Article

Management Scale Assessment of Practices to Mitigate Cattle Microbial Water Quality Impairments of Coastal Waters

1
University of California Cooperative Extension, Novato, CA 94947, USA
2
Point Reyes National Seashore, Point Reyes Station, CA 94956, USA
3
Department of Agricultural and Resource Economics, University of California, Davis, CA 95616, USA
4
Department of Plant Sciences, University of California, Davis, CA 95616, USA
*
Author to whom correspondence should be addressed.
Sustainability 2019, 11(19), 5516; https://0-doi-org.brum.beds.ac.uk/10.3390/su11195516
Submission received: 12 August 2019 / Revised: 30 September 2019 / Accepted: 2 October 2019 / Published: 6 October 2019
(This article belongs to the Collection Eutrophication and Sustainable Management of Water)

Abstract

:
Coastal areas support multiple important resource uses including recreation, aquaculture, and agriculture. Unmanaged cattle access to stream corridors in grazed coastal watersheds can contaminate surface waters with fecal-derived microbial pollutants, posing risk to human health via activities such as swimming and shellfish consumption. Improved managerial control of cattle access to streams through implementation of grazing best management practices (BMPs) is a critical step in mitigating waterborne microbial pollution in grazed watersheds. This paper reports trend analysis of a 19-year dataset to assess long-term microbial water quality responses resulting from a program to implement 40 grazing BMPs within the Olema Creek Watershed, a primary tributary to Tomales Bay, USA. Stream corridor grazing BMPs implemented included: (1) Stream corridor fencing to eliminate/control cattle access, (2) hardened stream crossings for cattle movements across stream corridors, and (3) off stream drinking water systems for cattle. We found a statistically significant reduction in fecal coliform concentrations following the initial period of BMP implementation, with overall mean reductions exceeding 95% (1.28 log10)—consistent with 1—2 log10 (90–99%) reductions reported in other studies. Our results demonstrate the importance of prioritization of pollutant sources at the watershed scale to target BMP implementation for rapid water quality improvements and return on investment. Our findings support investments in grazing BMP implementation as an important component of policies and strategies to protect public health in grazed coastal watersheds.

1. Introduction

Society expects coastal areas to simultaneously support multiple resource uses. Fecal-derived microbial pollutants discharged from various sources in coastal watersheds can contaminate surface waters and pose a significant human health risk via activities such as swimming and shellfish consumption [1,2,3,4]. The concentrations of waterborne fecal indicator bacteria (FIB), such as fecal coliforms, Enterococci spp., and Escherichia coli (E. coli), are monitored and regulated in coastal watersheds to safeguard public health from pathogens (e.g., Cryptosporidium spp., Giardia spp., E. coli O157:H7) [5,6]. Multi-use coastal regions across the globe (e.g., United Kingdom [7], Scotland [8], New Zealand [9], Canada [10,11], and China [12]) have documented public health concerns surrounding fecal-derived microbial pollutants associated with agricultural activities taking place in coastal watersheds. Shuval [13] estimated the global economic impact of human disease linked to land-based fecal pollution of coastal waters totaled $12 billion annually.
Dairy and beef cattle production are culturally and economically important activities in many coastal watersheds. However, cattle can be a source of waterborne microbial pollutants [14,15]. One livestock production activity associated with microbial pollution is unmanaged cattle access to surface waters [16,17,18]. Excessive cattle presence in stream corridors can increase microbial pollutants due to (1) direct loading of cattle fecal material to surface waters, (2) disturbance of microbial pollutants in stream sediments, and (3) reduced pollutant filtration due to impairments to riparian vegetation and soils [16,19,20,21]. Thus, managerial control of cattle access to stream corridors is a critical step in mitigating waterborne microbial pollution in grazed watersheds. Grazing best management practices (BMPs) such as stream corridor fencing, hardened stream crossings for livestock, and off stream livestock drinking water sources are tools managers can use to safeguard water quality [21,22].
Tomales Bay, in northern California, U.S.A. is a classic multiple-use coastal region supporting commercial livestock and aquaculture, as well as a diversity of recreational activities including swimming, kayaking, and shellfish harvest [23]. There are the added attractions of numerous state and national parks, including the Point Reyes National Seashore (PRNS) that receives an estimated 2.5 million visitors annually. To safeguard water quality conditions throughout the Tomales Bay Watershed, state, and federal regulatory programs require managers to minimize microbial pollutant discharges from grazing livestock to tributary streams. For several decades, PRNS, natural resources management and conservation organizations, and regulatory agencies have collaborated to increase managerial control of cattle access to streams feeding Tomales Bay [24,25].
The specific objective of this study was to conduct a trend analysis of a 19-year dataset to assess long-term microbial water quality improvements resulting from implementation of grazing BMPs along Olema Creek, a primary tributary to Tomales Bay. This dataset provides a unique opportunity to assess stream zone grazing BMP effectiveness for microbial water quality improvement at the spatial and temporal scales that conservation programs are commonly implemented. [21,26,27].

2. Materials and Methods
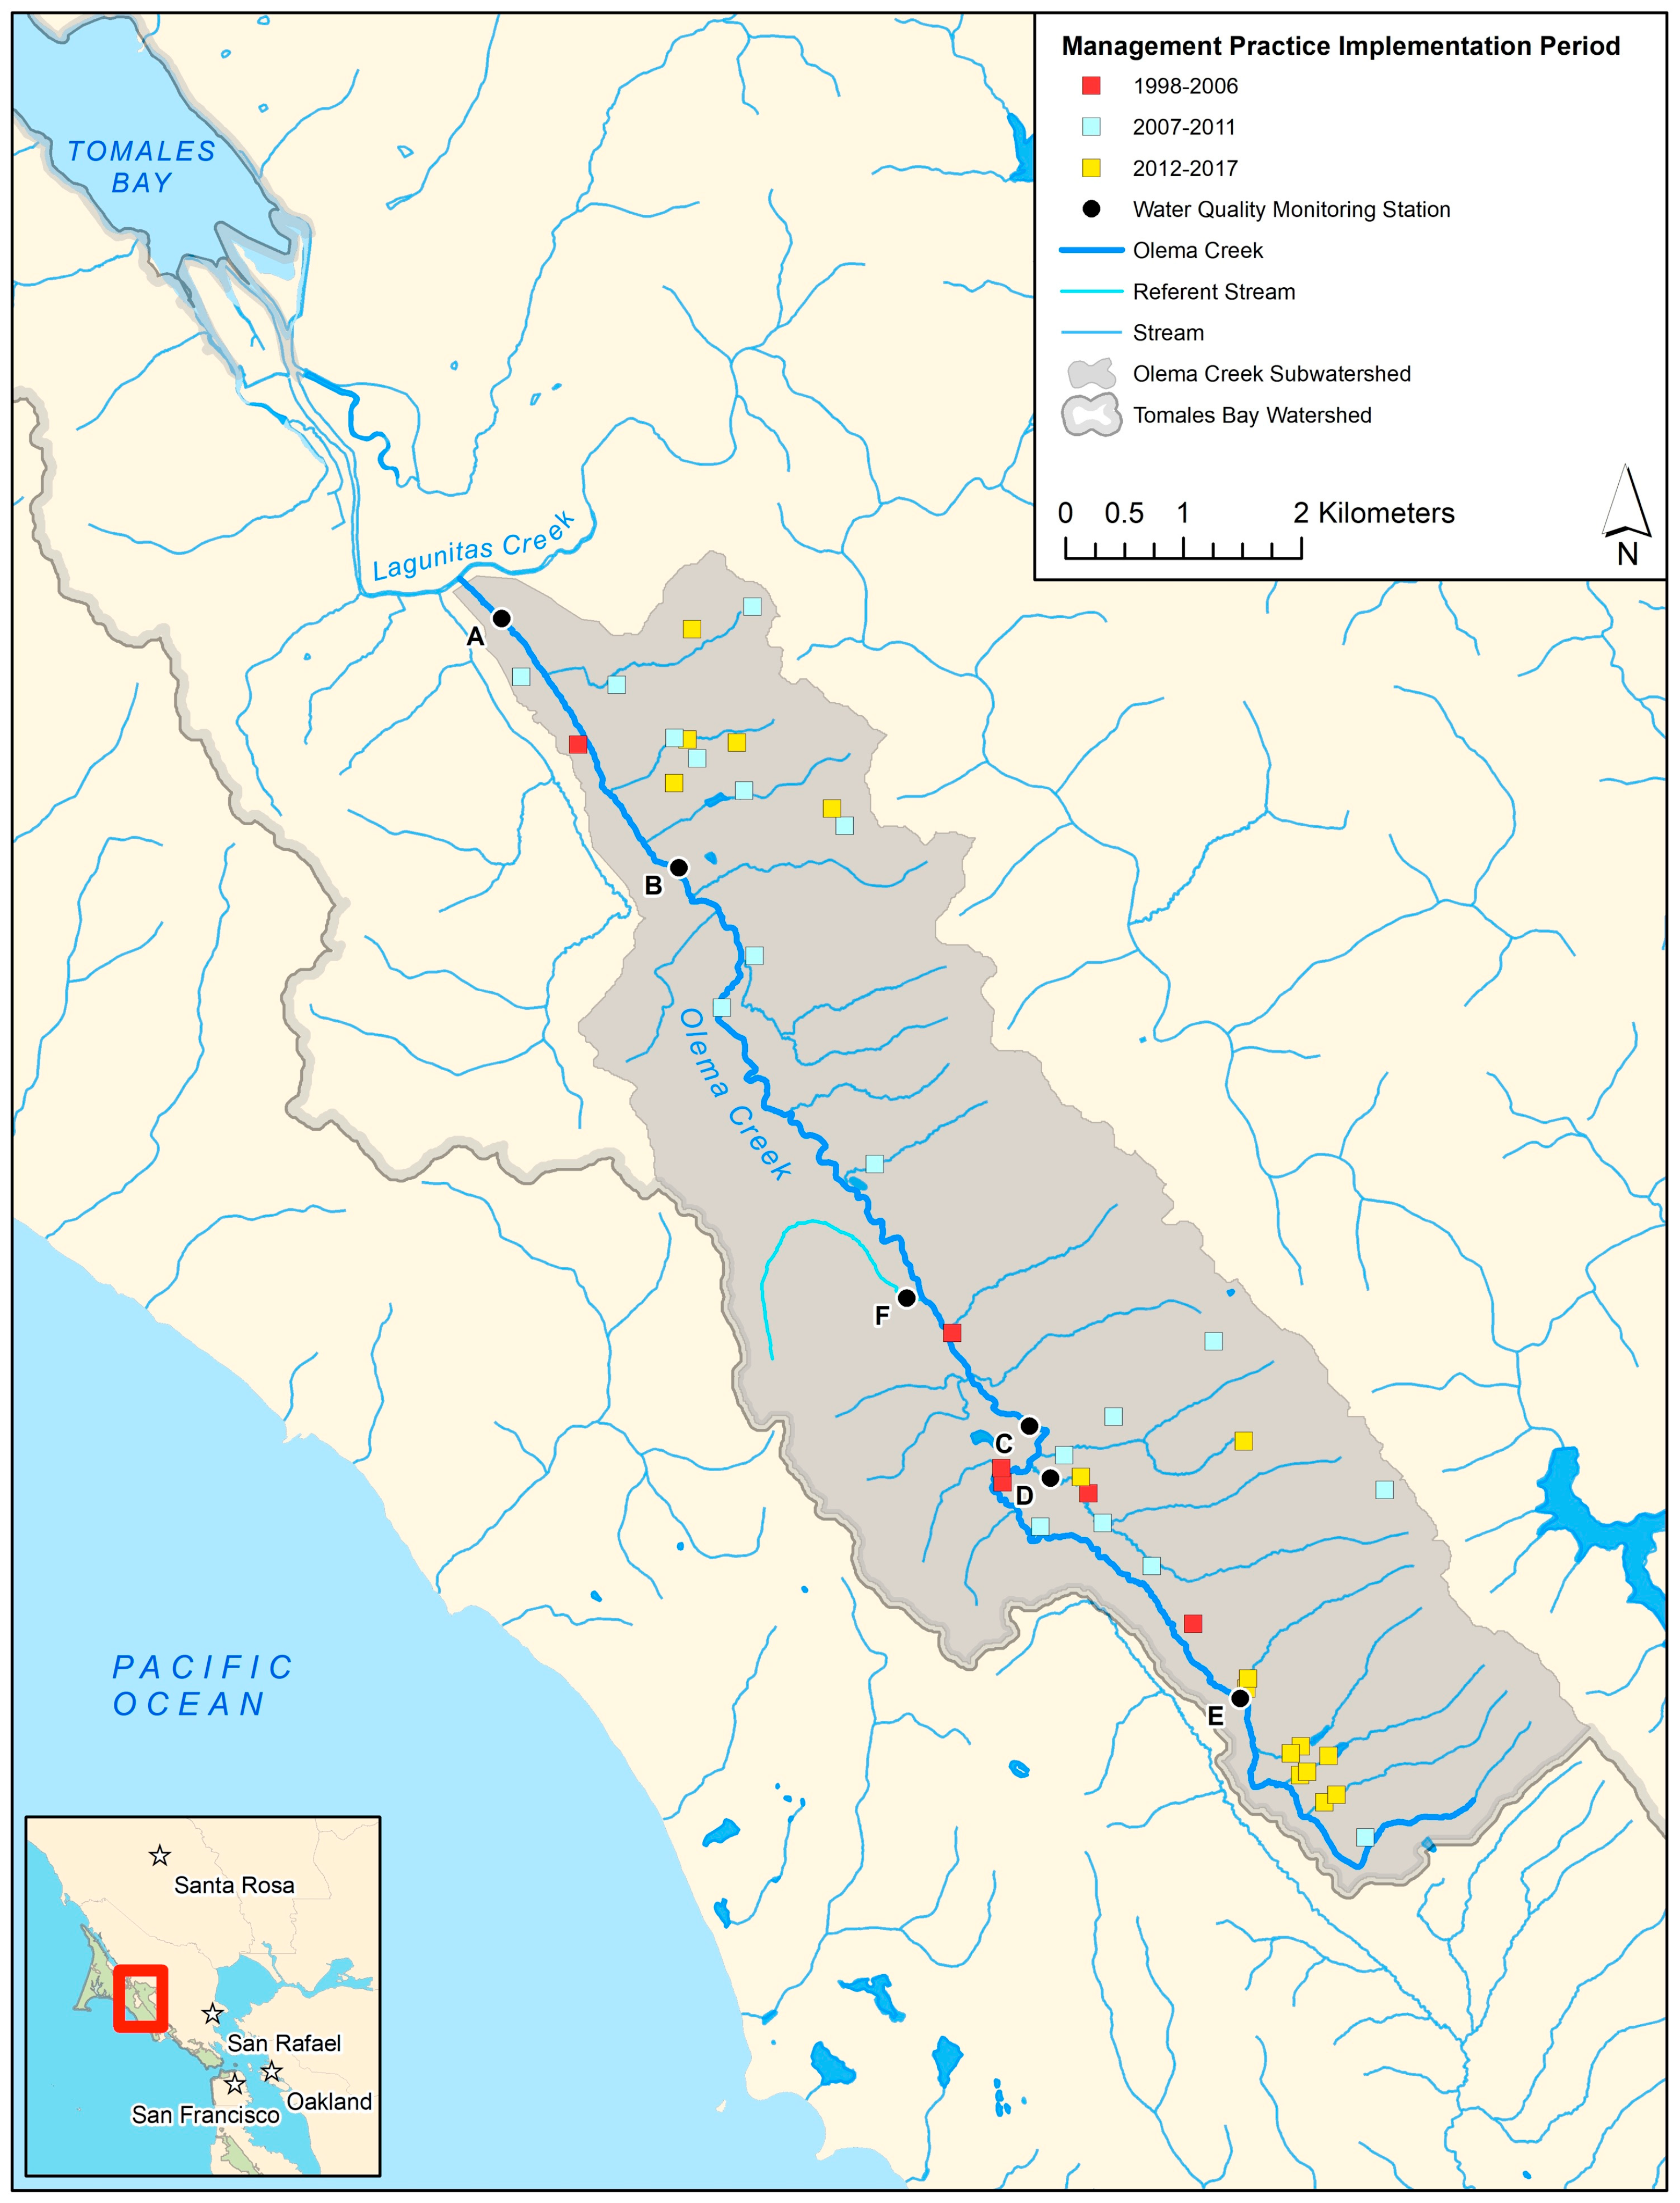
2.1. Study Location

The Tomales Bay Watershed is located approximately 64 km north of San Francisco, California. The watershed totals 560 km2 divided among three main tributaries: Lagunitas, Olema, and Walker Creeks [28]. This study was conducted in the 38 km2 Olema Creek Watershed (Figure 1). The U.S. National Park Service (NPS) administers 3762 hectares of mixed annual grassland and oak savanna/woodland ecological sites within the Olema Creek Watershed. The NPS manages 56% of this area (2107 hectares) as grazing lands leased to local cattle ranching operations. Climate in the area is Mediterranean with the majority (~95%) of precipitation falling as rainfall between October and April (wet season), and a pronounced dry season May through September [28]. The mainstem of Olema Creek is perennial with flows ranging from ~0.01 cubic meters per second during the dry season to over 70 cms during the wet season [29]. With a few exceptions, Olema Creek tributaries are predominantly intermittent, with streamflow during the wet season.

2.2. Grazing Best Management Practice Implementation

Prior to the late 1990s, livestock predominantly had unmanaged, direct access to mainstem and tributary stream corridors within the grazing lands of the Olema Creek Watershed. Starting in 1999, three types of stream corridor grazing BMPs were implemented across the grazed area in Olema Creek Watershed: 1) Stream corridor fencing to eliminate/control cattle access; 2) hardened stream crossings for cattle movements across stream corridors; and 3) off stream drinking water systems for cattle. This series of stream corridor grazing BMP implementation initiatives resulted in a total of 40 grazing BMPs projects implemented by 2017, collectively bringing managerial control over cattle access to nearly 28km of stream corridor on Olema Creek and tributaries (Figure 1). This BMP campaign was comprised of three discrete periods of planning, funding, and implementation. These sequential endeavors started with an initial effort 1999–2006 (6 grazing BMP projects implemented, 3.8 km of stream corridor impacted, $125k expended on BMP implementation), followed by larger initiatives during 2007–2011 (18 BMP projects, 15.6 km, $468k), and 2012-2017 (16 BMP projects, 8.6 km, $277k) (Figure 1 and Figure 2). All BMPs were inspected and maintained following implementation to insure performance of intended functions.

2.3. Fecal Coliform Sampling and Determination

The U.S. National Park Service conducted a microbial water quality monitoring program within the Olema Creek watershed to quantify trends in fecal coliform concentrations during this stream corridor grazing BMP campaign (hydrologic year 1999 through 2017). During this period stream water grab samples were collected at five permanent sites within the grazing lands area (Figure 1; sites A-D on Olema Creek, site E on a grazed perennial tributary stream). Grab samples were also collected over this period on one non-grazed, perennial tributary to Olema Creek to serve as a stable, control (Figure 1; site F) time series for comparison to the potentially trending time series from the grazed lands receiving BMPs over the study period. The control sub-watershed was characterized by the same oak savanna/woodland vegetation, weather, hydrology, and background microbial sources found on the grazed areas of the Olema Creek Watershed. The control sub-watershed has not been grazed by livestock since the late 1960’s, with limited hiking access being the only anthropological use during this period. There were no land use changes in the control sub-watershed during the study period, making it a stable time series for comparison.
Sampling frequency during the summer low flow season ranged from quarterly (1999–2003) to approximately monthly (2004–2017), and from three (1999–2003) to eight (2004–2017) storm runoff samples during the winter rainfall season (see Figure 2 for total sample numbers across all sites for each year). Fecal coliform concentrations (Most Probable Number (MPN/100ml)) were enumerated using the SM 9221E multiple tube technique for all samples. Previous studies demonstrated that fecal coliform concentrations in the region are strongly associated with rainfall conditions prior to sample collection [14], so we calculated the antecedent 24-h cumulative precipitation (PPT) for each sample for use as a covariate in the analysis of fecal coliform data.

2.4. Data Analysis and Interpretation

We used negative binomial regression analysis to determine if fecal coliform concentrations at sample sites in the grazed area decreased (relative to concentrations in the long-term non-grazed control tributary) during the stream corridor grazing BMP implementation period (1999–2017). The count nature of the fecal coliform (MPN/100ml) response variable, coupled with its over-dispersion motivated the use of the negative binomial specification. Covariates in the analysis included overall trend across all sites (years; 1999 through 2017), grazed site (Yes = sites A-E, No = site F), the interaction of overall trend (year) and grazed site (Yes/No), and antecedent 24-h cumulative precipitation (mm). The significance of the interaction term provides a specific test that any observed trend for grazed sites was different from the long-term non-grazed control tributary. Sample number per site per year was included as an exposure variable to account for variability in sampling intensity over the course of the study and standard error estimates were clustered on sample site to control for site-specific heterogeneity (Figure 2). Given the potential for our results to be influenced by repeated samples being taken at a given site over a 19-year period, we tested model robustness using a random effects negative binomial specification. Our results and conclusions are robust to this alternative specification. All statistical analyses were conducted in Stata/SE 15.0.

3. Results and Discussion
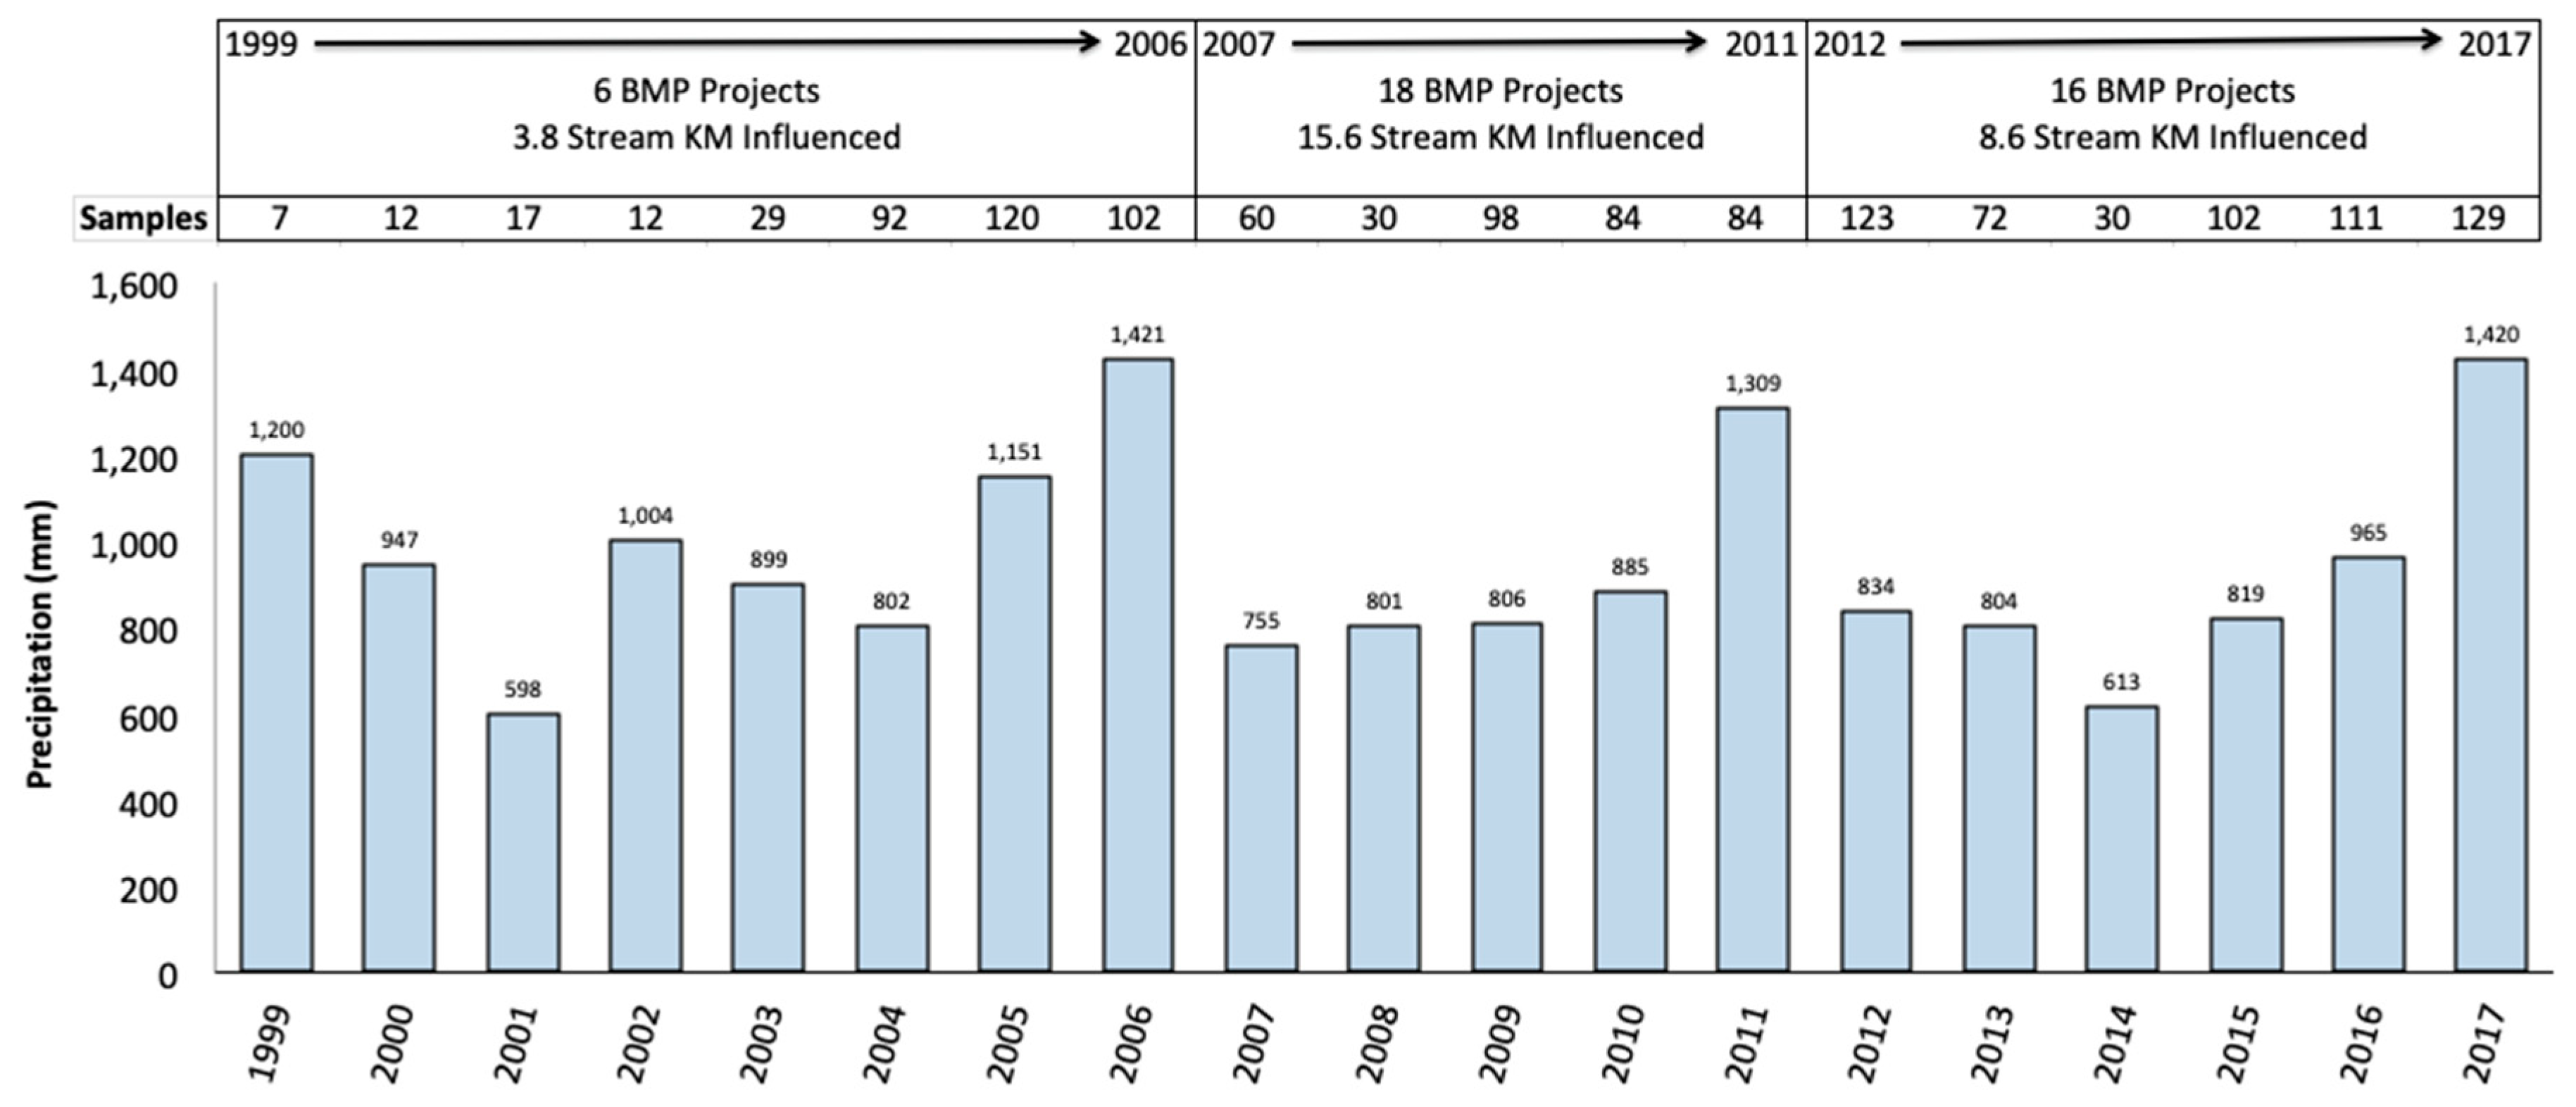
A total of 1053 stream samples were collected from grazed sites (A-E) and 194 samples were collected at the control site (F) during the study period. Overall mean (one standard error) fecal coliform concentrations over the period 1999 through 2017 at the grazed sites was 813 (SE=118) MPN/100ml and mean fecal coliform concentration at the long-term non-grazed control site was 146 (SE=21) MPN/100ml.
Annual descriptive statistics for fecal coliform concentrations observed across grazed sites for each hydrologic year are presented in Figure 3. Table 1 reports results of the negative binomial regression analysis, with all original covariates found to be significant (p < 0.001 in all cases) predictors of fecal coliform concentration.

3.1. Precipitation

Significant year-to-year variability was observed in annual precipitation (mm) over the study period, with a minimum of 598 mm in 2001 and a maximum of 1421 mm in 2006 (Figure 2). We used simple linear regression to determine if there was a trend in total annual precipitation (dependent variable) over the course of the study period (hydrologic year as independent variable). There was no apparent (Figure 2) or statistically significant (p = 0.94) trend in annual precipitation over the study period. This result is suggestive that a trend in annual precipitation is not driving the decreasing trend in fecal coliform concentration on grazed sites throughout the study period. In particular, the large reductions in fecal coliform concentrations observed following the initial BMP campaign (1999–2006) persisted during subsequent prolonged dry (2007–2010) and wet years (2011 and 2017).
Previous studies in this region have demonstrated that fecal coliform concentrations are strongly associated with antecedent rainfall—and thus runoff—conditions prior to sample collection [14]. Consistent with prior work, increased antecedent cumulative 24-h precipitation prior to each sample collection event was associated with increased fecal coliform concentrations at time of sample collection (Table 1).

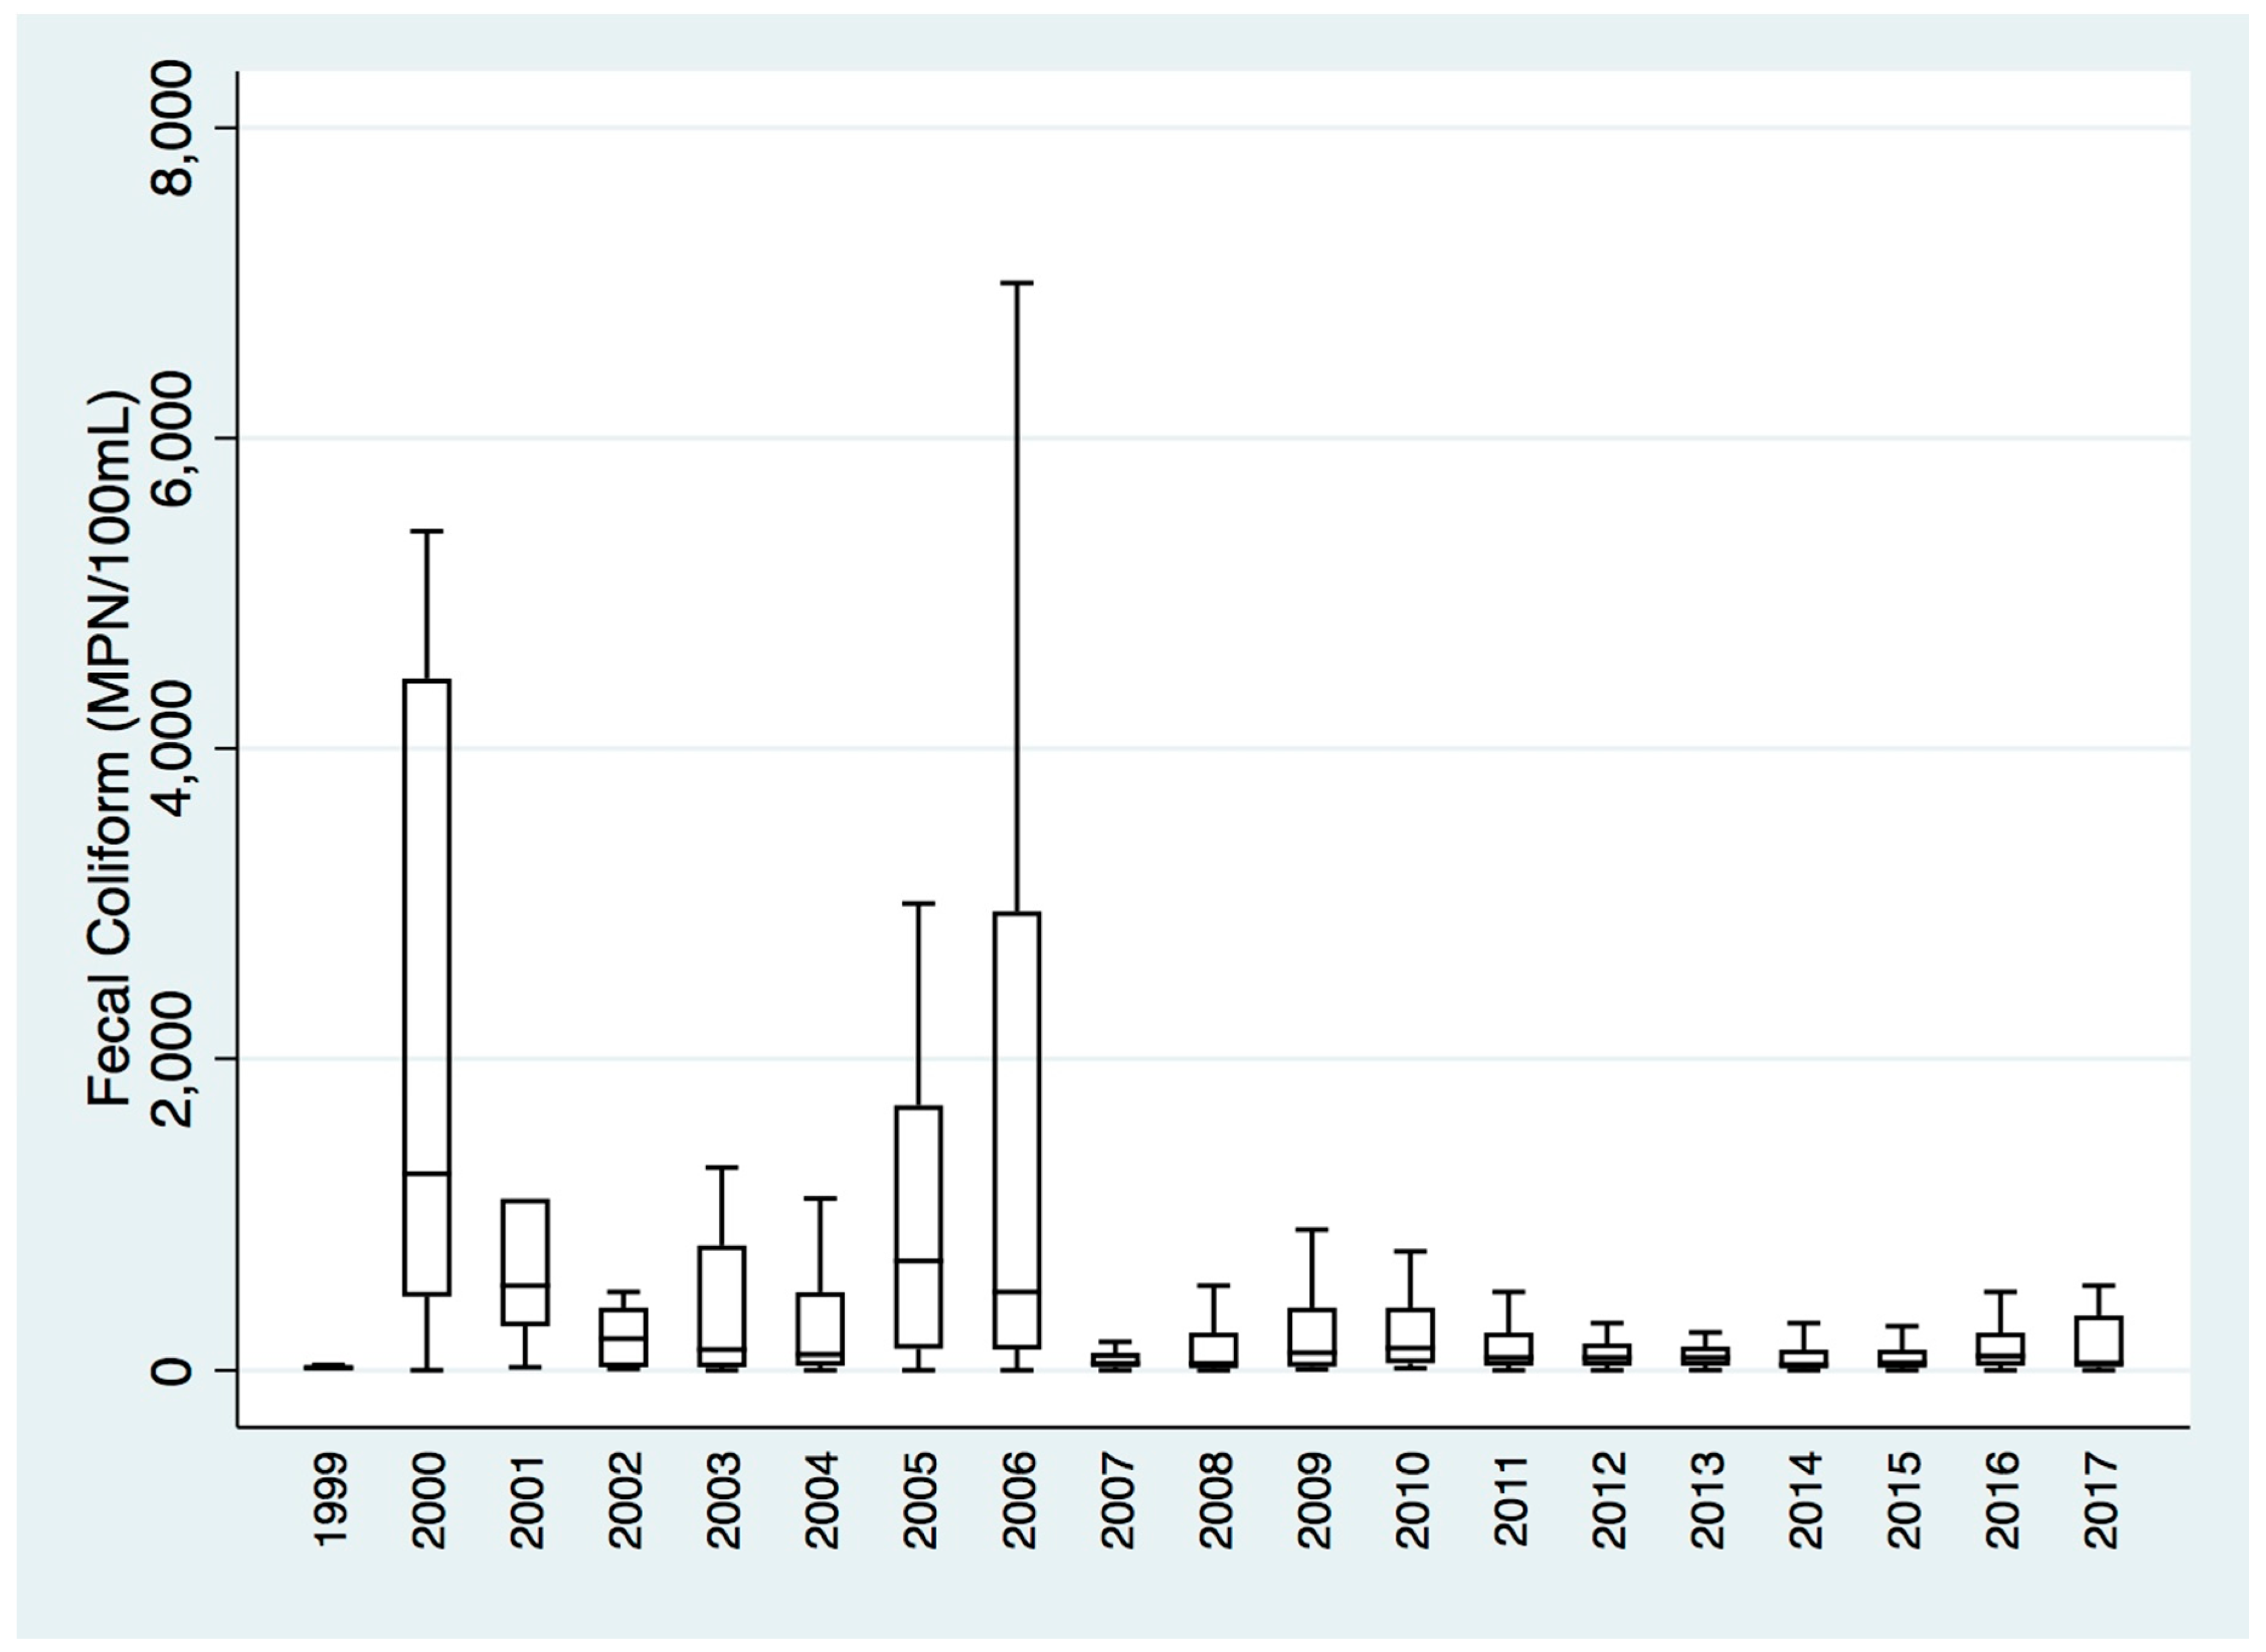
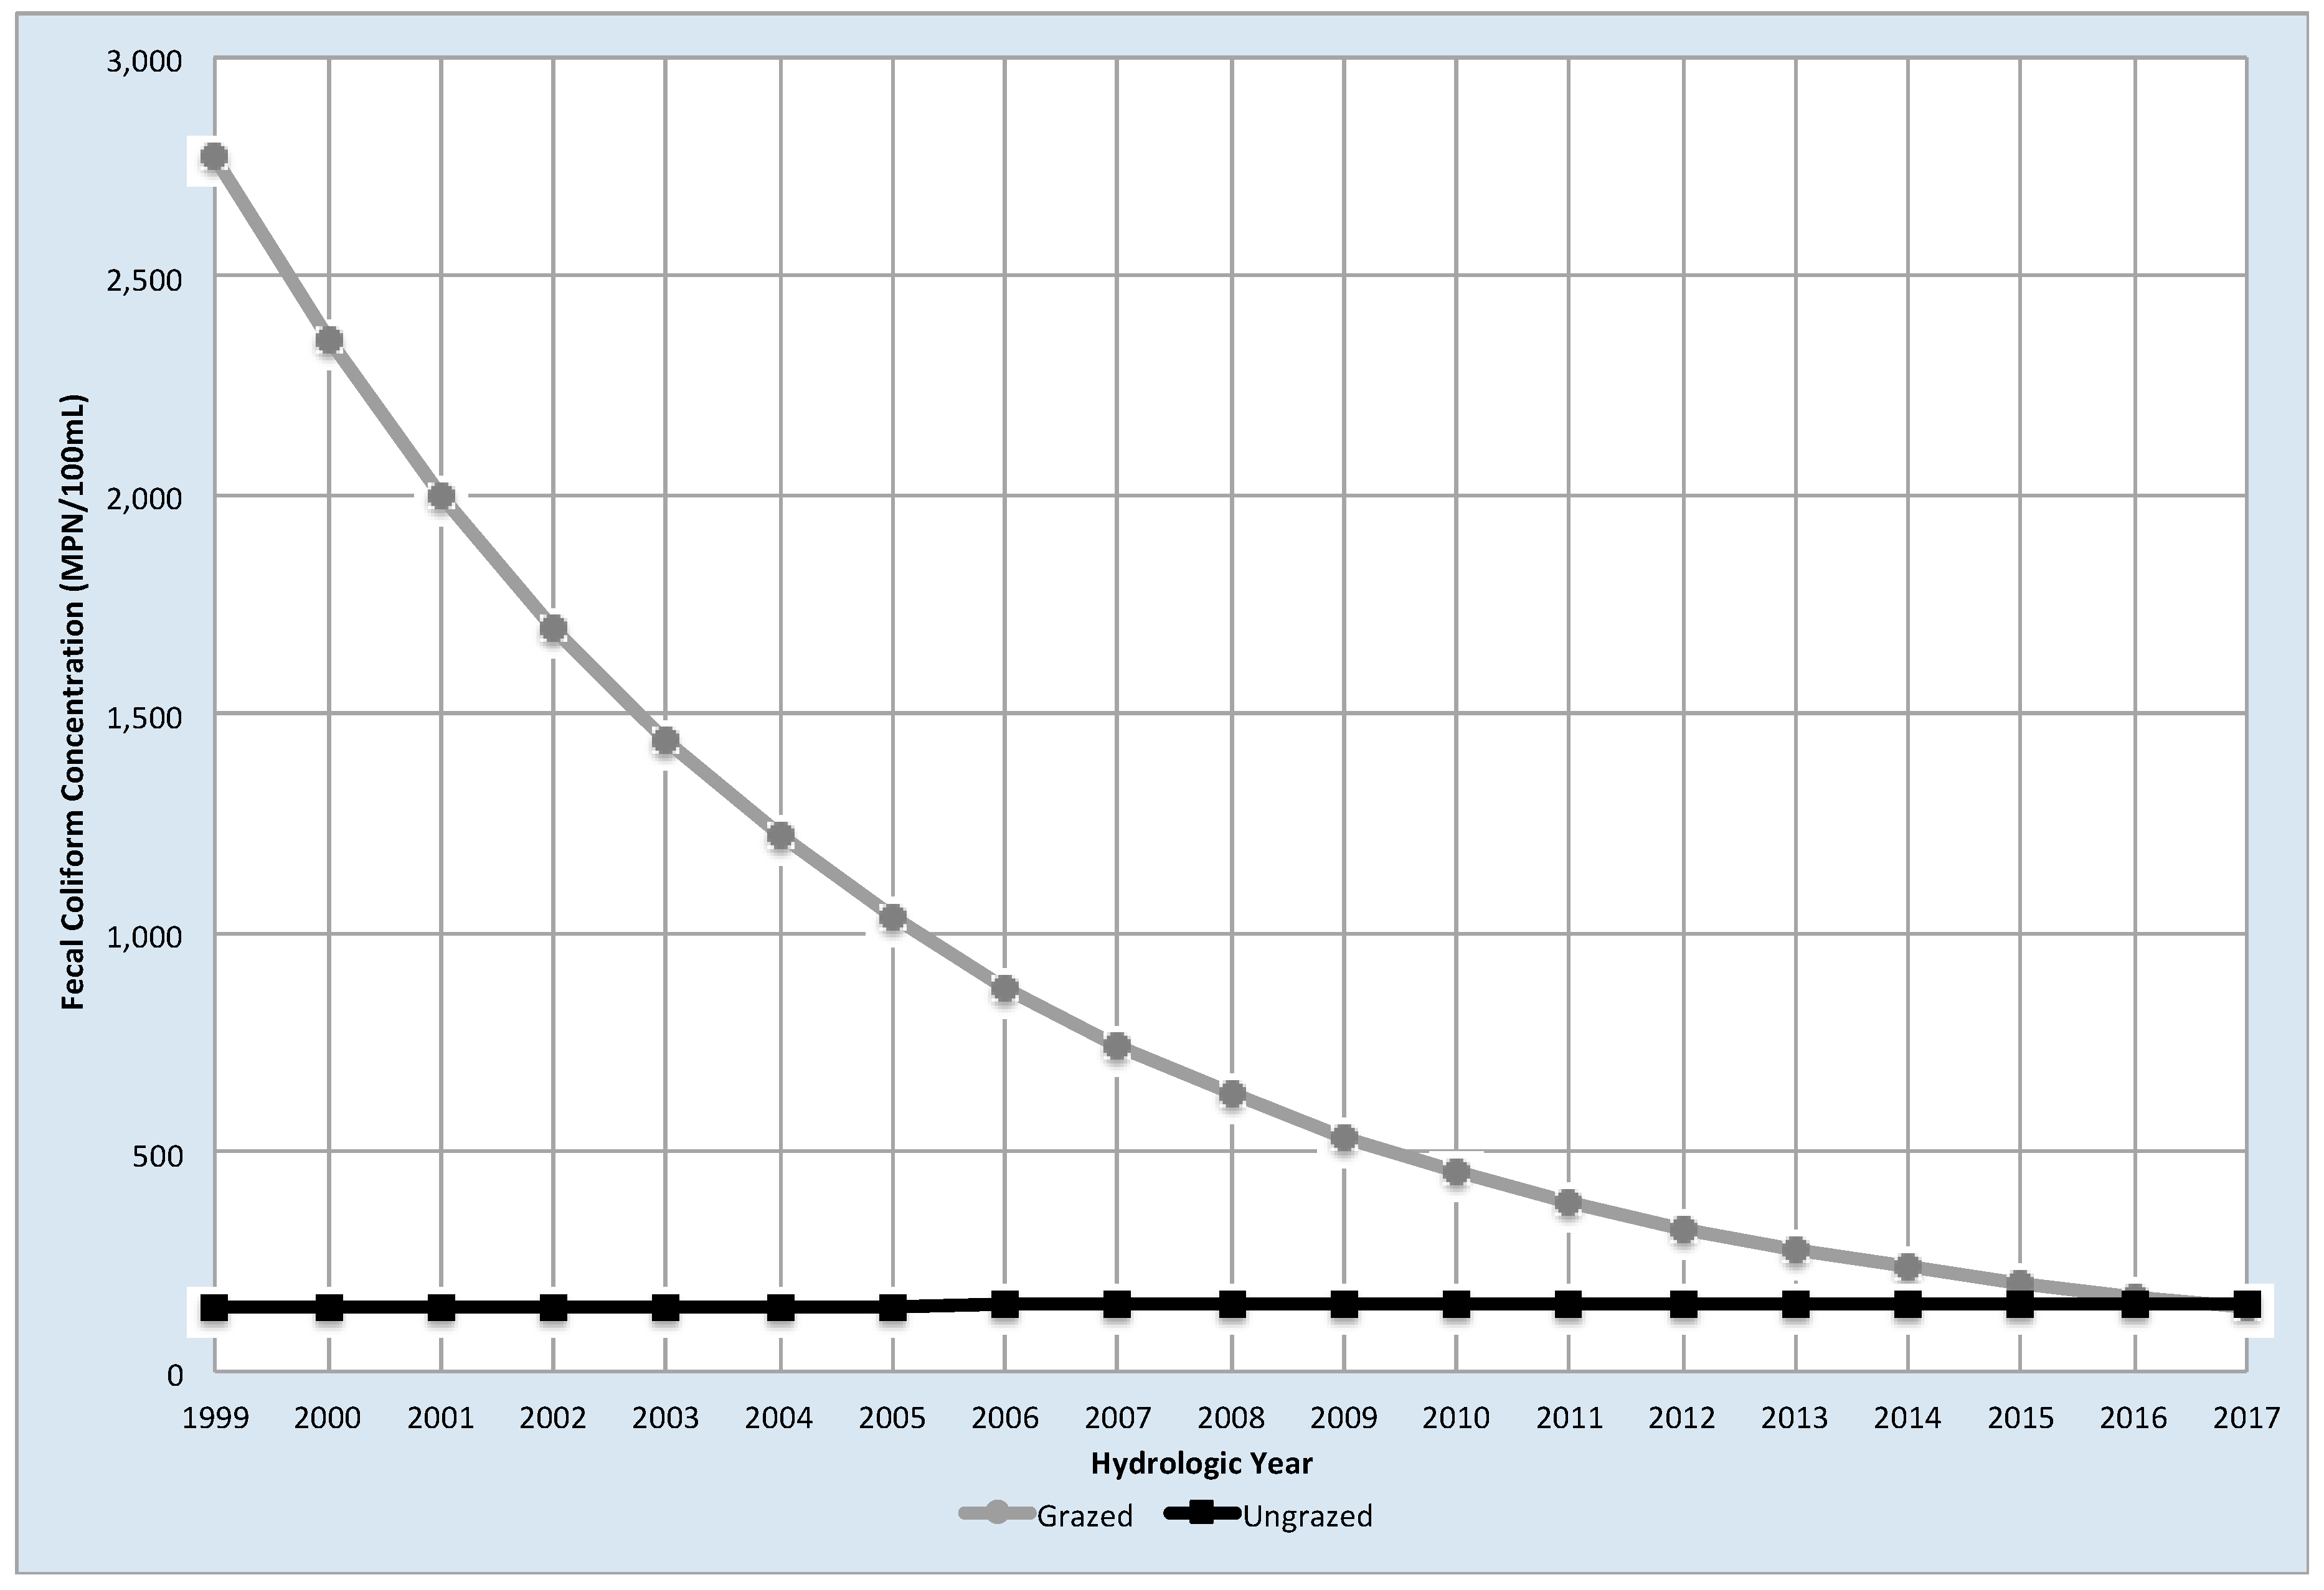
3.2. Trends in Fecal Coliform Concentrations at Grazed Compared to Non-Grazed Control Sites

The indicator variable for grazed sites in Table 1 shows that fecal coliform concentrations at the outset of sampling (i.e., when all of the other covariates in the model are evaluated at zero) were significantly higher when compared to the non-grazed control site (see coefficient for “Grazed Site”). The positive coefficient for the trend term indicates that there was a significant but slight upward trend in fecal coliform concentrations observed for the non-grazed site over the study period. Each year the model predicts an increase in the log count of fecal coliform of +0.002 (see coefficient for “Trend” in Table 1). However, the negative coefficient for the grazed site by trend interaction term indicates there was a significant downward trend in fecal coliform concentrations at the grazed sites, compared to the non-grazed control site. Each year the log of fecal coliform concentrations was predicted to decrease on average by -0.165 at the grazed sites (see coefficient for “Grazed Site X Trend” minus the coefficient for “Trend” in Table 1). Figure 4 plots the model predictions for grazed (Sites A–E) and non-grazed control (Site F) sites over the sample period, holding 24-h antecedent precipitation constant at its mean value of 4.13 mm.
Overall the 40-stream corridor grazing management practices implemented between 1999 and 2017 cumulatively provided increased managerial control of cattle access to over 28 kms of Olema Creek and tributaries. Results document a concurrent, significant trend of reduced fecal coliform concentrations over the course of the 19-year grazing BMP implementation campaign (Figure 2 and Figure 4). There was a substantial initial difference in fecal coliform concentrations across grazed and un-grazed sites, followed by large decreases in fecal coliform concentrations at the grazed sample sites over the study period—while concentrations were minutely increased at the non-grazed control sample site (Figure 4).

3.3. Effectivness of Grazing BMPs and Targeted Implementation

Over the 19-year grazing BMP implementation campaign, model predictions (Table 1 and Figure 4) indicate that a 1.28 log10 (95%) reduction in average fecal coliform concentration was realized at grazed sample sites, compared to the non-grazed control site. These results are consistent with other studies that have assessed stream corridor grazing BMPs, generally finding a 1–2 log10 (90%–99%) reduction in fecal indicator bacteria concentrations (e.g., [8,30]). Fencing to limit or exclude cattle access to stream corridors has been shown to be highly effective in improving water quality and riparian habitat [21,31]. In a recent comprehensive review of fecal indicator bacteria reductions reported in studies of stream corridor fencing, O’Callaghan et al. [18] found results ranging from 65.9% [32] to 83% [33]. Examining improved livestock crossings designed to limit direct contact of livestock with streams, Smolders et al. [22] reported over 100% reductions in fecal coliform concentrations compared to unimproved crossings. However, the authors concluded this practice alone would not be sufficient to safe-guard water quality. On Olema Creek and tributaries, hardened stream crossings were implemented in direct conjunction with stream corridor fencing. Reviewing the efficacy of non-fencing grazing BMPs designed to reduce the time free-ranging livestock spend in stream corridors (e.g., off-stream livestock water), Malan et al. [31] and George et al. [21] all concluded these practices are generally effective across diverse grazing lands—but with substantial variability among studies due to a variety of site specific conditions. Our results are congruent with other research on this topic globally, and the relatively high efficacy realized at Olema Creek can likely be attributed to the cumulative benefits of integrated implementation of multiple grazing BMPs (fencing, hardened crossing, and off-site drinking water) at a relatively large spatial scale [21].
An interesting aspect of our findings is that, while the downward trend observed across grazed sites was significant across the entire period (Figure 4), there was a notable reduction in fecal coliform concentrations with the completion of the 1999-2006 BMP phase (Figure 3). This suggests that some relatively substantial sources of cattle derived microbial pollution were prioritized and addressed early in the BMP campaign, resulting in disproportionately large return on investment ($125k), relative to BMPs implemented later in the project ($745k). Comparing the 1999–2006 mean (1906) to the 2007–2017 mean (291), it appears that the initial prioritization and implementation of BMPs was associated with a mean reduction of fecal coliform by 1615 cfu/100ml—an 85% mean reduction that persisted throughout the remainder of the study period. All six BMPs implemented between 1999 and 2006 were stream corridor fencing (3.8 km), with five of the six projects directly eliminating cattle access to approximately 90% of the mainstem of Olema Creek (Figure 1). Between 2007 and 2017, an additional 13.5 km of stream corridor fencing was implemented to exclude grazing from the remaining 2.1 km (~10%) of the mainstem and from 11.4 km of tributary stream corridor (~25% of total in grazed area). During this time period (2007–2017), off-stream drinking water and hardened crossings were also implemented. These subsequent practices were associated with continued—but relatively modest—reductions in microbial pollutants across grazed sample sites, compared to 1999 through 2006 (Figure 3). These results highlight the importance in prioritization of pollutant sources at the watershed scale to target BMP implementation for rapid and substantial water quality improvements and return on investment.

3.4. Implications for Public Health

There is substantial concern about risks that livestock derived microbial pollutants can pose to public health in coastal watersheds. Tomales Bay is one of many areas globally where managers and policy-makers must make decisions and take action to protect public health while supporting socio-economically important activities such as sustainable agriculture. The scientific literature provides managers with a suite of livestock grazing BMPs generally known to be variably effective for protecting water quality in grazed watersheds. These practices are commonly employed in structured efforts at the management scale, with limited resources available for monitoring. Real world BMP implementation and associated monitoring campaigns—such as the one reported in this paper—often suffer from challenges including insufficient pre/post-implementation data and not having identical treatment and control watersheds. Thus, it is often difficult to demonstrate, beyond all reasonable doubt, that grazing BMP implementation strategies result in quantifiable water quality improvements. Despite this, policy-makers and managers must make decisions and take action to protect public health in working landscapes. Our results indicate that in a sustained watershed scale effort, specifically designed to protect public health from livestock grazing activities, managers in Olema Creek were successful in achieving substantial reductions in fecal coliform concentrations via BMP implementation. These results are in strong agreement with a growing body of research on this topic. Strategic, watershed scale grazing BMP implementation campaigns are an effective and important component of comprehensive source reduction policies and strategies to protect public health from waterborne microbial pollutants in grazed coastal systems.

Author Contributions

Conceptualization, D.J.L., K.W.T., and D.V.; methodology, D.J.L., T.L.S., and K.W.T.; software, T.L.S. and D.V.; formal analysis, T.L.S. and K.W.T.; data, T.L.S. and D.V.; writing—original draft preparation, D.J.L. and K.W.T.; writing—review and editing, D.J.L., T.L.S., and K.W.T.; visualization, T.L.S. and D.V.; project administration, D.J.L. and D.V.; funding acquisition, D.J.L. and D.V.

Funding

This research received no external funding.

Acknowledgments

The nearly 20 years of water quality monitoring and implementation of best management practices received support from numerous funding sources, NPS staff, interns, volunteers, and ranchers. Funding from US EPA 319(h) and the San Francisco Regional Water Quality Control Board provided the most recent support for best management practice implementation and analysis of water quality samples.

Conflicts of Interest

The authors declare no conflict of interest.

References

  1. Fleisher, J.M.; Fleming, L.E.; Solo-Gabriele, H.M.; Kish, J.K.; Sinigalliano, C.D.; Plano, L.; Elmir, S.M.; Wang, J.D.; Withum, K.; Shibata, T.; et al. The BEACHES Study: health effects and exposures from non-point source microbial contaminants in subtropical recreational marine waters. Int. J. Epidemiol. 2010, 39, 1291–1298. [Google Scholar] [CrossRef] [PubMed]
  2. Pandey, P.K.; Kass, P.H.; Soupir, M.L.; Biswas, S.; Singh, V.P. Contamination of water resources by pathogenic bacteria. AMB Express 2014, 4, 51. [Google Scholar] [CrossRef] [PubMed]
  3. Fewtrell, L.; Kay, D. Recreational Water and Infection: A Review of Recent Findings. Curr. Environ. Heal. Rep. 2015, 2, 85–94. [Google Scholar] [CrossRef] [PubMed] [Green Version]
  4. Wu, J.; Jackson, L. Association of land use and its change with beach closure in the United States, 2004–2013. Sci. Total Environ. 2016, 571, 67–76. [Google Scholar] [CrossRef]
  5. Mallin, M.A.; Ensign, S.H.; McIver, M.R.; Shank, G.C.; Fowler, P.K. The Ecology and Etiology of Newly Emerging Marine Diseases. In Developments in Hyrdobiology; Porter, J.W., Ed.; Springer: Dordrecht, The Netherlands, 2001; pp. 185–193. [Google Scholar]
  6. Bougeard, M.; Le Saux, J.-C.; Teillon, A.; Belloir, J.; Le Mennec, C.; Thome, S.; Durand, G.; Pommepuy, M. Combining modeling and monitoring to study fecal contamination in a small rural catchment. J. Water Health 2011, 9, 467–482. [Google Scholar] [CrossRef] [PubMed]
  7. Bussi, G.; Whitehead, P.G.; Thomas, A.R.C.; Masante, D.; Jones, L.; Jack Cosby, B.; Emmett, B.A.; Malham, S.K.; Prudhomme, C.; Prosser, H. Climate and land-use change impact on faecal indicator bacteria in a temperate maritime catchment (the River Conwy, Wales). J. Hydrol. 2017, 553, 248–261. [Google Scholar] [CrossRef] [Green Version]
  8. Kay, D.; Aitken, M.; Crowther, J.; Dickson, I.; Edwards, A.C.; Francis, C.; Hopkins, M.; Jeffrey, W.; Kay, C.; McDonald, A.T.; et al. Reducing fluxes of faecal indicator compliance parameters to bathing waters from diffuse agricultural sources: The Brighouse Bay study, Scotland. Environ. Pollut. 2007, 147, 138–149. [Google Scholar] [CrossRef]
  9. Collins, R.; McLeod, M.; Hedley, M.; Donnison, A.; Close, M.; Hanly, J.; Horne, D.; Ross, C.; Davies-Colley, R.; Bagshaw, C.; et al. Best management practices to mitigate faecal contamination by livestock of New Zealand waters. New Zeal. J. Agric. Res. 2007, 50, 267–278. [Google Scholar] [CrossRef]
  10. Willis, J.E.; McClure, J.T.; Davidson, J.; McClure, C.; Greenwood, S.J. Global occurrence of Cryptosporidium and Giardia in shellfish: Should Canada take a closer look? Food Res. Int. 2013, 52, 119–135. [Google Scholar] [CrossRef]
  11. Aguirre, J.; Greenwood, S.J.; McClure, J.T.; Davidson, J.; Sanchez, J. Effects of rain events on Cryptosporidium spp. levels in commercial shellfish zones in the Hillsborough River, Prince Edward Island, Canada. Food Waterborne Parasitol. 2016, 5, 7–13. [Google Scholar] [CrossRef]
  12. Ma, H.J.; Fu, L.L.; Li, J.R. Differentiation of fecal escherichia coli from human, livestock, and poultry sources by rep-PCR DNA fingerprinting on the shellfish culture area of East China Sea. Curr. Microbiol. 2011, 62, 1423–1430. [Google Scholar] [CrossRef] [PubMed]
  13. Shuval, H. Estimating the global burden of thalassogenic diseases: human infectious diseases caused by wastewater pollution of the marine environment. J. Water Health 2003, 1, 53–64. [Google Scholar] [CrossRef] [PubMed] [Green Version]
  14. Lewis, D.J.; Atwill, E.R.; Lennox, M.S.; Hou, L.; Karle, B.; Tate, K.W. Linking On-Farm Dairy Management Practices to Coastal Watersheds. Environ. Monit. Assess. 2005, 107, 407–425. [Google Scholar] [CrossRef] [PubMed]
  15. Liang, Z.; He, Z.; Zhou, X.; Powell, C.A.; Yang, Y.; He, L.M.; Stoffella, P.J. Impact of mixed land-use practices on the microbial water quality in a subtropical coastal watershed. Sci. Total Environ. 2013, 449, 426–433. [Google Scholar] [CrossRef] [PubMed]
  16. Roche, L.M.; Kromschroeder, L.; Atwill, E.R.; Dahlgren, R.A.; Tate, K.W. Water Quality Conditions Associated with Cattle Grazing and Recreation on National Forest Lands. PLoS ONE 2013, 8, 1–14. [Google Scholar] [CrossRef] [PubMed]
  17. Bussi, G.; Janes, V.; Whitehead, P.G.; Dadson, S.J.; Holman, I.P. Dynamic response of land use and river nutrient concentration to long-term climatic changes. Sci. Total Environ. 2017, 590–591, 818–831. [Google Scholar] [CrossRef] [PubMed]
  18. O’Callaghan, P.; Kelly-Quinn, M.; Jennings, E.; Antunes, P.; O’Sullivan, M.; Fenton, O.; hUallacháin, D.Ó. The Environmental Impact of Cattle Access to Watercourses: A Review. J. Environ. Qual. 2019, 48, 340–351. [Google Scholar] [CrossRef] [PubMed]
  19. Belsky, A.J.; Matzke, A.; Uselman, S. Survey of livestock influences on stream and riparian ecosystems in the western United States. J. Soil Water Conserv. 1999, 54, 419–431. [Google Scholar]
  20. Agouridis, C.T.; Workman, S.R.; Warner, R.C.; Jennings, G.D. Livestock grazing management impacts on stream water quality: A review. J. Am. Water Resour. Assoc. 2005, 41, 591–606. [Google Scholar] [CrossRef]
  21. George, M.R.; Jackson, R.D.; Boyd, C.S.; Tate, K.W. A Scientific Assessment of the Effectiveness of Riparian Management Practices. Conserv. Benefits Rangel. Pract. Assess. Recomm. Knowl. Gaps 2011, 213–252. [Google Scholar]
  22. Smolders, A.; Rolls, R.J.; Ryder, D.; Watkinson, A.; Mackenzie, M. Cattle-derived microbial input to source water catchments: An experimental assessment of stream crossing modification. J. Environ. Manag. 2015, 156, 143–149. [Google Scholar] [CrossRef] [PubMed]
  23. California Regional Water Quality Control Board (CRWQCB). San Francisco Bay Basin (Region 2) Water Quality Control Plan (Basin Plan); CRWQCB: Oakland, CA, USA, 2017. [Google Scholar]
  24. California Regional Water Quality Control Board (CRWQCB). San Francisco Bay Region San Francisco Bay Basin Water Quality Control Plan; CRWQCB: Oakland, CA, USA, 2007. [Google Scholar]
  25. California Regional Water Quality Control Board (CRWQCB). Renewal of Conditional Waive of Waste Discharge Requirements for Grazing Operations in the Tomales Bay Watershed; CRWQCB: Oakland, CA, USA, 2018. [Google Scholar]
  26. Inamdar, S.P.; Mostaghimi, S.; Cook, M.N.; Brannan, K.M.; McClellen, P.W. A Long-Term, Watershed-Scale, Evaluation of the Impacts of Animal Waste BMPs on Indicator Bacteria Concentrations. JAWRA J. Am. Water Resour. Assoc. 2002, 38, 819–833. [Google Scholar] [CrossRef]
  27. Stocker, M.D.; Rodriguez-Valentín, J.G.; Pachepsky, Y.A.; Shelton, D.R. Spatial and temporal variation of fecal indicator organisms in two creeks in Beltsville, Maryland. Water Qual. Res. J. 2016, 51, 167–179. [Google Scholar] [CrossRef]
  28. Fischer, D.T.; Smith, S.V.; Churchill, R.R. Simulation of a century of runoff across the Tomales watershed, Marin County, California. J. Hydrol. 1996, 186, 253–273. [Google Scholar] [CrossRef]
  29. Ketcham, B. Benthic Macroinvertebrate Analysis of Twelve Sites in Point Reyes National Seashore Using the California Stream Bioassessment Procedure; National Park Service: Point Reyes, CA, USA, 2001.
  30. Kay, D.; Crowther, J.; Stapleton, C.M.; Wyer, M.D. Faecal indicator organism inputs to watercourses from streamside pastures grazed by cattle: Before and after implementation of streambank fencing. Water Res. 2018, 143, 229–239. [Google Scholar] [CrossRef] [PubMed] [Green Version]
  31. Malan, J.A.C.; Flint, N.; Jackson, E.L.; Irving, A.D.; Swain, D.L. Offstream watering points for cattle: Protecting riparian ecosystems and improving water quality? Agric. Ecosyst. Environ. 2018, 256, 144–152. [Google Scholar] [CrossRef]
  32. Line, D.E. Changes in a Stream’s Physical and Biological Conditions Following Livestock Exclusion. Trans. ASAE 2002, 46, 287–293. [Google Scholar]
  33. Larsen, R.E.; Miner, J.R.; Buckhouse, J.C.; Moore, J.A. Water-quality benefits of having cattle manure deposited away from streams. Bioresour. Technol. 1994, 48, 113–118. [Google Scholar] [CrossRef]
Figure 1. Olema Creek Watershed showing stream water sampling locations for the grazed (A-E) and control (F) sample sites; as well as locations of grazing best management practice implementation over the course of the project.
Sustainability 11 05516 g001
Figure 2. Water-quality improvement best management practices and annual precipitation (PPT). The number and stream length influenced by best management practices for three periods of time: 1999–2006, 2007–2011, and 2012–2017.
Sustainability 11 05516 g002
Figure 3. Fecal coliform concentrations (MPN/100ml) by hydrologic year for grazed sites (A-E). Bottom and top of each box are the 25th and 75th percentile of the data, horizontal line within the box is the median value, and the vertical lines extending from the box are the 10th and 90th percentiles of the data. Outliers were omitted from display due to scale.
Sustainability 11 05516 g003
Figure 4. Fitted model predictions in fecal coliform concentrations (MPN/100ml) on grazed and control sites from 1999–2017. Antecedent precipitation is held constant at its mean value of 4.13 mm.
Sustainability 11 05516 g004
Table 1. Negative binomial regression analysis for the associations over time (trend) in fecal coliform concentrations (MPN/100ml) on grazed and control sites in the Olema Creek Subwatershed from 1999–2017.
CoefficientStandard Errorp-Value
Grazed Site (Yes/No)336.01137.4740.000
Trend (Year)0.0020.00060.000
Grazed Site (Yes/No) x Trend (Year) 1−0.1670.01860.000
24-hour antecedent precipitation (mm)0.0620.00790.000
1: Interaction term for grazed sites (Yes = sites A–E; No = site F) and year. Standard errors are clustered on sampling site.

