A Study in Options to Improve Aerodynamic Profile of Heavy-Duty Vehicles in Europe


1
Supply Network Innovation Centre, Procter & Gamble Services Company NV, 1853 Strombeek-Bever, Belgium
2
Department of Structure Dynamics and Vibration Technology, Fraunhofer-Institute for Structural Durability and System Reliability LBF, 64289 Darmstadt, Germany
3
Transport Solutions, Volvo GTT Advanced Technology & Research (ATR), 41755 Göteborg, Sweden
4
Department of Power Systems Engineering, Czech Technical University in Prague, 16627 Prague, Czechia
*
Author to whom correspondence should be addressed.
Sustainability 2019, 11(19), 5519; https://0-doi-org.brum.beds.ac.uk/10.3390/su11195519
Submission received: 25 August 2019
/
Revised: 30 September 2019
/
Accepted: 1 October 2019
/
Published: 6 October 2019
(This article belongs to the Section Sustainable Transportation)
Abstract
:In this paper, we present and discuss different aerodynamic solutions available for European tractor and semi-trailers configurations along with summarizing their impact on the aerodynamic drag that contributes to the reduction of fuel consumption. Combinations of different aerodynamic solutions have been presented, and conclusions have been drawn from comparative studies and experience of the participating partners of Project TRANSFORMERS, but no CFD simulations have been done for the same solutions. The paper concludes by proposing configurations of aerodynamic measures for various configurations and how they can be cost-effectively adapted to improve the efficiency in road freight logistics networks and reduce emission.
1. Introduction
The overall objective of the TRANSFORMERS project is to develop and demonstrate innovative and energy-efficient trucks and load carriers for long distance transport assignments with an improved load efficiency leading to an overall 25% less energy consumption on a t⋅km basis and a lower impact on the road infrastructure [1]. To achieve this objective, four key innovations would be implemented and integrated in two demonstrator vehicles. One of the key innovations present in both the demonstrator vehicles is a mission-based configurable aerodynamic truck-trailer design. This is intended to optimize the drag coefficient.
In past and on-going projects (e.g., Project CONVENIENT, CO2RE, ECOCHAMPS, AEROFLEX, and FALCON), many solutions have been developed and are being considered to improve aerodynamic performance and reduce the overall drag of tractor-trailer architectures. Solutions considered were for front and underbody deflectors, side skirts, rear diffusers, or boat tails. Each solution by itself provides a significant reduction in drag, thus reducing the fuel consumption and CO2 emission. However, it is not known how the different solutions for semi-trailers and trailers should be combined for building an adaptable vehicle configuration. Thus, in this article, we present information collected from various studies and reports from all the publicly funded projects that are on-going or already completed. We have used this information to analyze and categorize the aerodynamic concepts and their physical working principles and then integrated their applications in different configurations to evaluate the performance of a configurable mission-adaptable truck-trailer design. Mission configuration is an important feature because vehicle efficiency can be configured based on the type of goods being transported.
1.1. Mission Efficiency
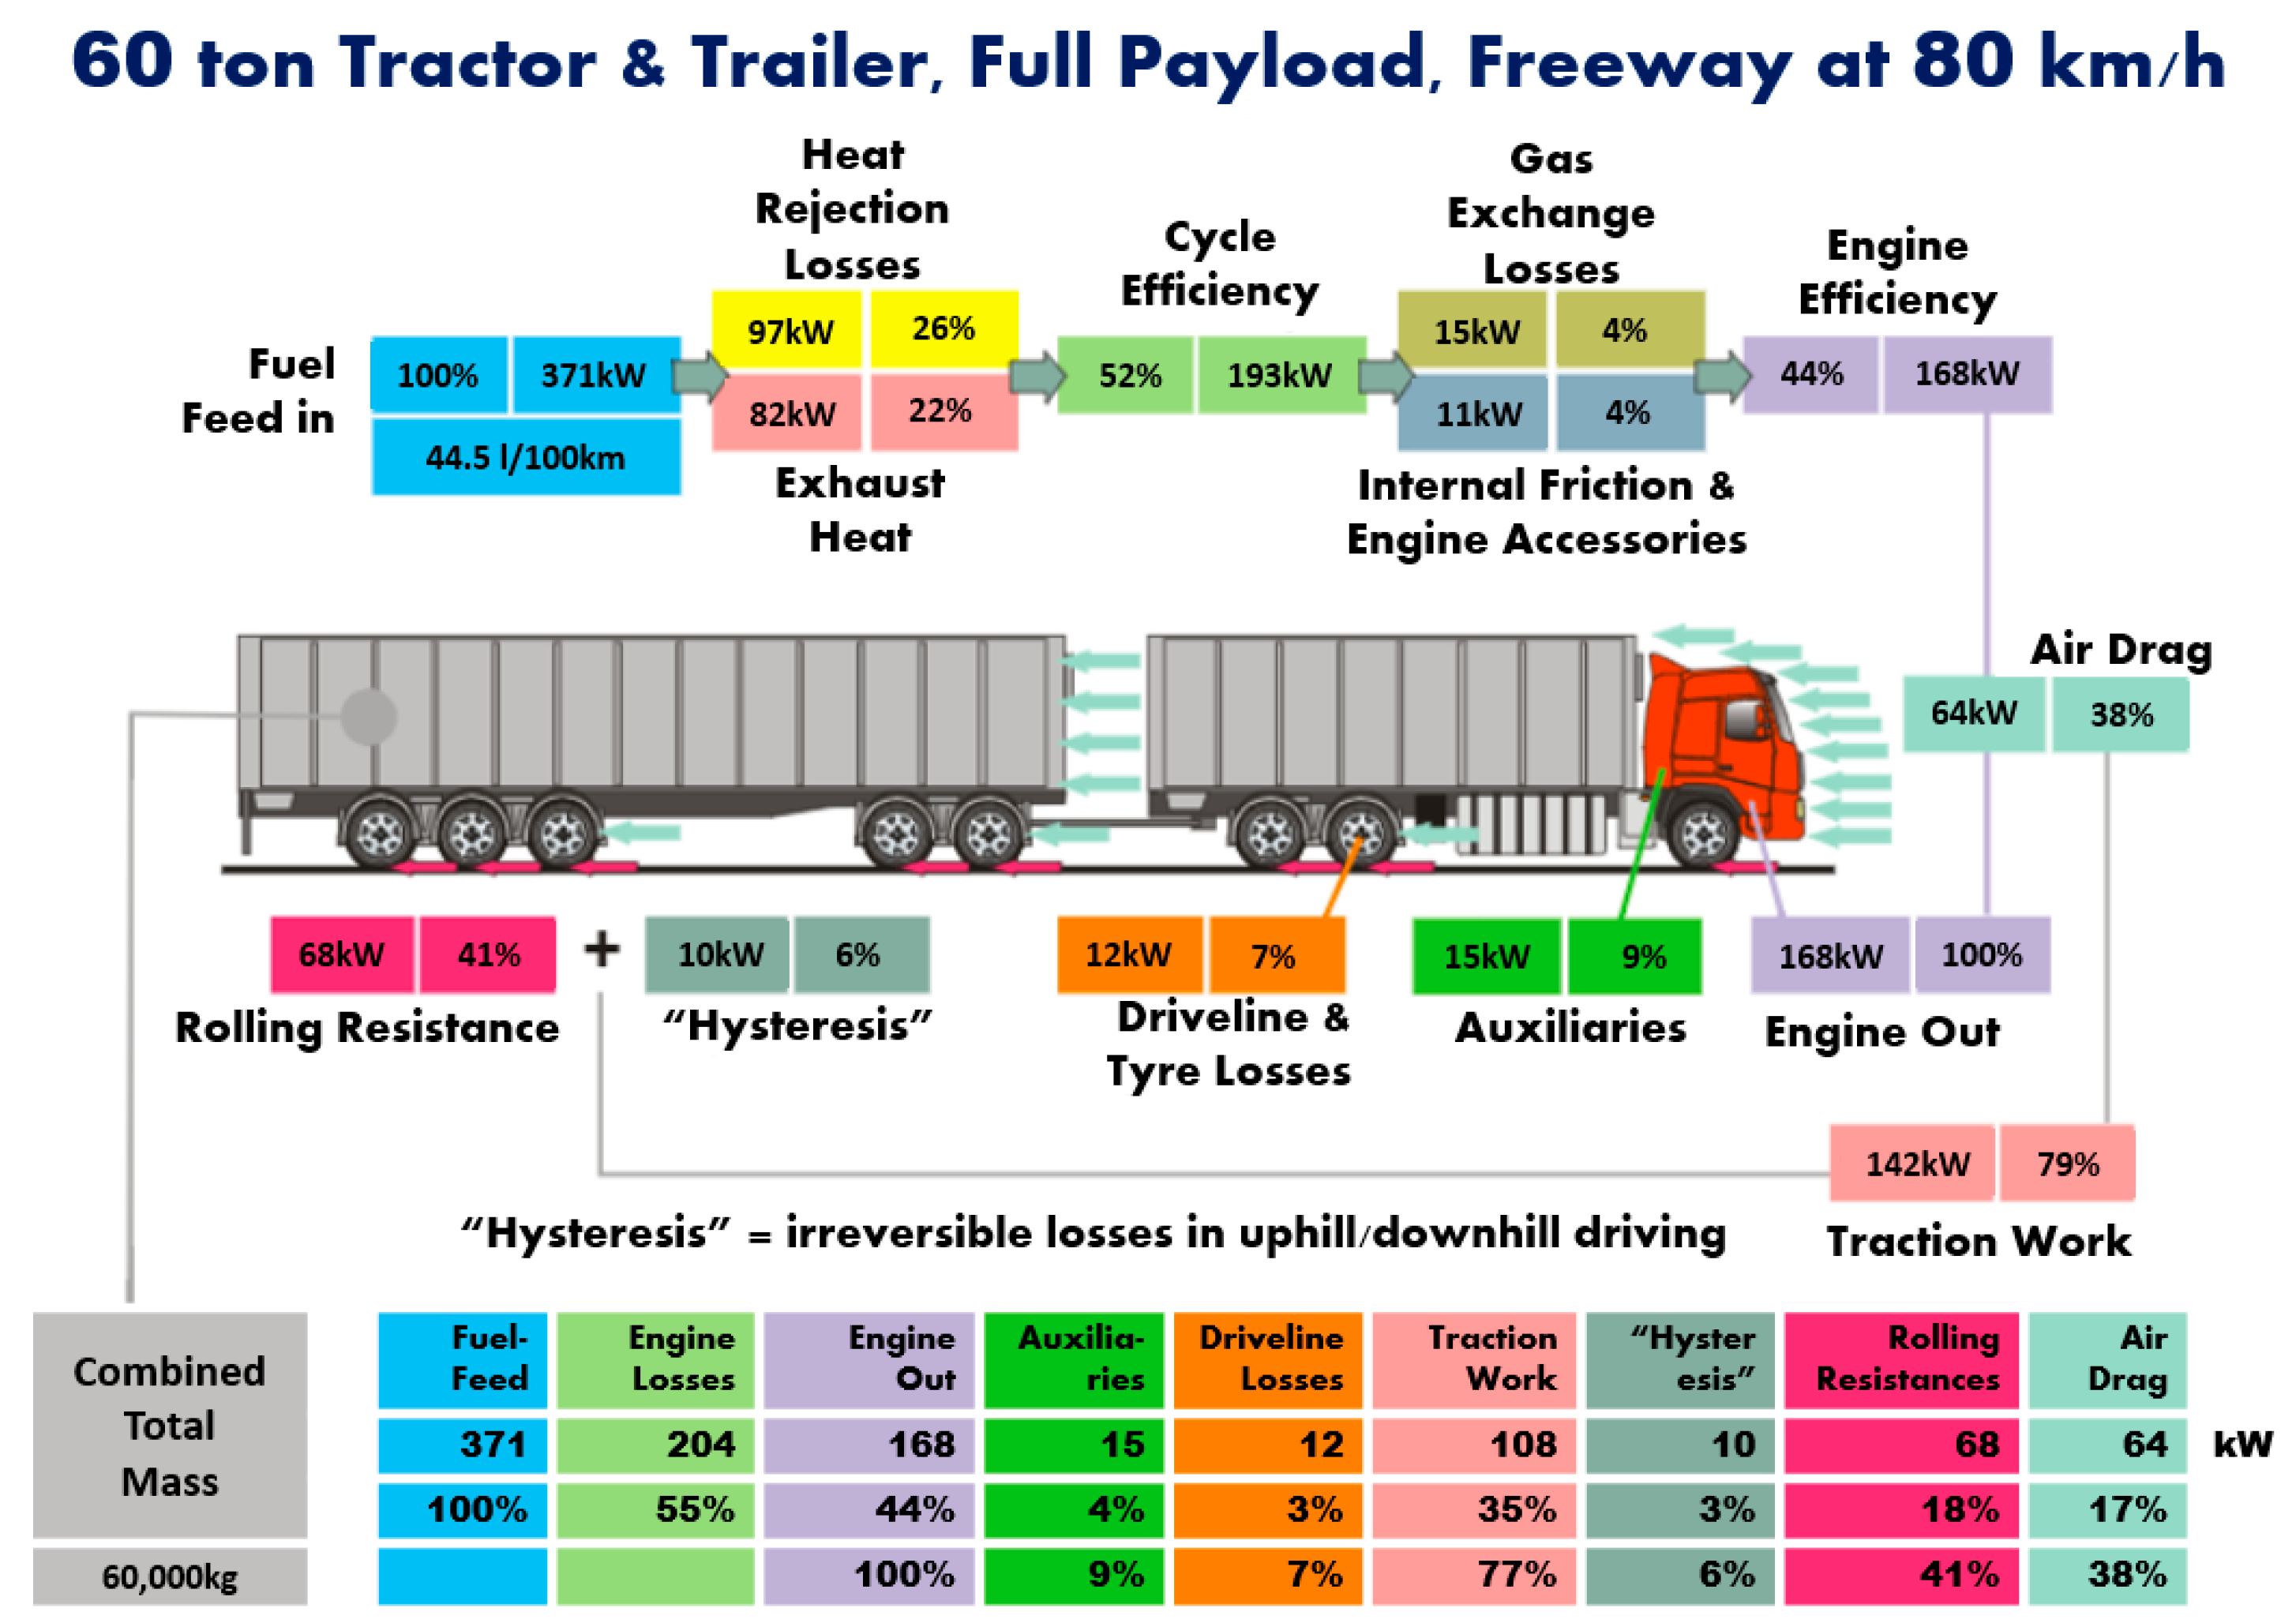
Before further exploring aerodynamic efficiency, it is important to understand the energy flow and how these flows impact mission efficiency in road freight operations. Consider a 60 ton tractor–trailer configuration running at the speed of 80 km/h [2]. Figure 1 shows a typical energy balance of such a combination.
Technologically, based on the calculations shown above and also observing the trend in efficiency for thermodynamic efficiency for internal combustion engine shown in Figure 2 [3], a tractor is able to convert ~44% of the energy contained in its fuel for use in forward motion.
This is not the only factor; the second efficiency is the system efficiency that comes from aerodynamic and frictional resistances that a vehicle needs to overcome to gain motion. Keeping these efficiencies in mind, we know that when we bring the analogy of mission efficiency [4], defined as
and apply it to our trucks, wherein the typical payload weight is roughly 62.5% of the combined weight i.e. when the truck is loaded to 25 tons, this yields a mission efficiency of less than 20%. For example,
Putting the above efficiencies into perspective, let us consider an analogy where we are filling the gas tank to 100 liters. While doing so, we pumped 35–45 liters into the tank and then pumped 55–65 liters onto the ground; you now begin to understand just how much fuel your vehicle can waste. Only ~50% of the energy from the 35–45 liters that made it into the tank will be required to move the weight of the vehicle against forces of nature, while only 8–20% of the energy depending on the payload will actually move the goods to their destination, leading to an overall mission efficiency of less than 20%, as indicated above. With the knowledge of aerodynamic efficiency, we will try to understand and improve the system efficiency in tractor-trailer combinations. Today’s trucks have to be modular to combine different tractors and trailers. Additionally, the load volume of the trailer is maximized to each country’s regulations. In the last 30 years, the aerodynamics of a vehicle has become a major focus to reduce fuel consumption and therefore get better transport efficiency.
1.2. Aerodynamic Drag Calculation
Drag is the force of wind or air resistance pushing in the opposite direction to the motion of the object. The drag coefficient () is useful when comparing the aerodynamic efficiency between different vehicles [5]. It is related to the aerodynamic drag force (), vehicle speed (), frontal area (), and the density () and is defined by
The comparison of the drag between specific case and reference case is defined as ∆Cd. For comparison, we look at the drag co-efficient when the wind is blowing at different angles, and we call it the yaw angle, which is denoted as . These parameters form the foundation for understanding the aerodynamic drag of the vehicle.
2. Conventional and Cab over Engine Tractors
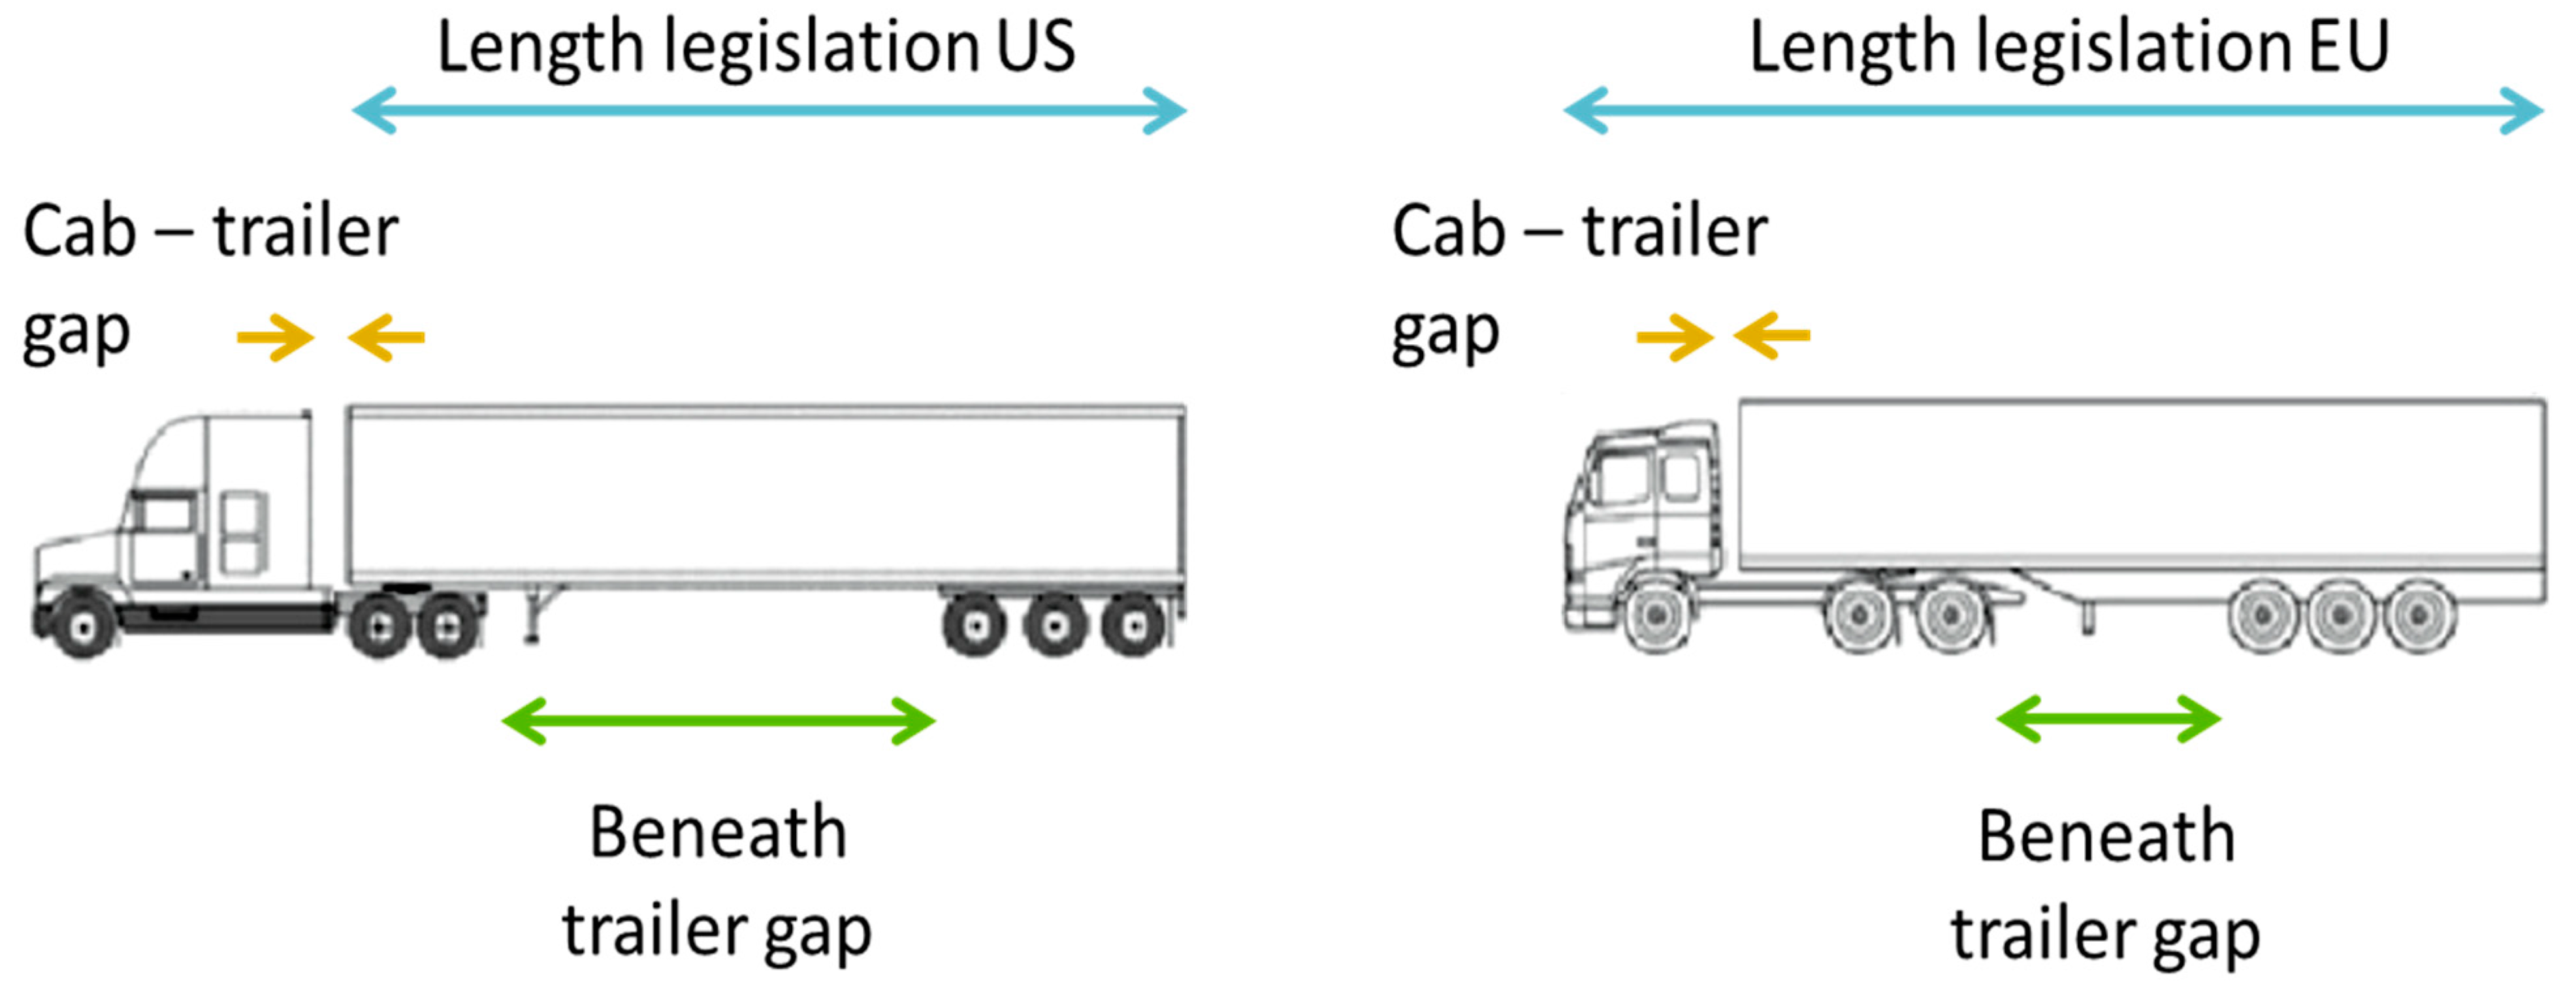
A lot of investigations on aerodynamic measures that could be integrated in trucks have been made in the US and Canada, but the achieved results are not directly transferable to European trucks. This is mainly due to the different truck designs that have been introduced by different legislation in the US and the EU [5]. Figure 3 shows the two designs of trucks. In the US, the typical design of trucks is named Conventional (CONV), and in Europe, it is named Cab over Engine (CoE). US legislation restricts only the length of the trailer and not of the whole tractor semi-trailer combination, as in Europe. Therefore, the design of the tractor is very free, typically with a long nose containing the engine and a sleeping cabin behind the driver cabin. In principle, the tractor height could be much lower than in European trucks. Here, the driver cabin is very short, to maximize the load volume of the trailer. Also, the tractor needs to be higher because of the engine is usually under the cabin, and in some cases, there is a sleeping cabin above the cabin.
There are three main areas that influence the aerodynamic behavior of the tractor in different ways. The first one is the front area of the tractor, where the long nose with fender (US) is different from the steep flat front (EU). The CoE design therefore gives fewer opportunities for aerodynamic design because of restricted design space. The second area is the gap between the cabin and the trailer. For European trucks, this gap is much smaller than in US trucks, and therefore the crosswind influences are much higher for US trucks. The third area is the gap beneath the trailer between the back of the tractor and the wheels of the trailer. In Europe, there are under run protection, tool and palette boxes, or spare wheels, whereas for US trucks, the gap is empty in most cases.
These differences in design imply that investigated aerodynamic measures have a different impact on the overall aerodynamics of the vehicle. Similar measures can show a trend, which can be adapted to the European truck, but the amount of drag or fuel reduction will be different (lower or higher).
3. Inquiry about Previously Examined Aerodynamic Measures for Truck and Semi-Trailer
The following section highlights and summarizes different aerodynamic measures for tractor, semi-trailer and their combinations. As stated in Section 2, the design of Conventional trucks (CONV) is different from the Cab over Engine trucks (CoE) found in Europe, and the benefits are not comparable. Therefore, the results of previous studies for CONV will only be taken as suggestions.
3.1. Cab Aerodynamics
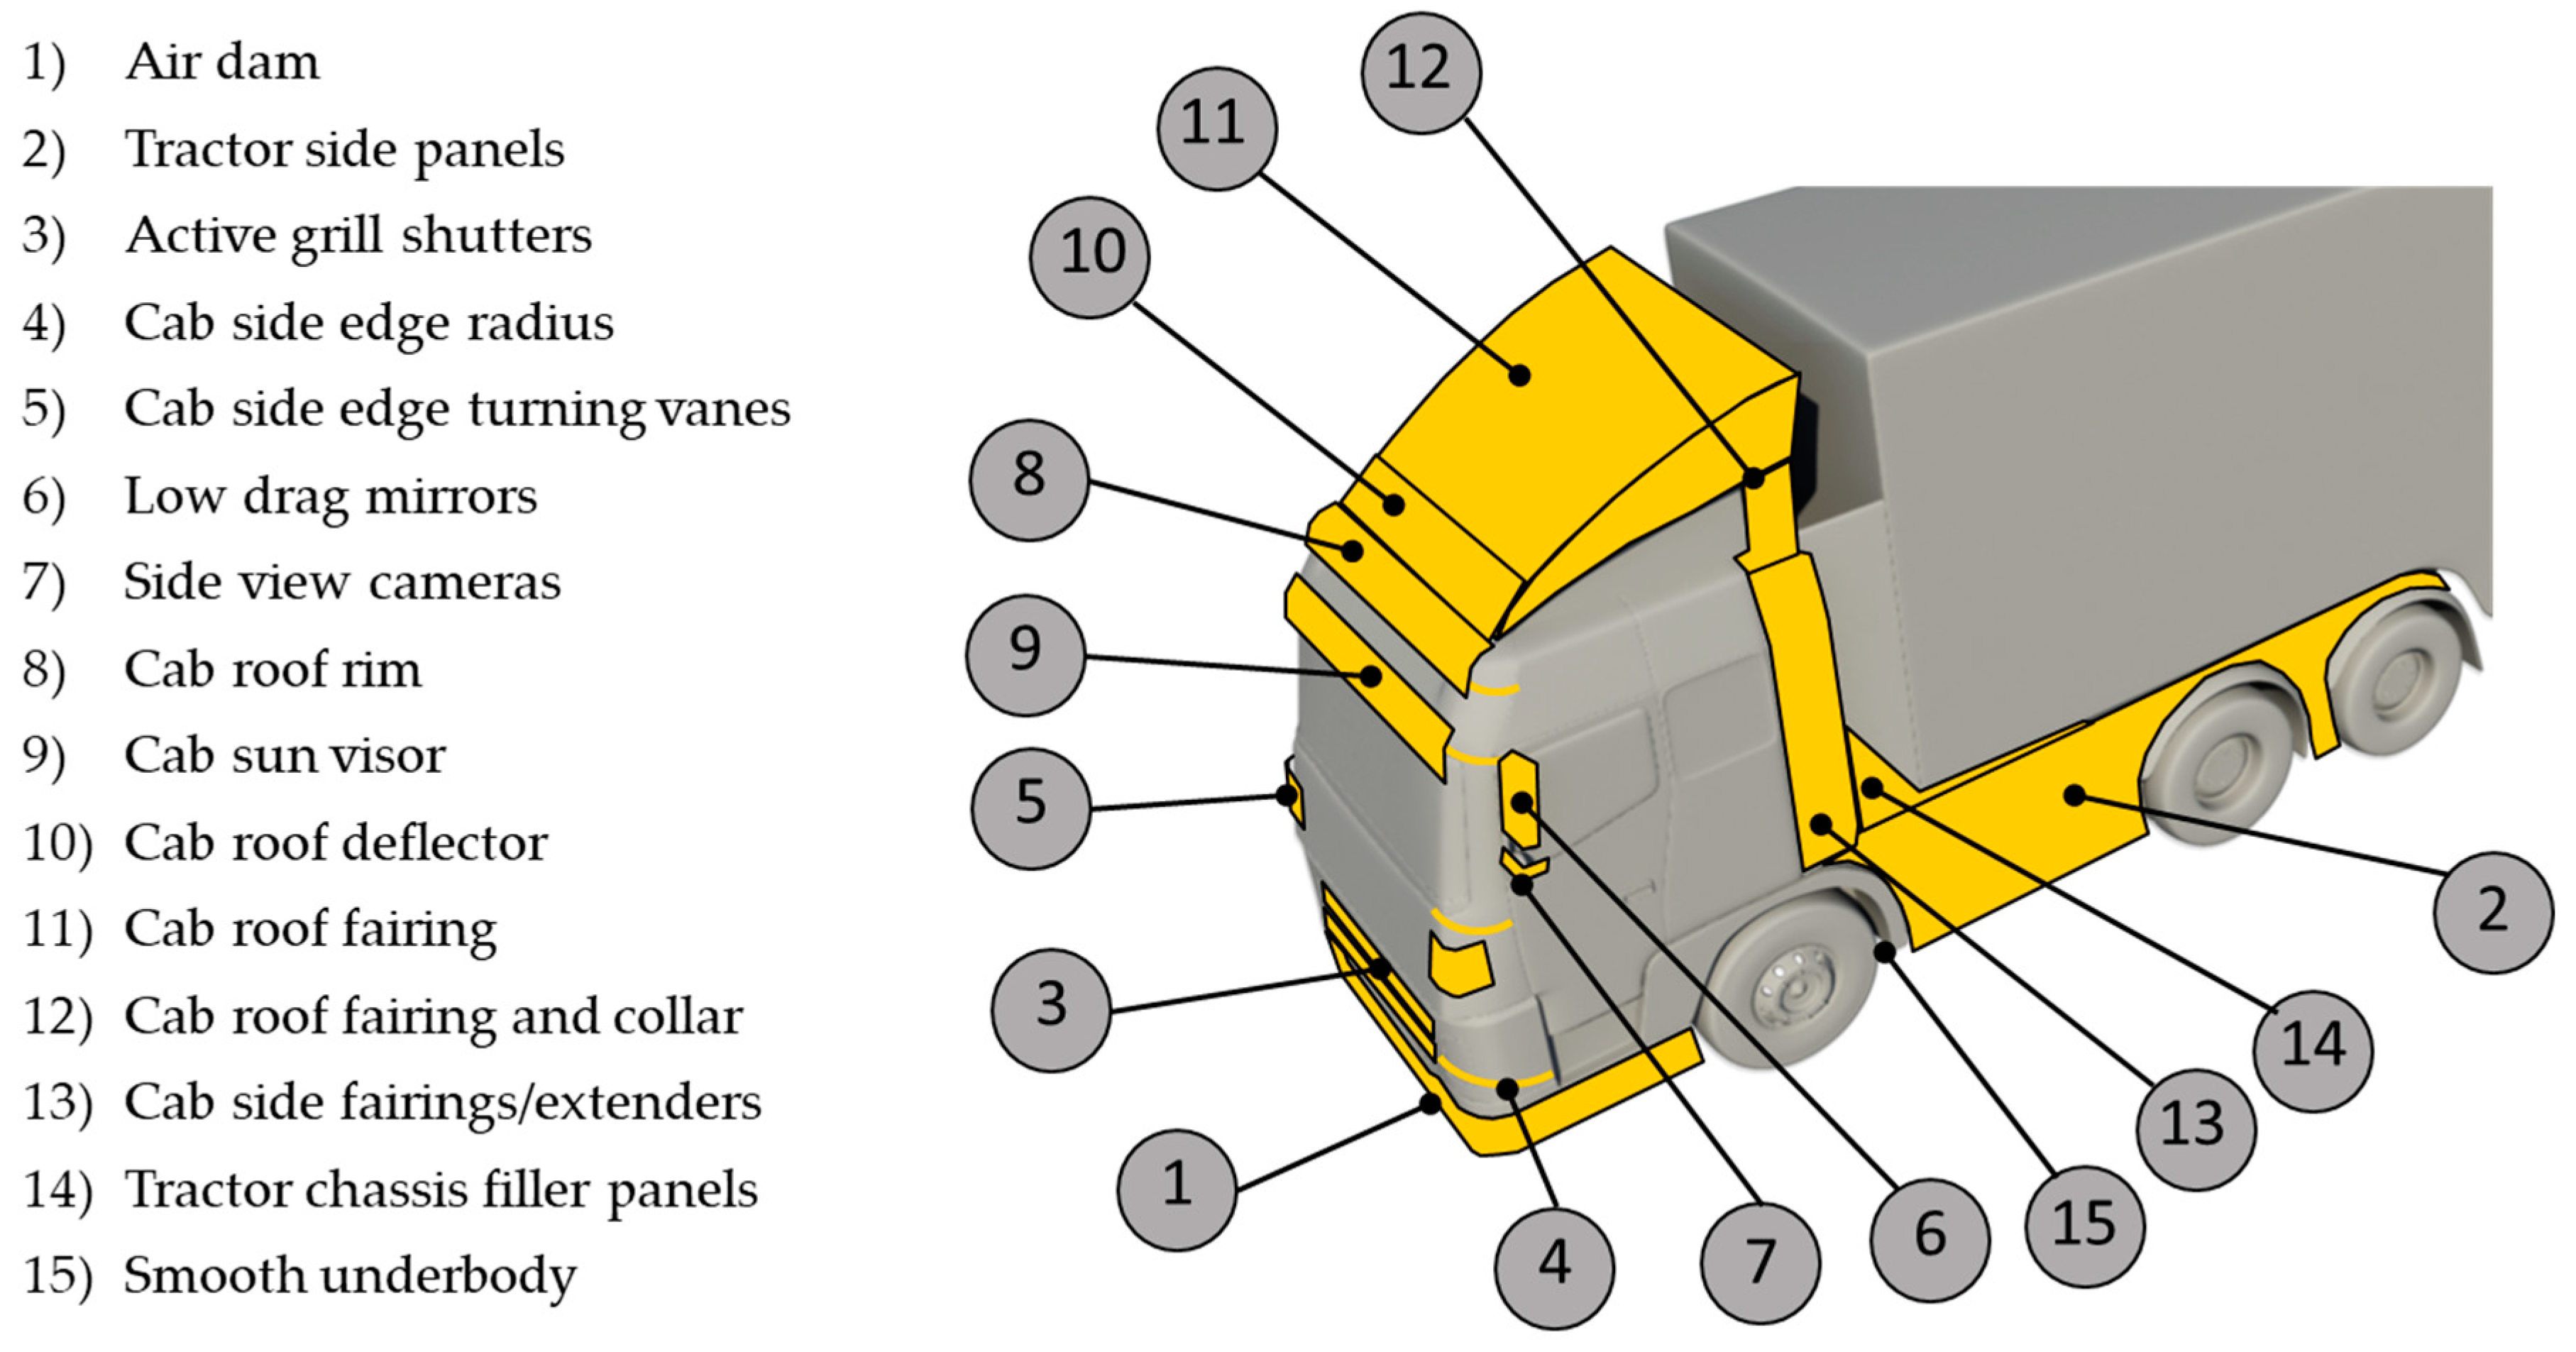
Figure 4 shows all aerodynamic measures for tractors found during the inquiry. Many of these features have also been shown in “Good Practice Guide 308: Truck Aerodynamic Styling” [6] from 2001 and the “Freight Best Practice: Aerodynamics for Road Efficient Road Freight Operations” [7] from 2010, where nearly the same values are given.
The definitions of these components are as follows:
- (1)
- (2)
- (3)
- Active grill shutters will reduce the air flow through the rough engine compartment. An intelligent connection between the grill shutters and the thermal management system of the engine is needed to prevent overheating [9].
- (4)
- The cab side edge radius is important to direct the airflow from the front around the cab to the sides of the truck. A higher radius is better, but the overall design of the cab has to be considered in detail to get an optimized radius of the different edges [10].
- (5)
- (6)
- (7)
- Side view cameras can reduce drag because they are much smaller than mirrors. In some cases, the drag increases if the abandoned mirrors supported a better airflow around the edge, so the overall design of the cab has to be considered in detail.
- (8)
- (9)
- (10)
- A cab roof deflector directs the air flow smoothly to the upper edge of the trailer without generating turbulences. It needs to be adjusted to the trailer height. Sometimes, it is only a simple, slightly contoured plate. Today, a small cab roof deflector is integrated into a cab roof fairing to level the heights of tractor and trailer in some vehicles [5,6].
- (11)
- (12)
- (13)
- (14)
- (15)
- A smooth underbody reduces the turbulences induced by the jagged underbody [11].
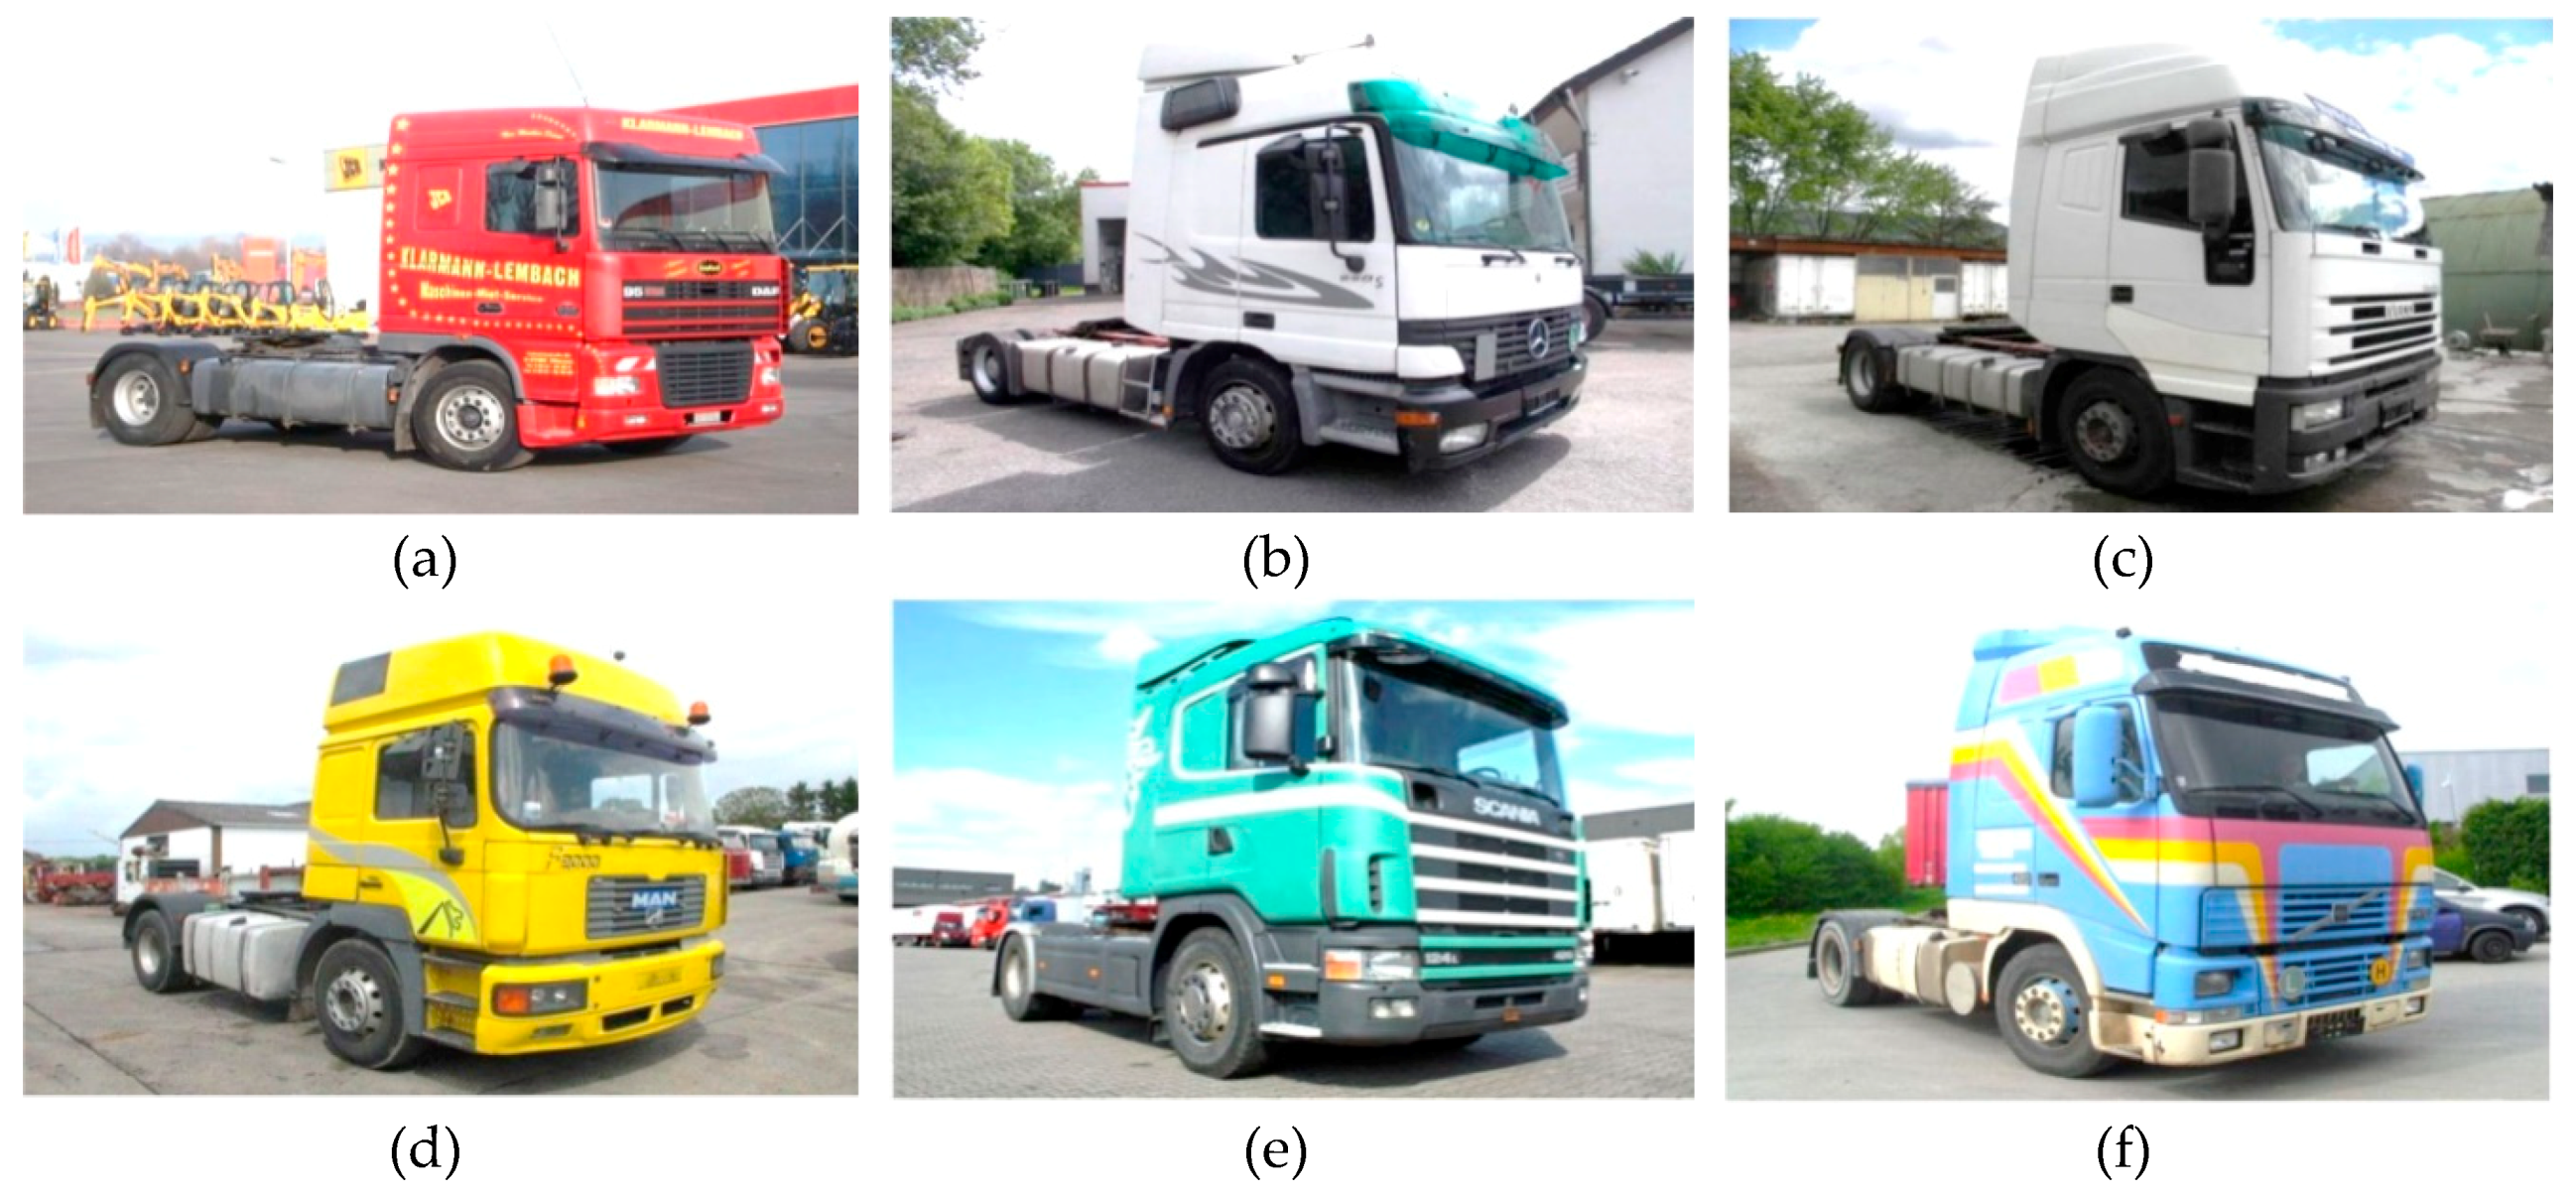
When we look at photographs in Figure 5 of tractors from 1999–2001 and in Table 1, we observe that Original Equipment Manufacturers (OEMs) already include a lot of aerodynamic features in their tractors, and many of them can only be fitted later, if the related OEM supplies these parts. All aerodynamic parts have to fit perfectly to the designated tractor; otherwise, the aerodynamic effect will be worse.
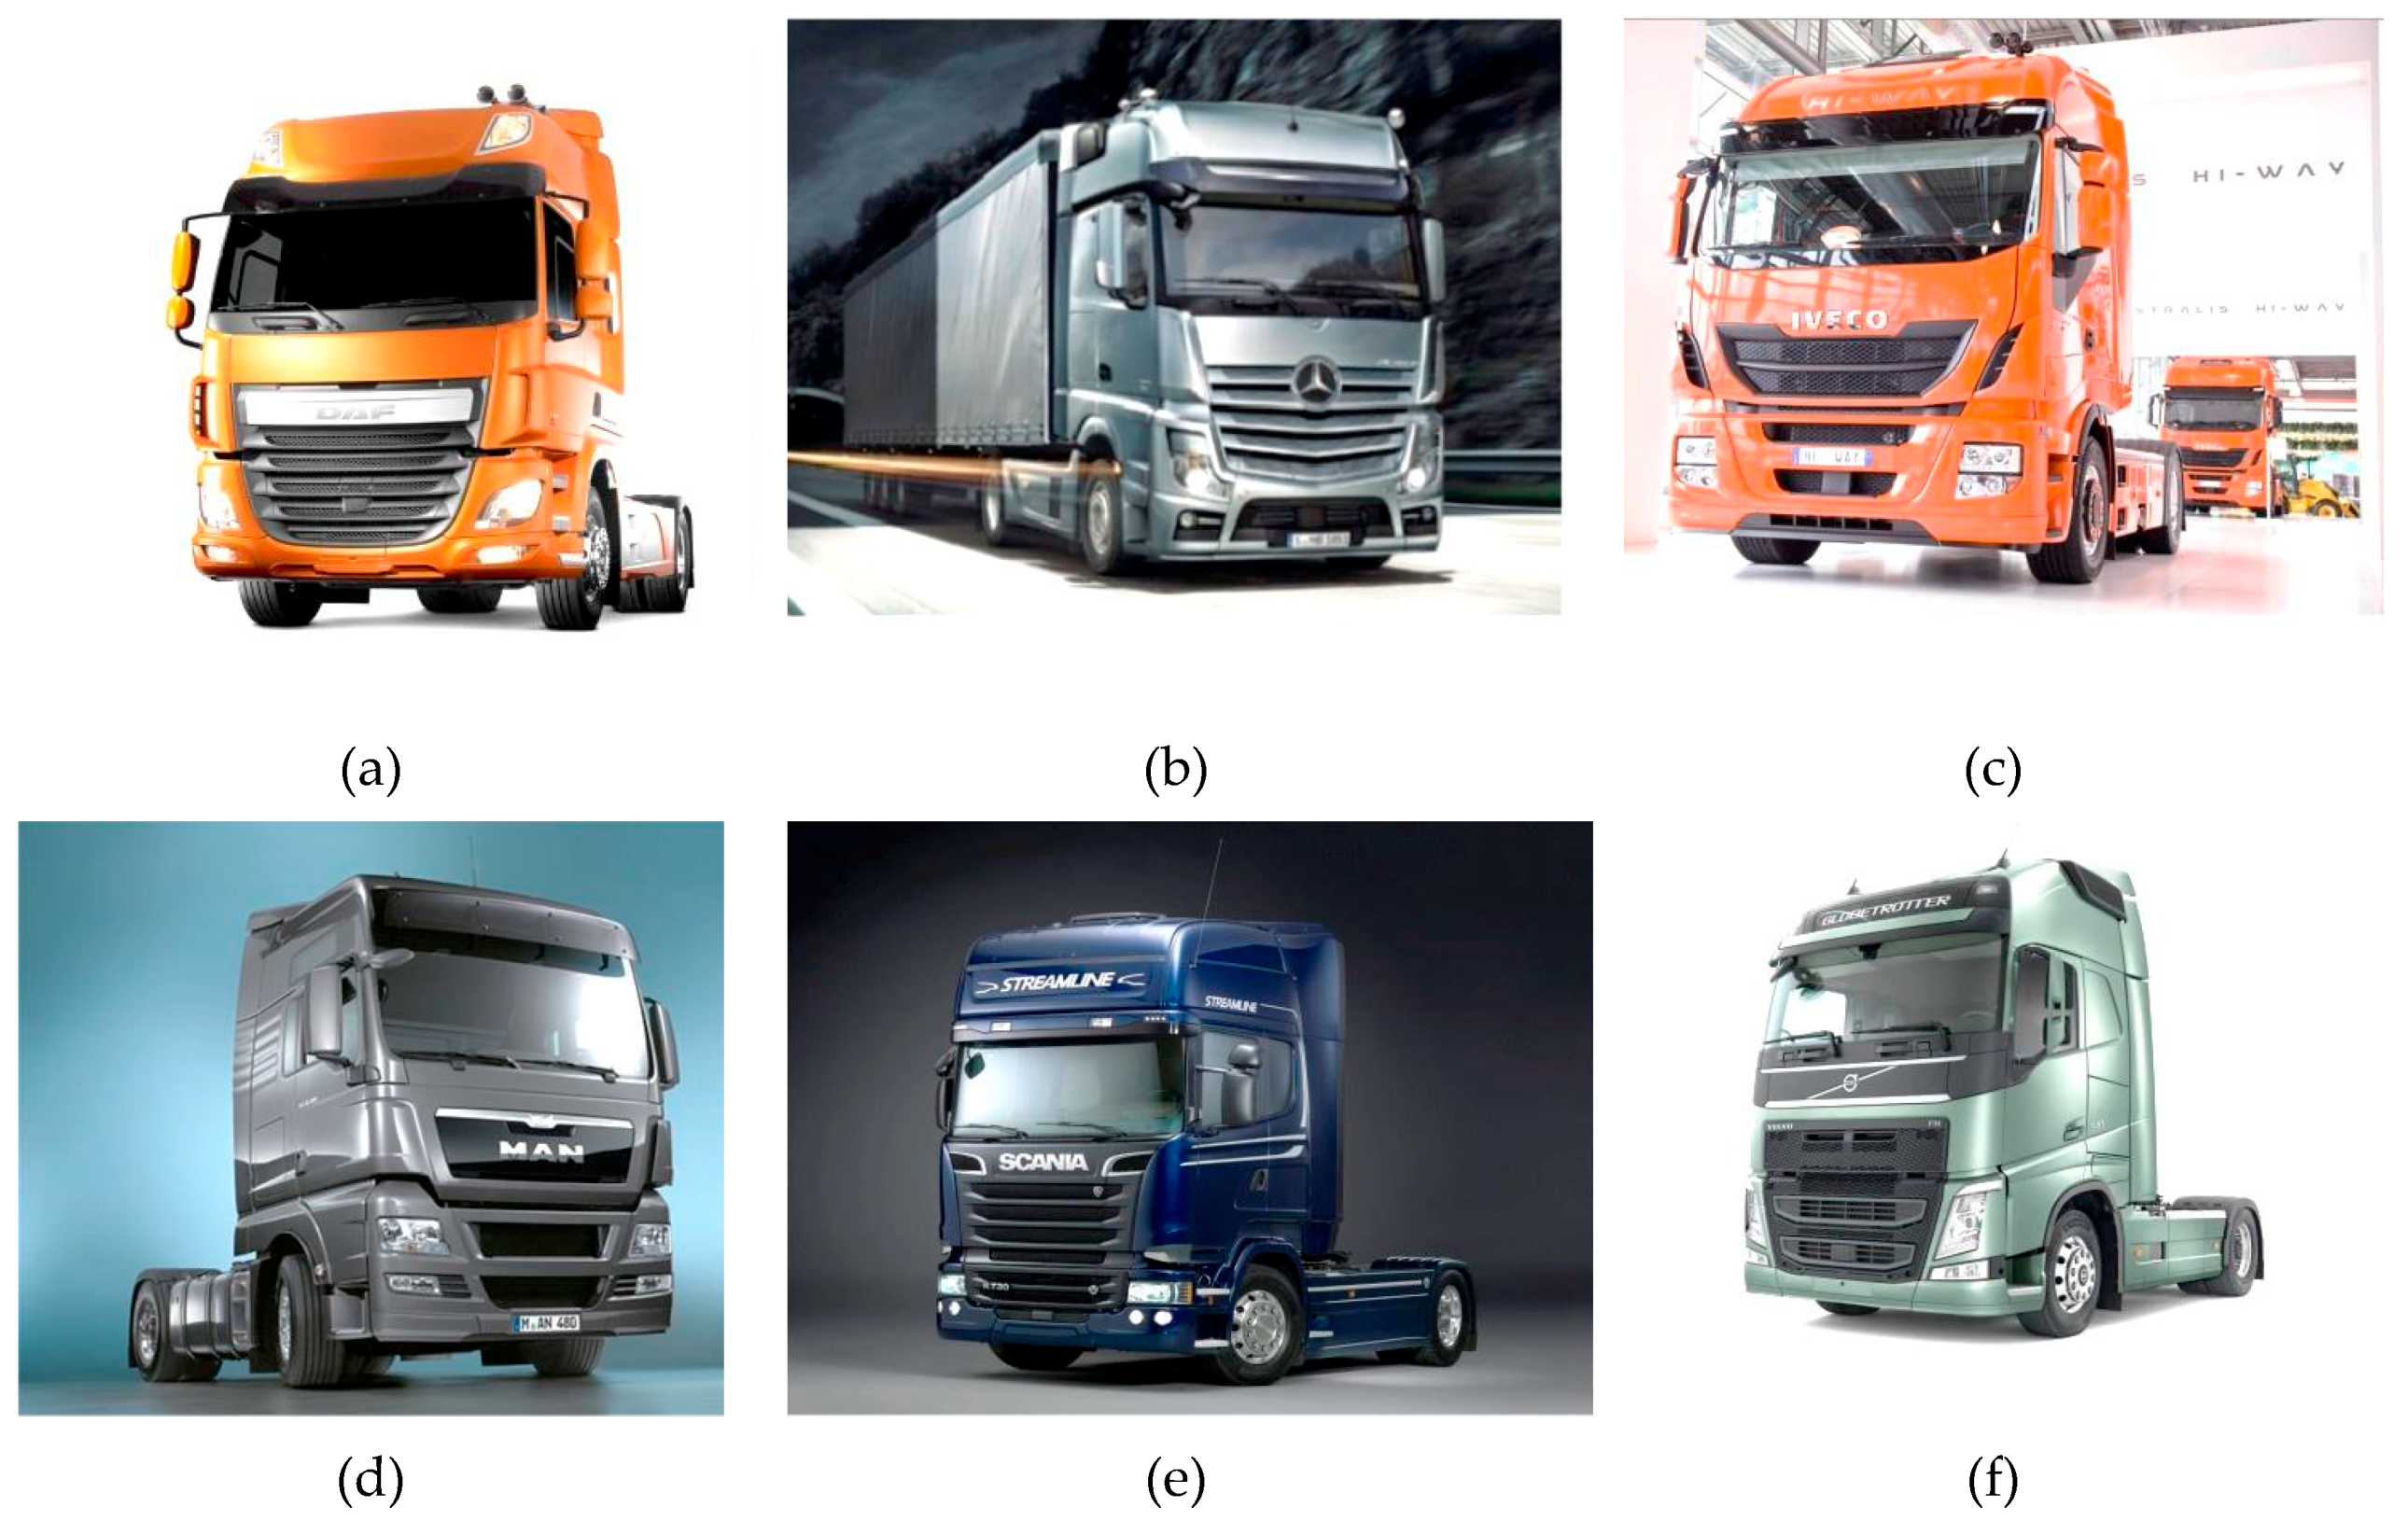
Comparing the tractors to state of the arts tractors of 2014 as seen in Figure 6 and Table 2, all OEMs implemented a lot more aerodynamic measures, which gives less room for further improvement. Improvement can mainly be achieved by adjusting the different measures to each other to get a fully optimized tractor. Here, all OEMs undertake a lot of effort to improve their tractors by performing Computational Fluid Dynamics (CFD) simulations, performing wind tunnel tests, and track tests. Looking at the tables, some of the aerodynamic features are mutually exclusive and cannot be identified with a photograph as reference.
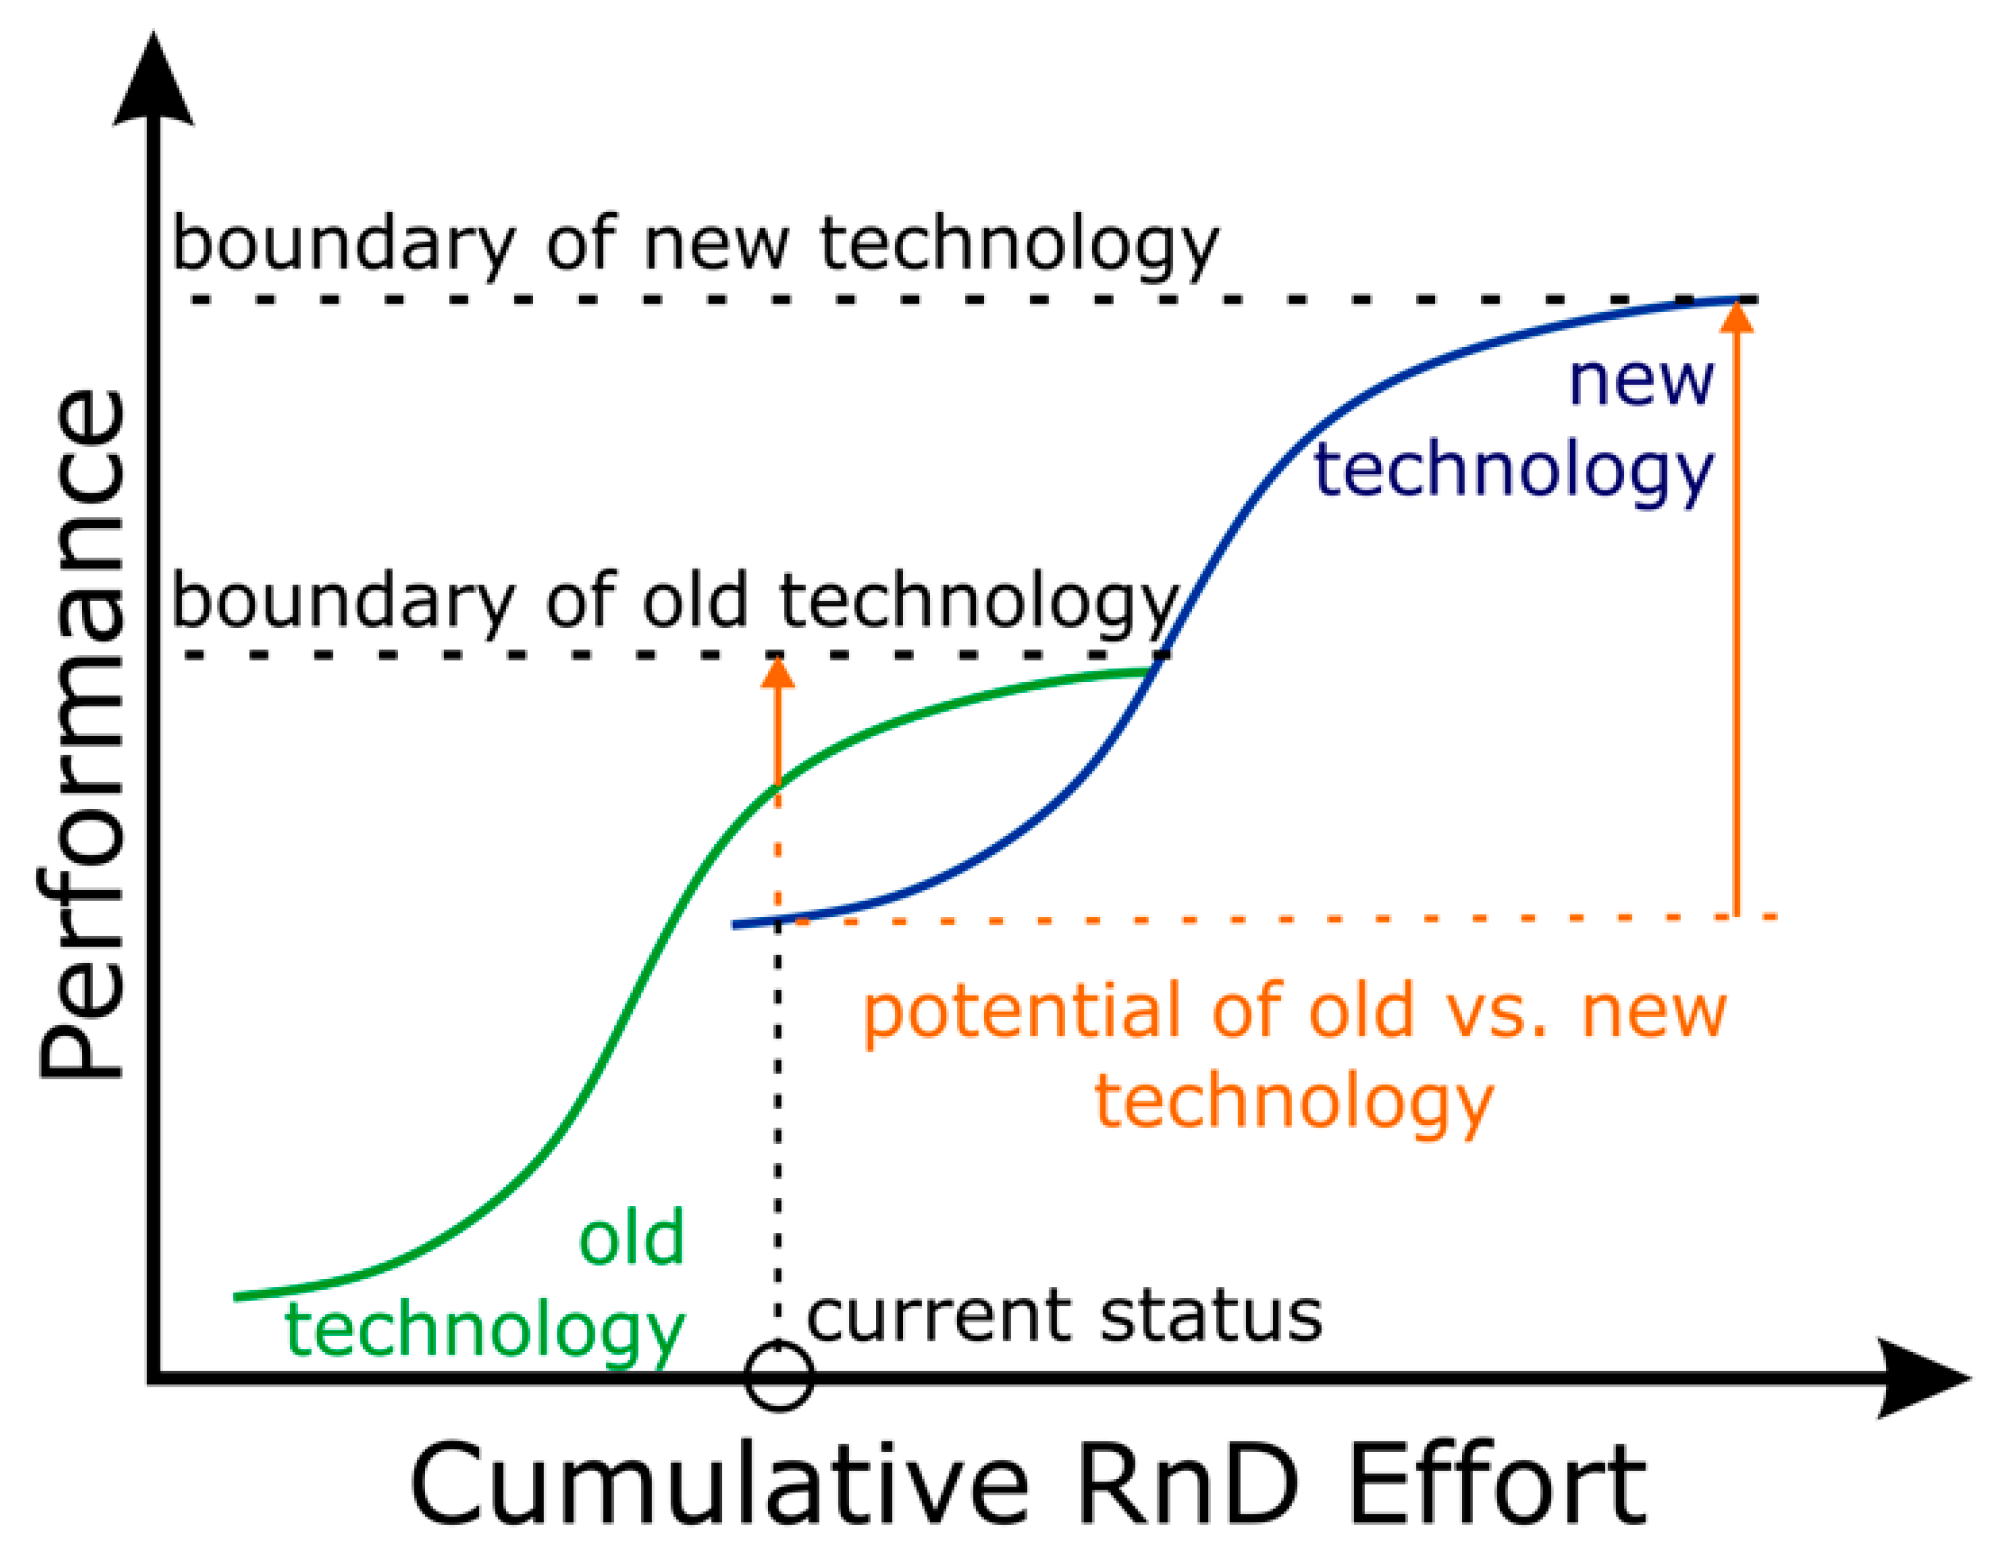
Another possibility is introducing new technologies for better improvements. Compared to Figure 5 and Figure 6 and applying the s-curve concept [12] as shown in Figure 7, the old design technology of tractor aerodynamics seems to be close to its boundary.
Low performance improvement needs a lot of engineering effort. The boundary of aerodynamic tractor design is therefore based on several aspects. Legislation and load efficiency limit the design space, and within this design space, nearly all possible aerodynamic features have been implemented, and only optimization improvements with smaller improvements are possible. Looking at the Concept S-truck by MAN, an overall performance improvement to a drag coefficient of a small van can be achieved. In order to get on the new s-curve for aerodynamic improvement, the whole transport chain with vehicle configuration needs to be reconsidered. Hence, new technology that offers bigger improvement in aerodynamics is not only a matter for OEMs to work on but also for infrastructure, legislation, transport companies, policies, and others.
3.2. Trailer Aerodynamics
When we look at Figure 8, there are three areas on the trailer that are of special interest for implementing aerodynamic measures. The first area is in front of the trailer, especially the gap between the tractor and the trailer. The second area is the lower part of the trailer, where under run protection, tool and palette boxes, or spare wheels are attached to the trailer. Also, the bogie of the trailer is of interest because of all the rough gaps between the wheels, the mud wings, and the axles. The third area is the back of the trailer. All shown measures can be classified to these three areas. Within every area, only one device can typically be installed.
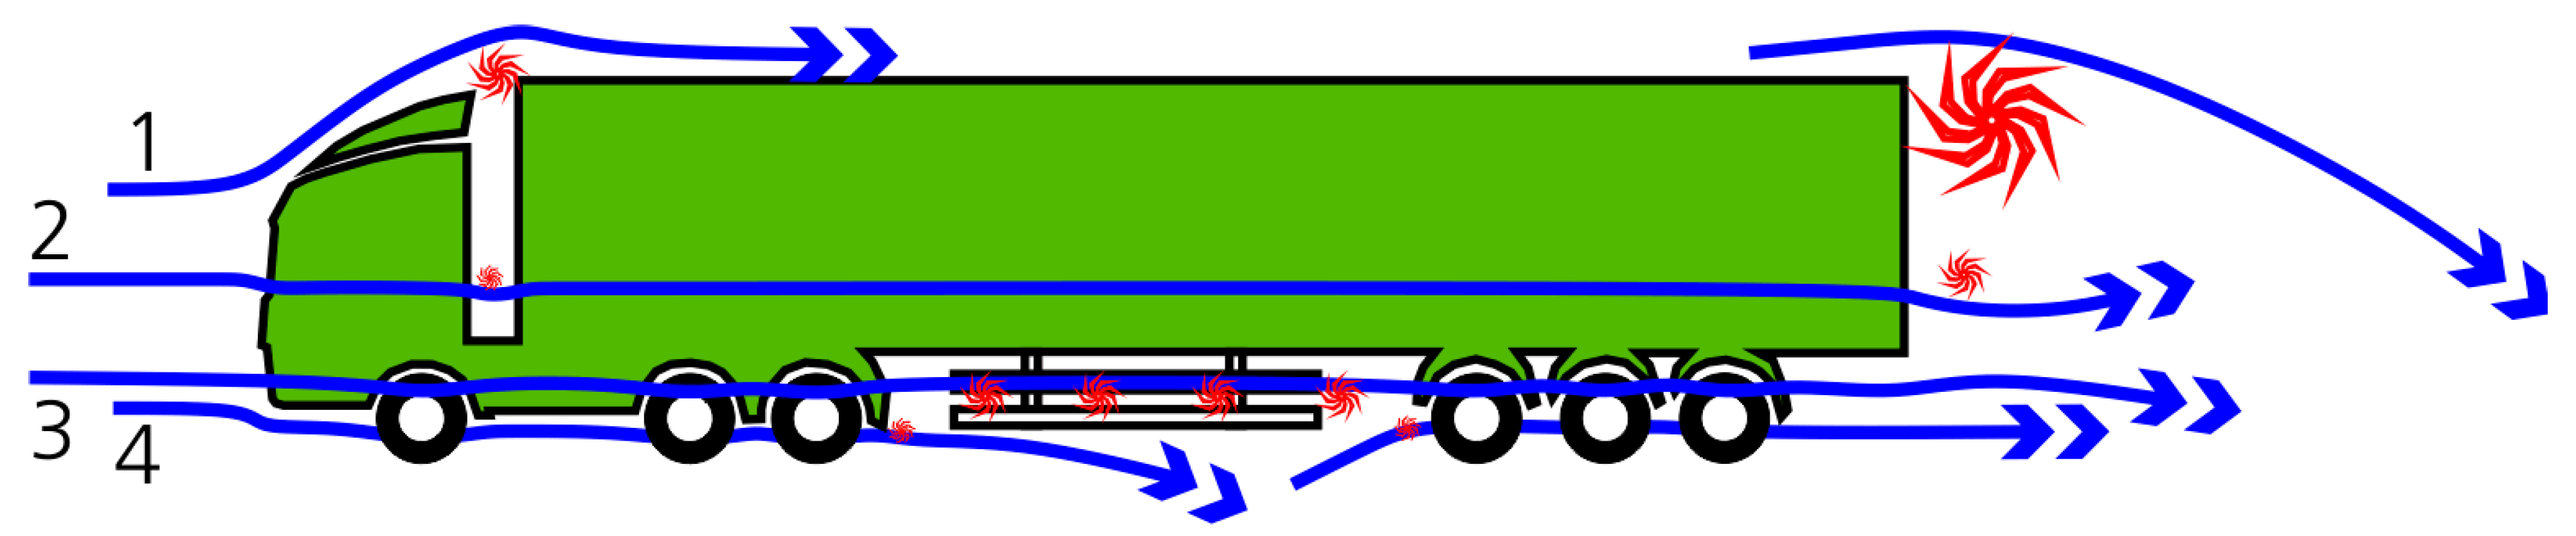
Figure 9 shows a rough sketch of airflow paths of a truck without any special aerodynamic measures at the trailer. The blue airflow paths do not represent streamlines from CFD simulations but serve for a better understanding.
Path 1 follows the truck at the top. Here, the deflector of the tractor guides the airflow to the trailer’s leading edge. If the deflector is not adjusted in the right way and the leading edge of the trailer is sharp, then the airflow will be disturbed by this sharp edge, and the drag will rise. This is represented in the picture by a red vortex. The air will flow along the trailer roof to the trailing edge where it will be disturbed again. A big area of wake is located at the back of the trailer (bigger red vortex), which results in a high drag on the truck.
Path 2 follows the truck at the upper side of the trailer. Here, the side fairing of the tractor guides the airflow to the trailer side. The gap between modern European tractors and trailers is small, and only a small disturbance will arise even when crosswinds occur. At the end of the trailer, the trailing edge with the wake at the back will also generate a lot of drag.
Path 3 follows the truck at the lower side of the trailer. Modern tractors having side panels, so one can find only very small turbulences induced by the wheels. At the area where the under run protection and other things are attached, slight vortices are generated by the rough equipment. The vortices will get bigger with a rising crosswind. This is also valid for the wheels and the wheel houses of the trailer. At the end of the trailer, the airflow combines with a big wake area at the back.
Path 4 follows the truck at ground level. Depending on the tractor, the air flows smoothly to the underside of the trailer. Here, it is important that there is no equipment or device underneath the trailer with an opening to the front and a closed back, because this could work like a brake parachute with a lot of drag. Depending on crosswinds, the airflow here will be disturbed a little bit. A lower distance to the ground would be worthwhile but gives the disadvantage of less chassis clearance. Without a crosswind, the bogie with the axles induces slight turbulences; otherwise, the generated vortex will rise, and so will drag.
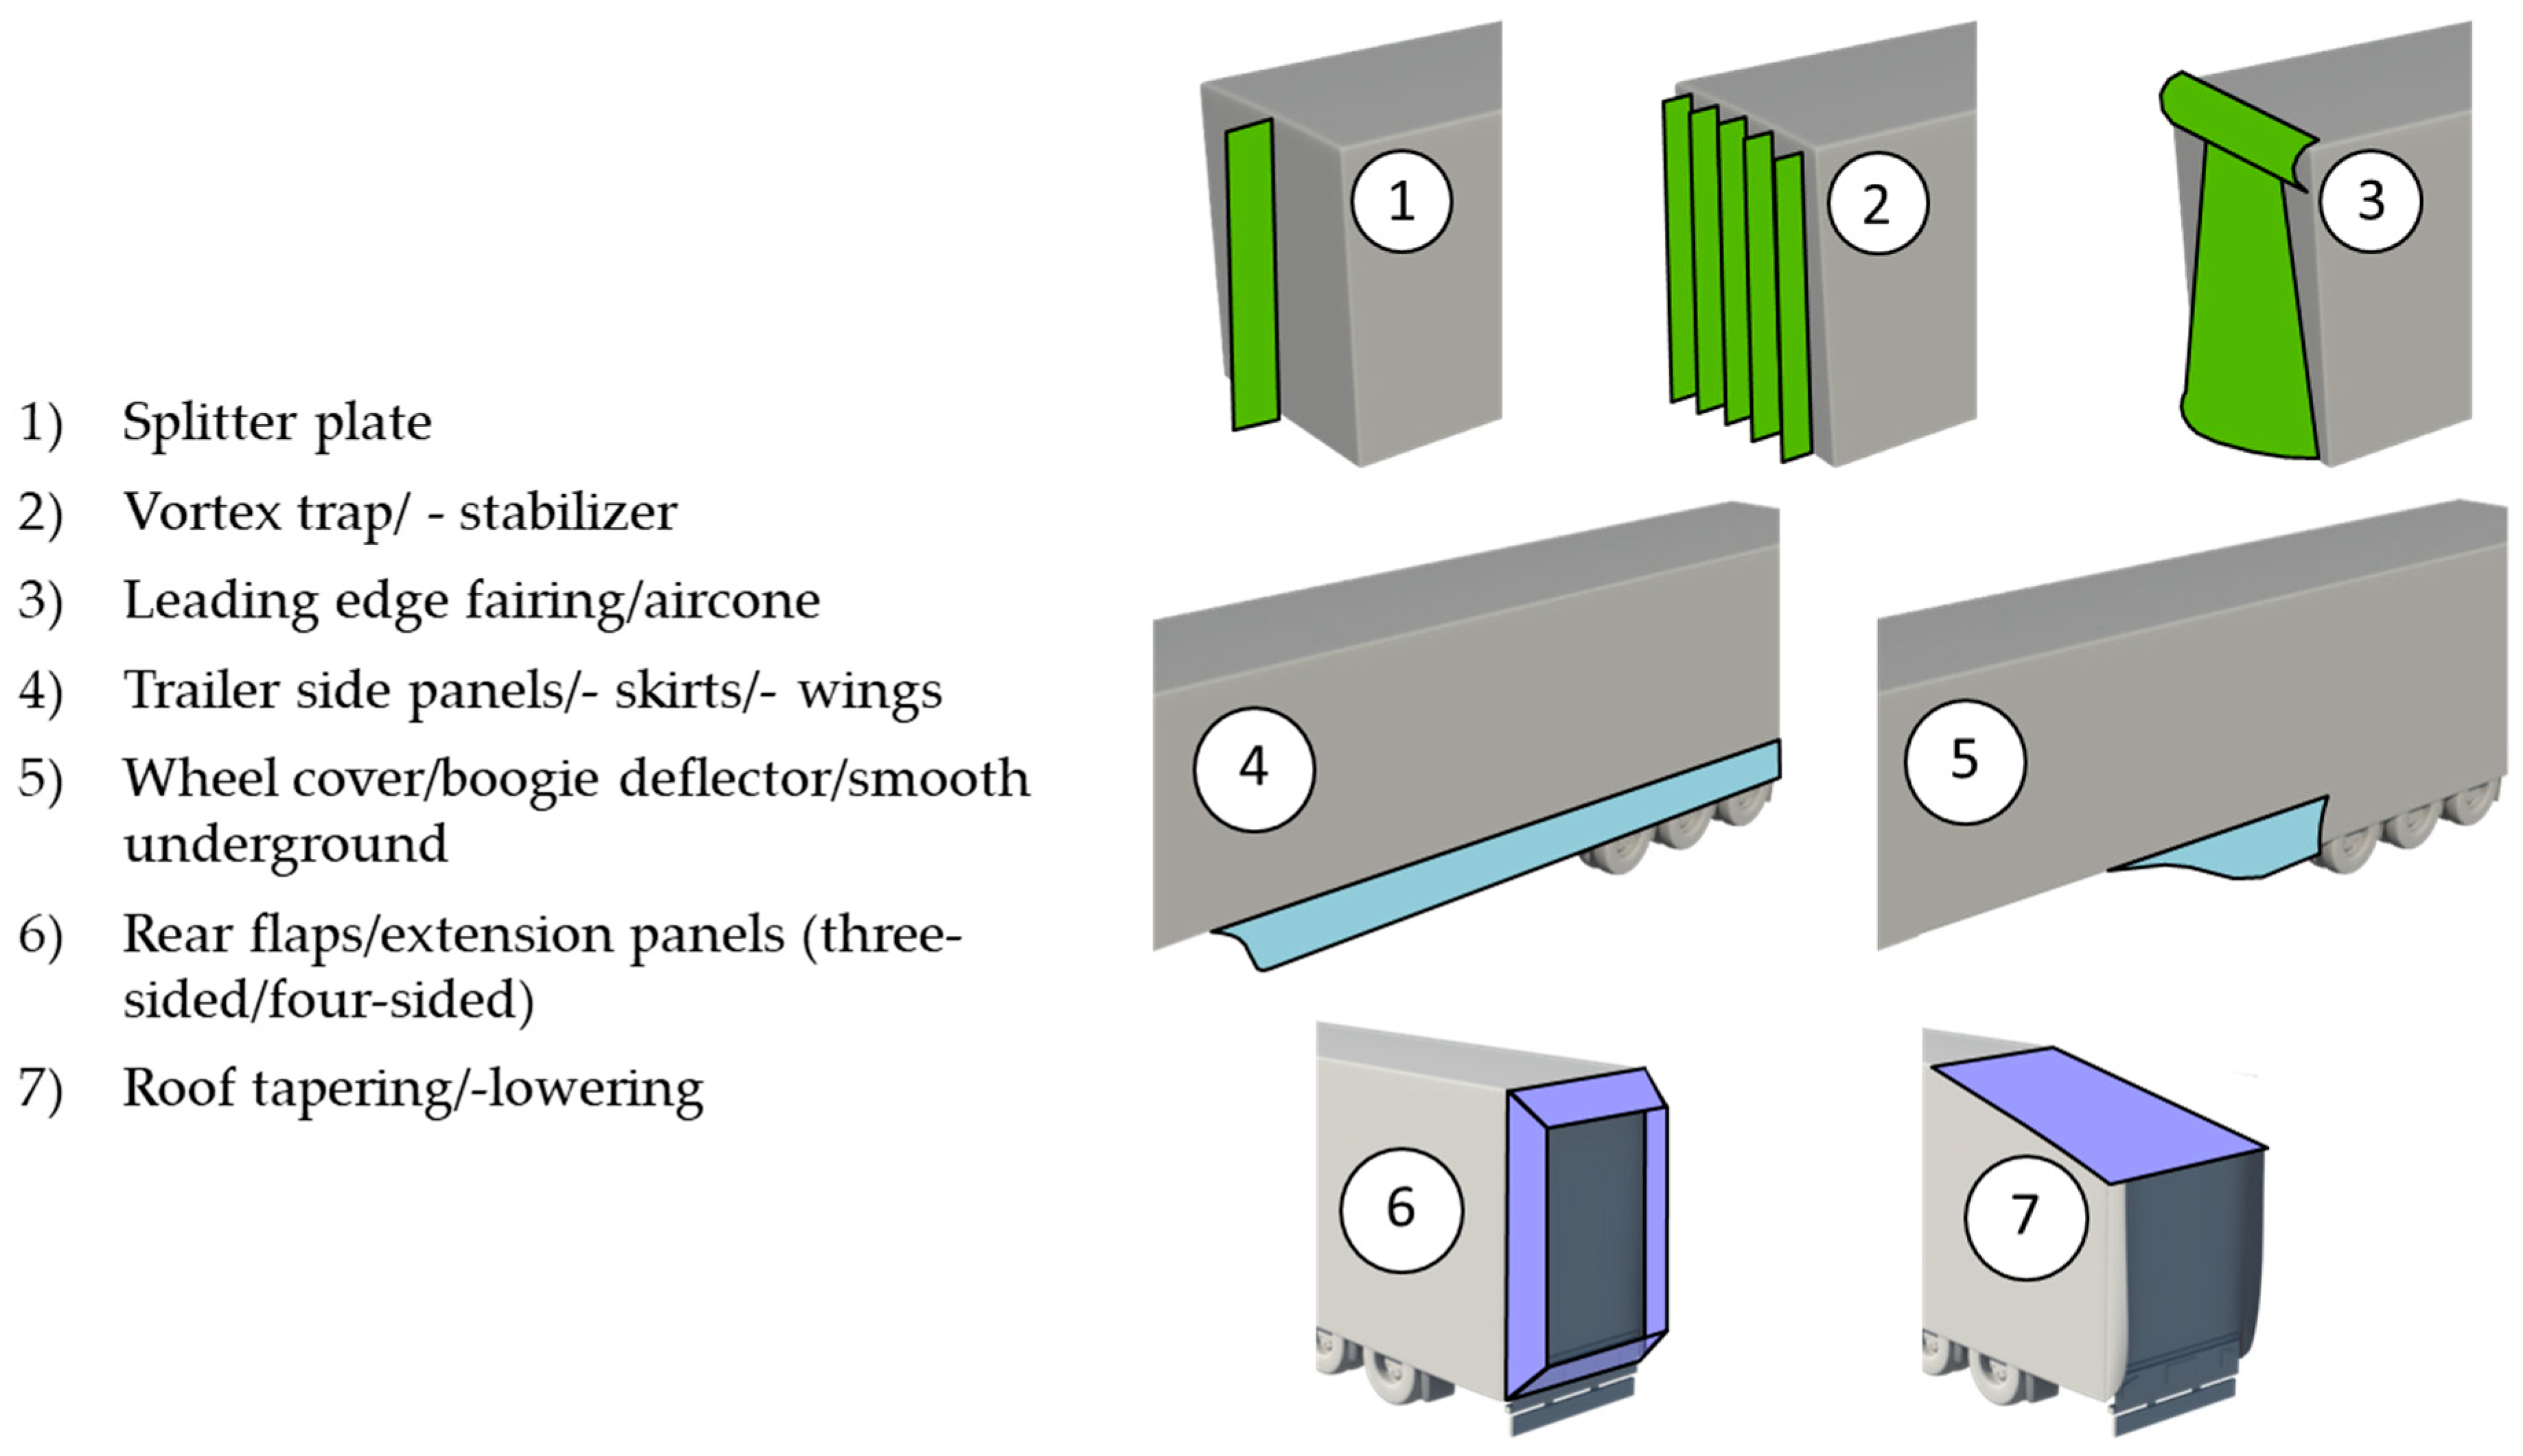
Figure 10 shows all aerodynamic measures for trailers that are investigated for CoE design within the Transformers project.
The definition of these components are as follows:
- (1)
- Splitter plate: A splitter plate divides the airflow to the left and right of the trailer and reduces the main vortices by building smaller local vortices. During crosswind, it closes the gap between tractor and trailer and hinders the airflow flowing through that gap, building additional vortices with additional drag. A splitter plate is more effective at bigger gaps between the tractor and trailer.
- (2)
- Vortex trap/stabilizer: The vortex trap or vortex stabilizer is similar to the splitter plate. It produces several local vortices between the plates that guide the airflow around the trailer. The main vortex is reduced and therefore so is the drag. Like the splitter plate, it also reduces the crosswind effects by closing the gap between tractor and trailer. A vortex trap is more effective for bigger gaps between the tractor and trailer (CONV).
- (3)
- Leading edge fairing/air cone: A leading edge fairing or an air cone guides the airflow directly around the trailer without building smaller local vortices like the splitter plate or the vortex trap. Depending on the type, it also closes the gap between tractor and trailer and therefore reduces drag induced by crosswind effects. A leading-edge fairing is more effective for bigger gaps between tractor and trailer (CONV) but also provides a significant reduction for CoE.
- (4)
- Trailer side panels/side skirts: Side panels, side skirts, or side wings close the gap beneath the trailer between the back of the tractor and the wheels of the trailer. There are different configurations for side wings. Short wings typically end before the wheels of the trailer, long wings typically cover the wheel houses, and fully closed wings cover the wheels too. There are many different designs that lead to different results.
- (5)
- Wheel-/bogie deflector/smooth underbody: Wheel covers (in front of the trailer wheels), bogie deflectors, or a smooth underground (fairing) work as moderate side wings. Here, mainly the wheels of the trailer are covered against crosswind and the airflow underneath the trailer in the driving direction. The building of vortices underneath the trailer is attenuated. A bogie deflector is more effective for bigger gaps underneath trailer (CONV).
- (6)
- Rear flaps/extension panels: Rear flaps or extension panels supporting the airflow at the top and the sides of the trailer merge and reduce the vortex behind the trailer. In the EU, the maximum length of foldable flaps is restricted to 500 mm behind the trailer.
- (7)
- Roof tapering/lowering: Roof tapering or roof lowering reduces the vortex area behind the trailer similar to the rear flaps. The main disadvantage of this design is less cargo space in terms of volume within current legislation. For a standard box trailer to be completely filled, the cargo must have a density of ≈300 kgs/m3. In the Transformers project, the trailer design will be adaptable to the loaded cargo, and height can be adjusted to these needs, which will resolve these disadvantages.
Table 3 shows the combinations of aerodynamics measures for the vehicle that is evaluated, and only one effective configuration will be considered to build the prototype.
4. Performance Study on Various Combinations for Aerodynamic Performance and Fuel Efficiency
To evaluate and compare the combination of two or more measures, a combination efficiency factor is used. It is calculated by
If the combination efficiency factor is equal 1, this combination of measures gives no advantage or disadvantage in opposition to the sum of the single measures. If it is above 1, this combination gives an additional advantage to the sum of the single measures. This means an additional positive effect takes place, which needs to be examined in detail. If the efficiency factor is below 1, this combination gives a disadvantage to the sum of the single measures. This means a negative effect takes place, and the measures are influencing each other. The efficiency factor is only an indicator. Positive and negative effects need to be investigated in detail to come to a precise conclusion.
4.1. Leading Edge Fairing and Rear Flaps [T3 + T6]
The combination of a leading-edge fairing device and rear flaps has been investigated by carrying out CFD simulations [14], and in relation to the shown airflow paths in Figure 9, the devices shown in Figure 11 greatly influence flow paths 1 and 2. The airflow at the lower side and ground level is not influenced very much by this combination. The gap between the tractor cab and the trailer front is reduced for the top air flow. The drag induced by not optimizing deflector adjustment and sharp edges of the trailer leading edge is lowered, and the robustness of a smooth airflow between the top of the cab and the trailer is supported. At the back of the trailer, the complete wake area is reduced by guiding the airflow around the edges at the top and the sides. As the airflow at the top of the trailer stays closer to the roof induced by the leading-edge fairing, the effect of the upper rear flap is amplified [14] as well. This also reduces the drag additional to the single measures.
The results from the CFD simulation show a drag coefficient difference of and for the combination of this two devices [14]. This combination has an efficiency factor of 1.2 at zero-degree yaw angle and 1.0 at five-degree yaw angle. Both measures complement each other very well. The positive effect at zero-degree yaw angle results from the closer airflow at the trailer roof.
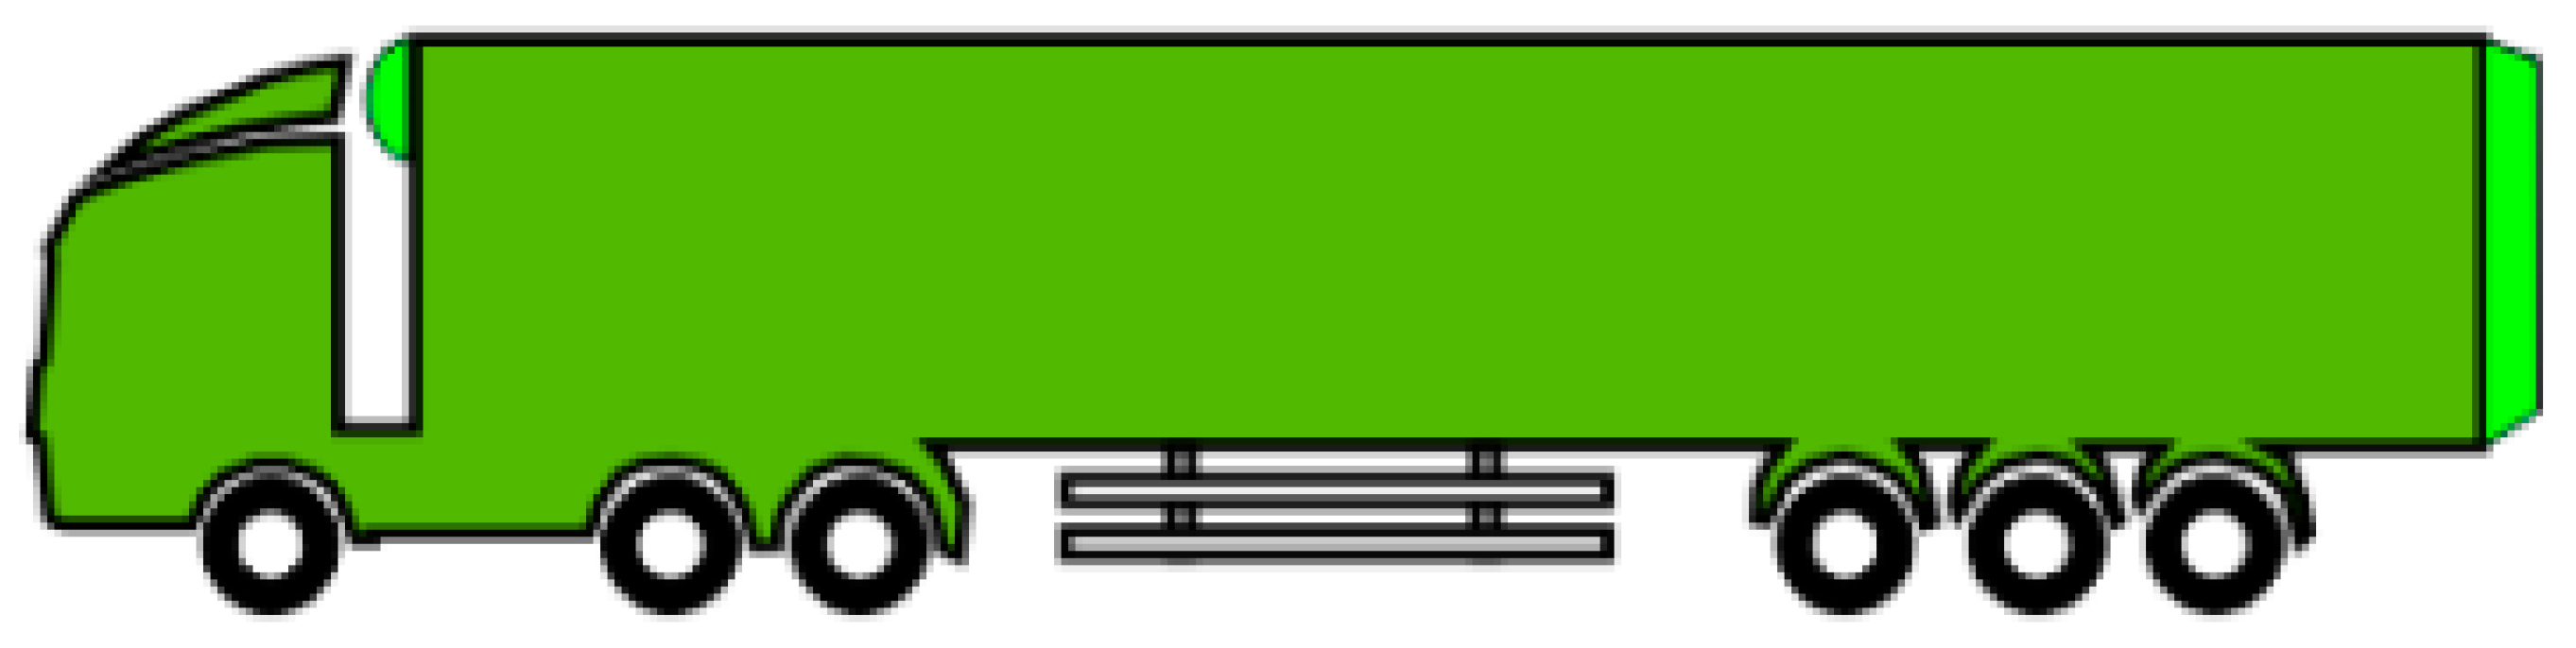
4.2. Side Wings and Rear Flaps (T4 + T6)
The combination of side wings and rear flaps has been investigated by CFD simulations and in track tests [8,14,15]. With respect to the shown airflow paths in Figure 9, the devices shown in Figure 12 influence flow paths 1, 2, and 3 (top, upper side, and lower side) of the truck. The airflow at the ground level is not influenced very much. At the back of the trailer, the top and upper side flow paths are influenced, and the complete wake area is reduced by guiding the airflow around the edges at the top and the upper sides by the rear flaps. This also reduces the drag. The lower side flow path is influenced by the side wings. Here, turbulence induced by gaps and sharp edges of underrun protection or pallet boxes is reduced. At crosswind condition, the flow from one side to the other is hindered, and therefore so are additional vortices induced by the underrun protection, etc. This further reduces the drag.
The results from the CFD simulation with fully closed side wings (wheels are covered) show a drag coefficient difference and (interpolated) for the combination of these two devices [15]. This combination has an efficiency factor of 1.4 at zero-degree yaw angle and 1.07 at five-degree yaw angle. In this case, the combination seems to be very good, as the efficiency factor is above 1 for both angles.
The results from the CFD simulation with uncovered wheels shows a drag coefficient difference of and for the combination of these two devices [14]. In this case, the combination has an efficiency factor of 0.6 at zero degree yaw angle and 0.99 at five degree yaw angle. This means the combination is only good at crosswind, as the efficiency factor is close to 1. At a zero yaw angle, the efficiency is low because the reduction of the rear flaps on their own is as high as the combination with the side wings. It seems that the positive effect at the lower wake area at the back of the trailer induced by the side wings is completely compensated by the downwash effect of the rear flaps. It is stated that a lower performance of this combination at zero yaw angle might be caused by an oversimplified model of the truck regarding to the airflow underneath the truck and through the engine compartment [15]. This results in a too optimistic drag coefficient reduction at zero yaw angles for the side wings. Therefore, the efficiency factors for zero yaw angles at combinations with side wings need to be handled with care, as the evaluation of this effect is challenging.
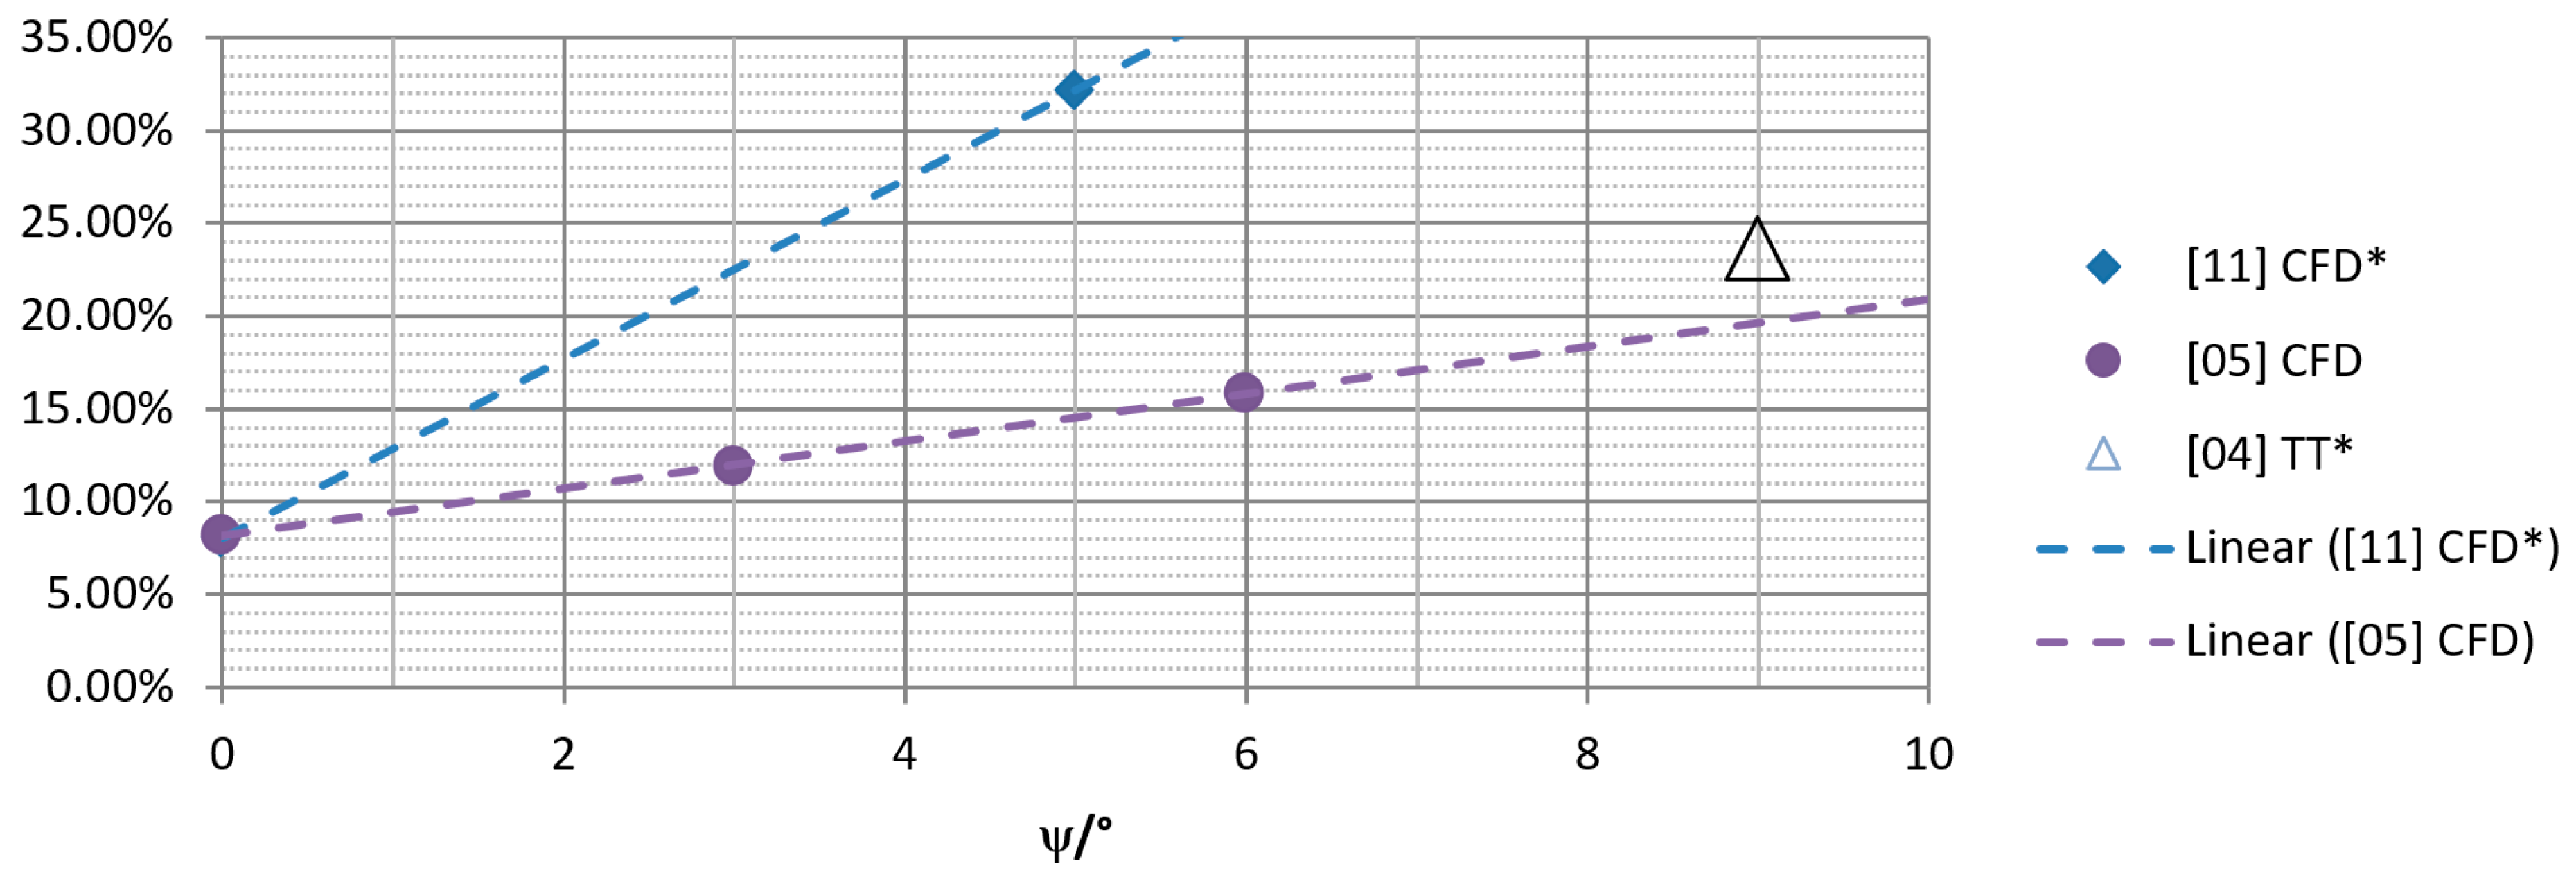
When the following configuration was used in test track with a CONV truck, a fuel consumption reduction of about 8% was measured. However, details on the impact from crosswinds were not found [16]. Nearly the same results were measured in a track test with a CoE truck at a crosswind of approximately 4 m/s (14.4 km/h) from ESE direction at the RDW test facility in Lelystad [16]. Comparing the graph in Figure 13 and the knowledge that the test facility is orientated in a southwest to northeast direction, this means that the yaw angle is close to 9° at a wind angle .
Assuming an aerodynamic efficiency of 0.34, an 8% fuel consumption reduction is equal to a relative drag coefficient reduction of . With a reference drag coefficient of , the drag coefficient difference is .
4.3. Leading Edge Fairing, Side Wings, and Rear Flaps (T3 + T4 + T6)
The combination of a leading-edge fairing device, side wings, and rear flaps is investigated by CFD simulations [14]. Referring to Figure 9, the devices shown in Figure 14 are influencing especially the flow paths 1, 2, and 3 (top, upper side, and lower side) of the truck. The way the devices influence the airflow has been explained in Section 4.1 and Section 4.2.
The results from the CFD simulation shows a drag coefficient difference of and for the combination of these two devices [14]. This combination has an efficiency factor of 0.64 at zero degree yaw angle and 0.99 at five degree yaw. Both measures complement each other well at a yaw angle of five degree. At a yaw angle of zero, the efficiency factor is low, and the combination of all three devices gives a lower drag coefficient reduction than the combination of only the leading edge fairing and rear flaps (). It seems that the positive effect at the lower wake area at the back of the trailer induced by the side wings is partially compensated by the downwash effect of the rear flaps. A lower performance of combinations with side wings at zero yaw angle is caused by an oversimplified model of the truck regarding the airflow underneath [8]. This results in a too optimistic drag coefficient reduction at zero yaw angles for the side wings. Therefore, the efficiency factors for zero yaw angles at combinations with side wings need to be handled with care, as the evaluation of this effect is challenging.
4.4. Roof Tapering (T7)
Currently, there are no results from trailer measure combinations with roof tapering available, but a simplified “tear drop” design has been investigated. These results can be taken into account to get a general behavior of combinations with roof tapering [14]. The simplified “tear drop” design has a quite similar roof height reduction at the end of the trailer, but the height also has a slope at the front of the trailer, which will behave like a kind of leading edge fairing. Some upcoming effects will be similar, and others will be different. Therefore, these results need to be handled with care.
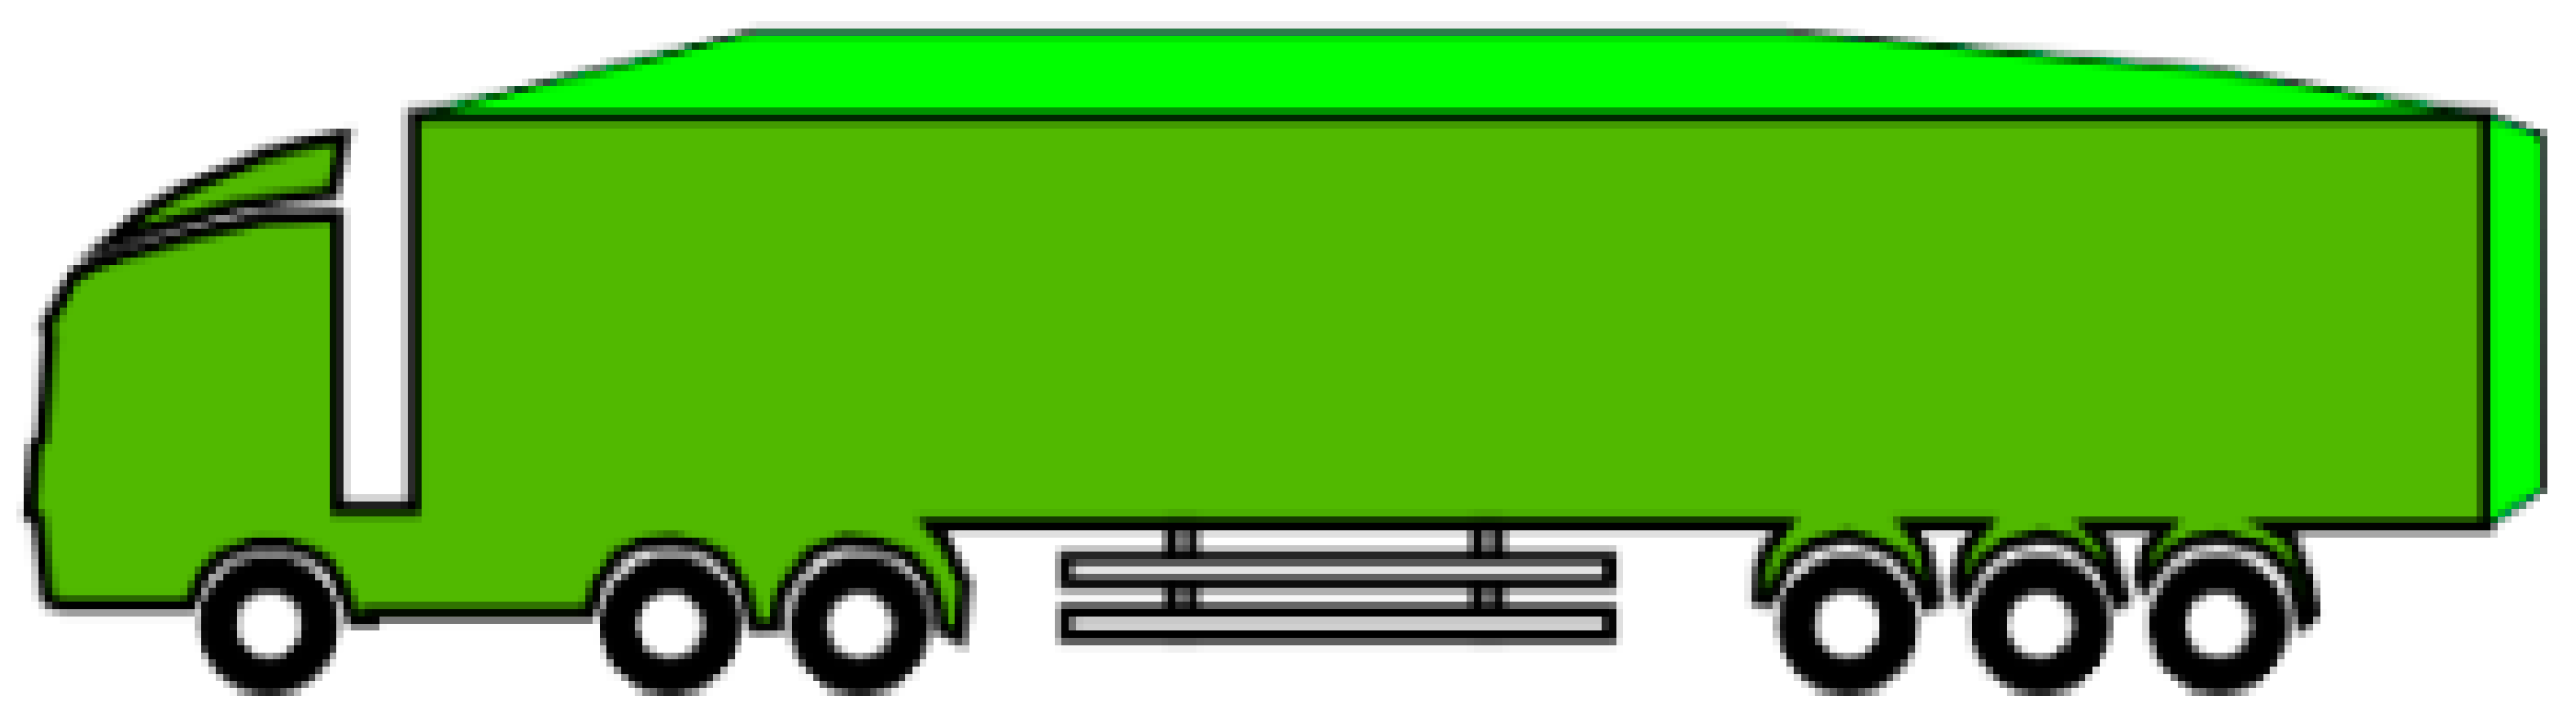
4.5. “Roof Tapering/Tear Drop” and Rear Flaps (T6 + T7)
The combination of a “roof tapering/tear drop” and rear flaps is investigated by CFD simulations [14]. Regarding to the shown airflow paths in Figure 9, the devices shown in Figure 15 influence flow paths 1 and 2 (top and upper side) of the truck. The way the devices influence the airflow has been explained in Section 4.2 and Section 4.4.
The results from the CFD simulation shows a drag coefficient difference of and for the combination of these two devices [14]. Compared to only rear flaps, these combination results are worse, which is also shown by the efficiency factor. This combination has an efficiency factor of 0.44 at zero degree yaw angle and 0.75 at five degree yaw angle. The reason for this is the amplified effect of guiding the airflow to the ground by the rear flaps. In the investigated case, the downwash is too strong. This results in a recirculation into the undercarriage and a rising drag [14]. A similar effect might occur in case of a combination of roof tapering and rear flaps like it is expected to be done within the Transformers project.
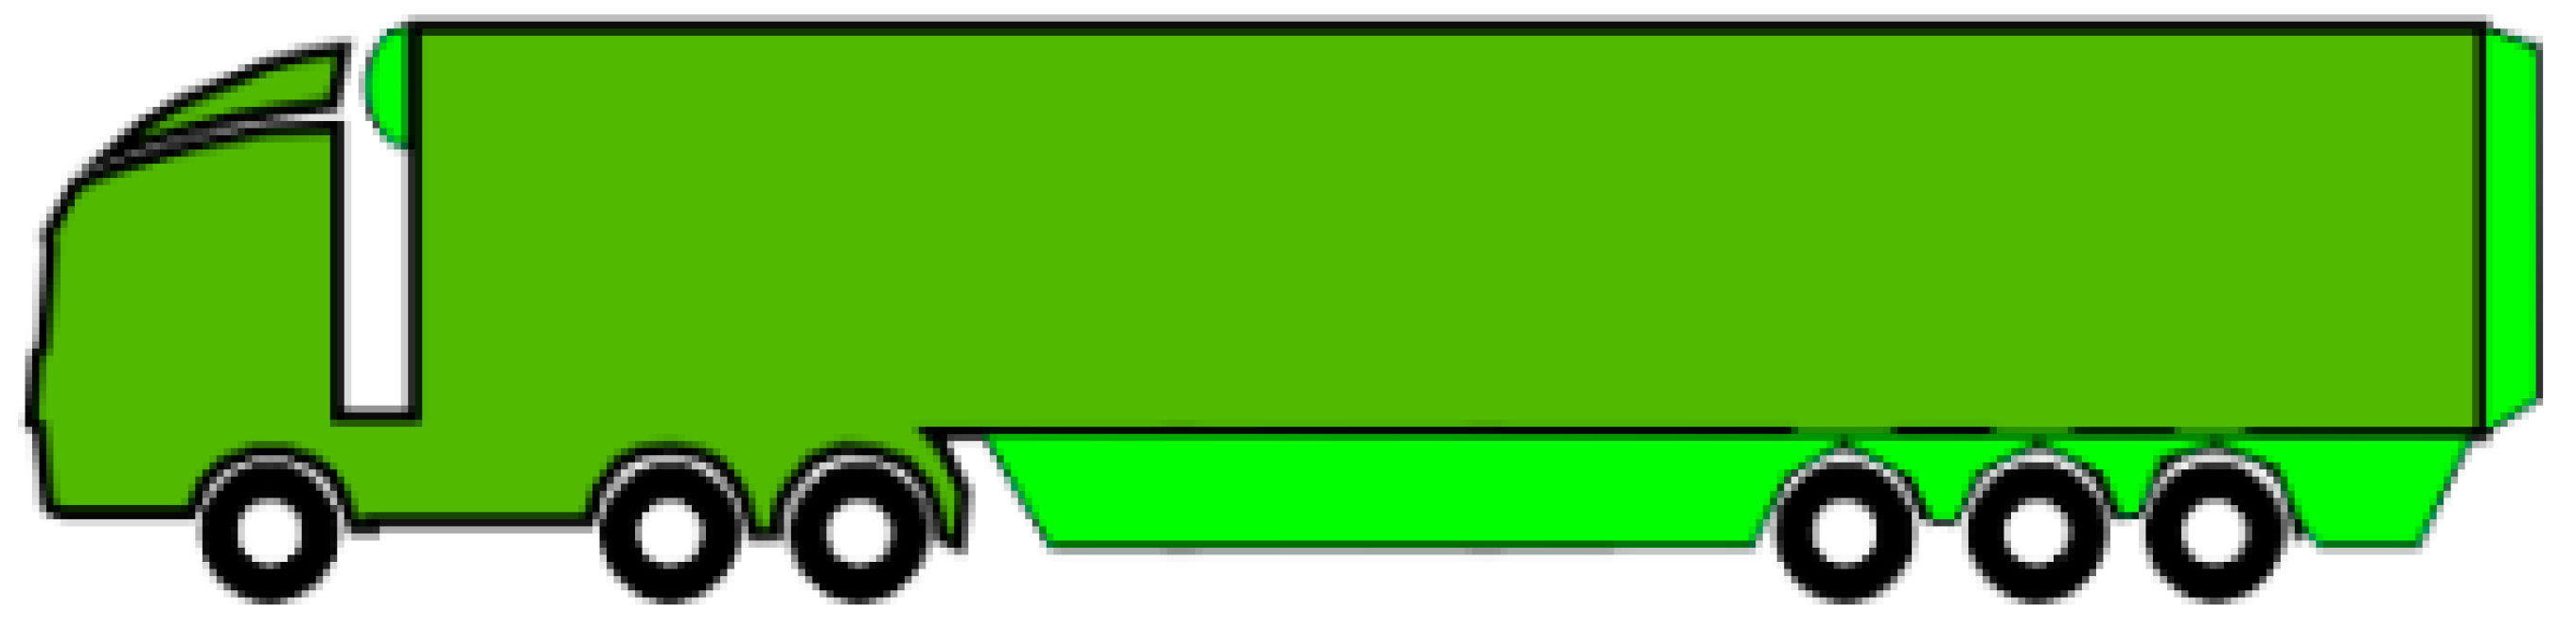
4.6. “Roof Tapering/Tear Drop” and Side Wings [T4 + T7]
The combination of a “roof tapering/tear drop” and side wings is investigated by CFD simulations in reference [14]. Regarding the airflow paths in Figure 9, the devices shown in Figure 16 influence flow paths 1 and 3 (top and lower side) of the truck. The way the devices influence the airflow has been explained in Section 4.2 and Section 4.4.
The results from the CFD simulation show a drag coefficient difference of and for the combination of these two devices. This combination has an efficiency factor of at zero degree yaw angle and at five degree yaw angle. Both measures complement each other well. Although the efficiency factor is below 1 at a yaw angle of zero degrees, the combination of both devices gives a higher drag coefficient reduction than the single devices. It seems that the positive effect at the wake area at the back of the trailer is partially compensated by the downwash effect of the “roof tapering/tear drop” design. It is stated that a lower performance of combinations with side wings at zero yaw angle is caused by an oversimplified model of the truck regarding the airflow underneath the truck [15]. This results in a too optimistic drag coefficient reduction at zero yaw angles for the side wings. Therefore, the efficiency factors for zero yaw angles at combinations with side wings need to be handled with care, as the evaluation of this effect is challenging.
4.7. Leading Edge Fairing, “Roof Tapering/Tear Drop,” Side Wings, and Rear Flaps (T3 + T4 + T6 + T7)
The combination of a leading-edge fairing, “roof tapering/tear drop,” side wings, and rear flaps is investigated by CFD simulations [14]. Referring to the shown airflow paths in Figure 9, the devices shown in Figure 17 influence flow paths 1 to 3 (top, upper side, and lower side) of the truck. The underneath airflow is not influenced very much. Influence on airflow has been explained in Section 4.1, Section 4.2 and Section 4.4.
The results from the CFD simulation shows a drag coefficient difference of and for the combination of these two devices [14]. This combination has an efficiency factor of 0.64 at zero degree yaw angle and 0.99 at five degree yaw. All measures complement each other well during crosswind condition. Although the efficiency factor is below 1 at a yaw angle of zero degrees, the combination of both devices gives a higher drag coefficient reduction than the single devices. It seems that the positive effect at the wake area at the back of the trailer is partially compensated by the downwash effect of the “roof tapering/tear drop” design. It is seen that a lower performance of combinations with side wings at zero yaw angle is caused by an oversimplified model of the truck regarding the airflow underneath the truck [17]. This results in a too optimistic drag coefficient reduction at zero yaw angles for the side wings. Therefore, the efficiency factors for zero yaw angles at combinations with side wings need to be handled with care, as the evaluation of this effect is challenging.
4.8. Combination of Cab Roof Deflector and Transformers Roof Tapering
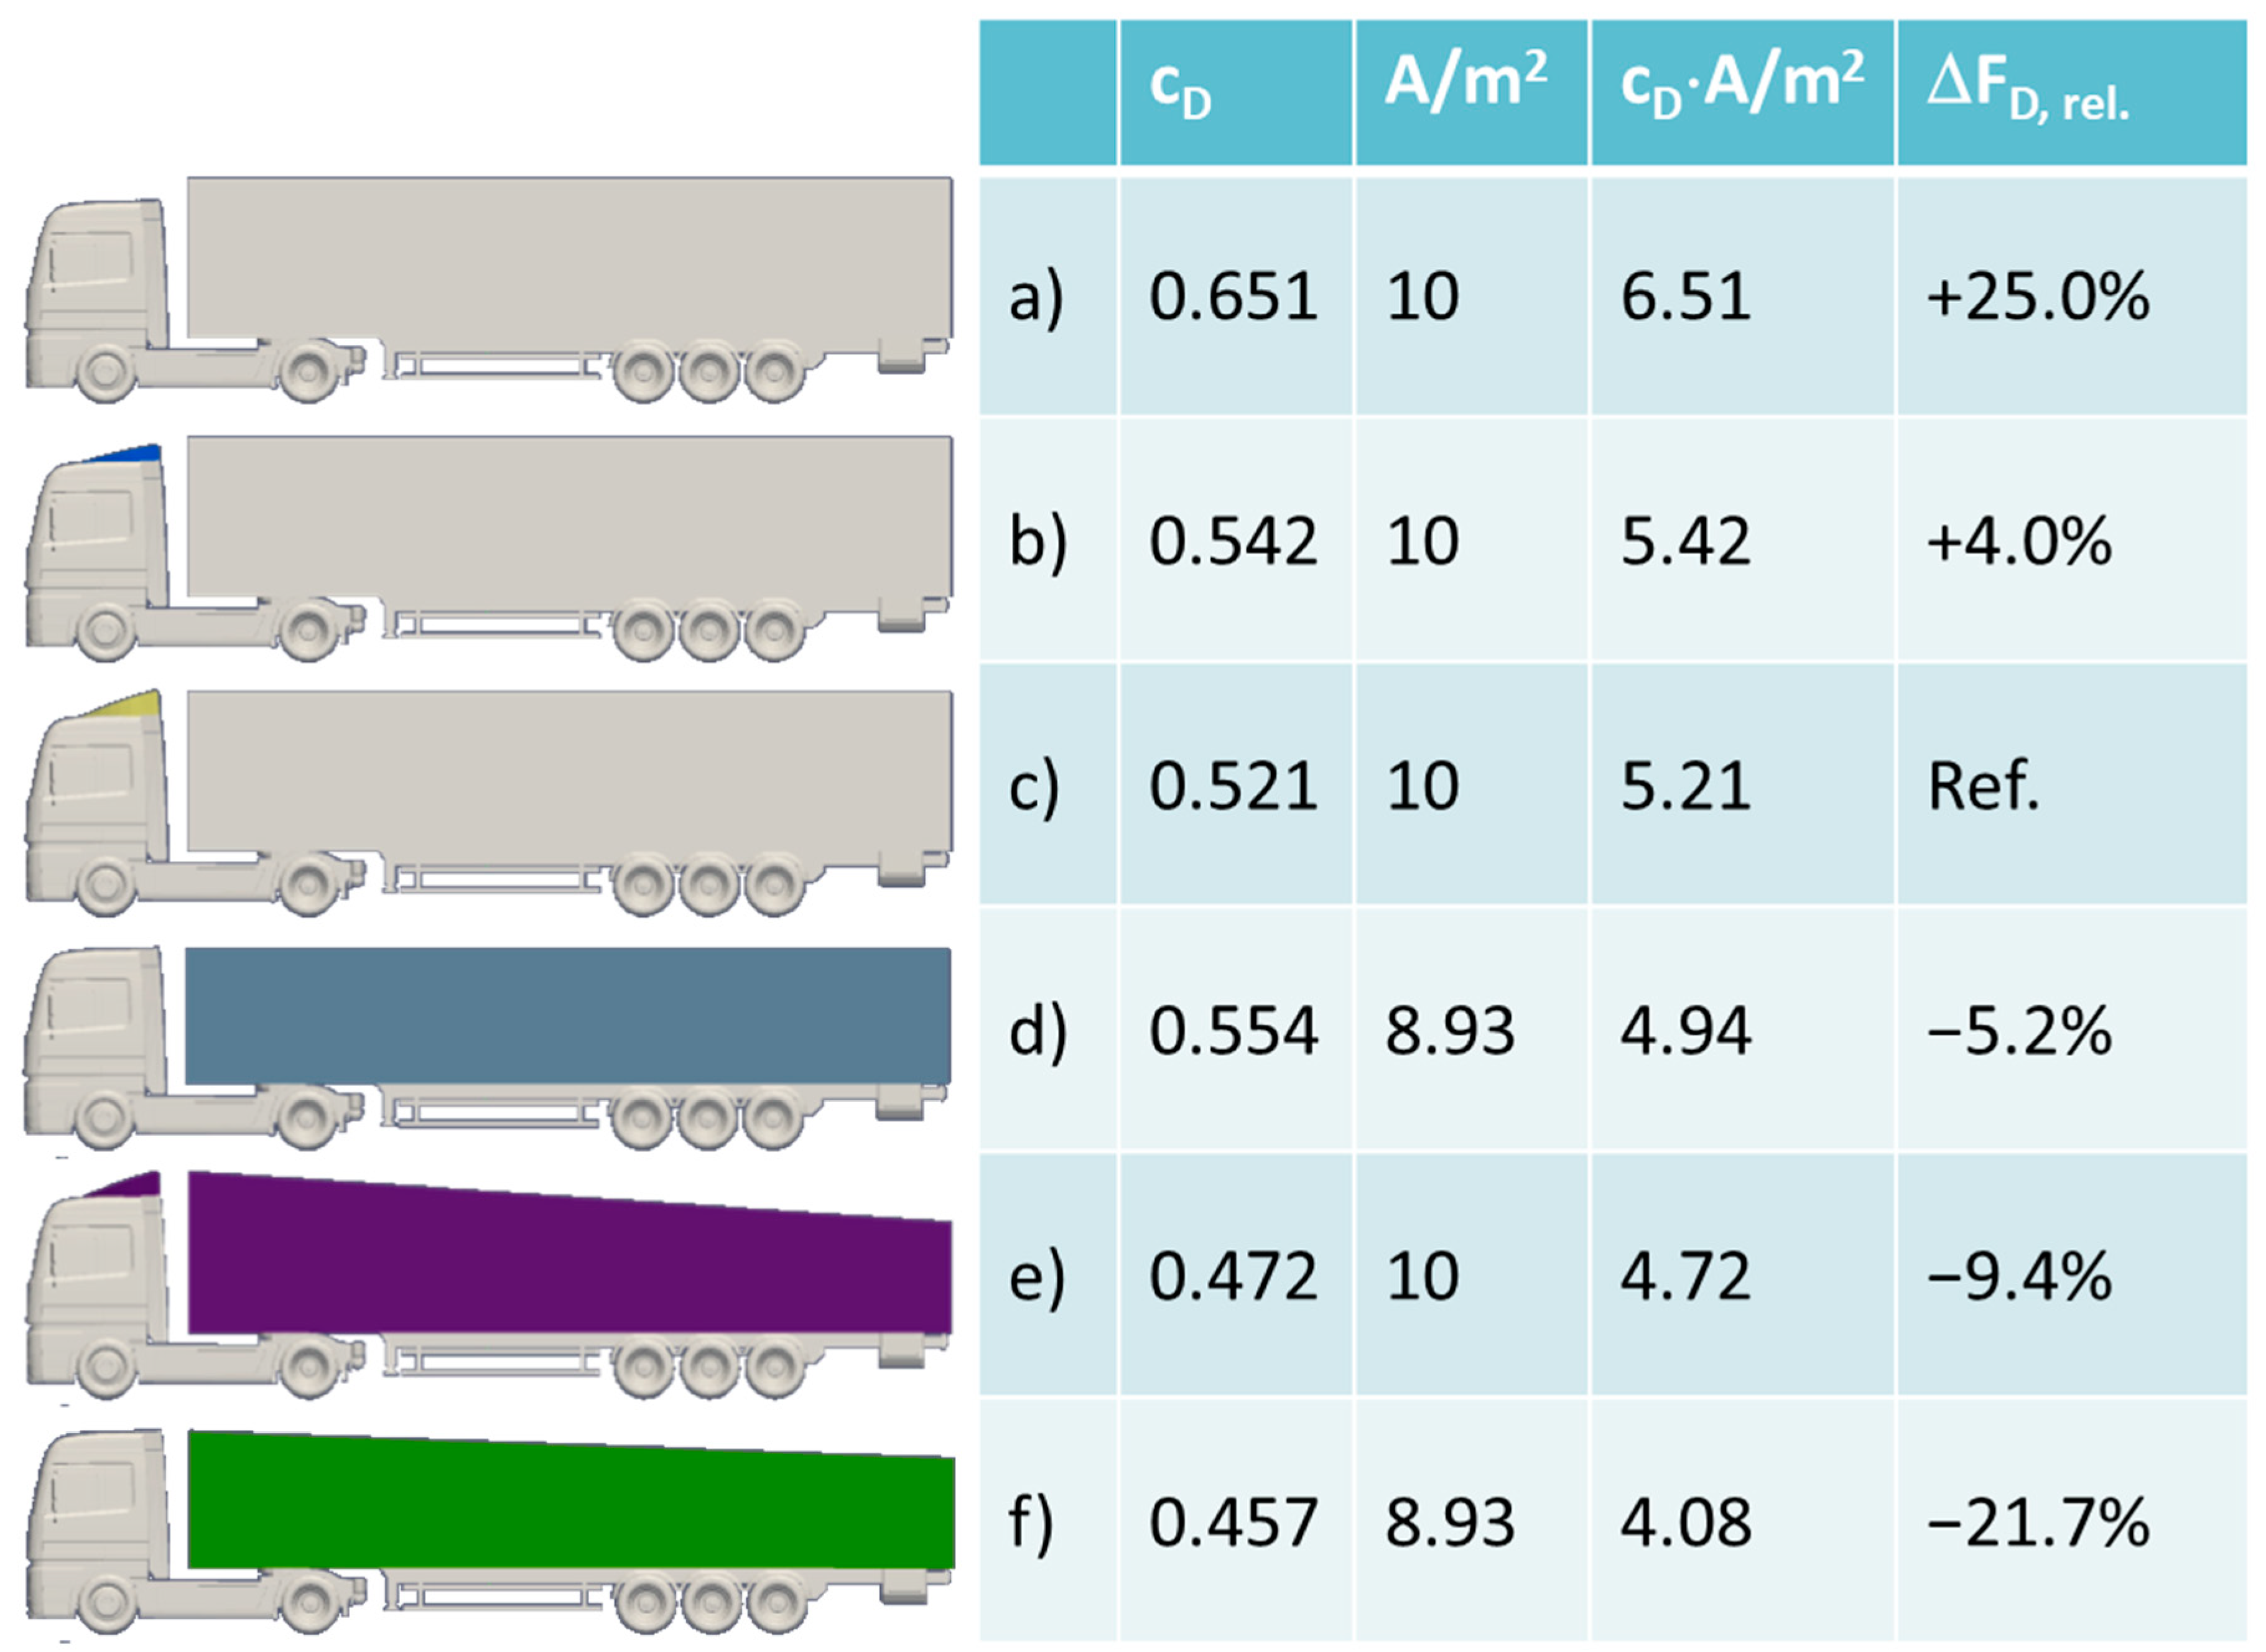
Due to the lack of results for different tractor combinations with a tapered/lowered trailer. The virtual vehicle competence center (VIF) performs several CFD simulations within the Transformers project in Work Package 2. Referring to Figure 18, the performed simulations are:
- a)
- Daimler Actros MP3 2008 tractor without cab roof deflector and a standard trailer with a maximum height of 4 m.
- b)
- Daimler Actros MP3 2008 tractor with low cab roof deflector and a standard trailer with a maximum height of 4 m.
- c)
- Daimler Actros MP3 2008 tractor with high cab roof deflector and a standard trailer with a maximum height of 4 m.
- d)
- Daimler Actros MP3 2008 tractor without cab roof deflector and a lowered standard trailer with a maximum height of 3.57 m.
- e)
- Daimler Actros MP3 2008 tractor with high cab roof deflector and a tapered standard trailer with a height of 4 m at the front and 3.1 m at the back.
- f)
- Daimler Actros MP3 2008 tractor without cab roof deflector and a tapered standard trailer with a height of 3.57 m at the front and 3.1 m at the back.
As the main benefit is expected to be given at a yaw angle of zero, all simulations are performed with a straight frontal airflow of 80 km/h.
Comparing the results to other measures of the trailer the difference in drag coefficient is not feasible because of changing the frontal area. It can be seen in Figure 13 that the drag coefficient of d) is worse than b) and c), although the truck height is lower and there is no need for a cab roof deflector. In principle, the shape and the aerodynamic quality of the truck represented by without a cab roof deflector are worse than with a cab roof deflector. Normally, it is expected that a lowered truck will be more aerodynamically efficient than a truck at full height. Looking at the product of the drag coefficient and projected frontal area, the product for d) is better than for b) and c). This is a result of the drag calculation. Therefore, it is not only feasible to compare the drag coefficient difference, but it is also feasible to compare the drag difference that can be compared by the differences of the product of drag coefficient and projected frontal area.
The reference truck results are the results of simulation c). Here, a typical truck with 4 m height and an adjusted cab roof deflector is investigated (). If the trailer height can be reduced to the cab height and the deflector can be submerged or removed (d), (), the drag can be reduced by 5.2%. If the trailer height needs to be at a 4 m height at the front and can be tapered to a height of 3.57 m at the back, and the tractor has an adjusted cab roof deflector (e), (), the drag can be reduced by 9.4%. If the trailer height can be reduced to the cab height at the front (3.57 m), the deflector can be submerged or removed and the trailer can be tapered to (3.1 m) at the back(f), (), the drag can be reduced by 21.7%. This shows how configurable and adoptable tractor-trailers can improve system efficiency, thus leading to better mission efficiency.
4.9. Possible Combinations
Table 4 summarizes the results of all promising aerodynamic trailer measures. At the front and underneath of the trailer, only one single feature can be attached, and the best features are chosen. These are the leading-edge fairing, which gives the best drag coefficient reduction, especially with the knowledge that the values for the splitter plate and the vortex trap are more feasible for CONV trucks and are less effective for CoE trucks.
Underneath the trailer, the best measure is the side wings against the bogie deflector. At the back of the trailer, both examined measures can be combined, and the roof tapering becomes a mandatory measure to realize substantial gains in drag reduction. Therefore, rear flaps are also chosen to further improve the aerodynamics at the back of the trailer. The result in Table 5 shows the drag coefficient differences of investigated aerodynamic trailer measure combinations and their efficiency factor gathered by CFD.
The combination efficiency factor for the chosen combination (leading edge fairing, side wings and rear flaps) at a yaw angle of 5° is 0.99 for the drag coefficient reduction difference, which is a good value.
All reductions from the single measures are well represented by the combination. The combination efficiency factor is only a theoretical number, and it cannot be concluded that the measures do not influence each other in a positive or negative way. Nevertheless, this combination also gives the highest drag coefficient reduction () of all examined combinations.
Therefore, the results for the combination of side wings and rear flaps need to be discussed first. As discussed above, there are two references investigating this combination by CFD simulation. The results for a zero degree yaw angle are close (−0.037 vs. −0.045), although the efficiency factors are quite different (0.60 vs. 1.40). One reason for the difference in the efficiency factor might be an under- or overestimation of one of the single measure results. If a single measure result is underestimated by an effect that is not obvious, and this effect is not as relevant for the combination as it is for the single measure, the efficiency factor seems to be better than it is in reality. In CFD simulation, small differences in the model can provoke effects that can cause large differences in the results. For better accuracy of the results, a comparison to detailed wind tunnel tests or track tests is needed. Results from wind tunnel tests are also challenging because of the level of detail of the model. Here, it is also possible to get over/underestimated results because of a rough detail level. The best accuracy can be achieved with full scale tests of the designated object. The challenge of track tests is the crosswind. The velocity of the wind and the wind direction is necessary to determine the yaw angle and rank the results in the right way. Depending on the region of the test track, in many test cases, crosswind occurs, which makes it difficult to acquire results for a zero yaw angle. With the lack of more references of combinations in different detail levels of models for CFD simulations or wind tunnel tests, it is nearly impossible to say which simulation model (regarding to the aerodynamic measure) will be closer to reality.
4.10. A summary on Fuel Consumption Reduction Values of Trailer Aerodynamic Measures
As every test track procedure is influenced by indifferent factors during the test a direct comparison of the fuel consumption reduction between different procedures is not recommended. The values within Table 6 can be used to consider the principle potential of the aerodynamic measure.
5. Opportunities for Configurable Measures
There are three main opportunities for configurable measures with regard to Configurable and Adaptable Tractor-Semitrailer Configuration. The first one is the cab roof deflector at the truck. This device gives the best advantage if it is adjusted to the frontal trailer height. Cases a) and b) will induce or more drag if the cab roof deflector is not present (cab height 3.57 m) or adjusted in the right way. Lowering the trailer height will be less effective if the cab roof deflector is not adjusted to this height. Within the Transformers project, Volvo plans to use an adaptable modified cab roof deflector developed within the Convenient project to adjust the height to the trailer. It is planned to use information from a sensor that will detect the cargo height inside of the trailer and send a suitable signal to roof height actuators and to the cab roof deflector. The cab roof deflector is then leveled by actuators to the trailer height. DAF plans to use a manually adjustable cab roof deflector. With these two approaches, all typical usage scenarios are covered during the road test phase.
The second opportunity for configurable measures is the trailer roof height and deflection of the tapering. The Schmitz Cargobull trailer is planned to have two supporting points, at the front and back, whereas the Van Eck trailer is planned to have four supporting points. The Van Eck trailer therefore gives more possibilities for shaping the trailer at the back. The best shape regarding aerodynamics with respect to the cargo height needs to be considered.
The combination of tear drop design (with a tapering/deflection at the back of the trailer) and rear flaps might provoke a recirculation into the undercarriage and therefore a reduced efficiency [14]. The described effect might also occur within the Configurable and Adaptable Tractor-Semitrailer Configuration if the airflow at the top of the trailer follows the tapering/deflection to the minimum height of 3.1 m and the rear flaps (typically optimized to a trailer height of 4 m) bend the airflow too much around the back of the trailer. Here, it might be feasible to adapt the angle of the rear flaps to the tapering of the back of the trailer, which is the third opportunity. However, this needs to be verified.
6. Conclusions and Recommendations
An approach to improve mission efficiency is by reducing the aerodynamic drag in a tractor-trailer configuration by dealing with overall system efficiency and not by looking at the tractor and trailer in isolation. Therefore, a basic background of aerodynamics for trucks had been prepared. One main finding is that the results of aerodynamic measures for reducing the fuel consumption of Conventional trucks (CONV) typically used in America cannot be compared to the results of Cab over Engine trucks (CoE) typically used in Europe. The designs are too different, so the amount of improvement induced by single measures of CONV diverges from CoE trucks. It has to be considered whether a measure will improve the aerodynamics in a relevant way. Results cannot be transferred from CONV to CoE trucks. Also, the operating environment influences the drag of a truck during its duty cycle and therefore its fuel consumption in several ways. Wind has a major influence as it changes the direction of airflow. Depending on the driving speed and the direction and velocity of the wind, there is influence on the drag co-efficient not only at the front and back of the truck but also the side of the trailer, which influence the measure of side wings and roof tapering. As the crosswinds differ from country to country and also from region to region, different wind averaged drag reductions can be calculated. To avoid an error-prone recalculation of wind averaged results, only values at specific yaw angles are used. Other operating environments are factors such as weather conditions (air pressure, temperature, precipitation) and the route conditions (height above sea level, vertical and horizontal slope, road condition).
To determine the benefit of aerodynamics, there are three main methods—computational fluid dynamics (CFD) simulations, wind tunnel tests (WTT), and track tests (TT). Summarized CFD simulations are useful for assessing aerodynamic effects and qualitative results. For quantitative results, the investigated model needs to be evaluated by WTT or TT. It is nearly the same with WTT. WTT are good to assess aerodynamic effects and qualitative results with approximated models. For quantitative results, the model needs to be evaluated by TT, or a full sized (operational) truck is needed for the WTT. In comparison to CFD simulations and WTT, at TT, the fuel consumption can be measured directly, but the environmental conditions cannot be controlled. Here, the conditions (wind velocity and direction, temperature, air pressure etc.) need to be measured to classify the results in the right way. To compare different measures, the conditions at the TT need to be similar. Otherwise, they have to be considered by calculations in the right way.
An aerodynamic expert might also rank all these results from the different methods in the right way due to his experience, but without this experience, it is challenging to assess the results. In principle, it is not as easy as it seems to compare different results (drag reduction, drag coefficient reduction, or fuel consumption reduction) from different determination methods, especially without knowing all the details. For fuel consumption reduction, one needs to carefully consider different environmental circumstances during the test that influence the results to a great extent. A recalculation of a fuel consumption reduction to a drag reduction or drag coefficient reduction is coupled with several simplified assumptions. A feasible method seems to be to use an efficiency factor of . This means a drag reduction multiplied with this efficiency factor will result in a fuel consumption reduction. This is only valid for flat highways and flat test tracks with trucks at high speed ().
During the inquiry, it was realized that almost all the shown or mentioned aerodynamic measures for tractors have already been implemented by most of the OEMs. The improvement in tractor design is nearly at the maximum, and an overall design of the tractor can deliver little improvement when done under the conditions set by the current legislation. Here, the parallel optimization of several parameters is needed, as the aerodynamic effects are very sensitive. Changing a single measure will not lead to a drag reduction for sure without considering the overall aerodynamics of the tractor.
Focusing on the trailer aerodynamics gives several improvement possibilities. The trailer design improvement is also challenging because of different design parameters like load volume, cargo/trailer weight, handling at loading/unloading, robustness, and aerodynamics. As we mentioned earlier, there are three areas in the trailer (front, underneath, and back) where aerodynamic measures can be integrated, and the most promising measures are selected. These are the leading-edge fairing (front), which supports the airflow in the transition between the tractor and the trailer; it also improves the robustness of slightly misaligned cab roof deflectors at different truck velocities. Here, a drag reduction of 1.3% is assumed at a yaw angle of and 3.6% at a yaw angle of . The next feature is the side wings (underneath), which supports a smooth airflow along the trailer side especially at crosswind condition. Here, an average drag reduction of 5.0% is assumed at a yaw angle of and 9% at a yaw angle of . The last one is the rear flaps (back), which supports the airflow merging behind the back of the trailer and therefore reducing the wake area and the drag. Here, a drag reduction of 5.7% is assumed at a yaw angle of and 8.1% at a yaw angle of . The special Transformer trailer roof lowering and tapering in combination with an adjustable cab roof deflector will give an additional benefit. As the lowering and tapering depends on the cargo height inside the trailer, the different configurations (full height at front and back (4 m/4 m), full height at front and lowered to the minimum at the back (4 m/3.1 m), lowered all to the cab height without cab roof deflector (3.57 m/3.57 m), lowered to the cab height at the front and to minimum at the back (3.57 m/3.1 m) are averaged to a drag reduction of 9.1% at a yaw angle of . At a yaw angle of there are no results available for lowering and tapering the roof. It is expected that there will be a drag reduction, but the amount cannot be assumed without further information.
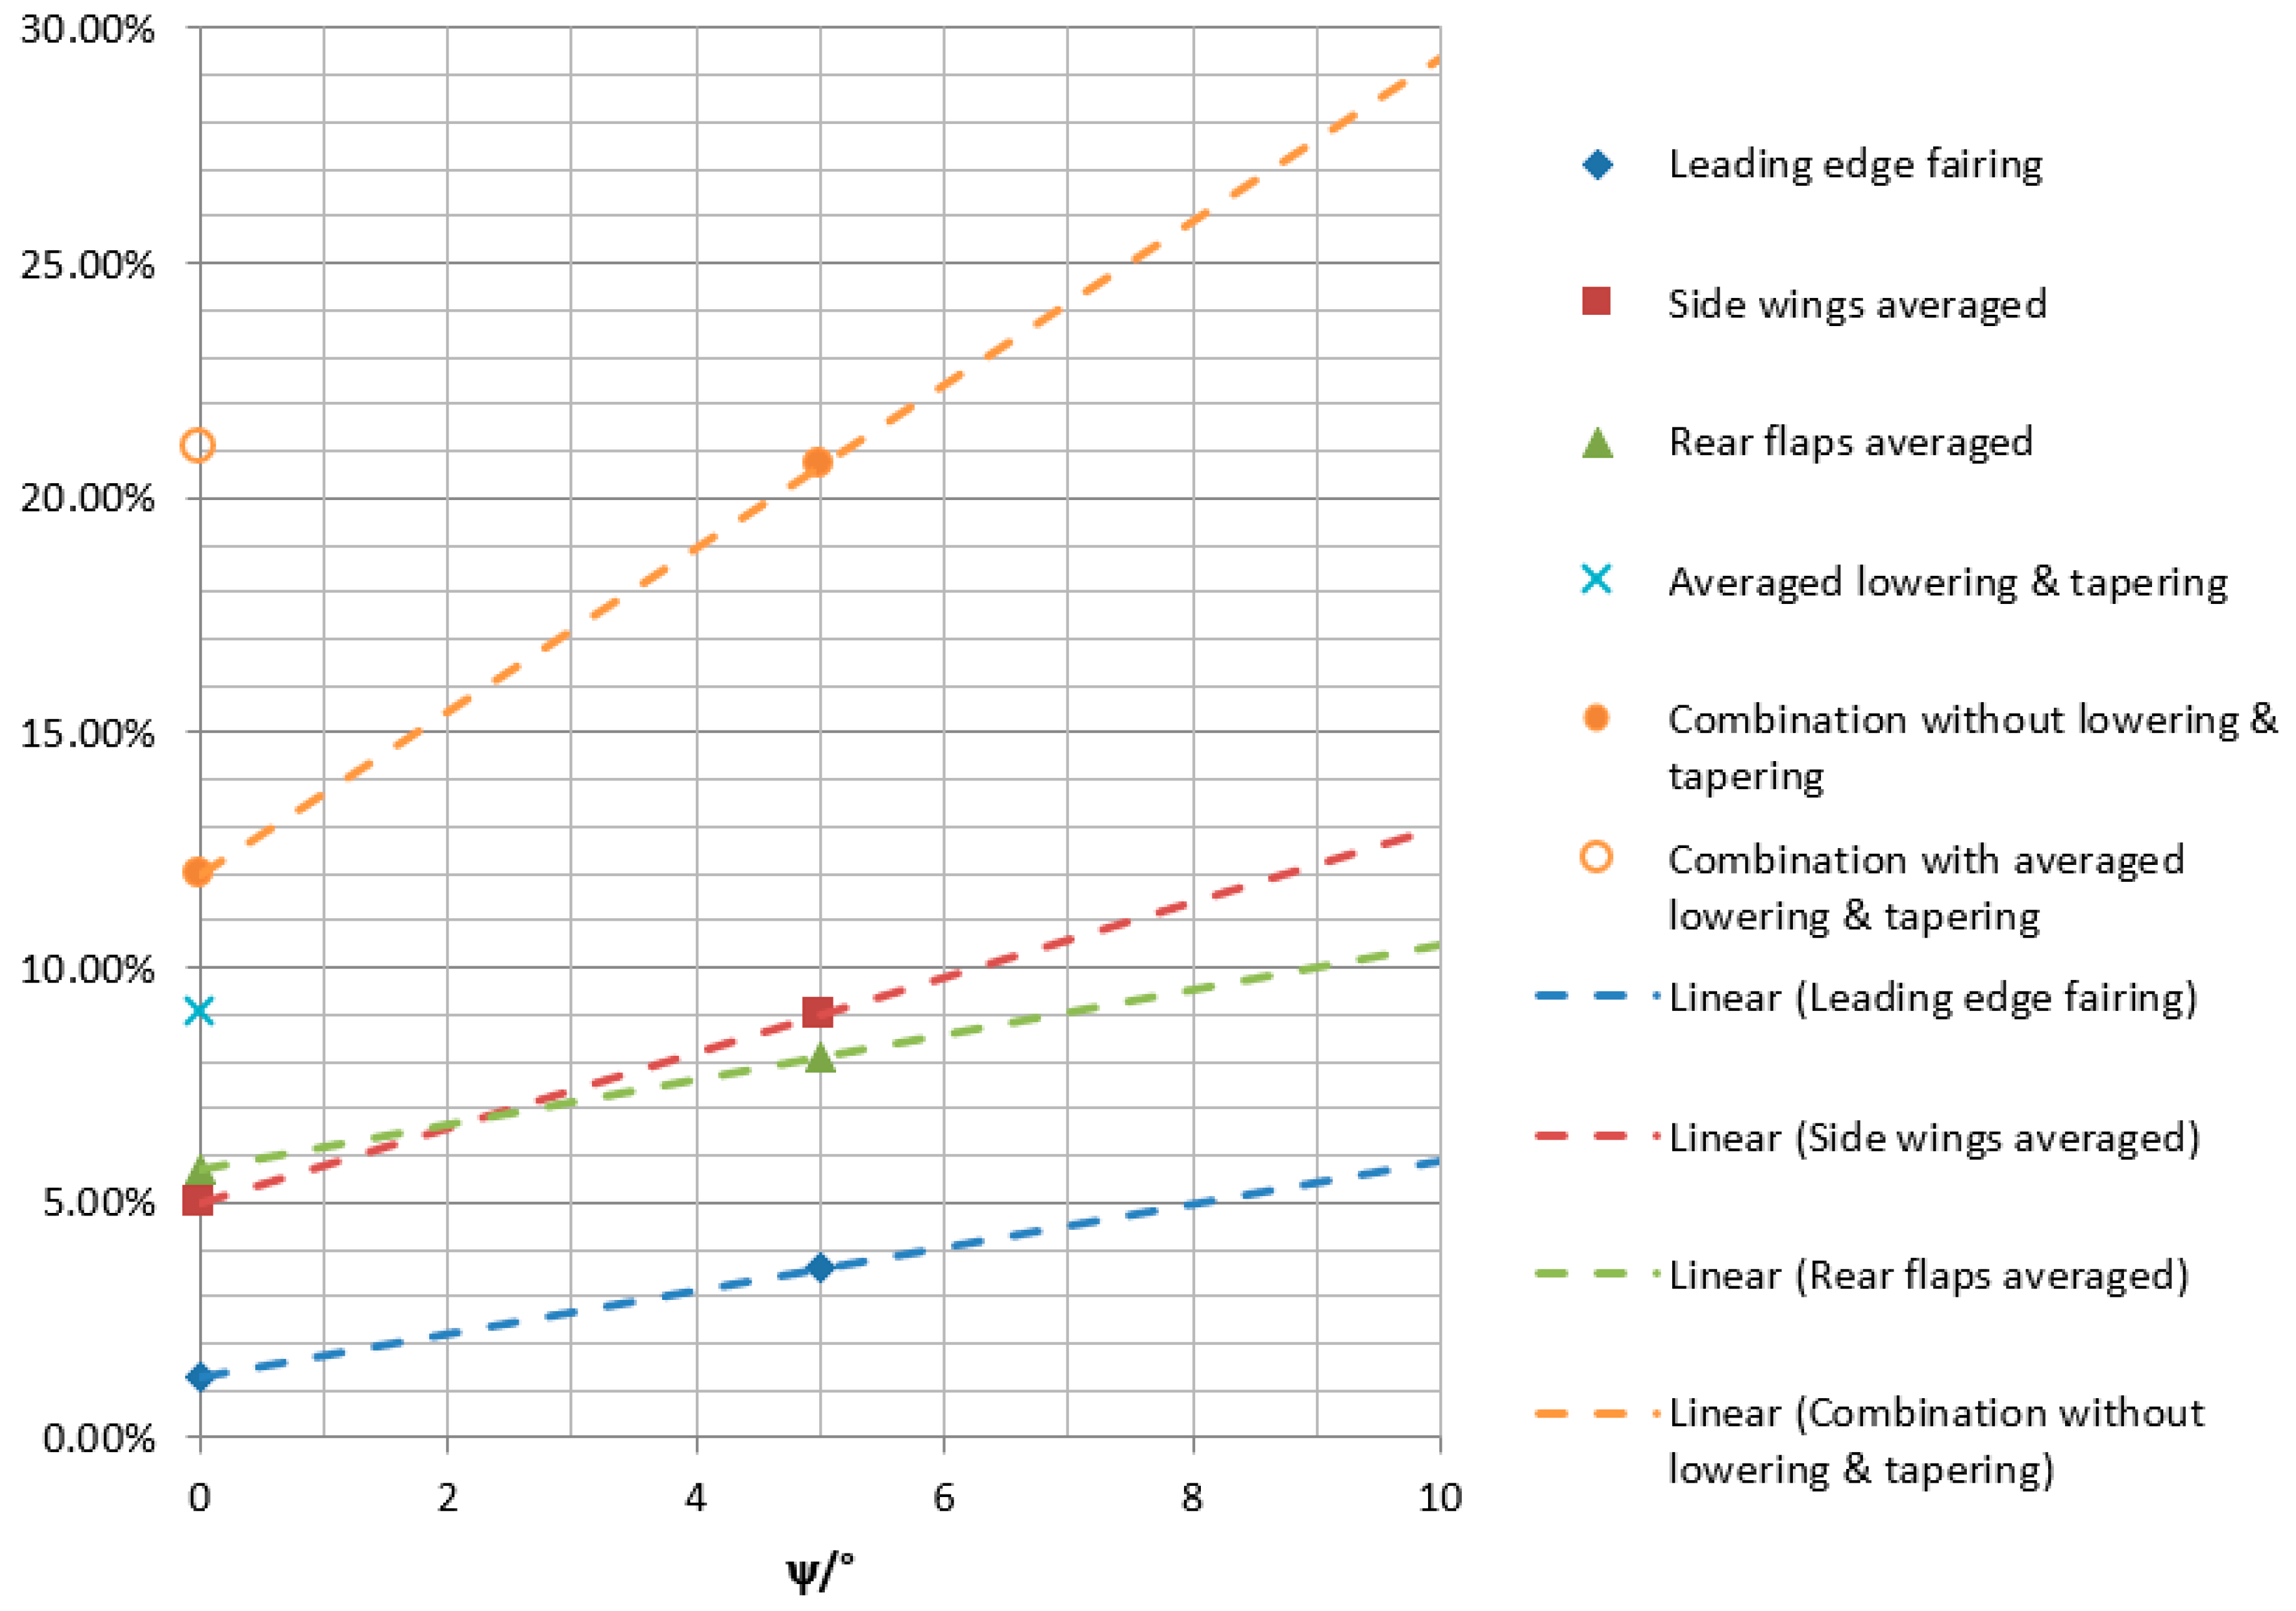
Within this report, the attempt was to introduce a combination efficiency factor ηcom that describes how good the different measures are working together. If the combination efficiency factor is 1, then the drag reduction of the combined measures is as high as the cumulative result of all single drag reductions, regardless of the measures influencing each other in a positive or negative way. If the factor is below 1, then the combined measures are influencing each other in a negative way, and if it is above 1 in a positive way for a factor equal to one, there is no change observed. Figure 19 shows the average results for the single measures and the Transformers roof lowering and tapering and their combinations.
In principle, there are three measures identified to be configurable. Beginning at the front of the truck, the cab roof deflector needs to be adjusted to the height of the trailer, as the trailer roof height and tapering is adapted to the cargo height inside of the trailer. Both these features have been implemented in Project Transformers. A sensor will detect the cargo height inside of the trailer and send a suitable signal to roof height actuators and the cab roof deflector. The third configurable measure is the rear flaps. Here, it might be feasible to adapt the angle of the rear flaps to the tapering of the back of the trailer because of a possible backflow of the airflow into the undercarriage, which might reduce the benefit of tapering in combination with the rear flaps. As the designs of the different measures within the different references are also different, there might be an additional optimization potential if the trailer aerodynamics is handled like the tractor aerodynamics at wind tunnel testing research centers. Here, an overall approach is used to optimize aerodynamics and to adapt the different measures to each other, and has been adapted in the research project during the prototyping phase.
Author Contributions
A.H., T.K. and B.M. conceived and designed the analysis; A.H. and T.K. carried out literature survey, spoke to expert panel and collected the data; A.H., J.K. and T.K. contributed data or analysis tools; T.K. performed the analysis; A.H. wrote the paper with inputs from all the authors.
Funding
This project has received funding from the European Union’s Seventh Framework Programme for research; technological development and demonstration under grant agreement no 605170.
Acknowledgments
The authors would like to thank the partners of Project TRANSFORMERS for their valuable inputs towards preparation of the project report.
Conflicts of Interest
The authors declare no conflict of interest.
References
- Elmer, M.; Kyncl, J.; Barbarino, S.; Hariram, A.; Wagner, S. Configurable and adaptable trucks and trailers for optimal transport efficiency. In Proceedings of the IEEE Conference and Expo Transportation Electrification Asia-Pacific (ITEC Asia-Pacific), Beijing, China, 31 August–3 September 2014. [Google Scholar] [CrossRef]
- Nylund, N.-O. Vehicle energy efficiencies. In Proceedings of the IEA EGRD Workshop Mobility: Technology priorities and strategic urban planning, Espoo, Finland, 22–23 May 2013. [Google Scholar]
- Singh, G. Overview of the DOE Advanced Combustion Engine R&D Program. In Proceedings of the Annual Merit Review Meeting and Peer Evaluation Meeting, Washington, DC, USA, 14–18 May 2012. [Google Scholar]
- Reisinger, R.; Emadi, A. Sensible Transportation Electrification: Get rid of inefficient powertrain designs. IEEE Electrif. Mag. 2013, 1, 6–12. [Google Scholar] [CrossRef]
- Hjelm, L.; Bergqvist, B. European Truck Aerodynamics–A Comparison Between Conventional and CoE Truck Aerodynamics and a Look into Future Trends and Possibilities; Springer: Berlin, Germany, 2009; pp. 469–477. [Google Scholar]
- SAE China; FISITA. Good practice guide 308, truck aerodynamic styling. In Proceedings of the FISITA 2012 World Automotive Congress; Springer: Berlin, Germany, 2001. [Google Scholar]
- Freight Best Practice. Aerodynamics for Efficient Road Freight Operations; Freight Best Practice: London, UK, 2007. [Google Scholar]
- Schütz, T. Hucho-Aerodynamik des Automobils: Strömungsmechanik, Wärmetechnik, Fahrdynamik, Komfort; Schütz, T., Ed.; Springer: Berlin, Germany, 2013. [Google Scholar]
- Iveco, S.p.A. Innovation for the Future, the Future is Here–Transport Concept; Iveco, S.p.A: Torino, Italy, 2008. [Google Scholar]
- Bracco, R.; Seccardini, R.; de Somma, M.; Gallardo, G.; Lindgarde, O.; Borjesson, S.; Kessels, J.; Cesari, C.; Fabio, S. CONVENIENT–Complete vehicle energy saving technologies for heavy trucks. Transp. Res. Procedia 2016, 14, 1041–1050. [Google Scholar] [CrossRef]
- Frank, H.D.-I.T. Aerodynamik von schweren Nutzfahrzeugen; VDA: Berlin, Germany, 2012. [Google Scholar]
- Foster, R.N. Timing technological transitions. Technol. Soc. 1985, 7, 2–3. [Google Scholar] [CrossRef]
- Springer Gabler, Herausgeber. Stichwort: S-Kurven-Konzept. Available online: https://wirtschaftslexikon.gabler.de/definition/s-kurven-konzept-43411/version-147038 (accessed on 30 June 2019).
- Lenngren, M.; Håkansson, C. CFD Analysis of Aerodynamic Trailer Devices for Drag Reduction of Heavy Duty Trucks. Master’s Thesis, Chalmers University, Göteborg, Sweden, 2010. [Google Scholar]
- Frasquet, C.P.; Indinger, T. Numerische Untersuchungen zur Aerodynamik von Nutzfahrzeugkombinationen bei realitätsnahen Fahrbedingungen unter Seitenwindeinfluss; VDA: Berlin, Germany, 2013. [Google Scholar]
- Smith, S.; Younessi, K.; Markstaller, M.; Schlesinger, D.; Bhatnagar, B.; Smith, D.; Banceu, B.; Schoon, R.; Sharma, V.; Kachmarsky, M.; et al. Laughlin and Charlot, Test, Evaluation, and Demonstration of Practical Devices/Systems to Reduce Aerodynamic Drag of Tractor/Semitrailer Combination Unit Trucks; Truck Manufacturers’ Association: Washington, DC, USA, 2007. [Google Scholar]
- Raemdonck, V.G.M.R. Design of Low Drag Bluff Road Vehicles. Ph.D. Thesis, TU Delft, Delft, The Netherlands, 2012. [Google Scholar]
- Wildhagen, M.; Ebert, J.; Beelmann, R. Moeglichkeiten der Verbrauchsoptimierung durch Aerodynamik und weitere Massnahmen am Trailer/Possibilities to Optimise fuel Consumption by Means of Aerodynamics and Further Measures on the Trailer; VDI Verlag GmbH: Düsseldorf, Germany, 2012. [Google Scholar]
Figure 1.
Example of energy flow in a truck-trailer configuration [2].
Figure 1.
Example of energy flow in a truck-trailer configuration [2].

Figure 2.
Evolution of engine efficiency in heavy duty vehicles [3].
Figure 2.
Evolution of engine efficiency in heavy duty vehicles [3].

Figure 3.
Comparison between Conventional (CONV) and Cab over Engine (CoE) trucks [5].
Figure 3.
Comparison between Conventional (CONV) and Cab over Engine (CoE) trucks [5].

Figure 4.
Aerodynamic measures on tractors.

Figure 5.
Tractors from the years 1999–2001. (a) DAF, (b) Daimler, (c) IVECO, (d) MAN, (e) Scania, (f) Volvo.
Figure 5.
Tractors from the years 1999–2001. (a) DAF, (b) Daimler, (c) IVECO, (d) MAN, (e) Scania, (f) Volvo.

Figure 6.
State of the art tractors 2014. (a) DAF CF, (b) Daimler Actros, (c) IVECO Stralis, (d) MAN TGX, (e) Scania R730, (f) Volvo FH.
Figure 6.
State of the art tractors 2014. (a) DAF CF, (b) Daimler Actros, (c) IVECO Stralis, (d) MAN TGX, (e) Scania R730, (f) Volvo FH.

Figure 7.
Diagram of the S-curve concept [13].
Figure 7.
Diagram of the S-curve concept [13].

Figure 8.
3 Areas of aerodynamic interest for the trailer.

Figure 9.
Principle airflow paths of a truck.

Figure 10.
Aerodynamic measures on the trailer.

Figure 11.
Combination of leading-edge fairing and rear flaps.

Figure 12.
Combination of side wings and rear flaps.

Figure 13.
Drag coefficient reductions of different references. * calculated with and considering wind direction and wind velocity at track tests.
Figure 13.
Drag coefficient reductions of different references. * calculated with and considering wind direction and wind velocity at track tests.

Figure 14.
Combination of leading edge fairing, side wings and rear flaps.

Figure 15.
Combination of “roof tapering/tear drop” and rear flaps.

Figure 16.
Combination of “roof tapering/tear drop” and side wings.

Figure 17.
Combination of Leading-edge fairing, “roof tapering/tear drop,” side wings, and rear flaps.
Figure 17.
Combination of Leading-edge fairing, “roof tapering/tear drop,” side wings, and rear flaps.

Figure 18.
Results of different cab roof defector–roof tapering combinations.

Figure 19.
Averaged drag reductions from different references and their combinations assuming a combination efficiency factor of 1.
Figure 19.
Averaged drag reductions from different references and their combinations assuming a combination efficiency factor of 1.


Table 1.
Aerodynamic measures used by state of the art tractors around the year 2000.
| Aerodynamic Measure | DAF | Daimler | IVECO | MAN | Scania | Volvo |
|---|---|---|---|---|---|---|
| C01 Air dam | x | x | x | x | x | x |
| C02 Tractor side panels | − | − | − | − | x | − |
| C03 Active grill shutters | − | − | − | − | − | − |
| C04 Cab side edge radius | x | x | x | x | x | x |
| C05 Cab side edge turning vanes | x | − | − | x | x | − |
| C06 Low drag mirrors | x | − | x | − | x | x |
| C07 Side view cameras | − | − | − | − | − | − |
| C08 Cab roof rim | − | − | − | − | − | − |
| C09 Cab sun visor | x | x | x | x | x | x |
| C10 Cab roof deflector | − | − | − | − | − | − |
| C11 Cab roof fairing | x | x | x | x | x | x |
| C12 Cab roof fairing with collar | x | x | x | x | x | x |
| C13 Cab side fairings/extenders | − | x | x | − | x | x |
| C14 Tractor chassis filler panel | − | − | − | − | − | − |
| C15 Smooth underside | − | − | − | − | − | − |
Note: x represents observed; − represents not observed.
Table 2.
Current aerodynamic measures used by state-of-the-art tractors in the year 2014.
| Aerodynamic Measure | DAF | Daimler | IVECO | MAN | Scania | Volvo |
|---|---|---|---|---|---|---|
| C01 Air dam | x | x | x | x | x | x |
| C02 Tractor side panels | x | x | x | x | x | x |
| C03 Active grill shutters | − | x | − | − | − | − |
| C04 Cab side edge radius | x | x | x | x | x | x |
| C05 Cab side edge turning vanes | x | x | x | x | − | − |
| C06 Low drag mirrors | x | x | x | x | x | x |
| C07 Side view cameras | − | − | − | − | − | − |
| C08 Cab roof rim | − | − | − | − | − | − |
| C09 Cab sun visor | x | x | x | x | x | x |
| C10 Cab roof deflector | x | − | − | x | − | x |
| C11 Cab roof fairing | x | x | x | x | x | x |
| C12 Cab roof fairing with collar | x | x | x | x | x | x |
| C13 Cab side fairings/extenders | x | x | x | x | x | x |
| C14 Tractor chassis filler panel | − | − | − | − | − | − |
| C15 Smooth underside | − | − | − | − | − | − |
Note: x represents observed; − represents not observed.
Table 3.
Possible recommended combinations for better aerodynamic profile.
| [T01] Splitter Plate | [T02] Vortex Trap/Stabilizer | [T03] Leading Edge Fairing/Air Cone | [T04] Trailer Side Panels/Side Skirts | [T05] Wheel-/Bogie Deflector/Smooth Underbody | [T06] Rear Flaps/Extension Panels | [T07] Roof Tapering/-Lowering | |
|---|---|---|---|---|---|---|---|
| [T01]Splitter Plate | x | − | − | + | + | + | + |
| [T02] Vortex Trap/Stabilizer | − | x | − | + | + | + | + |
| [T03] Leading Edge Fairing/Air Cone | − | − | x | + | + | + | + |
| [T04] Trailer Side Panels/Side Skirts | + | + | + | x | − | + | + |
| [T05] Wheel-/Bogie Deflector/Smooth Underbody | + | + | + | − | x | + | + |
| [T06] Rear Flaps/Extension Panels | + | + | + | + | + | x | + |
| [T07] Roof Tapering/-Lowering | + | + | + | + | + | + | x |
Note: x and + represent observed; − represents not observed.
Table 4.
Summary of promising measures and possible combinations.
| Trailer Area | Measure | Average of Different References ΔcD (ψ = 0°) | Average of Different References ΔcD (ψ = 5°) | Possible Combinations |
|---|---|---|---|---|
| Front | [T01] Splitter Plate (CONV truck) | > −0.04 (cD ave) | < −0.04 (cD ave) | [T04]–[T07] |
| [T02] Vortex Trap | −0.001 | −0.009 | [T04]–[T07] | |
| [T03] Leading Edge Fairing | −0.007 | −0.02 | [T04]–[T07] | |
| Underneath | [T04] Side Wings | −0.031 | −0.074 | [T01]–[T03], [T06], [T07] |
| [T05] Bogie Deflector | −0.011 | −0.051 | [T01]–[T03], [T06], [T07] | |
| Back | [T06] Rear Flaps | −0.044 | −0.072 | [T01]–[T05], [T07] |
| [T07] Roof Tapering | −0.063 | −0.007 | [T01]–[T05], [T07] |
Table 5.
Drag coefficient differences of investigated aerodynamic trailer measure combinations and their efficiency factor gathered by CFD.
Table 5.
Drag coefficient differences of investigated aerodynamic trailer measure combinations and their efficiency factor gathered by CFD.
| Combined Measures | Chap | (ψ = 0°) | (ψ = 5°) | |||
|---|---|---|---|---|---|---|
| ΔcD | ηcom | ΔcD | ηcom | |||
 | Leading edge fairing & Rear Flaps | 4.1 | −0.053 | 1.20 | −0.076 | 1.00 |
 | Side Wing & Rear Flaps | 4.2 | −0.037 | 0.60 | −0.153 | 0.99 |
| 4.2 | −0.045 | 1.40 | −0.08 | 1.07 | ||
 | Leading Edge Fairing, Side Wings & Rear Flaps | 4.3 | −0.044 | 0.64 | −0.177 | 0.99 |
 | “Tear Drop/Roof Tapering” & Rear Flaps | 4.4 | −0.027 | 0.44 | −0.047 | 0.75 |
 | “Tear Drop/Roof Tapering” & Side Wings | 4.5 | −0.039 | 0.80 | −0.110 | 1.01 |
 | “Tear Drop/Roof Tapering”, Leading Edge Fairing, Side Wings & Rear Flaps | 4.6 | −0.037 | 0.40 | −0.165 | 0.89 |
Table 6.
Fuel consumption reduction values of trailer aerodynamic measures at various track tests.
| Pos | Aerodynamic Measure | Ref. | Related Picture | Remarks | Relative Measured Fuel Consumption Reduction |
|---|---|---|---|---|---|
| 01 | (T04) Short side wing | [16] |  | (S) at RDW circuit in Lelystad with SW-NE orientation. | −1.42% |
| 02 | (T04) Full Side wing | [16] |  | (SSE/S) at RDW circuit in Lelystad with SW-NE orientation. | 4.10% |
| 03 | (T04) Wabco side wing | [16] | (SSE/S) at RDW circuit in Lelystad with SW-NE orientation. | 4.01% | |
| 04 | (T04) Wabco side wing | [16] | (ESE) at RDW circuit in Lelystad with SW-NE orientation. | 5.05% | |
| 05 | (T06) Extension panels | [16] |  | Open cavity, (W/WSW) at RDW circuit in Lelystad with SW-NE orientation. | 4.04% |
| 06 | (T06) Extension panels | [16] |  | Closed cavity, (SSE/S) at RDW circuit in Lelystad with SW-NE orientation. | 4.07% |
| 07 | (T06) Extension panels | [16] |  | No bottom, (SSE/ESE) at RDW circuit in Lelystad with SW-NE orientation. | 3.85% |
| 08 | Boat tail | [16] |  | Inflatable boat tail, (WSW/W) at RDW circuit in Lelystad with SW-NE orientation. | 4.03% |
| 09 | (T04) + (T06) Side wings + extension panels | [16] |  | Open cavity, (ESE) at RDW circuit in Lelystad with SW-NE orientation. | 8% |
| 10 | SDR | [16] |  | (WSW) at RDW circuit in Lelystad with SW-NE orientation. | 1.16% |
| 11 | SDR | [18] |  | No wind or test track data available. | 3.31% |
| 12 | (T04) Side wings | [18] |  | Reference tractor with pallet box. No wind or test track data available. | 3.55% |
| 13 | (T03) Leading edge fairing/ aircone and (T04) side wings | [18] |  | Reference tractor without deflector and side fairings/extenders. No wind or test track data available. | 3.3% |
© 2019 by the authors. Licensee MDPI, Basel, Switzerland. This article is an open access article distributed under the terms and conditions of the Creative Commons Attribution (CC BY) license (http://creativecommons.org/licenses/by/4.0/).
Share and Cite
MDPI and ACS Style
Hariram, A.; Koch, T.; Mårdberg, B.; Kyncl, J. A Study in Options to Improve Aerodynamic Profile of Heavy-Duty Vehicles in Europe. Sustainability 2019, 11, 5519. https://0-doi-org.brum.beds.ac.uk/10.3390/su11195519
AMA Style
Hariram A, Koch T, Mårdberg B, Kyncl J. A Study in Options to Improve Aerodynamic Profile of Heavy-Duty Vehicles in Europe. Sustainability. 2019; 11(19):5519. https://0-doi-org.brum.beds.ac.uk/10.3390/su11195519
Chicago/Turabian StyleHariram, Adithya, Thorsten Koch, Björn Mårdberg, and Jan Kyncl. 2019. "A Study in Options to Improve Aerodynamic Profile of Heavy-Duty Vehicles in Europe" Sustainability 11, no. 19: 5519. https://0-doi-org.brum.beds.ac.uk/10.3390/su11195519
Note that from the first issue of 2016, this journal uses article numbers instead of page numbers. See further details here.