1. Introduction
The world economy has a three-tiered world pattern, with the European Economic Area, the Free Trade Area of the Americas, and Asia-Pacific Economic Cooperation (APEC) as the centers. Judging by the South Korean and global trade cycle data, from January 2007 to January 2013, the Korean exports indicator was shown to be a leading indicator of global trade. Therefore, the Korean exports indicator is called a canary in the coal mine, as a barometer of global economic growth [
1].
According to the data compiled by Statistics Korea in 2018, among all the South Korean export growth (SKEG) Indicators, the total amount of Korean online shopping transactions increased to
$0.096 trillion USD (ranked fifth in the Organization for Economic Co-operation and Development (OECD) nations), generating 6.27% of the Korean GDP (
$1.53 trillion USD), showing significantly more sustainable characteristics than the ratio of Korean traditional manufacturing trades, such as the automotive manufacturing trade (4.0%) and the shipment trade (1.3%). In 2018, the growth rate of Korean mobile payment, which has significantly contributed to the sustainability of Korean economic growth, was 31.7% [
2], far exceeding Korea’s 2.7% gross domestic product (GDP) growth in 2018 [
3]. The sustainable growth of Korean mobile payment (m-payment) as an essential part of the SKEG indicators is crucial for the sustainable economic growth of Korea and the world.
Relevant data from 2018 showed that compared with the two larger major e-commerce markets, the United States and Europe, China’s electronic commerce sales reached
$634 billion USD, which has become the highest globally. The global e-commerce sales of 2019 are expected to exceed the threshold of
$2 trillion USD, and China’s e-commerce market is expected to remain ahead until 2023. Purchasing power has begun to shift from the United States and Europe to China and Southeast Asia, driven by an increasing number of Asian purchasers acquiring e-commerce from the rising purchasing power and greater Internet penetration, especially on mobile devices. Data from the China Ministry of Commerce revealed that by the end of 2018, the value of China’s e-commerce market accounted for
$633.9 billion USD, and it has been the biggest electronic commerce market globally for several consecutive years [
4].
From the above-mentioned literature, the following conclusion can be drawn: Considering the unique geographical advantage and driven by the higher e-commerce penetration rate, Korean m-payment service suppliers should realize that simply preserving the current Korean customers is insufficient; it is necessary to stimulate the elements influencing the usage intention of the Chinese consumer group.
In this study, we considered Korea’s largest mobile payment platform, Kakaopay, and we comprehensively studied all the factors affecting the sustainable development of Korean m-payment. As a provider of mobile payment and digital wallet services, Kakaopay (Kakao Co., Ltd., Seoul, Korea) allows consumers to perform mobile payment tasks using Near Field Communication (NFC) and two-dimensional codes [
5]. On 22 January 2016, by establishing the Kakao online bank and issuing debit cards, Kakao expanded to online financial transactions. On 21 February 2017, Kakaopay obtained
$200 million USD from Ant Financial of Alibaba Co., Ltd. (Hangzhou, China). In April 2017, Kakaopay was launched separately to manage the payment transactions. Kakaopay broke through the barrier of 10 million users within 20 months. On 21 May 2019, Korea government legally permitted Kakaopay to develop m-payment services abroad [
6]. Predictably, Kakaopay will provide joint services support with Alipay to service 450 million Chinese and Korean consumers’ m-payment requirements in the foreseeable future. Facing the exponentially increasing number of Chinese consumers, Korean m-payment suppliers should focus on core factors influencing the Chinese and Korean consumers’ m-payment system usage intention. Whether the Korean m-payment system can successfully survive is mostly influenced by vital core factors, such as user satisfaction, performance expectancy (PE), and compatibility between the technical features and task demands [
7].
Due to the limited research on the unified theory of acceptance and use of technology model (UTAUT) for mobile payment, our research is one of the few attempts to extend UTAUT from the perspective of multi-group and multi-model integration. Various researchers have sought the factors determining usage intention [
8,
9]. However, these elements have rarely been integrated into a comprehensive model. These studies in Asia have provided enough evidence in the research field of Korean mobile payment technology, with considerable empirical research literature published for the Chinese and Korean populations [
10]. To address the lack of research in related fields, we combined the information systems success model (D&M ISS) and the task-technology fit model (TTF) with UTAUT, and used this integrated model as the conceptual model presented here. This combined model compensates for the respective limitations of the three individual models and considers the subjective and objective factors. We also considered the moderator variable of the Chinese and Korean experience and multi-group analysis to enhance the multi-model integration method.
This research provides two significant contributions. Firstly, from a conceptual perspective, we expand upon previous research on the usage willingness in relation to Korean m-payment by suggesting that D&M ISS and TTF are critical components of UTAUT. Compared with traditional single-model analysis, this three-dimensional integration model enables the systematic examination of the factors determining consumers’ acceptance of m-payment solutions from a more comprehensive viewpoint. Secondly, the conclusions drawn in this study can provide a contrastive perspective on the moderating influence of Chinese and Korean consumers’ experience on the Kakaopay usage intention. For attracting potential Chinese adopters, identifying the similarities and differences between the Korean and Chinese consumers is necessary. Generally, given the background of the exponential growth of 5G Internet of Things (IoT), an integrated and contrastive perspective is conducive to follow-up research, expanding the scope of research to the use of elements affecting global m-payment willingness.
Considering the extensive cooperation between China and South Korea in the mobile payment industry, which began in early 2017, we studied the elements influencing Korean m-payment users’ usage intention (Chinese Kakaopay users in Korea and local Korean Kakaopay users) as the research objects. By comparing the differences between the two countries’ users, we aimed to stimulate the core factors which influence the Chinese consumers’ usage intention in Korea, and to provide the necessary theoretical foundation and practical preparation for larger-scale China–Korea sustainable mobile payment market cooperation.
The remainder of this paper is organized as follows.
Section 2 presents related literature on the three information system models of Korean mobile payment usage intention;
Section 3 states the research design, research hypotheses and the proposed model;
Section 4 reports the data collection, analysis, and results, including survey design and sample selection; and the final section presents the research findings, research contributions, actual impact, and future research recommendations.
3. Research Model
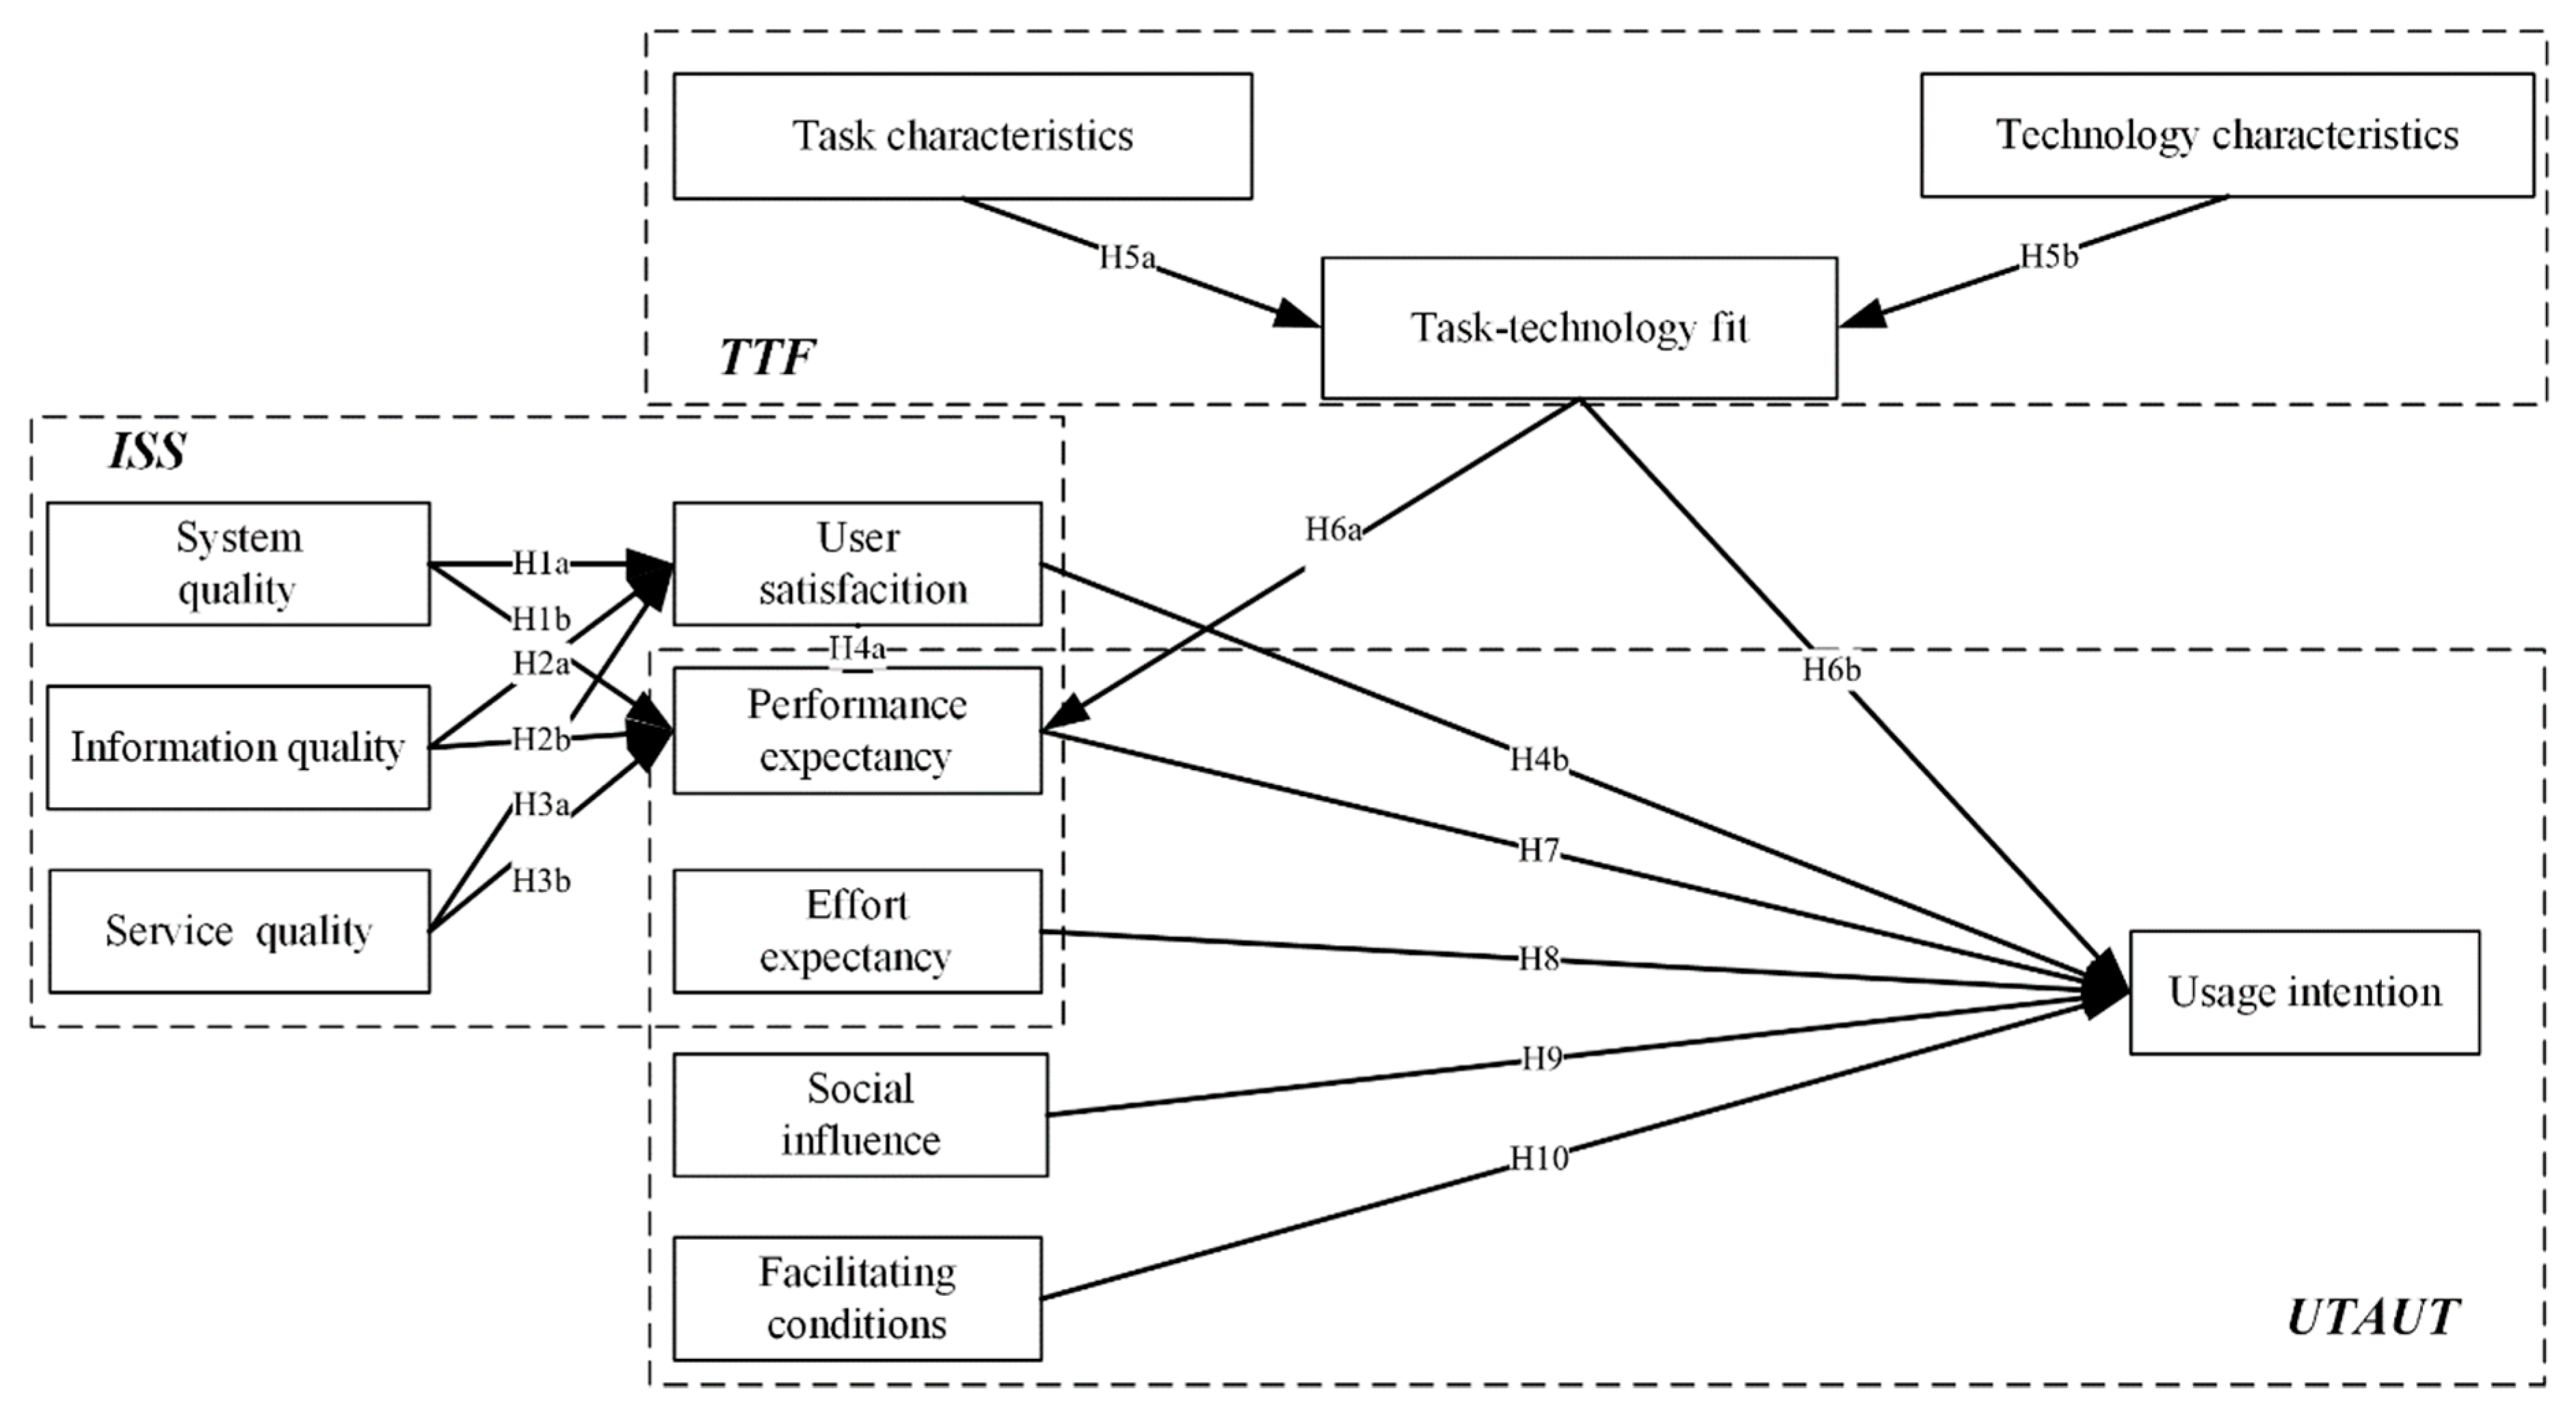
About the proposed model of this research, D&M ISS and TTF were hypothesized to be the necessary supplementary parts to UTAUT (as shown in
Figure 1). Furthermore, task-technology fit, user satisfaction as well as performance expectancy and effort expectancy, social influence as well as facilitating conditions were all hypothesized to be determining factors to usage intention. Finally, the differences between the Chinese consumers and Korean consumers were supposed to moderate these determining factors’ influence to usage intention.
Given the m-payment background, because consumers do not directly visit the mobile payment organization, system quality has become an "online store" to promote the usage intention of equipment [
15]. System quality reflects the convenience, reaction time, reliability, and stability of the user interface [
44,
45,
46]. The SYQ of m-payment is treated as the ability of the technology to support consumers when completing the payment task. Poor system quality may reduce user satisfaction, because it adds to the difficulty of using m-payments and will not fulfil users’ m-payment business needs [
42]. Hence:
Hypothesis 1a (H1a). System quality positively affects user satisfaction.
Hypothesis 1b (H1b). System quality positively affects performance expectancy.
DeLone and McLean [
31] identified most characteristics of information quality, such as integrality, timeliness, pertinence, and accuracy, which are the essential factors of user satisfaction [
7]. Information quality (IQ) includes certain features, such as correlation [
46], adequacy [
44], and precision [
47], which reveal that IQ is one of the critical factors determining user attitude toward technology [
48] that they have used.
Information quality includes the expected features of the system (e.g., relevance, accuracy, instantaneity, integrity, comprehension, and accessibility), or even feedback reports [
49]. Information quality affects people’s behavioral beliefs; for example, perceived convenience eventually affects mobile payment’s behavioral attitudes and UI [
9]. Therefore, IQ should be regarded as the core structure influencing user satisfaction and performance expectancy [
33]. Hence:
Hypothesis 2a (H2a). Information quality positively affects user satisfaction.
Hypothesis 2b (H2b). Information quality positively affects performance expectancy.
Service quality (SQ) means the characteristics of the service support (e.g., reaction, trustworthiness, brevity, and technological capability) that consumers obtain from the information system department and after-sales service personnel [
50]. SQ is commonly defined as how the payment service complements user requirements. Most information system measures emphasize goods quality rather than the service quality, and information system effectiveness cannot be evaluated correctly unless service quality is involved. We think that confirming all the qualities of the support will reduce usage risks. Therefore, the following hypotheses were proposed:
Hypothesis 3a (H3a). Service quality positively affects user satisfaction.
Hypothesis 3b (H3b). Service quality positively affects performance expectancy.
Performance expectation (PE) in this research is positively correlated with the related model recommended by DeLone and McLean [
31], who stated that ISS affects satisfaction and usage intention. According to the revised edition of the ISS model [
31], UTAUT explicates that strengthened user satisfaction (US) more significantly influences usage intention, which is subsequently affected by PE. Perceived expectations from D&M ISS usage reveal the close link between satisfaction and usage willingness [
51]. An increase in PE will improve user satisfaction and eventually affect usage willingness. Therefore, the following hypotheses were formed:
Hypothesis 4a (H4a). Performance expectancy positively affects user satisfaction.
Hypothesis 4b (H4b). User satisfaction positively affects usage intention.
From a broad TTF perspective, task characteristics (TAC) denote a user’s behavior of converting the input into an output to meet their information needs [
34]. Tasks can vary in many aspects: Task unconventionality, task relevance, and critical time. The conclusion is that users’ usage intention of IT will be lower if tasks need more time cost or information technology provides fewer functions [
9]. In the mobile context, the degree of fit between the task characteristics and the technical features determines the extent of TTF [
52]. Appropriate task characteristics positively influence users’ willingness to use mobile payment technology. In contrast, a weak task feature fitness decreases the consumer’s usage willingness [
8,
53,
54]. Therefore, the following hypothesis was formulated:
Hypothesis 5a (H5a). Task characteristics positively affect TTF.
Technical characteristics (TEC) are the terminal systems (mobile devices, applications, and transaction information statistics systems) used when performing payment tasks [
34]. TEC attracts consumers by allowing access to transaction payment settlement, timely inquiries about logistics, capital flows, and other financial services [
9]. Therefore, incorrect or unintentional technology selections will cause one technology to be ignored or masked. Consequently, the following hypothesis is postulated:
Hypothesis 5b (H5b). Technology characteristics positively affect TTF.
UTAUT assumes that consumer willingness regarding TTF results in performance expectancy (PE) [
9]. The technical characteristics of m-payment will affect effort efficiency (EE). The benefits of m-payment, such as omnipresence and immediateness, allow a consumer to be complete a quick payment and reduce the relevant cost. Compared with the complicated time and space limitation interfaces of traditional credit card payment system, m-payment has fewer characteristics and dedicated interfaces. This advantage may reduce the complexity of user operations. Therefore, the TTF factor will influence a consumer’s PE [
55], and the following hypothesis was formulated:
Hypothesis 6a (H6a). Task–technology fit of m-payment positively affects performance expectancy.
TTF is a technical perspective of how new technologies optimize work tasks. It is affected by task requirements and the matching degree of technical features. As such, TTF affects the intention of the consumer toward mobile payment [
9]. Previous research has experientially confirmed that TTF significantly affects user intention. Therefore, we hypothesized the following:
Hypothesis 6b (H6b). Task-technology fit positively affects usage intention.
Venkatesh [
56] interpreted PE as "how much technology will benefit consumers to accomplish certain tasks”. Therefore, performance expectations affect the different characteristics of information systems, which will benefit consumers. For example, Jaradat [
57] and Lee [
58] reported that performance expectations are essential predictors of willingness to use mobile commerce. Current evidence suggests that PE is essential to the application of m-payment [
9,
59,
60]. Therefore, we hypothesized that:
Hypothesis 7 (H7). Performance expectancy positively affects usage intention.
Efforts expectancy (EE) is conceptualized as "the comfort level of consumer adoption technology" [
56]. EE approximates the usability structure in TAM—that is, people think that using a given system will be effortless. Given the background of mobile payments, EE can be determined by the ability to finish a particular mobile payment transaction with minimal effort [
52]. Therefore, we hypothesized:
Hypothesis 8 (H8). Effort expectancy positively affects usage intention.
Social impact (SI) is described as “the level of support that consumers have for using the latest technology equipment” [
9]. Social impact reveals the social relatives in influencing individual technological acceptance. Individuals tend to consider other people’s opinions when deciding whether to accept an unknown technology. If their attitudes are optimistic, users adopt them; conversely, with negative attitudes, users do not adopt. Jaradat [
57] and Chuang [
61] proved that SI significantly influences the consumers’ UI of m-payment solutions. Hence, we hypothesized that:
Hypothesis 9 (H9). Social influence positively affects usage intention.
The facilitation condition (FC) is described as "the total amount of capital and assistance available that consumers can use to implement actions" [
56]. This means that the FC can be viewed as the consumer views of environmental obstacles or available resources that increase the accessibility of mobile payment solutions. Because mobile Internet must be used for mobile payment transactions, it has a significant impact on mobile payment [
52]. For example, the convenience or high threshold of specific online service areas can promote or hinder consumers from using mobile payments. From the concept of FC, the convenience conditions affecting the use of the mobile Internet are discussed. Vongjaturapat [
62] and Fianu [
63] disclosed that FC notably influences usage intention. Therefore, the following hypothesis was formed:
Hypothesis 10 (H10). Facilitating conditions positively affect usage intention.
Im [
64] revealed the relationships between the UTAUT variables to determine the moderating effect of nationality. Through an evaluation of U.S. and Korea data, Im reported that the effects of EE on use behavior were greater in the sample of U.S. consumers. Zhang [
65] studied an adoption model of mobile commerce, which expanded TAM to the theory of planned behavior (TPB) and IT. Through an adjusted analysis and segmentation test, the context was divided into sub-groups of eastern and western cultures to confirm the adoption of mobile commerce by different national cultures. The results showed that UTAUT perfectly matched the data. Lee et al. [
58] revealed the moderating effect of the government’s role on the determinants of usage intention in the UTAUT model.
According to this literature, we statistically tested the moderating effect of the different nationalities of consumers in the UTAUT model. We assumed that some differences exist in the national role that moderates these determinants’ influence on UI. Therefore, the following hypotheses were tested:
Hypothesis 11 (H11). The impact of facilitating conditions on usage intention differs between Chinese and Korean consumers.
Hypothesis 12 (H12). The effect of social influence on usage intention differs between Chinese and Korean consumers.
Hypothesis 13 (H13). The influence of effort expectancy on usage intention differs between Chinese and Korean consumers.
Hypothesis 14 (H11). The influence of performance expectancy on usage intention differs between Chinese and Korean consumers.
Hypothesis 15 (H15). The impact of satisfaction on usage intention differs between Chinese and Korean consumers.
Hypothesis 16 (H16). The impact of task-technology fit on usage intention differs between Chinese and Korean consumers.
4. Data Collection and Results
On 21 February 2017, China Ant Financial of Alibaba Co., Ltd. invested
$200 million USD in Kakaopay, which was launched separately to manage the payment transactions operated by the company two months later. This means that in the foreseeable future, Kakaopay will be able to provide joint services support with Alipay to service 450 million Chinese and Korean consumers’ m-payment requirements. Due to the increasing number of Chinese consumers, Korean mobile payment providers should explore the Chinese user market [
6].
As a comprehensive financial platform with a considerable scale in the Asia-Pacific region, Kakaopay has the following sustainability characteristics: Higher electricity supplier penetration, financial support and financial transactions integrated with cryptocurrencies like bitcoin and Ethereum, and joint services support with Alipay, which will provide 450 million Chinese and Korean consumers in the foreseeable future [
6].
This research designed questionnaires based on the above assumptions. In the pre-test, all variables and related measurement items were extended to follow the theme and background of this research, referring to the relevant literature. After the questionnaire design was completed, nearly 100 participants who often conducted transactions using Kakaopay were invited to complete a pre-test via face-to-face interviews. The ambiguous or easily misunderstood parts of the questionnaire were then modified so that participants could fully identify the content of the questionnaire, improving the accuracy of the survey. Considering the advantages of online questionnaires, such as their low cost, ability to provide fast feedback, wide-coverage, and lack of a time limitation [
66,
67,
68], the second group of about 200 participants was recruited from the Kakaopay after-sales information feedback center, who had bought e-ecommerce products using Kakaopay. In the pre-test, each group strictly excluded those who had not used Kakaopay products or services. The remaining data were obtained from the experienced Chinese and Korean users in Seoul from face-to-face interviews, where mobile commerce was more mature than other parts of Korea, so that we could quickly obtain enough samples. In Seoul, we randomly intercepted the Chinese and Korean individuals and identified suitable subjects who had used Kakaopay online. The suitable users received the questionnaires and completed them according to their own usage intention. Every individual who completed the survey received a gift reward.
According to the procedure proposed by Armstrong et al. [
69], we found no significant difference in the Chi-square test results at the 5% significance level between participants who answered the questionnaire via a face-to-face interview and those who answered online from the perspective of age, education, and occupation.
This study gathered relative statistical data to target both the Chinese who were foreign residents in Korea for over 10 weeks and the Korean population. To achieve an adequate response rate, surveys were sent using both online and blended delivery methods. Altogether 1300 questionnaires were issued, 1124 responses were collected (response rate of 86.46%). After discarding 216 responses, due to missing data or the lack of Kakaopay usage experience, a sample of 908 (80.78%) was eventually used in the decisive analysis (467 Chinese data and 441 Korean data). These data were enough to determine the dissimilarities between the two target populations, even with different sample numbers. A 5-point Likert scale was used for all questions ranging from 1, “strongly refuse”, to 5, “strongly approve”.
In the following empirical analysis, Cronbach’s α was used via IBM SPSS 24.0 to calculate the measuring means’ reliability and to test each construct and evaluate the construct validity by examining the factor structure and internal correlations. To test the research hypotheses, we used IBM AMOS 24.0, which also confirmed the causality between the endogenous core variables via standard coefficients and significance values. Before the hypothetical verification test, the integrated model was analyzed using the entire sample. For hypothetical verification, we conducted more specific analyses with the model applied to the groups.
We addressed the experience of Chinese and Korean customers in Korea, including travelers, professional staff, and part-time working students in Korea. Since middle-aged customers and women represent the largest group using the mobile payment system, a total of 590 respondents (60%) were female, and 707 (77.86%) of the suitable interviewees were around 40 years old.
Table 1 provides detailed statistical results relating to the respondents’ characteristics.
4.1. Reliability and Validity
Three steps are necessary when evaluating the convergent effectiveness of the measurement objects to their related constructs. Firstly, standardized loadings are applied to evaluate every index’s reliability. Secondly, Cronbach’s α and the composite reliability (CR) value of each construct is used to measure the overall CR. As an empirical analysis measure, Cronbach’s α is used to evaluate the composite materials’ reliability. CR is calculated using the index load and its error variances. Thirdly, the average variance extracted (AVE) evaluates the variance acquired by the variables relative to the variance owing to a measurement error [
70].
Table 2 displays the results of the reliability and validity analysis, indicating that the variables meet all the criteria. Supported by
Table 2, the standardized loadings of the single project surpassed the minimum amount of 0.50; Cronbach’s α and the CR value were higher than 0.70, and the AVE of each structure was higher than 0.50, which indicated the ideal validity of the measurement interpretation structure and the higher level of composite reliability [
70,
71,
72]. The Cronbach’s α analysis results demonstrated the high internal consistency between the variables, and the other obtained results supported sufficient reliability and validity of internal consistency.
In
Table 3, the discriminant validity shows the degree to which a principle with its related indexes vary from the second principle with the associated indexes [
73]. Fornell et al. [
72] revealed that the relationship between variables in any two structures must be inferior to the square root of the average variances shared by items of one structure.
Table 3 shows that compared with the correlations among the structures and other structures, the square root of the variance among structures with their terms was larger, which met every criteria of discriminant validity [
72]. The diagonal values surpassing the correlation between constructs proved that our measurement tool had satisfactory construct validity.
4.2. Measurement Model Evaluation
In evaluating the collected data, we adopted the two-process procedure proposed by Anderson et al. [
74]. Firstly, the convergent and discriminant validity was tested. Secondly, the measurement model used to investigate the theoretical constructs’ relationships was assessed.
Before the Chinese and Korean consumers’ data were separately analyzed, the integrated model was examined using the entire dataset. To test the fitting of measurements and structural modeling, Hooper et al. [
75] proposed model fit as an absolute fit index, and recommended the following indices (
Table 4) as incremental fit indices.
The SEM was applied to test the 16 hypotheses proposed in this research. For the parsimonious fit indices herein all exceeded the acceptable fitness minimum values which were a relatively strict standard of recommended values. As shown in
Table 4, all fit indices indicate a satisfactory model match between the analytical data and the composite model.
4.3. Hypothesis Verification
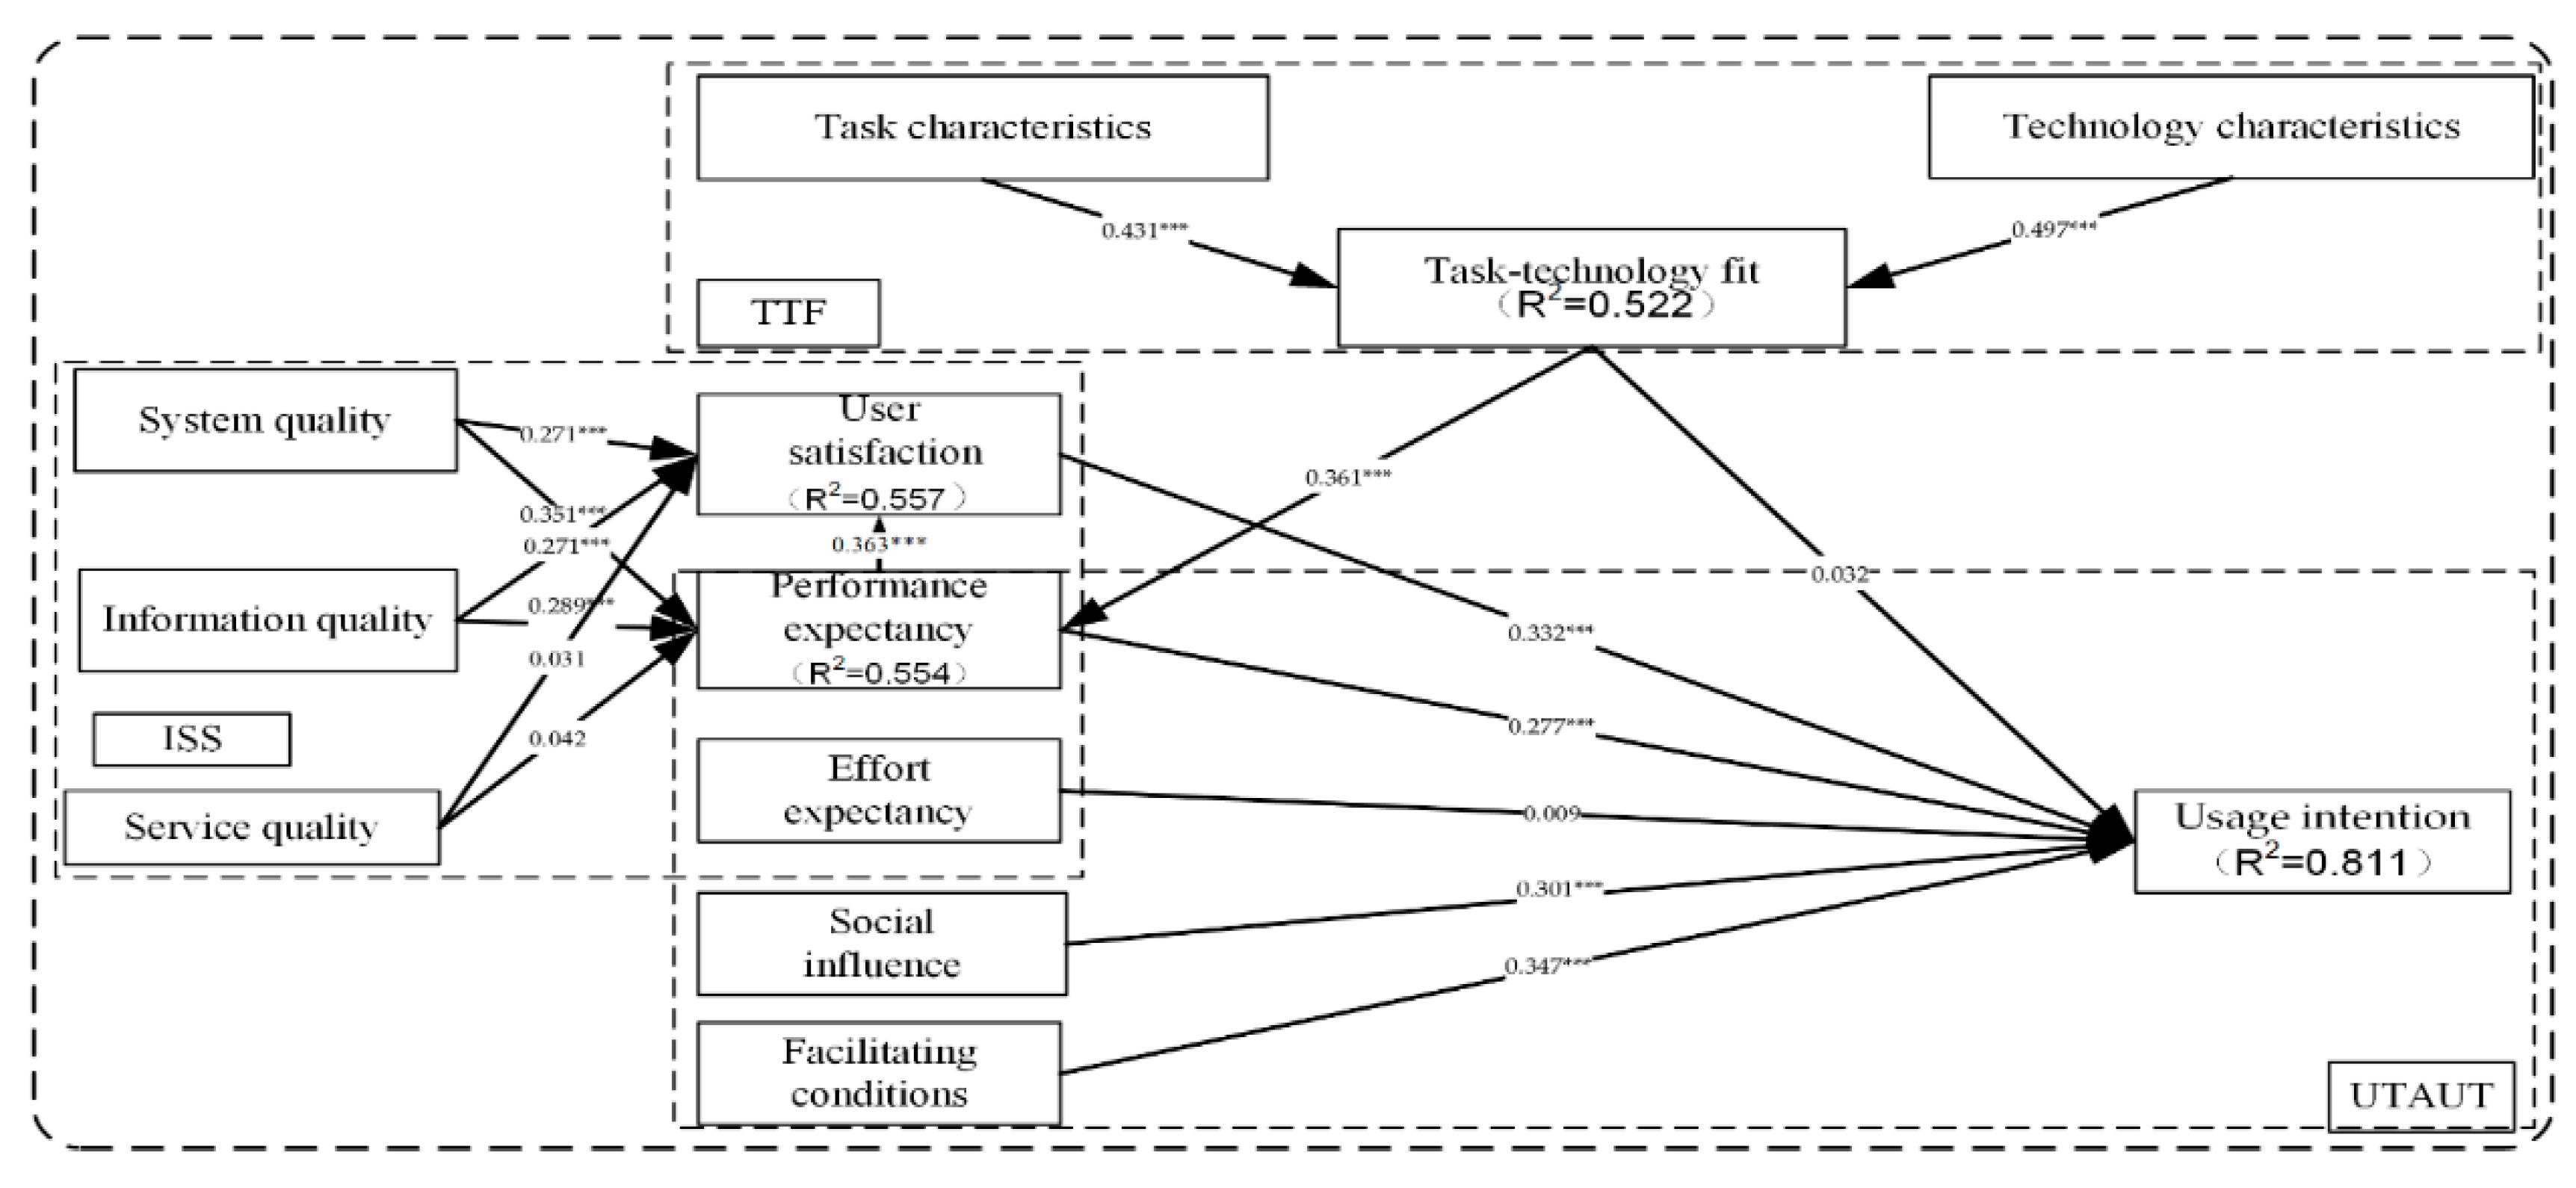
After confirming the suitability of the measurement and structure of the integrated model, the model was analyzed with the Chinese sample, and the Chinese path coefficients were assessed, as shown in
Figure 2. According to the p-values, 4 of the 16 paths (H3a, H3b, H6b, and H8) were rejected, but the other 12 paths had statistically significant characteristics.
The UI of the Chinese consumers was indicated by TTF (β = 0.032), US (β = 0.332), PE (β = 0.277), EE (β = 0.009), SI (β = 0.301), and FC (β = 0.347), which jointly explained 81.1% of the variance in UI.
The impact on Chinese consumers (
Figure 2) showed that the antecedents of TTF, ISS, and UTAUT models respectively explained 52.2%, 55.7%, and 55.4% of the variances, all of which were to the 81.1% explanatory power of the integrated model towards usage intention.
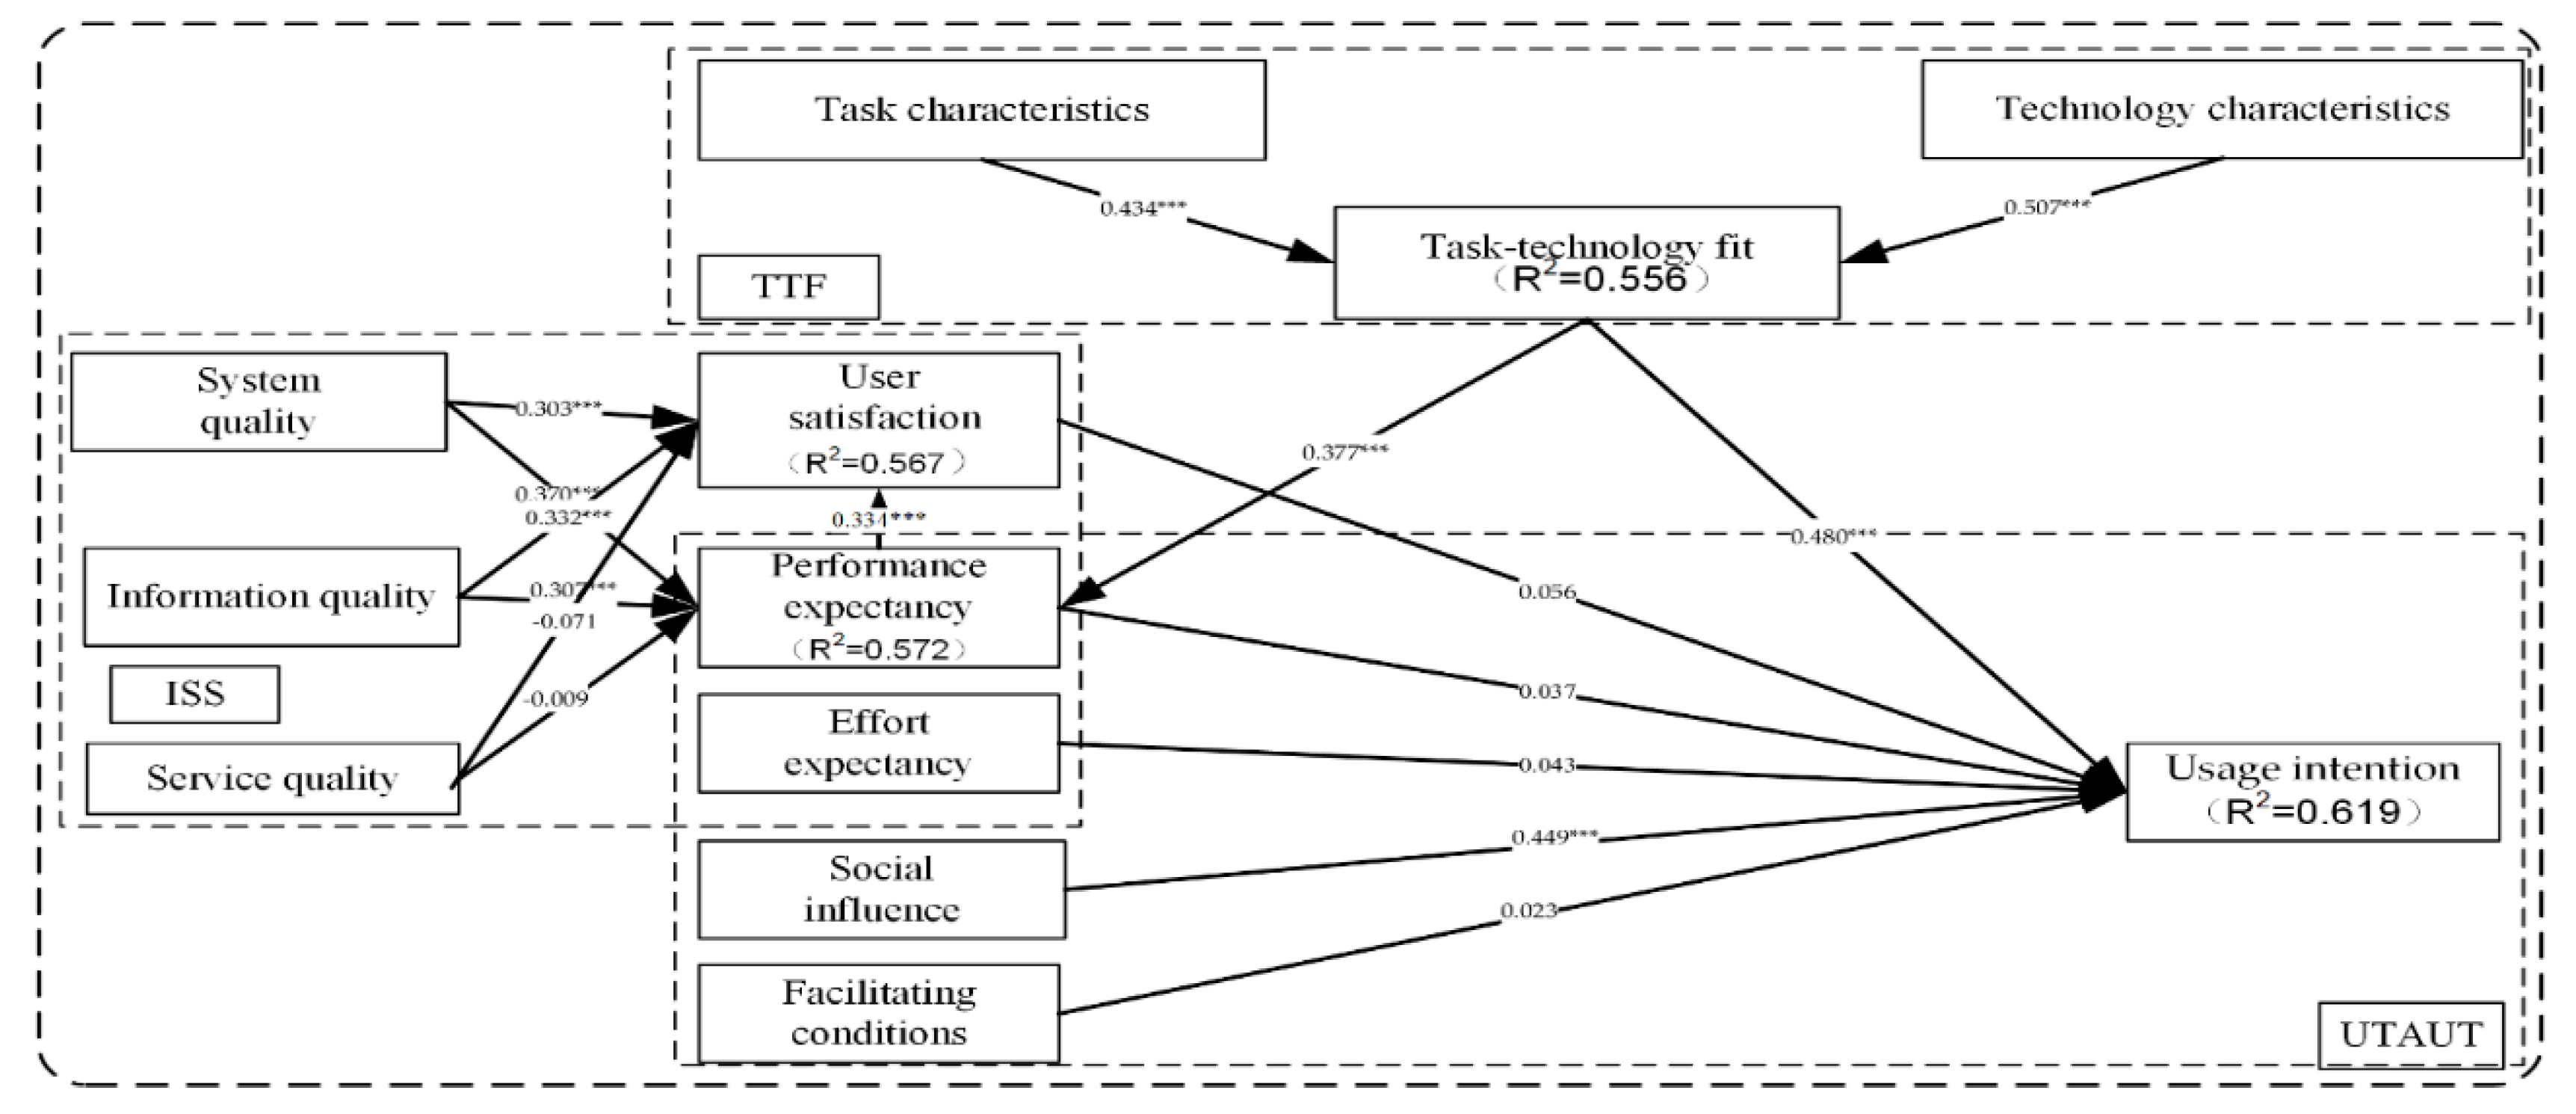
Given the satisfactory measurement and structure result, the integrated model was analyzed with the Korean sample.
Figure 3 shows that the Korean path coefficients of the integrated model among the fundamental hypotheses were appropriately assessed. According to the respective p-values, 6 of the 16 paths (H3a, H3b, H4b, H7, H8, and H10) were rejected, but the other paths had statistically significant characteristics.
UI of the Korean consumers was predicted by TTF (β = 0.480), US (β = 0.056), PE (β = 0.037), EE (β = 0.043), SI (β = 0.449), and FC (β = 0.023), which jointly explained 61.9% of the variance in Korean consumers’ usage intention. The impact on Korean consumers (
Figure 3) showed that the antecedents of TTF, ISS, and UTAUT models respectively explained 55.6%, 56.7%, and 57.2% of the variances, all of which were to the 61.9% explanatory power of the integrated model towards usage intention.
The empirical analysis results of the entire samples in
Table 5 show that three paths (H3a, H3b, and H8;
p-values > 0.05) were not supported, whereas the remaining paths were significant at 0.05. The characteristics of the causal paths are listed in
Table 5, including the path coefficients and hypothesis test results of the hypothetical model.
Table 5 proves that the series of statistics results support the integrated model.
The integrated model was also analyzed with the Chinese sample, as shown in
Table 6. The empirical analysis results of the Chinese sample in
Table 6 show that the integrated model is supported. Based on the Chinese sample, four paths (H3a, H3b, H6b, and H8;
p-values > 0.05) were not supported, whereas the remaining paths were significant at the 0.05 level. The characteristics of the causal paths, the standardized path coefficients, and hypothesis test results of the hypothetical model are listed in
Table 6. The integrated model was analyzed with the Korean sample, as shown in
Table 7.
The characteristics of the causal paths, the standardized path coefficients, and hypothesis test results of the hypothetical model are listed in
Table 7. The empirical analysis results of the Korean sample in
Table 7 confirm that the integrated model was supported. Based on the Korean sample, five paths (H3a, H3b, H4b, H7, and H8;
p-values > 0.05) were not supported, whereas the remaining paths were significant at the 0.05 level.
4.4. Analysis of the Differences in Path Coefficients Between Chinese and Korean Groups
This research paid more attention to the differences between Chinese and Korean consumer income groups in terms of the mobile payment UI. Comparing these two consumer groups had two advantages. Firstly, in terms of the gaps in income level, purchasing power, and network quality, the Chinese and Korean groups represented two unique and mutually different demographic characteristics. Secondly, Chinese consumers played the most critical role in online shopping. Although Chinese consumers tended to be lower-income consumers and had less experience with Kakaopay than Korean consumers, Chinese mobile payment use patterns were entirely different. Therefore, an evaluation comparing Chinese and Korean customers might improve our understanding of UI [
7]. In this research, PE, EE, SI, FC, and TTF were the factors directly determining UI, so we further studied them. The differences in the roles between Chinese and Korean groups are supposed to moderate these factors’ influence on UI.
Table 8 shows the empirical research results for the moderating effects of the hypotheses (H11–H16). Firstly, for both
p-values of SI on UI and EE on UI, the Chinese and Korean groups’ moderating effects were insignificant. Secondly, the other four
p-values revealed the moderating effects’ differences between the Chinese and Korean groups. In the Chinese group, the FC (β = 0.347,
p < 0.01), PE (β = 0.277,
p < 0.01), and US (β = 0.332,
p < 0.01) significantly influenced UI at the 5% significance level, unlike in the Korean group. Conversely, TTF (β = 0.480,
p < 0.01) significantly affected UI at the 1% significance level in the Korean group, unlike in the Chinese group.
5. Conclusions
5.1. Research Findings
As the scale of Internet shopping increases rapidly in Korea, the number of foreign mobile payment users is increasing precipitously. However, mobile payment providers cannot attract international customers, especially Chinese customers, without understanding their intention to use mobile payment technology. Hence, an integrated model for mobile payment providers is essential for academics and practitioners. The Chinese customer group in the Korean mobile payment market is one of the largest undeveloped markets, offering a unique research opportunity. Therefore, we focused on the differences between Chinese and Korean consumer income groups in intent to use mobile payments. Comparing these two consumer groups provided two representative findings. Firstly, in terms of the gaps in income level, purchasing power, and network quality, Chinese and Korean groups have unique and mutually different demographic characteristics. Secondly, Chinese users play the most critical role in online shopping. Since Chinese mobile payment use patterns are entirely different, Chinese consumers have less experience with Kakaopay than Korean consumers. Therefore, an empirical analysis of Chinese and Korean costumers can enhance our ability to analyze the factors influencing UI.
Compared with the three separate models, UTAUT, D&M ISS, and TTF, we proposed an integrated model that combines their different advantages. Each of the three independent models has its own historical and perspective limitations. Therefore, it is necessary to conduct an appropriate discussion with the data from both Chinese and Korean groups from the perspectives of theoretical literature and practical solutions and to accurately detect the key elements influencing the Chinese users’ usage intention in relation to the Korean m-payment system.
The integrated model in this research complemented several variables from the original UTAUT model. Performance expectancy (PE), effort expectancy (EE), social influence (SI), facilitating conditions (FC), and Usage intention (UI) were evaluated according to Venkatesh et al. [
20] and related researches [
21,
56]. Furthermore, task characteristics (TAC), technology characteristics (TEC), and task-technology fit (TTF) were evaluated according to Zhou [
8] and related research [
42]. Other related researches [
14,
50] were utilized to evaluate system quality (SQ), information quality (IQ), service quality (SQ), and user satisfaction (US).
From a theoretical perspective, previous research on mobile payment technology in Korea [
76,
77,
78] failed to integrate the TTF model into UTAUT, and DeLone and McLean’s ISS, decreasing the explanatory power of their analyses. We empirically tested the influence effects of three qualities on UI, in addition to the impact of TTF on UI. UTAUT fully considers the characteristics of the operating system. TTF adopts a directly objective procedure by supposing that consumers use IT that offers benefits, but does not consider consumers’ beliefs in and intents toward IT. DeLone and McLean’s ISS considers the stability of the quality of the system. The imperfection of the models can be compensated for through their integrating.
Following the integration of the UTAUT and TTF, the empirical analysis results indicated a correlation between TTF and UTAUT constructs. The characteristics of task and technology significantly affect TTF, which significantly affect the performance expectancy, as well as the usage intention. With the integration between the UTAUT and D&M ISS, we showed that SYQ, SQ, IQ, and PE are essential for consumer satisfaction, and SYQ, SQ, and IQ are critical for performance expectancy. Without the framework of the integrated model, we cannot analyze and identify the core factors influencing usage intention.
From the perspective of practical solutions, to stimulate the factors influencing usage intention, the integrated model provides a more comprehensive view to help mobile payment providers enhance their technological security advantages for improving costumers’ UI.
According to the results in
Table 8, in the Chinese group, PE (β = 0.277,
p < 0.01), SI (β = 0.301,
p < 0.01), FC (β = 0.347,
p < 0.01), and US (β = 0.332,
p < 0.01) significantly influenced UI, which is different from the Korean group, so it is necessary to stimulate these factors influencing the Chinese customers’ UI. For example, performance expectancy significantly affects the Chinese customers’ UI, and its effects follow the features that the Korean m-payment providers can offer [
79,
80]. The Korean m-payment providers should improve their services according to the Chinese users’ demands to better satisfy the Chinese consumers’ performance expectancy. However, compared with wired-network-based personal computer payment, the wireless m-payment network is more exposed to hacker attacks or error interception attacks [
81], causing the Chinese consumers to worry about security and seriously affecting their PE. The Korean m-payment providers have a better digital encoding technique to provide a trustworthy and safe product, and offer customers a real-time service.
According to the construct of the integrated model in
Figure 2, a good TTF is also an effective method for improving the Chinese consumers’ performance expectancy. If the m-payment system cannot meet the Chinese customers’ needs for payment tasks, they will assume that mobile payment technology is less practical, thus, creating low-performance expectations. For example, some mobile payment services may provide an ATM location service. Most Chinese consumers would accept these services as supporting technology. However, some users still complain that the service is insecure in terms of the disclosure of personal location information [
82,
83]. For these Chinese users, location services will create unacceptance of Korean mobile payment technology. Therefore, mobile payment technology providers need to obtain Chinese users’ permissions before providing location services.
Besides the significant determinant of PE, three other factors (SI, FC, and US) also directly and positively affect the Chinese consumers’ UI. The role of social impact (SI) is worthy of attention, and Korean mobile payment providers should use suggestions and comments from earlier Chinese consumers to stimulate public praise in subsequent Chinese customers [
84]. To improve the facilitating conditions (FC), the providers should consider input difficulties and the negative impact of small-screen mobile terminals, which should be designed so that they are more available to the Chinese consumers. Considering user satisfaction (US), the Korean providers should launch marketing operations to strengthen the Chinese consumers’ acquaintance with both mobile payment technology and usability. Gradually, Chinese consumers’ feelings of satisfaction will be improved.
5.2. Contribution
5.2.1. Theoretical Contribution
In relation to Korean m-payments, we integrated three models, and, using Kakaopay users’ experience as the moderating variables, simultaneously lay a solid foundation for follow-up research in academia. Our analysis results can help academics to understand which factors can significantly improve UI. The willingness of Kakaopay users can guide market development strategies for Kakaopay and other Korean mobile payment service providers.
This study integrated D&M ISS and TTF into UTAUT to explain the m-payment UI. We found that D&M and TTF not only directly influence UI, but also affect UI via user satisfaction and performance expectancy separately. Besides, the contributions of this study are two-fold: First, these results indicate that the integrated model offers more explanatory power for user acceptance than D&M ISS, TTF, or UTAUT alone. Therefore, future empirical research should adopt an integrated perspective to test the usage willingness of any other m-payment system. We think that the overall integration aspect will provide more valuable insights than the view using a single model. Second, few studies have focused on potential Chinese adopters who are long-term residents in Korea; this is an aspect of mobile payment research that is entirely unexplored, and we add to the limited knowledge of m-payment by testing moderating variables in combination with Chinese and Korean cultural factors. Third, this comparison method improves the effectiveness of testing several Chinese–Korean comparison scenarios to reveal specific new gaps in mobile payment research. The comprehensive approach outlined in this paper should be a suitable model for assessing technical factors. The impact of performance expectancy can be used as a foundation and an important starting point for future research [
85].
5.2.2. Managerial Contribution
From a practical perspective, this research revealed that D&M ISS, TTF, and UTAUT have a significant effect on the core influencing factors which will directly affect the Chinese and Korean consumers’ willingness to use Korean mobile payment. We discovered that the task–technology fit has a considerable impact on performance expectancy. Therefore, Korean mobile payment providers must improve the adaptability of task technology. They can segment the consumer market and provide customized technology to foreign customers. For example, Chinese professional staff and part-time working student customers may focus more on the usage costs and functions, but Chinese travelers may show more anxiety about the dependability and accessibility of Korean international mobile payment transfers. Therefore, Korean mobile payment providers can provide a series of customized services to satisfy the task requirements of different groups, thereby increasing the willingness of Chinese customers to use mobile payments in Korea. Korean mobile payment operators can also improve the technical experience of mobile consumers, such as PE. This goal can be achieved by offering a friendly consumer interface to decrease the workload expectancy and enhance the UI.
Our results indicate that if Korean mobile payment providers want to increase potential adopters, they should also enhance the quality of the systems and information to increase consumer satisfaction. Notably, in the context of the current situation, Korean mobile payment providers prefer to think that the importance of assessing the system quality diminishes as the mobile payment system matures and stabilizes. Therefore, the match between system quality information quality and task technology strongly influences the usage intention through user satisfaction and PE, respectively. Because mobile payment transactions occur whenever and wherever possible, we recommend that Korean m-payment system operators should focus on improving the utilitarian impact of PE, SI, FC, and US in Korean mobile payment services; for example, increasing the system speed, shortening the system-down time, strengthening various functions, and personalizing customized information technology. Continuous updating of all information supporting mobile payment customers could improve the quality of information. Uncorrelated, imprecise, or untimely information could influence customers’ satisfaction.
Considering the moderating effect of Chinese and Korean users’ differences, firstly, facilitating conditions to the usage intention of Korean m-payment systems should be enhanced to attract people who think highly of independence and privacy, such as free Wi-Fi traffic and professional Chinese and Korean after-sales consultation, to overcome the hardware and software barriers to the use of Kakaopay by Chinese and Korean users. Secondly, when Kakaopay providers develop mobile payment technology capabilities, they need to balance the Chinese and Korean users’ performance expectations of these features. They can enhance the product function according to customer feedback to better satisfy customers’ performance expectancy. Third, Korean customers are more sensitive to user satisfaction, which seems to be an essential factor in the development of the willingness to use technology. However, for Chinese users who prefer personal goals, the red envelope reward mechanism in using mobile payment could be one of Kakaopay’s supplier marketing tools. Fourth, Chinese and Korean users can accurately describe their convenience or other technical features in using Kakaopay features, or user-friendly features could be included in their promotional programs to accommodate different tasks.
Based on the above findings, we need to consider different perspectives to take advantage of factors affecting PE, satisfaction, and the ultimate intention to use mobile payment. To formulate a long-term strategy and sustainability, policymakers should develop action plans according to the elements influencing their customers. Addressing each factor that affects the willingness to use in this model will correspondingly benefit the willingness of users in China and Korea, and even cross-border e-commerce and economic cooperation across the Asia-Pacific region.
5.3. Limitations and Future Work
Our research has some limitations. Firstly, we assumed that the future use of mobile payment would increase, due to the improvement in the factors affecting the Chinese customers’ intention to use Kakaopay. Therefore, a follow-up study needs to be conducted. Secondly, we only conducted this research for a Korean mobile payment provider. Although Kakaopay is a representative provider of the Korean m-payment industry, it does not cover every field of global mobile payment. To strengthen the systematization of this research, we look forward to comparing the results with those from different countries with large sample size and a wide variety of cultures. Thirdly, we integrated D&M ISS and TTF into UTAUT to identify the factors influencing m-payment’s usage intention. Future research should apply other theories, for example, the trustworthiness of TAM theory, to explore the impact of other elements.


