How Does Urban Rail Transit Influence Residential Property Values? Evidence from An Emerging Chinese Megacity

School of Economics and Management, Beijing Jiaotong University, Beijing 100044, China
*
Author to whom correspondence should be addressed.
Sustainability 2019, 11(2), 534; https://0-doi-org.brum.beds.ac.uk/10.3390/su11020534
Submission received: 29 October 2018
/
Revised: 15 January 2019
/
Accepted: 16 January 2019
/
Published: 20 January 2019
(This article belongs to the Special Issue New Governance Model and Strategy to Improve a Sustainable Transport System)
Abstract
:Urban rail transit (URT) plays crucial economic, social, and environmental roles and may generate positive externalities that can influence the residential property values (RPVs) in real estate markets. Little attention has been given to exploring the impacts with respect to both the spatial and temporal perspectives. This paper explores the impacts of URT on the RPVs of 480 gated communities with respect to the spatial and temporal dimensions using the hedonic price model and a panel data set from Zhengzhou for 2012–2016. The results show the following: (1) URT does have a significant positive impact on the RPVs in all the selected years from 2012 to 2016, and the influencing strength was a “U-shape” with the increased travel time to the nearest URT stations in most of the selected years. Specially, there is quite some interaction between the temporal and spatial dimensions. (2) The influencing strength of URT during its early stages of planning and construction was higher than that during the operation periods, which is quite different from previous research that uses these first-tier cities such as Beijing and Shanghai in China. (3) Regarding the operating period, the influencing strength reached its peak point after two years of the URT line operating. The results of this paper could provide some new ideas for policy-makers, real estate developers, and even the consumers in real estate markets.
1. Introduction
Urban rail transit (URT) plays crucial economic, social, and environmental roles. URT improves the accessibility of commuters to workplaces and services and generates positive externalities for the environment due to potential reductions in greenhouse gas emissions [1,2]. URT has generated a significant substitution effect with private cars as a major transportation mode in Asia, North America, and Europe, especially in China. The URT in China has entered a phase of rapid expansion due to rapid urbanization. As of the end of 2017, 34 total cities in Mainland China have opened URT with a total mileage of 5033 km. In addition, according to the national development plan, in 2020, the total URT mileage in operation will exceed 6000 km, which means a total investment of approximately 49 billion. However, there are still some debates about whether a city should build a URT system when considering its costs and benefits. In most cities, the construction costs of URT are financed by local governments, while the operating costs are provided by the revenues generated from fares. In addition, the URT itself requires high investments and has a long payback period before being profitable, and the URT might increase the financial pressure on the local government and prevent them from investing in other new infrastructure [3,4]. This problem of developing URT is crucial for most cities, especially for the cities in a developing country such as China. The Urban Rail-based Transit Joint Development (URTJD) could be an important way to solve these problems based on the Land Value Capture theory [5]. Because relevant research proves that URT has externalities, and the most remarkable performance is to improve the surrounding land values, whose more intuitive performance is the relationship between URT and its surrounding real estate.
Previous studies have empirically studied the impacts of URT on residential property values (RPVs). However, most of these studies just considered the spatial impacts or the temporal impacts, neglecting the interaction of spatial and temporal dimensions. In terms of the temporal dimension, the researchers confirmed that the impacts on RPVs varied depending on whether URT was in the planning period, in the construction period, or in the operating period [6,7] and on how long URT was operating [8]. With regard to the spatial dimension, most research used dummy variables based on the Euclidian distance [6] or the travel time cut-off criteria by generating ring buffers around stations [8] or the continuous measures of the Euclidian distance [9], road distance [10], or travel time [11,12] from each study object to the nearest station to measure the predominance of URT.
Commonly, in the previous case studies, cities in developed countries, such as San Francisco [13], Atlanta [14], Toronto [15], and Texas [16], were chosen as case studies. In addition, the existing research taking cities in China as a case study is mainly concentrated on exploring the impact of URT of first-tier cities, such as Beijing [17], Shenzhen [18], and Shanghai [11,16], while little attention has been paid to the second-tier cities (e.g., Zhengzhou) that have just begun to construct and operate their URT systems. In fact, according to the national development plan in China, in addition to the first-tier cities such as Beijing [17,19], Shanghai [11,16], Guangzhou, and Shenzhen, the cities that are building rail transit in the future are mostly second-tier cities such as Zhengzhou, Chengdu, and Xi’an. This paper chooses Zhengzhou, one of the leading second-tier cities, as a research object, and provides suggestions for its URTJD, as well as and for other cities at the same level.
This study contributes to the existing studies in three ways. First, this paper compares the spatial impacts of URT on RPVs using the data of a selected year from 2012 to 2016. The spatial impacts of URT are evaluated using the travel time to the nearest URT stations, reflecting the accessibility to URT and the dummy variables based on travel time. The travel time to the nearest URT station is calculated using web crawler technology, which considers both the route distance and walking speed. Second, this paper builds panel models to investigate both the temporal and spatial impacts of URT. Among this, the temporal impacts of URT are explored using continuous times from 2012 to 2016. Finally, this paper takes an emerging Chinese megacity (Zhengzhou) as a case study, which can provide feasible suggestions for the government to implement URTJD and contribute to the sustainable development of URT. Of course, through the research in this paper, we can also provide a reference for real estate companies to choose a reasonable time and location for real estate development. Meanwhile, the consumers in the real estate markets can be better guided about when to buy or where to buy a new apartment in the surrounding areas of URT to maximize their social welfare.
The remainder of the paper is structured as follows: Section 2 reviews the literature on the relationship between URT and RPVs in real estate markets. Section 3 describes the details of the data and variables used in the analysis and model specifications. Section 4 reports and discusses the empirical results. Finally, the conclusion is given in Section 5.
2. Literature Review
From a theoretical point of view, Alonso [20] first proposed a single-center model to explain the impacts of urban transport on land rents and the model found that the land rent price decreased as the travel costs measured by travel distance to the city centers. Muth [21] further extended the model by combining the consumer behavior theory proposed by Kelvin and Lancaster [22], and this model treated housing prices as one kind of household consumption. On this basis, Rosen [23] proposed the hedonic price model (HPM), which indicated that the housing price of such consumption could be expressed as a function of the special combination of its characteristics. In theory, the URT might generate two opposite effects: the positive externalities due to the improved accessibility to URT stations and the negative externalities caused by the increased noise and traffic crime [24].
Many scholars have empirically explored the relationship between urban transport (especially URT) and surrounding residential property values by taking the housing prices as the primary variable for the travel cost model [25,26], the hedonic price model (HPM) [1,3,17], and the Linear Expenditure System [27]. HPM based on the ordinary least squares (OLS) is widely used. However, the previous research uses HPM based on the OLS mainly adopts cross-section data, which can only reveal the effects at the spatial level or time level and cannot consider their interaction effects. Therefore, this paper uses panel data and uses OLS for regression to simulate relevant parameters.
However, the relationship between URT and surrounding RPV is still controversial. Most studies found that the URT might generate positive externalities on RPV, represented by the housing price [3,16], while some scholars thought that the impacts of URT on RPV are negative during a certain travel distance due to the increasing problems such as noise, pollution, crowding, public security, and other issues [17,28], and the residents’ willingness to pay for the rent might decrease [29,30]. The positive or negative impact might be influenced by the type of transportation system [14,31], the type of real estate considered [32], and so on. Moreover, the influencing strength of URT is quite different in different spatial or temporal dimensions. The spatial dimension means the accessibility of a certain gated community to the nearest URT station. Usually, the closer a gated community is to the URT station, the better the accessibility is. Commonly, the better accessibility might generate a larger demand of department. The higher the demand of the consumer for the apartment, the higher the housing price is. However, at the same time, the closer the gated community is to a URT station, the greater the impact of noise and congestion brought about by the URT. This may reduce consumer demand for housing and payment prices. The combined effect of the positive (accessibility to a rail transit station) and negative effects (air pollution and noise) constitutes the influence of URT on RPV. As an inverted “U-shape” reflects that housing prices first increase, peak at a certain distance, and then decrease along with the travel distance (the Euclidian distance) to the nearest URT station [33]. The influencing scope of URT on housing prices varies with respect to the different lines and the URT in different cities. Al-Mosaind et al. [34] found that housing prices within 500 m of a station were 10.6% higher than those of other regions by exploring the impacts of the MAX light rail system in Portland two years after it opened. Other scholars reported different influencing scopes, such as 1300 m [35], 1100 m [36], 500–1000 m [19], and 1500 m [33] for Diego County in California, Beijing Metro Line 13, Beijing Metro Line 1, Shanghai Metro Line 1, and Nanjing Metro Line 1 and Line 2, respectively. In addition, the influencing strength differs according to the location of the URT. For example, the URT might generate a larger impact on the land value of the central business district and less impact on the suburbs [37].
In term of the temporal dimensions, it means time periods based on different phases of construction of URT stations, including the planning, construction, and the operating period. Before the opening of rail transit, if consumers have higher expectations of the accessibility of URT, then the demand for an apartment around the URT station is higher, which will push RPVs up. People’s expectations of rail transit will change over time, which can explain why the impact of rail transit on surrounding housing prices will change across temporal dimensions. Henneberry [38] found that the surrounding land values increased more when light rail was in the planning stage (1988) than that under construction (1993), while Nie et al. [18] found that the first phase of the Shenzhen Metro might generate negative impacts on housing prices during the construction period, but positive impacts during the operating period. In addition, some Chinese scholars found that the impact of URT on housing price might be no longer significant after operating for two years [39]. Loomis et al. [40] used the changes in the implicit pricing of transit accessibility during the whole project lifecycle to explore the impacts of URT on housing prices in detail.
Our review of the literature shows that the existing literature regarding the impacts of URT on RPVs, as represented by the average housing prices, is largely based on the case studies of cities in developed countries or megacities in developing countries from either the temporal or the spatial dimension. This means that the variations in the urban transportation variables in the spatial dimension are not taken into consideration. Hence, we hypothesize that the influence of URT on RPVs differs with respect to both the temporal and spatial dimensions. Our panel data set allows for the inclusion of both dimensions in the analysis. Thus, in this paper, we take gated communities as a basic research unit and explore both the spatial impacts considering the travel costs (travel time) to URT stations and the temporal impacts using dummy variables of the years from 2012 to 2016.
3. Model Construction
3.1. Sample Description
Zhengzhou, which is one of the provincial capitals as well as eight national central cities in China, is traditionally located at the intersection of the Beijing-Guangzhou transport corridor and the Longhai-Lanxin transport corridor (between Lianyungang, Jiangsu, and Urumqi, Xinjiang). Benefitting from a good location, Zhengzhou has rapidly developed since the reform and opening in 1978. Under China’s “One Belt, One Road” initiative, Zhengzhou has been transformed into a major logistics and manufacturing hub on the Silk Road Economic Belt between China and Europe. In 2017, the GDP and population of Zhengzhou respectively ranked seventh and tenth among 28 provincial capitals and four municipalities in China, while the average housing price ranked 15th. That is to say, its housing price rank is lower than the ranks in terms of its population and economic growth, thus indicating that there might be room for housing prices to rise.
The development of URT in Zhengzhou could date back to 2001. In 2001, the Urban and Rural Planning Bureau (URPB) of Zhengzhou firstly proposed the idea to build URT in Zhengzhou. In 2009, the National Development and Reform Commission (NDRC) submitted the plans of Zhengzhou Metro Line 1 and Zhengzhou Metro Line 2. The first phase of Line 1 with 20 stations and the total mileage of 26.34 km started to construct in June 2009 and operated in December 2013. Line 2 (the segment between Liuzhuang Station and Nansihuan Station) began to construct in December 2010 and commenced operations in August 2016. In 2017, Line 1 expanded to the west and the east by adding 15.01 km and nine stations. At the same year, the third URT line, named Chengjiao line, was opened in 2017, which started from Nansihuan in Guancheng and ending in Xinzheng International Airport. Until the end of 2017, Zhengzhou had three operating lines with a total mileage of 85.6 km and 59 stations. According to the Zhengzhou Urban Rail Transit Network Planning (2015–2050) revised in 2016, there will be 21 URT lines, including eight lines in the urban areas (Lines 1–8), firve lines in the suburbs (Line 9–13), and eight intercity express lines in 2050. The total mileage of the rail transit in Zhengzhou will reach 945.2 km in 2050. The rapid development of URT in Zhengzhou has raised a fierce debate among users and non-users since its overall profitability is difficult to assess. Additionally, the URT had generated obvious influence on the RPV. Thus, it is significant to explore the relationship between URT and RPV for the policy-makers, users and the operating company of URT in Zhengzhou.
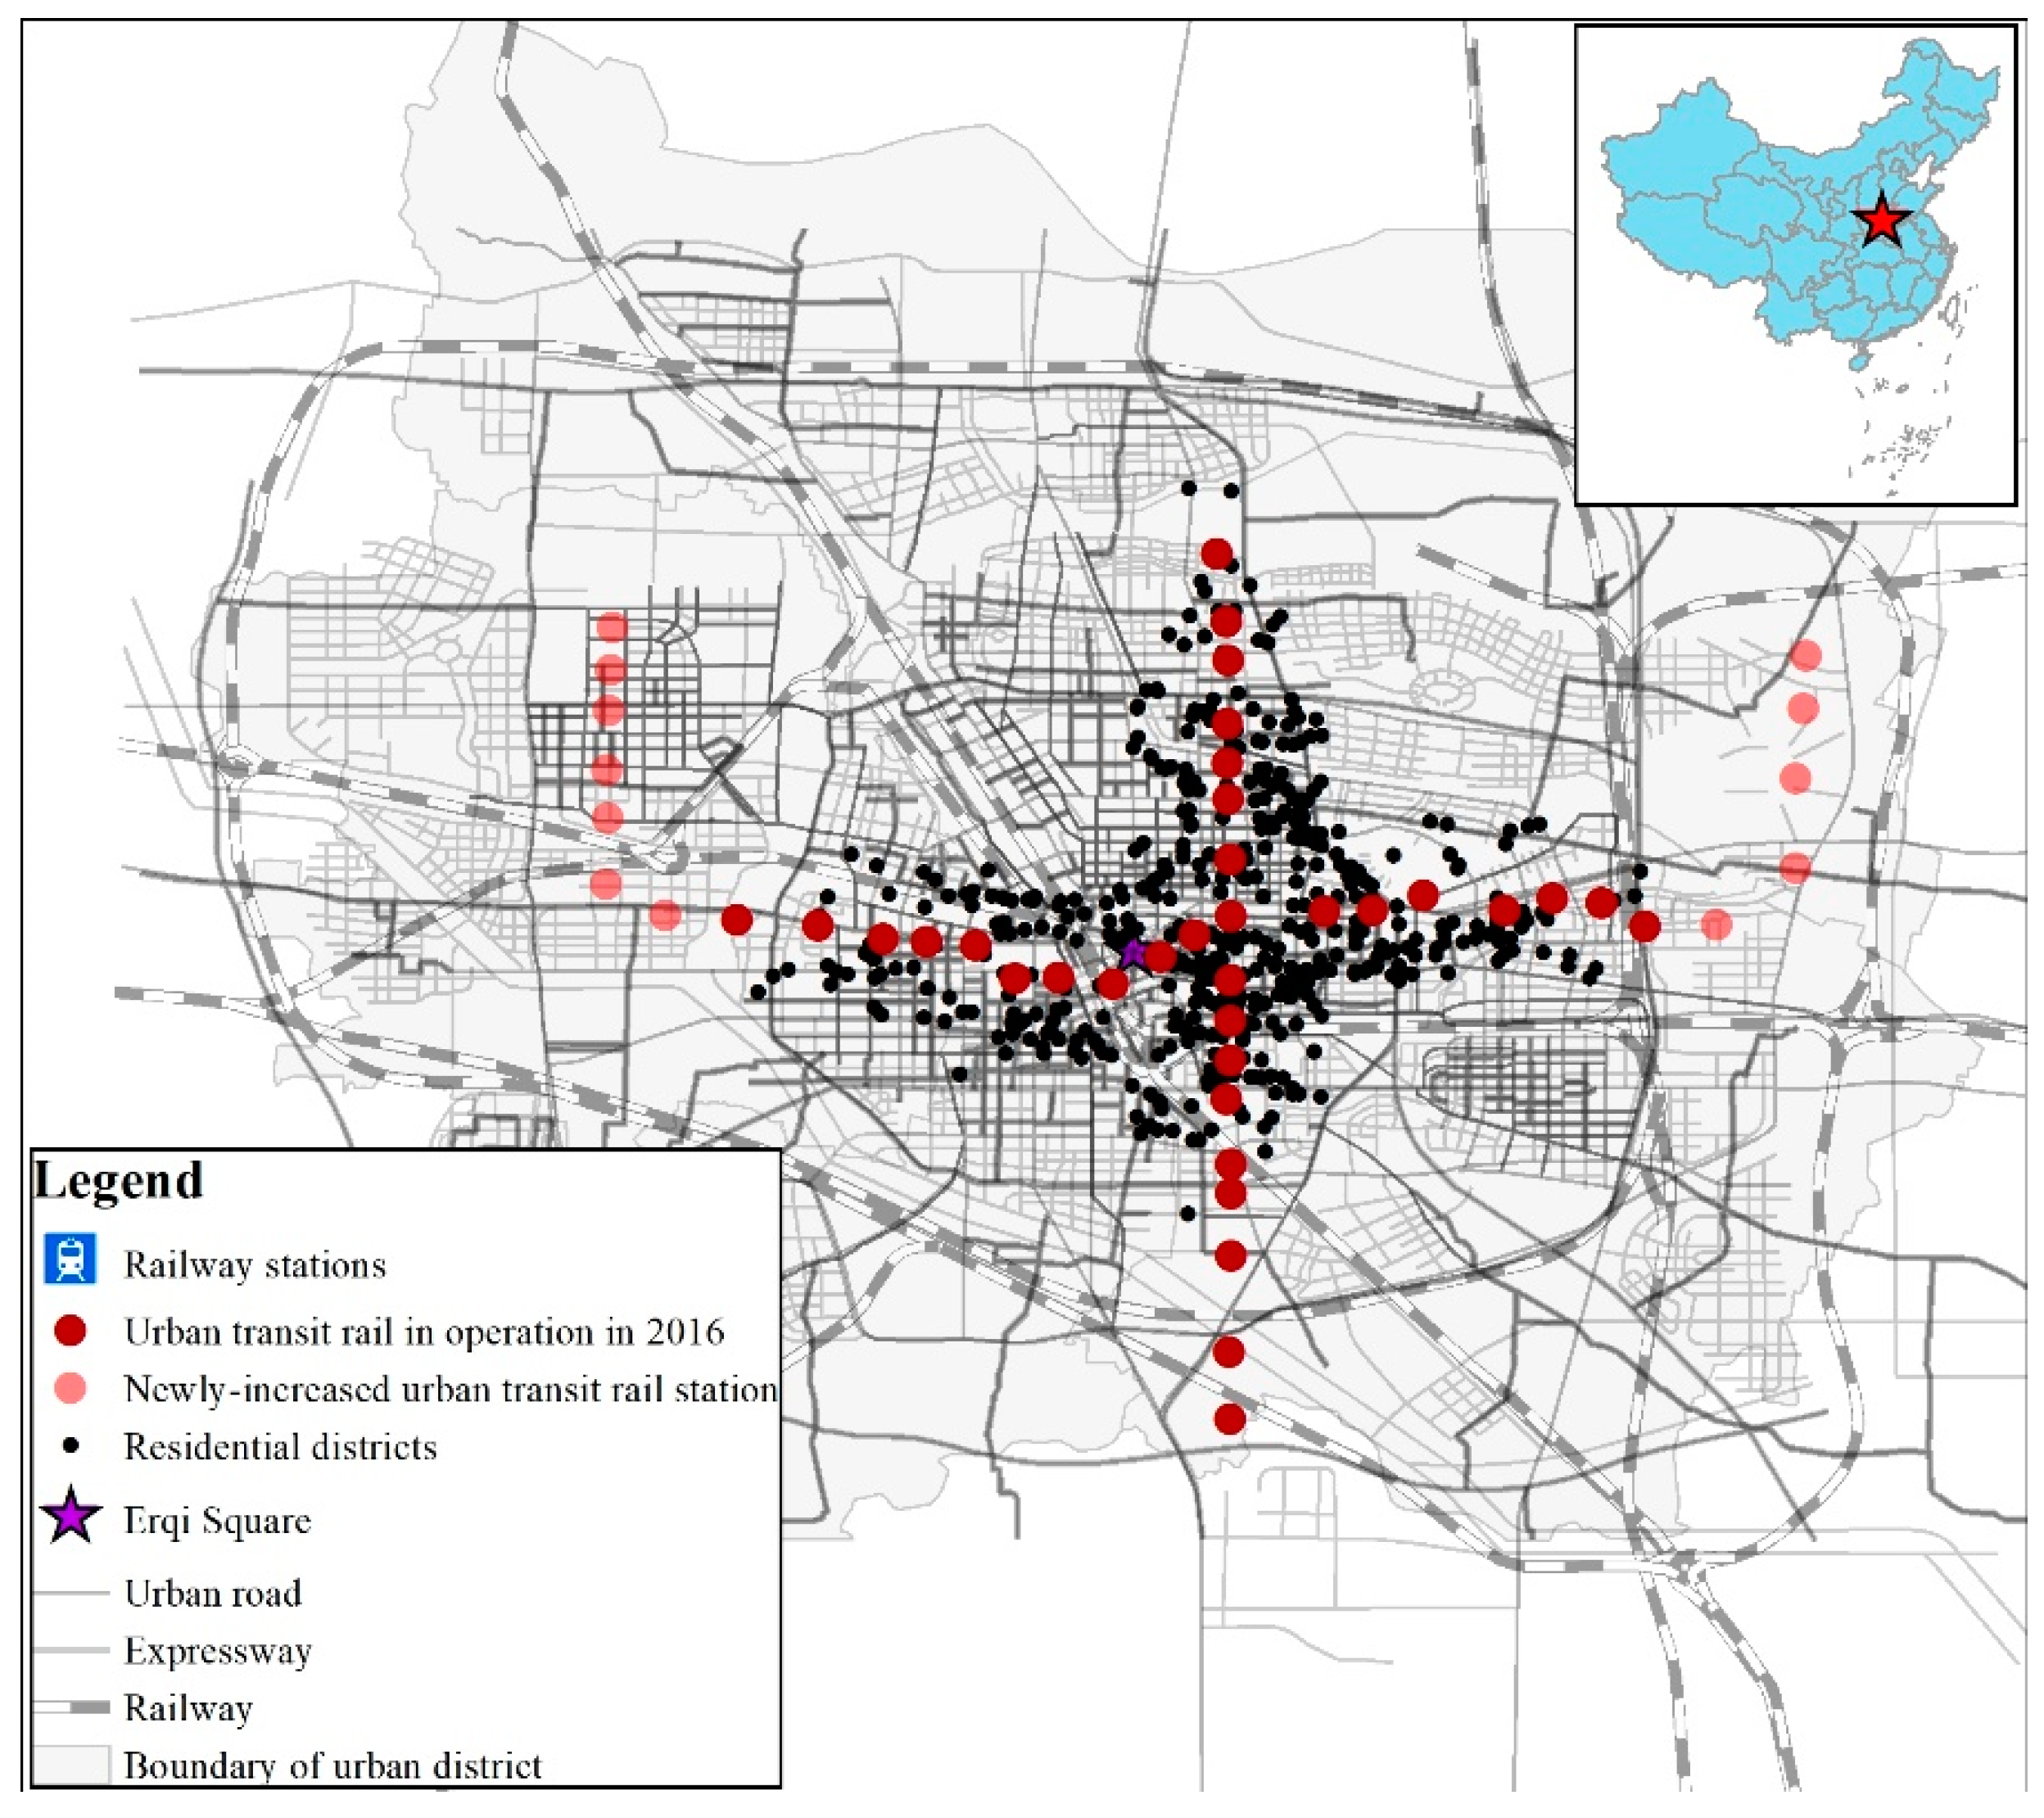
According to the data availability, the first phases of both Line 1 with 20 stations and Line 2 with 22 stations were chosen in this study to explore the impacts of URT on residential property values. Based on previous studies [17,41], a radius of 2 km is set as the influencing scope of URT stations. Thus, 480 gated communities located within a range of 2 km to the 42 transit stations were chosen as the study objects in this study, as shown in Figure 1. A “gated community” is generally located in an urban district and is a residential community or residential area characterized by the enclosed walls and fences. In addition, gated communities strictly control pedestrians, bicycles, and car entrances, and typically include small residential streets and a variety of shared facilities. The apartments in the same gated community are built by one real estate developer who traditionally controls the location and neighborhood characteristics.
The average housing price of each gated community was chosen to reflect the RPV, which was also used by Haizhen Wen [42] and Qingzhi Liu [43]. It is calculated by using the average housing prices of all transaction apartments in it, which is measured using the total transaction prices of all the apartments divided by their total areas. These data can be collected from the Anjuke website. All apartments located in the selected 480 gated communities are ordinary apartments, not luxury apartments or high-end apartments. Table 1 shows the statistical characteristics of the housing prices in the selected gated communities. These gated communities were randomly chosen in different groups with different total numbers of apartments. According to the statistical characteristics of the housing prices in the selected gated communities, the housing prices of about 0.53–0.90 of the apartments in the same gated communities are between the value of the average price minus () and plus the standard deviation (). Additionally, the coefficient of variation (CV, which is the standard deviation divided by the average value) of the housing prices in most gated communities is lower than the coefficient of variation of the average housing price of all gated communities (0.2315). This indicates that the housing prices in one certain gated community are much more concentrated around the average value and the differences among the housing prices in one certain gated community is lower than those between different gated communities. Since there is no gated community that was built after 2013, the average prices per square meter for the second-hand apartments in gated communities were chosen as dependent variables of the model.
In addition, four residential characteristics, namely, URT facilities, construction, neighborhood, and location were used as independent variables. Table 2 lists the variables along with the definition, name, data sources, and symbol for each variable. The details of the four independent variables are as follows.
(1) Regarding the URT facilities, unlike previous studies [16,17], the travel time to the nearest URT stations and the dummy of the travel time were introduced in the model to reflect the accessibility to URT. The first is a continuous variable, while the second is a dummy variable. The travel time to the nearest URT station is collected using web crawler technology, which accounts for both the road distance and walking speed.
(2) The residential property values of a gated community are always related to its physical characteristics itself. Since the basic research object of this paper is gated communities, there is no need to consider factors such as the floor levels (low, medium, and high) and the total number of floors of the apartment blocks. When a consumer purchases an apartment, the technological quality, the environment within the community, etc. are usually considered.
Thus, with regard to the construction characteristic variables, the property fee of the community (fee), the total number of households in a gated community (number), the housing age (age) [17,42], the greening rate (gre) [44,45], and the plot ratio (rate) of the building [46] are taken into account as the control variables in this paper. All of these are continuous variables. It is predicted that the age of the building and the plot ratio both have a negative impact on residential property values, the greening rate might have a positive effect, and there is an unknown relationship between the property fees (fee) and the total numbers of households (number) in the community on the residential property values.
(3) For the variables related to the neighborhood characteristics, the number of supermarkets [47] and banks located within 1000 m of the gated community, the number of bus stations within 500 m, the dummy of whether there are middle schools or primary schools in 1000 m [5,6], and a dummy variable measuring whether there is a park/hospital within 1000 m were introduced in the model. All of these variables are predicted to have positive effects on residential property values.
(4) Regarding the location characteristics, the shortest car travel times to Erqi Square (d_27), the central business district (CBD, d_cbd), and the district government (d_c) are introduced in the model. Here, the CBD in Zhengzhou is located in Zhengzhou New District and is named the Zhengdong CBD. The shortest car travel time was calculated using web crawler technology considering the real travel conditions.
The data for the study comprises two parts: (1) a GIS database including the travel distance and travel time to rail transit station, city central, or the other facilities, obtained from the Baidu Openmap website (http://apistore.baidu.com/astore/shopinfo/579.html); (2) the attributes of gated communities, sourced from the Anjuke website (https://zhengzhou.anjuke.com/), which is a leading second-hand trading platform in China.
3.2. Model and Variable Determination
The hedonic price model defines the residential property in a complex real estate market as a function of its heterogeneous commodity and average housing prices of apartments in one certain gated community [23]. Thus, the HPM is widely used to explore the relationships between the RPVs and the community’s physical and environment attributes [48]. There are four widely used forms of the HPM, including the linear Equation (1), the semilog-linear Equations (2) and (3), and the log-linear Equation (4) [17].
Among these, the linear model (Equation (1)) can only reflect the relationship of the housing price and these characteristics, but not the law of diminishing marginal utility. Equations (3) and (4) quite strictly require that the variables cannot be zero. Compared with Equation (1), Equation (2) can improve heteroscedasticity by reducing the scale of the dependent variable. In comparison with Equations (3) and (4), Equation (2) has no restrictions on whether the variables are zero. Therefore, we chose Equation (2) as the basic equation, and the semilog-linear form of HPM is formulated as follows:
where represents the average housing price of gated community i in year t; represents the travel time from gated community i to the nearest URT station in year t; , , and respectively represents the construction, neighborhood, and location characteristics of gated community i in year t.
The second model is an extension of Equation (1) that distinguishes between various travel distance (travel time) categories. In this model, the travel time to the nearest URT station is replaced by indicators reflecting the access to URT stations, which can be used to estimate the impacts of URT on RPVs with respect to spatial dimensions. For modeling purposes, the access to URT stations is implemented using either the dummies based on the travel time to URT stations (e.g., 0–4 min, 4–8 min, 8–12 min, 12–16 min, and >16 min) or the continuous travel time to the nearest URT.
where D includes the spatial dummies of d1, d2, d3, d4, and d5, as shown in Table 3.
With the third model, we explore the impacts of URT on RPV considering only the variables of the temporal dimensions or both the variables of the spatial and temporal dimensions. In this model, the year dummies (as shown in Table 3) are introduced in the models to explore the impacts from temporal dimensions. The model can be written as
where represents the time dummy of gated community i in year t.
4. Results
4.1. General Impacts
Table 4 shows the regression results using the data in a selected year from 2012 to 2016 at the p = 0.01, 0.05, or 0.1 significance level. In this model, the travel time to the nearest URT is introduced as the dominance of URT. The travel time to the nearest URT station has a negative relationship with RPVs, as reflected by the significantly negative coefficients of “lntd” for the models for 2012–2016. Specifically, the coefficient of “lntd” was −0.007 in 2016, which indicated that when the travel time to the nearest URT station was reduced by 1%, the RPVs around URT stations increased by 0.7%. In addition, after the start of the construction of Line 2, the absolute value of the coefficients of “lntd” gradually decreased from 0.025 in 2013 to 0.020 in 2014, which showed that, at the critical point of construction of URT, it has a greater impact on the surrounding RPVs. Another finding is that the absolute values of the coefficients of “lntd” are −0.025, −0.020, −0033, and −0.007 from 2013 to 2016, respectively. It indicates that the opening of URT has quite a positive influence on RPVs, and will be strongest after two years of operations with the absolute value of the coefficients of “lntd” peaking at 0.033 at the p = 0.01 significance level in 2015, which is different with the result of Gu and Guo (2010) [39], in which the impact of URT on RPVs might not be significant after two years of operations. Finally, the coefficient of “lntd” was −0.035 in 2012, when the URT system in Zhengzhou is just in the early stages of planning and construction. Based on this, we can infer that in cities where URT construction is just in its infancy, consumers tend to have greater expectations of the positive externalities brought by rail transit and are willing to pay more for it.
With respect to the construction characteristic variables, housing age (age) has a significant negative impact on RPVs, and the influence strength of greening rate (gre) is 0.268, while the plot rate (rate), and the total numbers of households of the gated community (number) have no significant influence on the RPVs in 2016. Specifically, the property management fee (fee) has significantly positive impacts on RPVs in 2012–2014, which is similar to the results by Wen (2015) [42]. That may be because the higher property management fee traditionally means better services for the residents. Commonly, the consumers are more inclined to choose the gated community with better services and facilities, which means a higher demand for the apartment in this community and thus higher RPVs. However, the influencing strength presents a fluctuate decreasing trend during 2012–2016, which also reflects the change in preferences of consumers when choosing a community.
With regard to the neighborhood characteristic variables, the number of bus stations (bus) within 500 m of the gated community, the number of supermarkets (spr) within 1000 m of the gated community, the dummy variable reflecting whether or not there is a middle or primary school (edu) within 1000 m of the gated community, and the dummy variable reflecting whether or not there is a top3 hospital (hos) within 1000 m have positive influences on RPVs. Specifically, if there is a supermarket (spr) or a top3 hospital (hos) within 1000 m, the RPV is expected to respectively be 4.5% or 1.9% higher than otherwise (the seventh column). It could be that the consumers in the real estate markets are much more concerned with the community environment and the convenience of consumption. In addition, the number of banks within 1000 m of the gated community has no significant influence on RPVs from 2014 to 2016. This may be because the emergence of mobile payment methods such as Alipay and WeChat Wallet has changed the way people conduct commerce. Interestingly, the influencing strength of education on housing prices peaked at 0.036 in 2014. The reason might be that the Municipal Education Bureau of Zhengzhou simultaneously submitted strategies to reclassify school districts and choose one top school with the best educational resources in each school district, which largely motivated parents to seize the scarce high-quality education resources for their children. The “school district housing” policy in China, which established a special-purpose district that operates local public primary or secondary schools, has a large influence on the RPVs in real estate markets.
Regarding the location characteristic variables, the travel times to the CBD (lnd_cbd) and the district governments (lnd_c) have significant negative impacts on RPVs. The influencing strength of the travel time to the CBD is greater than that of the travel time to the district governments. Specifically, when the travel time to the CBD is increased by 1%, the RPVs fall by 4.4%, which is line with the actual situation in Zhengzhou. In general, the economic and political activities are mainly concentrated around the local governments of each district, which makes the RPVs there relatively higher. As a regional financial center and international central business district, Zhengdong New District, which is the new CBD in Zhengzhou, is becoming a popular choice for consumers in the real estate markets in the last decade. However, the coefficient of the travel time to Erqi Square (lnd_27) is 0.012, indicating that, for each 1% reduction in the travel time to Erqi Square, the RPVs decrease by 1.2%, which is inconsistent with the predicted outcome. Erqi Square is the old CBD that is located near the Zhengzhou Railway Station, which is a well-known congested area in Zhengzhou that might not be a good choice for the younger generation. The quite different influences of Zhengdong New District and Erqi Square on RPVs also reflect the changes of the urban economic pattern in the process of urbanization in China.
4.2. Spatial Differences
To analyze impacts of URT on RPVs with respect to the spatial differences, this section replaces the continuous travel time variable in Table 4 with the travel time dummy variables (d1–d5), which represent the different travel ranges from the gated communities to the nearest URT station (over 16 min as a reference). Table 5 shows the results for the spatial impacts of URT on RPVs regarding the different travel rings from 2012 to 2016. Most of the variables are statistically significant at the 10%, 5%, and 1% levels. All the models in Table 5 have a good fit and a significant F-value.
According to the regression results in Table 5, the influencing strength of URT was the highest and the second highest for the gated communities located within 4 min and 12–16 min travel time, respectively, in 2012, and 2016. Specifically, the coefficient of the dummy variable of travel time was 0.037 within 0–4 min, 0.021 within 4–8 min, 0.022 within 8–12 min, and 0.034 within 12–16 min in 2016, which indicated that the price ratios of RPVs located at different travel distances to the nearest URT station respectively corresponded to 1.0377, 1.0212, 1.0222, and 1.0346. According to the results in Columns 3 and 4 in Table 5, the URT had no significant influence on the RPVs located within 4–8 min of the nearest station in both 2012 and 2013, during which the URT system in Zhengzhou is just in the early stages of planning and construction. Additionally, there is no significant influence of URT for the gated communities located within a 0-4 min travel time in 2014 when URT Line 2 was under construction. This might be because it is inevitable that negative externalities will also occur due to noise, pollution, and congestion during the construction periods of both URT Line 1 and Line 2. Comparing the regression results for the variables of the spatial dummy after the URT Line 1 opened, we found that the RPV located within a 0–4 min travel time increased the most in 2013, which was followed by 2015 and 2016. Specifically, the coefficient of the spatial dummy of 0–4 min travel in 2013 was 0.065, which was 1.75 times that in 2015 and 2016. This indicates that the opening of URT lines had the largest influence on RPVs within a 0–4 min travel time.
4.3. Spatial-Temporal Impacts
Table 6 shows the results for the panel model. According to the results of the Housman test, we cannot reject the null hypothesis at the p = 0.05 significance level that the coefficients that are estimated by the efficient random effects model are the same as the coefficients of the fixed effects model; thus, the random effects model is more appropriate here for the analysis. From the random effects model, the presence of URT lines in Zhengzhou has a positive relationship with the RPVs located around them. According to the results in Column 3 in Table 6, the coefficients of the time dummy showed an increasing trend, from 0.149 in 2013 to 0.427 in 2016. Similar results could be found in Model 3-2 in Column 4 of Table 6 and Model 3-3 in Column 5 of Table 6. According to Model 3-2 in Table 6, in which both the predominance temporal and spatial dimensions were introduced, the travel time to the nearest URT stations also had a negative relationship with RPVs, but the influencing strength for the time dummies in 2013 and 2016 decreased compared with the results of Model 3-1. This indicates that RPVs increased as the travel time to the nearest URT stations decreased and that there was some interaction between the temporal and spatial dimensions. And as shown in Model 3-2 in Table 6, the RPVs were higher for the gated communities located within a 0-4 min travel time than that within the other travel ranges.
5. Conclusion and Policy Implementation
This study explores the impacts of URT on RPVs with respect to both the spatial and temporal dimensions using a panel data set of 480 gated communities in Zhengzhou, which is a second-tier city in China from 2012 to 2016. There are three main conclusions. First, URT does have a positive influence on the surrounding RPV, and the influencing strength presents a “U-shape” along with the increased travel time to the nearest URT station in most of the selected years. Specially, there is quite some interaction between the temporal and spatial dimensions. Second, the influencing strength of URT during its early stages of planning and construction was higher than that during the operation periods, which is quite different from previous research that used first-tier cities such as Beijing in China [36,49]. This may be because consumers in cities that have just entered the stage of rail transit construction often have greater expectations for the positive externalities that the URT can produce. Third, regarding the operation period, the influencing strength reached its peak after two years of the URT line operating, such as in 2015 when the URT Line 1 had been operating for two years.
The results of this study can provide suggestions for policy-makers, real estate developers, and even consumers in real estate markets. For policymakers, first, the central government should accelerate the establishment and improvement of the institutional mechanism and system of URTJD. Second, local governments, especially these second-tier cities that are still in the early stages of rail transit planning and construction, should implement effective dynamic decision-making models that incorporate the land development time, scope, and intensity, which should be consistent with the influence of URT on the surrounding land values (mainly RPVs) across both spatial and temporal dimensions. Specifically, the local government should reserve the suitable land parcels in the early stage of URT planning in order to obtain the maximum added value of the surrounding land. Furthermore, the property that is closely linked to the URT (such as the upper cover development projects) must be simultaneously planned and developed by the rail transit companies in order to capture the value added of the land brought by URT. Meanwhile, when rail transit companies are trying to implement URTJDs, building a supermarket or a mall would be a good choice to improve the land values since it has been proved that a nearby supermarket has the biggest impact on RPVs among the selected neighborhood characteristic variables. (The coefficient of “spr” was 0.045, which means that if there is a supermarket within 1000 m of the gated community, its RPVs will be increased by 4.5%).
With respect to real estate developers, it also provides a reference for them to choose reasonable development time and location, when they try to participate in URTJD. Finally, our research could also provide a reference for consumers in real estate markets about when to buy or where to buy a new apartment in the areas surrounding URT to maximize their social welfare.
Notably, there is still more than one direction in which to enhance this research. In particular, we use the average price of gated communities and not the transaction price of each apartment as the basic research object. In addition, this paper uses the cross-section data and panel data and use OLS regression instead of DID or spatial regression models. In subsequent studies, we will try to collect more housing transaction data in different years and address these limitations, in order to offer more accurate and reliable suggestions on the relationship between URT and real estate markets.
Author Contributions
Data and methodology: D.Z.; writing—original draft preparation and supervision: J.J.
Funding
This research was funded by the National Natural Science Foundation of China (Grant No. 41701126), the Ministry of Education of the People’s Republic China (Grant No. 17YJC790064), and the Social Science Foundation of Beijing (Grant No.17JDYJB008).
Acknowledgments
We gratefully acknowledge the financial support from the National Natural Science Foundation of China (Grant No. 41701126) and the Ministry of Education of the People’s Republic China (Grant No. 17YJC790064), and the Social Science Foundation of Beijing (Grant No.17JDYJB008). The authors are grateful to anonymous reviewers whose comments have helped to improve the manuscript.
Conflicts of Interest
The authors declare no conflict of interest.
References
- Li, G.; Luan, X.; Yang, J. Value capture beyond municipalities: Transit-oriented development and inter-city passenger rail investment in China’s Pearl River Delta. J. Transp. Geogr. 2013, 33, 268–277. [Google Scholar] [CrossRef]
- Hewitt, C.M.; Hewitt, W.E. The effect of proximity to urban rail on housing prices in Ottawa. J. Public Transp. 2012, 15, 43–65. [Google Scholar] [CrossRef]
- Kim, K.; Lahr, M.L. The impact of Hudson-Bergen light rail on residential property appreciation. Papers Reg. Sci. 2013, 93, S79–S97. [Google Scholar] [CrossRef]
- Chatman, D.G.; Tulach, N.K.; Kim, K. Evaluating the economic impacts of light rail by measuring home appreciation: A first look at New Jersey’s River Line. Urban Stud. 2012, 49, 467–487. [Google Scholar] [CrossRef]
- Sheng, L.F. The implementation mode of urban rail based Transit Joint Development—Experiences from United States, Japan and Hong Kong. Appl. Mech. Mater. 2011, 97–98, 1149–1153. [Google Scholar] [CrossRef]
- Su, Y.Y.; Zhu, D.L.; Zheng, Y.Z.; Wang, X.; Chen, G. The effects of subways on housing price gradients between urban area and suburb in southwest Beijing. Resour. Sci. 2015, 37, 125–132. [Google Scholar]
- Wang, Y.N.; Yun, Y.X.; Guo, L.J. Spatial and temporal effect of urban rapid rail transit on real estate value increment: A case study of Tianjin. Urban Transp. 2015, 39, 71–75. [Google Scholar]
- Lin, J.J.; Hwang, C.H. Analysis of property prices before and after the opening of the Taipei subway system. Ann. Reg. Sci. 2004, 38, 687–704. [Google Scholar] [CrossRef]
- Bae, C.H.C.; Jun, M.J.; Park, H. The impact of Seoul’s subway line 5 on residential property values. Transp. Policy 2008, 10, 85–94. [Google Scholar] [CrossRef]
- Yuan, M.D. Research on the Influence of Rail Transit on the Housing Price in Changchun; Jilin University: Changchun, China, 2017. [Google Scholar]
- Jiang, Y.; Ye, X.F.; Wang, Z. Impact area of Shanghai rail transit line 1 on development benefits. Urban Mass Transit 2007, 10, 28–31. [Google Scholar]
- Ryan, S. Property values and transportation facilities: Finding the transportation-land use connection. J. Plan. Lit. 1999, 13, 412–427. [Google Scholar] [CrossRef]
- Webber, M.M. The BART experience-what have we learned? Inst. Urban Reg. Dev. 1976, 12, 76–108. [Google Scholar]
- Efthymiou, D.; Antoniou, C. How do transport infrastructure and policies affect house prices and rents? Evidence from Athens, Greece. Transp. Res. 2013, 52, 1–22. [Google Scholar] [CrossRef]
- Dewees, D.N. The effect of a subway on residential property values in Toronto. J. Urban Econ. 1976, 4, 357–369. [Google Scholar] [CrossRef]
- Pan, Q.; Pan, H.; Zhang, M.; Zhong, B. Effects of rail transit on residential property values Comparison study on the rail transit lines in Houston, Texas, and Shanghai, China. Transp. Res. Board Meet. 2014, 118–127. [Google Scholar] [CrossRef]
- Dai, X.; Bai, X.; Xu, M. The influence of Beijing rail transfer stations on surrounding housing prices. Habitat Int. 2016, 55, 79–88. [Google Scholar] [CrossRef]
- Nie, C.; Wen, H.Z.; Fan, X.F. The spatial and temporal effect on property value increment with the development of urban rapid rail transit: An empirical research. Geogr. Res. 2010, 29, 801–810. [Google Scholar]
- Zhang, W.Y.; Li, H.; Duan, X.J. The impacts of rail transit on property values: The case of No.1 Line in Beijing. Econ. Geogr. 2012, 32, 46–51. [Google Scholar]
- Alonso, W. Location and Land Use; Harvard University Press: Cambridge, MA, USA, 1964. [Google Scholar]
- Muth, R. Cities and Housing; University of Chicago Press: Chicago, IL, USA, 1969. [Google Scholar]
- Lancaster, K.J. A New Approach to Consumer Theory. J. Polit. Econ. 1966, 74, 132–157. [Google Scholar] [CrossRef]
- Rosen, S. Hedonic pricing and implicit markets: Product differentiation in pure competition. J. Polit. Econ. 1974, 82, 34–55. [Google Scholar] [CrossRef]
- Dube, J.; Theriault, M.; Des Rosiers, F. Commuter rail accessibility and house values: The case of the Montreal South Shore, Canada, 1992–2009. Transp. Res. 2013, 54, 49–66. [Google Scholar] [CrossRef]
- Yang, Z.L. Analysis of the Impact of Xi’an Subway on Housing Price; Xi’an University of Architecture and Technology: Xi’an, China, 2013. [Google Scholar]
- Ji, W. Analysis and Prediction of Commodity Housing Prices around Urban Rail Transit; Chengdu University of Technology: Chengdu, China, 2013. [Google Scholar]
- Zhang, J.S. Mathematical Economics-Theory and Applications; Tsinghua University Press: Beijing, China, 1998; pp. 20–68. [Google Scholar]
- Diao, M.; Qin, Y.; Sing, T.F. Negative externalities of rail noise and housing values: Evidence from the cessation of railway operations in Singapore. Real Estate Econ. 2015, 44, 878–917. [Google Scholar] [CrossRef]
- Baldassare, M.; Knight, R.; Swan, S. Urban service and environmental stressor: The impact of the bay area rapid transit system (BART) on residential mobility. Environ. Behav. 1979, 11, 435–450. [Google Scholar] [CrossRef]
- Portnov, B.A.; Bella, G.; Barzilay, B. Investing a timing the effect of train proximity on apartment prices: Haifa, Israel as a case study. J. Real Estate Res. 2009, 31, 371–395. [Google Scholar]
- Ewing, R. Hedonic price effects of pedestrian- and transit-oriented development. J. Plan. Lit. 2011, 26, 18–34. [Google Scholar]
- Duncan, M. Comparing rail transit capitalization benefits for single-family and condominiums units in San Diego, California. Transp. Res. Rec. 2008, 2067, 120–130. [Google Scholar] [CrossRef]
- Kang, L.; Qun, W.U.; Pei, W. Econometric analysis of the impacts of rail transit on property values: The number 1 and 2 lines in Nanjing. Resour. Sci. 2015, 37, 133–141. [Google Scholar]
- Al-Mosaind, M.A.; Dueker, K.J.; Strathman, J.G. Light-rail transit stations and property values: A hedonic price approach. Transp. Res. Rec. 1993, 1400, 90–94. [Google Scholar]
- Duncan, M. The impact of transit-oriented development on housing prices in San Diego, CA. Urban Stud. 2010, 48, 101–127. [Google Scholar] [CrossRef]
- Dan, H.E.; Jin, F.J. An analysis of the spatio-temporal impacts of major infrastructure on real estate prices-take Beijing Metro Line 4 as an Example. J. Beijing Union Univ. 2013, 24, 1171–1180. [Google Scholar]
- Won, J.M.; Son, K.B. Land Price Impact of Subway; Seoul University Capital Region Development Institute Yeongu Non-Chong: Seoul, Korea, 1993; pp. 35–37. [Google Scholar]
- Henneberry, J. Transport investment and house prices. J. Prop. Valuat. Invest. 1998, 16, 144–158. [Google Scholar] [CrossRef]
- Gu, Y.Z.; Guo, R. Effect of rail transit on housing price and land development intensity: A case study of line 13 in Beijing. Econ. Geogr. 2010, 65, 213–223. [Google Scholar]
- Loomis, J.; Santiago, L.; De Jesus, Y.L. Effects of construction and operation phases on residential property prices of the Caribbean’s first modern rail transit system. Urban Public Econ. Rev. 2012, 17, 56–77. [Google Scholar]
- Yanyan, K.; Shuyi, L. Research on Time and Space Effect of Rail Transit on Housing Price—Taking Xiamen Metro Line 1 as an Example. Constr. Econ. 2017, 38, 90–95. [Google Scholar]
- Wen, H.; Tao, Y. Polycentric urban structure and housing price in the transitional China: Evidence from Hangzhou. Habitat Int. 2015, 46, 138–146. [Google Scholar] [CrossRef]
- Liu, Q.Z.; Xie, Y. Special beneficiaries paying for rail transit: Theoretical hypothesis and empirical testing: Taking Wuhan Light Rail Line 1 and Metro Line 2 as examples. J. Cent. South Univ. Natl. 2018, 3803, 138–143. [Google Scholar]
- Li, X.; Wang, H.; Sun, H. Research on urban rail transit effect on land value—A case study of the first phase of Zhengzhou Rail Transit Line 1. Urban Dev. Res. 2014, 9, 21–24. [Google Scholar]
- Li, Y. Research on the influence of urban rail transit on house price along the line based on Characteristic Price Model—Taking Zhengzhou Metro Line 1 as an example. Soc. Sci. 2016, 8, 177–178. [Google Scholar]
- Huang, X. Research on the Spatial Effect of Urban Rail Transit on Residential Price along the Line—Taking Guangzhou Subway as an Example; South China Normal University: Guangdong, China, 2015. [Google Scholar]
- Yan, W. Research on the Impact of Urban Rail Transit on Land Value and Its Return Mode; Chongqing University: Chongqing, China, 2013. [Google Scholar]
- Can, A. Measurement of neighborhood dynamics in urban house prices. Econ. Geogr. 1990, 66, 254–272. [Google Scholar] [CrossRef]
- Sui, X.T. Research on the Impact of Rail Transit Projects on Residential Prices along the Line; Capital University of Economics and Business: Beijing, China, 2016. [Google Scholar]
Figure 1.
Spatial distribution of resale transactions.

Table 1.
Statistical characteristics of the housing prices in a selected gated community.
| Name of Gated Community | Total No. of Households | No. of Selected Households | Max. of Price | Min. of Price | Average (μ) of Price | Medium of Price | Standard Deviation (δ) | |
|---|---|---|---|---|---|---|---|---|
| Hanfei | 3504 | 100 | 17,551 | 11,429 | 13,070.22 | 13,014.5 | 1003.878 | 0.71 |
| Libao | 324 | 44 | 18,391 | 12,931 | 14,892.27 | 14,739.5 | 1184.727 | 0.53 |
| Shanding | 696 | 100 | 21,277 | 14,000 | 17,500.93 | 17,612.0 | 1197.519 | 0.75 |
| Yuhong | 524 | 39 | 13,580 | 12,500 | 13,141.46 | 13,103.0 | 250.765 | 0.67 |
| Fuli | 668 | 100 | 12,444 | 9906 | 11,594.74 | 11,818.0 | 731.210 | 0.72 |
| Jincheng | 260 | 69 | 18,987 | 13,636 | 15,646.33 | 15,227.0 | 1373.840 | 0.77 |
| Zhongheng | 1076 | 100 | 19,040 | 12,174 | 16,003.68 | 16,315.5 | 1331.811 | 0.74 |
| Julongcheng | 996 | 96 | 31,464 | 17,711 | 23,424.39 | 23,641.0 | 2609.190 | 0.81 |
| Junyuecheng | 1999 | 100 | 17,493 | 13,659 | 16,024.41 | 16,294.5 | 939.019 | 0.67 |
| Guangsha | 668 | 39 | 16,667 | 10,000 | 11,875.37 | 11,458.0 | 1504.610 | 0.81 |
| Zijing | 1400 | 100 | 15,823 | 10,256 | 12,509.03 | 12,275.5 | 1063.859 | 0.76 |
| Shengfei | 1289 | 100 | 23,333 | 14,545 | 18,325.06 | 18,142.5 | 1726.370 | 0.73 |
| Weilaicheng | 1965 | 100 | 20,934 | 13,675 | 16,503.94 | 16,438.0 | 1346.223 | 0.70 |
| Xinyuan | 2268 | 100 | 34,848 | 15,411 | 19,063.95 | 17,913.0 | 4043.968 | 0.85 |
| Zijingyangguang | 936 | 100 | 20,253 | 10,480 | 14,314.95 | 14,387.5 | 1647.394 | 0.90 |
Note: is the probability of the housing price of apartments located between the value of the average price minus () and plus the standard deviation ().
Table 2.
Summary and descriptive statistics of residential characteristic variables and expectations.
Table 2.
Summary and descriptive statistics of residential characteristic variables and expectations.
| Variable Name | Unit | Meaning | Data Source | Mean | Median | Maximum | Minimum | Std. Dev. | Sign | |
|---|---|---|---|---|---|---|---|---|---|---|
| Prediction | ||||||||||
| Dependent variable | - | - | - | - | - | - | - | - | - | |
| P | (yuan/m2) | The average housing price of the gated community per year | Anjuke | 11,208.40 | 10,593.75 | 25,959.25 | 5507.08 | 2601.97 | - | |
| Independent variable | - | - | - | - | - | - | - | - | - | |
| Travel time to the URT station | td | minute | The walking time to the nearest URT station | Baidu Openmap | 10.50 | 10.85 | 22.91 | 0.06 | 5.03 | - |
| Construction characteristic variable | fee | (yuan/m2) | property management fee | Anjuke | 0.78 | 0.50 | 3.00 | 0.20 | 0.48 | - |
| number | a | The total numbers of households of a certain community | Anjuke, Fangtianxia | 714.48 | 410.50 | 6146.00 | 14.00 | 856.74 | - | |
| age | year | The housing age: the selected in 2012–2016 minus the actually built years (year) | Anjuke | 12.80 | 13.00 | 27.00 | 3.00 | 5.15 | − | |
| gre | - | Greening rate | Anjuke | 0.32 | 0.32 | 0.60 | 0.10 | 0.07 | + | |
| rate | - | Plot Ratio | Anjuke | 2.45 | 2.10 | 9.24 | 0.80 | 0.98 | − | |
| Location characteristic variable | bus | a | The number of bus stations within 500 m | Anjuke | 8.68 | 8.00 | 20.00 | 1.00 | 3.89 | + |
| d_27 | minute | The car travel time to Erqi Square | Baidu Openmap | 15.71 | 15.04 | 39.57 | 0.28 | 6.80 | − | |
| d_cbd | minute | The car travel time to CBD | Baidu Openmap | 17.80 | 17.24 | 39.20 | 2.00 | 6.84 | − | |
| d_c | minute | The car travel time to the nearest district government | Baidu Openmap | 26.98 | 26.96 | 58.93 | 3.05 | 11.28 | − | |
| Neighborhood characteristic variable | edu | - | Whether or not there are middle schools or primary schools within 1000 m (all 2, one of them 1, otherwise 0) | Anjuke | 0.72 | 1.00 | 2.00 | 0.00 | 0.50 | + |
| hos | - | Whether or not there is top3 hospital within 1000 m (yes 1, otherwise 0) | Anjuke | 0.54 | 1.00 | 1.00 | 0.00 | 0.50 | + | |
| park | - | Whether or not there is park in within 1000 m (yes 1, otherwise 0) | Anjuke | 0.56 | 1.00 | 1.00 | 0.00 | 0.50 | + | |
| bank | a | The number of banks within 1 km | Anjuke | 23.37 | 21.00 | 80.00 | 0.00 | 15.79 | + | |
| spr | a | The number of supermarkets within 1 km | Anjuke | 4.67 | 4.00 | 10.00 | 1.00 | 2.24 | + | |
Note: Anjuke (https://zhengzhou.anjuke.com/) is a leading second-hand trading platform in China. Baidu Openmap (http://apistore.baidu.com/astore/shopinfo/579.html) is the largest open map source.
Table 3.
Variables newly added to study the spatial and temporal impacts.
| Dummy | Characteristic Variable | Time Distance to the Nearest URT Station |
|---|---|---|
| Spatial dummy | 0–4 min (yes 1, otherwise 0) | |
| 4–8 min (yes 1, otherwise 0) | ||
| 8–12 min (yes 1, otherwise 0) | ||
| 12–16 min (yes 1, otherwise 0) | ||
| Over 16min (yes 1, otherwise 0) | ||
| Temporal dummy | Dummy2012 | year 2012 (yes 1, otherwise 0) |
| Dummy 2013 | year 2013 (yes 1, otherwise 0) | |
| Dummy 2014 | year 2014 (yes 1, otherwise 0) | |
| Dummy 2015 | year 2015 (yes 1, otherwise 0) | |
| Dummy 2016 | year 2016 (yes 1, otherwise 0) |
Table 4.
Semi-log-linear model regression results (2012–2016).
| Variable | Name | 2012 | 2013 | 2014 | 2015 | 2016 |
|---|---|---|---|---|---|---|
| C | 9.108 *** | 9.057 *** | 9.044 *** | 9.047 *** | 9.087 *** | |
| Construction characteristic variable | lntd | −0.035 ** | −0.025 *** | −0.020 ** | −0.033 *** | −0.007 ** |
| fee | 0.052 *** | 0.040 *** | 0.038 *** | 0.001 | 0.000 | |
| age | −0.011 ** | −0.002 | 0.000 | −0.001 | −0.002 *** | |
| gre | −0.102 | 0.189 * | 0.126 | 0.280 | 0.268 *** | |
| lnnumber | −0.004 | −0.013 ** | 0.000 | −0.005 | −0.002 | |
| rate | −0.004 | −0.004 | −0.016 ** | −0.007 * | −0.001 | |
| Neighborhood characteristic variable | bus | 0.021 ** | 0.020 *** | 0.017 *** | 0.015 *** | 0.013 *** |
| bank | 0.0003 ** | 0.0005 ** | 0.0003 | 0.0003 | 0.0008 | |
| edu | −0.027 | −0.001 | 0.036 *** | 0.009 | 0.018 ** | |
| park | 0.003 | 0.020 * | 0.006 | 0.005 | 0.006 | |
| spr | 0.021 * | 0.020 ** | 0.025 *** | 0.003 *** | 0.045 *** | |
| hos | 0.024 | 0.022 * | 0.009 | 0.0015 * | 0.019 *** | |
| Location characteristic variable | lnd_27 | −0.040 ** | −0.018 | −0.006 | 0.009 | 0.012 ** |
| lnd_cbd | −0.072 *** | −0.066 *** | −0.005 *** | −0.045 *** | −0.044 *** | |
| lnd_c | −0.001 | −0.003 | −0.018 * | −0.019 ** | −0.024 *** | |
| Statistical indicators | R2 | 0.641 | 0.721 | 0.770 | 0.861 | 0.952 |
| F | 55.148 | 80.019 | 103.58 | 191.778 | 619.720 | |
| P(F) | 0.000 | 0.000 | 0.000 | 0.000 | 0.000 | |
| 2.082 | 2.068 | 2.121 | 2.215 | 2.000 |
Note: ***, **, * denote significance at the 1%, 5%, and 10% levels, respectively.
Table 5.
Semi-log-linear model regression results for the spatial dimensions (2012–2016).
| 2012 | 2013 | 2014 | 2015 | 2016 | ||
|---|---|---|---|---|---|---|
| Model 2 | C | 8.99 | 8.985 | 8.818 | 9.003 | 9.064 |
| d1 | 0.087 ** | 0.065 *** | 0.028 | 0.037 *** | 0.037 *** | |
| d2 | 0.029 | 0.031 | 0.030 ** | 0.033 *** | 0.021 ** | |
| d3 | 0.029 ** | 0.040 ** | 0.045 *** | 0.023 ** | 0.022 *** | |
| d4 | 0.050 ** | 0.034 * | 0.062 *** | 0.044 *** | 0.034 *** | |
| Construction characteristic variable | lnnumber | −0.006 | −0.015 ** | 0.000 | 0.000 | −0.003 |
| fee | 0.054 *** | 0.044 *** | 0.012 | −0.002 | 0.001 | |
| age | −0.010 *** | −0.002 | −0.001 | −0.003 *** | −0.002 *** | |
| gre | −0.116 | 0.162 | 0.234 *** | 0.235 *** | 0.255 *** | |
| rate | −0.004 | −0.005 | −0.002 | −0.004 | −0.002 | |
| Neighborhood characteristic variable | bus | 0.021 *** | 0.020 *** | 0.019 *** | 0.015 *** | 0.013 *** |
| bank | 0.0003 ** | 0.0005 *** | 0.0005 ** | 0.0002 | 0.0008 | |
| edu | −0.020 | 0.002 | 0.025 ** | 0.021 ** | 0.022 *** | |
| park | 0.007 | 0.020 | 0.000 | 0.004 | 0.006 | |
| spr | 0.022 ** | 0.002 *** | 0.046 *** | 0.043 *** | 0.040 *** | |
| hos | 0.025 | 0.016 | 0.018 * | 0.022 *** | 0.018 ** | |
| Location characteristic variable | lnd_27 | −0.044 ** | −0.020 | −0.018 ** | 0.017 ** | 0.011 ** |
| lnd_cbd | −0.077 *** | −0.066 *** | −0.056 *** | −0.060 *** | −0.045 ** | |
| lnd_c | −0.002 | −0.005 | −0.027 *** | −0.026*** | −0.025*** | |
| Statistical indicators | R2 | 0.644 | 0.721 | 0.896 | 0.928 | 0.955 |
| F | 46.427 | 66.214 | 219.905 | 327.991 | 539.442 | |
| P(F) | 0.000 | 0.000 | 0.000 | 0.000 | 0.000 | |
| 2.079 | 2.050 | 1.900 | 1.860 | 1.984 |
Note: ***, **, * denote significance at the1%, 5% and 10% levels, respectively.
Table 6.
Panel model regression results.
| Variable | Name | Model 3-1 | Model 3-2 | Model 3-3 |
|---|---|---|---|---|
| C | 8.805 | 8.640 | 8.595 | |
| Dummy variable | lntd | - | −0.016 *** | - |
| d1 | - | - | 0.048 *** | |
| d2 | - | - | 0.029 *** | |
| d3 | - | - | 0.033 *** | |
| d4 | - | - | 0.031 *** | |
| 2013 | 0.149 *** | 0.147 *** | 0.148 *** | |
| 2014 | 0.235 *** | 0.235 *** | 0.235 *** | |
| 2015 | 0.337 *** | 0.338 *** | 0.337 *** | |
| 2016 | 0.427 *** | 0.426 *** | 0.426 *** | |
| Construction characteristic variable | fee | 0.030 *** | 0.029 ** | 0.031 ** |
| age | −0.003 *** | −0.003 * | −0.003 ** | |
| gre | 0.160 ** | 0.167 ** | 0.156 ** | |
| lnnumber | −0.004 | −0.004 | −0.005 | |
| rate | −0.009 *** | −0.009 *** | −0.009 *** | |
| Neighborhood characteristic variable | bus | 0.019 *** | 0.019 *** | 0.019 *** |
| edu | 0.007 * | 0.005 | 0.008 | |
| bank | 0.0005 ** | 0.0002 * | 0.0003 | |
| park | 0.013 * | 0.013 * | 0.014 * | |
| spr | 0.039 *** | 0.036 *** | 0.036 *** | |
| hos | 0.018 ** | 0.020 ** | 0.017 ** | |
| Location characteristic variable | lnd_27 | −0.025 *** | −0.023 *** | 0.002 *** |
| lnd_cbd | −0.063 | −0.003 | −0.005 | |
| lnd_c | −0.006 | −0.005 | −0.007 | |
| Statistical indicators | R2 | 0.815 | 0.816 | 0.817 |
| P(F) | 0.000 | 0.000 | 0.000 | |
| P(H) | 1.000 | 1.000 | 1.000 |
Note: ***, **, * denote significance at the 1%, 5%, and 10% levels, respectively.
© 2019 by the authors. Licensee MDPI, Basel, Switzerland. This article is an open access article distributed under the terms and conditions of the Creative Commons Attribution (CC BY) license (http://creativecommons.org/licenses/by/4.0/).
Share and Cite
MDPI and ACS Style
Zhang, D.; Jiao, J. How Does Urban Rail Transit Influence Residential Property Values? Evidence from An Emerging Chinese Megacity. Sustainability 2019, 11, 534. https://0-doi-org.brum.beds.ac.uk/10.3390/su11020534
AMA Style
Zhang D, Jiao J. How Does Urban Rail Transit Influence Residential Property Values? Evidence from An Emerging Chinese Megacity. Sustainability. 2019; 11(2):534. https://0-doi-org.brum.beds.ac.uk/10.3390/su11020534
Chicago/Turabian StyleZhang, Dongfang, and Jingjuan Jiao. 2019. "How Does Urban Rail Transit Influence Residential Property Values? Evidence from An Emerging Chinese Megacity" Sustainability 11, no. 2: 534. https://0-doi-org.brum.beds.ac.uk/10.3390/su11020534
Note that from the first issue of 2016, this journal uses article numbers instead of page numbers. See further details here.