Extraction Behaviour and Income Inequalities Resulting from a Common Pool Resource Exploitation


1
Leibniz Centre for Tropical Marine Research (ZMT), 28359 Bremen, Germany
2
African Institute for Mathematical Sciences, 23000 Mbour, Senegal
3
Department of Physics and Earth Sciences, Jacobs University Bremen, 28759 Bremen, Germany
*
Author to whom correspondence should be addressed.
†
Current address: Department of Economics, Swedish University of Agricultural Sciences, 75007 Uppsala, Sweden.
Sustainability 2019, 11(2), 536; https://0-doi-org.brum.beds.ac.uk/10.3390/su11020536
Submission received: 22 November 2018
/
Revised: 10 January 2019
/
Accepted: 14 January 2019
/
Published: 21 January 2019
(This article belongs to the Section Environmental Sustainability and Applications)
Abstract
:Using an experimental approach, we investigate income distribution among heterogeneous subjects exploiting a Common Pool Resource (CPR). The CPR experiments are conducted in continuous time and under different treatments, including combinations of communication and monitoring. While many studies have focused on how real-life income inequality affects cooperation and resource use among groups, here we examine the relationship between individuals’ cooperative traits, harvest inequalities, and institutional arrangements. We found that: (1) When combined with monitoring, communication decreases harvest inequality—that is, harvest is more equally distributed among individuals in all treatments; and (2) the cooperative trait of individuals significantly predicts harvest inequality. The relative proportion of non-cooperators and cooperators (i.e., the cooperative dependency ratio) drives the within-session harvest distribution—as the cooperative dependency ration increases, the income distribution becomes increasingly unequal, leading to a downward spiral of resource overexploitation and scarcity. Finally, our results suggest that harvest and income inequalities are contingent to resource abundance, because under this regime, non-cooperators exert the greatest amount effort—thus leading to resource scarcity and income inequalities.
1. Introduction
People’s livelihood strongly depends on the sustainable use of common pool resources (CPRs), such as fisheries, pastures, forestry, and groundwater [1]. A deep understanding of the driving factors leading to the sustainable use of CPRs is thus of crucial importance for preserving ecosystem services. CPR experiments, consisting of individuals jointly exploiting a shared resource, constitute an important toolbox for understanding the extraction behaviour of resource users. Many of these experiments, conducted on different resources [2,3,4,5,6], have shown that resource extraction is influenced by the users’ cooperative traits and the specified institutional arrangements, such as communication and monitoring [7,8].
For example, by examining the influence of social motivation [9] on how information about others is interpreted in the context of resource extraction dilemmas, Liebrand et al. [10] found that non-cooperators understood these dilemmas as competition for more wealth, and that they were thus motivated to harvest more. Cooperators, instead, tended to view the problem in terms of morality and fairness, and thus restrained from harvesting. Sheldon and McGregor [11] conducted a CPR experiment of timber harvesting by subdividing resource users into two groups. One group contained more individuals exhibiting a strong desire for fame, wealth, and power (extrinsically oriented persons), whereas the other group contained more individuals valuing self-acceptance, intimacy, and community (intrinsically oriented persons). They observed that at a within-group level, extrinsically oriented subjects harvested more than those who were intrinsically oriented in both types of groups. However, a between-group analysis showed that groups with a greater number of extrinsic subjects, on average, profited less than the groups with more intrinsic subjects because the commons of the former were depleted at faster rates. A recent work [12] also showed that subtle differences in group composition can have a great range of outcomes in common pool resource management. These authors found that the presence of rule-breakers induced cooperative decay driven by coordination failure so that mixed-type (rule-breakers and rule-followers) groups were indistinguishable from rule-breaking groups. This highlights the important role that groups of individuals with the same harvesting trait play in CPR management.
Other studies on CPR found that allowing for communication, in the form of face-to-face, non-binding, cheap discussion that is conducted by resource users before they make private decisions, leads to sustainable resource extraction [13,14,15,16,17]. An even stronger and positive effect on resources was found [18,19] when communication was combined with costly punishment. More recent studies [20,21] found that the monitoring and sanctioning of rules is a necessary condition for successful resource management.
Studies addressing the effects of income inequality on resource management showed that institutional or self-governance arrangements, such as face-to-face communication, are constrained by the social distance created from unequal income and real wealth distribution. For example, by conducting field experiments in rural villages in Colombia, where groups of resource users faced the decisions to use the same forest from which they derived both direct (such as firewood) and indirect (such as water quality and biodiversity conservation) benefits, Cardenas [22] found that individual wealth and wealth distance affected cooperation by reducing the effectiveness of face-to-face communication within the groups.
Similarly, Baumgärtner et al. [23] found that willingness for biodiversity conservation is higher under an equal income distribution than it is under an unequal income distribution. Consistently, several other studies showed that reduced income inequality drives collective efforts towards protecting environmental resources [24,25,26,27,28]. Baland and Platteau [29], however, following an earlier hypothesis of Olson [30], pointed out that inequality can actually facilitate the provision of the collective good, with small players free-riding on the contribution of larger players. This apparent inconsistency between the positive effect of inequality postulated by Olson [30] and revived by Baland and Platteau [29] and the negative effects of inequality found by many empirical studies was solved, albeit in a theoretical context, by Dayton-Johnson and Bardhan [31], who showed that the relationship between inequality and resource conservation can be U-shaped, meaning that conservation is possible at very low and very high levels of inequality, while for a middle range of inequality, conservation is not possible.
These past works have focused on the links between income inequality and harvest, especially in relation to how real wealth affects cooperation and resource use. However, less effort has been devoted to investigating the relationships between harvest (and thus income) inequality and pre-determined individuals’ cooperative traits. Traditionally, individual cooperative behaviour has been classified a posteriori by the amount of resources extracted (the more is extracted, the less cooperative individuals are, and vice versa). Therefore, although many institutional arrangements have been proved to promote cooperation when exploiting a shared resource, less attention has been dedicated to the links between individuals’ cooperative traits, group composition in terms of the number of cooperators and non-cooperators, and harvest inequality.
Using CPR experiments, we investigated how individuals’ cooperative trait affects income inequalities in a virtual fishery. The software tools typically utilized for studying common pool resource problems are mostly framed as one-shot (e.g., https://www.moblab.com/) or as discrete time experiments (e.g., http://veconlab.econ.virginia.edu/cp/cp.php), often neglecting that user-resource interaction systems are highly dynamic. Our experiments were conducted in continuous time using a newly developed software [32] called OGUMI (http://www.ogumi.de). OGUMI allows resource users to vary their efforts dynamically because in natural systems, users can react quickly to current changes, both in regard to resource availability and the behaviour of others [33], such as by staying longer at sea or by casting more nets or fishing lines. The experiments are based on treatments combining communication and monitoring.
Conventional laboratory experiments are typically conducted with students, who are often considered as a standard subject pool [34], simply because students are a convenient sample for researchers. Students, some authors have argued [35], are unrepresentative of real situations because they differ systematically from a general population with respect to age, education, and socioeconomic conditions, and thereby may introduce systematic biases in the experiments. However, empirical evidence has shown that non-standard subjects display similar behavioural patterns to resource users and that they are thus appropriate subjects on which to examine human behaviour in relation to public policy design [36,37]. Following this evidence and the recommendations of Harrison and List [34], we undertook here artefactual field experiments where subjects were drawn randomly from the streets. This alternative approach to the use of students provided us with some variability in socio-demographic characteristics, such as age, gender, and income, which allowed us to assemble a more heterogeneous population in terms of time preferences also.
2. Materials and Methods
The experiments were conducted at the Leibniz Centre for Tropical Marine Research in Bremen, Germany, in August 2015 and February 2016. The subjects were recruited through an online platform for small jobs in Bremen. None of the subjects had participated in an economic experiment before. Each subject could participate only once in our experiments. A total of 126 (52 in August and 74 in February) participants, comprising 72 males and 54 females, took part in the experiments anonymously. The average age of the participants was 34. The subjects had different demographic characteristics with respect to age, gender, and income (Table 1). All subjects gave their informed consent for inclusion before they participated in the study. No deception was used, and the experiments were conducted anonymously.
The experiments were conducted with the software OGUMI (http://www.ogumi.de). OGUMI is an open-source application that runs on interconnected mobile Android devices such as tablets, and allows users to: (1) harvest from a dynamically varying resource (mimicking a fishery) and; (2) change their extraction behaviour in real time. Individuals who consented to participate through an online recruitment were invited privately and provided information on the date, time, and venue. The experimental sessions were conducted anonymously and included the following steps: (1) A tablet was given to each participant upon arrival; (2) instructions (Supplementary Materials) were provided and read aloud; (3) a trial experiment was run for about four minutes to familiarize the participants with the software; (4) the CPR experiments were run for ten minutes; (5) an incentivized task (Questionnaire—Type B, in Supplementary Materials) was run to elicit individuals’ distributional preferences, i.e., individuals’ cooperative traits; and (6) participants answered a series of questions (Questionnaire—Type A, in Supplementary Materials), which allowed us to gather demographic information.
2.1. CPR Experiment
Individual participants simultaneously and privately decided on how much to extract from a shared CPR, mimicking a fishery. The level of the resource was updated in real time while participants extracted from the common resource. Changes in resource levels were simulated with the Schaefer’s model [38,39], as follows:
R indicates the level of the resource (fish); t is time; G is the resource gross growth, assumed to follow a logistic function with carrying capacity K and maximum growth rate ; H is the harvest rate, i.e., the amount of fish extracted per time; N is the total number of resource users; E is fishing effort; q is the catchability coefficient, defined as the fraction of the resource fished per unit of effort. This coefficient, therefore, translates one unit of effort (e.g., measured in number of vessels) into one unit of harvest (e.g., measured in the number of fish or kg).
Each participant could decide, independently, on how much fishing effort to exert, and could change this during the experiment. The change in effort level was updated in real-time based on the current resource level. Income was exclusively related to the amount of resource harvested. Experiments were conducted according to two treatments: communication and monitoring. Under the communication treatment, a face-to-face discussion was either allowed as the experiment progressed (WC), or subjects were prohibited from communicating with one another (NC). Under the monitoring treatment, subjects were either given information about the current average group harvest (WM) or not (NM). For all treatments, participants were provided with information on their individual harvest and earnings. We ran three experimental sessions for each treatment. Final payoffs were determined by the individual harvests, which were converted into Euros using a fixed rate. On average, one experimental session, including the three main tasks (Questionnaire—Type A, Questionnaire—Type B, the main CPR experiment) and the time taken for giving the subjects instructions and payments, lasted 30 min. Table 1 summarizes the experimental treatments.
2.2. Incentivized Task for Inferring the Cooperative Traits of Participants
To infer the characteristics of the individuals in relation to cooperation or non-cooperation, we conducted an incentivized task (Questionnaire—Type B, in Supplementary Materials) based on the work by Balafoutas et al. [40]. During this task, participants make ten binary decisions of payoffs between themselves and another randomly and anonymously matched participant. The distributional preference of the respondents emerges from their choice patterns. Distributional preference is the motivation behind decision-making and how one person values his payoff relatively to that of another person. Spiteful individuals always seek relative advantages over others. Inequality-loving subjects seek to maximize their outcomes with little regard for others; efficiency-loving subjects tend to maximize the outcomes for both themselves and others; and inequality-averse subjects minimize differences between outcomes for themselves and others [41].
With this set-up (see Table 2), a benevolent subject will, in the disadvantageous domain, opt for the asymmetric block for the first time in the third choice or earlier, while a malevolent subject will switch later. Likewise, a benevolent subject will, in the advantageous domain, switch to the asymmetric block for the first time in the fourth choice or later, while a malevolent subject will switch earlier or will always favor the asymmetric block.
Participants were then classified as follows: (1) efficiency-loving (EFF), a benevolent decision maker in both domains; (2) inequality-averse (IAV), a malevolent decision-maker in the disadvantageous domain, and benevolent in the advantageous domain; (3) spiteful (SPI), a malevolent decision-maker in both domains; (4) inequality-loving (ILO), a benevolent decision-maker in the disadvantageous domain, and malevolent in the advantageous domain. We defined EFF and IAV as cooperators, and SPI and ILO as non-cooperators.
2.3. Data Analysis
To assess the relative distribution of cooperators versus non-cooperators in each session, we used the cooperative dependency ratio (CDR), i.e., the ratio of non-cooperators to cooperators per session. The CDR was defined within the range CDR , with 0 indicating the absence of non-cooperators, 1 indicating an equal share of cooperators and non-cooperators, and an increasing value between 0 and 1 indicating an increasing number of non-cooperators (but still below the number of cooperators) relative to cooperators. A cooperative dependency ratio (CDR) value higher than 1 indicates an increasingly higher share of non-cooperators until , which indicates a complete absence of cooperators. In our study, all sessions of the treatment had a higher number of cooperators than non-cooperators, and so the CDR values always varied between 0 and 1.
Inequality of harvested resource in each treatment was investigated using the Gini index, which is a form of summary statistics measuring how equitably the resource is distributed in a given population. This index varies between 0, reflecting complete equality (i.e., the resource is evenly distributed among participants within a session) and 1, representing complete inequality (i.e., one person or just a few wield most of the resource). The Gini index is computed from a Lorenz curve, which is a plot of the cumulative proportion of the resource harvested versus the cumulative proportion of each individual over the total number of individuals. The Lorenz curve is characterized by an equidistribution line, which indicates equally distributed harvest levels. The further the Lorenz curve deviates from the equidistribution line, the higher the degree of inequality in harvest among subjects. The Gini index is computed as twice the area between the Lorenz curve and the equidistribution line.
3. Results and Discussion
3.1. Main Results
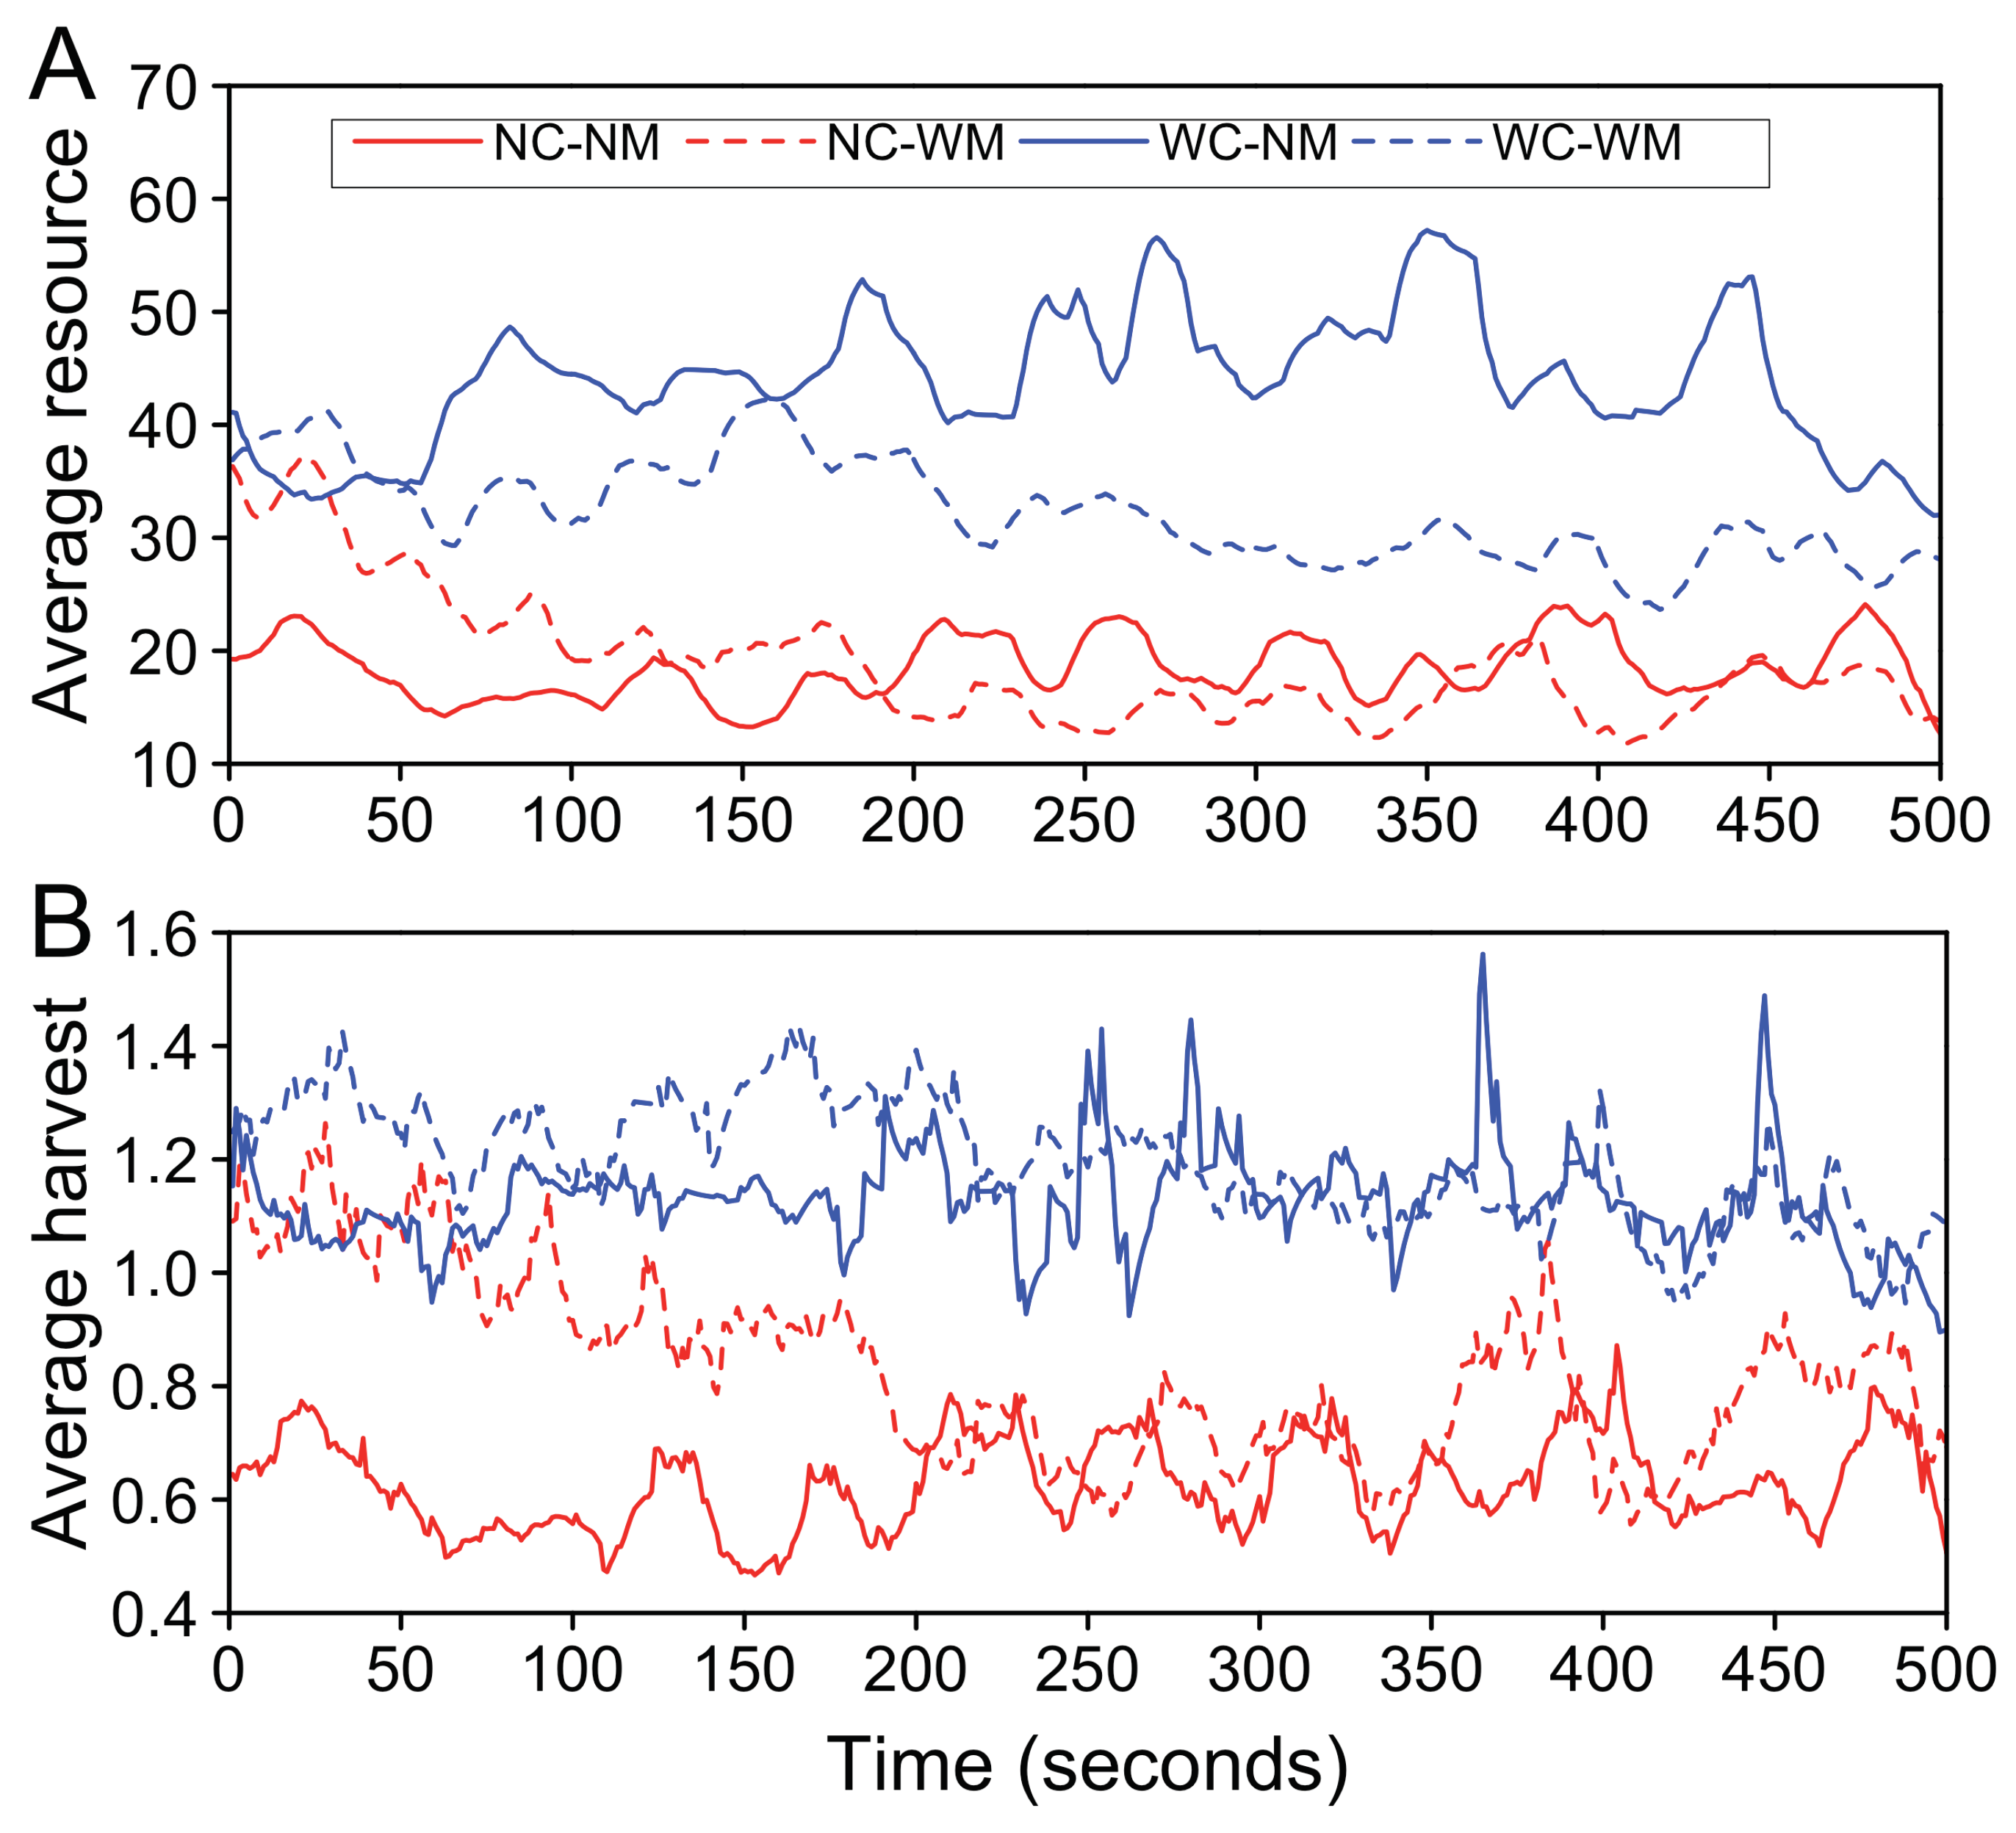
Consistently with most of the experimental evidence on CPRs (see Introduction), our main findings show that communication, with or without monitoring, produces relatively high resource levels (Figure 1A) and income (Table 3).
To investigate the presence of significant interactions between communication and monitoring and resource level and income, we conducted a two-way ANOVA with communication and monitoring as independent variables and resource level and income as dependent variables. The Levene’s test shows that variances in resource level () and income (, ) do not vary across groups. Communication produces significant effects on resource level (, ) and income (). The Bonferroni’s post-hoc test reveals that resource level () and income () are significantly higher in the presence of communication than in the absence of communication. In contrast, monitoring produces non-significant effects on resource levels (, ) and income (, ). We also found a non-significant interaction effect between communication and monitoring on resource level () and income (, ). The complete results of these tests are reported in Tables S1 and S2.
On average, treatments allowing for communication exhibited 30 % higher income levels than those without communication, being and €, respectively. Under non-communication, the average income increased from €, without monitoring, to €, with monitoring (, ). When communication was allowed, the difference between no-monitoring and monitoring is relatively small (), which confirms the importance of monitoring on income when communication is allowed [8,20,21]. An end-game effect on resource levels in the last few seconds of the experiments is also evident (Figure 1A) when users do not see any need in preserving the resource (e.g., [13]).
Recently, Lindahl et al. [42] conducted controlled laboratory experiments in which human subjects were confronted with virtual management situations, similarly to our study. They found that treatments allowing for communication reduced over-exploitation in the early periods of the experiments, because during this stage users were unfamiliar with the resource dynamics. Our experiments show that if monitoring is considered, the results are different. In the first 250 s, monitoring induces higher harvest levels than no monitoring, regardless of whether communication is allowed or not (; (, respectively), Figure 1B. After this period, monitoring does not play a big role anymore (; (Spearman’s ) and the major differences in harvest are produced by allowing or not allowing communication, shown in Figure 1B.
To investigate the effects of communication and monitoring on the Gini index, we performed a two-way ANOVA with communication and monitoring as independent variables and the Gini index as a dependent variable. The Levene’s test suggests that variances in Gini index do not vary across groups (). Both communication () and monitoring () produced significant effects on the Gini index. The Bonferroni’s post-hoc test revealed that the Gini index was significantly lower in the absence of communication than in the presence of communication, . We also found a non-significant interaction effect between communication and monitoring, . The complete results of these tests are reported in Tables S3 and S4.
Moreover, we conducted a partial correlation test for the Gini index (inequality) and income while controlling for the effect of CDR (ratio of non-cooperators to cooperators). The partial correlation between the Gini index and income is , which is different from the correlation when the effect of CDR is not controlled for, . The Gini index accounts for of the variance in income. However, when the effect of CDR is not controlled for, the Gini index shares of the variation in income. Hence, the Gini index alone does not explain the variation in income, but there is a complex relationship between CDR, Gini index, and income.
We also found (Table 3) that: (1) treatments not allowing for monitoring exhibited higher income inequalities; and (2) the fewer the number of non-cooperators, the higher the harvest and income levels. However, the average Gini index decreased by 35.29 % from no monitoring to monitoring () when communication was not allowed, and decreased by 28 % from no monitoring to monitoring () when communication was allowed.
The results summarized above lead to the following observations:
Observation 1:
Treatments that allow monitoring and communication produce higher income/harvest levels than those in which either one or the other is allowed.
Observation 2:
The income distribution derived from the exploitation of the CPR depends not only on the institutional arrangement (e.g., allowing or not allowing communication and/or monitoring), but also on the differences between resource users in terms of cooperative or non-cooperative behaviour.
3.2. Effort Dynamics for Cooperators and Non-Cooperators
Figure 2 shows the temporal dynamics of mean effort levels for cooperators and non-cooperators. When communication is not allowed (Figure 2A,B), both cooperators and non-cooperators exert higher efforts than when communication is allowed (Figure 2C,D). In all treatments, cooperators can be seen to exert, on average, less effort than non-cooperators at every point in time. Moreover, in all treatments, cooperators exhibit more stable effort levels (i.e., smaller degree of variations) than non-cooperators.
In all treatments, effort levels exerted by non-cooperators are consistently higher than those exerted by cooperators (Figure 2). A more interesting finding appears in the treatments that allow for communication. Under no monitoring (Figure 2C), cooperators and non-cooperators maintain similar, closer, and lower effort levels than when under monitoring (Figure 2D).
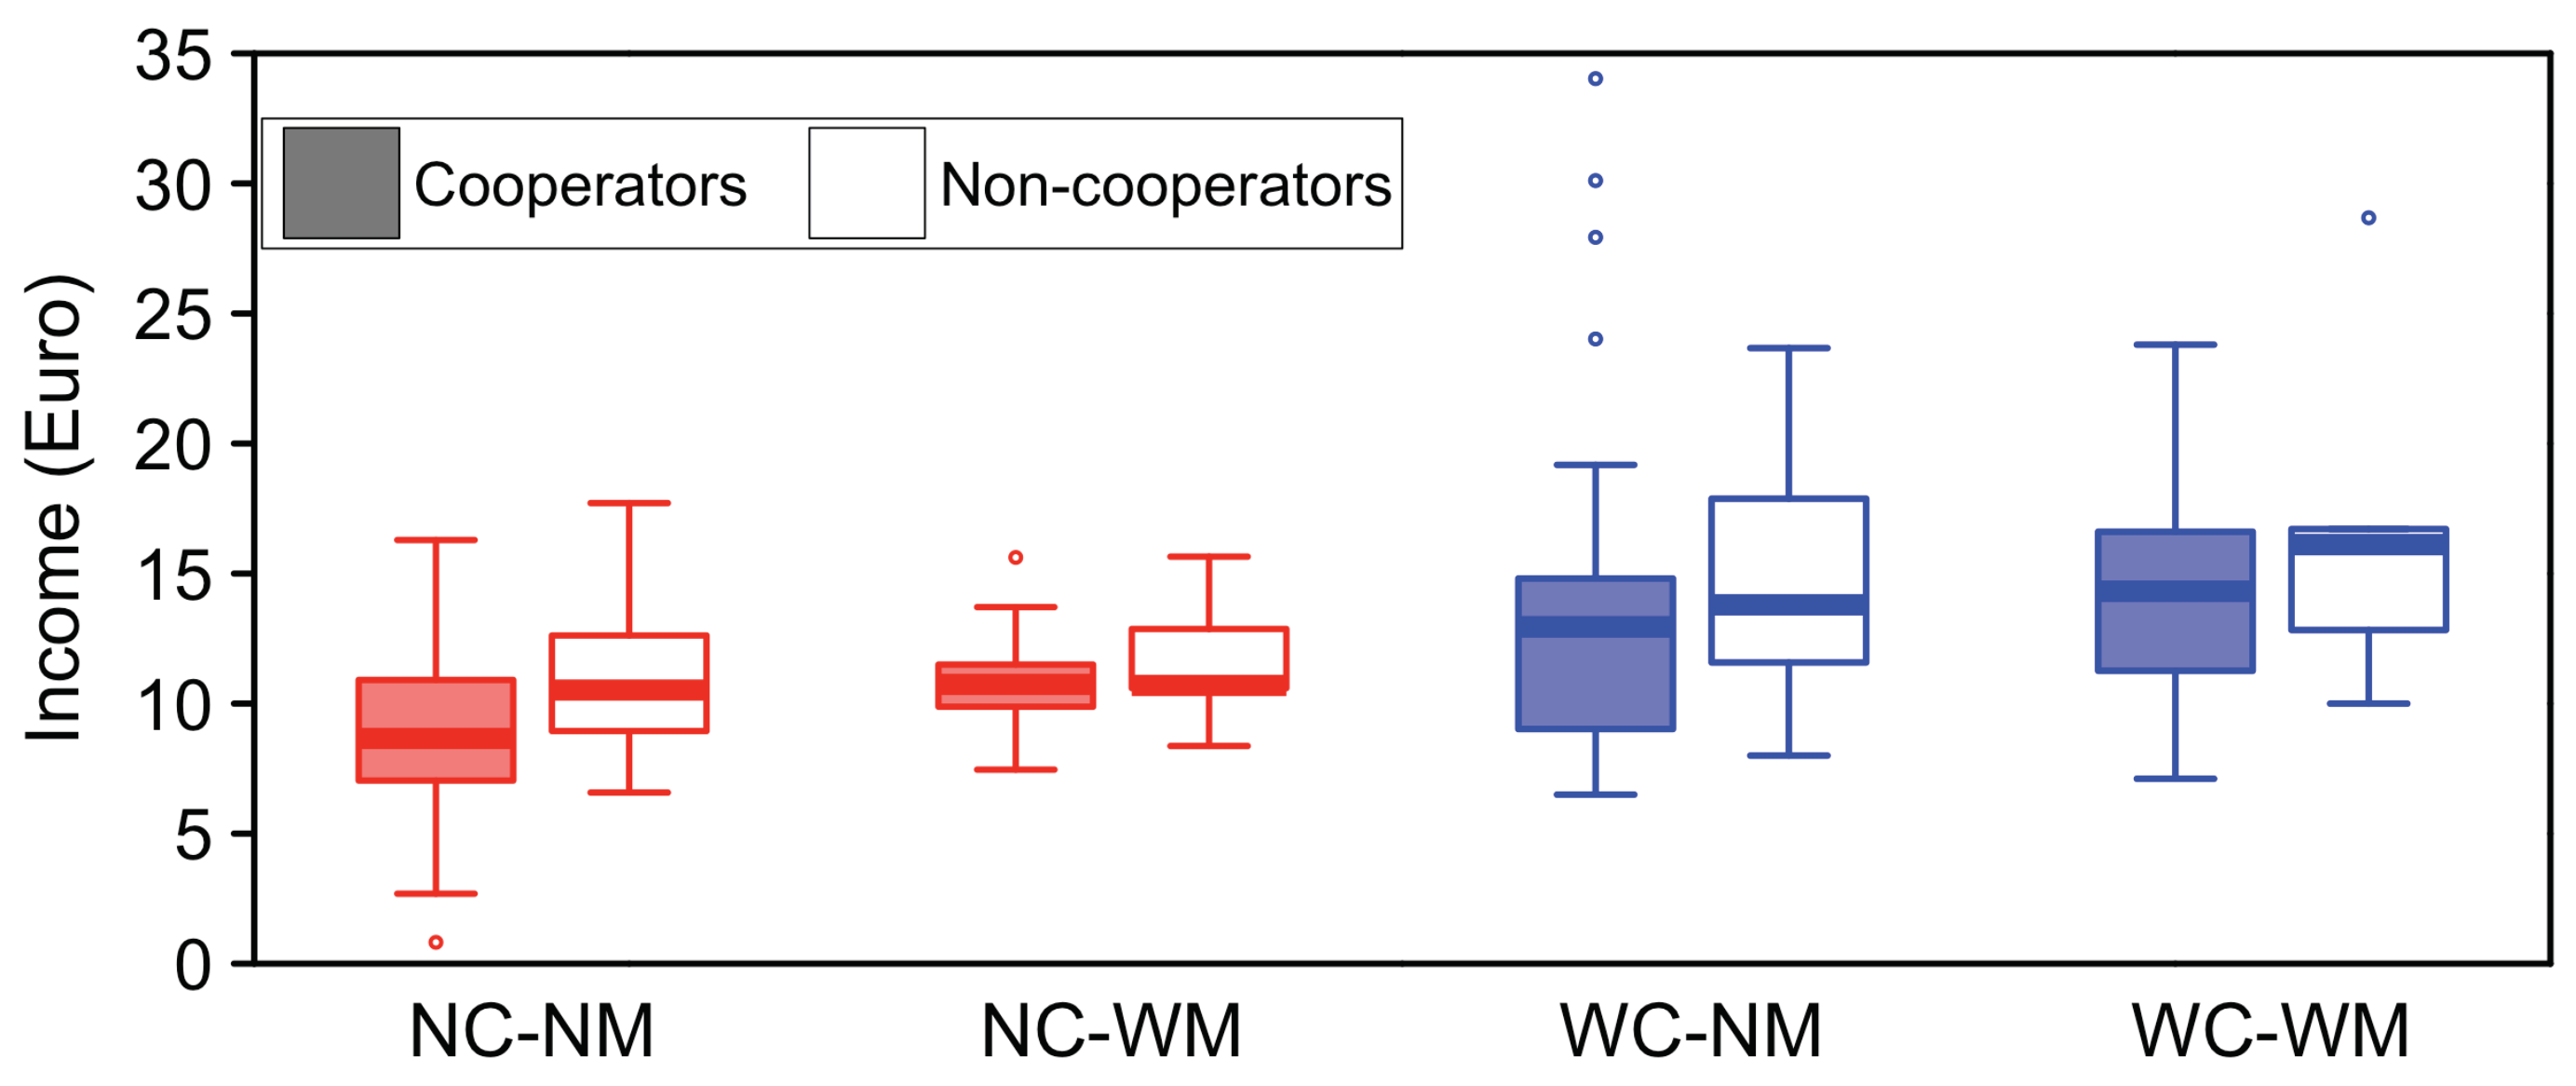
The volatility (i.e., the degree of variation) of the efforts for non-cooperators is higher than that for cooperators, regardless of whether monitoring is allowed or not. High volatility for non-cooperators suggests that they constantly adjust their effort in relation to what all other resource users (cooperators and non-cooperators) do. Low volatility for cooperators suggests that their effort levels are not chosen in relation to what other users (cooperators and non-cooperators) do, because they are motivated by altruistic or other-regarding preferences [43]. However, the strategy of constantly adjusting effort levels proves to be efficient for non-cooperators because it always leads to higher median incomes (Figure 3), although in each treatment the number of non-cooperators is always lower than the number of cooperators (Table 3).
Therefore,
Observation 3:
Communication is the institutional arrangement that maintains, on average, low effort levels and, thus, high resource levels.
Observation 4:
Cooperators are more stable in their harvest decisions than non-cooperators, but non-cooperators earn higher income than cooperators.
The results described above are consistent with several previous studies [44,45,46], showing that individual heterogeneities affect cooperation in social dilemmas. In general, resource extraction is influenced by the user’s cooperative trait. Non-cooperators are motivated to increase income, and thereby respond to changes in resource levels. In contrast, cooperators exert a stable effort over time. Furthermore, allowing for monitoring reduces the uncertainty with respect to the harvest behaviour of others and adds the possibility that communication helps developing efficient harvest strategies.
3.3. Harvest Distribution
So far, we showed that: (1) non-cooperators exert a greater amount of effort than cooperators; and (2) different institutional arrangements result in different average harvest levels (and thus different incomes). But how do these two aspects affect inequalities among individuals?
A session-level Spearman test suggests that higher effort levels correspond to lower Gini values (Spearman’s ). Intuitively, when subjects exert more effort, they extract more of the resource. This continues until the resource is depleted. A depleted resource means no harvest for all users, thus higher effort levels drive the Gini index toward small values. Consistently, we find that resource levels are positively correlated with Gini values (Spearman’s ). Thus,
Observation 5:
Higher resource levels corresponds to higher inequalities.
Moreover, we found that resource levels are negatively correlated to the CDR (Spearman’s ). This can be explained by the fact that cooperators are more altruistic and generous than non-cooperators, as studies that investigated the association between income and generosity and its implications on resource distributions showed (e.g., [47]). In the context of our results, this leads to:
Observation 6:
Inequalities are larger when the ratio of non-cooperators to cooperators is higher.
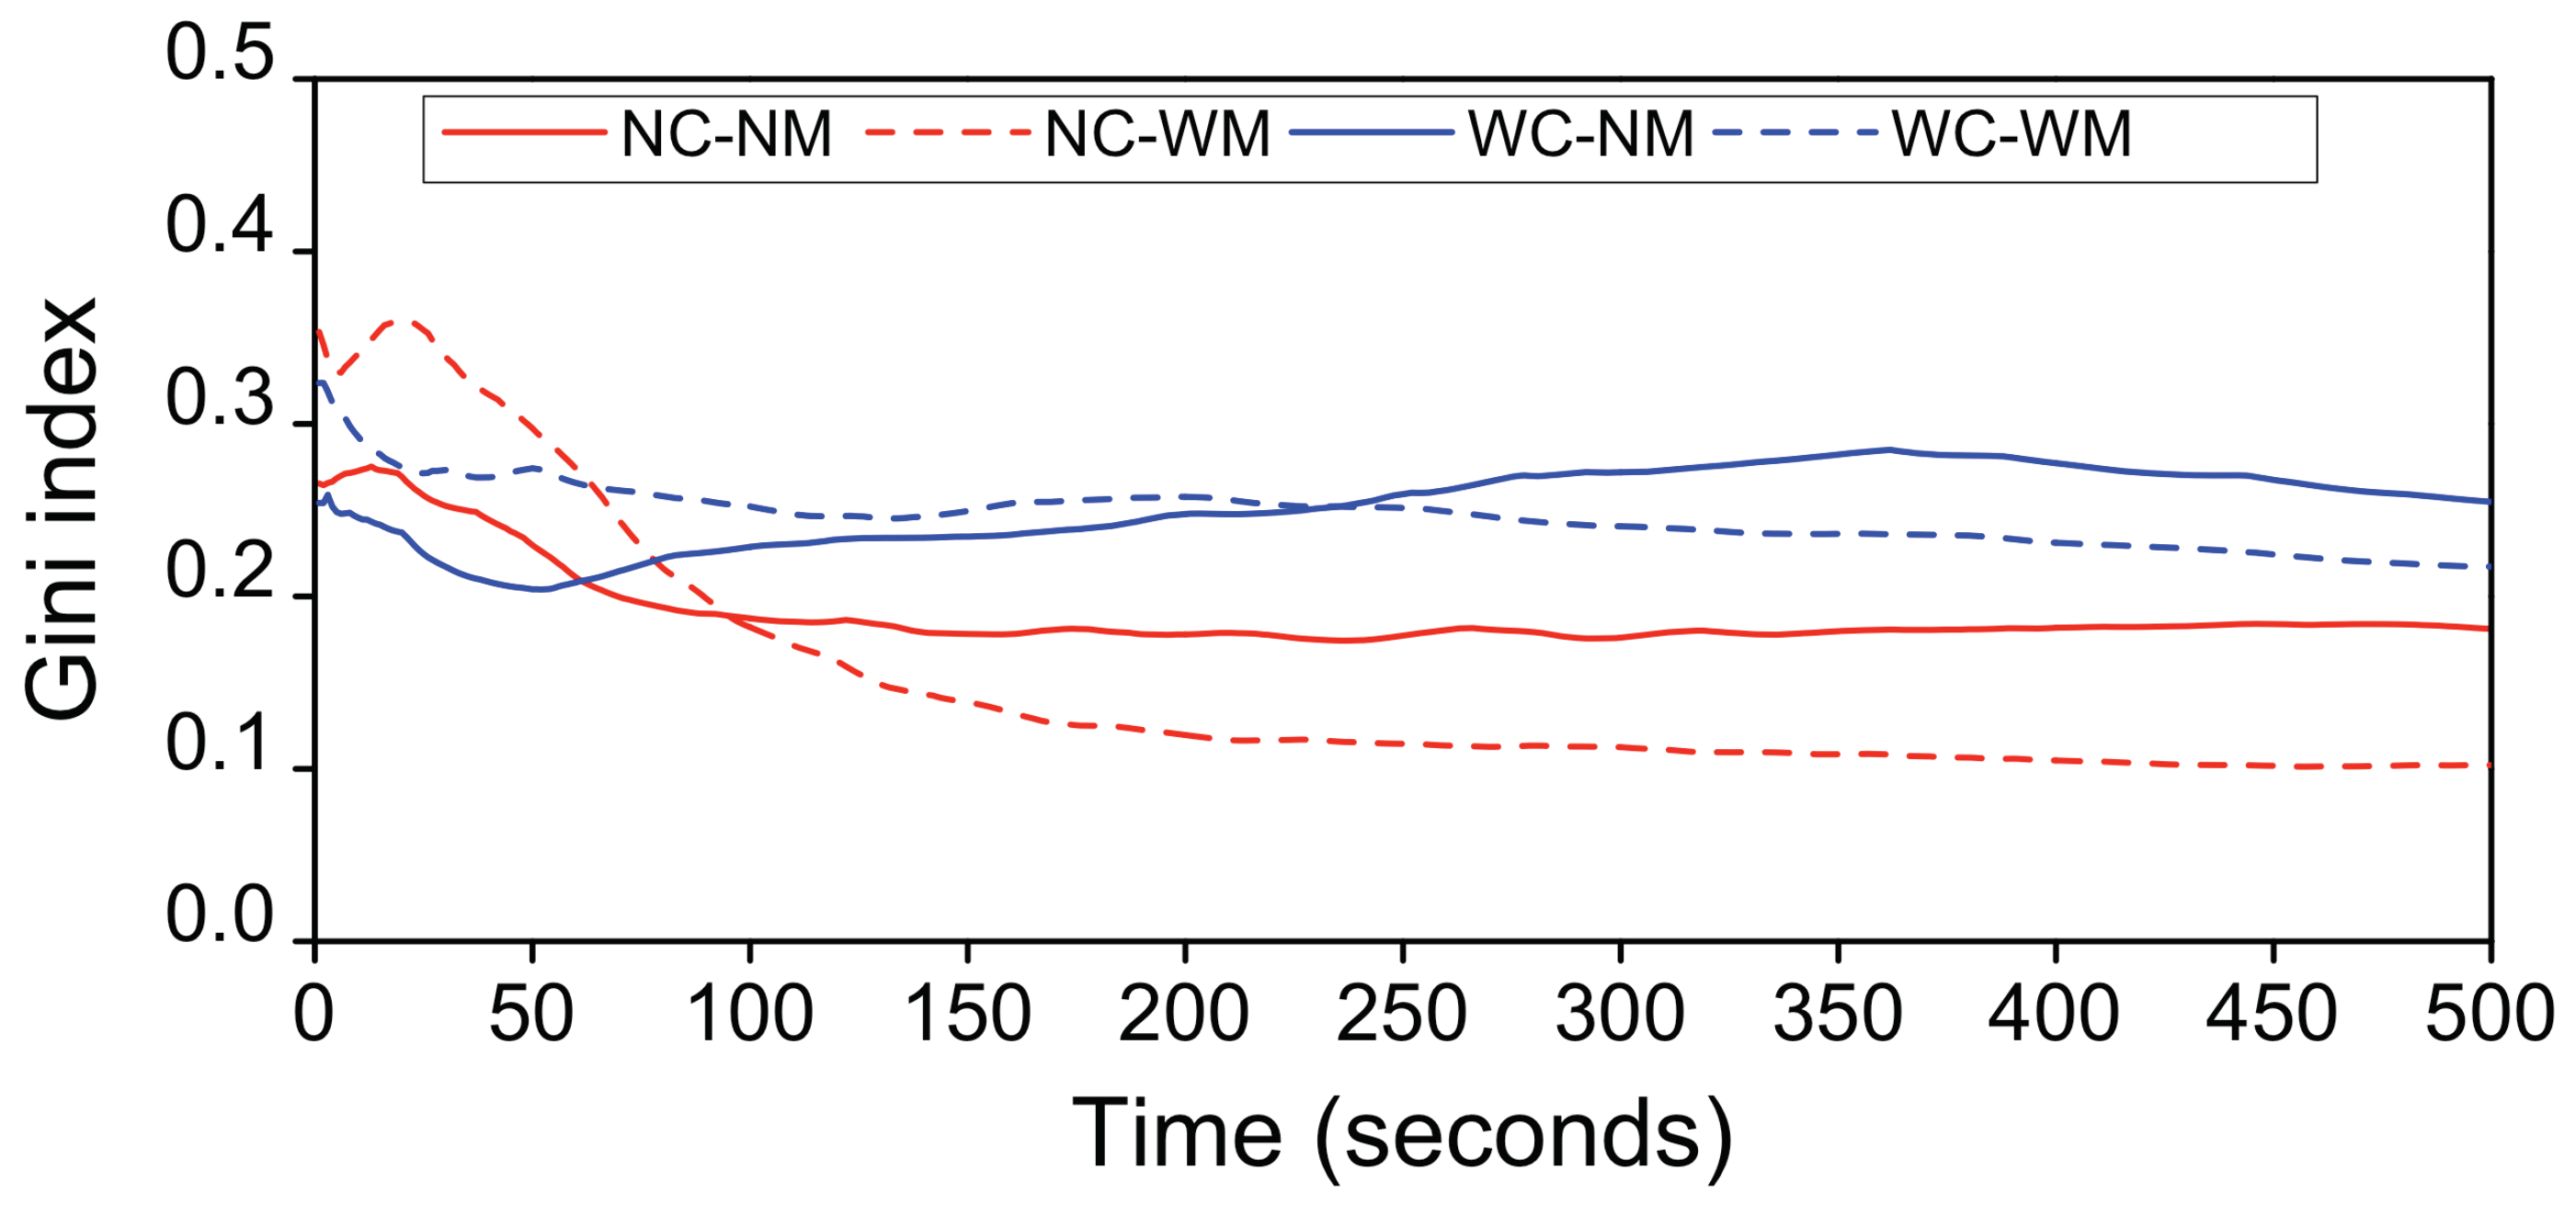
Figure 4 shows how the Gini index changes over time and with respect to different treatments. On average, harvest inequality is lower when communication is not allowed (NC-NM and NC-WM) as compared to when communication is allowed (WC-NM and WC-WM), ). In fact, a greater level of extraction behaviour that characterizes the no-communication treatments, leads to lower resource levels. Therefore, subjects exerting the greatest amount of effort cannot extract as much, which results in lower inequality (low Gini). However, although communication encourages cooperation, not all subjects will cooperate. Therefore, those who do not cooperate when communication is allowed can earn more because other subjects exert modest efforts, thus leading to greater inequality (high Gini).
Chen and Perc [48] showed that abundance of common resources deters social responsibility, suggesting that the key to maintaining common resources at sustainable levels is to adjust maximum harvest levels to allow for resource regeneration. However, our findings show that when the resource is abundant, non-cooperators extract more, thus resulting in income inequality. Under this condition, a downward spiral emerges, because the resources reduce, efforts increase, and the resource keeps reducing until nothing remains for everyone (Figure 2A,B and Figure 4). With communication, cooperators may be influenced by non-cooperators to maintain their efforts at lower levels. However, with monitoring and communication, cooperators can follow in detail whether the non-cooperators will also reduce their efforts (Figure 2C,D and Figure 4). This leads to:
Observation 7:
Communication without monitoring maintains high resource levels but also leads to high inequality, which eventually results in resource depletion.
4. Conclusions
The topic of human cooperation in relation to CPR systems has been widely studied in the last few decades. However, the sensitivity of cooperation to resource users’ heterogeneities has received less attention. Using CPR experiments in continuous time and mimicking a fishery, we examined here how different treatments affect the final distribution of harvests and income among resource users. We found that, when combined with monitoring, communication decreases harvest inequality (i.e., the harvest tends to be more equally distributed). We also found that, on average, the resulting inequality observed in the treatments not allowing for communication is lower than in those treatments allowing for communication.
In a dynamic context, inequality is affected by the individuals’ cooperative traits. We found that, regardless of the institutional arrangement (i.e., whether monitoring and/or communication is allowed or not), non-cooperators harvest more than cooperators. In addition, the relative proportion between non-cooperators and cooperators (i.e., the cooperative dependency ratio) significantly predicts the within-session harvest distribution. We therefore observed that, as the ratio of non-cooperators to cooperators increases, the distribution of income becomes increasingly unequal, leading to a downward spiral of resource overexploitation and resource scarcity.
Supplementary Materials
The following are available online at https://0-www-mdpi-com.brum.beds.ac.uk/2071-1050/11/2/536/s1.
Author Contributions
Conceptualization, A.M. and M.K.; methodology, K.O. and M.K.; formal analysis, K.O.; writing—original draft preparation, K.O.; writing—review and editing, A.M. and M.K.; funding acquisition, A.M.
Funding
This research was funded by the The German Academic Exchange Service, DAAD, grant number 57142704.
Acknowledgments
We are grateful to Gunnar Brandt for the technical assistance provided during the experiments and to Moustapha M. Fall, the Alexander von Humboldt research chair at AIMS Senegal, for his support and discussion on various aspects of this work.
Conflicts of Interest
The authors declare no conflict of interest. The founding sponsors had no role in the design of the study; in the collection, analyses, or interpretation of data; in the writing of the manuscript and in the decision to publish the results.
References
- Ranjan, R. Linking common property resource management to human capital outcomes. Ecol. Econ. 2014, 105, 139–153. [Google Scholar] [CrossRef]
- Gelcich, S.; Guzman, R.; Rodríguez-Sickert, C.; Castilla, J.C.; Cárdenas, J.C. Exploring external validity of common pool resource experiments: insights from artisanal benthic fisheries in Chile. Ecol. Soc. 2013, 18, 2. [Google Scholar] [CrossRef]
- Bluffstone, R.; Dannenberg, A.; Martinsson, P.; Jha, P.; Bista, R. Cooperative Behavior and Common Pool Resources: Experimental Evidence From Community Forest User Groups in Nepal (English); Policy Research Working Paper WPS 7323; World Bank Group: Washington, DC, USA, 2015. [Google Scholar]
- Pham, L.; Otto, I.; Zikos, D. Self-Governance and the Effects of Rules in Irrigation Systems: Evidence from Laboratory and Framed Field Experiments in China, India and Vietnam. Water Econ. Policy 2018. [Google Scholar] [CrossRef]
- Roßner, R.; Zikos, D. The role of homogeneity and heterogeneity among resource users on Water Governance: Lessons learnt from an economic field experiment on irrigation in Uzbekista. Water Econ. Policy 2018, 4, 1850008. [Google Scholar] [CrossRef]
- Sarker, A.; Baldwin, C.; Ross, H. Managing groundwater as a common-pool resource: An Australian case study. Water Policy 2009, 11, 598–614. [Google Scholar] [CrossRef]
- Kramer, R.; Brewer, M. Choice behavior in social dilemmas: Effects of social identity, group size, and decision framing. J. Personal. Soc. Psychol. 1986, 50, 543–549. [Google Scholar]
- Ostrom, E.; Gardner, R.; Walker, J. Rules, Games, and Common-Pool Resources; University of Michigan Press: Ann Arbor, MI, USA, 1994. [Google Scholar]
- McClintock, C.G. Social motivation—A set of propositions. Syst. Res. Behav. Sci. 1972, 17, 438–454. [Google Scholar] [CrossRef]
- Liebrand, W.B.; Jansen, R.W.; Rijken, V.M.; Suhre, C.J. Might over morality: Social values and the perception of other players in experimental games. J. Exp. Soc. Psychol. 1986, 22, 203–215. [Google Scholar] [CrossRef]
- Sheldon, K.M.; McGregor, H.A. Extrinsic value orientation and “the tragedy of the commons”. J. Personal. 2000, 68, 383–411. [Google Scholar] [CrossRef]
- Kimbrough, E.O.; Vostroknutov, A. The social and ecological determinants of common pool resource sustainability. J. Environ. Econ. Manag. 2015, 72, 38–53. [Google Scholar] [CrossRef] [Green Version]
- Janssen, M.A.; Holahan, R.; Lee, A.; Ostrom, E. Lab experiments for the study of social-ecological systems. Science 2010, 328, 613–617. [Google Scholar] [CrossRef] [PubMed]
- Ostrom, E.; Walker, J. Communication in a Commons: Cooperation without External Enforcement. In Contemporary Laboratory Research in Political Economy; Palfrey, T., Ed.; University of Michigan Press: Ann Arbor, MI, USA, 1991; pp. 287–322. [Google Scholar]
- Ostrom, E. The value-added of laboratory experiments for the study of institutions and common-pool resources. J. Econ. Behavior Organ. 2006, 61, 149–163. [Google Scholar] [CrossRef]
- Balliet, D. Communication and cooperation in social dilemmas: A meta-analytic review. J. Confl. Resolut. 2010, 54, 39–57. [Google Scholar] [CrossRef]
- Otto, I.; Wechsung, F. The effects of rules and communication in a behavioral irrigation experiment with power asymmetries carried out in North China. Ecol. Econ. 2014, 99, 10–20. [Google Scholar] [CrossRef]
- Ostrom, E.; Walker, J.; Gardner, R. Covenants with and without a Sword: Self-governance Is Possible. Am. Political Sci. Rev. 1992, 86, 404–417. [Google Scholar] [CrossRef]
- Fehr, E.; Gächter, S. Cooperation and punishment in public goods experiments. Am. Econ. Rev. 2000, 690, 980–994. [Google Scholar] [CrossRef]
- Gibson, C.C.; Williams, J.T.; Ostrom, E. Local enforcement and better forests. World Dev. 2005, 33, 273–284. [Google Scholar] [CrossRef]
- De Melo, G.; Piaggio, M. The perils of peer punishment: Evidence from a common pool resource framed field experiment. Ecol. Econ. 2015, 120, 376–393. [Google Scholar] [CrossRef]
- Cardenas, J.C. Real wealth and experimental cooperation: Experiments in the field lab. J. Dev. Econ. 2003, 70, 263–289. [Google Scholar] [CrossRef]
- Baumgärtner, S.; Drupp, M.; Meya, J.; Munz, J.; Quaas, M. Income inequality and willingness to pay for environmental public goods. J. Environ. Econ. Manag. 2017, 85, 35–61. [Google Scholar] [CrossRef] [Green Version]
- Islam, S.N. Inequality and Environmental Sustainability; DESA Working Paper No. 145, ST/ESA/2015/ DWP/145; Department of Economic and Social Affairs, UN Secretariat: New York, NY, USA, 2015. [Google Scholar]
- Mikkelson, G.M.; Gonzalez, A.; Peterson, G.D. Economic inequality predicts biodiversity loss. PLoS ONE 2007, 2, e444. [Google Scholar] [CrossRef] [PubMed]
- Cardenas, J.C.; Stranlund, J.; Willis, C. Economic inequality and burden-sharing in the provision of local environmental quality. Ecol. Econ. 2002, 40, 379–395. [Google Scholar] [CrossRef] [Green Version]
- Butler, C. Inequality and Sustainability. Ph.D. Thesis, The Australian National University, Canberra, Australia, 2002. [Google Scholar]
- Dorling, D. Social inequality and environmental justice. Environ. Sci. 2010, 19, 9–13. [Google Scholar]
- Baland, J.M.; Platteau, J.P. The ambiguous impact of inequality on local resource management. World Dev. 1999, 27, 773–788. [Google Scholar] [CrossRef]
- Olson, M. The Logic of Collective Action; Harvard University Press: Cambridge, MA, USA, 1965. [Google Scholar]
- Dayton-Johnson, J.; Bardhan, P. Inequality and conservation on the local commons: A theoretical exercise. Econ. J. 2002, 112, 577–602. [Google Scholar] [CrossRef]
- Brandt, G.; Kulesz, M.M.; Nissen, D.; Merico, A. OGUMI: A new mobile application to conduct common-pool resource experiments in continuous time. PLoS ONE 2017, 12, e0178951. [Google Scholar] [CrossRef] [PubMed]
- Bigoni, M.; Casari, M.; Skrzypacz, A.; Spagnolo, G. Time horizon and cooperation in continuous time. Econometrica 2015, 83, 587–616. [Google Scholar] [CrossRef]
- Harrison, G.; List, J. Field Experiments. J. Econ. Lit. 2004, 42, 1009–1055. [Google Scholar] [CrossRef]
- Pelligra, V.; Stanca, L. To give or not to give? Equity, efficiency and altruistic behavior in an artefactual field experiment. J. Socio-Econ. 2013, 46, 1–9. [Google Scholar] [CrossRef]
- Janssen, M.; Anderies, J.; Cardenas, J.C. Head-enders as stationary bandits in asymmetric commons: Comparing irrigation experiments in the laboratory and the field. Ecol. Econ. 2011, 70, 1590–1598. [Google Scholar] [CrossRef]
- Exadaktylos, F.; Espín, A.; Braãs Garza, P. Experimental subjects are not different. Sci. Rep. 2013, 3, 1213. [Google Scholar] [CrossRef] [PubMed]
- Clark, C.W. Mathematical Bioeconomics: The Mathematics of Conservation, 3rd ed.; John Wiley & Sons: Hoboken, NJ, USA, 2010. [Google Scholar]
- Schaefer, M.B. Some aspects of the dynamics of populations important to the management of the commercial marine fisheries. Bull. Math. Biol. 1991, 53, 253–279. [Google Scholar] [CrossRef]
- Balafoutas, L.; Kerschbamer, R.; Sutter, M. Distributional preferences and competitive behavior. J. Econ. Behav. Organ. 2012, 83, 125–135. [Google Scholar] [CrossRef] [PubMed] [Green Version]
- Van Lange, P.A.; De Bruin, E.; Otten, W.; Joireman, J.A. Development of prosocial, individualistic, and competitive orientations: Theory and preliminary evidence. J. Personal. Soc. Psychol. 1997, 73, 733. [Google Scholar] [CrossRef]
- Lindahl, T.; Bodin, Ö.; Tengö, M. Governing complex commons—The role of communication for experimental learning and coordinated management. Ecol. Econ. 2015, 111, 111–120. [Google Scholar] [CrossRef]
- Vélez, M.A.; Stranlund, J.K.; Murphy, J.J. What motivates common pool resource users? Experimental evidence from the field. J. Econ. Behav. Organ. 2009, 7, 485–497. [Google Scholar] [CrossRef]
- Roch, S.G.; Samuelson, C.D. Effects of environmental uncertainty and social value orientation in resource dilemmas. Organ. Behav. Hum. Decis. Process. 1997, 70, 221–235. [Google Scholar] [CrossRef]
- Balliet, D.; Parks, C.; Joireman, J. Social value orientation and cooperation in social dilemmas: A meta-analysis. Group Process. Intergroup Relat. 2009, 12, 533–547. [Google Scholar] [CrossRef]
- Kopelman, S.; Weber, J.M.; Messick, D.M. Factors influencing cooperation in commons dilemmas: A review of experimental psychological research. In The Drama of the Commons; Ostrom, E., Dietz, T., Dols̆ak, N., Stern, P., Stonich, S., Weber, E., Eds.; National Academy Press: Washington, DC, USA, 2002; Chapter 4; pp. 113–156. [Google Scholar]
- Côté, S.; House, J.; Willer, R. High economic inequality leads higher-income individuals to be less generous. Proc. Natl. Acad. Sci. USA 2015, 112, 15838–15843. [Google Scholar] [CrossRef]
- Chen, X.; Perc, M. Excessive Abundance of Common Resources Deters Social Responsibility. Sci. Rep. 2014, 4, 4161. [Google Scholar] [CrossRef]
Figure 1.
Temporal dynamics of average resource (A) and harvest (B) levels under different treatments. NC-NM: no-communication, no-monitoring; NC-WM: no-communication, with-monitoring; WC-NM: with-communication, no-monitoring; and WC-WM: with-communication, with-monitoring.
Figure 1.
Temporal dynamics of average resource (A) and harvest (B) levels under different treatments. NC-NM: no-communication, no-monitoring; NC-WM: no-communication, with-monitoring; WC-NM: with-communication, no-monitoring; and WC-WM: with-communication, with-monitoring.

Figure 2.
Average effort levels for cooperators and non-cooperators and in relation to the different treatments. NC-NM: no-communication, no-monitoring (A); NC-WM: no-communication, with-monitoring (B); WC-NM: with-communication, no-monitoring (C); and WC-WM: with-communication, with-monitoring (D).
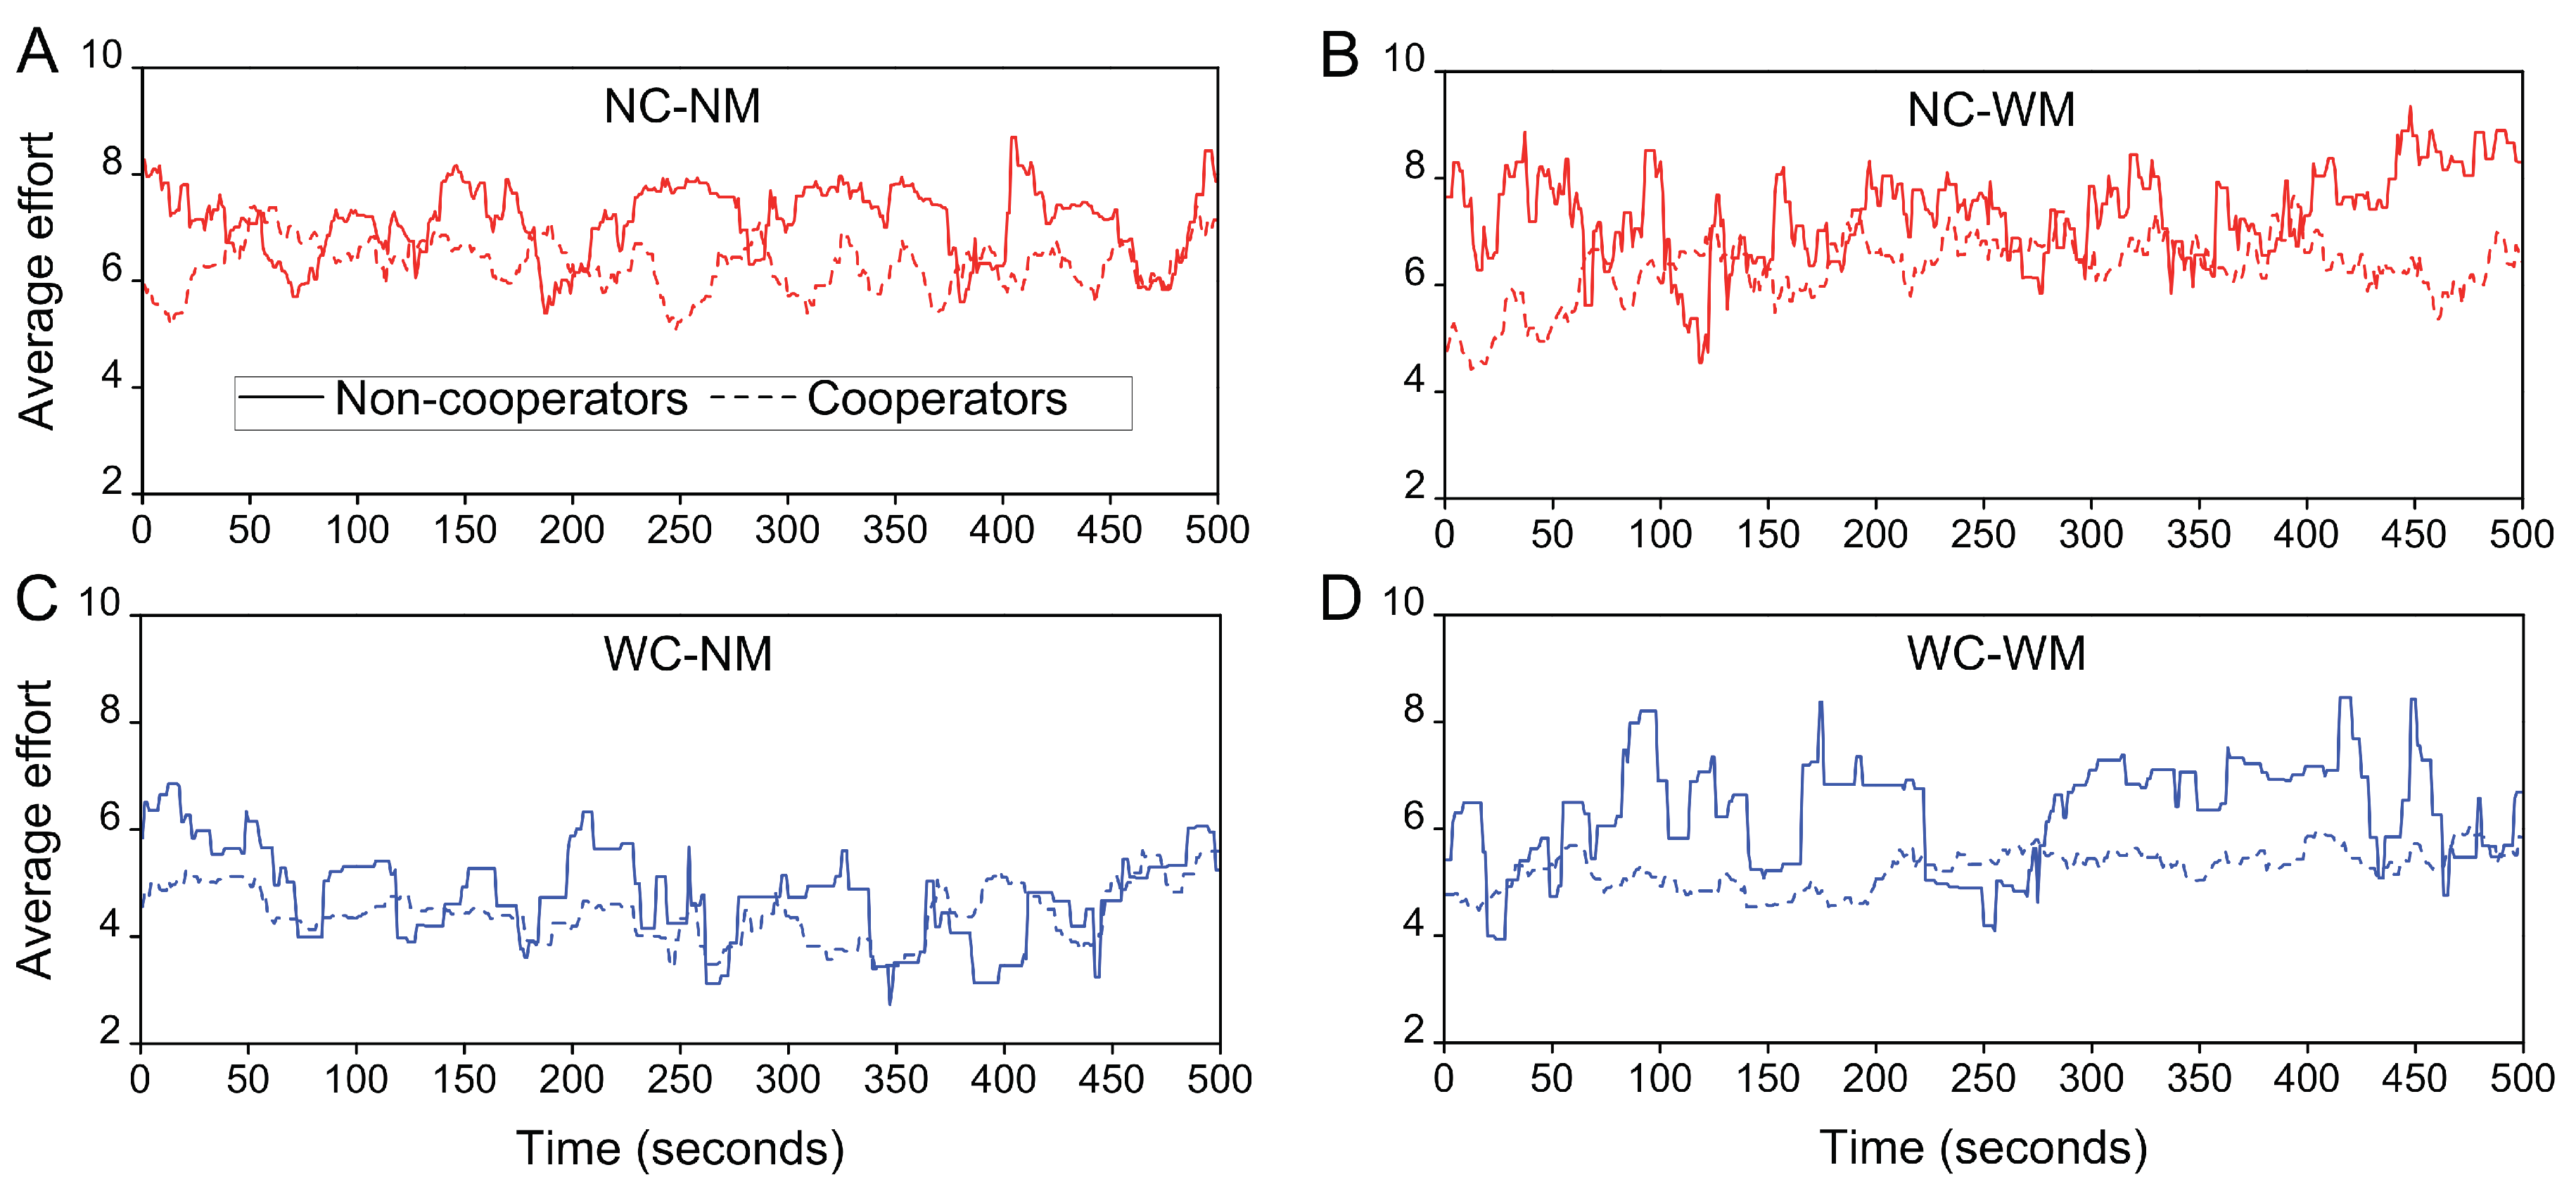
Figure 3.
Income earned by cooperators and non-cooperators in the different treatments. Note that in each treatment, the number of non-cooperators is always lower than the number of cooperators (see Table 3). NC-NM: no-communication, no-monitoring; NC-WM: no-communication, with-monitoring; WC-NM: with-communication, no-monitoring; and WC-WM: with-communication, with-monitoring.

Figure 4.
Gini index as a function of time and in relation to the different treatments. NC-NM: no-communication, no-monitoring, NC-WM: no-communication, with-monitoring; WC-NM: with-communication, no-monitoring; and WC-WM: with-communication, with-monitoring.
Figure 4.
Gini index as a function of time and in relation to the different treatments. NC-NM: no-communication, no-monitoring, NC-WM: no-communication, with-monitoring; WC-NM: with-communication, no-monitoring; and WC-WM: with-communication, with-monitoring.


Table 1.
Common Pool Resource (CPR) treatments and demographic data. The income level in € is composed of items on a seven-point scale: 1 is less than 8,000, 2 is from 8000 to 15,000, 3 is from 15,000 to 20,000, 4 is form 20,000 to 25,000, 5 is from 25,000 to 35,000, 6 is from 35,000 to 50,000, and 7 is above 50,000. Symbols: m = mean, sd = standard deviation, med = median, iqr = interquartile range, max = maximum.
| Treatment | Description | Nr. of Participants | Age (m ± sd) | Gender (Males, Females) | Income (med, iqr, max) |
|---|---|---|---|---|---|
| NC-NM | no communication, no monitoring | 38 | 35 ± 14 | (16, 22) | (1, 1, 7) |
| NC-WM | no communication, with monitoring | 28 | 28 ± 9 | (17, 11) | (1, 1, 5) |
| WC-NM | with communication, no monitoring | 32 | 35 ± 16 | (22, 10) | (1, 1, 6) |
| WC-WM | with communication, with monitoring | 28 | 32 ± 13 | (16, 12) | (2, 1, 5) |
Table 2.
Incentivized Task: For the ten binary choices, decision-makers always have the possibility to decide for either an asymmetric allocation (LEFT) or a symmetric allocation (RIGHT). Payoffs are in Euros.
Table 2.
Incentivized Task: For the ten binary choices, decision-makers always have the possibility to decide for either an asymmetric allocation (LEFT) or a symmetric allocation (RIGHT). Payoffs are in Euros.
| LEFT | RIGHT | ||
|---|---|---|---|
| You | Other | You | Other |
| Disadvantageous domain | |||
| 1.60 | 2.60 | 2.00 | 2.00 |
| 1.80 | 2.60 | 2.00 | 2.00 |
| 2.00 | 2.60 | 2.00 | 2.00 |
| 2.20 | 2.60 | 2.00 | 2.00 |
| 2.40 | 2.60 | 2.00 | 2.00 |
| Advantageous domain | |||
| 1.60 | 1.40 | 2.00 | 2.00 |
| 1.80 | 1.40 | 2.00 | 2.00 |
| 2.00 | 1.40 | 2.00 | 2.00 |
| 2.20 | 1.40 | 2.00 | 2.00 |
| 2.40 | 1.40 | 2.00 | 2.00 |
Table 3.
Descriptive statistics for the four treatments. Presented are the cooperative dependency ratio (CDR), distribution of harvest (Gini index), income, resource level, harvest, effort, and number of non-cooperators (non-coop) and cooperators (coop). Three experimental sessions were run for each treatment. NC-NM: no-communication, no-monitoring; NC-WM: no-communication, with-monitoring; WC-NM: with-communication, no-monitoring; and WC-WM: with-communication, with-monitoring.
| Session | Treatment | CDR | Gini | Income | Resource | Harvest | Effort | (non-coop, coop) |
|---|---|---|---|---|---|---|---|---|
| 1 | NC-NM | 0.27 | 0.14 | 8.52 | 24.01 | 0.51 | 6.62 | (3,11) |
| 2 | NC-NM | 0.80 | 0.18 | 12.27 | 24.27 | 0.95 | 6.31 | (4,5) |
| 3 | NC-NM | 0.50 | 0.20 | 8.84 | 20.01 | 0.49 | 6.68 | (5,10) |
| Average | 0.52 | 0.17 | 9.88 | 22.76 | 0.65 | 6.54 | (12,26) | |
| 1 | NC-WM | 0.38 | 0.09 | 10.13 | 17.06 | 0.59 | 6.83 | (3,8) |
| 2 | NC-WM | 0.43 | 0.10 | 11.20 | 21.35 | 0.77 | 6.61 | (3,7) |
| 3 | NC-WM | 0.17 | 0.12 | 12.14 | 32.43 | 1.18 | 6.13 | (1,6) |
| Average | 0.33 | 0.11 | 11.16 | 23.61 | 0.85 | 6.52 | (7,21) | |
| 1 | WC-NM | 0.11 | 0.19 | 14.53 | 53.32 | 1.21 | 3.84 | (1,9) |
| 2 | WC-NM | 0.50 | 0.27 | 15.88 | 43.58 | 1.27 | 4.73 | (3,6) |
| 3 | WC-NM | 0.30 | 0.28 | 13.44 | 39.53 | 0.86 | 4.93 | (3,10) |
| Average | 0.30 | 0.25 | 14.62 | 45.48 | 1.11 | 4.50 | (7,25) | |
| 1 | WC-WM | 0.00 | 0.11 | 14.49 | 32.51 | 1.45 | 5.67 | (0,7) |
| 2 | WC-WM | 0.33 | 0.22 | 14.32 | 32.23 | 0.86 | 5.66 | (3,9) |
| 3 | WC-WM | 0.29 | 0.22 | 15.67 | 38.53 | 1.27 | 4.98 | (2,7) |
| Average | 0.21 | 0.18 | 14.83 | 34.42 | 1.19 | 5.43 | (5,23) |
© 2019 by the authors. Licensee MDPI, Basel, Switzerland. This article is an open access article distributed under the terms and conditions of the Creative Commons Attribution (CC BY) license (http://creativecommons.org/licenses/by/4.0/).
Share and Cite
MDPI and ACS Style
Owusu, K.A.; Kulesz, M.M.; Merico, A. Extraction Behaviour and Income Inequalities Resulting from a Common Pool Resource Exploitation. Sustainability 2019, 11, 536. https://0-doi-org.brum.beds.ac.uk/10.3390/su11020536
AMA Style
Owusu KA, Kulesz MM, Merico A. Extraction Behaviour and Income Inequalities Resulting from a Common Pool Resource Exploitation. Sustainability. 2019; 11(2):536. https://0-doi-org.brum.beds.ac.uk/10.3390/su11020536
Chicago/Turabian StyleOwusu, Kwabena A., Micaela M. Kulesz, and Agostino Merico. 2019. "Extraction Behaviour and Income Inequalities Resulting from a Common Pool Resource Exploitation" Sustainability 11, no. 2: 536. https://0-doi-org.brum.beds.ac.uk/10.3390/su11020536
Note that from the first issue of 2016, this journal uses article numbers instead of page numbers. See further details here.