Article

Improving Firms’ Performance and Sustainability: The Case of Eco-Innovation in the Agri-Food Industry

by
Adrián Rabadán
1,*,
Ángela González-Moreno
2 and
Francisco J. Sáez-Martínez
2
1
Higher Technical School of Agricultural and Forestry Engineering, University of Castilla-La Mancha, 02071 Albacete, Spain
2
Faculty of Economics and Business Administration, University of Castilla-La Mancha, 02071 Albacete, Spain
*
Author to whom correspondence should be addressed.
Sustainability 2019, 11(20), 5590; https://0-doi-org.brum.beds.ac.uk/10.3390/su11205590
Submission received: 28 August 2019 / Revised: 7 October 2019 / Accepted: 8 October 2019 / Published: 11 October 2019
(This article belongs to the Section Economic and Business Aspects of Sustainability)

Abstract

:
Companies’ environmental responsibility has significantly increased in the last decade. However, the question about the benefits that this responsible decision has on the company’s performance in the market remains. In this scenario, the main goal of this study is to analyze the conditions that improve the performance of companies in the agri-food industry, paying specific attention to technological eco-innovation and different types of cooperation (in the use and in the development of eco-innovations). Our initial sample contains data of agri-food companies operating in Spain. The Qualitative Comparative Analysis (QCA) has been used as a new path for the analysis of firm’s data. Company performance has been considered by using a construct including three variables (increase in the sales, company profitability and cost reduction). Results show that the conditions that largely benefit company performance are R&D spending and the development of technological eco-innovation. Cooperation in the development and use of eco-innovations are especially important for the smaller companies, with the larger companies in the sector relying both in cooperation and in their own resources. The different recipes which improve the performance, as well as the sustainability of the sector, are presented in this study.

1. Introduction

Companies’ environmental responsibility has significantly increased in the last decades [1]. However, research has mainly focused on high-tech industries and on large corporations [2,3] and academic literature on the topic tend to avoid small and medium-sized enterprises with very few exceptions [4,5,6]. Usually, small companies find it difficult to convert green practices into competitive advantages [7] and, hence, are unenthusiastic to include environmental concerns in their management practices [8]. Additionally, there is a lack of research on this topic in traditional sectors such as the agri-food industry that are typically characterized as low-tech with notable exceptions [4,9,10]. For this reason, the question about the benefits that green practices have on performance on companies operating in low-tech sectors such as the agri-food industry remains unclear. Moreover, a recent literature review states that “important issues that have been widely studied in the broader environmental business literature, such as the role of external influences, internal resources/capabilities, the firm’s eco-friendly orientation and financial implications of environmental initiatives, have only been tangentially tackled” (p. 9) [11].
The agri-food industry is considered a traditional industry with low levels of cooperation and limited use of innovation [10]. Food-industry companies are devoted to the processing of raw materials and food supply, and these activities rely heavily on natural resources and territory [12]. As a result, significant direct and indirect environmental effects arise, which leads to a greater necessity to implement sustainable innovations in comparison to other manufacturing industries. By adopting environmental responsible innovations such as reducing water pollution, soil degradation or loss of biodiversity, the agri-food industry can directly contribute to mitigating climate change. Due to the close link of food production and natural resources, the transition to innovation ecosystems should rely on the implementation of more efficient agricultural systems and practices [13]. Likewise, processors and wholesalers in the food chain must try to achieve high levels of efficiency in the use of energy and water to reduce the impacts of their activities on the environment [14].
Companies operating in the agri-food industry have traditionally associated environmental protection with additional costs resulting from compliance with the regulation [15]. As the main responsibility of managers is the maximization of profit [16], environmental concerns would divert companies from their main objective. Hence, companies will only invest in more sustainable activities when investments return [17]. The “Porter hypothesis” [18] is proposed to solve this mismatch by arguing that companies can achieve environmental regulation and improve their competitive advantage at the same time [19,20], leading to a “win-win” situation.
Innovation in the agri-food industry is a complex process that involves different partners and collaborators of the food system. The addition of a new ingredient, the development of a more efficient production process or the implementation of a new method for food preservation are examples of innovations within this industry. Therefore, innovations in the agri-food industry rely in durable relationships with the distribution sector and the acquisition of networking capabilities to develop and introduce innovations [21].
The purpose of this paper is, therefore, to examine the effect of green activities on performance in agri-food companies. Our research questions can be formulated in the following way:
Does the development of technological eco-innovations have an impact on firms’ performance in the agri-food sector?
Which factors related to eco-innovation strategy have an impact on firms’ performance in the agri-food sector?
This paper contributes to the literature in several ways. First of all, there is a lack in the literature of papers that focus on companies on low-tech industries such as the agri-food industry. A distinctive feature in the agri-food industry is the fact that although technological innovation has been found to be critical in agri-food companies, especially for co-operatives [22], the sector has low R&D intensity while producing a significant number of innovations [23].
Additionally, several instruments have been used in the literature to measure eco-innovation using input measures, direct output and indirect impact [24]. However, most previous research is based on existing databases, such as CIS (Community Innovation Survey), which are not confined to specific green knowledge and environmental innovation achievements. In contrast, we develop an ad hoc questionnaire specifically focused on the improvement of the company’s environmental performance on its economic performance. Moreover, it lets us analyze the influence of cooperative interactions.
Finally, our empirical approach, by means of Qualitative Comparative Analysis (QCA) is suitable for research with small data samples, yet it allows for the generalization of the results, conclusions and implications.
The structure of the paper is as follows. In the next section, we present the theoretical background and literature review, which are followed by the explanation of the sample and methods. Then, we show the results of our empirical analysis and we finish with the conclusions, limitations, implications and future lines of research.

2. Theoretical Framework

Three different terms are often used interchangeably in the literature to describe innovations that reduce the negative impact on the environment: “green-”, “eco-”, and “environmental” innovations [1]. Eco-innovation can be defined as “the production, assimilation or exploitation of a product, production process, service or management or business method that is novel to the organization (developing or adopting it) and which results, throughout its life cycle, in a reduction of environmental risk, pollution and other negative impacts of resources use (including energy use) compared to relevant alternatives” (p. 8) [25]. Based on this definition and the Oslo Manual [26], we can distinguish between technological and non-technological eco-innovation. The former refers to eco-products and eco-production processes, including services. The later refers to those management, marketing or business methods that reduce the negative environmental impacts of the company’s activities.
Companies face growing pressure to become greener and companies try to cope with this pressure while staying competitive [
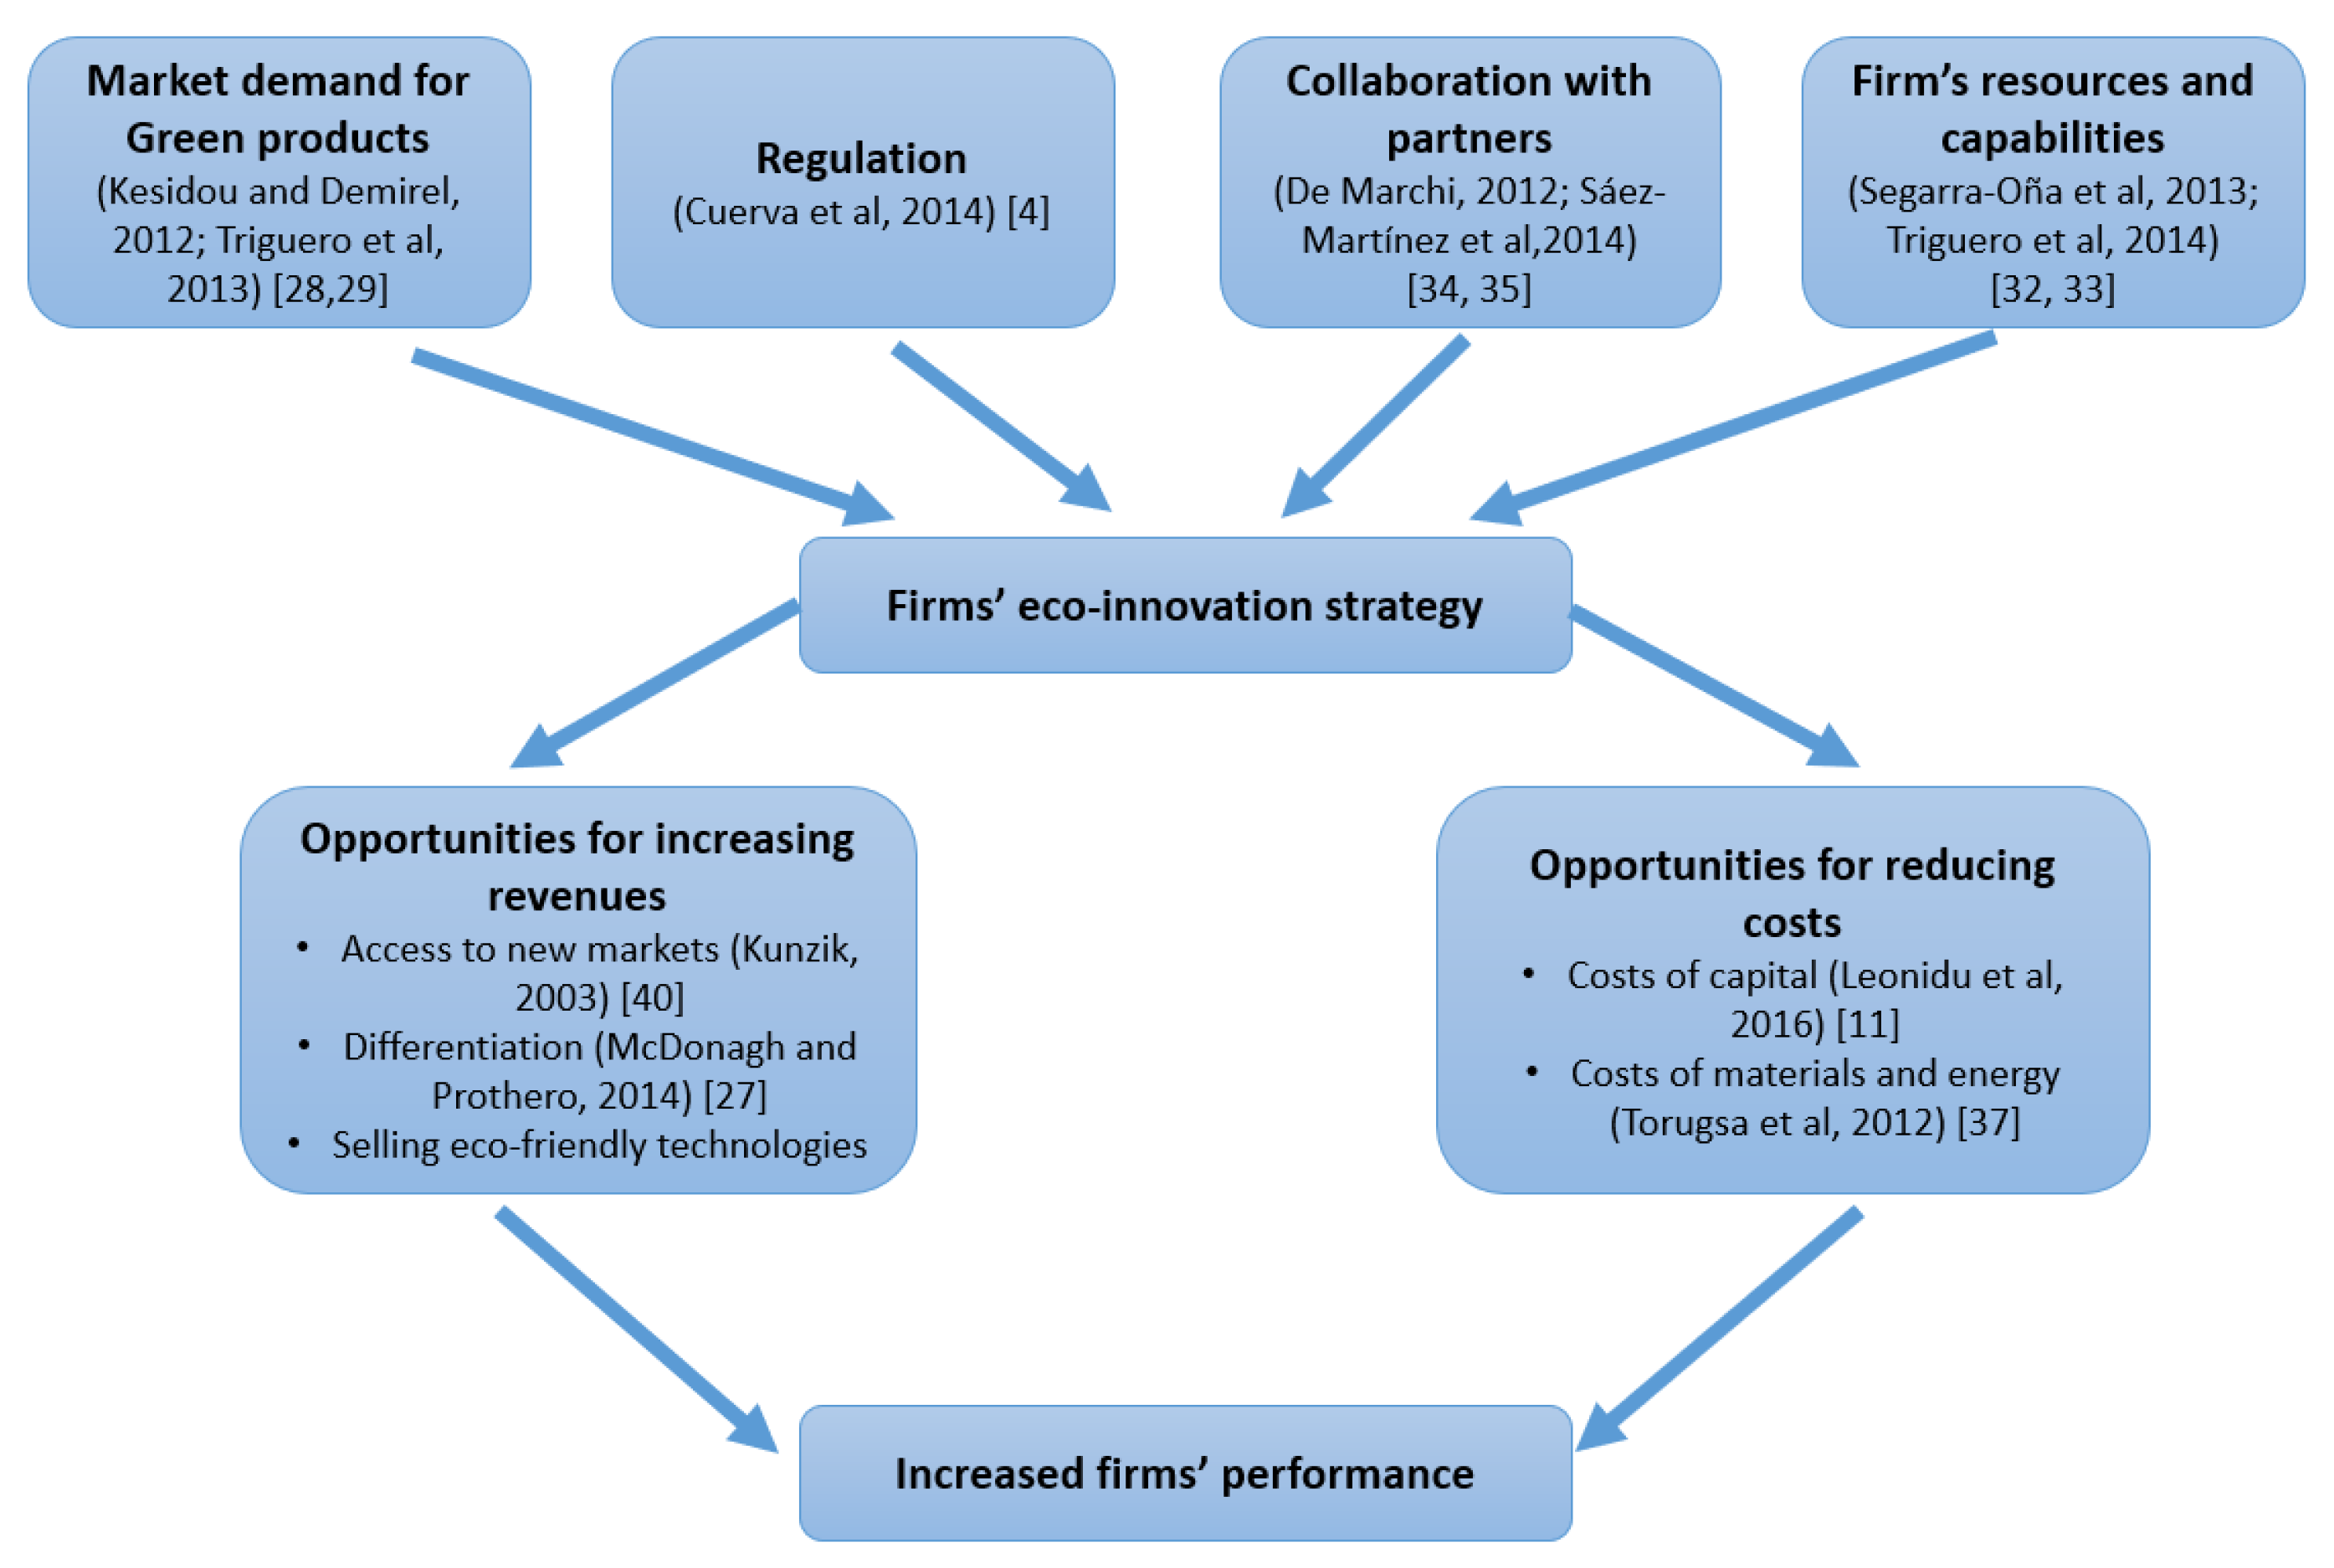
15]. Four main sources have been identified in the literature as drivers of eco-innovation—see Figure 1. Some studies show that customers are willing to pay for products or services produced in a more environmentally-conscious way [27]. Hence, there is a market pull towards E-I, as consumer demand for greener products and services may force companies to develop eco-friendly products [28,29].
In addition, regulation and fiscal incentives are traditionally considered as effective drivers of E-I [4]. Finally, technology push is also considered another key driver of E-I [30]. The technological level of industries influences the companies’ attitudes towards sustainability [31]. Company’s resources and capabilities enable them to develop the necessary knowledge base to promote E-Is [32,33]. The role of technology push also comes from establishing technological alliances with suppliers, business partners, universities, and research centers [34,35]. This is especially relevant for SMEs.
Being greener can improve competitiveness [19,20,36] and firms can obtain a competitive advantage through cost reduction as well as through an increase in revenues [15]. The so-called Porter Hypothesis [18] assumes that environmental regulation stimulates eco-innovation and leads to “win-win” opportunities where simultaneously pollution is reduced and firms’ competitiveness increased. This competitive advantage can be obtained either by reducing costs, per example, minimizing energy and water consumption [37] or by increasing benefits via enhancing customer satisfaction, corporate image and/or brand loyalty [38]. Recent research corroborates a positive relationship between environmental business practices and financial performance as well as to higher productivity [39].
Regarding the opportunities to increase the company’s revenues through environmental practices, purchasing policies of public administrations and some private organizations are increasingly focused on green suppliers [40]. Therefore, eco-innovation will help companies to have access to new markets where customers are more environmentally aware and even to apply for green public purchasing. Moreover, as we already mentioned, literature shows that customers are willing to pay for products or services produced in a more environmentally-conscious way [27]. Through eco-innovation, the company could customize products, offer a higher variety and adjust the product characteristics to customer needs. Eco-innovation is a strategy that seeks consumer satisfaction and -at the same time- is linked to the improvement of business performance [21]. Hence, an eco-innovation can be a source of differentiation and constitute the company’s base of its competitive advantage.
Finally, the company can take advantage of their eco-innovations selling or licensing the eco-friendly technology.
Additionally, an increase on companies’ performance can be based on costs’ reduction. Eco-innovation increases the companies’ opportunity for reducing costs in several ways. Obviously, eco-innovations can improve the companies’ production efficiency, reducing their consumption of energy and raw materials [37]. Hence, there is a straightforward reduction of the costs associated with these elements. Moreover, it is also possible that better environmental performance can be linked to lower cost of capital as greener companies may have access to capital markets through “green” and “ethical” funds [11].
Therefore, our argument is that technological eco-innovation strategy can be a source of competitive advantage, both through cost reduction and increased revenues. This strategy is based on the firms’ innovation strategy, where internal R&D is key. Resources and employees should be organized in a flexible structure that permit its innovative combination to adapt or even anticipate technological developments in their environment. Recognizing how industry or customer needs will evolve (especially with regards to sustainability and environmental issues) is a critical ability that leads to spending resources in R&D to develop green capabilities to generate eco-innovations [41].
Additionally, apart from internally spending in R&D and personnel, firms may decide to cooperate with other agents in the development, as well as the exploitation of eco-innovations. This cooperation is especially important for SMEs, who usually lack the necessary resources for the achievement of technological eco-innovations on their own. The association with other agents is one of the fastest and sometimes cheapest ways to innovate [42]. SMEs cooperate with other agents to reduce the risk and uncertainty usually associated with the innovation process. Hence, companies can improve their efficiency and increase their profits by securing a wider range of resources and more diversified sources through cooperation [43].
In this line, Horbach and colleagues [44] point out those companies that predominantly developed the eco-innovation themselves or in cooperation with other firms are particularly economically successful and that this is related to their internal R&D, high investment intensity and an improvement of a company’s innovative capacities.
In order to explain performance, we incorporate configurational theory, as it assumes that multiple organizational forms and strategies are equally effective [45]. The idea behind configurations is “that the whole is best understood from a systemic perspective and should be viewed as a constellation of interconnected elements” (p. 2) [46]. Configurations allow picturing equifinality, that is, the possibility for several ways to lead to the same outcome. Configuration scholars argue that increased understanding of organizational phenomena, such as performance, can be better achieved by identifying commonality among distinct, internally consistent sets of firms than by seeking to uncover relationships that hold across all organizations [47].
Our aim is to study which combinations of factors lead companies in the agri-food sector to increase their performance through their eco-innovation strategy. Hence, we will analyze the impact on performance of their R&D, technological eco-innovation and cooperation strategy both for the development and exploitation of environmental innovations.

3. Materials and Methods

3.1. Database

The agri-food industry is the manufacturing industry with the highest relevance for employment and economic output both, in Spain and in the European Union. The empirical analysis is based on an ad hoc survey. Questionnaire can be seen in the Appendix A. Questionnaires were launched in June 2017 to a randomly chosen sample of firms operating in the food and beverage industry (NACE codes 10 and 11). From a random sample of 1000 firms, 279 responded to the survey, which represents a 27.9% response rate. Considering the worst possible situation (p = q = 0.5) for a 95% confidence level, our margin of error is +/− 5.84%. Our final sample contains the data of 277 companies operating in the agri-food sector in Spain. Descriptive statistics of the database are shown in Table 1. Within the sample, 98 companies develop some kind of eco-innovation and 73 cooperate in the development or use of these eco-innovations.

3.2. Methodology

This study uses qualitative comparative analysis (QCA). Our research question could be answer by using other methods described in the literature [48]. However, the utility of QCA in strategy and organization studies is widely probed by the literature due to numerous advantages that promote its use [49]. The main advantages that have encourage authors to use QCA and no other methods, is that QCA permits conjunctural causation and multiple causation [50]. This allows studying the combinations of causal attributes that generate the outcome and, additionally, analyze if there are different paths that can lead in the same outcome. QCA relies on asymmetrical relationships overcoming the limitations that appear on traditional methods due to the linearity and complementary associations between variables [51]. In this sense, QCA allows to discover the combination of the antecedent conditions (traditional independent variables) that lead to a given outcome (in this study, the improvement of company performance). One of the main advantages of QCA that has severely increase it use in recent years, is that it offers valid responses even when using small-to-intermediate research designs [52].
In QCA different associations of variables can result in the same outcome as it entails equifinality [53]. In addition, it considers both the presence and the absence of antecedent conditions and how this fact affects the studied outcome [54]. Each combination of independent variables (“ingredients”) that leads to the studied outcome is known in QCA as recipe.
In this study, two specific QCA methods have been employed: crisp-set qualitative comparative analysis (csQCA) and fuzzy-set qualitative comparative analysis (fsQCA) (Table 2). csQCA is used for binary variables (i.e., the company cooperates/does not cooperate in the development of eco-innovations). csQCA calibration uses categorical conditions based on a dichotomy, assigning full non-membership (value of 0) and full membership (value of 1) to each condition (variable). On the other hand, fsQCA is appropriate for variables with continuous values (i.e., R&D expenditure as percentage of sales). fsQCA categorizes the variables into meaningful groups of cases combining qualitative and quantitative methods requiring theoretical and substantive knowledge of the context [52,55,56]. In fsQCA cut-off values range from full non-membership (0.05) to full membership (0.95) with the 0.5 case representing the maximum ambiguity (Table 2). For example, regarding firm size, companies have been classified in a continuous scale from 0 to 1 with companies with more than 73.5 employees being classified as “more large than small” and companies with less than 73.5 employees as “more small than large” [48]. After percentile determination, obtained breakpoints were adjusted on the basis of the knowledge of the sector and database characteristics.
Once the calibration is done, the next steps is performing the analysis of necessity. The goal of the analysis is to identify if all, or nearly all, instances of the outcome have the same condition for some of the considered variables. A condition is considered necessary when its consistency is very high (>0.95) and its coverage is not too low (>0.5). Results of the analysis of necessary conditions is shown in Table 3. The highest values for consistency appear for R&D spending (value 0.8172) and development of technological eco-innovation (0.6764), however, these values are not high enough for these conditions to be considered as necessary to improve company performance. As values for necessity are below 0.95, values for coverage are not considered.
The next step is the creation of the truth table. The truth table considers all logically possible combinations of conditions and assesses the consistency of the cases in each row with respect to the outcome. Its goal is to sort the cases according to the combinations of the causal conditions they show (it creates 2k rows). Each empirical case (in the present study each case is a company) corresponds to a configuration (a row of the truth table) depending on the antecedent conditions that it meets [52,57]. The reduction of the cases is done using the Quine-McCluskey algorithm [58]. QCA identifies the minimal set of causal conditions that are sufficient to produce the outcome by using Boolean algebra. Among QCA solutions, the intermediate solution was selected as it is recommended in the literature as the main point of reference for interpreting QCA results [59]. The goodness of fit of the row reduction depends on consistency and coverage. The consistency refers to the percentage of causal configurations with similar compositions that result in the same outcome value, while the coverage refers to the number of cases for which a configuration is valid [49,51].
Using the proposed method, this study analyzes the company conditions (recipes) that foster the performance of agri-food companies paying specific attention to the effects of eco-innovation. The consider outcome (better company performance) is a construct including three different variables related to company performance (Cronbach’s alpha: 0.930). The considered variables are: (1) increase in the sales of the company, (2) company profitability and (3) cost reduction.

4. Results and Discussion

In the configurations, black circles indicate the presence of the condition (●), white circles indicate the absence of the condition (○) and the absence of a circle indicates that the condition is not binding in that configuration [59]. Up to six different configurations (recipes) result in the improvement of the performance of the companies (Table 4). The coverage value of the model is high (0.54) and the solution consistency of the six models ranges from 0.86 to 0.91, higher than the minimum value (0.8) recommended by Ragin [56]. Additionally, the Appendix A (Table A1, Table A2 and Table A3) shows the firms configurations that lead to a positive effect in each one of the variables used to build the construct (sales increase, profitability value and cost reduction).
The conditions that more probably lead to a better performance of the companies are those of configuration 1 (coverage 33%): high R&D expenditure, high number of employees working on innovation, the company develops technological eco-innovation and the company cooperates in the development and use of eco-innovations. Companies that have the mentioned characteristics show better performance regardless of their size. The consistency of that configuration is 86%, indicating the percentage of companies that showing the reported conditions result in better performance.
The R&D expenditure and the development of technological eco-innovation are key in most of the recipes. By themselves, these two conditions are able to result in better company performance in the companies included in configuration 5. Traditionally, the agri-food industry has been classified as a low research-intensive industry due to its reduced R&D-to-sales ratio [60]. However, an elevated R&D expenditure as percentage of sales seems to be an important ingredient to increase the performance of companies within the sector as this condition appears in the six recipes. This is consistent with recent literature [61] that finds that investment in R&D for new products influences both future and growth sustainability. Similar results have been obtained in the U.S. food companies [62]. Previous studies have reported a limited influence of R&D spending on the development of eco-innovations in the agri-food sector [4]. As a result, it can be concluded that these variables may not be related to one another, but when acting together, they show a crucial effect in the improvement of company performance in the sector.
The condition development of technological eco-innovation appears in five of the six configurations reported. In general, effective innovation creates difficulties of replications, thereby improves company performance and generates competitive edge [63]. Innovating companies in the Spanish agri-food sector are proved to obtain better results both in economic and productive terms [64], but specific information about the effect and importance of eco-innovation in the country sector was missed.
Most studies have analyzed the drivers of eco-innovation [4,65,66,67] with few including eco-innovation as an explanatory variable. Specifically, eco-innovation strategies help companies to satisfy the current needs of customers and society in terms of sustainable products and services (i.e., organic products) [66,68,69] leading at the same time to a reduction in the use of energy or materials per unit [70] that could explain the positive effect of eco-innovation in company competitiveness and economic performance [66,68]. Higher financial performance had been previously proposed as a driver than increases eco-innovation behavior [71,72]. Attending to the obtained results, in the Spanish agri-food industry the opposite may be also happening.
The number of persons working on innovation is a condition with higher prevalence in the configurations than companies’ size or capital. The connection of company size with profitability is mainly based on the existence of economies of scale and/or market power [73], however this relation is industry specific [74] and not always applies [62,75,76]. Specifically, in the EU food industry, larger companies seem to achieve a higher level of profits [77] and company size has been identified as an important driver of profit persistence [78,79,80]. Hirsch and Gschwandtner [78] as well as Hirsch et al. [80] state that the positive impact of company size is due to the advantages that larger companies have to bargain with the highly concentrated food retail sector. In our sample, limited effect of size and capital on company performance has been found. Attending to the results of configurations 4 and 6, it can be concluded that larger companies in the agri-food sector do not need to cooperate in the development and use of eco-innovations to achieve better performance, however the smallest ones (configuration 2) use these kinds of cooperation to offset specific handicaps linked to their size.
Cooperation has been largely studied recently as it is an essential factor in the open innovation concept [10,81]. The positive effect of cooperation in company efficiency and profits has been proved [43]. Cooperation has recently been identified as a driver for the development of eco-innovations in the manufacturing sector [82,83], in the fertilizer and agricultural sector [84] and for the introduction of radical eco-innovations specifically in the agri-food sector [10].
The effect of cooperation with different market agents, including competitors has been studied in the agri-food industry [85]. However, few studies have considered separately cooperation in the use and cooperation in the development of eco-innovations due to the limitations that appear to considerate these variables independently. Table 4 shows that these two variables are important as they appear in the recipes that include the highest number of companies (configurations 1 and 2, which include the 33 and 19% of companies, respectively). In both configurations these two kinds of cooperation appear together indicating that they may be linked, and one (presumably, cooperation in the development) leads to the other (development in the use). Attending to results, cooperation in the development and in the use of eco-innovations are important to improve company performance especially in the smallest companies (small size and reduced capital) (configuration 2).

5. Conclusions

The aim of this study was to identify the conditions that lead companies operating in the Spanish agri-food industry to improve company performance. Beyond traditional variables, the influence of eco-innovation linked variables, including the development of technological eco-innovation and cooperation in the development and use of these eco-innovations, have been included. To achieve this, a new method (QCA) with proven warranties in the business and management area has been used [49].
By analyzing the obtained recipes, it can be concluded that all companies operating in the agri-food industry can improve their performance regardless of their size. This can be granted as long as firms have an adequate spending on R&D, develop technological eco-innovation and are willing to cooperate in the development and use of eco-innovations. The benefits that eco-innovative strategies have for the development of new markets and cost reduction [66,68,70] boost the performance of companies operating in the sector.
Regarding the effect of size and capital of firms, the smallest companies rely on cooperation in the development and use of eco-innovations, while larger companies rely on both cooperation, but also on their own personal working on innovation. Results state that the tradition of low cooperation in the agri-food sector [10] is constraining the performance of all firms, but specially limits the performance of the smaller ones. Cooperation is the cheapest way to innovate [42] and further effort must be made for these companies to create networks in order to achieve de benefits associated to the development of innovation processes. Efforts from public administrations in order to promote associations within the industry to develop and use eco-innovations would improve the economic performance of the companies and at the same time will contribute to reduce the environmental impact of their activity resulting in the greater good of society at large.
The importance of companies’ decisions about cooperation and innovation had been identified as essential to improve the sustainability in the agri-food sector [86]. As Capitanio et al. argue [21], building relationships with the distribution sector and acquiring networking capacities are key elements to develop and introduce innovations in this industry, and an essential element for firms’ sustainable development and survival. Open innovation strategies [81] generates potential for feedback and thus improves firm’s knowledge base, increasing performance [87]. Additionally, the positive effect of eco-innovation strategies on improving firms’ performance has been reported in the wine sector with specific eco-friendly practices leading to sustained competitive advantages [88]. However, practices must be considered individually as sustainability and better performance appears mainly when economically beneficial practices with the highest environmental benefits are adopted [89]. In this line, further analysis of the effects of specific eco-innovations, such as product or product eco-innovation or eco-innovation in the management should be studied individually.
This study has several limitations. We are aware that different variables can be used to measure performance, which may lead to different conclusions. With that in mind, and reducing the risk of considering a single variable, in this study the outcome “improved company performance” has been considered as a construct including three variables (increase in sales, company profitability and cost reduction). Regarding the obtained models, although the coverage and the consistency of the models is perfectly adequate, the question regarding whether the variables that are considered in this study are the best proxies for capturing the effects of eco-innovation strategies in the sector remains unanswered. Therefore, additional variables should be included in further research to increase our understanding of firm’s performance.
The main finding of the study is to conclude that for companies in the food industry it pays to be green. Companies engaged in eco-innovation strategies are those with better chances to improve their performance. In addition, open innovation strategies play a key role, as they help firms to reduce uncertainty and risk associated with innovation and eco-innovation processes. Through open innovation, firms in this industry can learn from others and implement their own strategies for improving both sustainability and performance, as well as reduce the plausible negative effects of their activities on the environment [90]. In this regard, it would be desirable to consider the complexity of knowledge and resource-right systems so that responsibility and reciprocity of partners can be allocated in a fair and objective way [87]. With all the reported information, the sustainability of the agri-food sector and its profitability seem to be linked, resulting in a win-win scenario. However, further analysis of these conclusions should be made for the companies operating in the agri-food sector of different countries or regions.

Author Contributions

Conceptualization, Á.G.M. and F.J.S.-M.; Formal analysis, A.R. and Á.G.M.; Methodology, A.R.; Project administration, F.J.S.-M.; Resources, F.J.S.-M.; Software, A.R.; Supervision, Á.G.M. and F.J.S.-M.; Writing—original draft, A.R., Á.G.M. and F.J.S.-M.

Funding

This research was funded by Spanish Ministry of Science, Innovation and Universities, project number RTI2018-101867-B-I00, and the University of Castilla-La Mancha and the European Regional Development Fund, grant number 2018/11744.

Conflicts of Interest

The authors declare no conflict of interest.

Appendix A

Table A1. Models predicting the increase in sales in agri-food companies.
Configuration No.R&DSizeCapitalPers. Innov.Tech. Eco-Innov.Coop. Dev.Coop. UseCoverageConsistency
RawUnique
1 0.1654710.009457470.888049
2 0.3372140.1507820.86327
3 0.1248240.01160380.87044
4 0.1399160.03615280.908933
5 0.1045680.0001024510.849129
6 0.2007510.01401850.900963
Solution coverage: 0.565564
Solution consistency: 0.0.851631
Frequency threshold = 1; consistency threshold = 0.88098.
Table A2. Models predicting the increase in the profitability in agri-food companies.
Configuration No.R&DSizeCapitalPers. Innov.Tech. Eco-InnovCoop. Dev.Coop. UseCoverageConsistency
RawUnique
1 0.1554060.007255260.863571
2 0.3215650.1460780.851604
3 0.1175750.01120680.848924
4 0.1344820.03491620.904575
5 0.1003430.0003886820.843682
6 0.1898690.01438110.8823
Solution coverage: 0.538252
Solution consistency: 0.839207
Frequency threshold = 1; consistency threshold = 0.875285.
Table A3. Models predicting the reduction of costs in agri-food companies.
Configuration No.R&DSizeCapitalPers. Innov.Tech. Eco-InnovCoop. Dev.Coop. UseCoverageConsistency
RawUnique
1 0.1604990.008634870.843053
2 0.3351840.1531660.83908
3 0.119860.01336350.818054
4 0.1418590.03693810.901961
5 0.1057430.0004112120.840414
6 0.1937360.01171880.850994
Solution coverage: 0.558525
Solution consistency: 0.823148
Frequency threshold = 1; consistency threshold = 0.858195.
Annex: Questionnaire
The original version of this questionnaire is in Spanish. This is an authors’ translation. Only the questions and variables related to this paper are shown below.
The following questionnaire is part of project RTI2018-101867-B-I00 founded by the Spanish Ministry of Science, Innovation and Universities. The aim of this project is to study environmental innovations. An environmental innovation or “eco-innovation” is any innovation introduced by your firm to mitigate the negative effects of the entrepreneurial activity on the environment. Your information will be treated anonymously, in an aggregate way and only for research purposes. We thank you in advance for your time and collaboration.
Please answer the following questions:
  • Please indicate the year when your firm was created ______
  • Please indicate the number of employees (full time equivalent) of your firm _____
  • How many of those employees are working in R&D? _____
  • Please indicate the percentage of your firm’s R&D expenses over total sales _____
  • Please indicate the company capital (in thousand euros) ______
  • Please indicate which of the following sector is your main business:
    • [ ] Meat and meat products
    • [ ] Processed and preserved fish and fish products
    • [ ] Processed and preserved fruits and vegetables
    • [ ] Vegetable and animal oils and fats
    • [ ] Dairy products;
    • [ ] Bakery and farinaceous products
    • [ ] Prepared animal feeds
    • [ ] Grain mill products
    • [ ] Other food products
    • [ ] Beverages
  • We are interested in studying the cooperation relationships your firm has with other agents for the development and use of environmental innovations.
    • Has your firm cooperated with other partners (companies, suppliers, clients, research centres, consultants, etc.) for the development of environmental innovations?
      Yes [ ] No [ ]
    • Has your firm cooperated with other partners (companies, suppliers, clients, research centres, consultants, etc.) for the use and exploitation of environmental innovations?
      Yes [ ] No [ ]
  • Has your firm introduced an “eco-product” and/or made significant changes in product containers and packaging in order to reduce environmental hazard during the last year?
    Yes [ ] No [ ]
  • Has your firm made significant changes in the production processes, including the distribution channels, in order to reduce environmental hazards during the last year?
    Yes [ ] No [ ]
  • Compared to your competitors, which is your firm’s position in the following indicators?
IndicatorLower 20% of SectorBelow Sector’s AverageSector’s AverageAbove Sector’s AverageTop 20% of Sector
Increase in sales
Profitability value
Costs reduction
THANK YOU VERY MUCH FOR YOUR COLLABORATION

References

  1. Díaz-García, C.; González-Moreno, Á.; Sáez-Martínez, F.J. Eco-innovation: Insights from a literature review. Innov. Manag. Policy Pract. 2015, 17, 6–23. [Google Scholar] [CrossRef]
  2. Schiederig, T.; Tietze, F.; Herstatt, C. Green innovation in technology and innovation management—An exploratory literature review. R D Manag. 2012, 42, 180–192. [Google Scholar] [CrossRef]
  3. Segarra-Onã, M.; Peiró-Signes, A.; Payá-Martínez, A. Factors influencing automobile firms’ eco-innovation orientation. EMJ-Eng. Manag. J. 2014, 26, 31–38. [Google Scholar] [CrossRef]
  4. Cuerva, M.C.; Triguero-Cano, Á.; Córcoles, D. Drivers of green and non-green innovation: Empirical evidence in Low-Tech SMEs. J. Clean. Prod. 2014, 68, 104–113. [Google Scholar] [CrossRef]
  5. Popa, S.; Soto-Acosta, P.; Martinez-Conesa, I. Antecedents, moderators, and outcomes of innovation climate and open innovation: An empirical study in SMEs. Technol. Forecast. Soc. Chang. 2017, 118, 134–142. [Google Scholar] [CrossRef]
  6. Klewitz, J.; Hansen, E.G. Sustainability-oriented innovation of SMEs: A systematic review. J. Clean. Prod. 2014, 65, 57–75. [Google Scholar] [CrossRef]
  7. Del Río González, P. Analysing the factors influencing clean technology adoption: A study of the Spanish pulp and paper industry. Bus. Strategy Environ. 2005, 14, 20–37. [Google Scholar] [CrossRef]
  8. Revell, A.; Rutherfoord, R. UK environmental policy and the small firm: Broadening the focus. Bus. Strategy Environ. 2003, 12, 26–35. [Google Scholar] [CrossRef]
  9. Bossle, M.B.; De Barcellos, M.D.; Vieira, L.M. Why food companies go green? The determinant factors to adopt eco-innovations. Br. Food J. 2016, 118, 1317–1333. [Google Scholar] [CrossRef]
  10. Triguero, A.; Fernández, S.; Sáez-Martinez, F.J. Inbound open innovative strategies and eco-innovation in the Spanish food and beverage industry. Sustain. Prod. Consum. 2018, 15, 49–64. [Google Scholar] [CrossRef]
  11. Leonidou, L.C.; Christodoulides, P.; Thwaites, D. External Determinants and Financial Outcomes of an Eco-friendly Orientation in Smaller Manufacturing Firms. J. Small Bus. Manag. 2016, 54, 5–25. [Google Scholar] [CrossRef]
  12. Blasi, E.; Monotti, C.; Ruini, L.; Landi, C.; Avolio, G.; Meriggi, P. Eco-innovation as a driver in the agri-food value chain: An empirical study on durum wheat in Italy. J. Chain Netw. Sci. 2015, 15, 1–15. [Google Scholar] [CrossRef]
  13. Pigford, A.A.E.; Hickey, G.M.; Klerkx, L. Beyond agricultural innovation systems? Exploring an agricultural innovation ecosystems approach for niche design and development in sustainability transitions. Agric. Syst. 2018, 164, 116–121. [Google Scholar] [CrossRef]
  14. Garnett, T. Where are the best opportunities for reducing greenhouse gas emissions in the food system (including the food chain)? Food Policy 2011, 36 (Suppl. S1), S23–S32. [Google Scholar] [CrossRef]
  15. Ambec, S.; Lanoie, P. Does it pay to be green? A systematic overview. Acad. Manag. Perspect. 2008, 22, 45–62. [Google Scholar]
  16. Friedman, M. The social responsibility of business is to increase its profits. N. Y. Times Mag. 1970, 13, 122–124. [Google Scholar]
  17. Stucki, T. Which firms benefit from investments in green energy technologies?—The effect of energy costs. Res. Policy 2019, 48, 546–555. [Google Scholar] [CrossRef]
  18. Porter, M.; Van Der Linde, C. Towards a New Conception of Environment-Competitiveness Relationship. J. Econ. Perspect. 1995, 9, 97–118. [Google Scholar] [CrossRef]
  19. Aragón-Correa, J.A.; Sharma, S. A contingent resource-based view of proactive corporate environmental strategy. Acad. Manag. Rev. 2003, 28, 71–88. [Google Scholar] [CrossRef]
  20. Sáez-Martínez, F.J.; Díaz-García, C.; González-Moreno, Á. Factors promoting environmental responsibility in European SMEs: The effect on performance. Sustainability (Switzerland) 2016, 8, 898. [Google Scholar] [CrossRef]
  21. Capitanio, F.; Coppola, A.; Pascucci, S. Product and process innovation in the Italian food industry. Agribusiness 2010, 26, 503–518. [Google Scholar] [CrossRef]
  22. Luo, J.; Guo, H.; Jia, F. Technological innovation in agricultural co-operatives in China: Implications for agro-food innovation policies. Food Policy 2017, 73, 19–33. [Google Scholar] [CrossRef]
  23. Capitanio, F.; Coppola, A.; Pascucci, S. Indications for drivers of innovation in the food sector. Br. Food J. 2009, 111, 820–838. [Google Scholar] [CrossRef]
  24. Cheng, C.C.; Shiu, E.C. Validation of a proposed instrument for measuring eco-innovation: An implementation perspective. Technovation 2012, 32, 329–344. [Google Scholar] [CrossRef]
  25. Kemp, R.; Pearson, P. Final Report MEI Project about Measuring Eco-Innovation. Available online: http://www.oecd.org/env/consumption-innovation/43960830.pdf (accessed on 15 June 2019).
  26. OECD. The Measurement of Scientific and Technological Activities: Guidelines for Collecting and Interpreting Innovation Data; OCDE: Paris, France, 2005. [Google Scholar]
  27. McDonagh, P.; Prothero, A. Sustainability marketing research: Past, present and future. J. Mark. Manag. 2014, 30, 1186–1219. [Google Scholar] [CrossRef]
  28. Kesidou, E.; Demirel, P. On the drivers of eco-innovations: Empirical evidence from the UK. Res. Policy 2012, 41, 862–870. [Google Scholar] [CrossRef]
  29. Triguero, A.; Moreno-Mondéjar, L.; Davia, M.A. Drivers of different types of eco-innovation in European SMEs. Ecol. Econ. 2013, 92, 25–33. [Google Scholar] [CrossRef]
  30. Sáez-Martínez, F.J.; Díaz-García, C.; Gonzalez-Moreno, A. Firm technological trajectory as a driver of eco-innovation in young small and medium-sized enterprises. J. Clean. Prod. 2016, 138, 28–37. [Google Scholar] [CrossRef]
  31. Peiró-Signes, A.; Segarra-Oña, M.; Miret-Pastor, L.; Verma, R. Eco-innovation attitude and industry’s technological level—An important key for promoting efficient vertical policies. Environ. Eng. Manag. J. 2011, 10, 1893–1901. [Google Scholar] [CrossRef]
  32. Segarra-Oña, M.V.; Peiró-Signes, A.; Mondéjar-Jiménez, J. Identifying variables affecting the proactive environmental orientation of firms: An empirical study. Pol. J. Environ. Stud. 2013, 22, 873–880. [Google Scholar]
  33. Triguero, A.; Córcoles, D.; Cuerva, M.C. Persistence of innovation and firm’s growth: Evidence from a panel of sme and large spanish manufacturing firms. Small Bus. Econ. 2014, 43, 787–804. [Google Scholar] [CrossRef]
  34. De Marchi, V. Environmental innovation and R&D cooperation: Empirical evidence from Spanish manufacturing firms. Res. Policy 2012, 41, 614–623. [Google Scholar]
  35. Sáez-Martínez, F.J.; González-Moreno, Á.; Hogan, T. The role of university in eco-entrepreneurship: Evidence from the eurobarometer survey on attitudes of european entrepreneurs towards eco-innovation. Environ. Eng. Manag. J. 2014, 13, 2541–2549. [Google Scholar]
  36. Simpson, M.; Taylor, N.; Barker, K. Environmental responsibility in SMEs: Does it deliver competitive advantage? Bus. Strategy Environ. 2004, 13, 156–171. [Google Scholar] [CrossRef]
  37. Torugsa, N.A.; O’Donohue, W.; Hecker, R. Capabilities, Proactive CSR and Financial Performance in SMEs: Empirical Evidence from an Australian Manufacturing Industry Sector. J. Bus. Ethics 2012, 109, 483–500. [Google Scholar] [CrossRef]
  38. Bos-Brouwers, H.E.J. Corporate sustainability and innovation in SMEs: Evidence of themes and activities in practice. Bus. Strategy Environ. 2010, 19, 417–435. [Google Scholar] [CrossRef]
  39. Martin, R.; Muûls, M.; De Preux, L.B.; Wagner, U.J. Anatomy of a paradox: Management practices, organizational structure and energy efficiency. J. Environ. Econ. Manag. 2012, 63, 208–223. [Google Scholar] [CrossRef]
  40. Kunzik, P. National Procurement Regimes and the Scope for the Inclusion of Environmental Factors in Public Procurement. In The Environmental Performance of Public Procurement: Issues of Policy Coherence; OECD: Paris, France, 2003; pp. 193–220. [Google Scholar]
  41. El-Kassar, A.N.; Singh, S.K. Green innovation and organizational performance: The influence of big data and the moderating role of management commitment and HR practices. Technol. Forecast. Soc. Chang. 2019, 144, 483–498. [Google Scholar] [CrossRef]
  42. Hagedoorn, J.; Schakenraad, J. The effect of strategic technology alliances on company performance. Strateg. Manag. J. 1994, 15, 291–309. [Google Scholar] [CrossRef]
  43. Van Kranenburg, H.; Hagedoorn, J.; Pennings, J. Measurement of International and Product Diversification in the Publishing Industry. J. Media Econ. 2004, 17, 87–104. [Google Scholar] [CrossRef] [Green Version]
  44. Horbach, J.; Rammer, C.; Rennings, K. Determinants of eco-innovations by type of environmental impact—The role of regulatory push/pull, technology push and market pull. Ecol. Econ. 2012, 78, 112–122. [Google Scholar] [CrossRef]
  45. Doty, D.H.; Glick, W.H.; Huber, G.P. Fit, equifinality, and organizational effectiveness: A test of two configurational theories. Acad. Manag. J. 1993, 36, 1196–1250. [Google Scholar]
  46. Fiss, P.C.; Marx, A.; Cambré, B. Configurational theory and methods in organizational research: Introduction. In Configurational Theory and Methods in Organizational Research; Emerald: Bingley, UK, 2013; pp. 1–22. [Google Scholar]
  47. Ketchen, D.J.J.; Thomas, J.B.; Snow, C.C. Organizational configurations and performance: A comparison of theoretical approaches. Acad. Manag. J. 1993, 36, 1278–1313. [Google Scholar] [CrossRef]
  48. Bedford, D.S.; Sandelin, M. Investigating management control configurations using qualitative comparative analysis: An overview and guidelines for application. J. Manag. Control 2015, 26, 5–26. [Google Scholar] [CrossRef]
  49. Roig-Tierno, N.; Gonzalez-Cruz, T.F.; Llopis-Martinez, J. An overview of qualitative comparative analysis: A bibliometric analysis. J. Innov. Knowl. 2017, 2, 15–23. [Google Scholar] [CrossRef]
  50. Thomann, E.; Maggetti, M. Designing Research with Qualitative Comparative Analysis (QCA): Approaches, Challenges, and Tools. Sociol. Methods Res. 2017, 1–31. [Google Scholar] [CrossRef]
  51. Woodside, A.G. Moving beyond multiple regression analysis to algorithms: Calling for adoption of a paradigm shift from symmetric to asymmetric thinking in data analysis and crafting theory. J. Bus. Res. 2013, 66, 463–472. [Google Scholar] [CrossRef]
  52. Fiss, P.C. A set-theoretic approach to organizational configurations. Acad. Manag. Rev. 2007, 32, 1190–1198. [Google Scholar] [CrossRef]
  53. Samara, G.; Berbegal-Mirabent, J. Independent directors and family firm performance: Does one size fit all? Int. Entrep. Manag. J. 2018, 14, 149–172. [Google Scholar] [CrossRef]
  54. Wu, P.L.; Yeh, S.S.; Huan, T.C.; Woodside, A.G. Applying complexity theory to deepen service dominant logic: Configural analysis of customer experience-and-outcome assessments of professional services for personal transformations. J. Bus. Res. 2014, 67, 1647–1670. [Google Scholar] [CrossRef] [Green Version]
  55. Vis, B. The Comparative Advantages of fsQCA and Regression Analysis for Moderately Large-N Analyses. Sociol. Methods Res. 2012, 40, 168–198. [Google Scholar] [CrossRef]
  56. Ragin, C.C. Redesigning Social Inquiry Fuzzy Sets and Beyond; University of Chicago Press: Chicago, IL, USA, 2008. [Google Scholar]
  57. Berbegal-Mirabent, J.; Ribeiro-Soriano, D.E.; Sánchez García, J.L. Can a magic recipe foster university spin-off creation? J. Bus. Res. 2015, 68, 2272–2278. [Google Scholar] [CrossRef]
  58. Quine, W.V. The problem of simplifying truth functions. Am. Math. Mon. 1952, 59, 521–531. [Google Scholar] [CrossRef]
  59. Ragin, C.C.; Fiss, P.C. Net effects analysis versus configurational analysis: An empirical demostration. In Redesigning Social Inquiry: Fuzzy Sets and Beyond; University of Chicago Press: Chicago, IL, USA, 2008; pp. 190–213. [Google Scholar]
  60. Garcia Martinez, M.; Briz, J. Innovation in the Spanish food & drink industry. Int. Food Agribus. Manag. Rev. 2000, 3, 155–176. [Google Scholar]
  61. Park, W.; Sung, C.S.; Byun, C.G. Impact of Unlisted Small and Medium-Sized Enterprises’ Business Strategies on Future Performance and Growth Sustainability. J. Open Innov. Technol. Mark. Complex. 2019, 5, 60. [Google Scholar] [CrossRef]
  62. Chaddad, F.R.; Mondelli, M.P. Sources of firm performance differences in the US food economy. J. Agric. Econ. 2013, 64, 382–404. [Google Scholar] [CrossRef]
  63. Juniati, S.; Saudi, M.H.M.; Astuty, E.; Mutalib, N.A. The impact of internationalization in influencing firm performance and competitive advantage: The mediating role of eco-innovation. Int. J. Supply Chain Manag. 2019, 8, 295–302. [Google Scholar]
  64. Zouaghi, F.; Sánchez, M. Has the global financial crisis had different effects on innovation performance in the agri-food sector by comparison to the rest of the economy? Trends Food Sci. Technol. 2016, 50, 230–242. [Google Scholar] [CrossRef]
  65. Horbach, J. Determinants of environmental innovation-New evidence from German panel data sources. Res. Policy 2008, 37, 163–173. [Google Scholar] [CrossRef]
  66. Hojnik, J.; Ruzzier, M.; Manolova, T.S. Internationalization and economic performance: The mediating role of eco-innovation. J. Clean. Prod. 2018, 171, 1312–1323. [Google Scholar] [CrossRef]
  67. Cainelli, G.; Mazzanti, M.; Zoboli, R. Environmental innovations, complementarity and local/global cooperation: Evidence from North-East Italian industry. Int. J. Technol. Policy Manag. 2011, 11, 328–368. [Google Scholar] [CrossRef]
  68. Sarkar, A.N. Promotion of eco-innovation to leverage sustainable development of eco-industry and green growth. Int. J. Ecol. Dev. 2013, 25, 71–104. [Google Scholar]
  69. Medina-Viruel, M.J.; Bernal-Jurado, E.; Mozas-Moral, A.; Moral-Pajares, E.; Fernández-Uclés, D. Efficiency of organic farming companies that operate in an online environment. Custos Agronegocio 2015, 11, 264–289. [Google Scholar]
  70. Ghisetti, C.; Rennings, K. Environmental innovations and profitability: How does it pay to be green? An empirical analysis on the German innovation survey. J. Clean. Prod. 2014, 75, 106–117. [Google Scholar] [CrossRef]
  71. Przychodzen, J.; Przychodzen, W. Relationships between eco-innovation and financial performance-Evidence from publicly traded companies in Poland and Hungary. J. Clean. Prod. 2015, 90, 253–263. [Google Scholar] [CrossRef]
  72. Scarpellini, S.; Marín-Vinuesa, L.M.; Portillo-Tarragona, P.; Moneva, J.M. Defining and measuring different dimensions of financial resources for business eco-innovation and the influence of the firms’ capabilities. J. Clean. Prod. 2018, 204, 258–269. [Google Scholar] [CrossRef]
  73. Fernández, E.; Iglesias-Antelo, S.; López-López, V.; Rodríguez-Rey, M.; Fernandez-Jardon, C.M. Firm and industry effects on small, medium-sized and large firms’ performance. BRQ Bus. Res. Q. 2019, 22, 25–35. [Google Scholar] [CrossRef]
  74. Becker-Blease, J.R.; Kaen, F.R.; Etebari, A.; Baumann, H. Employees, firm size and profitability in U.S. manufacturing industries. Invest. Manag. Financ. Innov. 2010, 7, 119–132. [Google Scholar]
  75. Dhawan, R. Firm size and productivity differential: Theory and evidence from a panel of US firms. J. Econ. Behav. Organ. 2001, 44, 269–293. [Google Scholar] [CrossRef]
  76. Goddard, J.; Tavakoli, M.; Wilson, J.O.S. Determinants of profitability in European manufacturing and services: Evidence from a dynamic panel model. Appl. Financ. Econ. 2005, 15, 1269–1282. [Google Scholar] [CrossRef]
  77. Gschwandtner, A.; Hirsch, S. What Drives Firm Profitability? A Comparison of the US and EU Food Processing Industry. Manch. Sch. 2018, 86, 390–416. [Google Scholar] [CrossRef]
  78. Hirsch, S.; Gschwandtner, A. Profit persistence in the food industry: Evidence from five European countries. Eur. Rev. Agric. Econ. 2013, 40, 741–759. [Google Scholar] [CrossRef]
  79. Hirsch, S.; Schiefer, J. What Causes Firm Profitability Variation in the EU Food Industry? A Redux of Classical Approaches of Variance Decomposition. Agribusiness 2016, 32, 79–92. [Google Scholar] [CrossRef]
  80. Hirsch, S.; Schiefer, J.; Gschwandtner, A.; Hartmann, M. The determinants of firm profitability differences in EU food processing. J. Agric. Econ. 2014, 65, 703–721. [Google Scholar] [CrossRef]
  81. Chesbrough, H.W. Open Innovation: The New Imperative for Creating and Profiting from Technology; Harvard Business School Press: Boston, MA, USA, 2003. [Google Scholar]
  82. Tumelero, C.; Sbragia, R.; Evans, S. Cooperation in R & D and eco-innovations: The role in companies’ socioeconomic performance. J. Clean. Prod. 2019, 207, 1138–1149. [Google Scholar]
  83. da Silva Rabêlo, O.; de Azevedo Melo, A.S.S. Drivers of multidimensional eco-innovation: Empirical evidence from the Brazilian industry. Environ. Technol. 2018, 40, 1–11. [Google Scholar] [CrossRef] [PubMed]
  84. Hasler, K.; Olfs, H.W.; Omta, O.; Bröring, S. Drivers for the adoption of different eco-innovation types in the fertilizer sector: A review. Sustainability 2017, 9, 2216. [Google Scholar] [CrossRef]
  85. Galdeano-Gómez, E.; Pérez-Mesa, J.C.; Aznar-Sánchez, J.A. Internationalisation of SMEs and simultaneous strategies of cooperation and competition: An exploratory analysis. J. Bus. Econ. Manag. 2016, 17, 1114–1132. [Google Scholar] [CrossRef]
  86. Lubell, M.; Hillis, V.; Hoffman, M. Innovation, cooperation, and the perceived benefits and costs of sustainable agriculture practices. Ecol. Soc. 2011, 16, 23. [Google Scholar] [CrossRef]
  87. Gupta, A.K.; Dey, A.R.; Shinde, C.; Mahanta, H.; Patel, C.; Patel, R.; Sahay, N.; Sahu, B.; Vivekanandan, P.; Verma, S.; et al. Theory of open inclusive innovation for reciprocal, responsive and respectful outcomes: Coping creatively with climatic and institutional risks. J. Open Innov. Technol. Mark. Complex. 2016, 2, 16. [Google Scholar] [CrossRef]
  88. Galletto, L.; Barisan, L. Carbon footprint as a lever for sustained competitive strategy in developing a smart oenology: Evidence from an exploratory study in Italy. Sustainability 2019, 11, 1483. [Google Scholar] [CrossRef]
  89. Lubell, M.; Hillis, V.; Hoffman, M. The Perceived Benefits and Costs of Sustainability Practices in California Viticulture; University of California: Davis, CA, USA, 2010. [Google Scholar]
  90. Cooke, P. Green governance and green clusters: Regional & national policies for the climate change challenge of Central & Eastern Europe. J. Open Innov. Technol. Mark. Complex. 2015, 1, 1. [Google Scholar]
Figure 1. Theoretical framework.
Sustainability 11 05590 g001
Table 1. Variable definition and descriptive statistics
VariableDescriptionMeanSDMinMax
SalesCompany increases in sales. Company manager’s opinion (min: 0, max: 5). 3.111.0905
ProfitabilityCompany profitability value. Company manager’s opinion (min: 0, max: 5).3.041.1005
CostReduction of costs in the company. Company manager’s opinion (min: 0, max: 5).2.921.1505
ConstructConstruct for sales increase, profitability value and cost reduction (min: 0, max: 5).3.031.1205
R&DR&D expenditure as percentage of sales (%)2.056.02080
SizeNumber of employees140.5171.51817
CapitalCompany capital (thousands of euros)42349729364,368
Pers. Innov.Number of employees working on innovation development2.393.81040
Tech. Eco-Innov.The company develops technological eco-innovation (0, does not develop; 1, develops)0.630.4801
Coop. Develop.The company cooperates to develop eco-innovation (0, does not cooperate; 1, cooperates)0.410.4901
Coop. UseThe company cooperates in the use of eco-innovations (0, does not cooperate; 1 cooperates)0.410.4901
Table 2. Calibration values.
VariableMembership Threshold Values (Percentiles)Membership Threshold Values (Selected)
Full Non-Membership (0.05)Crossover Point (0.5)Full Membership (0.95)Full Non-Membership Crossover Point Full Membership
Sales03502.94.9
Profitability03402.93.9
Cost03402.93.9
Construct03402.93.9
R&D021001.910
Size273.55221.973.5522.1
Capital360121,219360121,219
Pers. Innov.019.1019.1
Tech. Eco-Innov.0 10 1
Coop. Develop.0 10 1
Coop. Use0 10 1
Table 3. Companies’ valuation of the performance. Analysis of necessary conditions.
Conditions Tested *ConsistencyCoverage
R&D0.8172260.821063
~R&D0.6211470.897238
Size0.5818140.786868
~Size0.6527550.688458
Capital0.5288510.801574
~Capital0.7140260.694727
Pers. Innov.0.5884340.808886
~Pers. Innov.0.6267930.652853
Tech. Eco-Innov.0.6763810.643271
~Tech. Eco-Innov0.3236190.508776
Coop. Develop.0.4667360.678396
~Coop. Develop.0.5332640.533506
Coop. Use0.4613490.670566
~Coope. Use0.5386910.538896
* The symbol (~) represents the negation of the characteristic.
Table 4. Models predicting company performance in agri-food companies.
Configuration No.R&DSizeCapitalPers. Innov.Tech. Eco-InnovCoop. Dev.Coop. UseCoverageConsistency
RawUnique
1 0.325890.1472710.86138
2 0.191600.0129810.88862
3 0.158690.0075290.88013
4 0.136170.0349840.91416
5 0.120010.0116830.86481
6 0.101960.0003890.85566
Solution coverage: 0.545012
Solution consistency: 0.848095
Frequency threshold = 1; consistency threshold = 0.886128.

