Article

Effects of Straw Returning and Residue Cleaner on the Soil Moisture Content, Soil Temperature, and Maize Emergence Rate in China’s Three Major Maize Producing Areas

1
Key Laboratory of Bionic Engineering, Ministry of Education, Jilin University, Changchun 130022, China
2
College of Biological and Agricultural Engineering, Jilin University, Changchun 130022, China
*
Author to whom correspondence should be addressed.
Sustainability 2019, 11(20), 5796; https://0-doi-org.brum.beds.ac.uk/10.3390/su11205796
Submission received: 10 August 2019 / Revised: 6 October 2019 / Accepted: 17 October 2019 / Published: 18 October 2019
(This article belongs to the Special Issue Suitable Agronomic Techniques for Sustainable Agriculture)

Abstract

:
Straw returning is of significant value for the sustainable development of agriculture, but it can easily cause the decrease of soil moisture content (SMC) and soil temperature (ST), leading to the serious reduction of maize emergence rate (MER). This paper focuses on the influence law and influence principle of straw returning amounts and residue cleaner on SMC, ST, and MER. This paper selected representative areas of China’s three major maize-producing areas as test sites to take two-factor tests. Four levels were selected with straw returning amounts of 30%, 50%, 70%, and 100%. Three types of residue cleaners were selected: corrugated disc (CD), profiling residue cleaner (PRC), and rotary blade (RB). The test results show that the test factors have significant effects on the test indicators, and there is an interaction between the test factors. However, due to the large difference in annual average temperature, the influence of test factors on ST in different major maize producing areas is not the same. In order to obtain the optimal combination of factors in the three major maize producing areas, the nine regression models and the combination of factors corresponding to the extreme values were obtained through MATLAB. The following conclusions are drawn from the regression models: The maize emergence rate reached 91.7% when using PRC, and the amount of straw returning was 52% at the Jilin Maize Production Area. The maize emergence rate reached 94.7% when using CD, and the amount of straw returning was 67% at the Heilongjiang Maize Production Area. The maize emergence rate reached 91.4% when using CD, and the amount of straw returning was 68% at the Inner Mongolia Maize Production Area. This paper discussed the principle that test factors have a significant impact on test indicators. It is believed that, because the test factors can change the residual cover thickness (RCT) and soil compactness (SC), they have a significant impact on SMC and ST. In addition, it is believed because the test factors can change SMC, ST and the difficulty of cleaning operations, they have a significant impact on MER. At the same time, the basis for selecting straw returning amounts and rescue cleaner under different conditions is discussed. This paper can provide theoretical support and data reference for the sustainable development of agriculture in China’s three major maize producing areas.

1. Introduction

Straw returning means that more than 30% of the residue (stalk) covers the soil after harvesting [1,2]. It has the advantage of preventing soil erosion and increasing the soil organic matter content [3,4]. Therefore, straw returning is of great significance to the sustainable development of agriculture [5,6]. However, the residues covering the soil will impede the exchange of moisture and heat between the soil and the outside world [7], which will have great influences on the soil moisture content (SMC) and soil temperature (ST) during sowing [8]. There will be different SMC and ST values with different straw returning amounts [9,10]. Within a certain range, with the increase of SMC and ST, the transport ability of maize roots to organic matter and water is improved, the respiration of roots is enhanced, the accumulation of carbohydrates is increased, and the activity of microorganisms and enzymes in soil is enhanced [11,12]. In addition,, straw returning can affect the operation quality of the planter [13]. Therefore, if the straw returning amount is not appropriate, the emergence of various food crops, such as maize and soybean, will be difficult [14].
As a typical high-warmth and high-water crop [15,16], the growth of maize requires proper soil Zhengzhou, China moisture and soil temperature [16]. Therefore, if the selected straw returning amount and residue cleaner are unreasonable, the soil moisture content and soil temperature will be insufficient, which will seriously affect the growth of maize [17,18]. The Inner Mongolia Maize Production Area, the Heilongjiang Maize Production Area, and the Jilin Maize Production Area are the three largest maize producing areas in China. They are all located in the Phaeozem region of Northeast China, whose total output accounts for more than 40% of the country [19]. The three major maize producing areas in China are typical cold-temperate climates. Compared with China’s maize producing areas such as Central China, South China, and Northwest China, the temperature is lower and the rainfall is lower [20]. The average temperatures before spring planting (April) are 8.2, 10.1, and 13.8 °C, respectively [21,22,23]. The annual average precipitation is 582, 594, and 576 mm [21,22,23]. At present, is very little research on the influence of the straw returning amount on SMC and ST, and we are faced with a situation where the right straw returning amount cannot be chosen during spring sowing. The maize emergence rate (MER) has even dropped to 75% in some areas where straw returning was implemented [24,25]. Therefore only 15%–20% of the maize growing areas currently use straw returning [26,27]. In summary, it is really necessary to study the effect of the straw return amount on SMC, ST, and MER.
The generalization of any agriculture technique should be supported by matched agricultural equipment [28]. Residue cleaner is the most important agricultural equipment used in straw returning. It is used to clean up the residue and loose soil during sowing [29]. Thus, SMC, ST, and MER are affected by the use of different residue cleaners in sowing.
In all, we conducted a two-factor test at three sites, separately selected, in the three major maize producing areas, to study the effects of the straw returning amount and the type of residue cleaner used on SMC, ST, and MER. Regression models between straw returning amounts and MER were established under different residue cleaner conditions. The optimal straw returning amount and residue cleaner combination that produced the best emerging effect was identified. Our findings will accelerate the generalization of straw returning in China’s three major maize producing areas.

2. Materials and Methods

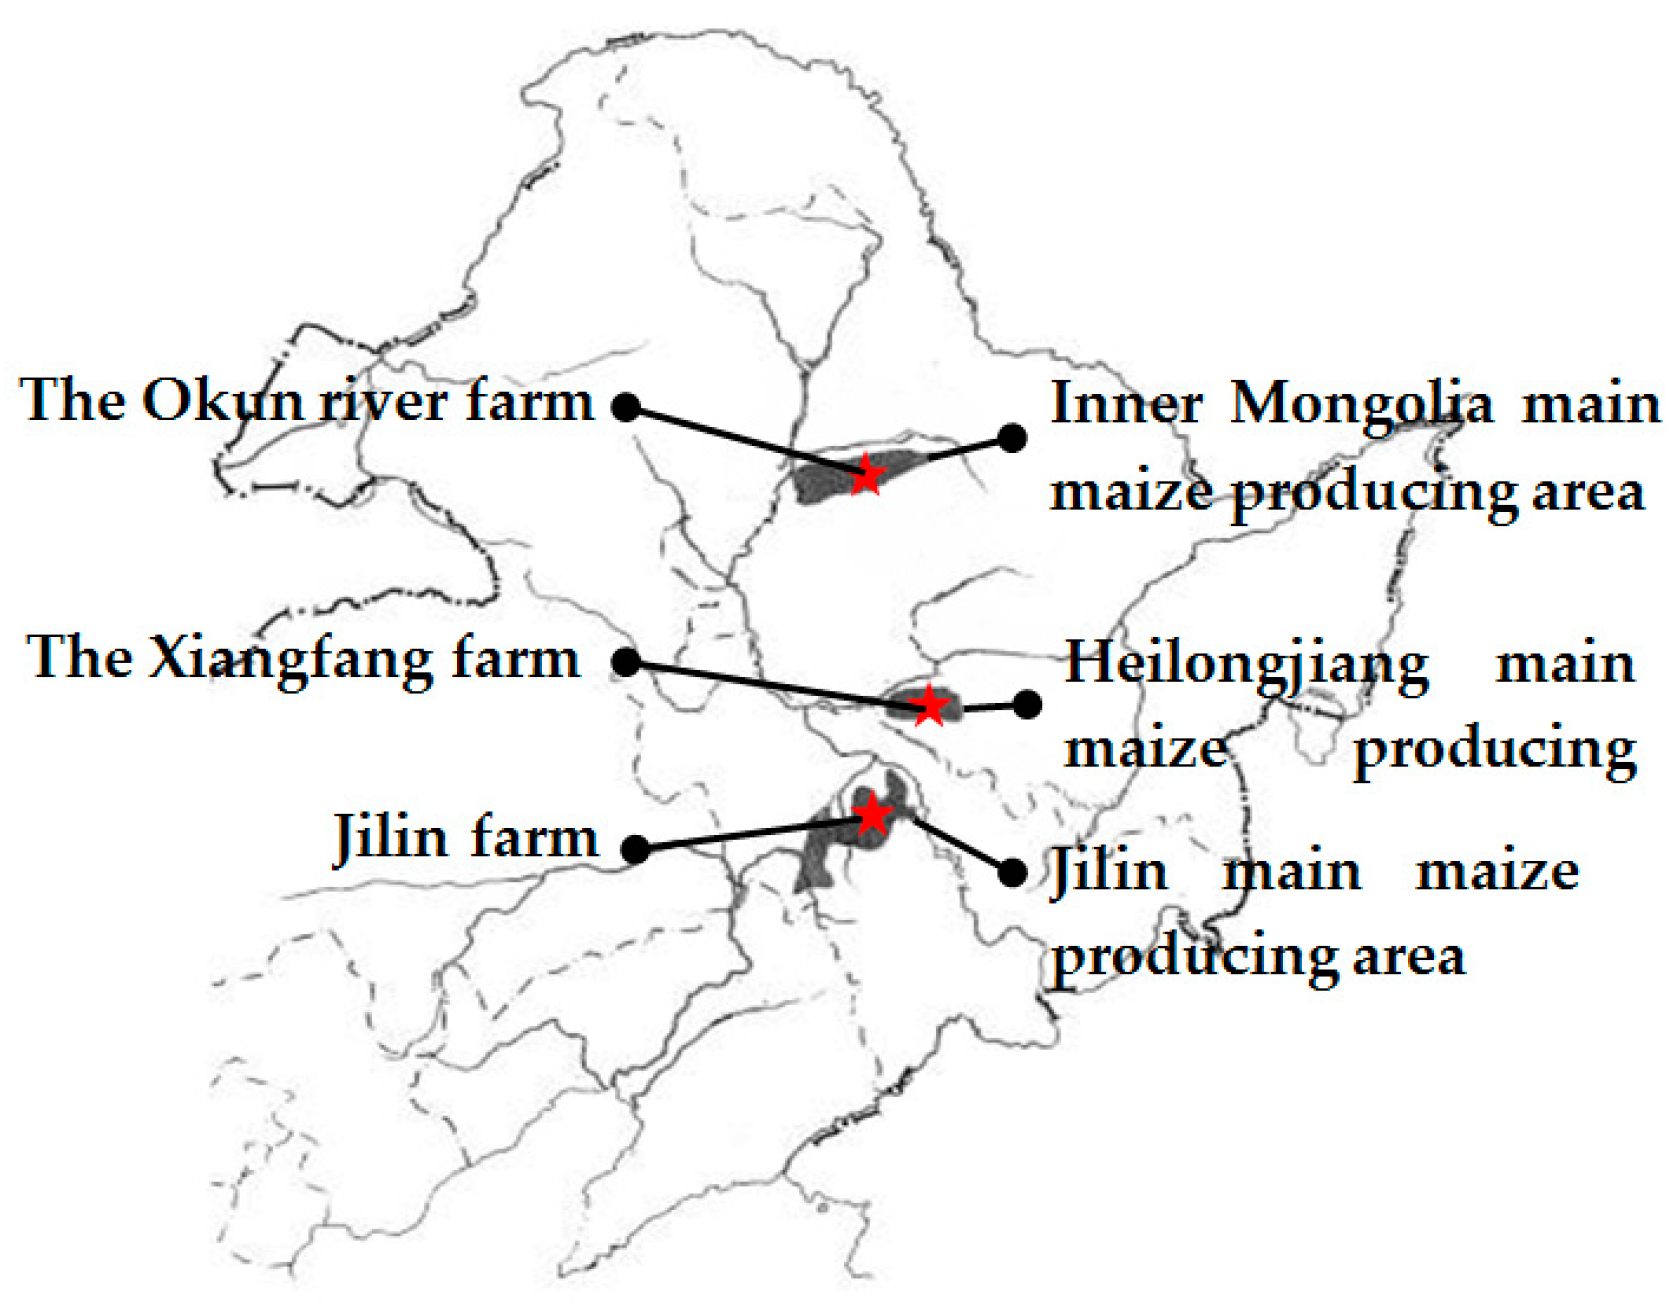
2.1. Site Description and Test Time

The soil moisture content (SMC) and soil temperature (ST) are affected by the straw returning amount and the type of residue cleaner. In addition, they are affected by the soil type and climate features, including the sowing temperature, annual sunshine hours, and annual precipitation [30]. Thus, when the test site was selected, its climate needed to be considered [31].
As shown in Table 1, the soil type in the three major maize producing areas is black clay, according to WRB classification. There is little difference in the annual sunshine time and annual precipitation in the three major maize producing areas. Taking the Inner Mongolia Maize Production Area as an example, there is a 200-hour difference between the two sites, with the largest difference being in annual sunshine hours. Additionally, there is only a gap of 42 millimeters between the two sites, with the largest difference being in annual precipitation.
There are large differences in the sowing temperature in the three major maize producing areas. The sowing temperature is 18% and 40% lower in the major producing areas of Inner Mongolia than in the other two major producing areas.
We selected one test site in each of the three major maize producing areas (Figure 1). The basis for selecting the test site is that the difference between the spring sowing temperatures of the test site and the major maize producing areas is not greater than 3%. The climate indicators of the three major maize producing areas in nearly 30 years are shown in Table 1. The climate indicators of the three test sites in nearly 30 years are shown in Table 2. Inner Mongolia Okun River farm (49.79 °N, 124.81 °E, altitude 387 mm) was selected as the test site of the Inner Mongolia Maize Production Area, referred to as N. Xiangfang farm (45.71 °N, 126.66 °E, altitude 152 m), was selected as the test site of Heilongjiang Maize Production Area, referred to as M. Experimental field of agricultural machinery (43.84 °N, 125.33 °E, altitude 152 m), was selected as the test site of the Jilin Maize Production Area, referred to as S. As shown in Table 1 and Table 2, the selected test site can represent the climate characteristics of the major maize producing area in which it is located. Therefore, the research findings from the test site are highly likely to apply to the major maize producing area where it is located.
The data presented in Table 3 were obtained on the day before the sowing operation, and they reflect the soil conditions. The soil temperature was measured by an 11,000 Temperature Gauge (Midwest company, USA). The soil moisture content was measured by the MS-350 Soil Moisture Content Tester (Spectrum company, USA). The soil compactness was measured by the SC-900 Soil Compactness Tester (Spectrum company, USA). The pH was measured by the HT-PHJ Soil Acidity Meter (Lubo company Qingdao, China). The Olsen-K, Olsen-P, organic matter, and total nitrogen content were all measured by the PJ-TQN all-round Soil Fertilizer Nutrient Speedometer (pengjian agricultural science and technology company, Zhengzhou, China). The pH, organic matter content, total nitrogen content, Olsen-K, and Olsen-P indicators in Table 3 indicate the acidity and alkalinity of the soil, as well as the contents of organic matter, N, P, and K in the soil. The above five indicators are affected by the type of fertilizer and the amount of chemical fertilizer applied [32], showing the fertility status of the soil [33]. When soil fertility is better, the maize emergence rate is higher [34]. The test instrument is shown in Figure 2.
To verify that the test data obtained in the spring of 2018 are representative, we compared the data obtained from the Statistical Yearbooks during spring sowing in 2018 with the average values of the past 30 years, including the sowing temperature and annual precipitation at three test sites. The annual sunshine hours and annual precipitation were relatively stable over the past 30 years, except for in 1990 and 1998. The sowing temperature in spring has slightly increased [21,22,23]. The annual precipitation was 593 mm, the annual number of sunshine hours was 2550 h, and the sowing temperature was 8.1 °C at test site N in 2018 [21,22,23]. The annual precipitation was 601 mm, the annual number of sunshine hours was 2600 h, and the sowing temperature was 10.3 °C at test site M in 2018 [21,22,23]. The annual precipitation was 595 mm, the annual number of sunshine hours was 2600 h, and the sowing temperature was 14.4 °C at test site S in 2018 [21,22,23]. The gap was less than 3% between the main climate indicators of the three test sites and their corresponding average values for the past 30 years (Table 2). Therefore, the test data for 2018 were deemed to be generally representative.

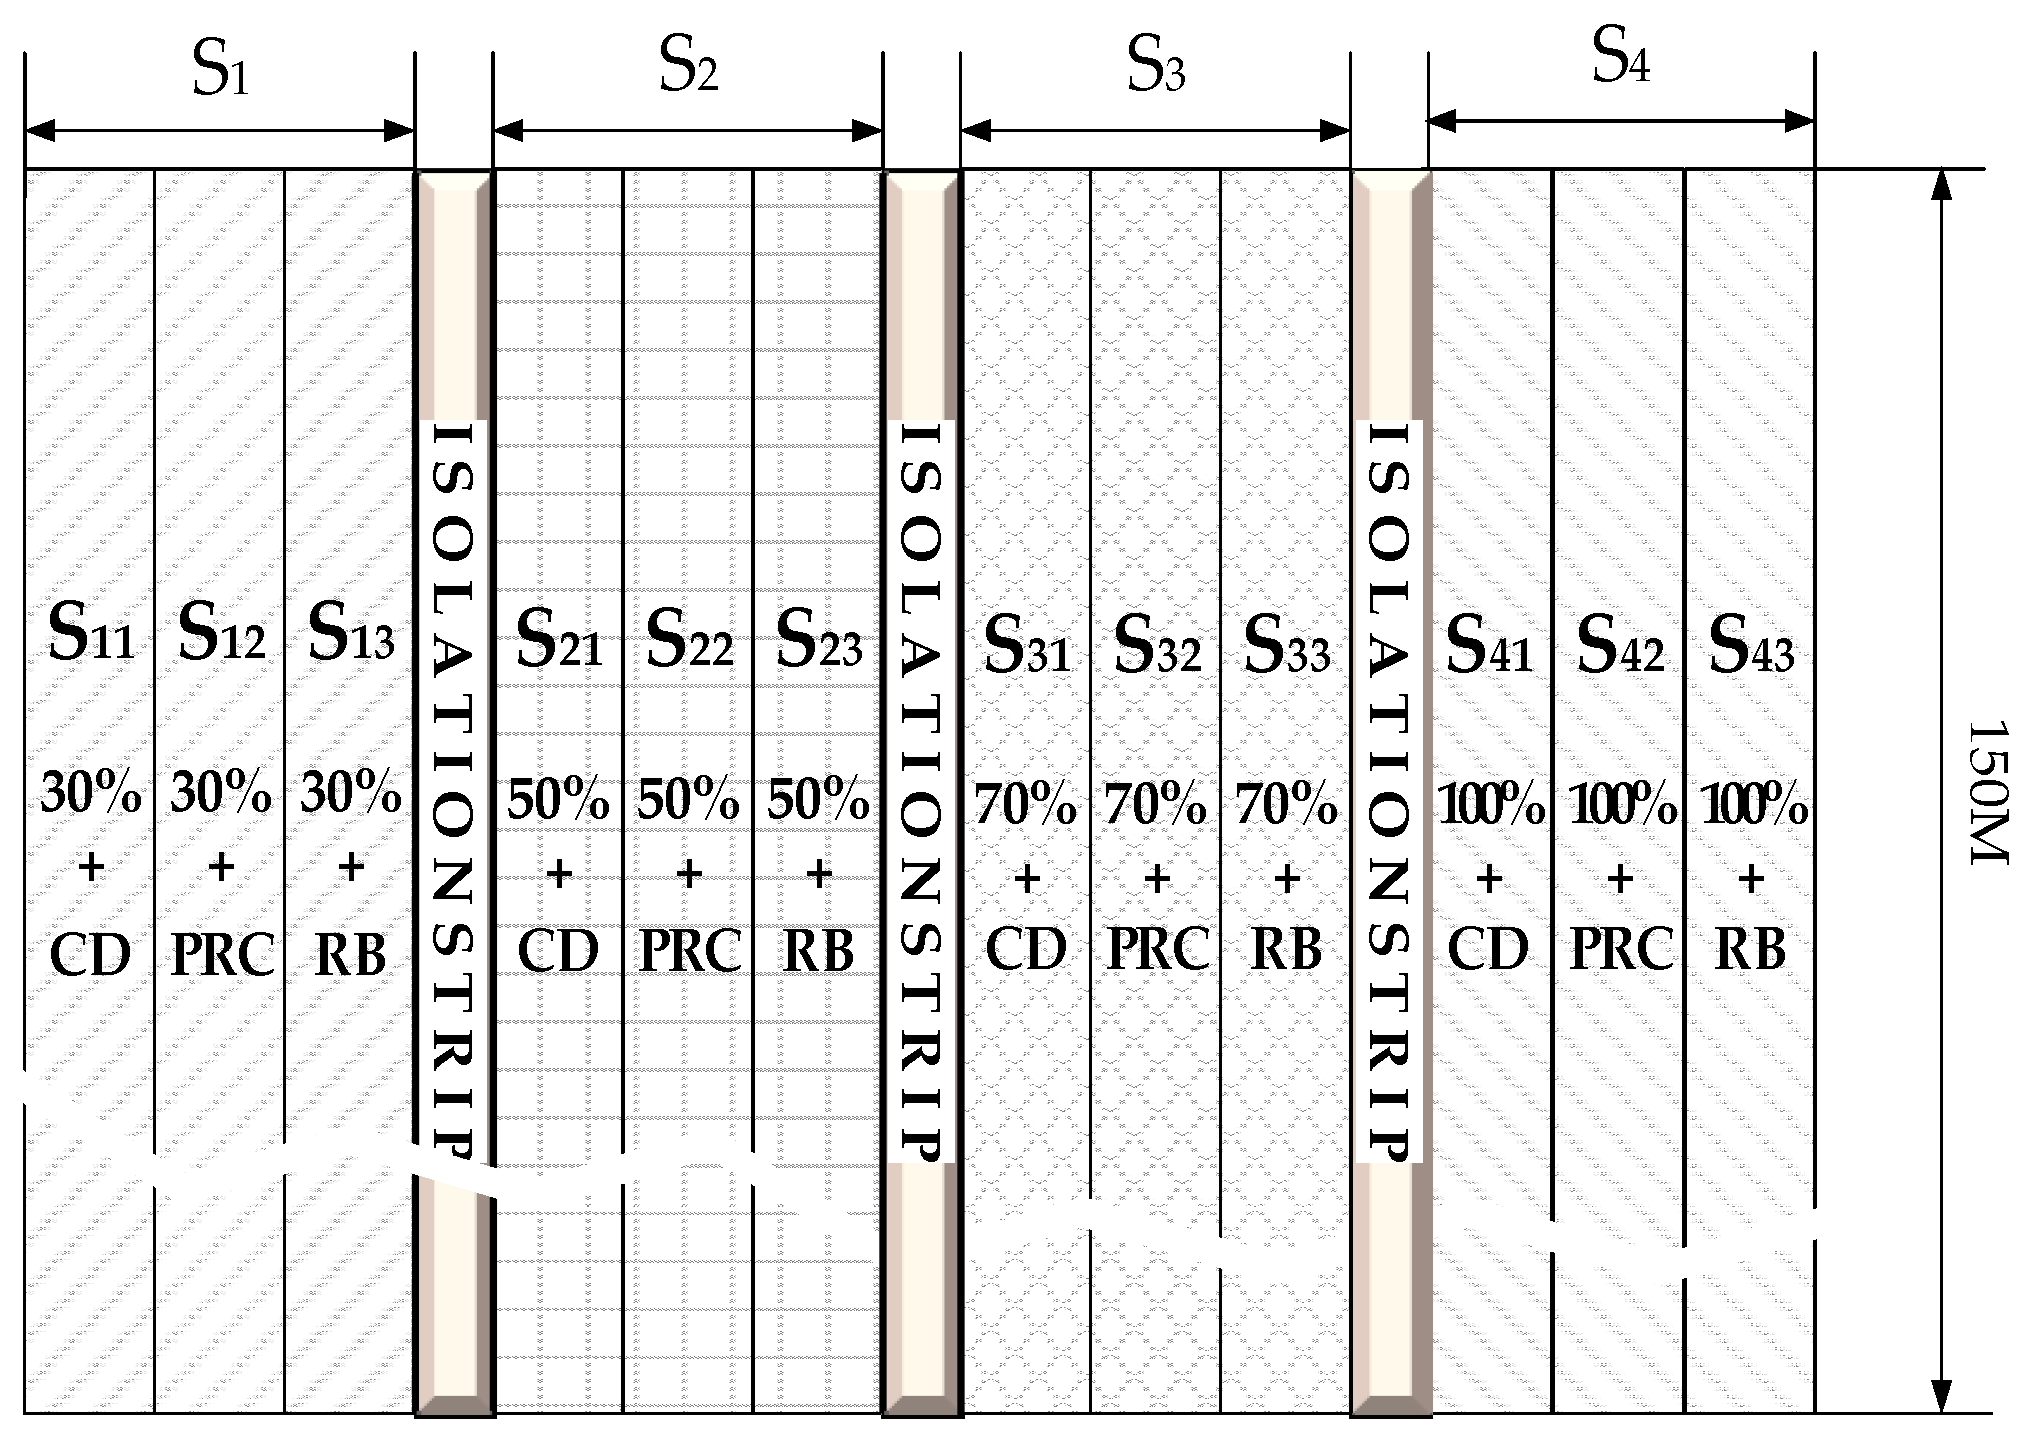
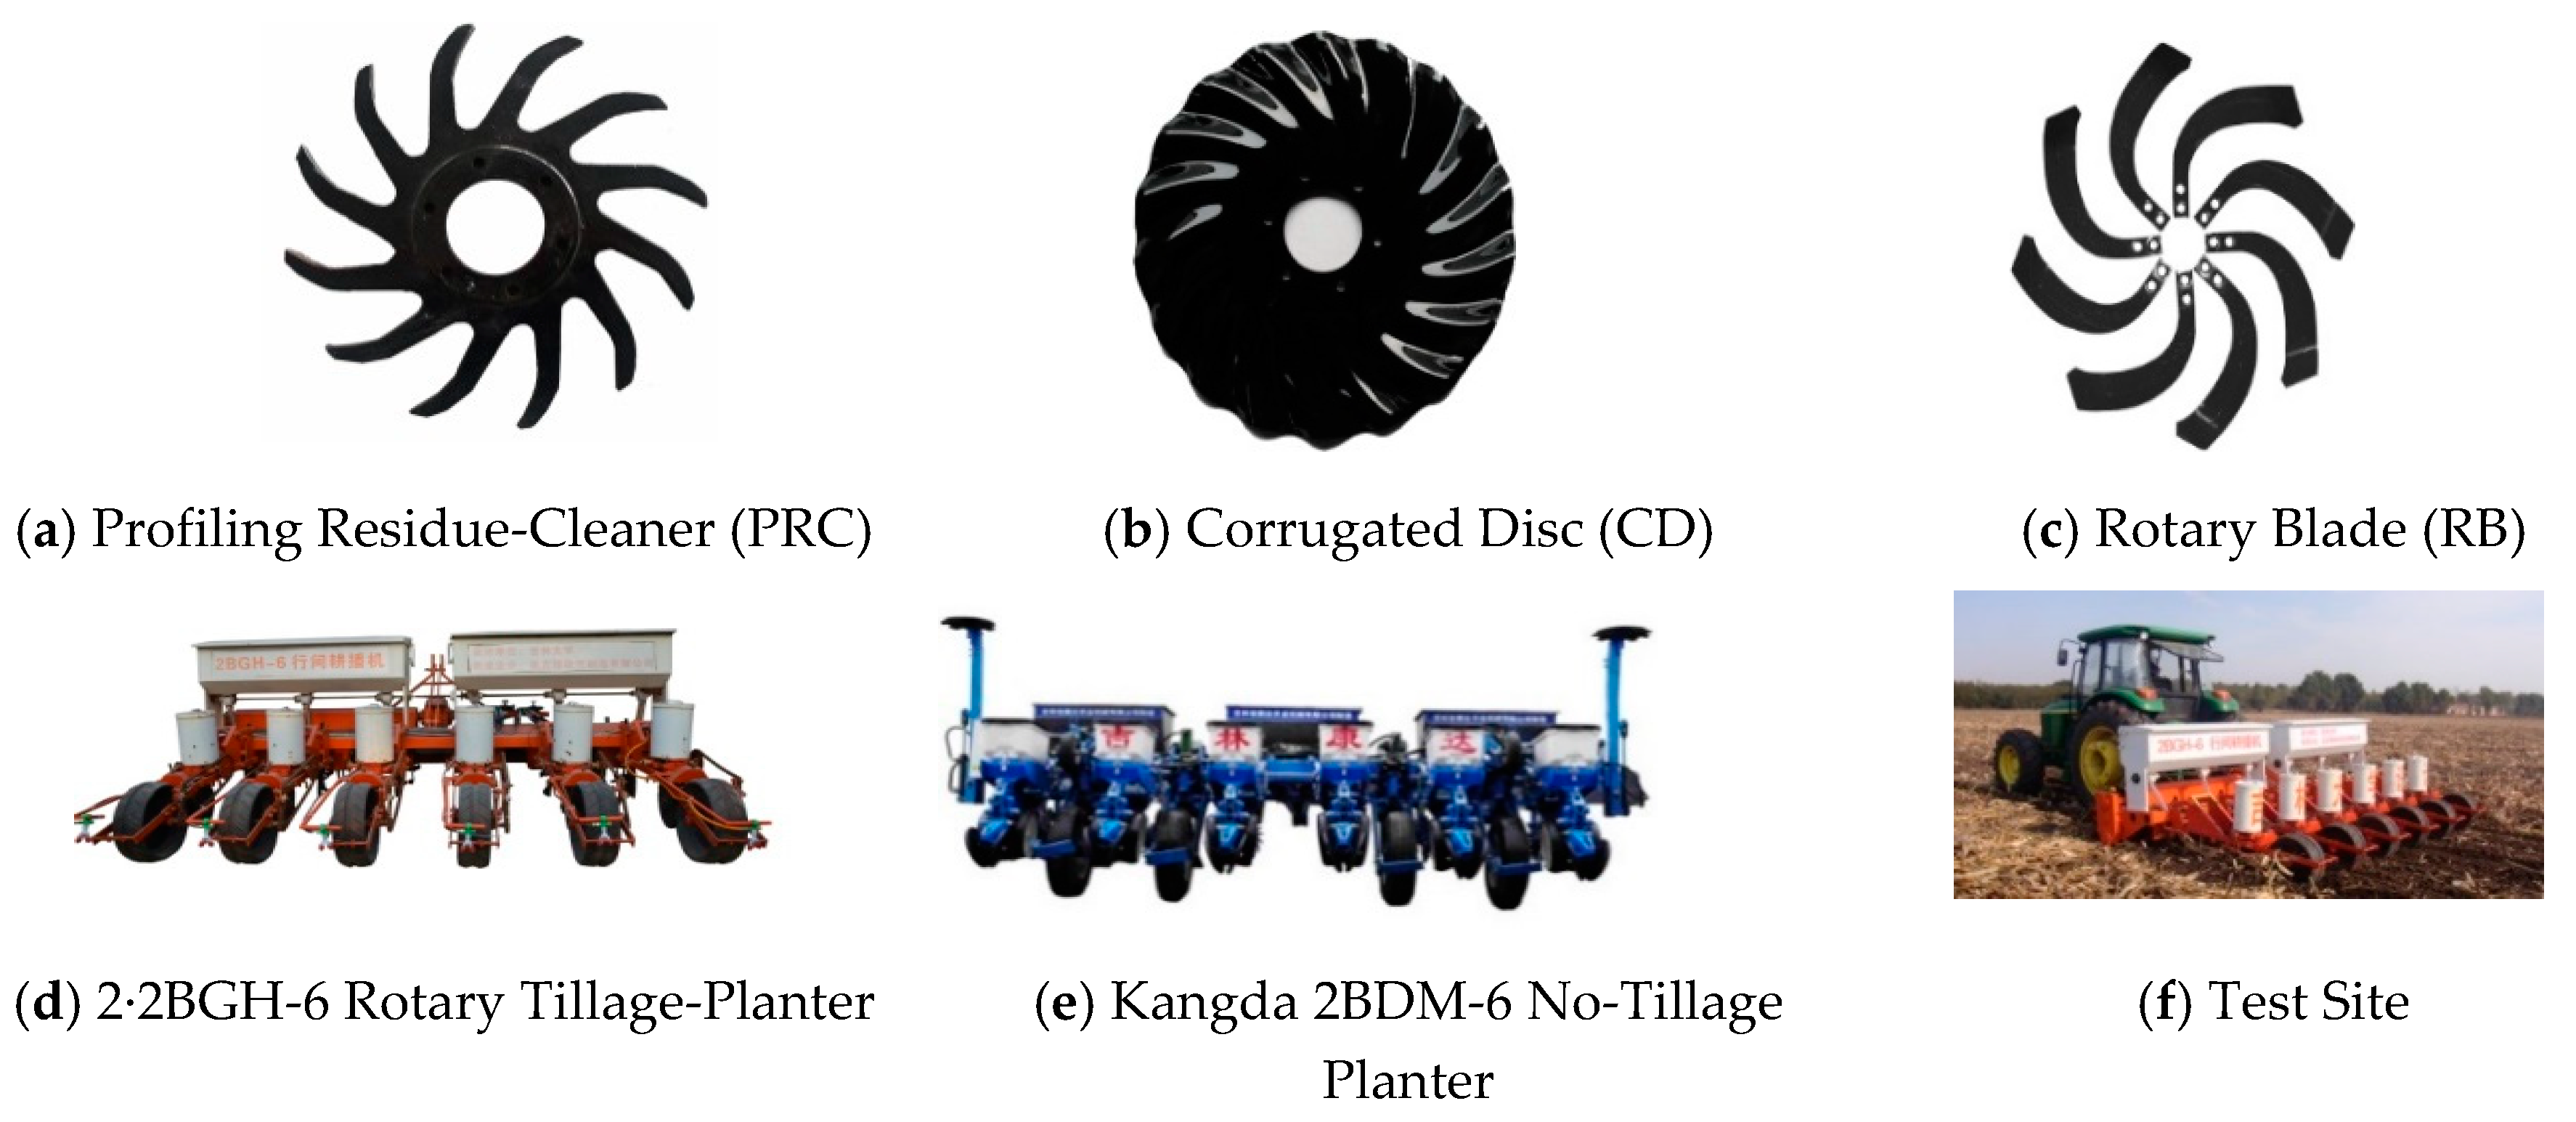
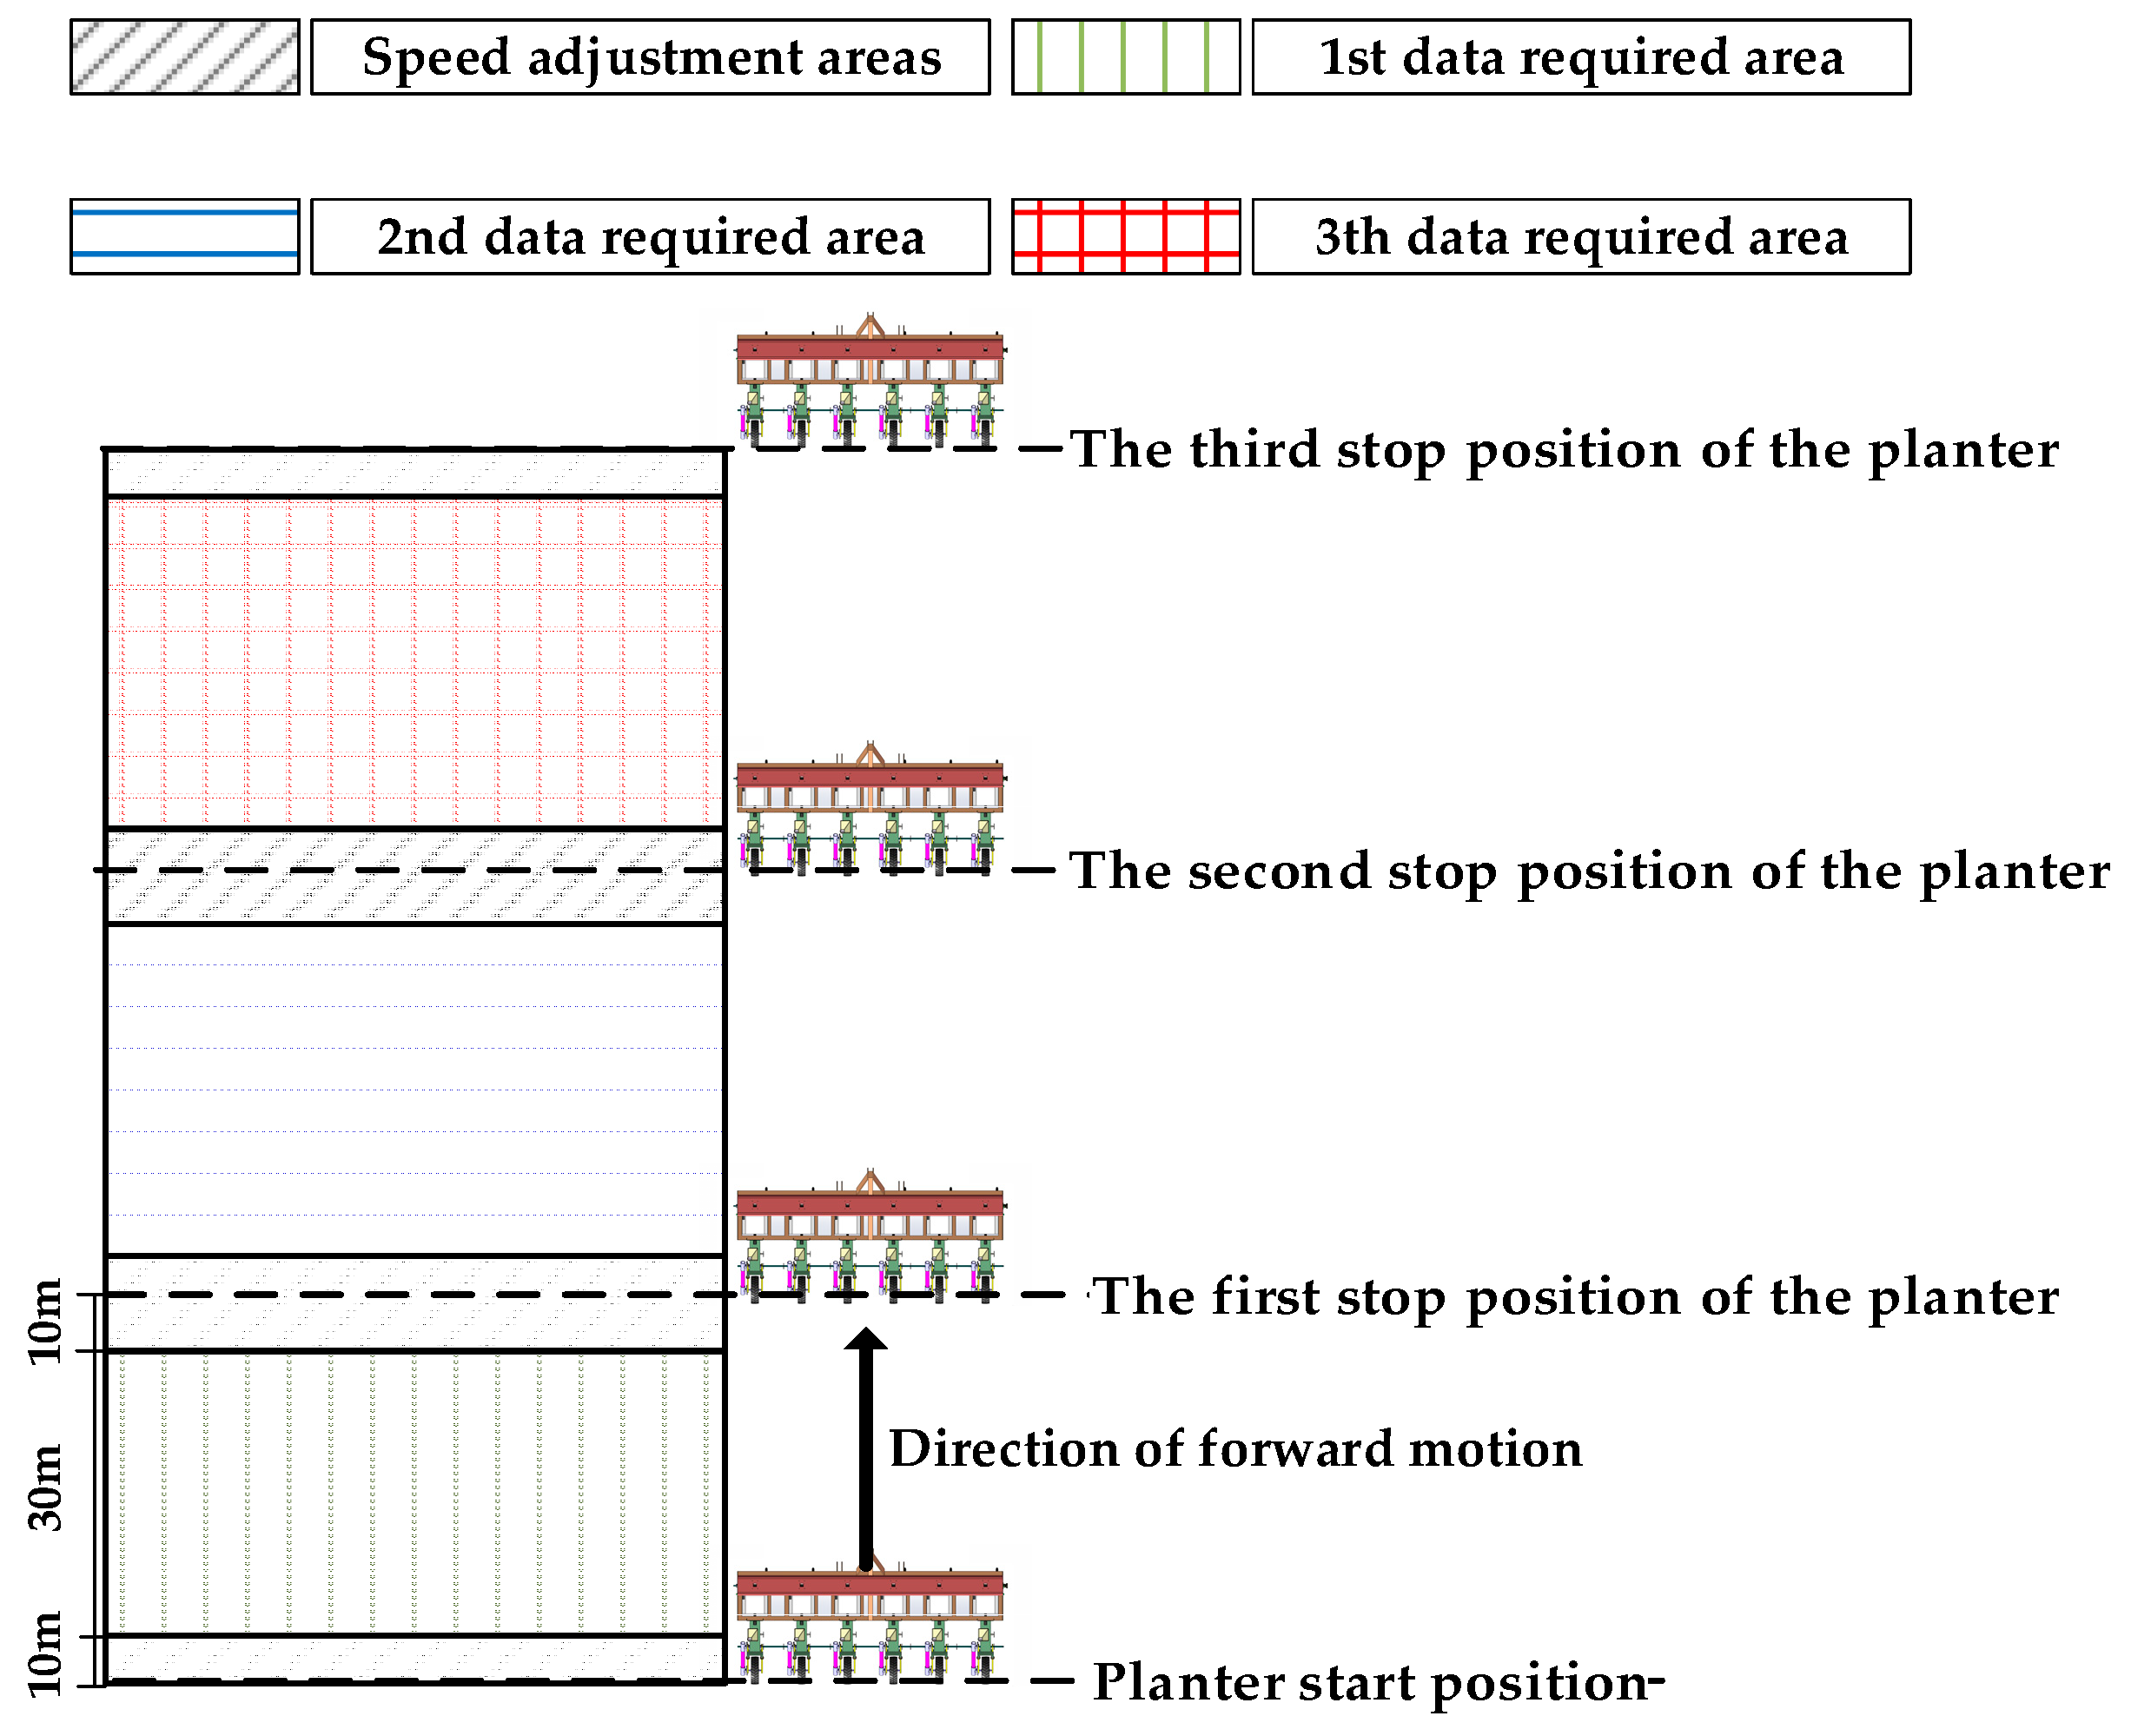
2.2. Experimental Design and Treatment Methods
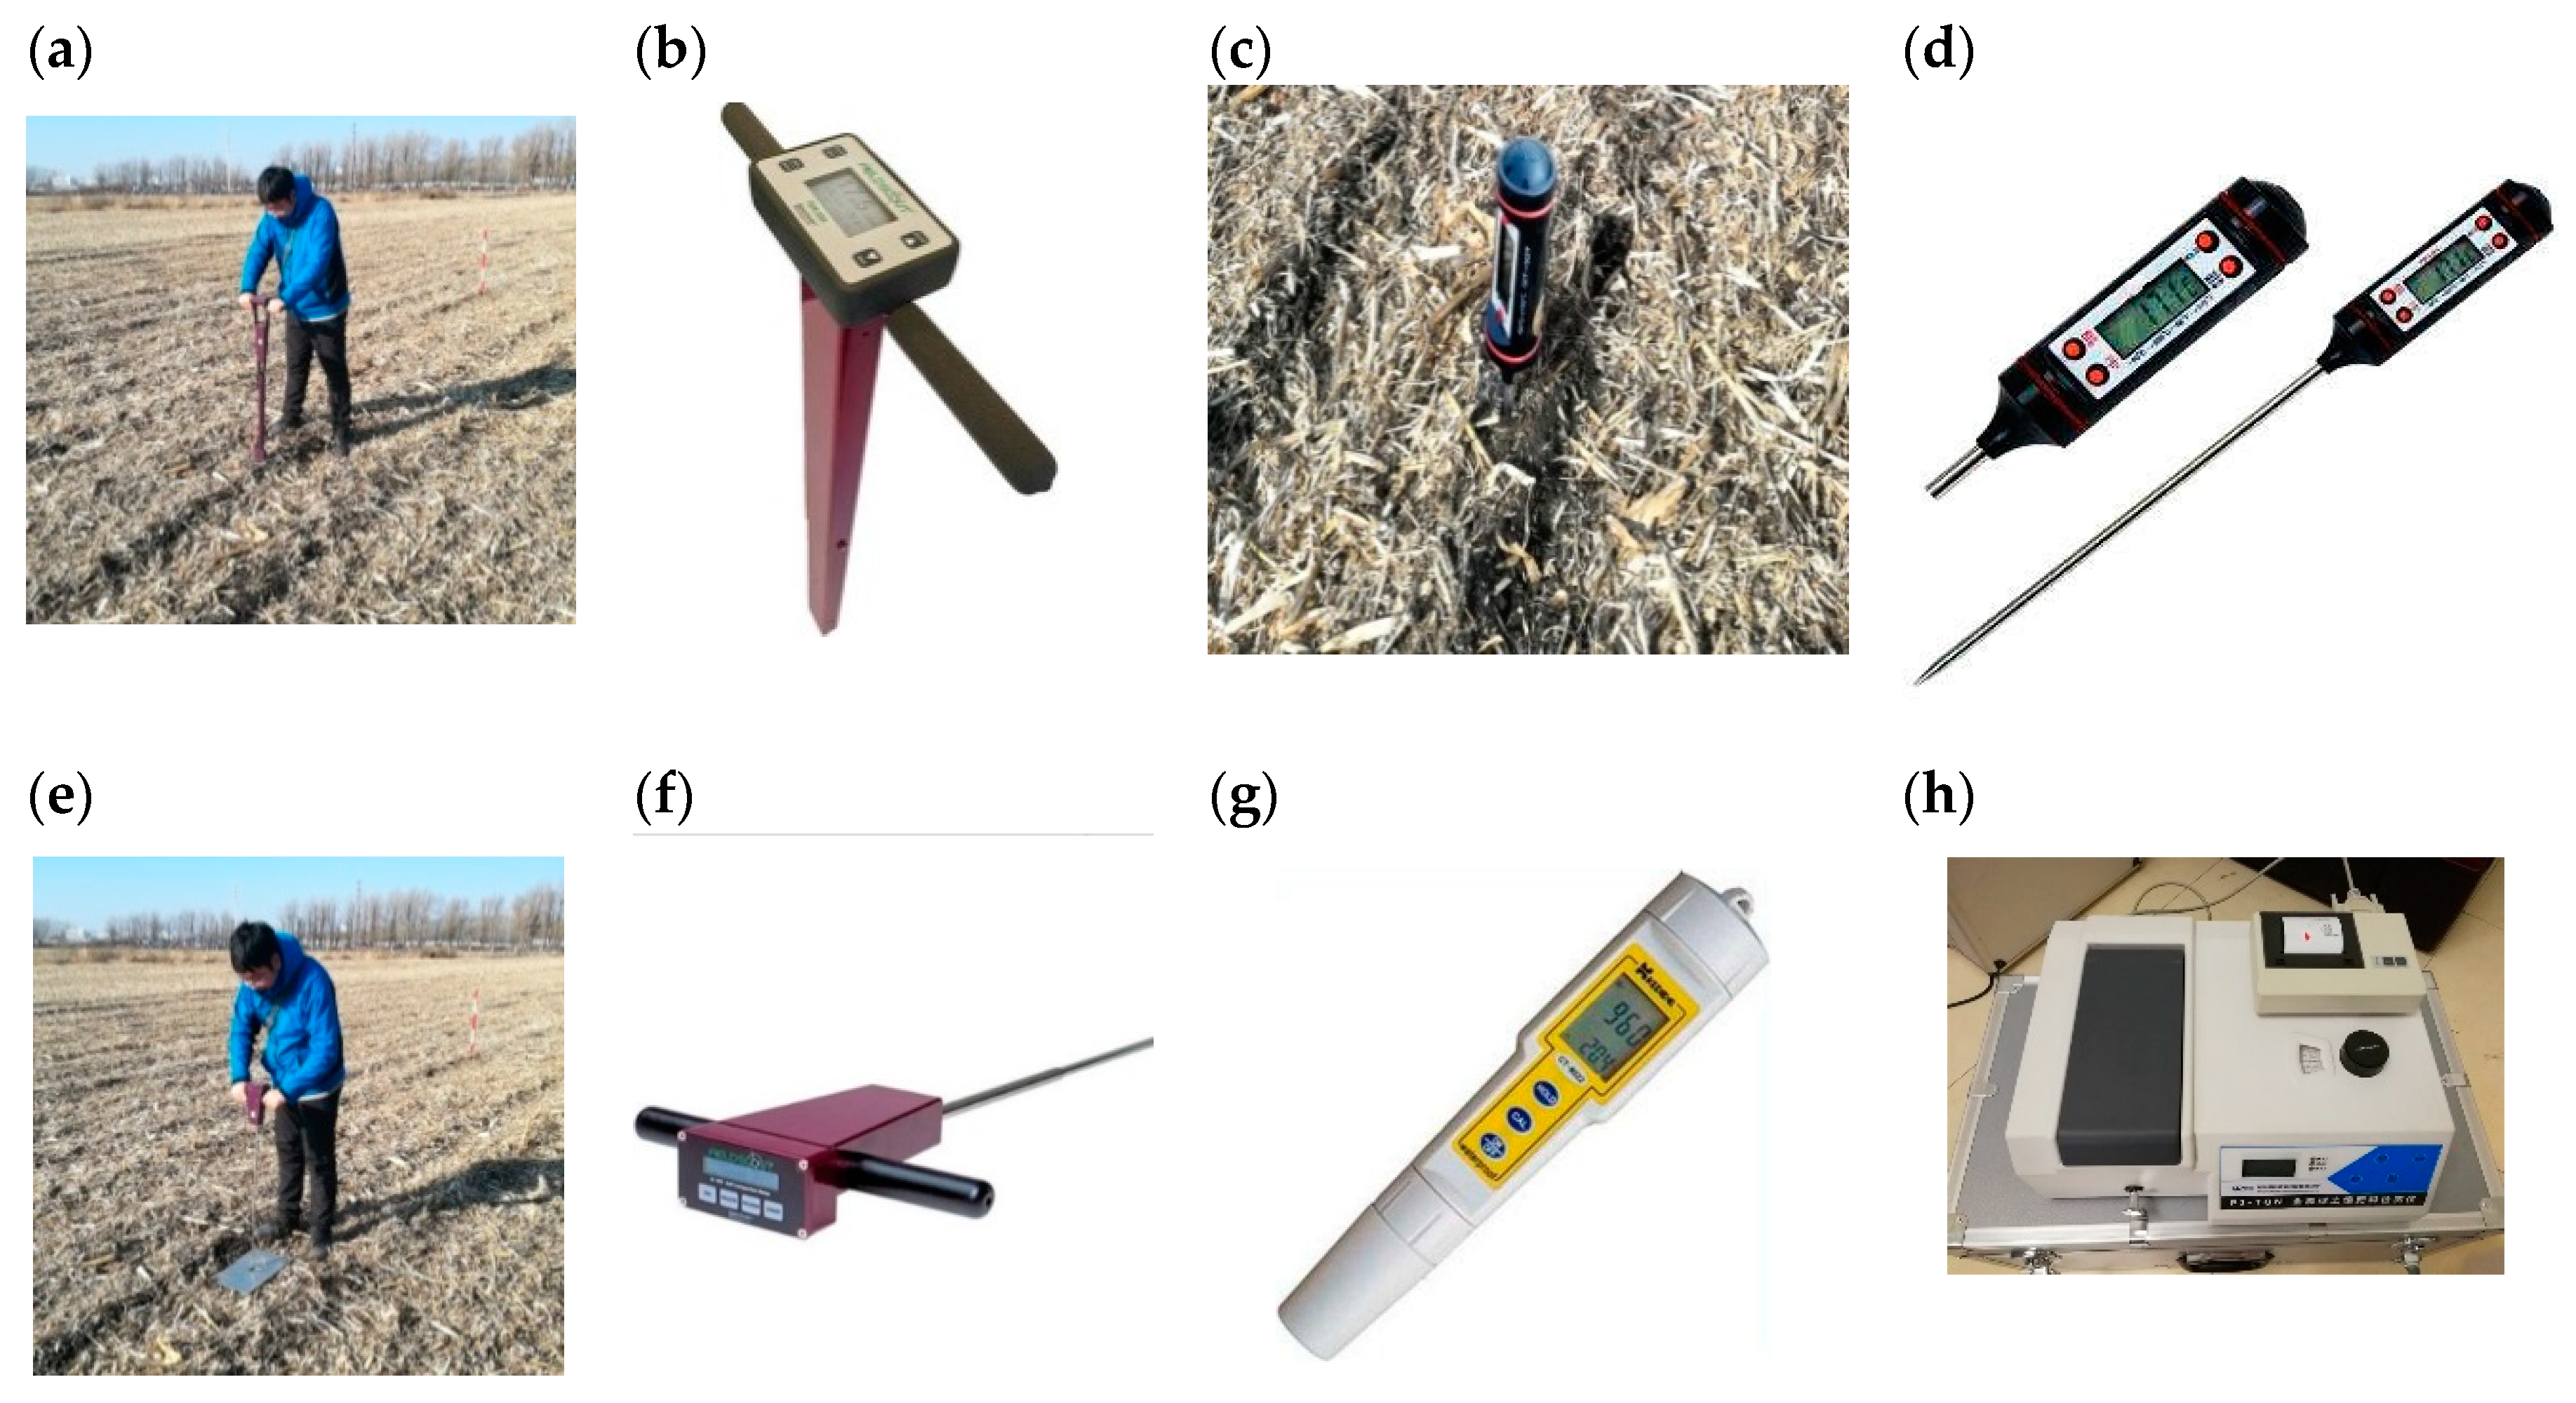
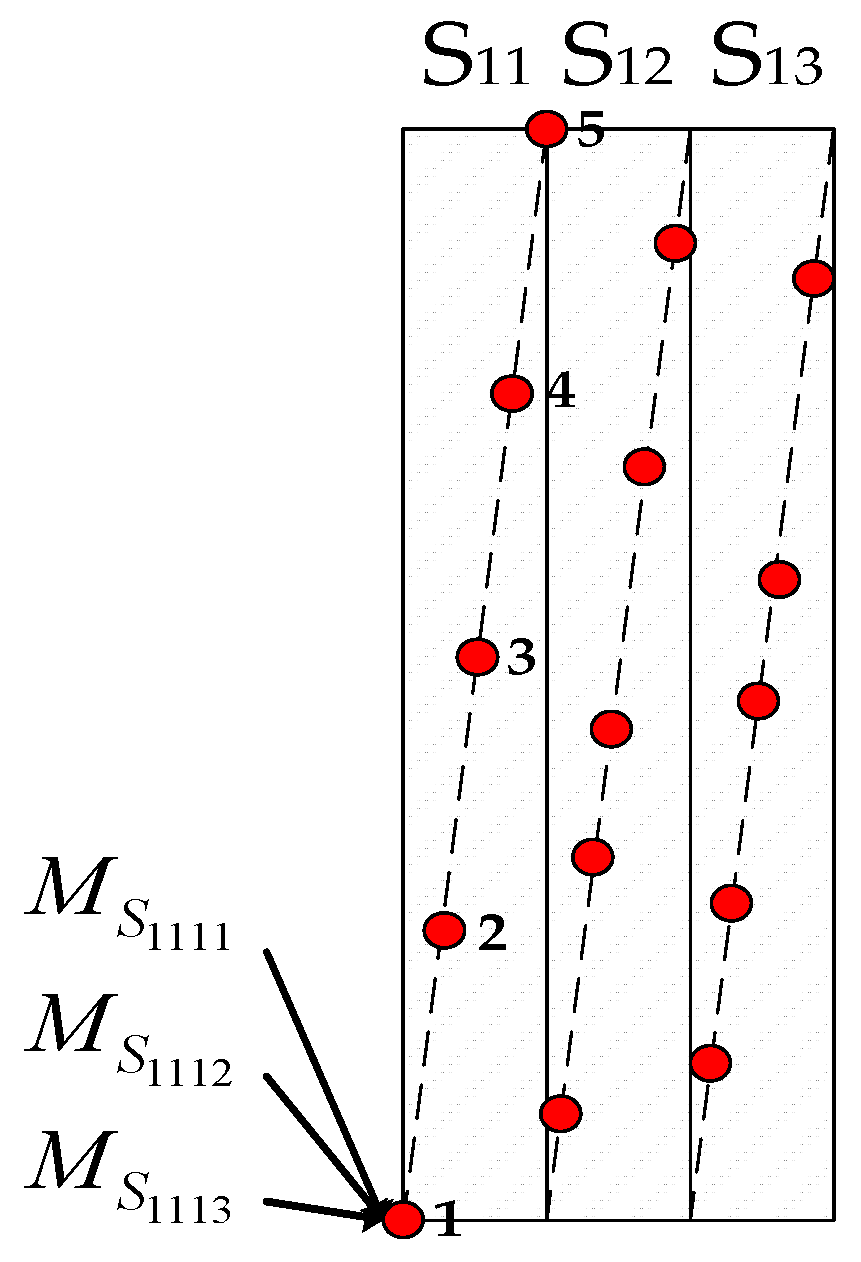
The main problem faced by straw returning in the promotion of China’s three major maize producing areas is choosing a reasonable amount of straw returning and residue clearing [35,36], so this paper aims to study the effects of straw returning and residue cleaner on the SMC, ST, and MER. The definition of straw returning is to cover no less than 30% of straw on the soil [37]. Therefore, the straw returning amount must be greater than 30%. At the same time, residue cleaner must be used to clean the straw out of the seedling belt after the straw returning, to ensure that the seeds fall into the seed trench [38]. The three most common cleaning institutions in China’s three major maize producing areas were selected.
Two-factor multilevel tests were conducted at each test site. Four levels were selected with straw returning amounts of 30%, 50%, 70%, and 100%. Three types of residue cleaner were selected: corrugated disc (CD), profiling residue cleaner (PRC), and rotary blade (RB). First, 4 blocks were set at each test site, and then 3 plots were set in each block. Each plot was 6 ridges wide and 150 m long, with a width of 0.75 m per ridge. Each test plot and its corresponding factor combination is shown in Figure 3. The residue-cleaners and planters are shown in Figure 4.

2.3. Measurements

2.3.1. Soil Moisture Content (SMC)

The SMC has a significant impact on the respiration of crop roots, further affecting the emergence rate of maize [39], so the SMC was selected as one of the test indicators. The SMC was measured on the 15th day after sowing [40]. As shown in Figure 5, 5 points were randomly selected on the diagonal line of each plot, and the SMC of each point at a depth of 200 mm was detected by the MS-350 Moisture Meter (Spectrum company, USA, resolution: 0.1% VWC, accuracy: ±0.3% (EC < 2 mS/cm), range: 0–50%, power: 4 AA batteries, data capacity: 50,000 GPS data). Each point was detected 3 times, and the average value is obtained from 15 measured values, which was used as the SMC of the corresponding plot. Then, the average value and standard deviation of SMC of the corresponding plot were determined as follows:
M S n k ¯ = i = 1 5 j = 1 3 M S n k i j 15
M S n k = i = 1 5 ( j = 1 3 M S n k i j 3 M S n k ¯ ) 2 5
where M S n k ¯ (%) is the average SMC in the S n k . M S n k (%) is the standard deviation of SMC in the S n k . M S n k i j (%) is the j-th measurement value of the i-th test point in the S n k . S n k is the kth plot in the n-th block in the test site (Figure 3).

2.3.2. Soil Temperature (ST)

The ST has a significant impact on the enzyme activity of soil, further affecting the emergence rate of maize [41], so the ST was selected as one of the test indicators. The ST was measured on the 15th day after sowing [40]. As shown in Figure 5, 5 points were randomly selected on the diagonal line of each plot, and the ST of each point at a depth of 200 mm was detected by the 11,000 ST Meter (Midwest company, USA, range: –40 to 150 °C, accuracy: ±0.5 °C, resolution: 0.1 °C, battery: 1.5 V button battery). Each point was detected 3 times, and the average value is obtained from 15 measured values, which was used as the ST of the corresponding plot. Then, the average value and standard deviation of the ST of the corresponding plot were determined as follows:
T S n k ¯ = = i = 1 5 j = 1 3 T S n k i j 15
T S n k = i = 1 5 ( j = 1 3 T S n k i j 3 T S n k ¯ ) 2 5
where T S n k ¯ (℃) is the average ST value in the S n k . T S n k (℃) is the standard deviation of the ST in the S n k . T S n k i j (℃) is the j-th measurement value of the i-th test point in the S n k . S n k is the k-th plot in the nth block in the test site (Figure 3).

2.3.3. Maize Emergence Rate (MER)

Reduction of the maize emergence rate is the worst impact during straw returning in China’s three major maize producing areas [42], so MER is regarded as the most important evaluation indicator. As shown in Figure 6, The planter was operated three times in each plot during sowing with an advanced distance of 50 m each time. The first 10 m and the last 10 m of each operation were used as speed adjustment areas, and the rest of the area was used as the data-required area. During the tests, the planter was driven by a John Deere 1204 tractor, and the running speed was 6–8 km/h, which is often adopted in maize sowing works in this region. The maize emergence time in China’s three major producing areas does not exceed 15 days, so the MER was detected on the 15th day after sowing [43]. Then, the average values and standard deviations of MER of the corresponding plots were determined as follows:
E S n k i = N S n k i 30 L × 6 × 100 %
where N S n k i is the number of emergences after the i-th operation of the planter in Zone S n k . L(m) is the maize plant spacing. The length of the test area was 30 (m). The number of ridges was 6. S n k is the k-th plot in the n-th block in the test site (Figure 3).
E S n k ¯ = i = 1 3 E S n k i 3
E S n k = i = 1 3 ( E S n k i E S n k ) 2 3
where E S n k ¯ (%) is the average MER in the S n k . E S n k (%) is the standard deviation of MER in the S n k . E S n k i (%) is the MER after the i-th operation of the planter in the S n k . S n k is the k-th plot in the n-th block in the test site (Figure 3).

2.3.4. Other Indices

Residual Cover Thickness (RCT)

We suspect that the RCT may have an impact on the SMC and ST, because the straw remaining on the soil will also absorb heat and moisture [44]. The RCT was detected on each plot after sowing. As shown in Figure 5, 5 points were randomly selected on the diagonal line of each plot. The cover thickness at each point was measured by using digital images. As shown in Figure 7, the RCT was determined in MATLAB by using the threshold analysis of images, and the average value of 5 points was used as the RCT of the corresponding plot:
H S n k ¯ = i = 1 5 H S n k i 5
H S n k = i = 1 5 ( H S n k i H S n k ) 2 5
where H S n k ¯ (mm) is the average RCT in the S n k . H S n k (mm) is the standard deviation of the RCT in the S n k . H S n k i (mm) is the RCT after the i-th operation in the S n k . S n k is the k-th plot in the n-th block in the test site (Figure 3).

Soil Compactness (SC)

The SC represents the degree of soil porosity [45], so we believe that the SC may have an impact on the SMC, ST, and MER. The SC was measured on the 15th day after sowing. As shown in Figure 5, 5 points were randomly selected on the diagonal line of each plot, and the SC of each point at a depth of 200 mm depth was detected by the SC-900SC detector (Spectrum company, USA, range: 0–450 mm, pressure range: 0–2 Mpa, accuracy: 0.01 Mpa, conical head diameter: 12.827 mm, power: 4AA batteries). Each point was detected 3 times, and the average value is obtained from 15 measured values, which was used as the SC of the corresponding plot. Then, the average value and standard deviation of SC of the corresponding plots were determined as follows:
C S n k ¯ = i = 1 5 j = 1 3 C S n k i j 3 5 = i = 1 5 j = 1 3 C S n k i j 15
C S n k = i = 1 5 ( j = 1 3 C S n k i j 3 C S n k ¯ ) 2 5
where C S n k (MPa) is the average SC in the S n k . C S n k (MPa) is the standard deviation of SC in the S n k . C S n k i j (MPa) is the j-th measurement value of the i-th test point in the S n k . S n k is the kth plot in the n-th block in the test site (Figure 3).

2.4. Statistical Analyses

Analysis of variance (ANOVA), Least Significant Difference (LSD), regression analysis, and Goodness of Fit (GOF) were used in this paper to analyze the statistical data. ANOVA was used to analyze the variance of the obtained data and determine whether the test factors significantly impacted the test indicators. LSD was mainly used to determine whether there were significant differences among the different levels of one test factor and to compare the averages of different levels. The regression analysis was used to build regression models and find theoretical optimal values. The fitness and the significance of the regression equation were tested by the GOF and ANOVA, respectively.

3. Results

The analysis of variance (ANOVA) results of the variables with the respective average values and the results of F-tests are shown in Table 4. The results of F-tests shown in Table 4 were used to determine whether the test factors (SRA and RC) have significant effects on the test indicators (SMC, ST, and MER). The test factors all had significant effects on the test indicators, and there was an interaction between each two test factors.

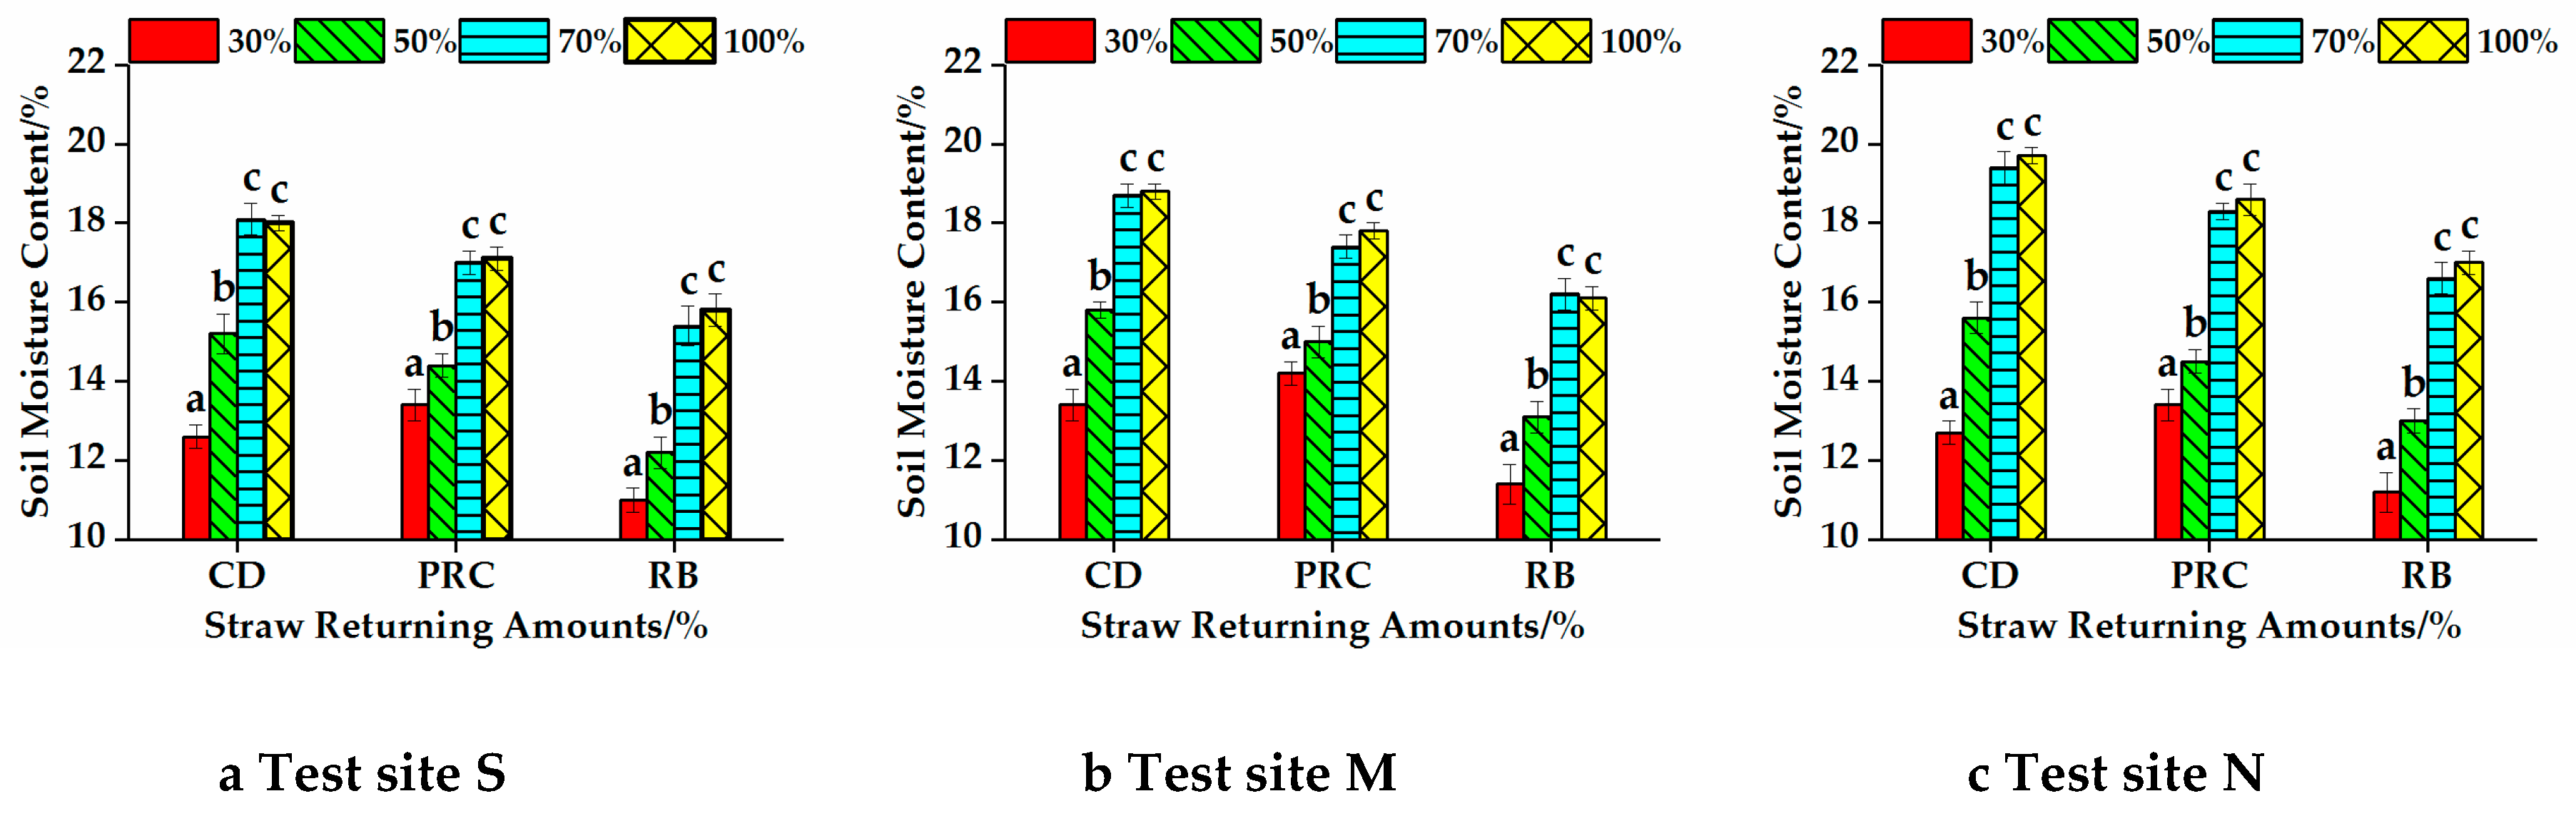
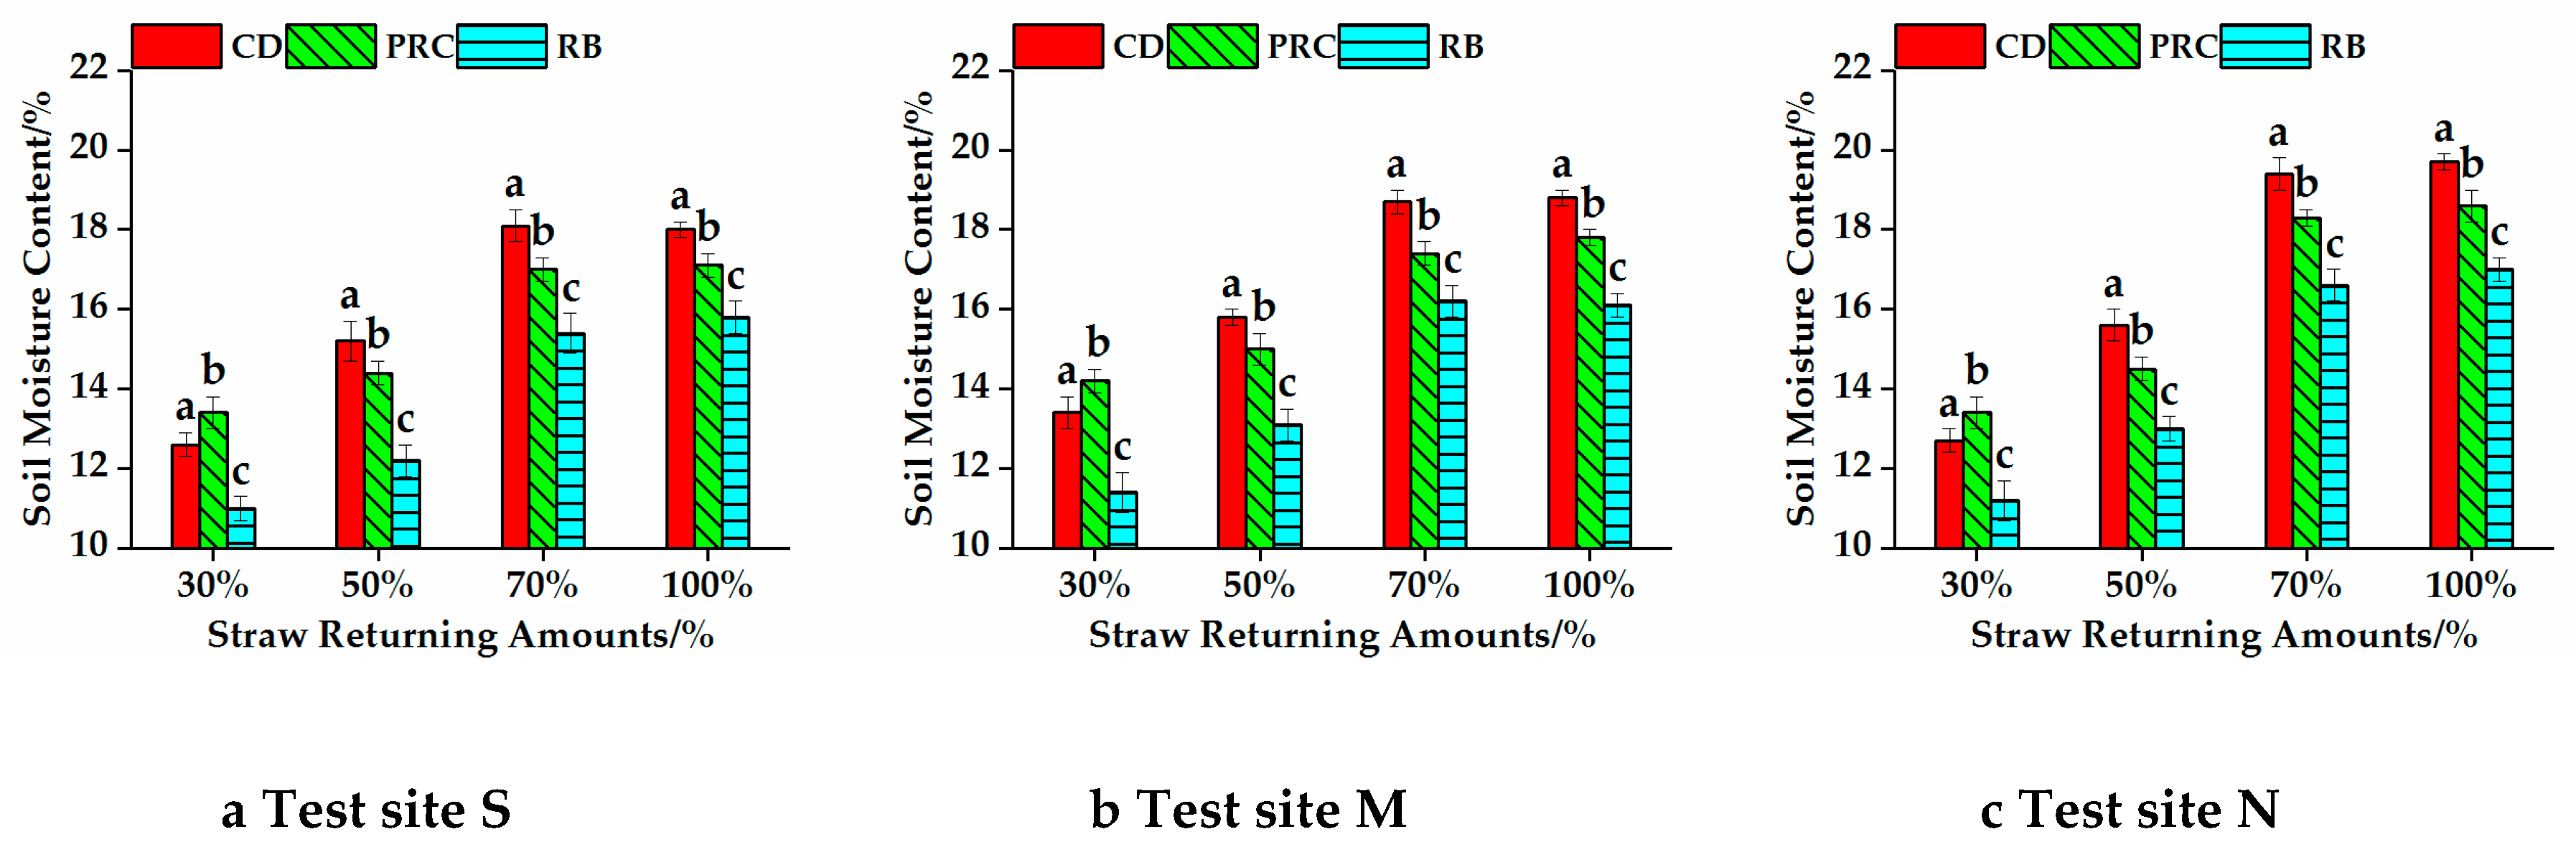
3.1. Effects of SRA and RC on SMC

The ANOVA showed that the straw returning amount significantly affected the SMC (Table 4). The effect of the straw returning amount on SMC in the three major producing areas is roughly the same. The Least Significant Difference (LSD) analysis showed that SMC increased as the straw returning amount increased when the straw returning amount was 30%, 50%, and 70% (Figure 8). However, no significant difference was observed between straw returning amounts of 70% and 100% (Figure 8). The RCT increased as the straw returning amount increased (Table 4). The results show that the straw returning amount had a significant influence on the SMC, as it was found to affect the RCT. Though the residual cover cannot fully block water dissipation, it can decrease the speed of soil water dispersion within a certain range. The above results show that there is a straw returning amount threshold. When the straw returning amount is less than the threshold, SMC is significantly affected. ZhiQing Zhang’s research in the Greater Xing’an Mountains also obtained a similar result [46].
The above results are not fully consistent with the findings of Zhao Hongbo et al. from the province of Hebei [47], which indicated that the SMC always increases as the straw returning amount increases. This inconsistency may be attributed to the differences in maize planting modes between Hebei and the three major maize producing areas. The average planting density of the three major maize producing areas is 1.3 times that of Hebei [48]. The average diameters of maize stalks are 28 and 22 mm in the three major maize producing areas and Hebei [48,49], respectively. When the straw returning amount exceeded 70%, the RCT in the three major maize producing areas was already larger than that of full return in Hebei.
The residue cleaner significantly affected the SMC, as determined by the ANOVA (Table 4). The Least Significant Difference (LSD) analysis showed that SMC varied in the order RB < CD < PRC when the straw returning amount was 30% (Figure 9). The SMC varied in the order RB < PRC < CD when the straw returning amount was 50%, 70%, and 100% (Figure 9). SC varied in the order RB > CD > PRC and RCT varied in the order RB > PRC > CD, as shown in Table 4. Wang qingjie ’s research also obtained a similar result [50]. Our results showed that the residue cleaner had a significant influence on the SMC, as it can affect the RCT and SC. The speed of soil water dispersion was affected by the RCT and SC, especially by the RCT when the straw returning amount was more than 50% and the SC when the straw returning amount was 30%. When the straw returning amount was more than 50%, the trend of the SMC was same as that of the RCT, which was RB < PRC < CD. When the straw returning amount was 30%, the trend of the ST was the same as that of the SC, which was RB > CD > PRC.

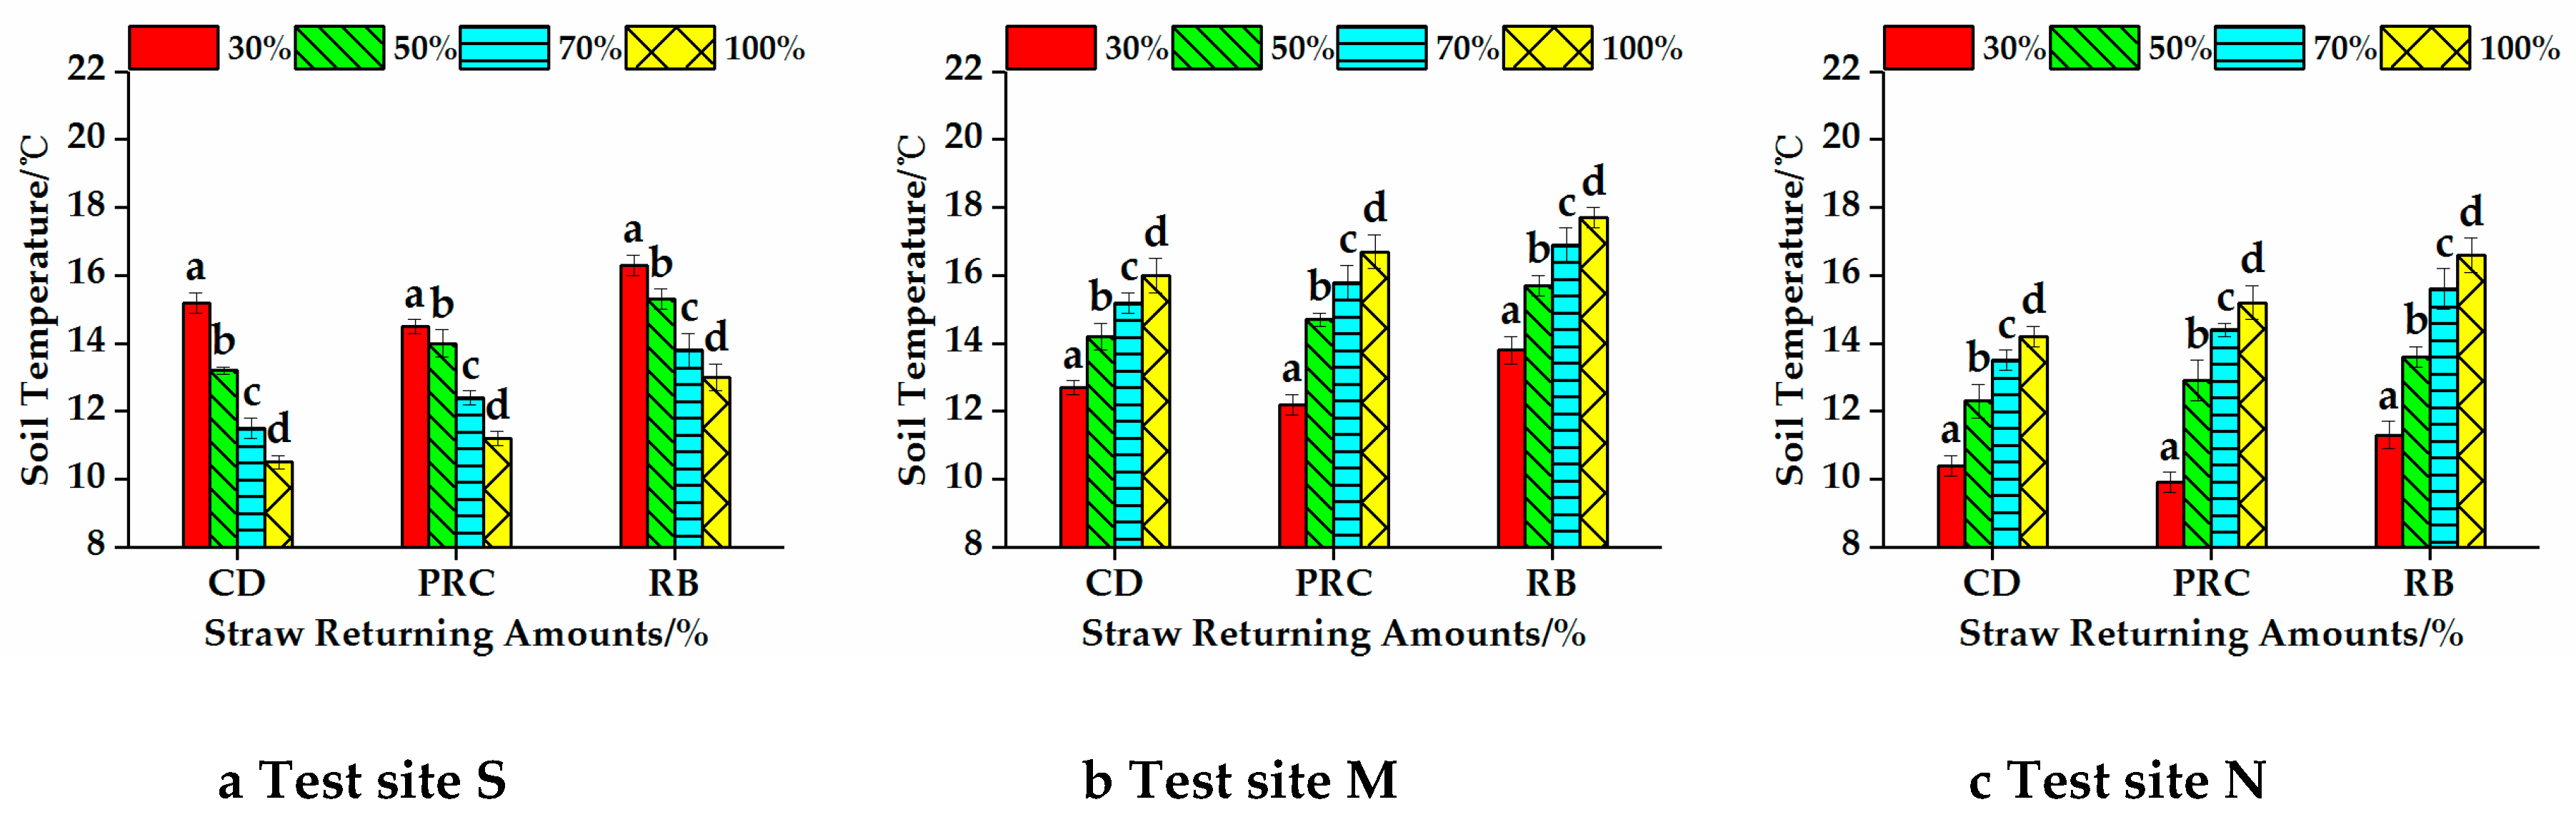
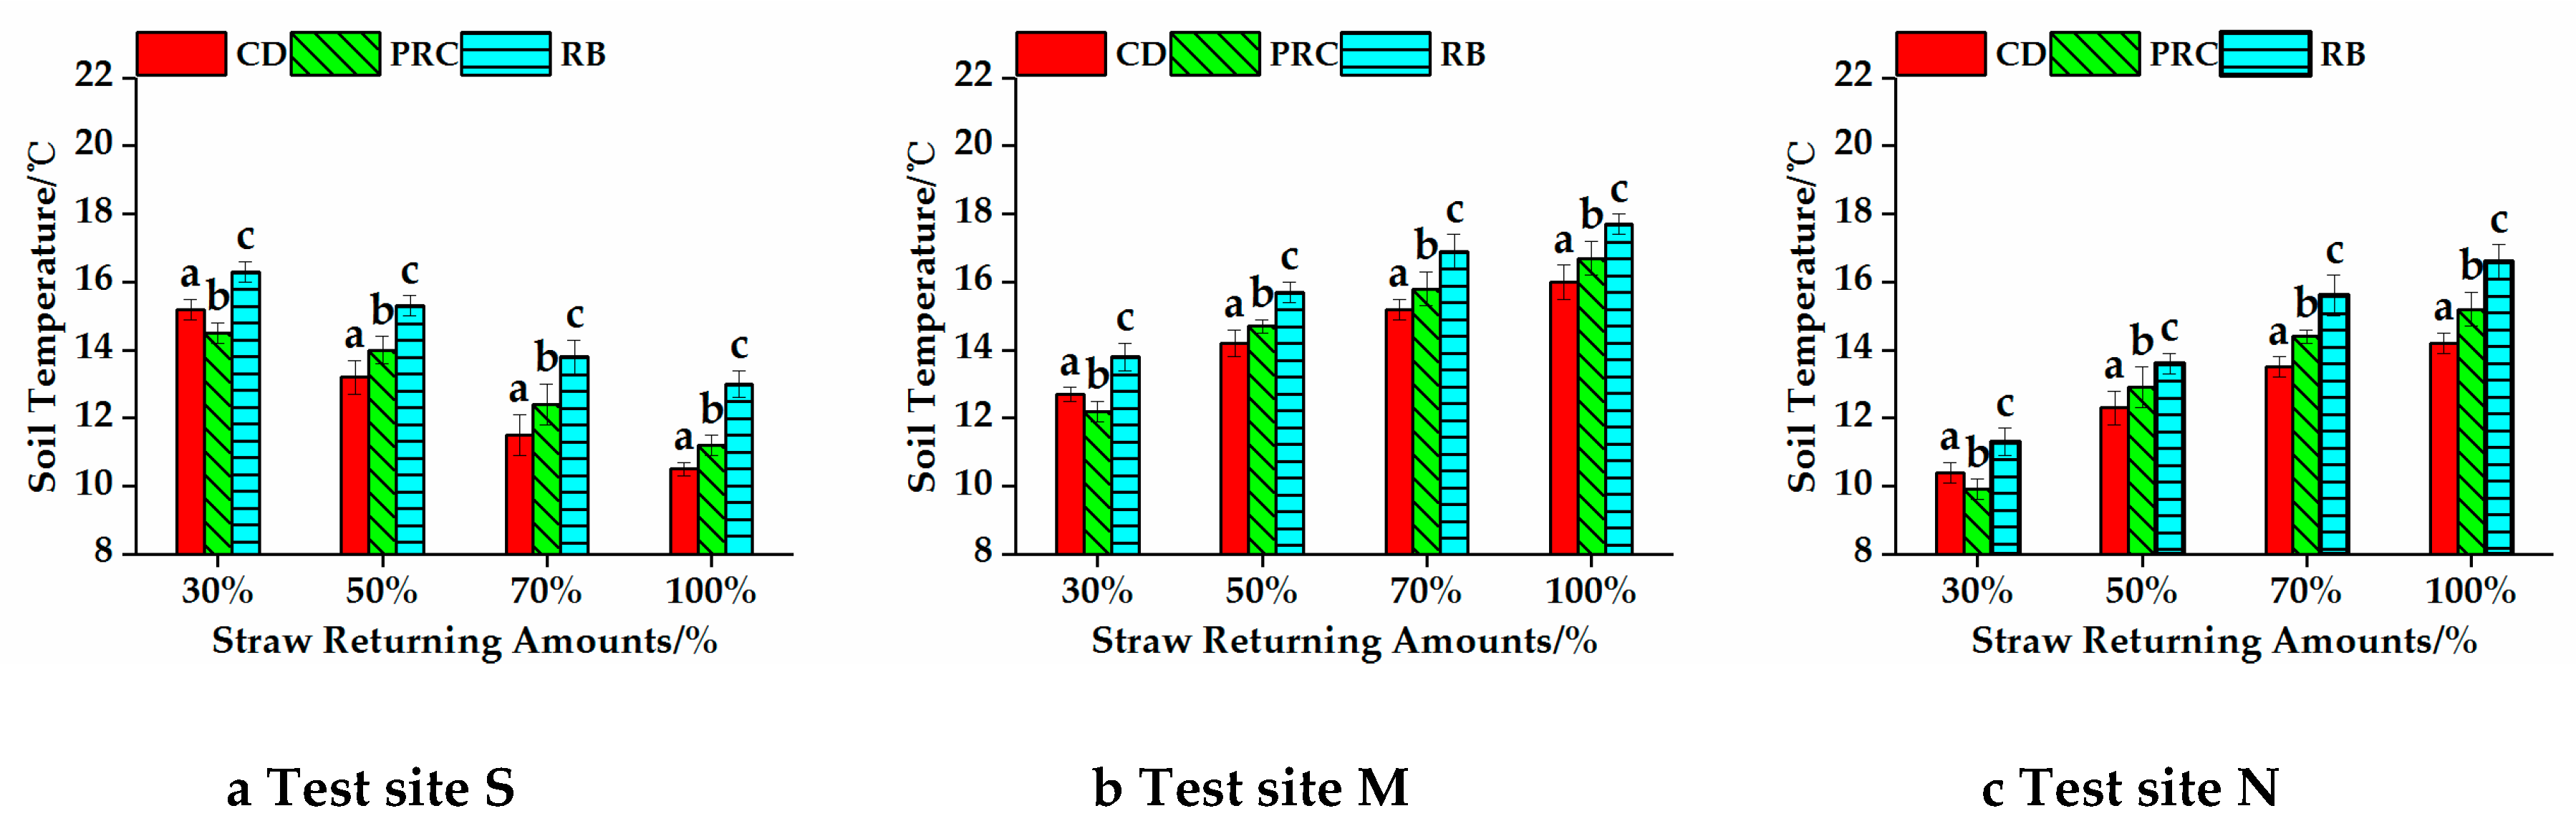
3.2. Effects of SRA and RC on ST

The straw returning amount significantly affected the ST, as shown by the ANOVA (Table 4). The Least Significant Difference (LSD) analysis showed that the ST increased as the straw returning amount increased at test sites N and M, while the ST declined as the straw returning amount increased at test site S (Figure 10). The results show that the RCT increased as the straw returning amount increased, and this may have inhibited the heat exchange speed between the soil and the outside. Residues can prevent the soil from losing heat under relatively low air temperatures, while absorbing heat under relatively high air temperatures. The temperature at test sites N and M was lower than that at test site S. Therefore, straw returning is more effective for preventing soil from losing heat at test sites N and M than at test site S.
The residue cleaner significantly affected the ST, as shown by the ANOVA (Table 4). The Least Significant Difference (LSD) analysis showed that the ST varied in the order RB > CD > PRC when the straw returning amount was 30% (Figure 11). The ST varied in the order RB > PRC > CD when the straw returning amount was 50%, 70%, and 100% (Figure 11). The residue cleaner affected ST through changing the RCT and SC. After springtime sowing, the use of residue cleaner can decrease the RCT and SC, accelerating the heat absorption speed of soil. Thus, as shown in Table 4, RB had the most significant influence on decreasing the RCT and SC. ST had the highest value after working with RB. The ability of PRC to decrease the RCT was better than that of CD, while PRC decreased the SC to a lesser extent than CD. When the straw returning amount was more than 50%, ST varied in the order PRC > CD. When the straw returning amount was 30%, ST varied in the order PRC < CD.

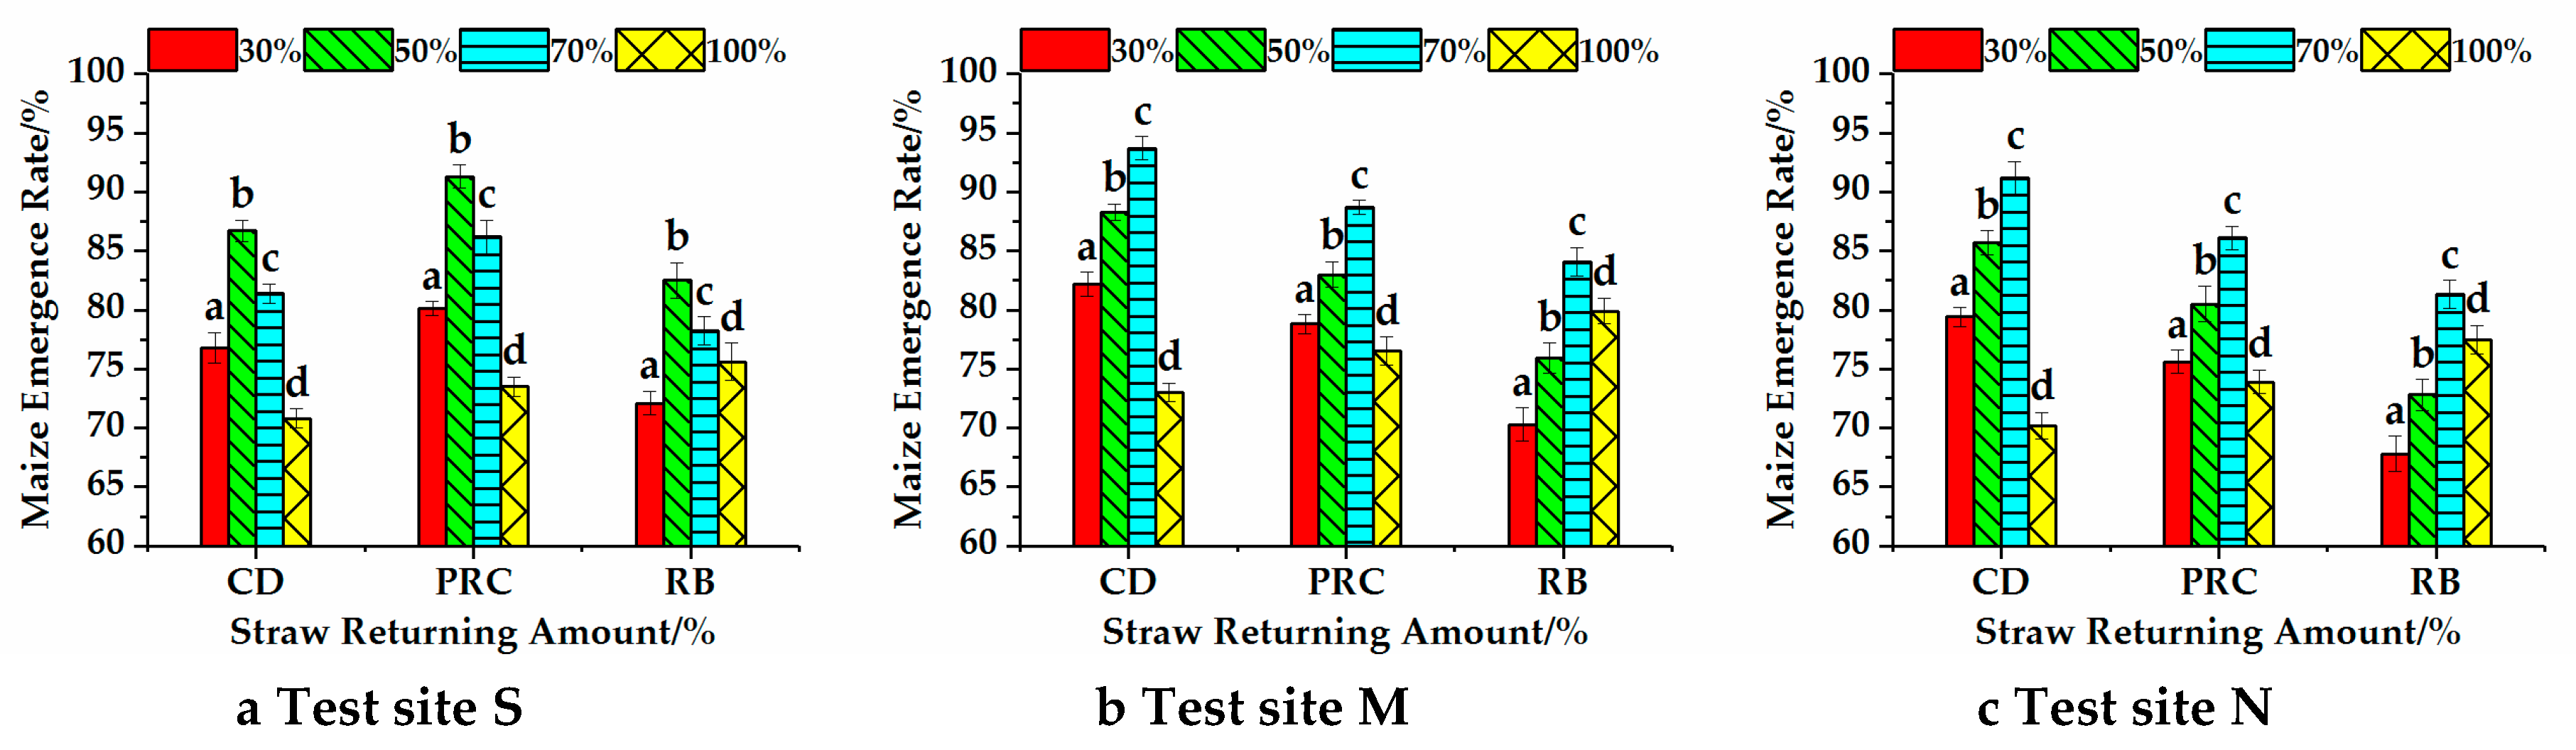
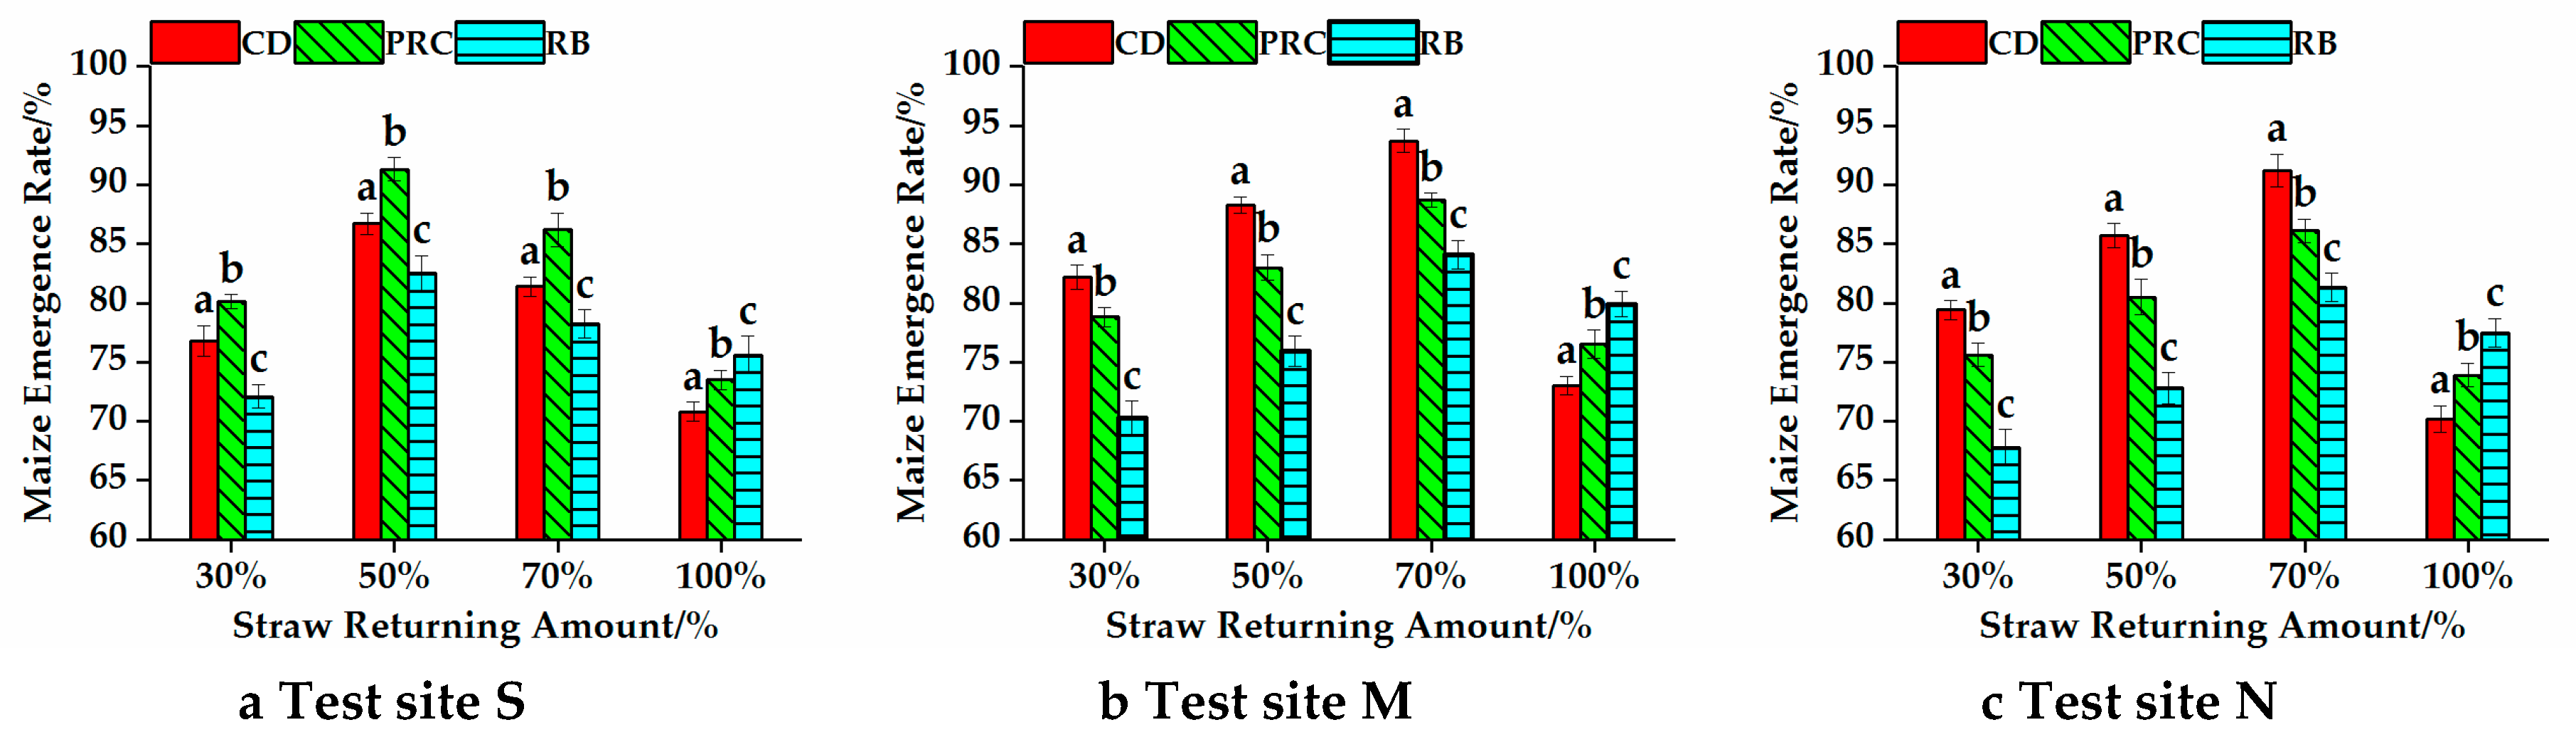
3.3. Effects of SRA and RC on the MER

The straw returning amount significantly affected the MER, as shown by the ANOVA (Table 4). The effect of the straw returning amount on MER in the three major producing areas is roughly the same. The Least Significant Difference (LSD) analysis showed that MER first rose and then declined as the straw returning amount increased (Figure 12). The MER had the highest value when the straw returning amount was 70% at sites N and M and when it was 50% at site S (Figure 12). The results show the same MER trend with an increase in the straw returning amount at all test sites. This is similar to Hongwen Li’s study conclusion in the province of Shanxi [51]. However, different straw returning amounts were found to be optimal at different test sites, which is similar to the study conclusion obtained by Xu Ying [52]. We believe that the reason for this may be the different temperature conditions.
The residue cleaner significantly affected the MER, as shown by the ANOVA (Table 4). The Least Significant Difference (LSD) analysis showed that, when the straw returning amount was 30%, 50%, or 70%, the MER varied in the order CD > PRC > RB at test sites N and M, while it varied in the order PRC > CD > RB at test site S (Figure 13). When the straw returning amount was 100%, the MER varied in the order RB > PRC > CD at all test sites (Figure 13).
The results above show that the MER was not only affected by the SMC and ST, but it was also affected by the quality of sowing. The larger the RCT is, the more difficult the planter operation is. SMC had the lowest value after working with RB. However, when only RB was selected, the RCT was effectively decreased with a straw returning amount of 100%, so the sowing quality was the best. All residue cleaners had great effects on the sowing quality, and the MER was affected by the SMC and the ST when the straw returning amount was less than 70%. Different SMC and ST values were obtained with different residue cleaners. So, the best residue cleaner was different at different test sites.
To find the best combination of the straw returning amount and residue cleaner in the three largest maize producing areas in China, the test data were imported into MATLAB for regression analysis, and the regression model (Equation (12)) between SRA and MER was obtained under different RC conditions. Also, significance tests were performed for nine models by Goodness of Fit (GOF) and F-test analyses. The F-values and correction coefficients (R2) of the nine regression models are shown in Table 5. The R2 is close to 1, and the P-value corresponding to the value of F is less than 0.01, which indicates that the nine regression models (Equation (12)) all have high levels of reliability and fitness. The regression curve is shown in Figure 14.
In all, the best combination of MER was 68% + CD, 67% + CD, and 52% + PRC, respectively, at sites N, M, and S. The MER values were 91.4%, 94.7%, and 91.7%, respectively. The conclusions above can be used to guide the straw returning operation in the three major maize producing areas.
[ M E R S R B M E R S C D M E R S P R C M E R M R B M E R M C D M E R M P R C M E R N R B M E R N C D M E R N P R C ] = [ 0.2992 6.325 41.141 2.475 0.2462 5.5929 37.63 7.6 0.243 5.6821 39.151 7.225 0.2036 3.3786 14.254 88.15 0.2618 3.8393 14.837 99.225 0.2244 3.5536 15.333 98.875 0.2201 3.7393 16.628 89.975 0.2643 3.8643 14.814 96.2 0.2087 3.2179 13.067 91.475 ] × [ x 3 x 2 x 1 ]
where x(%) is straw returning amount, M E R N R B (%) is MER after RB operation in area N,   M E R N C D (%) is MER after CD operation in area N,   M E R N P R C (%) is MER after PRC operation in area N, M E R M R B (%) is MER after RB operation in area M,   M E R M C D (%) is MER after CD operation in area M, M E R M P R C (%) is MER after PRC operation in area M, M E R S R B (%) is MER after RB operation in area S, M E R S C D (%) is MER after CD operation in area S, and M E R S P R C (%) is MER after PRC operation in area S.

4. Discussion

This study helps to reveal the principle that the straw returning amount and the residue cleaner have a significant effect on SMC, ST, and MER. It was observed that, when two test factors are combined differently, different RCT and SC values were generated, which is likely to be the root cause of the significant influence of the test factors on the test indicators. Straw covers on the soil has the effect of hindering the exchange of heat and moisture between the soil and the outside world, so when RCT is larger, the exchange rate gets lower. Zhang Wenli also came up with similar views in the study of the relationship between straw returning and soil respiration [53]. The SC value can reflect the size of the soil porosity. When SC goes lower, the soil porosity gets larger, and the exchange rate of heat and moisture increases. Yu Xin also came up with similar views in the study of the relationship between different tillage methods and soil properties [54]. It is furtherly discovered that RCT is determined by the straw returning amount and the residue cleaner. It explains why there was an interaction between each pair of test factors. When the straw returning amount is larger, the residue cleaner’s ability to clean up the straw is worse, causing the RCT to get larger. At the same time, SC is only determined by the residue cleaner. The stronger the loose soil capacity of the residue cleaner, the smaller the SC is. It is believed because the test factors can change RCT and SC, they have a significant impact on SMC and ST.
This study discovered that, because the test factors can change SMC and ST, they have a significant impact on MER. Zhang Dejian also came up with similar conclusions in the study of the relationship between soil physical properties and MER [55]. It is furtherly discovered that, while RCT has a significant impact on SMC and ST, it will also change the difficulty of cleaning operations. When RCT is too large, seeds are too difficult to fall into the seed trench, causing the decrease of MER [38]. It explains the MER was not only affected by the SMC and ST, but it was also affected by the quality of sowing. This paper also validates this view by combining the optimal factors derived from the regression model. For example, when returning amount is 100%, SMC and ST are both the largest, while MER is relatively low in test site N and M. When returning amounts are respectively 68% and 67%, MER is the largest in test site N and M. It is believed that, because the test factors can change SMC, ST, and the difficulty of cleaning operations, they have a significant impact on MER.
In summary, to obtain a greater MER, climate characteristics of different corn production areas and the performance of residue cleaner should be considered when a combination of factors are selected. Take the Inner Mongolia Maize Production Area and Heilongjiang Maize Production Area as examples; their temperature and precipitation are low [21,22,23], and the exchange of heat and moisture is mainly based on the trend that soil loss to the outside world. The combination of test factors in the above two major producing areas should be able to obtain greater RCT and SC. All residue cleaners had great effects on the sowing quality, when the straw returning amount was less than 70%. Therefore, the straw returning amount should be relatively high, but should not be higher than 70%. This paper found that, when the straw returning amount is greater than 30%, the impact of RCT on SMC, ST and the difficulty of cleaning operations is greater than that of SC. Compared to PRC and RB, the lateral force applied to the straw during CD operation is the smallest, and the cleaning ability is the weakest. Therefore, in order to improve SMC and ST, CD should be selected as much as possible in the above two major producing areas. The precipitation is low in the Jilin Maize Production Area, but it has a higher temperature than the other two producing areas. Water in the soil continues to evaporate, and the heat is absorbed. Therefore, the straw returning amount selected in the Jilin Maize Production Area should be lower than the other two producing areas. At the same time, in order to accelerate the promotion of soil temperature after spring sowing, the PRC should be chosen which has better cleaning ability and lowest soil-loss ability. The above discussion applies to the case where the straw returning amount can be freely selected. At present, there are few straw-picking machines in China’s three major maize producing areas, so that straw returning amount in some areas has to be chosen as 100%. In these areas, the RB with the strongest cleaning ability should be chosen.

5. Conclusions

Choosing a suitable straw returning amount and residue cleaner can effectively improve the soil moisture content, soil temperature, and maize emergence rate during straw returning. Comparative experiments were conducted with three kinds of residue cleaner under four different straw returning amounts in China’s three largest maize producing areas to reveal the influences of the straw returning amount and type of residue cleaner on the soil moisture content, soil temperature, and maize emergence rate. This study was based in China’s three largest maize producing areas. Due to the relationship between climate and site, three farms that represent the overall climate situation of three major maize producing areas were selected as test sites.
The straw returning amount and type of residue cleaner were shown to have significant effects on the SMC, ST, and MER in the three largest maize producing areas in China. An increase in the straw returning amount was shown to significantly increase the SMC when the straw returning amount was less than 70% in China’s three largest maize producing areas. An increase in the straw returning amount significantly increased the ST in the Inner Mongolia maize producing area and Heilongjiang maize producing area test sites, while it decreased the ST at the Jilin maize producing area test site. An increase in the straw returning amount will also increase the RCT, resulting in a decline in the residue-cleaner working quality, which decreases the MER. Therefore, there should be an extreme point in the straw returning amount so that the MER reaches a maximum value.
After springtime sowing, residue cleaner can decrease the RCT and SC so that the heat-absorption speed of soil is accelerated. In this study, the residue cleaner affected the ST by changing the RCT and SC. The influence of the residue cleaner on the clearing performance was significantly different with different straw returning amounts. Therefore, the best combination of test factors should be used in the three largest maize producing areas in China.
Therefore, in order to obtain a better maize emergence rate, a reasonable straw returning amount and a suitable residue cleaner should be selected. The most optimal combinations of test factors were determined by establishing a regression model of the straw returning amount and the MER with different residue cleaners. In the Jilin maize producing area, when the straw returning amount was 52% and PRC was used as the residue cleaner, the MER was estimated to be 91.7%. In the Heilongjiang maize producing area, when the straw returning amount was 67% and CD was used as the residue cleaner, the MER was estimated to be 94.7%. In the Inner Mongolia maize producing area, when the straw returning amount was 68% and CD was used as the residue cleaner, the MER was estimated to be 91.4%. At present, the straw returning amount is commonly accepted as 100% in China’s three major maize producing areas. The highest MER will occur when RB is used as the residue cleaner, based on the conditions above.
This work will accelerate the popularization of straw returning into China’s three major maize producing areas and promote sustainable agriculture development there.

Author Contributions

J.Z. conceived of and designed the experiments; J.Z., Y.L., H.J. and M.G. performed the experiments; J.Z., H.T. and Y.L. analyzed the data. All authors contributed to the writing of the paper. All authors have revised and approved the final manuscript.

Funding

We acknowledge that the research was financially supported by the 13th Five-Year Plan for National Science and Technology (Grant No.2017YFD700701), the Natural Science Foundation of China (51705194), the Science and Technology Development of Jilin (20190301023NY), and the Natural Science Foundation of Jilin (20180101090JC).

Acknowledgments

This manuscript represents a portion of Ph.D. research by the second author. We highly appreciate Yongjian Cong, who is a teacher at the School of Biological and Agricultural Engineering, at Jilin University, for fieldwork.

Conflicts of Interest

The authors declare no conflicts of interest.

References

  1. Lal, R. Tillage and agricultural sustainability. Soil Tillage Res. 1991, 20, 133–146. [Google Scholar] [CrossRef]
  2. Gao, W. Development trends and basic principles of conservation tillage. Sci. Agric. Sin. 2007, 40, 2702–2708. [Google Scholar]
  3. Zheng, L.; Wu, W.; Wei, Y.; Hu, K. Effects of straw return and regional factors on spatio-temporal variability of soil organic matter in a high-yielding area of northern China. Soil Tillage Res. 2015, 145, 78–86. [Google Scholar]
  4. Horning, L.B.; Strtler, L.D.; Saxton, K.E. Surface residue and soil toughness for wind erosion protection. Trans. ASAE 1998, 41, 1061–1065. [Google Scholar] [CrossRef]
  5. Issaka, F.; Zhang, Z.; Zhao, Z.Q.; Asenso, E.; Li, J.H.; Li, Y.T.; Wang, J.J. Sustainable Conservation Tillage Improves Soil Nutrients and Reduces Nitrogen and Phosphorous Losses in Maize Farmland in Southern China. Sustainability 2019, 11, 2397. [Google Scholar] [CrossRef]
  6. Zhao, S.; Li, K.; Zhou, W.; Qiu, S.; Huang, S.; He, P. Changes in soil microbial community, enzyme activities and organic matter fractions under long-term straw return in north-central China. Agric. Ecosyst. Environ. 2016, 216, 82–88. [Google Scholar] [CrossRef]
  7. Fan, J.Z.; Yan, F.Y.; Shi, D.J. Effect of different tillage management on soil physical properties and maize yield. J. Maize Sci. 2016, 24, 96–101. [Google Scholar]
  8. Wang, Q.; Gao, Z.; Chang, B.; Liu, F. Deep tillage with organic materials returning to field improving soil physical characters of calcic chernozem. Trans. Chin. Soc. Agric. Eng. 2015, 31, 161–166. [Google Scholar]
  9. Zhang, J.; Liu, J.; Zhao, G. Study on soil temperature variation of no-till cultivation with different amounts of stalk mulch. Chin. Agric. Sci. Bull. 2015, 31, 224–228. [Google Scholar]
  10. Cheng, Z.S.; Yun, C.C.; Jiang, L.K.; Qiu, S.J.; Wei, Z.; Ping, H.E. Effects of long-term straw return on soil fertility, N pool fractions and crop yields on a fluvo-aquic soil in North China. J. Plant Nutr. Fertil. 2014, 20, 1441–1449. [Google Scholar]
  11. Li, J.; Li, C.; Li, L.; Ding, Z.; Zhao, M. Effect of straw mulching on soil temperature, soil moisture and spring maize yield under seedling strip subsoiling. Acta Agron. Sin. 2014, 40, 1787–1796. [Google Scholar] [CrossRef]
  12. Jiang, X. Effects of Returning Maize Stalks into Field on Soil Physical and Chemical Properties and Root and Development Function in Wheat Zhengzhou. Ph.D. Thesis, Henan Agricultural University, Zhengzhou, China, 2012. [Google Scholar]
  13. Li, H. Current status of small and medium sized no-till Seeder in North China; Asian Association for Agricultural Engineering: Shanghai, China, 2010. [Google Scholar]
  14. Dong, H.; Li, H.; Li, A.; Yan, X.; Zhao, C. Relations between delayed sowing date and growth, effective accumulated temperature of maize. Maize Sci. 2012, 20, 97–101. [Google Scholar]
  15. Li, Q.; Gao, L.; Shi, A. Relationships between soil temperature and emergence of maize. Crops 2011, 4, 89–92. [Google Scholar]
  16. Bin, H.; Zengjia, L.; Yun, W.; Tangyuan, N.; Yanhai, Z.; Zhongqiang, S. Effects of soil tillage and returning straw to soil on maize growth status and yield. Trans. CSAE 2007, 23, 48–53. [Google Scholar]
  17. Gao, Y.; Li, S. Cause and mechanism of crop yield reduction under straw mulch in dryland. Trans. CSAE 2005, 21, 15–19. [Google Scholar]
  18. Hu, C.; Chen, S.; Zhao, S.; Zhang, X. No–tillage seeding technique under the bestrow of the whole corn stalk. Trans. CSAE 2005, 21, 118–220. [Google Scholar]
  19. Ma., J. Projected of Future Changes of Heat Stress & Drought and Their Impacts on Maize Yield in Northeast China; Chinese Academy of Agriculture Sciences: Beijing, China, 2012. [Google Scholar]
  20. Xiong, W.; Lin, E.; Jiang, J.; Li, Y.; Xu, Y. An integrated analysis of impact factors in determining China’s future grain production. Acta Geogr. Sin. 2010, 65, 397–406. [Google Scholar]
  21. National Bureau of Statistics of China. Inner Mongolia Province National Bureau of Statistics; China Statistical Yearbook; China Statistical Publishing House: Beijing, China, 2018.
  22. National Bureau of Statistics of China. Heilongjiang Province National Bureau of Statistics; China Statistical Yearbook; China Statistical Publishing House: Beijing, China, 2018.
  23. National Bureau of Statistics of China. Jilin Province National Bureau of Statistics; China Statistical Yearbook; China Statistical Publishing House: Beijing, China, 2018.
  24. Zhao, S.; He, P.; Qiu, S.; Jia, L.; Liu, M.; Jin, J.; Johnston, A.M. Long-term effects of potassium fertilization and straw return on soil potassium levels and crop yields in North-Central China. Field Crops Res. 2014, 169, 116–122. [Google Scholar] [CrossRef]
  25. Qiu, H.; Zhang, S.; Yang, J. Development of China’s maize industry, challenges in the future and policy suggestions. J. Agric. Sci. Technol. 2013, 15, 20–24. [Google Scholar]
  26. Shu-tian, L.I.U.; Sen, D.O.U.; Yan-lin, H.O.U. Relationship between area of straw returning to the field and content of soil organic carbon in China. J. Jilin Agric. Univ. 2016, 38, 723–732, 738. [Google Scholar]
  27. Xiong, W.; Holman, I.P.; You, L.; Yang, J.; Wu, W. Impacts of observed growing-season warming trends since 1980 on crop yields in China. Reg. Environ. Chang. 2014, 14, 7–16. [Google Scholar] [CrossRef]
  28. Karayel, D. Performance of a modified precision vacuum seeder for no-till sowing of maize and soybean. Soil Tillage Res. 2009, 104, 121–125. [Google Scholar] [CrossRef]
  29. Lin, J.; Liu, Y.; Li, B.; Qian, W.; Niu, J. Effect of ridge-till and no-till mulching modes in Northeast China on soil physical chemical properties. Trans. CSAE 2014, 30, 58–64. [Google Scholar]
  30. Lobell, D.B.; Asner, G.P. Climate and management contributions to recent trends in US agricultural yields. Science 2003, 299, 1032. [Google Scholar] [CrossRef] [PubMed]
  31. Magiera, T.; Zawadzki, J. Using of high-resolution topsoil magnetic screening for assessment of dust deposition: Comparison of forest and arable soil datasets. Environ. Monit. Assess. 2007, 125, 19–28. [Google Scholar] [CrossRef] [PubMed]
  32. Zhang, B.; Chen, T.; Wang, B. Effects of Long-term Uses of Chemical Fertilizers on Soil Quality. Chin. Agric. Sci. Bull. 2010, 26, 182–187. [Google Scholar]
  33. Lei, X.; Wang, F.; Zhou, B.; Yang, W.; Nie, S.; Xing, S. Effects of long-term fertilization on soil soluble organic nitrogen and free amino acid profile variations in paddy fields. J. Agro-Environ. Sci. 2019, 3, 1550–1559. [Google Scholar]
  34. Yang, F.; He, B.; Zhang, G.; Zhang, L.; Gao, Y. Impacts of different soil fertility improvement practices with film mulched ridge-furrow tillage on soil nutrient content, maize yield, and water use efficiency. Chin. J. Appl. Ecol. 2019, 30, 893–905. [Google Scholar]
  35. He, J.; Li, H.; Chen, H.; Lu, C.; Wang, Q. Research Progress of Conservation Tillage Technology and Machine. Trans. Chin. Soc. Agric. Mach. 2018, 49, 1–19. [Google Scholar]
  36. Zhang, X.; Li, H.; Wang, Q.; He, J.; Zheng, Z. Research on Maize Stubble and Plastic Film Separation. J. Agric. Mech. Res. 2015, 37, 261–264, 268. [Google Scholar]
  37. Gao, H.; Li, H.; Li, W. Development of Conservation Tillage. Trans. Chin. Soc. Agric. Mach. 2008, 9, 43–48. [Google Scholar]
  38. Lin, J.; Qian, W.; Niu, J. Design and Experiment of Stubble-cutting and Anti-blocking Mechanism for Ridge-till and No-till Planter. J. Shenyang Agric. Univ. 2015, 46, 691–698. [Google Scholar]
  39. Zhou, C.; Li, Y.; Yin, M.; Guo, X.; Zhao, X. Ridge-furrow planting with biodegradable film mulching over ridges for rainharvesting improving root growth and yield of maize. Trans. CSAE 2015, 31, 109–117. [Google Scholar]
  40. Sun, X. Edaphology; China Agricultural Press: Beijing, China, 2000. [Google Scholar]
  41. Li, R.; Jia, Z. Effects of soil water-temperature effect under dual-mulching of ridge and furrow on growth of maize. Ningxia J. Agric. For. Sci. Technol. 2015, 56, 26–30. [Google Scholar]
  42. Ye, X.; Wang, B.; Liu, S.; Ma, C.; Li, J.; Chai, R.; Xiong, Q.; Li, H.; Gao, H. Influence of tillage and straw retention on soil carbon pool and maize-wheat yield in Shajiang black soil. Trans. CSAE 2019, 35, 112–118, (In Chinese with English abstract). [Google Scholar]
  43. Ma, S.Q.; Wang, Q.; Chen, F.T. Impact of spring maize seeding growth on yield and assessment models of production cut under background of spring drought. Trans. CSAE 2015, 31, 171–179. [Google Scholar]
  44. Zhou, L.M.; Jin, S.L.; Liu, C.A.; Xiong, Y.C.; Si, J.T.; Li, X.G. Ridge-furrow and plastic-mulching tillage enhances maize-soil interactions opportunities and challenges in a semiarid agroecosystem. Field Crops Res. 2012, 126, 181–188. [Google Scholar] [CrossRef]
  45. Zhang, S.; Qi, Z.; Wang, F.; Zhao, H.; Zhang, H. Design and Experiment of Soil Moisture Content and Firmness Collecting Instrument for Farmland. Trans. Chin. Soc. Agric. Mach. 2010, 41, 75–79. [Google Scholar]
  46. Zhiqing, Z. Current situation and countermeasures of Hulunbeier straw mechanization returning to the field. Agric. Mach. Technol. Promot. 2018, 2, 34–36. [Google Scholar]
  47. Zhao, H.; He, J.; Li, H.; Wang, Q.; Li, W.; Liu, W. Effect of Straw Returning Manners on Seedbed Soil Physical Properties and Winter Wheat Growth. Trans. Chin. Soc. Agric. Mach. 2018, 49, 60–67. [Google Scholar]
  48. Zhao, Y.; Xiao, D.; Qi, Y.; Bai, H. Crop yield and water consumption of different cropping patterns under different precipitation years in North China Plain. Trans. CSAE 2018, 34, 108–116, (In Chinese with English abstract). [Google Scholar]
  49. Chen, Y.; Wu, K.; Zhang, J.; Nong, K.; Li, J.; Li, W. Relationship between Corn Lodging Resistance and Mechanical Parameters. Trans. Chin. Soc. Agric. Mach. 2011, 42, 89–92. [Google Scholar]
  50. Wang, Q.; Li, H.; He, J.; Li, W.; Liu, A. Effects of no-tillage on the soil moisture and maize yield in large ridges and narrow rows. Trans. Chin. Soc. Agric. Eng. 2010, 26, 39–43. [Google Scholar]
  51. Wang, Q.; Li, H.; He, J. Effect of ridge culture and no-tillage on soil moisture and maize yield. Trans. CSAE 2012, 28, 146–150. [Google Scholar]
  52. Xu, Y.; Li, M.; Li, H. Effects of drought at different developmental stages on growth and yield of Summer Maize in North China. J. Meteorol. Environ. 2017, 33, 108–112. [Google Scholar]
  53. Zhang, W.; Jia, S.; Zhang, Y.; Guo, Y.; Zhang, S.; Qi, H. Long—Term conservation tillage effects on soil respiration and soil water content. Soils Crops 2019, 8, 23–31. [Google Scholar]
  54. Yu, X.; Wang, X. Effects of Different Tillage Methods on Soil Physical-chemical Properties and Crop Yield in Loess Plateau. J. Anhui Agric. Sci. 2018, 46, 144–146, 156. [Google Scholar]
  55. Zhang, D.; Lu, Z.; Zhang, X.; Jing, Z.; Yao, Z.; Cheng, Y.; Wang, Y.; Zhang, J.; Bai, H.; Xian, F. Effects of Different Tillage Methods on Maize Yield and Soil Physical and Chemical Characters of Maize Field. Chin. Agric. Sci. Bull. 2014, 30, 209–213. [Google Scholar]
Figure 1. Location of three test sites. The Okun river farm with the closest climate indicators to the Inner Mongolia major maize producing area in the past 30 years was selected. The Xiangfang farm with the closest climate indicators to the Heilongjiang major maize producing area in the past 30 years was selected. The Jilin farm with the closest climate indicators to Jilin major maize producing area in the past 30 years was selected.
Sustainability 11 05796 g001
Figure 2. Soil condition testing. (a) Soil moisture content field indicator measurement. (b) MS-350 Moisture Meter (Spectrum, USA). (c) Soil-temperature field indicator measurement. (d) A 11,000 Temperature Gauge (Midwest company, USA). (e) Soil compactness field indicator measurement. (f) SC-900 Soil Compactness Tester (Spectrum, USA). (g) CT-8022 pH meter (Lubo company, Qingdao). (h) PJ-TQN all-round Soil Fertilizer Nutrient Speedometer (Zhengzhou pengjian agricultural science and technology).
Sustainability 11 05796 g002
Figure 3. Corresponding distribution map of each test plot and its factor combination. Taking test site S as an example, straw returning amount level was chosen for each block, such as 30% in test block S1. Each block is divided into 3 plots. Each test plot corresponds to a combination of test factors. For example, test plot S11 corresponds to the combination of 30% + CD.
Sustainability 11 05796 g003
Figure 4. Residue-cleaners and planters used in the test. PRC and CD were installed on the Kangda 2BDM-6 No-tillage Planter during the test. RB was installed on the 2BGH-6 Rotary Tillage- planter during the test.
Sustainability 11 05796 g004
Figure 5. Point selection: schematic diagram of the test plot used for detecting the soil moisture content (SMC), soil temperature (ST), soil compactness (SC), and residual cover thickness (RCT). As shown in the figure, five points were randomly taken on the diagonal of each plot. For example, Ms1112 is the second measurement value of the first test point in plot S11.
Sustainability 11 05796 g005
Figure 6. The schematic diagram of the maize emergence rate (MER) measurement method. As shown in the diagram, the planter operated three times in each plot. For example, Es111 is the emergence rate of the first seeding operation in plot S11.
Sustainability 11 05796 g006
Figure 7. Measurement of the residual cover thickness (RCT) by using MATLAB: (a) photo of the measured area of straw; (b) using Matlab to process the photo and get the RCT.
Sustainability 11 05796 g007
Figure 8. Effect of straw returning amount on SMC under different residue cleaner. Averages followed by different lowercase letters are significantly different according to LSD’s multiple range test at the significance level of 0.05. Error bars are standard deviation.
Sustainability 11 05796 g008
Figure 9. Effect of residue cleaner on SMC under different straw returning amount. Averages followed by different lowercase letters are significantly different according to LSD’s multiple range test at the significance level of 0.05. Error bars are standard deviation.
Sustainability 11 05796 g009
Figure 10. Effect of straw returning amount on ST under different residue cleaner. Averages followed by different lowercase letters are significantly different according to LSD’s multiple range test at the significance level of 0.05. Error bars are standard deviation.
Sustainability 11 05796 g010
Figure 11. Effect of residue cleaner on ST under different straw returning amounts. Averages followed by different lowercase letters are significantly different according to LSD’s multiple range test at the significance level of 0.05. Error bars are standard deviation.
Sustainability 11 05796 g011
Figure 12. Effect of straw returning amount on MER under different residue cleaner. Averages followed by different lowercase letters are significantly different according to LSD’s multiple range test at the significance level of 0.05. Error bars are standard deviation.
Sustainability 11 05796 g012
Figure 13. Effect of residue cleaner on MER under different straw returning amounts. Averages followed by different lowercase letters are significantly different according to LSD’s multiple range test at the significance level of 0.05. Error bars are standard deviation.
Sustainability 11 05796 g013
Figure 14. Regression curves between the straw returning amount and MER at different test sites with different residue cleaners. The optimal values of test points N, M, and S should be obtained in the curves of M-CD, N-CD, and S-PRC.
Sustainability 11 05796 g014
Table 1. Soil type, values of sowing temperature, and annual precipitation of three major maize producing areas for nearly 30 years [21,22,23].
AreaAnnual Sunshine Hours (h)Annual Precipitation (mm)Sowing Temperature (℃)Soil Type
MeanMaxMinMeanMaxMinMeanMaxMin
Inner Mongolia Maize Production Area2500235025505826015598.29.07.8black clay
Heilongjiang Maize Production Area25002400260059461256810.110.89.5black clay
Jilin Maize Production Area25502500270057660556113.814.213.2black clay
The data in the table are from Inner Mongolia Statistical Yearbook 2018, Heilongjiang Province Statistical Yearbook 2018 and Jilin Province Statistical Yearbook 2018. The values in the table are the average of all farms in each major maize producing area in nearly 30 years.
Table 2. Soil type, values of sowing temperature, and annual precipitation of three test sites for nearly 30 years [21,22,23].
Geographic Information of Test SiteAnnual Sunshine Hours (h)Annual Precipitation (mm)Sowing Temperature (℃)Soil Type
N: Inner Mongolia Okun River farm
(49.79 °N, 124.81°E, altitude 387 mm)
25005848.0black clay
M: Xiangfang farm
(45.71°N, 126.66 °E, altitude 152 m)
250059110.1black clay
S: Experimental field of agricultural machinery
(43.84 °N, 125.33 °E, altitude 152 m)
255057814.1black clay
The data in the table are from Inner Mongolia Statistical Yearbook 2018, Heilongjiang Province Statistical Yearbook 2018 and Jilin Province Statistical Yearbook 2018. The data in the table are the average of the corresponding test sites for nearly 30 years.
Table 3. Physical and chemical parameters of soil in three test sites before tests.
ParameterValues
(Test site N)
Values
(Test site M)
Values
(Test site S)
Soil typeBlack clayBlack clayBlack clay
Soil compactness (MPa)0.990.980.98
Soil Temperature (℃)9.010.110.9
Soil moisture content (% d. b.)20.719.618.8
pH7.087.127.06
Organic Matter (%)3.753.783.77
Total nitrogen content (%)0.130.110.12
Olsen-K (K2O, mg/kg)173.2173.5173.1
Olsen-P (P2O5, mg/kg)16.516.316.5
Table 4. Summary of statistical analysis of the respective average and the result of F-test in test site S, M, and N.
Test site S
FactorsVariables
SMC (%)ST (℃)MER (%)RCT (mm)SC (MPa)
straw returning amount (F1)
30%12.3a15.3d76.3c9.6a0.65a
50%13.9b14.2c86.8a27.0b0.62a
70%16.8c12.6b81.9b38.4c0.62a
100%16.8c11.6a73.3d89.6d0.64a
residue-cleaner (F2)
CD16.0c12.2b79.9b49.2c0.63b
PRC15.2b13.1a84.8c41.0b0.71c
RB13.6a14.6c75.1a33.3a0.53a
F-test
F1181.451 *388.356 *362.397 *1024.665 *0.081 ns
F2337.534 *485.583 *442.178 *685.784 *450.716 *
F1×F2124.653 *321.834 *357.962 *578.627 *1.566 ns
Test site M
FactorsVariables
SMC (%)ST (℃)MER (%)RCT (mm)SC (MPa)
straw returning amount (F1)
30%13.0a12.3a77.1c10.1a0.63a
50%14.6b14.9b82.4b28.2b0.63a
70%17.4c16.0c88.8a40.3c0.65a
100%17.6c16.8d72.8d94.5d0.61a
residue cleaner (F2)
CD16.7c14.0b84.8c49.8c0.65b
PRC16.0b13.1a81.2b40.3b0.76c
RB14.2a14.9c77.5a32.4a0.51a
F-test
F1202.632 *507.623 *583.284 *944.732 *0.079 ns
F2370.483 *424.334 *683.942 *547.847 *401.223 *
F1×F2178.314 *401.502 *558.134 *455.968 *1.182 ns
Test site N
FactorsVariables
SMC (%)ST (℃)MER (%)RCT (mm)SC (MPa)
straw returning amount (F1)
30%12.4a10.5a74.5c11.6a0.75a
50%14.4b12.9b79.7b30.5b0.72a
70%18.1c14.5c86.2a43.8c0.73a
100%18.4c15.4d70.2d101.2d0.78a
residue cleaner (F2)
CD16.9c13.1b81.6c50.3c0.71b
PRC16.2b12.6a79.0b41.5b0.82c
RB14.5a14.3c74.9a34.7a0.58a
F-test
F1192.334 *410.658*407.972 *1243.792 *0.092 ns
F2312.429 *538.473 *527.375 *873.361 *502.332 *
F1×F2163.942 *396.828 *312.451 *664.382 *1.378ns
Soil moisture content (SMC), soil temperature (ST), residual cover thickness (RCT), soil compactness (SC). Averages followed by the same letter in the column do not differ significantly by Tukey’s test (p < 0.05). * Significant at 5% probability (p < 0.05), and ns is nonsignificant (p ≥ 0.05).
Table 5. Results of F-test and Goodness of Fit (GOF) on nine regression models.
ModelMERS-RBMERS-CDMERS-PRCMERM-RBMERM-CDMERM-PRCMERN-RBMERN-CDMERN-PRC
R20.98360.99140.98020.99350.98470.98210.99820.98310.9423
F59.88 **95.52 **63.61 **92.47 **85.23 **69.41 **75.68 **56.19 **60.23 **
The reliability and high fitness of the regression model were tested by Goodness of Fit (GOF) and F-test for 9 models. ** Significant at 1% probability (p < 0.01).

