Assessment of the Economic Value of Ecological Conservation of the Kenting Coral Reef


1
Department of Natural Resources and Environmental Studies, College of Environmental Studies, National Dong Hwa University, Hualien 97401, Taiwan
2
Department of Applied Economics, National Chung Hsing University, Taichung City 402, Taiwan
*
Author to whom correspondence should be addressed.
Sustainability 2019, 11(20), 5869; https://0-doi-org.brum.beds.ac.uk/10.3390/su11205869
Submission received: 20 September 2019
/
Revised: 17 October 2019
/
Accepted: 18 October 2019
/
Published: 22 October 2019
Abstract
:Sightseeing and recreation have become prevalent in the Kenting coral reef area. However, coral reefs in Kenting are being severely bleached at an increasing rate under the influence of excessive human activities and climate change that have necessitated stronger conservation policies by the government. Based on a random utility model for coral ecology conservation, the preferences and willingness-to-pay (WTP) values of diving, fishing, and sightseeing visitors are analyzed. Empirical results show that: (1) increasing living coral coverage, improving water quality, restricting the number of daily visitors, increasing biodiversity, increasing the ratio of marine protected areas, and reducing the coral reef’s conservation fund will improve the overall utility of Kenting for visitors; (2) the WTP values significantly vary with respondents’ socioeconomic background and travel behaviors; (3) the results of a latent class model (LCM) also show that the two groups with different coral conservation preferences and WTP values have different socioeconomic backgrounds and travel behaviors.
1. Introduction
The coral ecosystem provides many benefits that are essential for human beings as well as marine organisms. According to Cesar [1], the coral ecosystem has a variety of functions, the most important being the protection of coastal residents of developing countries. However, in recent years, the coral ecosystem is facing a serious threat from excessive human activities and climate change. As Taiwan is located between the tropics and the subtropics, it provides a habitable coastal environment for corals, with coral clusters distributed along a coastal area from the northeast corner to southernmost area, and as well as off all its vicinity islands (Penghu Islands, Green Island, and the Dongsha Islands). According to Tseng et al. [2], one third of the world coral species are found in Taiwan. Hence, each coral species should be properly conserved and managed based on its special characteristics to maintain the diversity of marine life.
Located in southernmost region of Taiwan, Kenting provides a suitable living environment with warm and clean seawater for many marine organisms. Its rich and diversified marine ecology attracts a large number of domestic and foreign tourists for sightseeing and recreational activities [3]. In recent years, many large-scale hotels, hostels, and restaurants have been built along the Kenting coast to cater to tourists. Indeed, the discharged wastewater from these establishments has affected the marine ecology both directly and indirectly. Studies have indicated that eutrophication is becoming increasingly serious in the south bay area of Kenting, resulting in damage of the marine environment [4]. One method of operating and managing the marine ecosystem is to establish marine protected areas. Researches [5] have pointed out that the coral ecology has been effectively managed and conserved in only 6% of global marine protected areas and up to 73% of the coral ecology remains neglected. Methods of improving the efficiency of operation and management should be given more importance in the future [5]. This study adopts the choice experiment (CE) method to build a random utility model for coral ecology conservation, and explore the coral conservation preferences and willingness-to-pay (WTP) values of Kenting tourists in an attempt to strengthen the efforts of the government, Kenting National Park Management Office and the relevant units for Kenting coral ecosystem conservation and management.
Since coral reef resources are non-market goods with no real market value, the conservation benefits of coral reef resources must be measured by a corresponding assessment method. Usually, the CE method and the contingent valuation method (CVM) of stated preference are utilized to estimate the value of natural resources. CVM is the most common method of assessing the non-use value of natural resources, but it cannot extract enough information from respondents. Errors are easily produced because it is very difficult to accurately estimate the real preferences for natural resources when respondents have never seen them or are unable to imagine their future condition [6]. The CE method, however, can analyze the characteristics of products and services provided by natural resources (for example, natural landscape of ecotourism, traditional and recreational economic values) [6], define important attributes, and combine different attribute levels into choice sets to investigate the preferences and WTP values of respondents.
In 2012, Rolfe and Windle [7] employed the CE method to assess the conservation and management preferences of residents in three regions of Australia’s Great Barrier Reef Marine Protected Areas, with important attributes that include “the ratio of healthy coral reef area”, “the ratio of healthy fish species”, “the ratio of healthy sea grass area”, and “additional tax”. The results of the study indicate that the residents prefer to increase the number of healthy fish species and the people living near the reef area are willing to pay higher conservation values. The reason might be the popularity of recreational fishing in these areas. In 2014, Jobstvogt et al. [8] adopted the CE method to assess the attitudes and WTP values of 545 local residents for England’s deep-sea ecosystem conservation, with assessment attributes such as “potential for medical product development”, “the number of conserved species”, and “additional tax”. The results indicated that up to 81% of the respondents were willing to maintain the marine environment and ecosystem, preferred highly-conserved species and the potential for medical product development, and were willing to pay 70 to 77 pounds on average. The study also suggested that men, people who participated in environmental groups, fish product lovers and those optimistic about the future had a higher willingness to conserve the marine ecosystem. In 2012, Can and Alp [9] also used the CE method to evaluate the preferences of residents and visitors for improving the environment of Göcek Bay in Turkey, with survey attributes that include “water quality”, “marine ecology”, and “cost”. The results indicated that the public could obtain environmental benefits by improving the water quality and restoring the marine ecosystem. Local residents were willing to pay TL 18 (Turkish Lira) to improve the water quality and TL 14.8 to restore the marine ecosystem every month; whereas, tourists were willing to pay TL 16.6 to improve water quality and TL 11.2 to restore the marine ecosystem on every trip. Marre et al. [10] evaluated the values of improving the coral reef ecology in New Caledonia using the CE method, which included assessment attributes like “cost”, “sustainable total fish catch”, “water quality”, “coastal and lagoon landscape”, and “regional practice”. The investigation covered a total of 550 citizens in the two areas and the results indicated that almost all parameters were highly significant, and the residents of the two regions were significantly different in the “regional practice” attribute. According to the calculation, residents from Zone Côtière Ouest area were willing to pay 1000 to 105,008 francs per month while VKP residents were willing to pay 400 to 5700 francs per month to improve and maintain the local ecological environment. In 2012, Boxall et al. [11] applied the CE method to evaluate the WTP values of Canadian residents for protecting the endangered species in the Gulf of Saint Lawrence, with assessment attributes that include “species conservation status”, “size of marine protected area”, “shipping and whale-watching industry regulations”, and “cost”. The results indicated that local residents preferred the plan that improves the species status from “threatened” to “not at risk” for belugas and harbor seals and from “endangered” to “threatened” for blue whales. Every household was willing to pay CA$229.17. In addition, the study further analyzed the values of each plan, and found that residents were willing to pay a higher value for improving the species status from “threatened” to “special concern” (CA$184.21) than improving the species status from “threatened” to “not at risk” (CA$23.67).
In summary, many studies have evaluated the economic value of coral reefs, marine protected area management, environmental quality improvement, and welfare loss. The respondents of these studies generally hold a positive attitude toward ecological conservation and are willing to pay a specific amount of money, by the relevant units, to support the conservation and restoration of the marine ecosystem. This study uses the CE method to build a random utility model for coral ecology conservation, and investigate the diving, fishing, and other general visitors in Kenting. In the nest section, the survey design and sample data of this study will be further illustrated, the principles of random parameter logit (RPL) and latent class model (LCM) will be explored, and the sampling method and questionnaire’s descriptive statistics of this study will be introduced. Results sections will further use the RPL model to estimate the utility functions of multiple attributes of coral ecology conservation and the WTP values for attribute level changes. Furthermore, it will explore the impacts of socioeconomic background and touring behavior of visitors on their WTP values, and examine the heterogeneity in the preferences of respondent groups for coral reef ecosystem conservation and socioeconomic background based on LCM. This study also seeks to estimate the economic values of different coral reef ecosystem conservation and management plans and propose suggestions based on the results of the empirical analysis.
2. Materials and Methods
2.1. Evaluation Models
This study applies the conditional logit (CL), RPL, and LCM to analyze the utility of coral reef conservation attributes. Conditional logit provides an analysis benchmark that can be used to assess only the mean preference of respondents because the parameters of all respondents are assumed to be fixed [12]. Therefore, this study analyzes preferences and WTP values of respondents with different backgrounds (sex, marital status, age, and education) based on the RPL model and groups’ respondents by characteristic based on LCM model. Compared to RPL, LCM can analyze the differences between groups more systematically, which can help Kenting management office or the relevant units formulate proper conservation policies based on group preferences.
CL, RPL, and LCM can be derived by the random utility model [13]. The model assumes that the utility function of every respondent can be added and each utility function contains two elements: deterministic term and error term. The deterministic term can be considered as the linear function of the parameter [12]. The error term refers to the factors and random items that affect the choices of the respondents and cannot be observed by the researcher. As RPL takes into account the utility that cannot be observed, the overall utility (U) of the nth respondent for the ith alternative is:
In the above formula, Vni is the utility coefficient of the observed variable Xni and the respondent characteristic Sn, indicating their preferences. εni indicates error terms that can contain missing values and factors influencing the respondents, and it can help researchers take into account the unobservable factors [14,15,16].
When one of the attributes being researched is price, WTP can be calculated using the fixed ratio of two parameters (βS coefficient). And, the two attributes must be statistically significant. The coefficient of the price attribute is placed as the denominator [17]. The calculation method of WTP is the ratio of “coefficient of interested attribute” to “coefficient of price attribute” [18]. When βk is the coefficient of a non-price attribute and βc is the coefficient of a price attribute, WTP can be obtained:
2.2. Choice Experiment Design
2.2.1. Introduction to Attributes and Levels of Kenting Coral Conservation
After having introduced the empirical models of CL, RPL, and LCM models for CE methods, this study considers the multiple attributes of coral ecology conservation, predicts the development trends of ecotourism and ecosystem management, makes references to related research reports and literature on Kenting National Park Management Office, and conducts interviews of experts and scholars in various fields. Based on these results, five attributes are defined that include “living coral coverage”, “biodiversity”, “ratio of marine protected area”, “control on visitor numbers”, and “seawater quality;” the price variable, “coral reefs conservation fund”, is defined as a payment tool. The change levels of every coral conservation attribute include a level variable set according to the status quo as a measurement benchmark. Table 1 shows the attributes and their levels, as well as their meanings:
Living Coral Coverage
The National Oceanic and Atmospheric Administration, U.S. Department of Commerce (NOAA) [19] pointed out that coral reefs provide a considerable number of products and services, including direct use values (swimming, diving, snorkeling, and watching), indirect use values (coastal protection, providing habitats for commercial and recreational fisheries), and non-use values (benefits associated with the natural ecosystem). Moreover, the coral reef ecology also brings considerable economic benefits to coastal residents, which include the tourism industry, fishery resources, building materials, coastal habitat protection, and medical product research and development (R&D) [5].
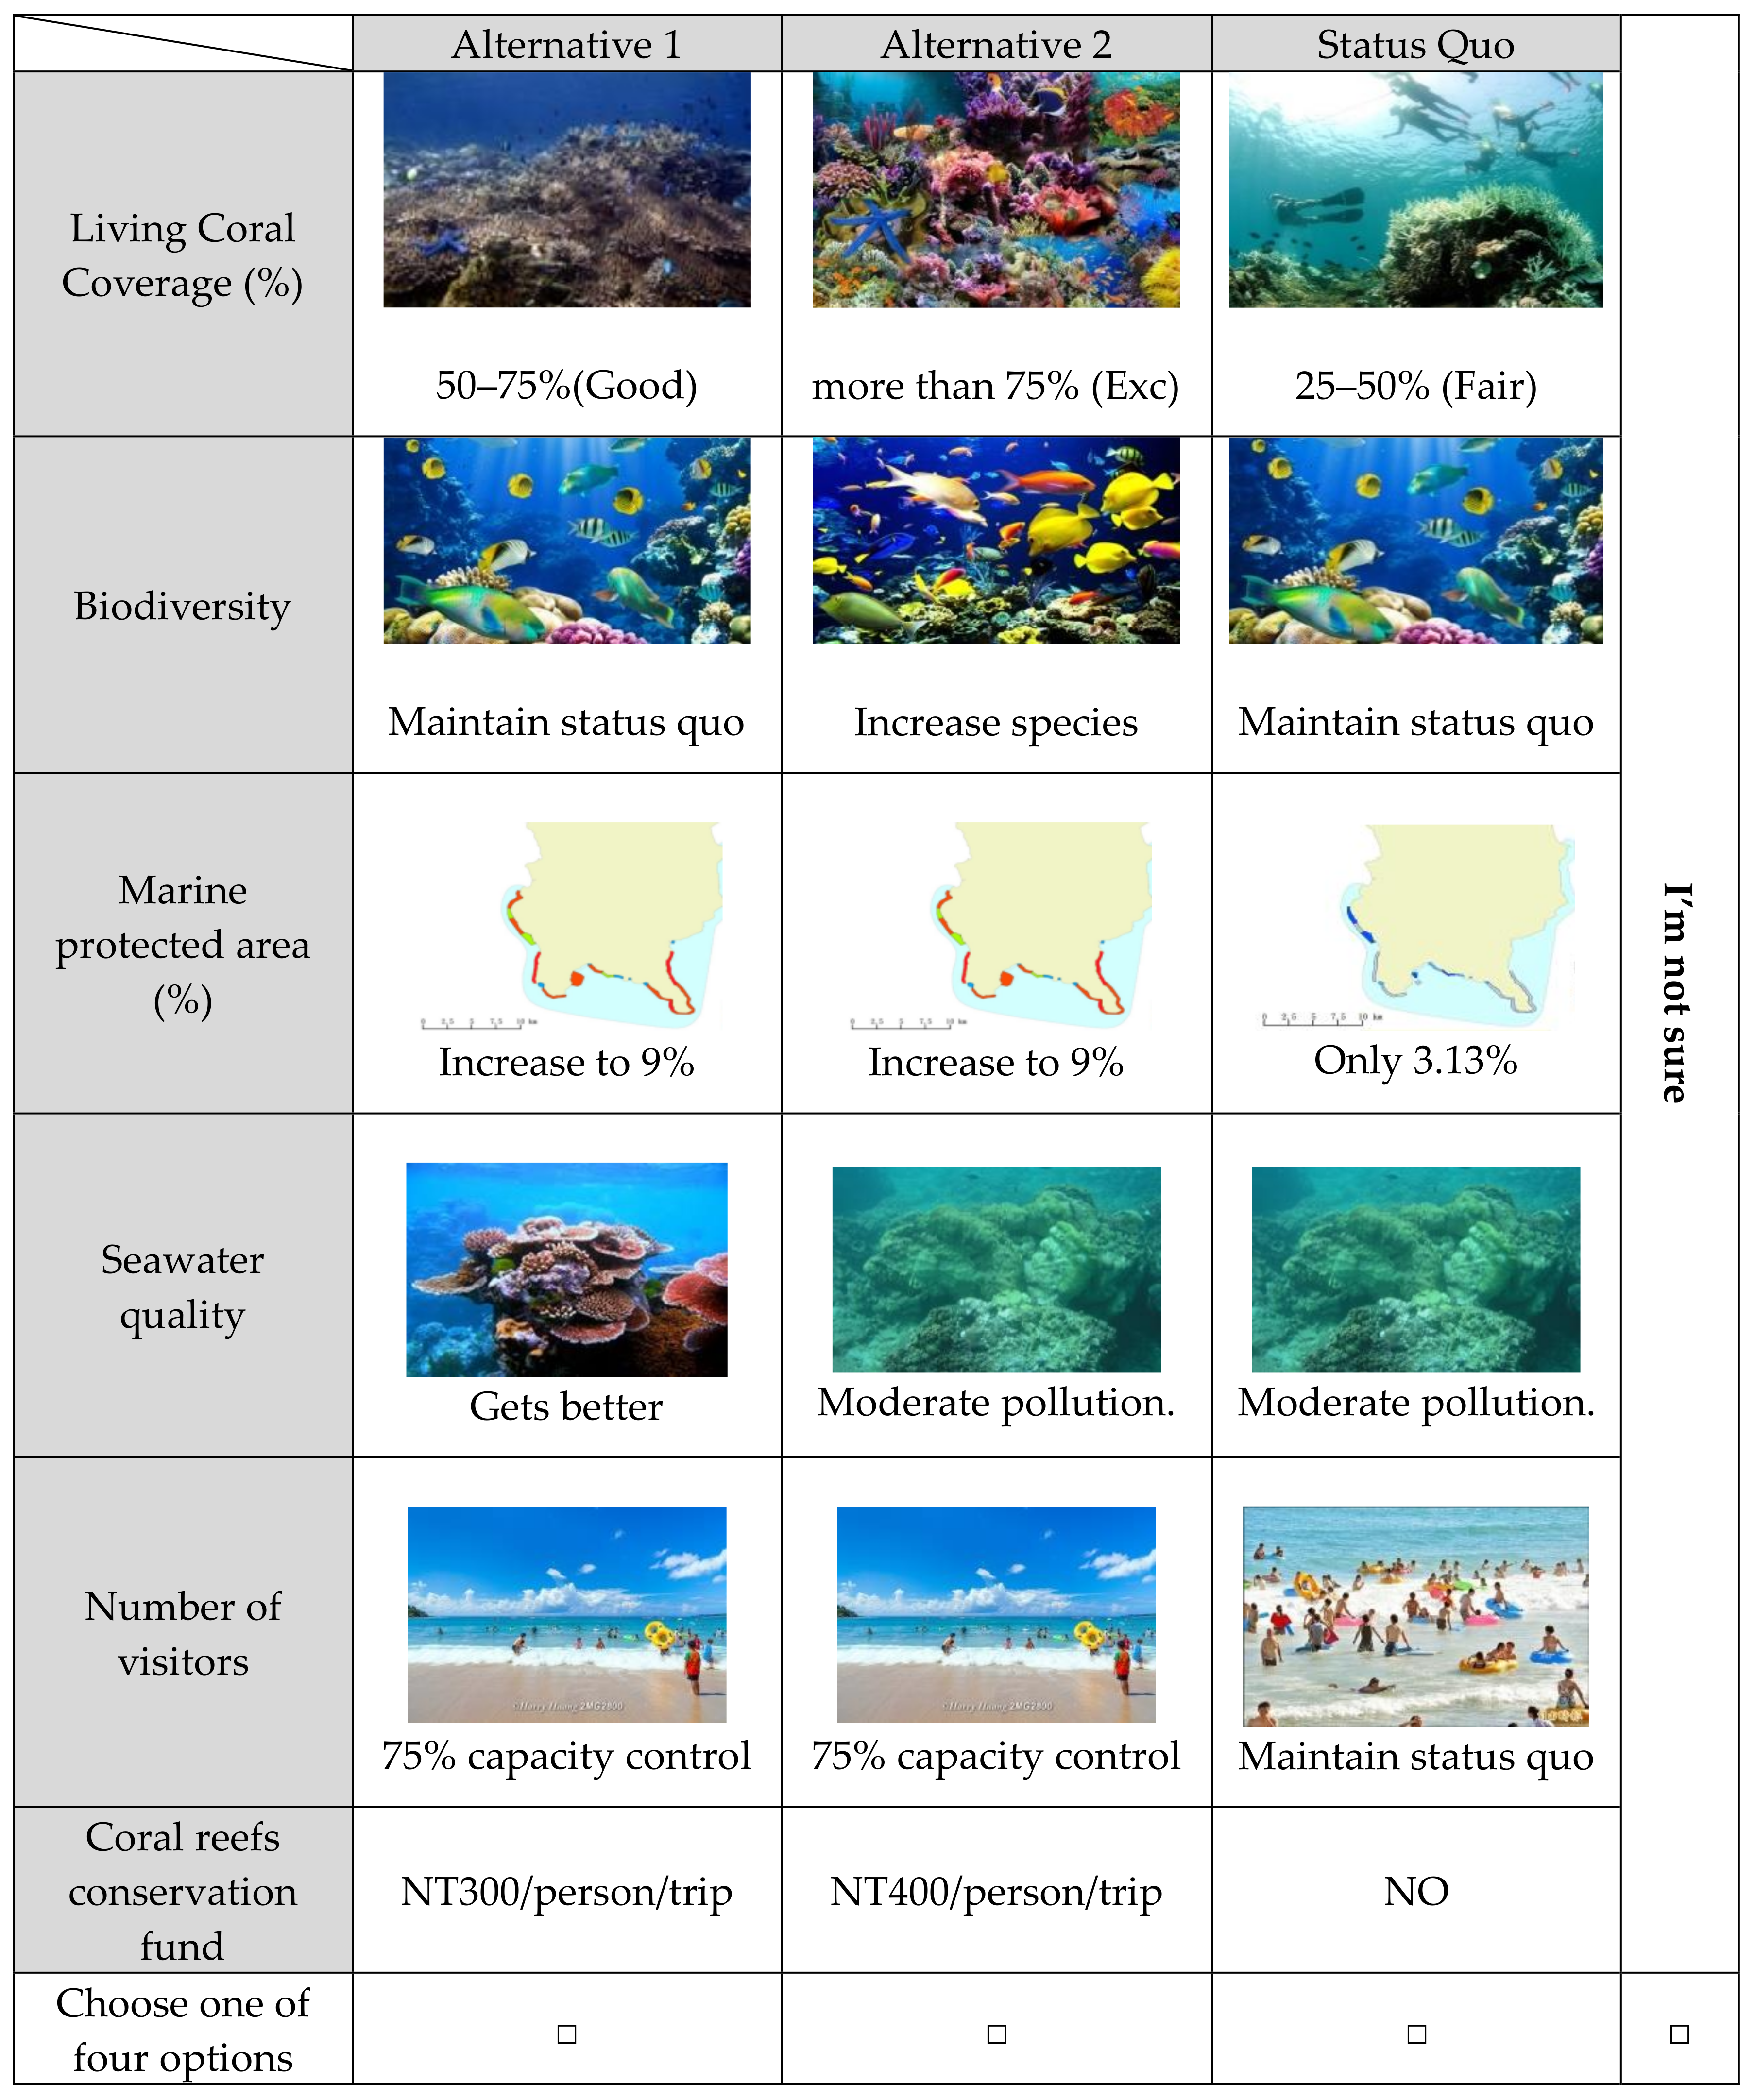
Therefore, increasing living coral coverage can bring benefits to many marine biological species and human beings. The annual overall coral examination report (Reef Check) of Taiwan takes “living coral coverage” as one of the assessment variables. According to general international standards, living coral coverage (hard corals and soft corals) is “bad” or “poor” if it is below 25%, “general” or “fair” if it is 25%–50%, “good” if it is 50%–75%, and “excellent” if it is greater than 75% [20]. Related foreign studies use the CE method to evaluate the utility of non-use values of Australia’s Great Barrier Reef Marine Protected Areas and considered “healthy coral reef coverage” as an important indicator of economic value assessment. The results indicate that local residents have positive preferences for increasing the healthy coral reef coverage and the number of healthy fish species [7]. In summary, this study sets the level of living coral reef coverage as “fair (current status)”, “good”, and “excellent” to observe the attitudes and preferences of respondents for coral reef ecology conservation.
Biodiversity
Coral reef ecosystem is an important field where many marine organisms spawn, raise babies, and feed [21], and it has more marine species than in any other shallow marine ecosystems [22]. Although coral reefs cover only one thousandth of the world’s seawaters, the coral ecosystem has a high degree of biological diversity.
Internationally, many scholars regard biodiversity as one evaluation indicator of environmental health and ecosystem functioning [23]. In 2003, Carlsson et al. [24] used the CE method to evaluate the non-use value of wetlands in southern Sweden. The results indicated that local residents were willing to pay high marginal values to improve biodiversity and trail facilities. In 2011, Juutinen et al. [25] with the same method assessed the biological diversity and recreation service values of Finland’s Oulanka National Park. The results indicated that visitors had a significantly positive preference for improving the biodiversity. Maintaining biodiversity is one of the important future projects in coral reef ecology conservation. Therefore, this study considers “biodiversity” as an important attribute and “increase in the number of species” as its proxy.
Marine Protected Area
From 1950 to the early 1960s, many scientists found that the marine ecological environment suffered serious damage due to excessive human activities (overfishing, touring, and recreation activities), hence they began to advocate building good management practices to maintain the natural ecological resources [26]. Marine ecological surveys and research were carried out internationally to seek effective ways of operation and management. After 20 years, establishing marine protected areas were found to be the most effective [27].
A marine protected area is an inclusive concept, and it can be roughly divided into three functional areas according to the actual local situation and characteristics: core area, buffer zone, and transition zone. The core area is completely protected from any interference by human activities, the buffer zone allows activities that are compatible with the natural ecology, and sustainable resources of the transition zone can be jointly managed by the local community residents, scientists, and other stakeholders [28]. At present, the strictly-protected marine ecological protective area of Kenting National Park covers 476.38 hectares, accounting for only 3.13% of the total area in the sea area plan. Experts have pointed out that a small protected area can be easily managed, but its conservation effect is not good for the organisms with a long floating period (coral reef larvae can disperse across many kilometers). Moreover, the scale of a protected area is inversely proportional to its conservation speed [29].
Boxall et al. [11] evaluated the economic value of conserving threatened marine mammals in Saint Lawrence Bay Area of Canada using the CE method with evaluation indicators such as the “size of marine protected area”, “species status”, “shipping and whale watching regulations”, and “cost”. To protect the coral reef ecologies in various districts of Kenting, this study increases proportions of marine protected areas to 6% and 9% for visitors to choose.
Seawater Quality
Coral is an organism with low adaptability, whose survival is affected by many factors including seawater temperature, salinity, and ocean currents, as indicated by many studies [30,31]. The wastewater emitted by many hotels, hostels, and restaurants in the Kenting area increases nutrient salt in the water, leading to algae breeding. The algae compete for living space in the coral reef ecology causing the decline of coral coverage [3].
Can and Alp [9] also adopted the CE method to evaluate the preferences of local residents and visitors for environmental improvement plans of Turkey Göcek Bay, with evaluation indicators including “seawater quality”, “marine ecology”, and “cost”. The empirical results indicated that people could obtain environmental benefits by improving water quality and restoring the marine ecological system. The water quality of the Kenting sea area had been seriously polluted; therefore, the relevant units should pay attention to and improve the water quality of Kenting in the future. This study provides two levels for visitors to choose from, “Clean or excellent as unpolluted (gets better)” and “mild to moderate polluted (current status)”.
Number of Visitors
The number of visitors is related to the man-made damage that the environment can withstand and the ability to restore itself to the previous state [32]. Controlling the number of visitors is also a way to awaken the environmental protection consciousness of visitors and effective control can provide a quality travel experience for visitors [33]. The study on the impact of human activities on the Kenting ecosystem [3] indicated that the excessive number of tourists, suspended solids in water, and nutrient salt and ammonia are the main factors causing the decline of living coral coverage.
At present, Kenting National Park management office does not restrict the number of visitors in the marine recreational areas, leading to an increase in the number of visitors every year. The damage caused by excessive human activities including habitat destruction, overfishing, water pollution, sightseeing and recreational activities, and climate change are the main causes for the deterioration of the coral reef ecosystem. In 2011, Juutinen, et al. [25] used the CE method to evaluate the values of biodiversity and recreation services of Finnish Oulanka National Park. “Restricted visitor number” is one of the evaluation indicators used and the empirical results indicate that most respondents agree to reduce or limit the number of visitors. Therefore, this study designs three levels for visitor number of Kenting area for visitors to choose: “maintain the status quo (unrestricted)”, “restrict the daily number of visitors to 50% of the current number”, and “restrict the daily number of visitors to 75% of the current number”.
Coral Reefs Conservation Fund
In 2010, Thur [34] pointed out that in recent years, the management systems of protected areas have been working ineffectively due to the shortage of funds. To successfully conserve and manage the coral reef ecosystem, the management units need to have deep understanding of the local marine ecosystems and solve local socioeconomic problems. Many marine protected areas charge a user fee from diving visitors that is contributed toward the ongoing monitoring and conservation work. Charging visitors is a way to solve the financial problem of marine protected areas [35]. In 2011, Wattage, et al. [6] employed the CE method to investigate the WTP values of local Irish residents for conserving Irish deep-sea coral areas with “annual tax” as an evaluation indicator. Based on the above literature, this study works out five levels of fee charged from visitors: “no charge (current status)”, “NT$100 yuan/trip/person”, “NT$200 yuan/trip/person”, “NT$300 yuan/trip/person”, and “NT$400 yuan/trip/person”.
2.2.2. Introduction to the Preference Choice Sets of Kenting Coral Ecology Conservation
After defining the six attributes of Kenting coral ecology conservation and their levels (Table 1), the preference choice sets of Kenting coral ecology conservation will be designed based on the evaluation process of the CE method, providing references for questionnaire and sampling designs. The levels of each attribute need to be defined more clearly to better understand the preferences of visitors for Kenting coral ecology conservation so that a more accurate development plan can be made. The six attributes include “living coral coverage”, “biodiversity”, “the ratio of marine protected area”, “the number of visitors”, “seawater quality”, and “coral reefs conservation fund”. For more relevant information, see Table 1 and the introduction to attributes and levels of Kenting coral ecology conservation. The attributes and their levels will produce 540 possible combinations (3 × 2 × 3 × 2 × 3 × 5). However, to reduce the burden of respondents in the actual investigation, this study adopts the orthogonal design method to reduce 540 combinations to 24 combinations of alternative plans and a status quo plan, delete four unreasonable plans, and generate 190 choice sets through permutation and combination. To ensure the credibility of permutation changes in choice sets, each respondent is required to choose one answer from two alternative plans and a status quo plan (see Figure 1). Therefore, each questionnaire includes three choice sets, and there are 63 such kinds of questionnaires.
2.3. Data
2.3.1. Sampling Method
This study interviewed visitors using an initial questionnaire in early May 2015; then modified the questionnaire based on the conservation and management status, expert opinions and advice, and the initial interview results, and used the formal questionnaire to investigate from July to November 2015. A random sampling method and one-on-one interviews were utilized to reduce questionnaire errors and to help respondents quickly understand the questionnaire. The sampling sites were distributed in the Kenting area according to activities engaged in by visitors (fishing, diving and the general visitors).
2.3.2. Descriptive Statistics
To increase the reliability of the questionnaire survey, this study interviewed 1284 visitors who went fishing, snorkeling, and sightseeing in the Kenting area. After the incomplete questionnaires were removed, there were 1236 valid questionnaires accounting for 96.2% of the total questionnaires. In the sample distribution, 313 were general visitors, 772 diving visitors and 151 fishing visitors. As regard socioeconomic background, there were 733 male respondents accounting for 59.3% of the total samples. Under marital status, there were 701 single respondents (56.7%) and 535 married respondents (43.3%), single respondents accounted for the majority. In age distribution, 276 respondents were 30–39 years old (22.3%), and 234 respondents are 20–29 years old (18.9%). In education, there were 643 respondents with college degree (52.0%), followed by 274 respondents with high (vocational) school degree (22.2%). With regard to profession, 311 were students (25.2%), followed by 305 respondents in the service sector (24.7%) and 146 respondents in the industry (11.8%). For average personal income, 447 respondents earned 20,000 to 40,000 yuan per month (36.2%), and 415 respondents earned less than 20,000 yuan per month (33.6%). There were 1110 respondents (89.8%) who have never participated in any environmental groups. 652 respondents (52.8%) do not usually carry environmental chopsticks, while 584 respondents (47.2%) usually carry them.
3. Results
This section may be divided by subheadings. It should provide a concise and precise description of the experimental results, their interpretation as well as the experimental conclusions that can be drawn.
3.1. Study of the Factors Influencing the Utility of Kenting Coral Conservation Attributes
In this study, the RPL model is used to estimate the utility function of Kenting coral reef ecosystem and study its relevant factors. The empirical results are shown in Table 2. The fitness of the assessment model of this study is tested (likelihood value is 1385) with significance level at 1% and 19 degrees of freedom and it was found to be significantly higher than the critical value (36.2), indicating that the utility function of Kenting coral reef ecosystem has a good explanatory ability (Table 2) [7,25]. The variable ASC represents status quo, and the negative sign implies that the respondents would support the implementation of coral reefs conservation policy. Moreover, the participants would prefer to change the current state of the coral reefs conservation in Kenting area. As for the factors influencing preferences for the coral reef ecosystem (Table 2), it was found that the LCC1 coefficient is positive and significant at the 1% level indicating that improving living coral coverage to a healthy level can increase the utility level of respondents. Further, at the 1% significance level, BIO and WQL coefficients are positive and their t values are also highly significant, indicating that increasing the biodiversity and improving the seawater quality to an unpolluted level will increase preferences of visitors for the Kenting coral reef ecosystem. As regards delimitation of the marine protected area, the t values of MPA1 and MPA2 are positive and significant at the 10% level, indicating that visitors prefer to increase the current area ratio of the marine protected area to 9%. With respect to the preference for restrictions on the number of visitors, the VIS1 coefficient is positive and significant at the 1% level, indicating that restricting the daily number of visitors to 75% of the status quo will significantly improve the utility of respondents. Finally, the t value of “coral reefs conservation fund” is negative and significant at the 1% level, indicating that visitors will derive a lower utility from the Kenting coral reef ecosystem if the coral reefs conservation fund increases.
The heterogeneity of preferences of visitors for coral ecosystem conservation can be discussed based on the standard error coefficient estimated by RPL [7,25]. As shown in Table 2, at the 1% significance level, the standard error coefficients of variables LCC1, LCC2, BIO, MPA1, WQL, VIS1 and VIS2 are significantly different, indicating that the preferences of visitors for the aforementioned coral reef ecosystem conservation attributes are heterogeneous. The results indicate that the respondents have different preferences for the aforementioned attributes because of their socioeconomic backgrounds and their touring behaviors. The WTP values for coral reef ecosystem conservation can be estimated using the marginal utility estimation formula of attributes [25]. In the formula, indicates the coefficient value of attributes, indicates the coefficient of the “coral reefs conservation fund” attribute. According to Table 2, for the “coral reefs conservation fund” attribute, the highest WTP corresponds to “improving living coral coverage from the status quo to a healthy level” (51 yuan/trip/person), sequentially followed by “improving water quality to unpolluted” (38.7 yuan/trip/person), “restricting the daily number of visitors to 75% of the current number” (33.0 yuan/trip/person), “increasing biodiversity” (32.3 yuan/ trip/person), and “increasing the area ratio of marine protected areas to 6%” (25.7 yuan/trip/person).
3.2. Study of the Willingness-To-Pay Values and Market Segments of the Coral Reef Ecosystem Attributes
This study found that the following five coral reef ecosystem attributes are heterogeneous (Table 2): improve the living coral coverage to a healthy level (LCC1), increase biodiversity (BIO), increase the area ratio of marine protected areas to 6% (MPA1), improve the seawater quality to not-polluted (WQL), and restrict the daily number of visitors to 75% of the current number (VIS1). The WTP values of respondents for the above attribute levels will be further discussed with the socioeconomic background and travel behaviors of respondents (Table 3).
According to Table 3, at the 10% significance level, the surveyed visitors who are single, younger than 39 years, and have an income between 80,000 yuan to 100,000 yuan are willing to pay a high value for an increase in biodiversity. MPA1’s WTP values are significantly different between respondent groups and environmental group. General visitors and non-environmental groups are willing to pay significantly higher values for increasing the area ratio of marine protected areas to 6%. For improving the seawater quality to unpolluted level (WQL), respondents with college or higher educational level are willing to pay a higher value at the 10% significance level. Finally, at the 5% significance level, WTP values of VIS1 greatly vary with respondent groups, marital status, educational level and age composition. This study found that tourists, snorkelers, unmarried people, and those with college or higher degree, and between 20 to 29 years of age, are willing to pay relatively high values for restricting the daily number of visitors to 75% of the current number. The findings of this study are consistent with the heterogeneous preferences and market segments of respondents discovered through RPL in the past literature [7,25].
3.3. Study of the Heterogeneity of Respondents’ Preferences for the Coral Reef Ecosystem
After analyzing the differences in WTP values for coral reef ecosystem conservation based on the socio-economic background of respondents, LCM was applied to further study the heterogeneous preferences of respondents for the coral reef ecosystem (Table 4). LCM analysis indicated that groups in two potential market segments have different preferences for coral reef ecosystem conservation. Although both groups want to change the status quo, the first group of respondents prefers “improving living coral coverage to excellent level”, “improving the seawater quality to unpolluted degree”, and “lower the coral reef conservation fund”; whereas, the second group of respondents prefers “improving living coral coverage to healthy level”, “increasing biodiversity”, “improving the seawater quality to an unpolluted degree”, “increasing the size of the marine protected area”, “increasing the area ratio of marine protected areas to 9%”, “restricting the daily number of visitors” and “lower the coral reef conservation fund”. As compared to the respondents of the first group, the respondents in the second group pay more attention to all coral reef ecosystem conservational management and their overall WTP values are also significantly higher. This group of people can be called as “visitors with obvious preferences for coral reef ecosystem conservation”, accounting for 83.1% of the total samples. Visitors in the first group prefer to increase living coral coverage and water quality only, and they can be termed as “visitors with fewer preferences”, accounting for only 16.9% of the total samples. Comparing the socio-economic backgrounds and travel behaviors of the two groups, this study found that “visitors with fewer preferences” mostly comprise fishing visitors with lower incomes and educational levels. Based on the foregoing analysis, this study also found that the respondent groups in Kenting area have heterogeneous preferences for the coral reef ecosystem and they have obvious market segment differences. Based on LCM, market segments of Kenting coral reef ecosystem preferences are divided to verify the results of RPL and the t test. Even for the same attribute level, the probability that an alternative is selected under influence of the attribute level will vary with the socio-economic backgrounds of the respondents.
3.4. Hypothetical Management Scenarios
In the case where the CE model is used to set a management plan, Garcia-Llorente, et al. [36] used it to create value assessment functions of land use management scenarios and estimated their economic values according to attributes and levels. Therefore, this study makes three plans for coral reef ecosystem operation and management based on the important attributes and levels of Kenting coral ecosystem conservation: “marine conservation plan”, “social institution plan”, and “integrated ecosystem management plan”. (1) “Marine conservation plan” mainly involves making plans for increasing the living coral coverage, biodiversity, and size of marine protected areas. Other attributes remain in the current status; (2) “Social institution plan” changes three attributes: improve the size of marine protected areas, improve water quality, and set a recreation limit. Other attributes remain in the current status; (3) “Integrated ecosystem management plan” combines marine resource conservation and social system formulation for the Kenting coral reef ecosystem conservation, including five attributes and levels: improve living coral coverage, increase biodiversity, increase the size of marine protected areas, improve water quality, and set a recreation capacity. The economic values of the aforementioned three assessment scenarios are estimated by the estimation coefficient of RPL, and the results are shown in Table 5.
The analysis results (Table 5) indicate that the economic value of the “marine conservation plan” is 109 yuan/trip/person, and the economic value at the 95% confidence interval ranges from 106.3 yuan to 111.7 yuan/trip/person. The economic value of the “social institution plan” is 97.4 yuan/trip/person, and the economic value at the 95% confidence interval ranges from 95.0 yuan to 99.8 yuan/trip/person. As for the “integrated ecosystem management plan”, its economic value reaches 180.7 yuan/trip/person, and the economic value at the 95% confidence interval ranges from 176.2 yuan to 185.2 yuan/trip/person.
4. Discussion
The Kenting coral ecosystem is influenced by excessive human activities and climate change. The coral ecology will deteriorate more severely if conservation and management are not strengthened. However, evidence had shown that protected wildlife may reduce the economic benefit [37], but which may be due to the lack of consideration of the socio-economic-environment [38,39]. In order to reduce the human impacts on coral reef ecosystem, and maintain coral reefs’ economic function to the community, economic practices should be enforced according to the concept of sustainable development [40]. In this case, knowing the economic value of Kenting coral reef could be an efficient way to communicate with the society adopting sustainable practices. After analyzing literature reviews, interviewing experts, and conducting onsite surveys, this study designs a conservation plan for the Kenting coral ecosystem based on domestic and international management, restoration and conservation measures for marine protected areas, factors that cause deterioration of the coral reef ecology; and related commission plans and survey data from Kenting National Park. In addition, this study uses the CE method to build the recreation benefit model, which can evaluate the multi-attribute utility of choice preferences of diving, fishing, and sightseeing visitors in the Kenting area.
It is found that conservation preferences of respondents for the Kenting coral reef ecosystem functions will be significantly improved if living coral coverage is improved to a healthy level, biodiversity is increased, seawater quality is improved to an unpolluted level, the area ratio of marine protected areas is increased to 6%, and the daily visitors are restricted to 75% of the current number. As for the marginal WTP values of coral reef ecosystem conservation, these are highest if living coral coverage is improved to a healthy level, followed by the seawater quality being improved to an unpolluted level, the daily number of visitors being restricted to 75% of the current number, an increase in biodiversity, and the area ratio of marine protected areas being increased to 6%. When developing management strategies, Kenting National Park Management Office and related units are suggested to improve the overall functions of Kenting coral reef ecosystem by improving living coral coverage, increasing the number of species, increasing the area proportion of marine protected areas, improving the water quality, and properly restricting the number of visitors. This is similar to the results of the study performed by Can and Alp in 2012 [9], which used the CE method to evaluate the environment improvement preferences of residents and visitors in Turkish Göcek Bay. Their studies also indicate that people can obtain environmental benefits by improving water quality and restoring the marine ecological system.
Studies have proved that visitors were willing to pay a price premium to support marine conservation [41,42], and also found that the amount of WTP could be influenced by the social demographic characteristics [42]. The preferences and WTP values of visitors in Kenting for the coral reef ecosystem are heterogeneous. Visitors who are single, 39 years old or younger, and earn higher incomes prefer to increase biodiversity; general visitors and non-environmental groups prefer to increase the sizes of marine protected areas; visitors with a college or higher degree hope that the seawater quality can be improved to an unpolluted level; snorkelers and visitors who are single, with college degrees and of younger ages prefer to set a limit on daily recreation. These results are similar to the results of the study by Jobstvogt, et al. in 2014 [8], which used the CE method to evaluate the attitudes and WTP values of local residents for deep-sea ecosystem conservation in England. The study also found that the social and economic backgrounds and travel behaviors of respondents also cause heterogeneous preferences for coral reef ecosystem conservation. This is similar to the results of the study by Hynes et al. in 2013 [43], which used the CE method to assess the benefits of improving the water quality of Ireland in Europe. Therefore, the above results can provide information on how to educate people about coral reef ecosystem conservation. Moreover, they can be used as references when Kenting operators and relevant units make the overall coral reef ecosystem conservation plan. The management units are suggested to first educate the stakeholders, such as single, young, well-educated, and high-income earning visitors and snorkelers to conserve the coral reef, and plan an advocacy strategy based on the differences of visitors, improving the effectiveness of Kenting coral reef ecosystem conservation plan under the support of the aforementioned personnel.
5. Conclusions and Suggestions
Regarding the discussion, we can generate the policy implications for the protected area managers of the coral reef: (1) the management program have to contain living coral coverage, biodiversity, marine protected area, water quality levels, number of visitors, and a coral reefs conservation fund for the reef protected area [6,7,9,25,27,33]; (2) it would meet the goals of sustainable development to contain the aspects of ecology, recreation, and institution into protected area management [8,44]; (3) capturing the heterogeneity’s preference for the stakeholders would help to integrate the comprehensive framework of market segmentation strategy by combining the qualitative and quantitative data in a protected area [44,45,46,47]; (4) for the environmental education and positioning of a reef protected area, programmers may concentrate on increasing the 50%–75% of living coral coverage, increasing the biodiversity, increasing the marine protected area at 6%, improving the seawater quality to an unpolluted level, and restricting the daily number of visitors to 75% of the status quo. Thus, this would meet the criterion of sustainable marine tourism of reef protected area simultaneously with a visitor’s preferences and opinions for the effectiveness program in the future. Finally, the results of the research on the economic values of Kenting coral reef ecosystem management plans indicate that the “integrated ecosystem management plan” has the highest coral reef ecosystem conservation value, followed by the “marine conservation plan” and the “social institution plan”. If estimated based on the current 8 million visitors, then the stated plans can generate great economic values for coral reef ecosystem conservation. Therefore, the foregoing analysis can be referred to by the Environmental Protection Administration, Kenting National Park, and the to-be-established department of environmental resources when they make the budget allocation and operation management plan for coral reef conservation.
Author Contributions
Conceptualization, C.-H.L. and Y.-J.C.; methodology, C.-H.L. and Y.-J.C.; software, C.-H.L. and Y.-J.C.; validation, C.-H.L., Y.-J.C., and C.-W.C.; formal analysis, C.-H.L. and Y.-J.C.; investigation, C.-H.L. and C.-W.C.; resources, C.-H.L. and Y.-J.C.; data curation, C.-H.L. and C.-W.C.; writing—original draft preparation, C.-H.L., Y.-J.C., and C.-W.C.; writing—review and editing, C.-H.L. and Y.-J.C.; visualization, Y.-J.C., and C.-W.C.; supervision, C.-H.L.; project administration, C.-H.L. and Y.-J.C.; funding acquisition, C.-H.L. and Y.-J.C.
Funding
This research was funded by Center for Sustainability Science, Academia Sinica, Taiwan, grant number AS-104-SS-A03 and AS-TP-108-LM14, and Fisheries Agency, Council of Agriculture, Executive Yuan, (Taiwan, ROC) grant number 106AS-13.2.1-FA-F2.
Conflicts of Interest
The authors declare no conflict of interest.
References
- Cesae, H.S.J. Collected Essays on the Economics of Coral Reefs; CORDIO, Kalmar University: Kalmar, Sweden, 2000. [Google Scholar]
- Tseng, W.W.C.; Hsu, S.H.; Chen, C.C. Estimating the willingness to pay to protect coral reefs from potential damage caused by climate change—The evidence from Taiwan. Mar. Pollut. Bull. 2015, 101, 556–565. [Google Scholar] [CrossRef]
- Liu, P.J.; Meng, P.J.; Liu, L.L.; Wang, J.T.; Leu, M.Y. Impacts of human activities on coral reef ecosystems of southern Taiwan: A long-term study. Mar. Pollut. Bull. 2012, 64, 1129–1135. [Google Scholar] [CrossRef] [PubMed]
- Meng, P.J.; Lee, H.J.; Wang, J.T.; Chen, C.C.; Lin, H.J.; Tew, K.S.; Hsieh, W.J. A long-term survey on anthropogenic impacts to the water quality of coral reefs, southern Taiwan. Environ. Pollut. 2008, 156, 67–75. [Google Scholar] [CrossRef] [PubMed]
- Burke, L.; Reytar, K.; Spalding, M.; Perry, A. Reefs at Risk Revisited; World Resources Institute: Washington, DC, USA, 2011. [Google Scholar]
- Wattage, P.; Glenn, H.; Mardle, S.; Van Rensburg, T.; Grehan, A.; Foley, N. Economic value of conserving deep-sea corals in Irish waters: A choice experiment study on marine protected areas. Fish. Res. 2011, 107, 59–67. [Google Scholar] [CrossRef]
- Rolfe, J.; Windle, J. Testing benefit transfer of reef protection values between local case studies: The Great Barrier Reef in Australia. Ecol. Econ. 2012, 81, 60–69. [Google Scholar] [CrossRef]
- Jobstvogt, N.; Hanley, N.; Hynes, S.; Kenter, J.; Witte, U. Twenty thousand sterling under the sea: Estimating the value of protecting deep-sea biodiversity. Ecol. Econ. 2014, 97, 10–19. [Google Scholar] [CrossRef] [Green Version]
- Can, Ö.; Alp, E. Valuation of environmental improvements in a specially protected marine area: A choice experiment approach in Göcek Bay, Turkey. Sci. Total Environ. 2012, 439, 291–298. [Google Scholar] [CrossRef]
- Marre, J.B.; Brander, L.; Thebaud, O.; Boncoeur, J.; Pascoe, S.; Coglan, L.; Pascal, N. Non-market use and non-use values for preserving ecosystem services over time: A choice experiment application to coral reef ecosystems in New Caledonia. Ocean Coast. Manag. 2015, 105, 1–14. [Google Scholar] [CrossRef] [Green Version]
- Boxall, P.C.; Adamowicz, W.L.; Olar, M.; West, G.E.; Cantin, G. Analysis of the economic benefits associated with the recovery of threatened marine mammal species in the Canadian St. Lawrence Estuary. Mar. Policy 2012, 36, 189–197. [Google Scholar] [CrossRef]
- Train, K.E. Discrete Choice Methods with Simulation; Cambridge University Press: Cambridge, UK, 2009. [Google Scholar]
- McFadden, D.; Zarembka, P. Frontiers in econometrics. In Conditional Logit Analysis of Qualitative Choice Behavior; University of Berkley: Berkley, CA, USA, 1974; pp. 105–142. [Google Scholar]
- Hanley, N.; Colombo, S.; Tinch, D.; Black, A.; Aftab, A. Estimating the benefits of water quality improvements under the Water Framework Directive: Are benefits transferable? Eur. Rev. Agric. Econ. 2006, 33, 391–413. [Google Scholar] [CrossRef]
- Shoji, Y.; Tsuge, T. Heterogeneous preferences for winter nature-based tours in sub-frigid climate zones: A latent class approach. Tour. Econ. 2015, 21, 387–407. [Google Scholar] [CrossRef]
- Revelt, D.; Train, K. Mixed logit with repeated choices: Households’ choices of appliance efficiency level. Rev. Econ. Stat. 1998, 80, 647–657. [Google Scholar] [CrossRef]
- Hensher, D.A.; Rose, J.M.; Greene, W.H. Applied Choice Analysis: A Primer; Cambridge University Press: Cambridge, UK, 2005. [Google Scholar]
- Birol, E.; Koundouri, P. (Eds.) Choice Experiments Informing Environmental Policy: A European Perspective; Edward Elgar Publishing: Cheltenham, UK, 2008. [Google Scholar]
- Brander, L.; Van Breukering, P. The Total Economic Value of US Coral Reefs: A Review of the Literature; NOAA: Silver Spring, MD, USA, 2013. [Google Scholar]
- Gomez, E.D.; Alcala, A.C. San Diego AC. Status of Philippine coral reefs–1981. In Proceedings of the Fourth International Coral Reef Symposium, Manila, Philippines, 18–22 May 1981; pp. 275–282. [Google Scholar]
- Spalding, M.; Spalding, M.D.; Ravilious, C.; Green, E.P. World Atlas of Coral Reefs; University of California Press: Oakland, CA, USA, 2001; p. 416. [Google Scholar]
- Knowlton, N.; Brainard, R.E.; Fisher, R.; Moews, M.; Plaisance, L.; Caley, M.J. Life in the World’s Oceans: Diversity, Distribution, and Abundance; Blackwell Publ.: Hoboken, NJ, USA, 2010; Volume 10, pp. 65–78. ISBN 9781444325508. [Google Scholar]
- Bianchi, C.N.; Morri, C. Marine biodiversity of the Mediterranean Sea: Situation, problems and prospects for future research. Mar. Pollut. Bull. 2000, 40, 367–376. [Google Scholar] [CrossRef]
- Carlsson, F.; Frykblom, P.; Liljenstolpe, C. Valuing wetland attributes: An application of choice experiments. Ecol. Econ. 2003, 47, 95–103. [Google Scholar] [CrossRef]
- Juutinen, A.; Mitani, Y.; Mäntymaa, E.; Shoji, Y.; Siikamäki, P.; Svento, R. Combining ecological and recreational aspects in national park management: A choice experiment application. Ecol. Econ. 2011, 70, 1231–1239. [Google Scholar] [CrossRef]
- Toropova, C.; Meliane, I.; Laffoley, D.; Matthews, E.; Spalding, M. Global Ocean Protection; IUCN WCPA: Gland, Switzerland, 2010. [Google Scholar]
- Mccay, B.J.; Jones, P.J.S. Marine protected areas and the governance of marine ecosystems and fisheries. Conserv. Biol. 2011, 25, 1130–1133. [Google Scholar] [CrossRef]
- Batisse, M. Developing and focusing the biosphere reserve concept. In Perspectives in Resource Management in Developing Countries; Concept Publishing: New Delhi, India, 2003; Volume 5, p. 160. [Google Scholar]
- Sale, P.F.; Cowen, R.K.; Danilowicz, B.S.; Jones, G.P.; Kritzer, J.P.; Lindeman, K.C.; Planes, S.; Polunin, N.V.C.; Russ, G.R.; Sadovy, Y.J.; et al. Critical science gaps impede use of no-take fishery reserves. Trends Ecol. Evol. 2005, 20, 74–80. [Google Scholar] [CrossRef]
- Archer, D.E. An atlas of the distribution of calcium carbonate in sediments of the deep sea. Glob. Biogeochem. Cycles 1996, 10, 159–174. [Google Scholar] [CrossRef]
- Kleypas, J.A.; McManus, J.W.; Menez, L.A.B. Environmental limits to coral reef development: Where do we draw the line? Am. Zool. 1999, 39, 146–159. [Google Scholar] [CrossRef]
- Castellani, V.; Sala, S.; Pitea, D. A new method for tourism carrying capacity assessment. In Ecosystems and Sustainable Development VI; WIT Press: Southampton, UK, 2007; pp. 365–374. [Google Scholar]
- Ríos-Jara, E.; Galván-Villa, C.M.; Rodríguez-Zaragoza, F.A.; López-Uriarte, E.; Munoz-Fernández, V.T. The tourism carrying capacity of underwater trails in Isabel Island National Park, Mexico. Environ. Manag. 2013, 52, 335–347. [Google Scholar] [CrossRef]
- Thur, S.M. User fees as sustainable financing mechanisms for marine protected areas: An application to the Bonaire National Marine Park. Mar. Policy 2010, 34, 63–69. [Google Scholar] [CrossRef]
- Depondt, F.; Green, E. Diving user fees and the financial sustainability of marine protected areas: Opportunities and impediments. Ocean Coast. Manag. 2006, 49, 188–202. [Google Scholar] [CrossRef]
- García-Llorente, M.; Martín-López, B.; Iniesta-Arandia, I.; López-Santiago, C.A.; Aguilera, P.A.; Montes, C. The role of multi-functionality in social preferences toward semi-arid rural landscapes: An ecosystem service approach. Environ. Sci. Policy 2012, 19, 136–146. [Google Scholar] [CrossRef]
- Cuerdo-Mir, M.; Picher, A.; Sainz, J. Determinación del precio en terrenos agrícolas en espacios protegidos. Rev. Mex. Cienc. Agrícolas 2015, 6, 1403–1416. [Google Scholar] [CrossRef]
- Chang, Y.C.; Hong, F.W.; Lee, M.T. A system dynamic based DSS for sustainable coral reef management in Kenting coastal zone, Taiwan. Ecol. Model. 2008, 211, 153–168. [Google Scholar] [CrossRef]
- Zielinska, A. Applying Multidimentional Comparative Analysis for the Assessment of the Concept Realization of Sustainable Development for the Protected Areas. Econ. Sociol. 2011, 4, 87. [Google Scholar] [CrossRef]
- Zielinska, A. Abilities of running an economic activity on protected areas. Econ. Sociol. 2009, 2, 108. [Google Scholar] [CrossRef]
- Tongson, E.; Dygico, M. User fee system for marine ecotourism: The Tubbataha Reef experience. Coast. Manag. 2004, 32, 17–23. [Google Scholar] [CrossRef]
- Peters, H.; Hawkins, J.P. Access to marine parks: A comparative study in willingness to pay. Ocean Coast. Manag. 2009, 52, 219–228. [Google Scholar] [CrossRef]
- Hynes, S.; Tinch, D.; Hanley, N. Valuing improvements to coastal waters using choice experiments: An application to revisions of the EU Bathing Waters Directive. Mar. Policy 2013, 40, 137–144. [Google Scholar] [CrossRef] [Green Version]
- Sriarkarin, S.; Lee, C.H. Integrating the multiple attributes for sustainable development in a national park. Tour. Manag. Perspect. 2018, 28, 113–125. [Google Scholar] [CrossRef]
- Zong, C.; Cheng, K.; Lee, C.H.; Hsu, N.L. Capturing Tourists’ Preferences for the Management of Community-Based Ecotourism in a Forest Park. Sustainability 2017, 9, 1673. [Google Scholar] [CrossRef]
- Lee, C.H.; Wang, C.H. Estimating Residents’ Preferences of the Land Use Program Surrounding Forest Park, Taiwan. Sustainability 2017, 9, 598. [Google Scholar] [CrossRef]
- Lee, C.L.; Wang, C.H.; Lee, C.H.; Sriarkarin, S. Evaluating the public’s preferences toward sustainable planning under climate and land use change in forest parks. Sustainability 2019, 11, 3149. [Google Scholar] [CrossRef]
Figure 1.
Example of preference choice sets of Kenting coral ecology conservation.


Table 1.
Attributes and levels of Kenting coral reef conservation.
| Attributes | Levels | Variable Name |
|---|---|---|
| Living coral coverage (%) | 1. 25%–50% (FAIR) | LCC ±(LCC) |
| 2. Increase to 50%–75% (GOOD) | LCC +(LCC1) | |
| 3. Increase more than 75% (EXC) | LCC ++(LCC2) | |
| Biodiversity | 1. Status quo | BIO ±(BIO) |
| 2. Populations of species increase | BIO +(BIO1) | |
| Marine protected area (%) | 1. 3.13% | MPA ±(MPA) |
| 2. Percent of area increases to 6% | MPA +(MPA1) | |
| 3. Percent of area increases to 9% | MPA ++(MPA2) | |
| Seawater quality | 1. Mild to moderate pollution | WQL ±(WQL) |
| 2. Gets better (Clean or Excellent) | WQL +(WQL1) | |
| Number of visitors | 1. No capacity control | VIS ±(VIS) |
| 2. Capacity control reduces number to 75% | VIS −(VIS1) | |
| 3. Capacity control reduces number to 50% | VIS −−(VIS2) | |
| Coral reefs conservation Fund (NT$/person/trip) | 1. No pay | FUND |
| 2. NT$100/person/trip | ||
| 3. NT$200/person/trip | ||
| 4. NT$300/person/trip | ||
| 5. NT$400/person/trip |
Note: The superscript ± describes the attribute level included in the basic alternative. The superscript + (++) indicates an increase (strong) compared with the basic alternative and the superscript − indicates a reduction.
Table 2.
Results of random parameter logit model.
| Variables & Levels | Coeff. | t Value | Coeff. Std | t Value | WTP |
|---|---|---|---|---|---|
| ASC | −2.515 | −10.63 *** | 3.190 | 13.03 *** | |
| LCC1 | 0.294 | 4.73 *** | 0.435 | 2.92 *** | 51.0 |
| LCC2 | 0.099 | 1.46 | 0.495 | 2.71 *** | - |
| BIO | 0.186 | 4.20 *** | 0.474 | 4.45 *** | 32.3 |
| MPA1 | 0.148 | 2.33 ** | 0.595 | 5.10 *** | 25.7 |
| MPA2 | 0.123 | 1.70 * | 0.341 | 1.35 | 21.3 |
| WQL | 0.223 | 5.02 *** | 0.397 | 3.20 *** | 38.7 |
| VIS1 | 0.190 | 2.86 *** | 0.824 | 7.39 *** | 33.0 |
| VIS2 | 0.073 | 1.01 | 0.551 | 3.36 *** | - |
| FUND | −0.0058 | −12.06 *** | - | - | - |
| Log-likelihood Ratio | 1385.2 *** | χ2 (0.01,19) = 36.2 | |||
Note: *, **, ***—Significant at 1%, 5%, 10% level respectively.
Table 3.
Relationships among willingness-to-pay values, socioeconomic background, and travel behavior.
Table 3.
Relationships among willingness-to-pay values, socioeconomic background, and travel behavior.
| OBS | LCC1 | BIO | MPA | WQL | VIS1 | ||||||
|---|---|---|---|---|---|---|---|---|---|---|---|
| Characteristic of Social | Mean | T or F Value | Mean | T or F Value | Mean | T or F Value | Mean | T or F Value | Mean | T or F Value | |
| Divers | 743 | 51.35 | 0.784 (F value) | 32.89 | 0.495 (F value) | 24.27 | 2.336 * (F value) | 38.33 | 0.287 (F value) | 37.37 | 11.03 *** (F value) |
| Fishermen | 144 | 52.32 | 30.37 | 24.14 | 36.92 | 8.33 | |||||
| Visitors | 297 | 49.76 | 32.71 | 30.10 | 38.12 | 37.83 | |||||
| Single | 674 | 51.71 | 1.127 | 34.56 | 2.856 *** | 26.36 | 0.623 | 38.03 | −0.154 | 38.85 | 2.76 ** |
| Married | 510 | 50.22 | 29.87 | 24.88 | 38.21 | 27.48 | |||||
| Senior school | 469 | 49.78 | −1.601 | 30.93 | −1.596 | 24.60 | −0.770 | 36.70 | −1.932 * | 25.15 | −3.50 *** |
| University | 715 | 51.91 | 33.59 | 26.45 | 39.03 | 39.73 | |||||
| No Environmental groups | 1066 | 50.81 | −1.168 | 32.69 | 0.561 | 26.38 | 1.702 * | 38.39 | 1.455 | 32.99 | −1.41 |
| Environmental groups | 118 | 53.36 | 31.16 | 19.71 | 35.52 | 42.64 | |||||
| Never carry eco-chopstick in outside | 619 | 50.86 | −0.327 | 31.94 | −0.767 | 26.22 | 0.449 | 37.58 | −0.922 | 31.10 | −1.46 |
| Always carry eco-chopstick in outside | 565 | 51.29 | 33.19 | 25.17 | 38.68 | 37.08 | |||||
| 20~29 years old | 599 | 51.23 | 1.338 (F value) | 33.82 | 2.433 ** (F value) | 27.89 | 1.490 (F value) | 38.91 | 1.380 (F value) | 39.84 | 2.48 ** (F value) |
| 30~39 | 259 | 48.87 | 33.27 | 25.98 | 37.07 | 28.73 | |||||
| 40~49 | 223 | 53.50 | 31.76 | 22.81 | 37.25 | 29.42 | |||||
| 50~59 | 97 | 50.18 | 25.37 | 18.82 | 38.81 | 24.11 | |||||
| More than 60 | 6 | 53.64 | 17.35 | 17.67 | 22.76 | −.78 | |||||
| Less thanNT$20,000 | 401 | 50.68 | 1.094 (F value) | 34.51 | 2.123 * (F value) | 26.05 | 0.405 (F value) | 38.04 | 0.450 (F value) | 33.22 | 0.794 (F value) |
| NT$20,000~NT$40,000 | 578 | 51.90 | 31.90 | 24.84 | 37.70 | 32.25 | |||||
| NT$50,000~NT$70,000 | 152 | 50.52 | 28.47 | 28.73 | 39.85 | 38.41 | |||||
| NT$80,000~NT$100,000 | 53 | 46.41 | 36.18 | 24.21 | 38.03 | 45.37 | |||||
Note: *, **, ***—Significant at 1%, 5%, 10% level respectively.
Table 4.
Willingness-to-pay (WTP) evaluation for Kenting coral conservation with latent class model (LCM).
Table 4.
Willingness-to-pay (WTP) evaluation for Kenting coral conservation with latent class model (LCM).
| Attributes and Level | Coefficient | t Value | WTP |
|---|---|---|---|
| Group 1 | |||
| ASC | −1.201 | −2.01 ** | |
| LCC1 | 0.131 | 0.58 | - |
| LCC2 | 0.706 | 2.84 *** | 64.1 |
| BIO | 0.207 | 1.10 | - |
| MPA1 | 0.055 | 0.22 | - |
| MPA2 | −0.071 | −0.25 | - |
| WQL | 0.397 | 2.46 ** | 36.0 |
| VIS1 | −0.186 | −0.67 | - |
| VIS2 | −0.254 | −0.90 | - |
| −0.011 | −5.97 *** | ||
| Group 2 | |||
| ASC | −0.964 | −6.66 *** | |
| LCC1 | 0.162 | 3.56 *** | 81.0 |
| LCC2 | 0.033 | 0.58 | - |
| BIO | 0.105 | 3.14 *** | 52.5 |
| MPA1 | 0.084 | 1.83 * | 42.0 |
| MPA2 | 0.111 | 1.90 * | 55.5 |
| WQL | 0.135 | 3.98 *** | 67.5 |
| VIS1 | 0.172 | 3.67 *** | 86.0 |
| VIS2 | 0.103 | 1.83 * | 51.5 |
| −0.002 | −7.81 *** | ||
| Class membership parameters: Group 1 | |||
| Constant | −0.798 | −1.61 | |
| Divers | −0.235 | 0.467 | |
| Fishermen | 1.872 | 4.05 *** | |
| Income > NT$ thirty thousand | −1.435 | −2.80 *** | |
| Married | 0.688 | 1.63 | |
| University | −1.676 | −2.00 ** | |
| Number of choice sets | 3515 | ||
| Log-likelihood ratio | −3426.640 | ||
| Chi squared | χ2 (0.01,26) = 45.6 | ||
Note 1: The superscript ± describes the attribute level included in the basic alternative. The superscript +(++) indicates an increase (strong) compared with the basic alternative, and the superscript − indicates a reduction. Note 2: *, **, ***—Significant at 1%, 5%, 10% level respectively.
Table 5.
Multiple scenarios of coral reef conservation.
| Policy Attributes | Marine Conservation | Social Institution | Integrated Management for the Ecosystem |
|---|---|---|---|
| Living coral Coverage (%) | Increase to 50%–75% (GOOD) | Stay as in the present | Increase to 50%–75% (GOOD) |
| Biodiversity | Population increase | Stay as in the present | population Increase |
| Marine protected area (%) | increase to 6% | increase to 6% | increase to 6% |
| Water quality Levels | Stay as in the present | Gets better (Clean or Excellent) | Gets better (Clean or Excellent) |
| Number of Visitors | Stay as in the present | Set the 75% total capacity control | Set the 75% total capacity control |
| Mean WTP 95% confidence level | 109 106.3~111.7 | 97.4 95.0~99.8 | 180.7 176.2~185.2 |
© 2019 by the authors. Licensee MDPI, Basel, Switzerland. This article is an open access article distributed under the terms and conditions of the Creative Commons Attribution (CC BY) license (http://creativecommons.org/licenses/by/4.0/).
Share and Cite
MDPI and ACS Style
Lee, C.-H.; Chen, Y.-J.; Chen, C.-W. Assessment of the Economic Value of Ecological Conservation of the Kenting Coral Reef. Sustainability 2019, 11, 5869. https://0-doi-org.brum.beds.ac.uk/10.3390/su11205869
AMA Style
Lee C-H, Chen Y-J, Chen C-W. Assessment of the Economic Value of Ecological Conservation of the Kenting Coral Reef. Sustainability. 2019; 11(20):5869. https://0-doi-org.brum.beds.ac.uk/10.3390/su11205869
Chicago/Turabian StyleLee, Chun-Hung, Yun-Ju Chen, and Chu-Wei Chen. 2019. "Assessment of the Economic Value of Ecological Conservation of the Kenting Coral Reef" Sustainability 11, no. 20: 5869. https://0-doi-org.brum.beds.ac.uk/10.3390/su11205869
Note that from the first issue of 2016, this journal uses article numbers instead of page numbers. See further details here.