The Corporate Performance Measurement and Its Importance for the Pricing in a Transport Enterprise


Abstract
:1. Introduction
2. Literature Review
2.1. Externalities and Transport Costs
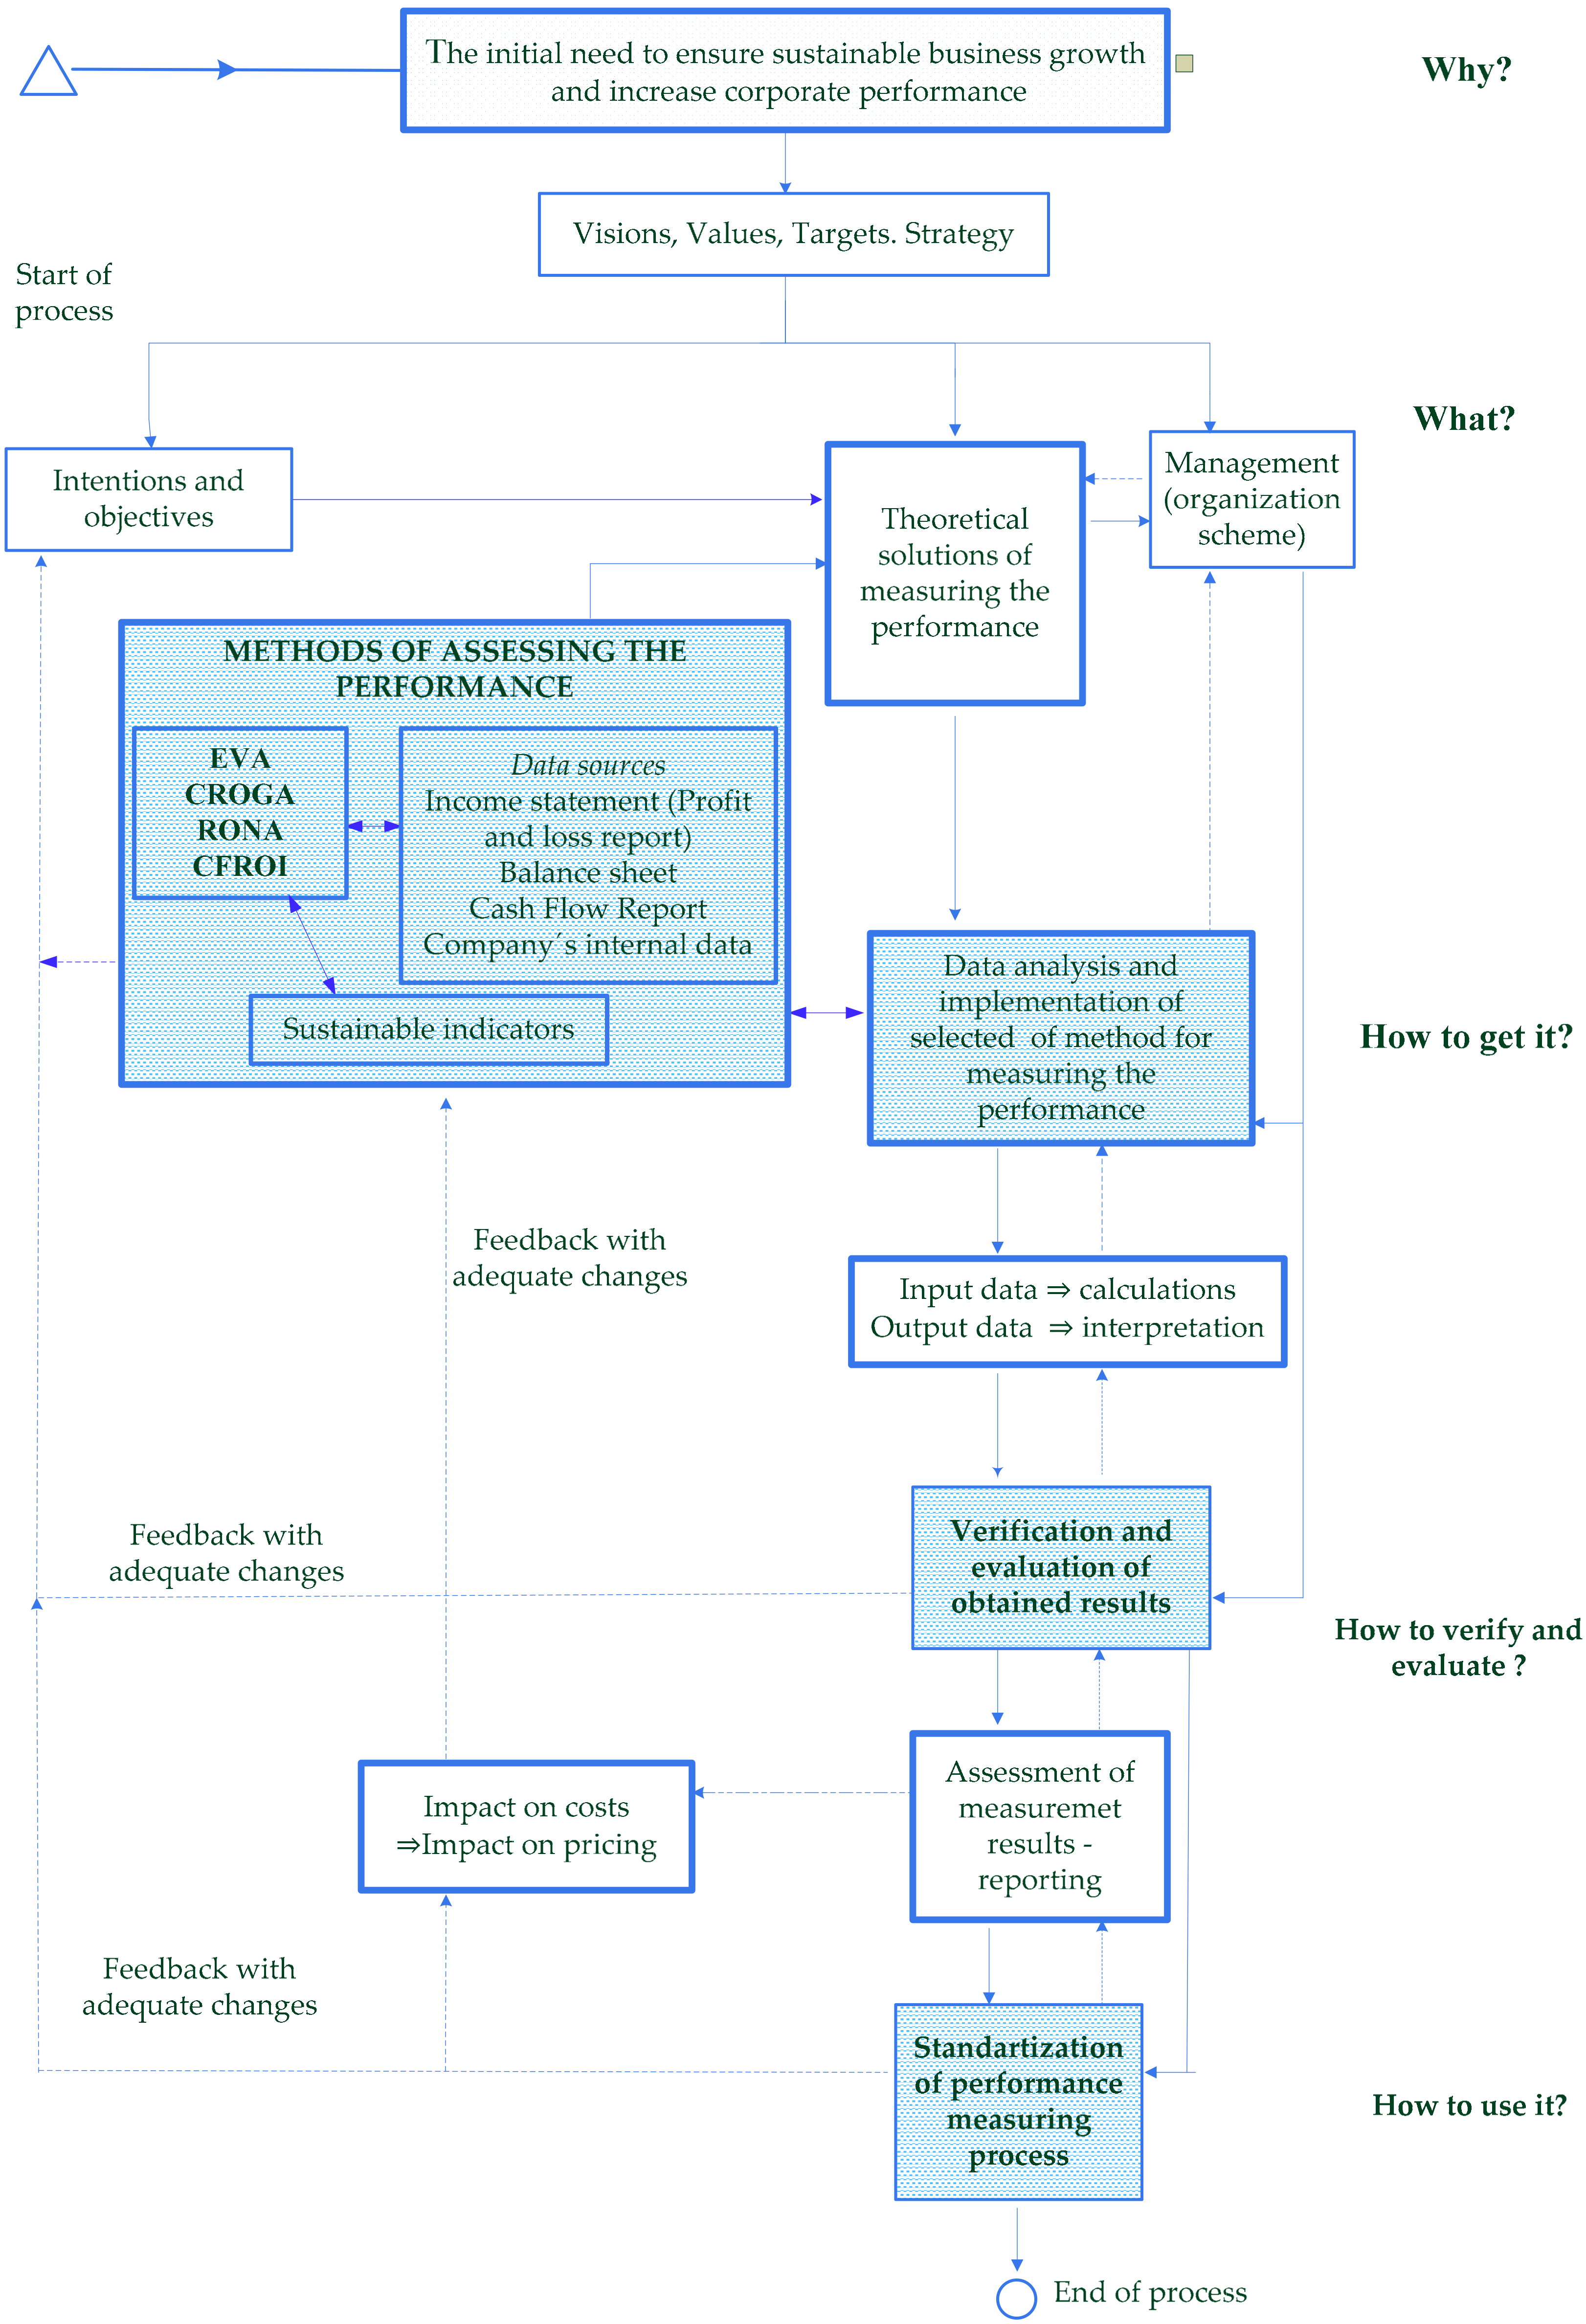
2.2. Corporate Performance Measurement in a Transport Enterprise
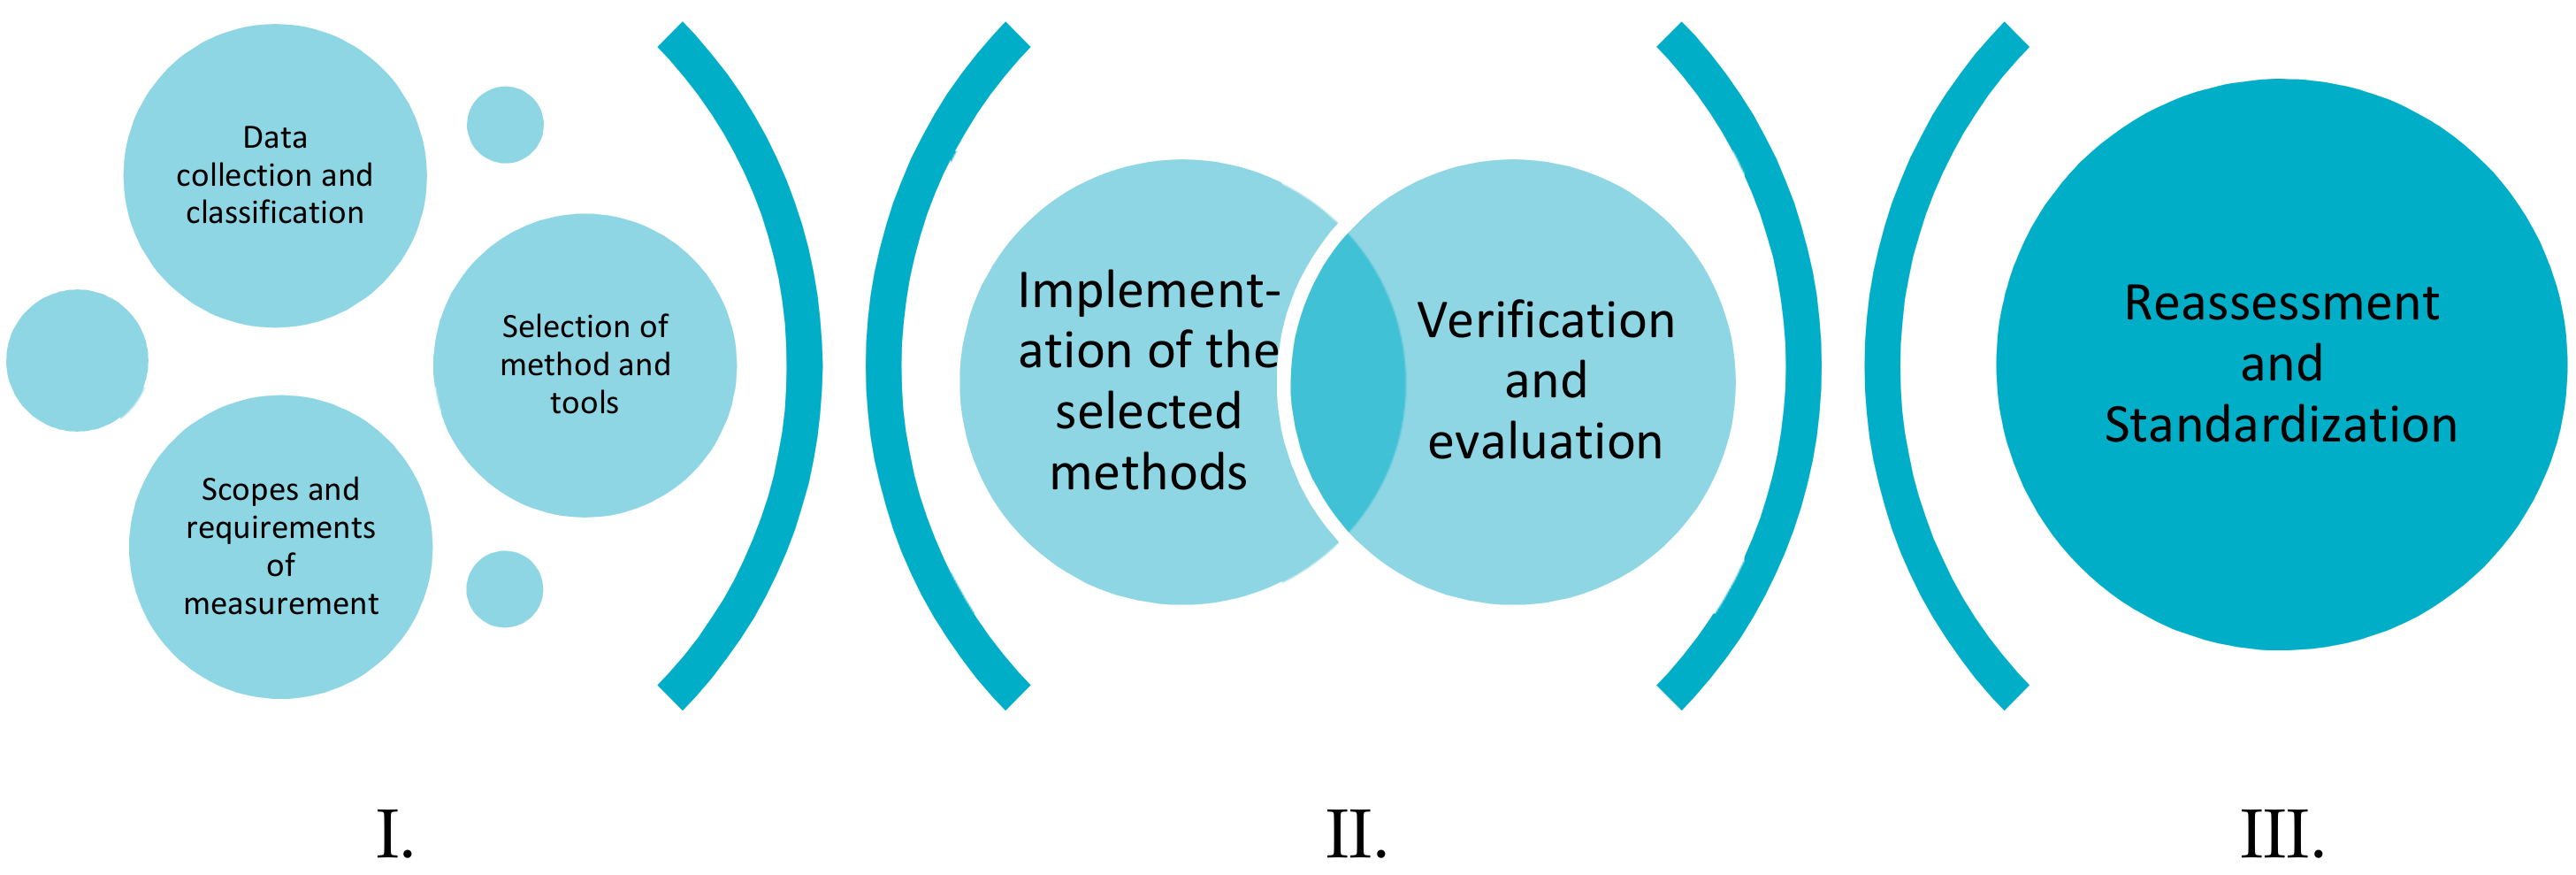
- Data collection and classification in terms of suitability of corporate performance evaluation and transport sustainability. Analysis of the variables’ determination, process mapping and identification of limitations.
- A search for convenient performance evaluation methods for a transport enterprise, according to sustainable requirements, business size, time, and capacity options, legal form, quality of human capital [50], etc.
- Identification of the measurement’s scope, evaluation time intervals, and the transport´s indicators affecting the costs of the transport enterprise and following its performance. Determination and application of appropriate ICT performance assessment tools.
- Implementation of selected performance measurement methods within specific conditions and their graphical interpretation.
- Verification and evaluation of the obtained results, analysis of the causes of deviations and provision of information to the management.
- Reassessment of the results by the management, correction in the extensions or the rejection of application of the performance methods in relation to specific requirements.
- Subsequent performance measurement plan´s setting and standardization of the performance measurement process.
3. Materials and Methods
4. Results
4.1. Economic Value Added (EVA)
4.2. Cash Flow Return on Investment (CFROI)
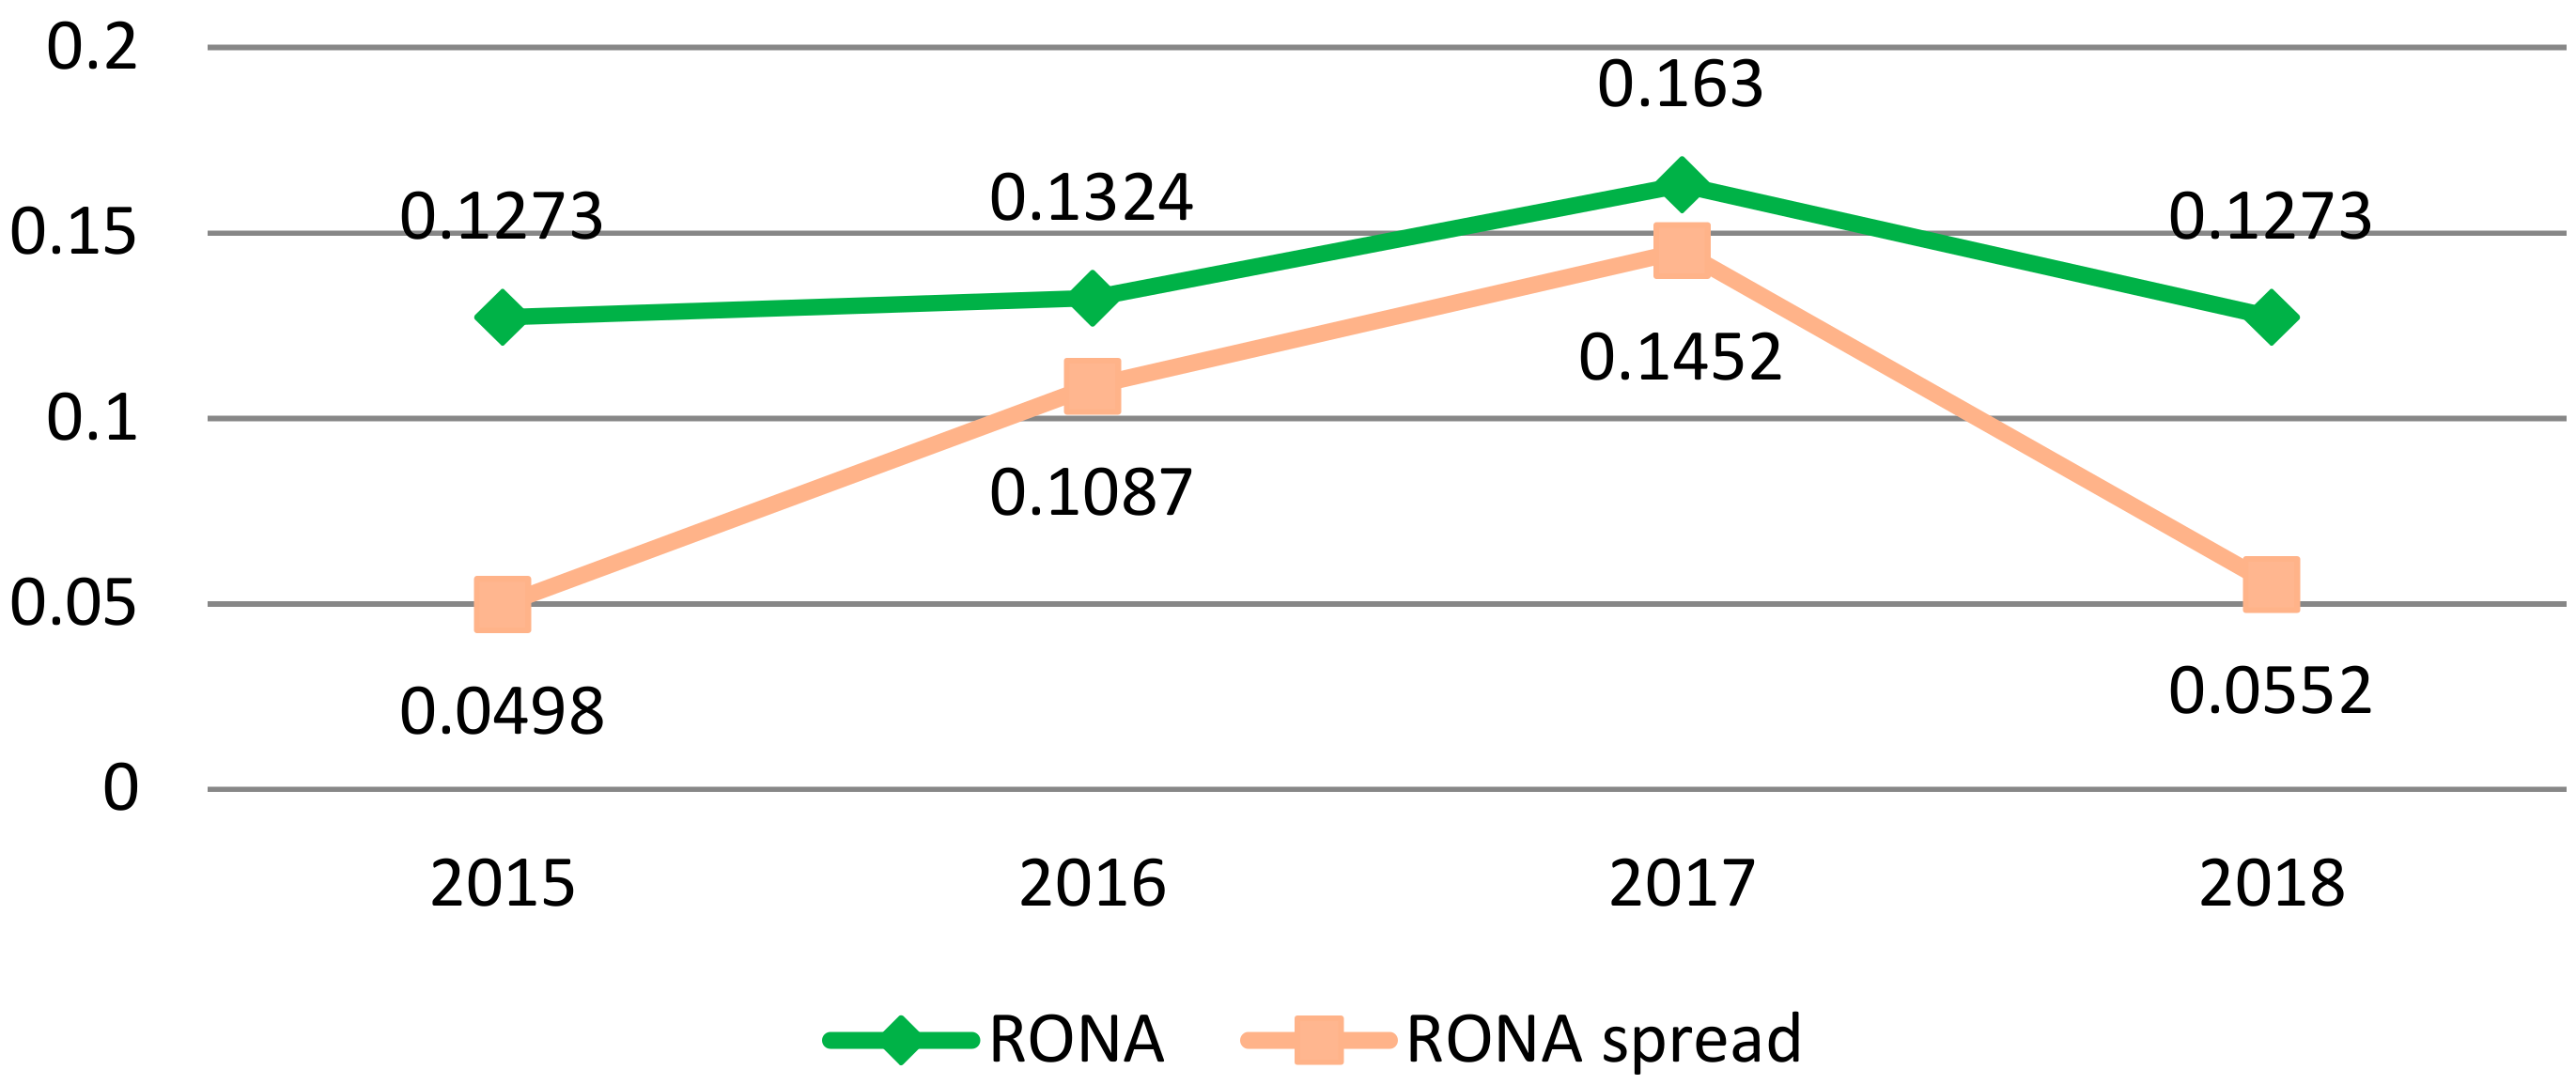
4.3. Rentability on Net Assets (RONA)
4.4. Cash Return On Gross Assets (CROGA)
4.5. Conclusions Based on the Application of the Methods
5. Discussion
6. Conclusions
Author Contributions
Funding
Conflicts of Interest
References
- Fellnhofer, K. Drivers of innovation success in sustainable business. J. Clean. Prod. 2017, 167, 1534–1545. [Google Scholar] [CrossRef]
- Collins, A.J.; Hester, B.E.; Horst, J. An improvement selection methodology for key performance indicators. Environ. Syst. Decis. 2016, 36, 196–208. [Google Scholar] [CrossRef]
- Rauter, R.; Globocnik, D.; Perl-Vorbach, E.; Baumgartner, J.R. Open innovation and it´s effects on economic and sustainability innovation performance. J. Innov. Knowl. 2019, 4, 223–226. [Google Scholar] [CrossRef]
- Salvado, M.F.; Azevedo, G.S.; Matias, C.O.J.; Ferreira, M.L. Proposal of a Sustainability Index for the Automotive Industry. Sustainability 2015, 7, 2113–2144. [Google Scholar] [CrossRef] [Green Version]
- Darton, C.R. Setting a policy for sustainability: The importance of measurement. In Assessing and Measuring Environmental Impact and Sustainability; Butterworth-Heinemann: Oxford, UK, 2015; pp. 479–496. [Google Scholar]
- Chen, T. Competitive and sustainable manufacturing in the age of globalization. Sustainability 2017, 9, 26. [Google Scholar] [CrossRef]
- Poliak, M.; Hammer, J.; Reuter, N.; Poliakova, A. The impact of the transport route on the cost of the transfer. In Proceedings of the 2018 XI International Science-Technical Conference Automotive Safety, Casta, Slovakia, 18–20 April 2018. [Google Scholar]
- Tsai, C.H.; Mulley, C. Identifying Short-run and Long-run Public Transport Demand Elasticities in Sydney a Pseudo Panel Approach. J. Transp. Econ. Policy 2014, 48, 241–259. [Google Scholar]
- Potkany, M.; Hlatka, M.; Debnar, M.; Hanzl, J. Comparison of the Lifecycle Structure of Electric and Diesel buses. Nase More 2018, 65, 270–275. [Google Scholar] [CrossRef]
- Ljungberg, A. Marginal cost-pricing in the Swedish transport sector—An efficient and sustainable way of funding local and regional public transport in the future. Res. Transp. Econ. 2016, 59, 159–166. [Google Scholar] [CrossRef]
- Janacek, J.; Kohani, M.; Koniorczyk, M.; Marton, P. Optimization of periodic crew schedules with application of column generation method. Transp. Res. Part C 2017, 83, 163–178. [Google Scholar] [CrossRef]
- Janech, J.; Baca, T.; Lieskovsky, A.; Krsak, E.; Matiasko, K. Distributed database systems and data replication algorithms for intelligent transport systems. Komunikacie 2013, 15, 6–12. [Google Scholar]
- Proost, S.; Van Dender, K. Optimal urban transport pricing in the presence of congestion, economies of density and costly public funds. Transp. Res. Part A 2008, 42, 1220–1230. [Google Scholar] [CrossRef]
- Hansson, L.; Holmgren, J. Reducing Dependency on Special Transport Services Through Public Transport, World Conference on Transport Research; Ulengin, F., Boltze, M., Eds.; Tongji University: Shanghai, China, 2017; Volume 25, pp. 2454–2464. [Google Scholar]
- European Commission. DG Mobility and Transport. In Update of the Handbook of External Costs of Transport; European Commission: London, UK, 2014. [Google Scholar]
- Tveter, E. Using impact on commuting as an initial test of wider economic benefits of transport improvements: Evidence from the Eiksund Connection. Case Stud. Transp. Policy 2018, 6, 803–814. [Google Scholar] [CrossRef]
- Wetwitoo, J.; Kato, H. High-speed rail and regional economic productivity through agglomeration and netork externality: A case study of inter-regional transportation in Japan. Case Stud. Transp. Policy 2017, 5, 549–559. [Google Scholar] [CrossRef]
- Li, Z. The impact of metro accessibility on residential property values: An empirical analysis. Res. Transp. Econ. 2018, 70, 52–56. [Google Scholar] [CrossRef]
- Mohring, H. Optimalization and scale economies in urban bus transportation. Am. Econ. Rev. 1972, 62, 592–604. [Google Scholar]
- Jansson, J.O.; Holmgren, J.; Ljungberg, A. Pricing public transport services. 2015. Cheltenham, UK. In Handbook of Research Methods and Applications in Transport Economies and Policy; Book Series: Handbooks of Research Methods and Applications; Linköping University Post Print, Edward Elgar Publishing: Cheltenham, UK, 2015. [Google Scholar]
- Stachova, K.; Stacho, Z.; Blstakova, J.; Hlatka, M.; Kapustina, L.M. Motivation of Employees for Creativity as a Form of Support to Management Innovation Processes in Transportation-Logistics Companies. Nase More 2018, 65, 180–186. [Google Scholar] [CrossRef]
- Kampf, R.; Lorincova, S.; Hitka, M.; Stopka, O. Generational Differences in the Perception of Corporate Culture in European Transport Enterpises. Sustainability 2017, 9, 1561. [Google Scholar] [CrossRef]
- Kucharcikova, A.; Miciak, M.; Hitka, M. Evaluating the Effectiveness of Investment in Human Capital in E-business Enterprise in the Context of Sustainability. Sustainability 2018, 10, 3211. [Google Scholar] [CrossRef]
- Lorincova, S.; Hitka, M.; Starchon, P.; Stachova, K. Strategic Instrument for Sustainability of Human Resource Management in Small and Medium-Sized Enterprises Using Management Data. Sustainability 2018, 10, 3687. [Google Scholar] [CrossRef]
- Kucharcikova, A.; Miciak, M. Human Capital Management in Transport Enterprises with the Acceptance of Sustaina; 18th International Scientific Conference—LOGI 2017; Book Series: MATEC Web of Conference; Stopka, O., Ed.; EDP Sciences: London, UK, 2017; Volume 134. [Google Scholar] [CrossRef]
- Potkany, M.; Krajcirova, L.; Hitka, M.; Lorincova, S. Innovations of the Calculation Methodology According to Modified Dimensional Requirements for Selected Production. Mark. Manag. Innov. 2017, 4, 315–323. [Google Scholar] [CrossRef]
- Potkany, M.; Hitka, M.; Lorincova, S.; Krajcirova, L.; Stachon, P. Use of Variators in Applying the Cost Calculation Methodology in Small and Medium Furniture Enterprises Based on Changes in Human Body Dimension. Drv. Ind. 2019, 70, 27–35. [Google Scholar] [CrossRef]
- Wagner, J. Měření Výkonnosti; Grada ePublishing: Praha, Czech Republic, 2009; ISBN 978-80-247-2924-4. [Google Scholar]
- Fontes, M.; Sousa, C. The entry strategies of research-based firms in the transition to a sustainable energy system. Int. J. Technoentrep. 2017, 3, 310–329. [Google Scholar] [CrossRef]
- Shad, M.K.; Lai, F.W.; Fatt, C.L.; Klemes, J.J.; Bokhari, A. Integrating sustainability reporting into enterprise risk management and its relationship with business performance: A conceptual framework. J. Clean. Prod. 2018, 208, 415–425. [Google Scholar] [CrossRef]
- Levdokymov, V.V.; Valinkevich, N.V.; Zavalii, T.O. Evolution of basic value-based management concepts. Financ. Credit Act. 2018, 3, 384–393. [Google Scholar] [CrossRef]
- McKinnon, A. Performance measurement in freight transport: Its contribution to the design, implementation and monitoring of public policy, OECD, Prepared for the Roundtable on Logistics Development Strategies and their Performance Measurements (9–10 March 2015 Queretar) 2015. Available online: https://www.itf-oecd.org/sites/default/files/docs/mckinnon.pdf (accessed on 10 September 2019).
- Ionescu, R.V.; Zlati, M.L.; Antohi, V.M.; Stanciu, S. Reduced Inequalities as Factor of Sustainable Development: The Analysis Under Econometric Models. Sustainability 2018, 10, 3523. [Google Scholar] [CrossRef]
- Sroufe, R.; Gopalakrishna-Remani, V. Management, Social Sustainability, Reputation, and Financial Performance Relationships: An Empirical Examination of US Firms. Organ. Environ. 2019, 32, 331–362. [Google Scholar] [CrossRef]
- Amrina, E.; Yusof, M.S. Interpretive Structural Model of Key Performance Indicators for Sustainable Manufacturing Evaluation in Automotive Companies. In Proceedings of the IEEE International Conference on Industrial Engineering and Engineering Management, Hong Kong, China, 10–13 December 2012. [Google Scholar]
- Kiessling, T.; Isaksson, L.; Yasar, B. Market orientation and CSR: Performance implications. J. Bus. Ethics 2015, 137, 269–284. [Google Scholar] [CrossRef]
- Flammer, C. Does corporate social responsibility lead to superior financial performance? A regression discontinuity approach. Manag. Sci. 2015, 61, 2549–2568. [Google Scholar] [CrossRef]
- Holmgren, J. The effects of using different output measures in efficiency analysis of public transport operations. Res. Transp. Bus. Manag. 2018, 28, 12–22. [Google Scholar] [CrossRef]
- Taneja, S.S.; Taneja, P.K.; Gupta, R.K. Researches in corporate social responsibility: A review of shifting focus, paradigms, and methodologies. J. Bus. Ethics 2011, 101, 343–364. [Google Scholar] [CrossRef]
- Melo, T.; Garrido-Morgado, A. Corporate reputation: A combination of social responsibility and industry. Corp. Soc. Responsib. Environ. Manag. 2012, 19, 11–31. [Google Scholar] [CrossRef]
- Valente, A.; Atkinson, D. Sustainability in business: How ESG can protect and improve financial performance, Economic and Social Development. In Proceedings of the 40th International Scientific conference on Economic and Social Development, Buenos Aires, Argentina, 10–11 May 2019; pp. 234–245. [Google Scholar]
- Davidsson, P.; Hajinasa, B.; Holmgren, J.; Jevinger, A.; Persson, J.A. The Fourth Wave of Digitalization and Public Transport: Opportunities and Challenges. Sustainability 2016, 8, 1248. [Google Scholar] [CrossRef]
- Yes, L.S.; Istrate, C. Corporate tax-mix and firm performance. A comprehensive assessment for Romanian listed companies. Econ. Res. Ekon. Istraž. 2018, 31, 1258–1272. [Google Scholar] [CrossRef]
- Zhu, W.Q.; Yang, X.G.; Ge, H.W.; Xie, B.L. Cost-efficiency of buses using stochastic frontier analysis. In Proceedings of the Institution of Civil Engineers-Transport; Thomas Telford Ltd.: London, UK, 2017; Volume 170, pp. 185–193. [Google Scholar]
- Llorca, M.; Banos, J.; Somoza, J.; Arbues, P. A Stochastic Frontier Analysis Approach for Estimating Energy Demand and Efficiency in the Transport Sector of Latin America and Caribbean. Energy J. 2017, 38, 153–174. [Google Scholar] [CrossRef]
- Saeedi, H.; Behdani, B.; Wiegmans, B.; Zuidwijk, R. Assessing the Technical Efficiency of Intermodal Freight Transport Chains Using a Modified Network DEA Approach. Transp. Res. Part E 2019, 126, 66–86. [Google Scholar] [CrossRef]
- Jarboui, S.; Forget, P.; Boujelbene, Y. Transport firm’s inefficiency and managerial optimism: A stochastic frontier analysis. J. Behav. Exp. Financ. 2014, 3, 41–51. [Google Scholar] [CrossRef]
- Kral, P.; Rohcaova, V. Measuring the Efficiency of Public Road Transport Companies in the Slovak Republic Using DEA and SFC. Statistika 2013, 93, 76–85. [Google Scholar]
- Almasheki, E.S.; Shah, M.Z. Technical Efficiency Analysis of Container Terminals in the Middle Eastern Region. Asian J. Shipp. Logist. 2015, 31, 477–486. [Google Scholar] [CrossRef] [Green Version]
- Kucharčíková, A.; Mičiak, M. Human Capital Management in transport Enterprises with the Acceptance of Sustainable Developement in the Sloval Republic. Sustainability 2018, 10, 2530. [Google Scholar] [CrossRef]
- Malichová, E.; Ďurišová, M.; Tokarčíková, E. Model of application economic value added in automotive company. Transp. Probl. 2017, 12, 93–102. [Google Scholar]
- Brigham, F.E.; Ehrhardt, C.M. Financial Management: Theory & Practice, 14th ed.; SouthWestern: Mason, OH, USA, 2014; p. 1163. ISBN 978-1-111-97220-2. [Google Scholar]
- Medvecka, I.; Binasova, V.; Kubinec, L. Planning and performance evaluation of the manufacturing organizations. Procedia Eng. 2017, 192, 46–51. [Google Scholar] [CrossRef]
- Potkany, M.; Hitka, M.; Krajčírová, L. Life cycle cost calculation at the transport company in the supply of production of wooden houses—Case study. In Proceedings of the 18th International Scientific Conference, Ceske Budejovice, Czech Republic, 19 October 2017. [Google Scholar]
- Malichová, E.; Durisova, M.; Kucharcikova, A. The influence of selected tools of economic policy on managerial decision making on investment. In Proceedings of the 27th IBIMA 2018: Innovation Management and Education Excellence through Vision 2020, Milan, Italy, 4 May 2016; pp. 3752–3762. [Google Scholar]


| Item | U of M | 2015 | 2016 | 2017 | 2018 |
|---|---|---|---|---|---|
| NOPAT | € | 1,679,749 | 2,221,510 | 3,073,260 | 2,341,340 |
| WACC | coef. | 0.0775 | 0.0237 | 0.0179 | 0.0721 |
| C | € | 13,933,653 | 17,602,729 | 20,158,427 | 18,846,348 |
| EVA | € | 599,890.89 | 1,804,325.32 | 2,712,424.16 | 982,518.31 |
| Item | Uof M | 2015 | 2016 | 2017 | 2018 |
|---|---|---|---|---|---|
| Gross intangible assets | € | 1,005,632 | 19,018 | 15,069 | 17,394 |
| Gross tangible assets | € | 31,763,372 | 32,033,771 | 32,098,272 | 30,412,891 |
| Lands | € | 1,942,589 | 1,944,161 | 1,944,161 | 1,944,161 |
| Gross depreciated assets | € | 32,769,004 | 32,052,789 | 32,113,341 | 30,430,285 |
| Item | UofM | 2015 | 2016 | 2017 | 2018 |
|---|---|---|---|---|---|
| Gross depreciated assets | € | 32,769,004 | 32,052,789 | 32,113,341 | 30,430,285 |
| Annual depreciations | € | 887,703 | 915,683 | 934,856 | 963,590 |
| Asset life span | year | 37 | 35 | 34 | 32 |
| Item | UofM | 2015 | 2016 | 2017 | 2018 |
|---|---|---|---|---|---|
| GDP Deflator | index | - | 109.983 | 110.102 | 111.482 |
| coef. | - | 1.100 | 1.101 | 1.115 | |
| Coefficient for conversion | coef. | 1.13 | 1.24 | 1.37 | 1.58 |
| Adjusted depreciated assets | € | 32,769,004 | 32,052,789 | 32,113,341 | 30,430,285 |
| Depreciated assets at current prices | € | 37,028,974 | 39,745,458 | 43,995,277 | 48,079,850 |
| Item | UofM | 2015 | 2016 | 2017 | 2018 |
|---|---|---|---|---|---|
| LTFA | € | 3070 | 3070 | 3070 | 18 |
| Short-term FA | € | 206,116 | 596,538 | 528,623 | 580,410 |
| Receivables | € | 9,044,516 | 8,760,732 | 8,295,091 | 7,978,387 |
| Time separation of assets | € | 28,062 | 15,112 | 10,839 | 10,314 |
| Monetary assets | € | 9,281,764 | 9,375,452 | 8,837,623 | 8,569,129 |
| Reserves | € | 401,666 | 337,927 | 463,725 | 219,227 |
| Long-term non-interest-bearing liabilities | € | 14,423 | 11,575 | 95,355 | 85,283 |
| Short-term non-interest-bearing liabilities | € | 11,102,195 | 5,548,755 | 2,626,208 | 2,161,656 |
| Time separation of liabilities | € | 0 | 0 | 0 | 0 |
| Non-interest-bearing liabilities | € | 11,518,284 | 5,560,330 | 3,185,288 | 2,466,166 |
| Net monetary assets | € | −2,236,520 | 3,815,122 | 5,652,335 | 6,102,963 |
| Inventories at current prices | € | 6,057,464 | 4,534,692 | 4,827,473 | 4,405,075 |
| Lands | € | 1,942,589 | 1,944,161 | 1,944,161 | 1,944,161 |
| Not depreciated assets at current prices | € | 5,763,533 | 10,293,975 | 12,423,969 | 12,452,199 |
| Item | UofM | 2015 | 2016 | 2017 | 2018 |
|---|---|---|---|---|---|
| Depreciated assets at current prices | € | 37,028,974 | 39,745,458 | 43,995,277 | 48,079,850 |
| Not-depreciated assets at current prices | € | 5,763,533 | 10,293,975 | 12,423,969 | 12,452,199 |
| Value of investment | € | 42,792,507 | 50,039,433 | 56,379,246 | 60,532,049 |
| Item | UofM | 2015 | 2016 | 2017 | 2018 |
|---|---|---|---|---|---|
| Final sum from ordinary activity after tax | € | 1,919,553 | 2,605,555 | 2,996,559 | 2,233,364 |
| Profit from sales of LTA and material * (1-t) | € | 16,370 | 9,491 | 26,837 | 31,967 |
| Interest expense | € | 27,779 | 43,264 | 59,128 | 58,164 |
| Depreciations | € | 887,703 | 915,683 | 934,856 | 963,590 |
| Gross cash flow | € | 2,851,405 | 3,573,993 | 4,017,380 | 3,287,085 |
| Item | U of M | 2015 | 2016 | 2017 | 2018 |
|---|---|---|---|---|---|
| Value of investment | € | 42,792,507 | 50,039,433 | 56,379,246 | 60,532,049 |
| Gross cash flow | € | 2,851,405 | 3,573,993 | 4,017,380 | 3,287,085 |
| Not-depreciated assets | € | 5,763,533 | 10,293,975 | 12,423,969 | 12,452,199 |
| Life span of assets | year | 37 | 35 | 34 | 32 |
| CFROI | coef. | 0.0587 | 0.0592 | 0.0584 | 0.0450 |
| CFROI in % | % | 5.87 | 5.92 | 5.84 | 4.50 |
| Item | UofM | 2015 | 2016 | 2017 | 2018 |
|---|---|---|---|---|---|
| Tangible assets | € | 9,354,816 | 8,770,659 | 8,270,532 | 7,791,875 |
| Intangible assets | € | 5042 | 3 810 | 2578 | 3898 |
| Long-term fin. assets | € | 3070 | 3070 | 3070 | 18 |
| Long-term asset | € | 9,362,928 | 8,777,539 | 8,276,180 | 7,795,791 |
| Own resources | € | 13,180,802 | 15,786,356 | 16,752,918 | 16,303,811 |
| Long-term foreign capital | € | 14,423 | 1,011,575 | 2,095,355 | 2,085,283 |
| Constant assets | € | 9,362,928 | 8,777,539 | 8,276,180 | 7,795,791 |
| Net working capital | € | 3,832,297 | 8,002,392 | 10,572,093 | 10,593,303 |
| NA | € | 13,195,225 | 16,779,931 | 18,848,273 | 18,389,094 |
| NOPAT | € | 1,679,749 | 2,221,510 | 3,073,260 | 2,341,340 |
| NA | € | 13,195,225 | 16,779,931 | 18,848,273 | 18,389,094 |
| RONA | coef. | 0.1273 | 0.1324 | 0.1631 | 0.1273 |
| RONA | % | 12.73 | 13.24 | 16.31 | 12.73 |
| Item | UofM | 2015 | 2016 | 2017 | 2018 |
|---|---|---|---|---|---|
| NOPAT | € | 1,679,749 | 2,221,510 | 3,073,260 | 2,341,340 |
| Depreciations | € | 887,703 | 915,683 | 934,856 | 963,590 |
| OATCF | € | 2,567,452 | 3,137,193 | 4,008,116 | 3,304,930 |
| Long-term assets at current acquisition prices | € | 34,740,663 | 34,000,020 | 34,060,572 | 32,374,446 |
| Short-term, receivables | € | 8,658,516 | 8,610,732 | 8,295,091 | 7,978,387 |
| Stock | € | 6,057,464 | 4,534,692 | 4,827,473 | 4,405,075 |
| Short-term financial assets | € | 206,116 | 596,538 | 528,623 | 580,410 |
| Short-term liabilities | € | 11,102,195 | 5,548,755 | 2,626,208 | 2,161,656 |
| Common bank loans | € | 0 | 0 | 0 | 0 |
| Working capital | € | 3,819,901 | 8,193,207 | 11,024,979 | 10,802,216 |
| GA | € | 38,560,564 | 43,193,227 | 45,085,551 | 43,176,662 |
| CROGA | coef. | 0.0666 | 0.0726 | 0.0889 | 0.0765 |
| CROGA | % | 6.66 | 7.26 | 8.89 | 7.65 |
| Item | UofM | 2015 | 2016 | 2017 | 2018 |
|---|---|---|---|---|---|
| CROGA | coef. | 0.0666 | 0.0726 | 0.0889 | 0.0765 |
| WACC | coef. | 0.0775 | 0.0237 | 0.0179 | 0.0721 |
| CROGA spread | coef. | −0.0109 | 0.0489 | 0.0710 | 0.0044 |
| CROGA spread | % | −1.09 | 4.89 | 7.10 | 0.44 |
| Item | 2015 | 2016 | 2017 | 2018 | |
|---|---|---|---|---|---|
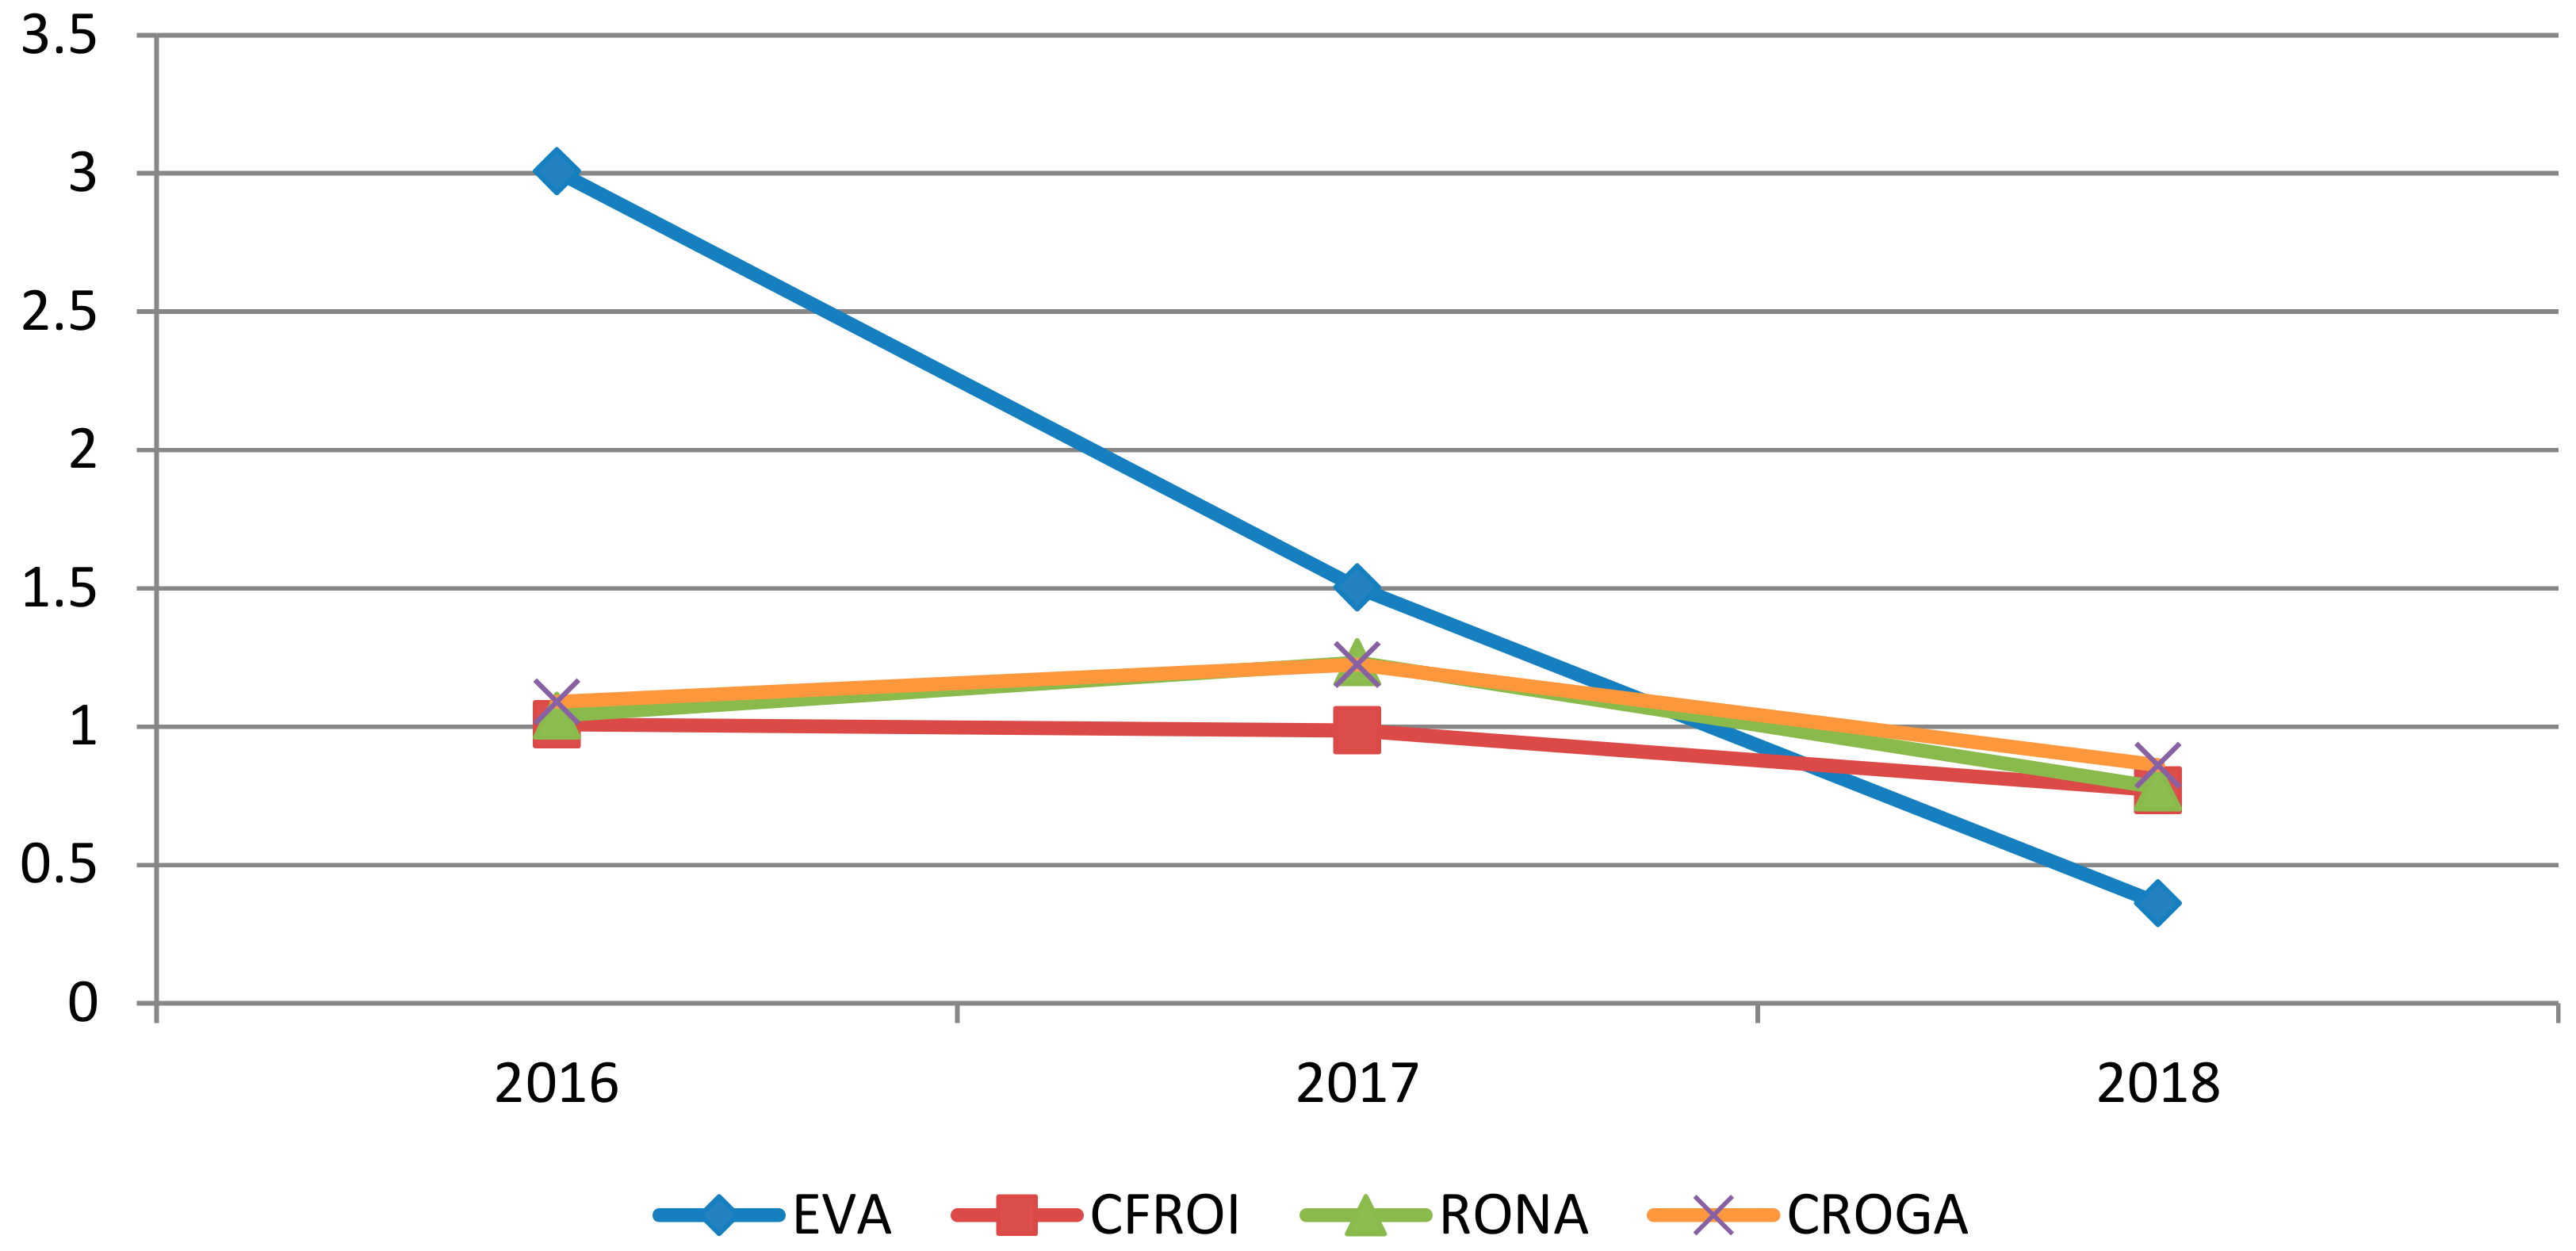
| EVA | € | 599,890.89 | 1,804,325.32 | 2,712,424.16 | 982,518.31 |
| Index of change | coef. | - | 3.0078 | 1.5032 | 0.3622 |
| Percentage of change | % | - | +200.78 | +50.32 | −60.78 |
| Difference | € | - | +1,204,43.43 | +908,098.84 | −1,729,905.85 |
| CFROI | coef. | 0.0587 | 0.0592 | 0.0584 | 0.0450 |
| Index of change | coef. | - | 1.0085 | 0.9865 | 0.6505 |
| Percentage of change | % | - | 0.85 | −1.35 | −22.95 |
| Difference | coef. | - | +0.005 | −0.0008 | −0.0134 |
| RONA | coef. | 0.1273 | 0.1324 | 0.1631 | 0.1273 |
| Index of change | coef. | - | 1.0401 | 1.2319 | 0.7810 |
| Percentage of change | % | - | +4.01 | +23.19 | −21.90 |
| Difference | coef. | - | +0.0051 | +0.0307 | −0.0357 |
| CROGA | coef. | 0.0666 | 0.0726 | 0.0889 | 0.0765 |
| Index of change | coef. | - | 1.0901 | 1.2245 | 0.8605 |
| Percentage of change | % | - | +9.01 | +22.45 | −13.95 |
| Difference | coef. | - | +0.0060 | +0.0163 | −0.0124 |
© 2019 by the authors. Licensee MDPI, Basel, Switzerland. This article is an open access article distributed under the terms and conditions of the Creative Commons Attribution (CC BY) license (http://creativecommons.org/licenses/by/4.0/).
Share and Cite
Ďurišová, M.; Tokarčíková, E.; Virlanuta, F.O.; Chodasová, Z. The Corporate Performance Measurement and Its Importance for the Pricing in a Transport Enterprise. Sustainability 2019, 11, 6164. https://0-doi-org.brum.beds.ac.uk/10.3390/su11216164
Ďurišová M, Tokarčíková E, Virlanuta FO, Chodasová Z. The Corporate Performance Measurement and Its Importance for the Pricing in a Transport Enterprise. Sustainability. 2019; 11(21):6164. https://0-doi-org.brum.beds.ac.uk/10.3390/su11216164
Chicago/Turabian StyleĎurišová, Mária, Emese Tokarčíková, Florina Oana Virlanuta, and Zuzana Chodasová. 2019. "The Corporate Performance Measurement and Its Importance for the Pricing in a Transport Enterprise" Sustainability 11, no. 21: 6164. https://0-doi-org.brum.beds.ac.uk/10.3390/su11216164