Article

Management and Perception of Metropolitan Natura 2000 Sites: A Case Study of La Mandria Park (Turin, Italy)

by
Luca Battisti
1,*,
Filippo Corsini
2,
Natalia Marzia Gusmerotti
2 and
Federica Larcher
1
1
Department of Agricultural, Forest and Food Sciences, University of Turin, 10095 Grugliasco (TO), Italy
2
Sant’Anna School of Advanced Studies—Institute of Management, 56127 Pisa (PI), Italy
*
Author to whom correspondence should be addressed.
Sustainability 2019, 11(21), 6169; https://0-doi-org.brum.beds.ac.uk/10.3390/su11216169
Submission received: 4 October 2019 / Revised: 28 October 2019 / Accepted: 1 November 2019 / Published: 5 November 2019

Abstract

:
The European Commission promotes management practices for nature conservation and human well-being, requiring the involvement of users in Natura 2000 sites. The research aim was to investigate the user’s aesthetic perception in relation to the adoption of different management measures, within an Italian metropolitan Natura 2000 site. The research was performed in La Mandria Park in 2018 (1780 ha). The method was based on a participatory approach (interviews, questionnaires and participatory mapping), involving both park managers and users. Four main landscape elements were identified: lawns, woodlands, lines of trees and water bodies. Questionnaires (N = 232) were analyzed by descriptive and regression analysis. Mapped preferred places were analyzed using ecological indexes on 500 m land use buffers. A gendered perception of the aesthetic quality was detected, demonstrating that women are more strictly connected to nature than men. Users involved in park activities better perceived the aesthetic quality, while regular visitors had a worst perception. From participatory mapping (N = 137), it emerges that the eight preferred places are characterized by a mixed land use with different maintenance regimes and ecological values. Users’ perceptions should be integrated in a co-management plan in metropolitan Natura 2000 sites, combining nature conservation with user enjoyment.

1. Introduction

Natura 2000 sites are networks of protected sites for rare and threatened species, stretched across 28 countries in Europe [1]. There are 27,758 Natura 2000 sites covering 18% of the EU territory [2]. Some of these sites are located in urban areas, where the human–nature interaction is more present and where attention to management issues must be specific [3].
The ‘Natura 2000 and Forest’ technical report [4] encourages “forest protection and enhancement of ecosystem services”, arguing that Member States “should achieve a significant and measurable improvement in the conservation status of forest species and habitats by fully implementing EU nature legislation and ensuring that national forest plans contribute to the adequate management of the Natura 2000 network by 2020”.
In 2018, the EU Commission focuses on Article 6 (92/43/EEC), indicating the importance of management plans in Natura 2000 sites, with the involvement of stakeholders [5]. This participatory approach to decision making in Natura 2000 sites is essential [6], with the aim of conserving habitat biodiversity and ensuring proper local economic development [7]. It should take into account the knowledge and the needs of users of Natura 2000 sites [8,9], integrating social and ecological aspects in the management plans [10]. In this regard, the Guidelines on Wilderness in Natura 2000 [11] highlight the need to re-build relationships with people who live, work or visit the sites with specific and differentiated communication strategies in order to increase public awareness of nature conservation [12,13]. It was noted that people have difficulty in understanding the Natura 2000 network [14], even though a greater awareness and a more positive attitude are accompanied by a higher level of education [3].
There is the need to investigate people’s perception over time, to study the potential effects of educational programs and changes in attitudes [14]. These issues related to aesthetic, perceptual, educational and recreational values are part of cultural ecosystem services and are of great importance in Natura 2000 sites [15,16]. Cultural ecosystem services are also considered central to human well-being and important for environmental decision making [17]. A range of landscape characteristics have been associated with, and influence at different scales of perception, the values of cultural ecosystem services [18]. On the other hand, managers have to understand how people perceive different management practices that would affect the environment and human well-being, in order to avoid controversy [19].
In this context, the aim of the research was to investigate the users’ aesthetic perception (cultural ecosystem services) in relation to the adoption of different management measures, related to different land use categories, within a metropolitan Natura 2000 site. The research was performed in 2018 on La Mandria Park (Site code: IT1110079), a Natura 2000 site located in the Turin metropolitan area, in Italy. The method was based on a participatory approach (interviews, questionnaires and participatory mapping), involving both park managers and users. Results can be used to set up a long-term co-management plan [20] combining nature conservation with user enjoyment.

2. Materials and Methods

2.1. Study Area

The metropolitan city of Turin in Piedmont (Italy), comprises 2,269,120 inhabitants, with an area of 682,691 ha, comprising 19.8% green areas—4.5% of which are protected natural areas [21]. La Mandria Park is a regional protected area since 1978, located between the Stura di Lanzo stream, the Ceronda stream and the northern part of the Turin urbanized area (Figure 1).
La Mandria Park is characterized by a buffer area (6557 ha) and a core area (3125 ha). The core area is surrounded by approximately 30 km of walls and is partly privately owned and partly publicly (Piedmont Region) owned. The study area (1780 ha) is the public area within the core area.
La Mandria Park has gently undulated surfaces varying between 250 and 420 m asl, with more clayey soils in the higher-lying areas and sandy soils in the lower-lying areas, derived from alluvial deposits, dating back to the Mindel and Riss glaciations [22]. The mean annual rainfall is 938 mm and the mean annual temperature is 14.8 °C (data from Turin weather station, 238 m asl and Caselle weather station 301 m asl). The La Mandria Park is a Special Area of Conservation (SAC) and part of the Natura 2000 network, preserving the most significant example of lowland forest in Piedmont. The protected regional area also hosts two United Nations Educational, Scientific and Cultural Organization (UNESCO) World Heritage Sites (1997), which are part of the Residences of the Royal House of Savoy (called ‘Corona di Delizie’) in and around Turin: Reggia di Venaria Reale and Borgo Castello.
The study area (Figure 2a) is composed of a mosaic of wooded (65%) and open patches (35%).
The wooded patches are characterized by an oak-hornbeam forest of Carpinion betuli and Quercus robur on sandy plains, while the open patches are characterized by pastures and sparsely wooded grasslands. The composition of trees in the study area is varied, but the most common species are Quercus robur L., Carpinus betulus L., Fraxinus excelsior L., Prunus avium L. and Alnus glutinosa (L.) Gaertn [23].
Water bodies are important elements of the landscape, even though they represent only 1.18% of the study area. There are streams, canals and five artificial lakes used for fishing and as water reservoirs [24]. It is possible to access the park through 6 entrances located in different municipalities, visit the castle and see the Church of San Giuliano and 15 farmsteads that characterized in the past (and still today) the life within the area.
For management purposes, the park is divided into four areas, based on the level of protection identified for each zone (Figure 2b): zone A— strict nature reserve (strict protection of ecosystems, almost without allowing the presence of humans, in order to safeguard flora and fauna); zone B—permit-only access reserve (access is permitted only for carrying out agricultural activities that characterize the landscape); zone C— controlled reserve (areas with tourist facilities and for recreational use); zone U—urbanized area (buildings or structures generally of historical and cultural value).
La Mandria Park offers different services and possibilities for leisure and educational activities. The routes open to the public are nearly 40 km in length, for hiking, walking, running and also traveled by a touristic train. It is possible to access the park throughout the year, from 08:00 to 20:00 during the summer period, and from 08:00 to 17:00 during the winter period. However, it is possible to stay in touch with nature even at night, through guided tours, especially to listen to the roaring of the deer, one of the symbols of the park. Special huts for sighting are available for naturalist photographers. However, the number of users per year is not registered.

2.2. Study Design and Data Analysis

In order to achieve the research aims, the study area was analyzed through field visits. During these inspections, four main landscape elements were identified: lawns, woodlands, lines of trees and water bodies. The four landscape elements were used to gather information from park managers and users. The main phases, methods and attended results are reported in Table 1.

2.2.1. Interviews of Park Managers

In order to understand the management activities pursued and the activities that will be carried out in the future, semi-structured interviews of the park managers were performed in March 2018, using the criteria for urban forest sustainability identified by Clark et.al., [25] as a starting point for the discussion. The questions mainly concerned aspects of the management and maintenance of the Park, the application of the European directives on Natura 2000 sites and the management of tourist flows. The first part was aimed at understanding the main management activities carried out in the park, related to the four main landscape elements (lawns, woodlands, lines of trees and water bodies). Then, the critical points and suggested proposals for management practice improvement were discussed. The results of this phase were used to develop the questionnaire and analyze its results.

2.2.2. Questionnaires to Users

In order to investigate the value of aesthetic perceptions and the habits and mode of park users, a self-completion questionnaire was prepared. The questionnaire consisted of the following sections:
  • general information about the respondents (age, gender, education and proximity to the park);
  • the aesthetic quality perception of respondents with regards to lawn, woodland, waterbodies and routes. The questions were formulated on a 5-point Likert scale;
  • the general knowledge of the respondents of the park. In such sections, the questions were formulated using a yes/no option;
  • the frequency of visits and involvement in park activities. In such sections, the questions were formulated using both yes/no options and a 5-point Likert scale.
Even though the questionnaire consisted of several other sections and questions, only those presented above were employed in the analysis.
Nederhof [26] suggests guaranteeing anonymity for the respondents in order to reduce social desirability bias. Indeed, in the field of social science, such a bias represents a type of response bias where respondents provide an answer to a question in a manner that will be viewed favorably by others. For such reasons, the questionnaire was administered in anonymous form.
The questionnaire was subjected to a pre-test phase (30 completed questionnaires) to verify the layout, content and wording of the questions. During the survey, respondents were informed about the objectives of this study and the time required to complete the questionnaire (approximately10 min). Table 2 presents the main questions, options and related variables used.
The questionnaire was submitted from April to November 2018 in 9 places (five entrances; three farmsteads and the complex of Borgo Castello—Figure 2b) located along the main routes in order to reach the highest number of respondents. A total number of 232 completed questionnaires were collected. This sample is comparable to that used by other similar research in Natura 2000 sites [16,27]. Some descriptive statistics about the respondents are presented in Table 3.
Aesthetic quality perception was then measured adapting the items (questions) used by Dimitrakopoulos et al. and Vodouhê et al. [16,27]. In detail, four items (questions) were developed to measure such quality perception, and respondents graded their opinion on using a 5-point Likert scale (ranging from “great quality” to “bad quality”). Answers were statistically analyzed. Items were merged into a single factor by first checking the internal consistency using Cronbach’s Alpha, which equaled 0.78. In most social science studies, a reliability coefficient greater than 0.70 is considered acceptable. Then, the analysis of the determinants of quality perception was conducted by a multinomial logistic regression analysis, more in detail, due to the categorical nature of the variables we decided to perform an ordinal logistic regression. Such a method allows analyzing the relation between a dependent variable and several independent variables, indicating whether the independent variables have a significant relationship with a dependent variable and the relative strength. In our investigation, the measure of quality perception was used as a dependent variable. On the other hand, the remaining variables assessed in the questionnaire were used as independent variables. As Peterson and Harrell [28] suggest, the main assumption of the regression model is represented by the fact that the cumulative odds ratio for any two values of the covariates is unchanging across response categories. The likelihood ratio test to assess such an assumption was used showing no main concerns. Moreover, the presence of multicollinearity was checked by calculating the tolerance and variance inflationary factors (VIFs) for all variables; no problems were underlined. Finally, the presence of common method variance also was assessed by conducting Harman’s single-factor test and the results indicate that common method variance does not occur.

2.2.3. Participatory Mapping

The third phase was participatory mapping [29,30], which allowed users to indicate their preferred area with a pencil on a map.
Participatory mapping involved 137 respondents. This information was used to understand which places are more visited and appreciated in order to set up priorities in future management practices, considering these anthropogenic pressures and expectations. The answers obtained were related to eight specific points of the park such as areas of historical and cultural interest or areas equipped for stopover. From these points, a 500 m buffer was created to analyze the land use around the preferred points [18]. QGIS software (version 2.18.1) (Open Source Geospatial Foundation, Beaverton, Oregon, USA) was used for mapping elaborations.
In order to study the relationship between landscape diversity and users’ aesthetic preferences, the buffer zones were ranked along a gradient of landscape diversity and evenness. To this end, the calculated indices are the number of patches, Shannon evenness index and Simpson’s index using LecoS, a specific plugin for QGIS [31,32]. Shannon evenness shows the distribution of the patches within the total area. It varies between 0, when the landscape contains only one patch (no diversity), and 1, when the distribution of each class surface is equitable. Simpson’s index defines the probability that two objects, selected at random, belong to different categories. It varies between 0 to 1 (when the diversity is higher). The indexes increase under situations where the number of land cover types increases, or/and the equitability of the distribution of land among the various cover types increases [33].
Results were qualitatively compared with user’s aesthetic preferences and adopted management regimes.

2.3. Ethics Statement

The park managers expressed their consent to the use of information for research purposes. The information acquired concerns only the management practices of the area, which is public information. No personal data were requested and acquired. Moreover, the questionnaires to users were self-completion questionnaires and did not require the presence of researchers. The questionnaires were freely available, and data were anonymously collected only for research purposes, as mentioned. No data on respondents’ health were collected and no contact between respondents and researchers occurred.

3. Results and Discussions

3.1. Interviews of Park Managers

Over time, the La Mandria Park has undergone deep transformations, especially in the XIX and XX Centuries. As highlighted by Laurora et al. [22], there have been significant changes in the territory due to agricultural practices, hunting and forestry activities. Nowadays, management is fundamental for landscape conservation and maintenance of the ecological characteristics. The main management operations carried out in the park, referred to as the four landscape elements, are summarized in Table 4.
The park does not have a management plan. The management of the lawns is almost entirely delegated to farmers. In the lawn areas (not irrigated), nearly 20,000 q/year of hay on approximately 320 ha are produced. Farmers have obligations under the management contract, such as ensuring the presence of buffer strips at the edges of the fields, so as to preserve biodiversity. Access to almost all of the lawns is prohibited, with the exception of specially marked areas equipped for rest and refreshment.
Woodland management concerns: trees present in wooded areas; lines of trees; monumental trees. Trees in wooded areas can be subjected to three main management practices: i) pruning, felling and removal of trees, if necessary; ii) the dead trees are left on the ground or some trees are managed as “totem trees” (standing dead tree), so as to provide habitat for protected species; iii) standing timber can be sold, especially invasive species, such as Quercus rubra L.
Regarding lines of trees, a visual level check is carried out and, if necessary, a Visual Tree Assessment (VTA) [34] is carried out, with any subsequent pruning. In this case, the trees are checked and the operations carried out are monitored. As far as the monumental trees are concerned, the main access avenue to the area (now closed to use for safety reasons) is one of the most valuable naturalistic sites of the park for the presence of 96 secular Quercus robur L.—one-third of which have diameters between 100 and 140 cm. These trees host a rich entomofauna, including the Osmoderma eremita (Directive 92/43/EEC), indicating a high species richness, as it is an umbrella species [35].
The management of woodlands and lines of trees must consider two fundamental aspects. First, the presence of Osmoderma eremita is associated with a category of high falling risk of trees and this entails a risk for the use of specific areas [36]. Second, the management of invasive species must be accurate, as a pedological study conducted in the park on low fertility well-developed soils shows how the presence of invasive species, such as Quercus rubra L., could change the ecosystem functionality by complicating the restoration of the original forests [37].
There is currently no protocol for pests and disease control, but targeted measures are taken to remove Quercus rubra L. and Prunus serotina Ehrh.
With regards to water body management, chemical–physical analyses have been carried out, not on a regular basis, in order to monitor their quality over time.

3.2. Questionnaires to Users

During the period April–November 2018, 232 questionnaires were collected.
The sample of respondents comes from different territories: 12% live in the municipalities bordering La Mandria Park, 54% from other municipalities of the Metropolitan City of Turin, 22% from Piedmont, 10% from other Italian regions and 2% from other countries (Switzerland, Germany and USA). The sample’s level of education is quite varied: 5% elementary school; 25% secondary school; 37% high school; 19% scientific university; 12% humanistic university. In total, 88% of the people know that La Mandria Park is a protected area. The frequency of visits to the park is divided as follows: 38% less than once a year; 23% up to 10 times a year; 40% more than 10 times a year. There are no differences between people who visit the park during public holidays or during the week; neither are there differences in the use of the park in the morning or in the afternoon. More than 60% of the sample are aware of the cultural activities proposed in the park, but only the 32% actively participate in them. The main reason seems to be related to hours of activity that are not in line with working hours. A lack of publicity of the events has been pointed out too.
By analyzing answers to the four questions referring to quality perception of the area, Table 5 reports the frequency (%) of the selection of the options based on a 5-point Likert scale, ranging from “great quality” to “bad quality”.
The four landscape elements are perceived as of good quality by the respondents. We can see a tendency to great quality especially with regard to lawns and routes, while there are higher percentages of selection of the categories of low and bad quality for woodlands and water bodies.
In total, 80% of users considered the lawns of good and great aesthetic quality, referencing good management operations and the presence of flowers and insects. Those who perceived low or bad quality, identified the presence of tall grass among the main reasons.
As for the woodlands, in total, 50% of respondents indicated that they are well maintained. However, the presence of dead wood was perceived as a negative element for the aesthetic quality. Nevertheless, the presence of birds and mammals is related to a great level of perception.
Furthermore, the perception of the routes, characterized by the presence of lines of trees, is in line with that of the lawns and the woodlands. Approximately 60% of respondents indicated that the routes are well maintained, and low or bad quality perception is mostly related to limits in accessibility.
As far as the water bodies are concerned, the perception of quality differs a little from the other three landscape elements. The respondents who had a medium–high quality perception (55%) indicated that the water bodies are well maintained and that the presence of fish and water birds is a positive value. Respondents with a sufficient, low or bad quality identified that the main reasons are linked to a low management level and to a difficulty in use, because not all water bodies are easily accessible or visible.
Using the same data, the mean aesthetic quality perceived by users is 3.92, thus expressing a good value.
In order to develop a model able to identify the determinants of aesthetic quality perception, a multinomial logistic regression was performed (Table 6).
Results highlight several interesting aspects. In particular, women have a slightly higher perception of quality, which is in line with other studies [38]. Several studies have demonstrated that women are more strictly connected to nature and its values [39], and therefore they perceived and experiment higher environmental pollution and natural resources depletion [40]. Women are more sensitive to ecological aspects in mobility [41]; use distinctively natural space [42]; have a very impressive view of natural ecosystems [43]; and are deeply touched by climate change dynamics [44]. This study’s findings on a gendered perception of esthetic quality of the protected area support conclusions developed by MacBride-Stewart and colleagues [45]. Therefore, they suggest women have a higher perception of cultural ecosystem services (i.e., give more value to and achieve more benefit from). Our study supports in a quantitative way that women’s perception of aesthetic value of a natural space is higher than that of men. Therefore, it could be assumed that they benefit more from the cultural ecosystem services provided by a given ecosystem. The other variables did not show significance in the regression (i.e., age, education, proximity to the park, environmental and park knowledge).
Moreover, the results outlined that being a regular visitor resulted in negative and statistically significant results as a predictor of quality perception. Thus, visiting the park only a few times results in a higher quality perception. Such a link has been marginally investigated by the current literature and the few studies on the topic are in contrast with our finding. For example, Chen et al. [46], analyzing the tourist satisfaction in visiting the Kinmen National Park (Taiwan), showed that there were no significant differences between quality perception and number of visits to the park. Similar results were found by Akama and Kieti [47] in analyzing tourist satisfaction and quality perception in Tsavo West National Park (Kenya).
Finally, users involved in the park activities have a slightly higher perception of the quality of the park. Relationships between aesthetic quality perception and users’ involvement in recreational activities seems to be largely unexplored. Nevertheless, a number of previous studies have argued that direct sensory experience can be a crucial way for determining environmental quality perception [48,49]. Other studies have measured a positive and significant effect between perceived aesthetic beauty and perceived community fulfillment [50]; between engagement in outdoor leisure and water quality [51]; and between recreational activities and pro-environmental behaviors [52].

3.3. Participatory Mapping

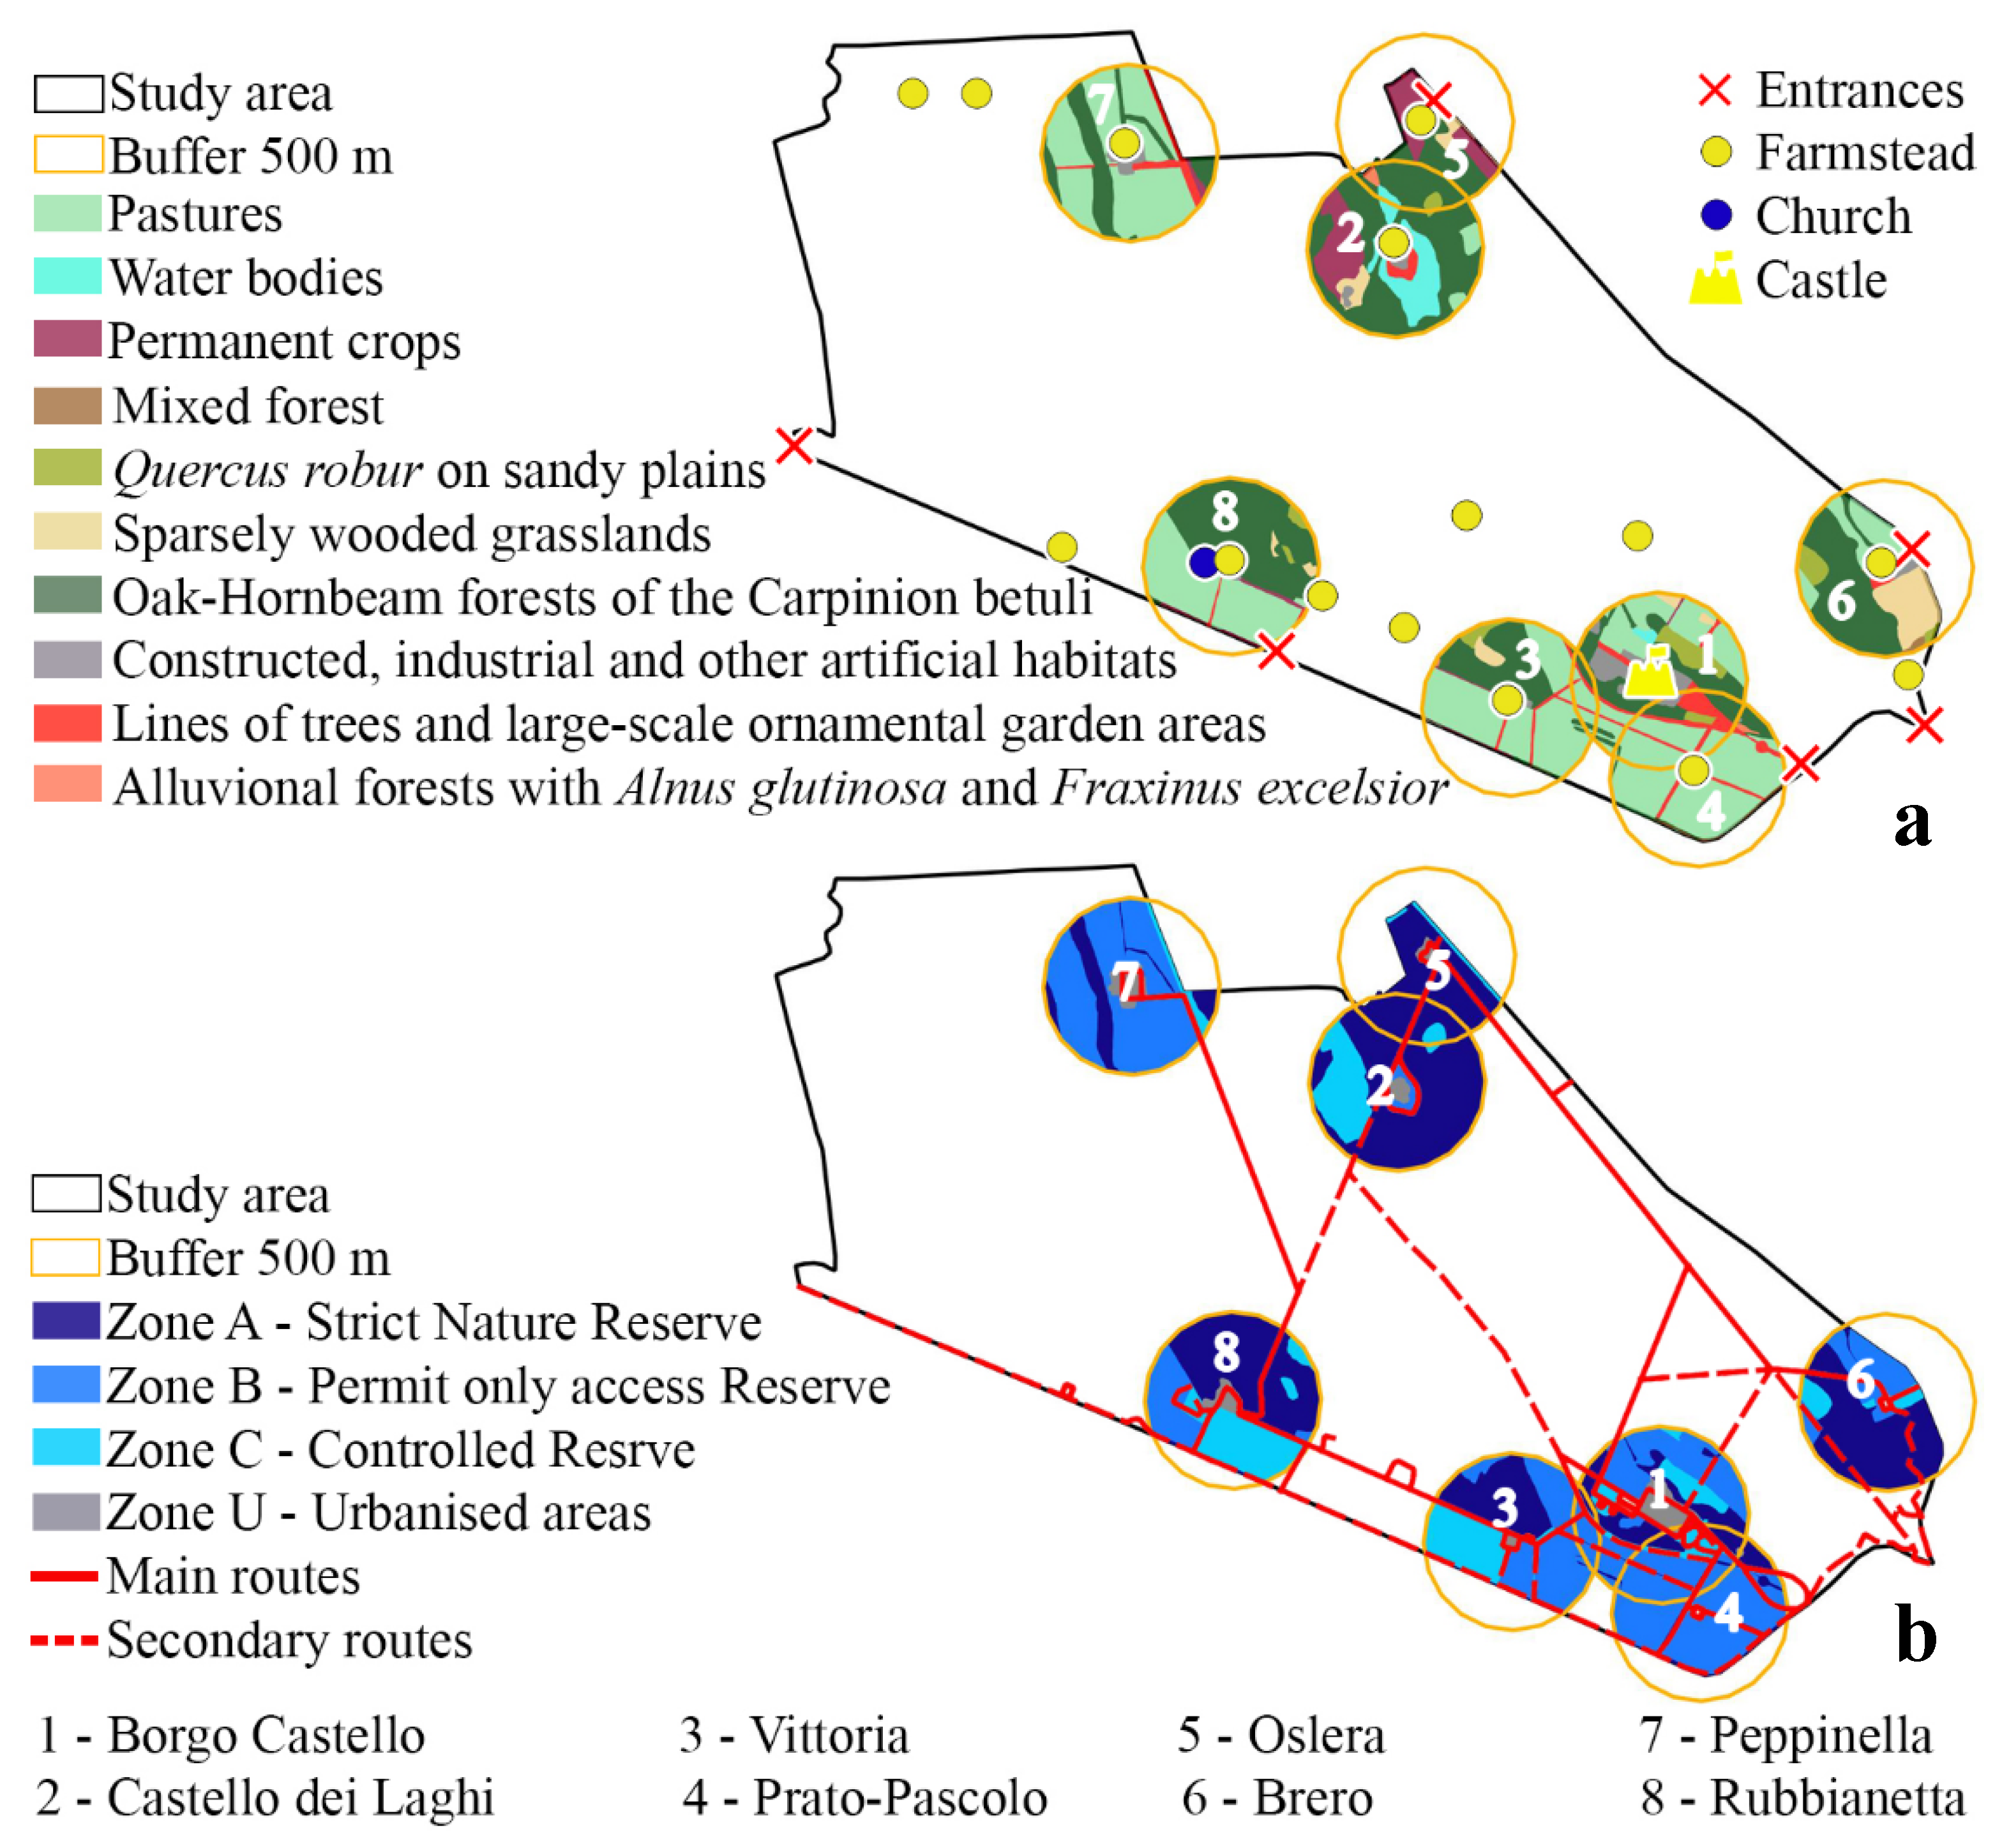
The participatory mapping phase involved 137 users, who selected their favorite places in La Mandria Park on a map. Each person could select more than one favorite place. Favorite places have been identified as points. Eight favorite places were chosen, with a total of 221 selections. Around each selected place, a 500 m buffer has been created to highlight what was present in the surrounding area.
The buffers were crossed with the land use map (Figure 3a) and with the map of the level of protection (Figure 3b). This procedure was useful for analyzing the main ecological characteristics of each buffer area.
For each buffer, the percentages of areas by zones, A, B, C, and U, are reported in Table 7. The percentages of areas affected by land cover categories, the number of patches, Shannon’s equitability index (DIV_EV) and Simpson’s diversity Index (DIV_SI) of patches have been calculated (Table 8), using LecoS.
Results show that four selected places are characterized by more than 50% of the surface in zone A. All the selected places are characterized by a percentage higher than 70% of zone A plus zone B. It can therefore be assumed that the different levels of protection, and therefore of management, of the La Mandria Park influence place preference. Specifically, it is possible to notice that respondents prefer points from which it is possible to observe low maintained areas where access requires a permit or is prohibited (zones A and B). This could also be due to the fact that there are some known beneficial physiological effects that occur when a man observes wilderness [53].
With the aim to understand whether the preference of a place was influenced by a higher or lower number of patches, and therefore whether the buffers were more or less heterogeneous in the composition of land cover categories, an ecological analysis was performed. It is possible to point out that the places preferred by the respondents are not characterized by having a similar total number of patches, nor by having in common similar numbers of patches covered by the same category (Table 8).
However, it is possible to highlight how the three land cover categories always present within the buffers are: oak-hornbeam forests of the Carpinion betuli; constructed, industrial or other artificial habitats, and lines of trees and large-scale ornamental garden areas. Moreover, the presence of pastures seems to characterize the spatial composition of the preferred places; in fact, the number of pasture patches is higher than the number of other land categories and they are present in seven buffers out of eight.
Analyzing the DIV_EV and the DIV_SI, it is possible to note that the DIV_EV values of the buffers are between 0.47 and 0.73, while the DIV_SI values are between 0.47 and 0.72. The mean values of DIV_EV and DIV_SI are, respectively, 0.63 and 0.68. These values are comparable to those of other Natura 2000 areas close to urban centers in Italy [54,55]. It is interesting to note that the general index of perceived esthetic quality (3.92—good) is substantially aligned to medium/medium–high ecological values.
The highest ecological values were found in the buffers Borgo Castello and Brero. These areas do not have strongly dominant classes and are characterized by richness in the composition of the environmental mosaic and a tendency toward the equidistribution of cover categories. A reverse trend was found in the Prato-Pascolo buffer, which has the lowest values of DIV_EV and DIV_SI.
This outcome is also supported by the questionnaire results, which show that environmental and park knowledge are non-significant variables. This is probably due to the fact that some services offered by the anthropic component, and not by the strictly environmental one, favor the choice of preferred places. It is possible, however, to highlight that even if the choice of the preferred places does not seem to be based exclusively on ecological characteristics, the buffers around the chosen points are characterized by open (mainly pastures) and wooded patches. This result is also found in the work by Hakim [56], in which it is reported that agroforestry landscapes provide man-made ecosystems that can enhance tourism.
This outcome is also interesting from an ecological point of view. From a study conducted on dung beetle within the park [57], it is possible to evince how the patchy ecosystems, made up of open and wooded patches and inhabited by several ungulate species, can support the highest levels of diversity.
The results could lead to the assumption that there are many factors that contribute to the choice of the preferred place within La Mandria Park: the possibility to observe places where management is reduced and where it is difficult to access; and the constant presence of farmsteads, castle, oak-hornbeam forest and lines of trees (Figure 3a).
It is important to note that through the participatory mapping phase, specific preferred points were selected by users. These points are assumed to be representative of a wider areas (500m buffer zones). Therefore, the choice of preferred places by users is associated with the benefit obtained from the provision of ecosystem services (especially cultural ones) in those places, although it is necessary to highlight how the links between well-being, historical/cultural values, ecosystem services and preferred places are complex [18].

4. Conclusions

The management of green areas requires a multi-stakeholder approach and must be addressed from a socio-ecological point of view, increasing human well-being conditions for future generations [58]. In particular, the integration and inclusion of different stakeholders (e.g., farmers and users) in the process of planning, managing and monitoring of agroforestry landscapes is a winning solution [59].
Moreover, knowledge of users’ perceptions can produce useful information that could be integrated into the decision-making process and lead to the resolution of conflicts between the users’ will and the park managers’ needs in order to positively improve the users’ attitude towards conservation measures [27]. However, within the limits of this study, it is possible to highlight that not all the results underlined by the questionnaire can be reflected in practical actions that can be used in a management plan. Nevertheless, an effective communication plan with users is essential to help them to be more aware and informed.
In order to be more effective, these processes should also consider a gendered perspective. In fact, our study shows that women’s perception of the aesthetic value of a natural space is higher than men’s perception. It would be interesting to analyze in further studies whether the perception of other cultural ecosystem services is also higher and whether ecosystem disservices are also more deeply perceived.
Users involved in the park activities better perceived aesthetic quality, while regular visitors had a worse perception. This evidence might be related to the aspects investigated as proxies of quality perception, by the natural park under analysis and the related attraction offered and by the other cultural variables.
Further research is needed to deepen this relationship, in particular by framing the analysis on the influence of the ‘first time impression’ on specific natural and historical sites such as La Mandria Park. However, similar consideration can be made regarding the existing tie between the activism in Natura 2000 (cultural and recreational) activities and aesthetic quality perception. It could be useful to investigate whether some kinds of activities are more strictly correlated with a higher aesthetic quality perception and how to promote these results in communication and in stakeholder engagement processes. Moreover, the socio-cultural profile of users of Natura 2000 metropolitan sites should be compared with that of urban parks that are not protected.
In addition, evidence on the perceived aesthetic quality of an area should play a critical role in defining management priorities and in designing communication activities related to objectives, problems and other issues connected to the governance of the site [60]. This could be useful to achieve a more aware and responsible citizenship, capable of the sustainable management of its territory and participatory choices [61].
Therefore, Natura 2000 sites included in the urban context have to satisfy two main requests: to be a protected area with great ecological characteristics; to provide services (tourist facilities, cultural and recreational activities) that allow full enjoyment on visits.
From the results obtained through the different methods of investigation, it can be stated that policies and investments aimed at maintaining habitat quality and the inclusion of multiple ecosystem services in conservation planning approaches [62,63] are needed.
The proposed methodology must be continued over time in order to collect more information, involving more stakeholders, with the aims to assess the provision of other ecosystem services and to co-design a long-term management plan, an essential tool to reconcile nature conservation with user enjoyment.

Author Contributions

L.B. conceived the research, collected and analyzed data and wrote the manuscript; F.L. conceived the research, supervised the methodology of the research and wrote the manuscript; F.C. and N.M.G. performed statistical analysis and wrote the manuscript.

Funding

L.B. received a PhD grant from the Italian Ministry of Education, University and Research (MIUR).

Acknowledgments

Thanks to Enrico Pomatto for his contribution in map elaboration and Walter Gaino for helping us in collecting questionnaires. We are grateful to Giuseppina Rezza, Antonella Pogliano, Roberto Filipello (Managers of Ente di gestione delle aree protette dei Parchi Reali) and all the respondents.

Conflicts of Interest

The authors declare no conflict of interest.

References

  1. European Commission. 2018. Available online: http://ec.europa.eu/environment/nature/natura2000/index_en.htm (accessed on 8 April 2019).
  2. European Environment Agency. 2018. Available online: https://www.eea.europa.eu/data-and-maps/dashboards/natura-2000-barometer (accessed on 10 April 2019).
  3. Pietrzyk-Kaszyńska, A.; Cent, J.; Grodzińska-Jurczak, M.; Szymańska, M. Factors influencing perception of protected areas—The case of Natura 2000 in Polish Carpathian communities. J. Nat. Conserv. 2012, 20, 284–292. [Google Scholar] [CrossRef]
  4. European Commission. Natura 2000 and Forest Part I-II. 2015. Available online: http://ec.europa.eu/environment/nature/natura2000/management/docs/Final%20Guide%20N2000%20%20Forests%20Part%20I-II-Annexes.pdf (accessed on 18 April 2019).
  5. European Commission. Managing Natura 2000 Sites. The Provisions of Article 6 of the ‘Habitats’ Directive 92/43/EEC. 2018. Available online: http://ec.europa.eu/environment/nature/natura2000/management/docs/art6/Provisions_Art_._nov_2018_endocx.pdf. (accessed on 18 April 2019).
  6. Beunen, R.; de Vries, J.R. The governance of Natura 2000 sites: The importance of initial choices in the organisation of planning processes. J. Environ. Plan. Manag. 2011, 54, 1041–1059. [Google Scholar] [CrossRef]
  7. Paletto, A.; Graziani, A.; Brescancin, F.; De Meo, I. Public participation in the implementation of the Natura 2000 network in Italy: The stakeholders’ experiences. Forest 2017, 14, 13–27. [Google Scholar] [CrossRef]
  8. Nastran, M. Why does nobody ask us? Impacts on local perception of a protected area in designation, Slovenia. Land Use Policy 2015, 46, 38–49. [Google Scholar] [CrossRef]
  9. Jones, N.; Malesios, C.; Ioannidou, E.; Kanakaraki, R.; Kazoli, F.; Dimitrakopoulos, P.G. Understanding perceptions of the social impacts of protected areas: Evidence from three NATURA 2000 sites in Greece. Environ. Impact Assess. Rev. 2018, 73, 80–89. [Google Scholar] [CrossRef]
  10. Lischka, S.A.; Teel, T.L.; Johnson, H.E.; Reed, S.E.; Breck, S.; Carlos, A.D.; Crooks, K.R. A conceptual model for the integration of social and ecological information to understand human-wildlife interactions. Biol. Conserv. 2018, 225, 80–87. [Google Scholar] [CrossRef] [Green Version]
  11. European Commission. Guidelines on Wilderness in Natura 2000. 2013. Available online: http://ec.europa.eu/environment/nature/natura2000/wilderness/pdf/WildernessGuidelines.pdf (accessed on 18 April 2019).
  12. Kati, V.; Hovardas, T.; Dieterich, M.; Ibisch, P.L.; Mihok, B.; Selva, N. The challenge of implementing the European network of protected areas Natura 2000: Implementing Natura 2000. Conserv. Biol. 2015, 29, 260–270. [Google Scholar] [CrossRef]
  13. Schirpke, U.; Scolozzi, R.; Da Re, R.; Masiero, M.; Pellegrino, D.; Marino, D. Recreational ecosystem services in protected areas: A survey of visitors to Natura 2000 sites in Italy. J. Outdoor Recreat. Tour. 2018, 21, 39–50. [Google Scholar] [CrossRef]
  14. Blicharska, M.; Orlikowska, E.H.; Roberge, J.M.; Grodzinska-Jurczak, M. Contribution of social science to large scale biodiversity conservation: A review of research about the Natura 2000 network. Biol. Conserv. 2016, 199, 110–122. [Google Scholar] [CrossRef]
  15. Schirpke, U.; Scolozzi, R.; De Marco, C.; Tappeiner, U. Mapping beneficiaries of ecosystem services flows from Natura 2000 sites. Ecosyst. Serv. 2014, 9, 170–179. [Google Scholar] [CrossRef]
  16. Dimitrakopoulos, P.G.; Jones, N.; Iosifides, T.; Florokapi, I.; Lasda, O.; Paliouras, F.; Evangelinos, K.I. Local attitudes on protected areas: Evidence from three Natura 2000 wetland sites in Greece. J. Environ. Manag. 2010, 91, 1847–1854. [Google Scholar] [CrossRef] [PubMed]
  17. Hirons, M.; Comberti, C.; Dunford, R. Valuing Cultural Ecosystem Services. Annu. Rev. Environ. Resour. 2016, 41, 545–574. [Google Scholar] [CrossRef]
  18. Ridding, L.E.; Redhead, J.W.; Oliver, T.H.; Schmucki, R.; McGinlay, J.; Graves, A.R.; Morris, J.; Bradbury, R.B.; King, H.; Bullock, J.M. The importance of landscape characteristics for the delivery of cultural ecosystem services. J. Environ. Manag. 2018, 206, 1145–1154. [Google Scholar] [CrossRef] [PubMed] [Green Version]
  19. Elwell, T.L.; Gelcich, S.; Gaines, S.D.; López-Carr, D. Using people’s perceptions of ecosystem services to guide modeling and management efforts. Sci. Total Environ. 2018, 637–638, 1014–1025. [Google Scholar] [CrossRef] [PubMed]
  20. Apostolopoulou, E.; Drakou, E.G.; Pediaditi, K. Participation in the management of Greek Natura 2000 sites: Evidence from a cross-level analysis. J. Environ. Manag. 2012, 113, 308–318. [Google Scholar] [CrossRef] [PubMed]
  21. Istituto Nazionale di Statistica (ISTAT). I. Stat Banca Dati. Available online: http://dati.istat.it/Index.aspx (accessed on 18 April 2019).
  22. Laurora, C.; Masciavè, C.; Niccoli, M.P.; Racca, G. Le Reali mandrie dei Savoia. Territorio, Caccia e Allevamento di Cavalli per la Corte e L’esercito; Editor Regione Piemonte; EDIZIONI EDA: Torino, Italy, 2005; Volume 1, p. 440. [Google Scholar]
  23. Ente di Gestione Delle Aree Protette dei Parchi Reali. 2019. Available online: http://www.parchireali.gov.it/parco.mandria/pagina.php?id=3 (accessed on 11 April 2019).
  24. Anonymous. La Mandria, 1st ed.; Editor Regione Piemonte—Parco Regionale La Mandria; EDIZIONI EDA: Torino, Italy, 2002; p. 208. [Google Scholar]
  25. Clark, J.R.; Matheny, N.P.; Cross, G.; Wake, V. A model of urban forest sustainability. J. Arboric. 1997, 23, 17–30. [Google Scholar]
  26. Nederhof, A. Methods of coping with social desirability bias: A review. Eur. J. Soc. Psychol. 1985, 15, 263–280. [Google Scholar] [CrossRef]
  27. Vodouhê, F.; Coulibaly, O.; Adégbidi, A.; Sinsin, B. Community perception of biodiversity conservation within protected areas in Benin. For. Policy Econ. 2010, 12, 505–512. [Google Scholar] [CrossRef]
  28. Peterson, B.; Harrell, F.E. Partial proportional odds models for ordinal response variables. Appl. Stat. 1990, 39, 205–217. [Google Scholar] [CrossRef]
  29. Dunn, C.E. Participatory GIS—People’s GIS? Prog. Hum. Geogr. 2007, 31, 616–637. [Google Scholar] [CrossRef]
  30. Canedoli, C.; Bullock, C.; Collier, M.J.; Joyce, D.; Padoa-Schioppa, E. Public Participatory Mapping of Cultural Ecosystem Services: Citizen Perception and Park Management in the Parco Nord of Milan (Italy). Sustainability 2017, 9, 891. [Google Scholar] [CrossRef]
  31. Rajendran, P.; Mani, K. Quantifying the dynamics of landscape patternsin Thiruvananthapuram Corporation using open source GIS tools. Int. J. Res. Eng. Appl. Sci. 2015, 5, 77–87. [Google Scholar]
  32. Jung, M. LecoS—A python plugin for automated landscape ecology analysis. Ecol. Inform. 2016, 31, 18–21. [Google Scholar] [CrossRef]
  33. Nagendra, H. Opposite trends in response for the Shannon and Simpson indices of landscape diversity. Appl. Geogr. 2002, 22, 175–186. [Google Scholar] [CrossRef]
  34. Mattheck, C.; Breloer, H. Field guide for Visual Tree Assessment (VTA). Arboric. J. 1994, 18, 1–23. [Google Scholar] [CrossRef]
  35. Ranius, T.; Aguado, L.O.; Antonsson, K.; Audisio, P.; Ballerio, A.; Carpaneto, G.M.; Chobot, K.; Gjurasin, B.; Neculiseanu, Z. Osmoderma eremita (Coleoptera, Scarabaeidae, Cetoniinae) in Europe. Anim. Biodivers. Conserv. 2005, 28, 1–44. [Google Scholar]
  36. Carpaneto, G.M.; Mazziotta, A.; Coletti, G.; Luiselli, L.; Audisio, P. Conflict between insect conservation and public safety: The case study of a saproxylic beetle (Osmoderma eremita) in urban parks. J. Insect Conserv. 2010, 14, 555–565. [Google Scholar] [CrossRef]
  37. Bonifacio, E.; Petrillo, M.; Petrella, F.; Tambone, F.; Celi, L. Alien red oak affects soil organic matter cycling and nutrient availability in low-fertility well-developed soils. Plant Soil 2015, 395, 215–229. [Google Scholar] [CrossRef]
  38. Martín-López, B.; Iniesta-Arandia, I.; García-Llorente, M.; Palomo, I.; Casado-Arzuaga, I.; Del Amo, D.G.; González, J.A. Uncovering ecosystem service bundles through social preferences. PLoS ONE 2012, 7, e38970. [Google Scholar] [CrossRef]
  39. Jackson, C. Doing what comes naturally? Women and environment in development. World Dev. 1993, 21, 1947–1963. [Google Scholar] [CrossRef]
  40. Resurreccion, B.P. Persistent women and environment linkages in climate change and sustainable development agendas. Womens Stud. Int. Forum 2013, 40, 33–43. [Google Scholar] [CrossRef]
  41. Dymen, C.; Andersson, M.; Langlais, R. Gendered dimensions of climate change response in Swedish municipalities. Local Environ. 2013, 18, 1066–1078. [Google Scholar] [CrossRef]
  42. Richardson, E.A.; Mitchell, R. Gender differences in relationships between urban green space and health in the United Kingdom. Soc. Sci. Med. 2010, 71, 568–575. [Google Scholar] [CrossRef] [PubMed] [Green Version]
  43. McNiel, J.N.; Harris, D.A.; Fondren, K.M. Women and the wild: Gender socialization in wilderness recreation advertising. Gend. Issues. 2012, 29, 39–55. [Google Scholar] [CrossRef]
  44. Stafford, M.; Cummins, S.; Macintyre, S.; Ellaway, A.; Marmot, M. Gender differences in the associations between health and neighbourhood environment. Soc. Sci Med. 2005, 60, 1681–1692. [Google Scholar] [CrossRef]
  45. MacBride-Stewart, S.; Gong, Y.; Antell, J. Exploring the interconnections between gender, health and nature. Public Health 2016, 141, 279–286. [Google Scholar] [CrossRef] [Green Version]
  46. Chen, C.M.; Lee, H.T.; Chen, S.H.; Huang, T.H. Tourist behavioural intentions in relation to service quality and customer satisfaction in Kinmen National Park, Taiwan. Int J. Tour. Res. 2011, 13, 416–432. [Google Scholar] [CrossRef]
  47. Akama, J.S.; Kieti, D.M. Measuring tourist satisfaction with Kenya’s wildlife safari: A case study of Tsavo West National Park. Tour. Manag. 2003, 24, 73–81. [Google Scholar] [CrossRef]
  48. Canter, L.W.; Nelson, D.I.; Everett, J.W. Public perception of water quality risks-influencing factors and enhancement opportunities. J. Environ. Syst. 1993, 22, 163–187. [Google Scholar] [CrossRef]
  49. Strang, V. Common senses: Water, sensory experience and the generation of meaning. J. Mater. Cult. 2005, 10, 92–120. [Google Scholar] [CrossRef]
  50. Florida, R.; Mellander, C.; Stolarick, K. Beautiful Places: The Role of Perceived Aesthetic Beauty in Community Satisfaction. Reg. Stud. 2011, 45, 33–48. [Google Scholar] [CrossRef]
  51. Barnett, M.J.; Jackson-Smith, D.; Haeffner, M. Influence of recreational activity on water quality perceptions and concerns in Utah: A replicated analysis. J. Outdoor Recreat. Tour. 2018, 22, 26–36. [Google Scholar] [CrossRef]
  52. Tarrant, M.A.; Green, G.T. Outdoor recreation and the predictive validity of environmental attitudes. Leis. Sci. 1999, 21, 17–30. [Google Scholar]
  53. Maller, C.; Townsend, M.; Pryor, A.; Brown, P.; St Leger, L. Healthy nature healthy people: Contact with nature as an upstream health promotion intervention for populations. Health Promot. Int. 2005, 21, 45–54. [Google Scholar] [CrossRef] [PubMed]
  54. Caravello, G.; Pivotto, B. Individuazione di confini ecologici per un paesaggio fluviale nel tratto ritrale de La Brenta: Bassano del Grappa-Tezze sul Brenta. Biol. Ambient. 2007, 21, 17–25. [Google Scholar]
  55. Tomaselli, V.; Veronico, G.; Sciandrello, S.; Blonda, P. How does the selection of landscape classification schemes affect the spatial pattern of natural landscapes? An assessment on a coastal wetland site in southern Italy. Environ. Monit. Assess. 2016, 188. [Google Scholar] [CrossRef]
  56. Hakim, L. Cultural Landscape Preservation and Ecotourism Development in Blambangan Biosphere Reserve, East Java. In Landscape Ecology for Sustainable Society, 1st ed.; Hong, S.K., Nakagoshi, N., Eds.; Springer: Cham, Switzerland, 2017; pp. 341–358. [Google Scholar]
  57. Barbero, E.; Palestrini, C.; Rolando, A. Dung Beetle Conservation: Effects of Habitat and Resource Selection (Coleoptera: Scarabaeoidea). J. Insect Conserv. 1999, 3, 75–84. [Google Scholar] [CrossRef]
  58. Battisti, L.; Pille, L.; Wachtel, T.; Larcher, F.; Säumel, I. Residential Greenery: State of the Art and Health-Related Ecosystem Services and Disservices in the City of Berlin. Sustainability 2019, 11, 1815. [Google Scholar] [CrossRef]
  59. Gullino, P.; Battisti, L.; Larcher, F. Linking Multifunctionality and Sustainability for Valuing Peri-Urban Farming: A Case Study in the Turin Metropolitan Area (Italy). Sustainability 2018, 10, 1625. [Google Scholar] [CrossRef]
  60. Robinson, K.W.; Elliott, K.C. Environmental Aesthetics and Public Environmental Philosophy. Ethics Policy Environ. 2011, 14, 175–191. [Google Scholar] [CrossRef]
  61. Battisti, L.; Larcher, F.; Devecchi, M. L’orto come strumento di educazione ambientale e inclusione sociale. Esperienze multidisciplinari nella Città di Torino. Memorie Geografiche della Società di Studi Geografici 2017, 15, 453–459. [Google Scholar]
  62. Gusmerotti, N.M.; Testa, F.; Amirante, D.; Frey, M. The role of negotiating tools in the environmental policy mix instruments: Determinants and effects of the Environmental Agreement. J. Clean Prod. 2012, 35, 39–49. [Google Scholar] [CrossRef]
  63. Qu, Y.; Lu, M. Identifying conservation priorities and management strategies based on ecosystem services to improve urban sustainability in Harbin, China. PeerJ 2018, 6, e4597. [Google Scholar] [CrossRef] [PubMed] [Green Version]
Figure 1. Classification of La Mandria Park, indicating buffer, core and study areas.
Sustainability 11 06169 g001
Figure 2. Land use and main elements (entrances, farmsteads, church and the castle) that characterize La Mandria Park (a) and levels of protection divided by zones (A, B, C, and U) and routes available (of different sizes) within the park (b).
Sustainability 11 06169 g002
Figure 3. Land use in the eight buffers related to favorite places (a) and levels of protection divided by zones (A, B, C, and U) (b). The main cultural elements and routes were reported.
Sustainability 11 06169 g003
Table 1. The main phases, methods used and attended results of the research.
Phases of the ResearchMethodsAttended Results
Involvement of park managers Qualitative analysis of semi-structured interviewsManagement operations carried out in the park based on the four main landscape elements (lawns, woodlands, lines of trees and water bodies).
Involvement of usersQuestionnaires submission and statistical analysis of questionnaire data Users’ knowledge of the park; users’ aesthetic perception of the four landscape elements.
Involvement of users Participatory mappingUsers’ preferred places within the park.
Table 2. Questions, multiple-choice options and related variables used in the questionnaire.
QuestionsOptionsVariables
Where do you live?Cities that have direct access to the park; Metropolitan area of Turin; Piedmont; other Italian regions; other countriesProximity
Age; gender; education< 18, 18–30, 31–45, 46–60, > 60; M/F; primary, secondary, high school, university degreeAge; gender; education
Do you know that La Mandria Park is a protected park?yes/noEnvironmental knowledge
How many times do you come here in a year?/On which days of the week?less than once, up to 10 times, more than 10 times/Saturday/Sunday/days off; during the weekFrequency of visits
How do you rate the aesthetic value of lawn areas?/Why?1—great; 2—good; 3—sufficient; 4—low; 5—bad/well maintained; poorly maintained; tall grass; presence of flowers and bees; otherQuality perception
How do you rate the aesthetic value of woodland areas?/Why?1—great; 2—good; 3—sufficient; 4—low; 5—bad/well maintained; poorly maintained; presence of dead wood; presence of birds and mammals; otherQuality perception
How do you rate the usability of the main routes consisting of lines of trees?/Why?1—great; 2—good; 3—sufficient; 4—low; 5—bad/well maintained; poorly maintained; I reach my favorite places; not suitable for use by all; otherQuality perception
How do you rate the aesthetic value of water bodies?/Why?1—great; 2—good; 3—sufficient; 4—low; 5—bad/well maintained; poorly maintained; it is difficult to enjoy all the areas; presence of fishes and waterfowls; otherQuality perception
Are you aware of the paid cultural activities that take place within the area?yes/noPark knowledge
Have you ever participated in a cultural activity?yes/noInvolvement
Table 3. Descriptive statistics about the age and gender of park users (N = 232 completed questionnaires).
AgeNumberPercentage
Less than 183716%
Between 18 and 303917%
Between 31 and 453616%
Between 46 and 605825%
Older than 606227%
Gender
Female13156%
Male10144%
Table 4. The main management operations, referred to as the four landscape elements.
ElementsManagement Operations
LawnsMowing of lawn: three times per year
WoodlandsPruning, felling, removal of trees; standing dead trees (Quercus robur L.); sale of standing timber (Quercus rubra L.)
Lines of trees along routesVisual Tree Assessment; pruning
Water bodiesChemical–physical analyses
Table 5. Frequency (%) of selected options (based on a 5-point Likert scale, ranging from “great quality” to “bad quality”) of perceived aesthetic quality in relation to four landscape elements (N = 232).
ElementsFrequency (%) of Selected Options
GreatGoodSufficientLowBad
Lawns31.749.813.73.51.3
Woodlands22.349.118.96.92.8
Routes35.646.213.92.81.5
Water bodies20.246.320.58.05.0
Table 6. Results of the regression analysis.
VariableCoef.Std. Errz[95% ConfInterval]
Proximity0.07700.08660.89−0.09280.2469
Age−0.06790.0599−1.13−0.18540.0495
Education0.07870.06751.17−053610.2111
Gender0.5123 **0.16313.140.19260.8321
Environmental knowledge0.27060.27420.99−0.26670.8081
Regular visitor−0.1652 **0.0710−2.33−0.3044−0.0260
Park knowledge−0.11510.1690−0.68−0.44650.2163
Involvement0.3925 *0.18382.140.03220.7528
* p < 0.01; ** p < 0.001.
Table 7. Percentages of buffers affected by zones (A, B, C, and U).
Borgo Castello (N a = 44)Castello dei Laghi (N = 44)Vittoria (N = 30)Prato-Pascolo (N = 29)Oslera (N = 29)Brero (N = 19)Peppinella (N = 14)Rubbianetta (N = 12)
%%%%%%%%
Zone A b28.576.132.219.793.269.220.854.4
Zone B45.73.740.870.90.021.768.215.9
Zone C19.218.825.78.44.28.36.226.8
Zone U6.61.41.41.12.60.84.83.0
a N: number of selections. b A—strict nature reserve; B—permit-only access reserve; C—controlled reserve; U—urbanized areas.
Table 8. Land cover categories, number of patches (N), Shannon’s equitability index (DIV_EV) and Simpson’s diversity index (DIV_SI) of favorite places selected by users (1–8).
Patches (N)
Favorite Places1 a2345678
Land cover categoriesWater bodies17035000
Alluvial forests with Alnus glutinosa and Fraxinus excelsior 12111001
Constructed, industrial or other artificial habitats32232211
Lines of trees and large-scale ornamental garden areas31221233
Sparsely wooded grasslands211029202
Permanent crops12202013
Pastures1121650953
Oak-hornbeam forests of the Carpinion betuli616418242
Quercus robur on sandy plains21111202
Mixed forest0015501012
Total number of Patches3019462459201429
DIV_EV0.690.640.520.470.620.730.580.50
DIV_SI0.720.630.570.470.640.690.480.59
a1—Borgo Castello; 2—Castello dei Laghi; 3—Vittoria; 4—Prato-Pascolo; 5—Oslera; 6—Brero; 7—Peppinella; 8—Rubbianetta.

