Vulnerability of the Maritime Network to Tropical Cyclones in the Northwest Pacific and the Northern Indian Ocean


1
State Key Laboratory of Resources and Environmental Information Systems, Institute of Geographical Sciences and Natural Resources Research, Chinese Academy of Sciences, Beijing 100101, China
2
University of Chinese Academy of Sciences, Beijing 100049, China
*
Author to whom correspondence should be addressed.
Sustainability 2019, 11(21), 6176; https://0-doi-org.brum.beds.ac.uk/10.3390/su11216176
Submission received: 10 September 2019
/
Revised: 17 October 2019
/
Accepted: 30 October 2019
/
Published: 5 November 2019
(This article belongs to the Section Sustainable Transportation)
Abstract
:Maritime networks are one of the most important types of transportation networks in international logistics and it accounts for 90% of the global trade volume. However, the structure of maritime networks is severely impacted by tropical cyclones, especially the maritime network in the Northwest Pacific and the northern Indian Ocean. This paper investigates the vulnerability of the maritime network in the Northwest Pacific and the northern Indian Ocean to the influence of tropical cyclones through removing ports at high or very high tropical cyclones hazard levels and analyzing how the network structure characteristics change from a complex network point of view. From the results, we find that this maritime network is a small-world network and the degree distribution of ports follows a power law distribution. The ports in East Asia are impacted more severely by the tropical cyclones. Moreover, this maritime network exhibits some vulnerability to tropical cyclones. However, the interconnection of the survived ports is not severely impacted, when the network is attacked by tropical cyclones. The port system in the Philippines is most vulnerable to the influence of tropical cyclones, followed by the ports systems in Japan and China. The paper also shows that it is important for studies of maritime network vulnerability to identify the ports that are both important to the regional and cross-regional logistics and severely impacted by natural hazards. The findings provide a theoretical basis for optimizing the port layout and improving the ability of the network to resist damage caused by tropical cyclones.
1. Introduction
Maritime transport is the most important mode of transport in international logistics due to its high capacity, low freight rate, and use of natural waterways, and it accounts for 90% of the global trade volume [1]. The maritime network of the Northwest Pacific (the northwestern part of the Pacific Ocean) and the northern Indian Ocean is an important part of the global maritime network; it has many international hub ports, such as Shanghai port, Busan port, Hong Kong port, Singapore port, Dubai port, and others. This network is also a major component of China’s 21st Century Maritime Silk Road maritime network [2]. With increasing economic globalization and the implementation of China’s 21st Century Maritime Silk Road strategy, maritime trade with countries that border the Northwest Pacific and the northern Indian Ocean will be further expanded [3]. However, the high frequency of tropical cyclones severely hinders the cargoes transport among ports [4]. Therefore, studying the vulnerability of the maritime network of the Northwest Pacific and the northern Indian Ocean to the influence of tropical cyclones is of great significance, such research is generally lacking.
Tropical cyclones are a type of maritime meteorological disaster with great power. The major effects related to tropical cyclones include strong winds, high wave, and rain [4]. Tropical cyclones can extensively impact port operations, cargo transport, and maritime network structures. The most famous instance in East Asia was Typhoon Maemi in 2003, which attacked the port of Busan and resulted in a 91-day closure of the port that significantly affected maritime transport in the region [5]. Moreover, tropical cyclones can make many ports in several countries fail at the same time. For instance, in the fall of 2016, three tropical cyclones occurred simultaneously in the Northwest Pacific Ocean, namely Meranti (super typhoon), Malakas (severe typhoon), and Rai (tropical storm), which affected ports in China, Japan, the Philippines, and Laos [6]. Port disruption due to the tropical cyclones can also lead to serious loss to port’s reputation, shippers, and carriers [7]. Some studies [8,9] have shown that the intensity and frequency of tropical cyclones will increase with the increasing global mean temperature. The increasing concentration of cargos, combined with greater exposure to tropical cyclones, makes ports more vulnerable than ever before [10].
In recent years, many studies have used complex network theory as an appropriate method to investigate the maritime network [11]. This network approach views ports as the nodes and shipping routes as the links. A port is a node in a network that is mainly responsible for ship mooring and cargo handling. A route is a link for ships to move between ports and connects different regions. Most studies have analyzed maritime networks using complex network models that consider the spatial structure characteristics, dynamic characteristics, and flows [12,13] of the network. Ducruet analyzed the dynamic characteristics of the maritime network in Northeast Asia and the centrality of the ports between 1996 and 2006 [14], in addition to the spatial structures and relative positions of the ports in a global liner shipping network in 1996 and 2006 [15]. Kaluza revealed the differences in network parameters and the movement patterns of different ship types, including bulk dry carriers, container ships, and oil tankers [16]. Fang investigated the dynamics of global maritime networks affected by international events, including military conflicts, lifted economic sanctions, and government elections [17]. Moreover, many studies have investigated the vulnerability of maritime networks. Laxe obtained the port vulnerability by calculating the maximum percentage of cargo that one port shares with another and investigated the relationship between the vulnerability and the connectivity of each port [18]. Wang used node-removal strategies to simulate random errors and targeted attacks and then investigated the different responses of a container shipping network using two methods [19]. Peng investigated the robustness of shipping networks with different ship types, including bulk dry carriers, container ships, and oil tankers [20]. However, few studies have investigated the dynamics or vulnerability of maritime networks under the influence of tropical cyclones.
The objective of this study is to investigate the vulnerability of the maritime network in the Northwest Pacific Ocean and the northern Indian Ocean to the influence of tropical cyclones and attempt to identify the most vulnerable ports system among the countries that are connected by this network. We investigate the vulnerability of the maritime network through removing ports at high or very high tropical cyclones hazard levels and analyze how the network structure characteristics change from a complex network point of view. This research provides a theoretical basis for optimizing the port layout and improving the ability of the network to resist damage caused by tropical cyclones.
The remainder of this article is organized as follows. Section 2 introduces the materials and methods. Section 3 presents the results in terms of the structure of the maritime network, tropical cyclone hazards for ports, and the network vulnerability to the influence of tropical cyclones. Finally, Section 4 presents the concluding remarks and discussion.
2. Materials and Methods
2.1. Data
The data used in this paper include the best track data for tropical cyclones over the Northwest Pacific Ocean and the northern Indian Ocean between 1990 and 2017 and shipping companies’ sailing schedule data in April and May 2019.
The best track data of tropical cyclones over the Northwest Pacific Ocean and the northern Indian Ocean were sourced from the World Meteorological Organization [21] This dataset contains various characteristics of tropical cyclones, such as the six-hour positions (lat/lon), estimated pressures, and sustained maximum surface wind speeds.
The sailing schedule data were sourced from the China Ports website [22]. This dataset contains data on calling ports and route distributions for more than 90 shipping companies, including the Maersk Line, the Mediterranean Shipping Company, the China Ocean Shipping Company, and other international shipping companies. If two ports are adjacent ports of call in the sailing schedule data, we consider that a fixed route connects the two ports. We extracted 948 routes from the dataset, and they connect 182 ports located on the coasts of the Northwest Pacific and the northern Indian Ocean. The maritime network in the Northwest Pacific Ocean and northern Indian Ocean was constructed based on these sailing schedule data [19].
Because of limitations in data acquisition, there was a two-year gap between the historical data of tropical cyclones and sailing schedule data in our study. The gap was small. Moreover, considering the high reliability of natural hazards assessment based on the long-term historical data [23], the year gap would not seriously impact the maritime network vulnerability analysis.
2.2. Methods
2.2.1. Tropical Cyclone Hazard Assessment for Ports
First, we classify tropical cyclones into 4 grades. Next, we use the Modified Rankine Vortex (MRV) model to simulate the wind field of each tropical cyclone. Then, the frequency of each grade of tropical cyclone that occurred at the ports can be obtained. Finally, we propose a tropical cyclone hazard assessment model to assess the tropical cyclone hazard level at each port. The details are as follows.
In general, both international standards and port or terminal authorities assume that ports are operational up to Beaufort 6–8 wind speeds [24]. Therefore, this paper only considers tropical cyclones with wind speeds reaching level 8 (17.2 m/s). According to the previous studies [25,26], tropical cyclones are classified as grade 4 in this paper, as reported in Table 1.
The wind speeds of tropical cyclones are generally modeled using either a dynamical numerical or a parametric approach [27]. Parametric methods are widely used in tropical cyclone hazard and risk assessment due to their cost efficiency and limited number of parameters [28]. The MRV model is one of the most commonly used wind models [26]; it is simple but exhibits good performance in modeling wind fields [27]. Therefore, this study uses the MRV model and the buffer and overlay functions in the ArcGIS platform to simulate the wind speed distribution of each tropical cyclone. According to the port positions, we obtain the actual grades of the tropical cyclones that influenced ports. Then, we calculate the frequency of each grade of tropical cyclone that occurred at every port between 1990 and 2017. The MRV model can be expressed as follows:
where is the maximum wind speed, is the radius of the maximum wind, and is a scaling parameter that adjusts the profile shape. Following Das [26], Phadke [29], and Holland [27], we used = 0.5.
In this paper, we use Equation (3) and Equation (4) to assess the tropical cyclone hazard levels of ports.
where is the hazard coefficient, is the average wind speed of grade in tropical cyclone classification, is the hazard index and is the frequency of occurrence of grade tropical cyclones. The tropical cyclone hazard level of ports is classified into 5 grades in this study: Very low, low, medium, high, and very high.
2.2.2. Network Characteristics Metrics
This study is based on a complex network theory that considers the degree, average shortest path length, and clustering coefficient to analyze the characteristics of the maritime network.
In complex network theory, the connectivity between a port and other ports can be expressed by the degree of the port, and a high degree value indicates that this port has a relatively important position in the network [3,30]. In general, if a port is a national hub port or an international hub port, the port always has a high degree. The average degree of the maritime network is the average for all the ports in the network, which expresses the connectivity of the entire network.
The average shortest path length of a port is the average of the shortest path length between that port and other ports in the network [31]. The minimum number of times required to sail through a given connection between any two ports in the network can be reflected by the average shortest path length of the network. An increasing average shortest path length suggests that the average trans-shipment topological distance between two ports increases, the convenience of the entire network decreases, and the shipping costs increase. Conversely, if the average shortest path length decreases, the transit times will decrease, the shipping costs will decrease. and the convenience of the entire network will increase. The shortest average path length of the network can be expressed as follows:
where represents the shortest path length between nodes and , is the total number of port nodes in the network (182 in this study), L represents the average shortest path length of the entire network and, represents the average shortest path length of node .
The clustering coefficient shows the connection between neighboring ports in the maritime network. A high clustering coefficient indicates a clustered neighborhood, allowing cargo to be transported efficiently within the given area [32]. The clustering coefficient can be expressed as follows:
where represents the real number of edges to which node connects, represents the degree of node , represents the clustering coefficient of node , n represents the total number of port nodes in the network, and represents the average clustering coefficient of the entire network.
2.2.3. Analysis of Maritime Network Vulnerability
According to the previous studies [19,31], we found that the structure of maritime network changed significantly and the network exhibited obvious vulnerability if some nodes failed. Under the scenarios of tropical cyclones, a port with a high hazard level is easily influenced by tropical cyclones, and the probability of port failure is relatively high. Therefore, we can explore the vulnerability of the maritime network by deleting the port nodes that correspond to high or very high tropical cyclone hazard levels, and the changes in the number of ship routes, port degree, average shortest path length, and clustering coefficient before and after port deletion are used as quantitative indicators. When selected ports are gradually removed, the network can become disrupted and isolated ports may appear. In our study, we find that only one isolated port (except for the ports that are removed) appears and other survived ports are connected in the largest subgraph. Therefore, we use the average shortest path length of the largest subgraph to represent the average shortest path length of the entire network. The greater the change in a network characteristic index is, the more notable the vulnerability of the maritime network will be [31]. Based on the tropical cyclone hazard index value from high to low, this study removes the ports at high and very high hazard levels gradually, with the number of ports removed increasing by 10% in each step. The nodes with the highest tropical cyclone hazard index value are deleted first.
3. Results
3.1. Characteristics of the Maritime Network
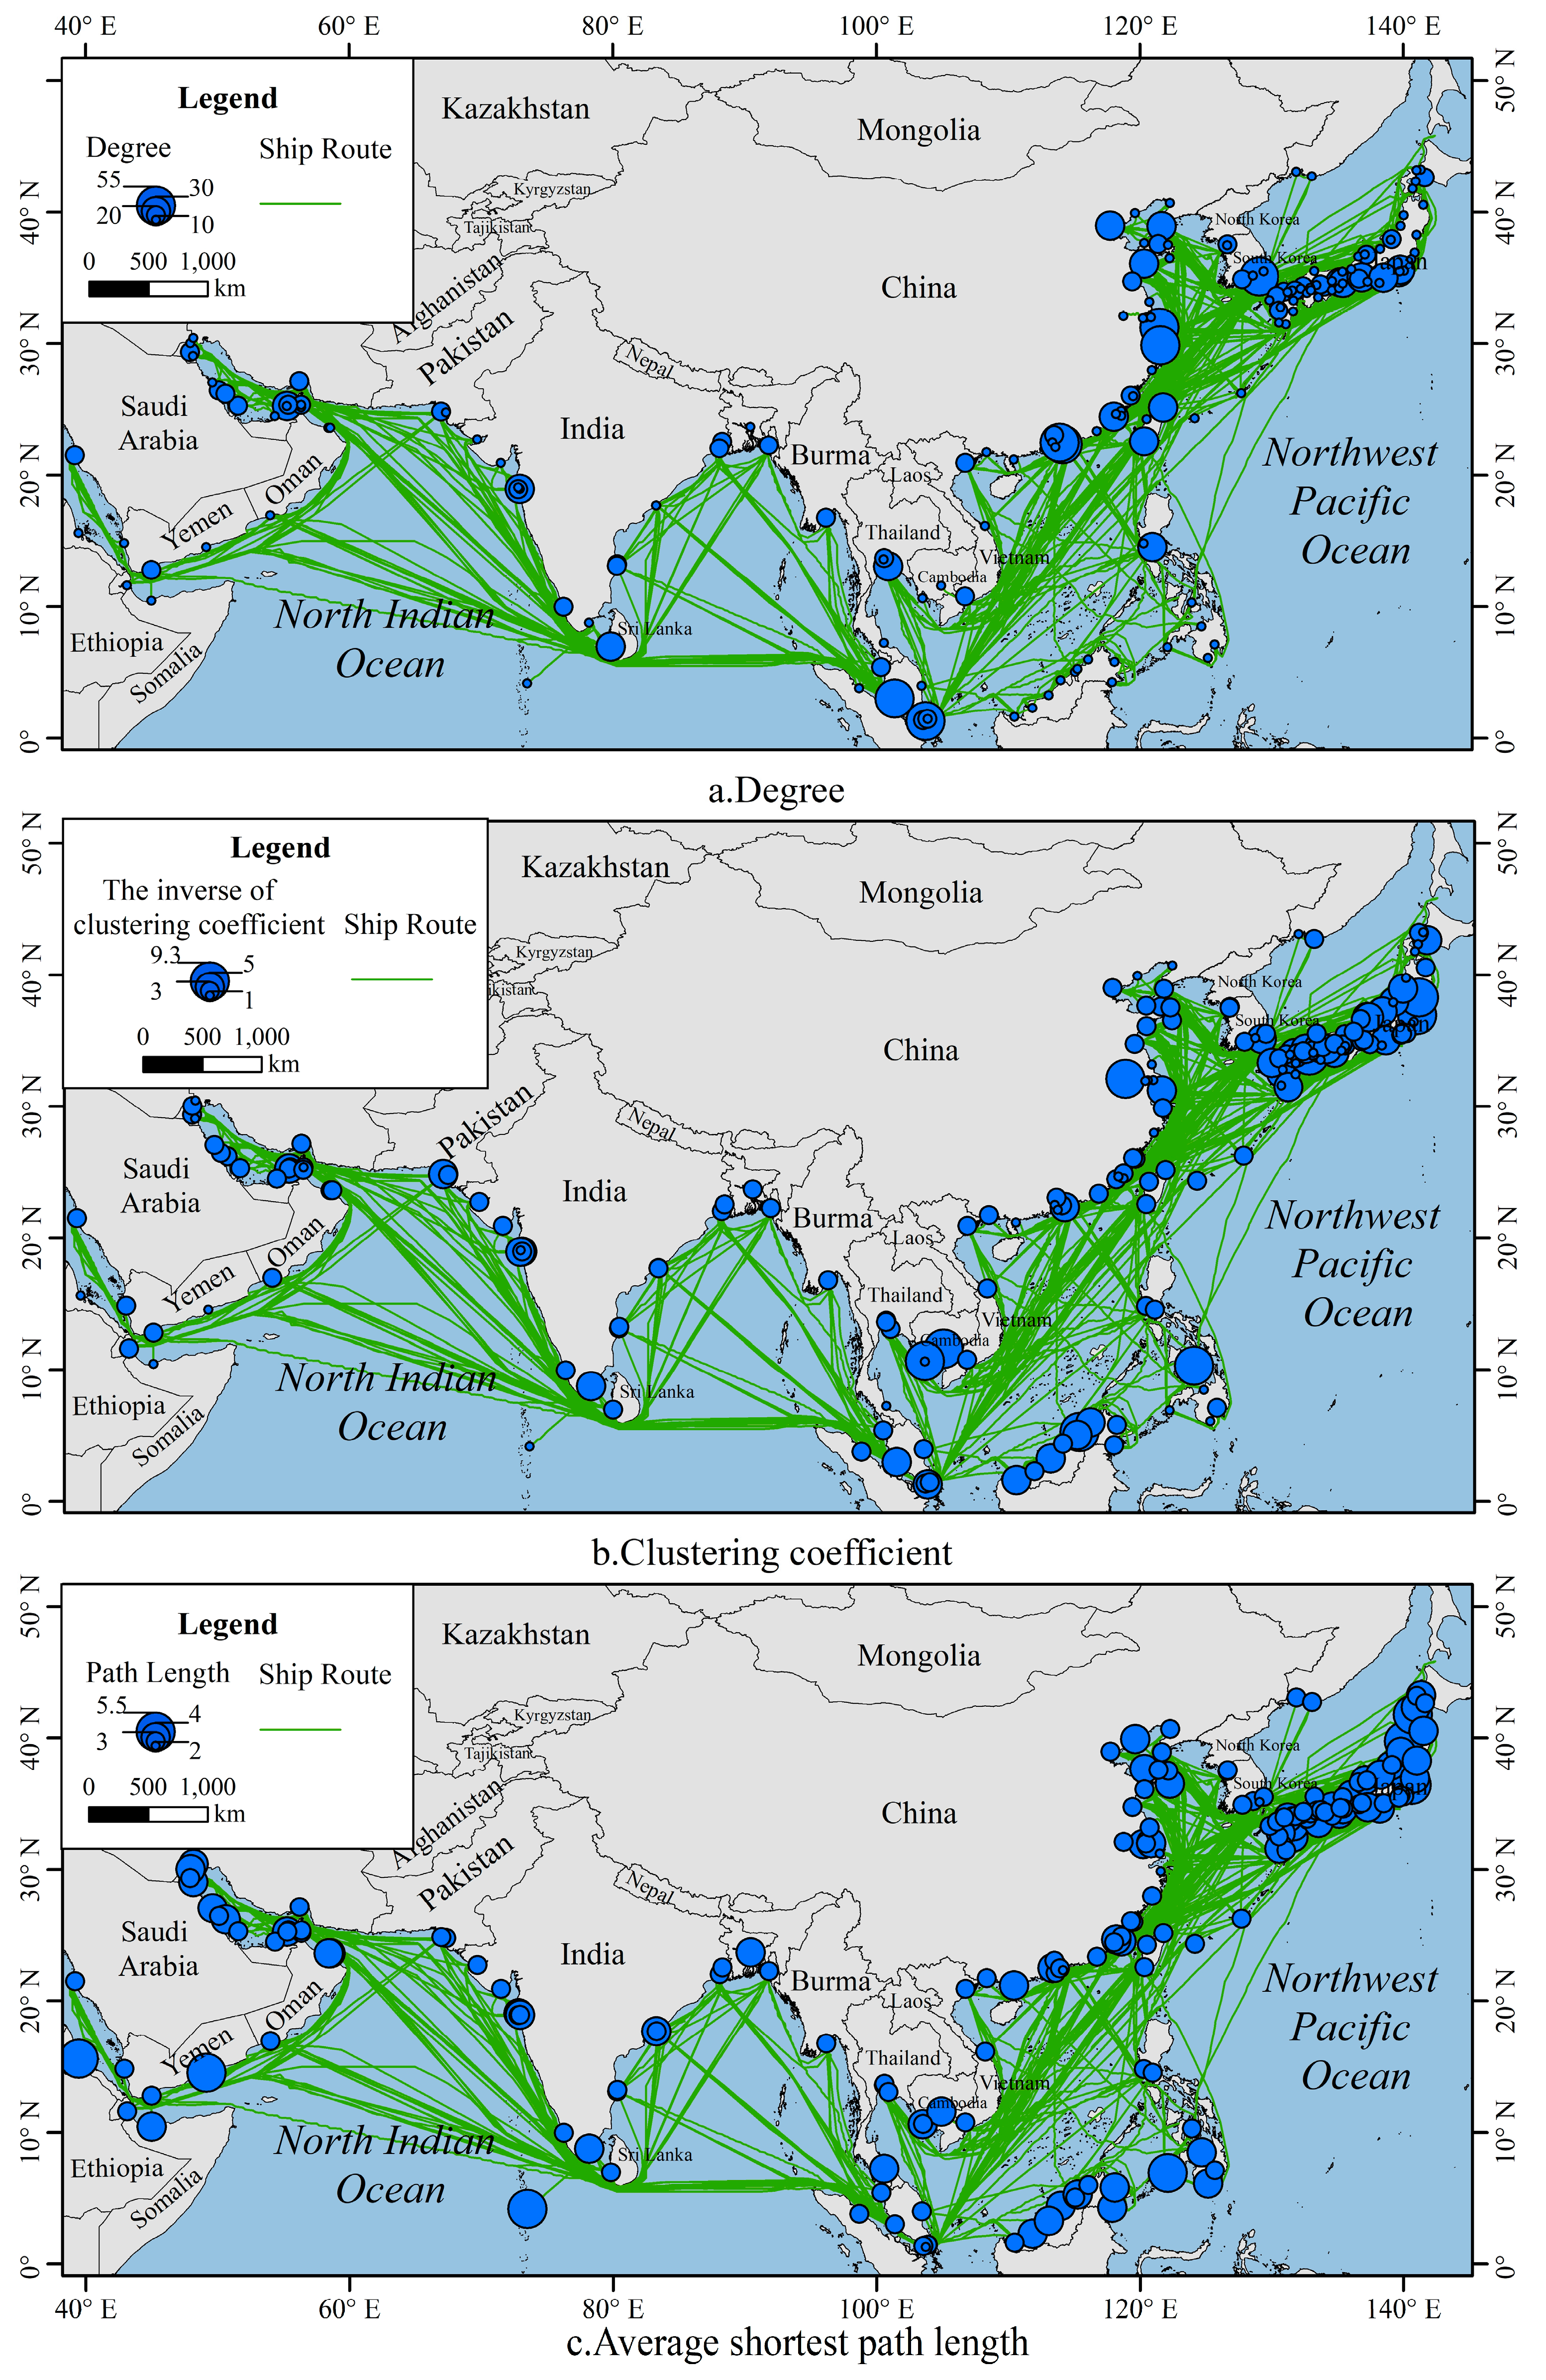
Figure 1 shows that the degree, clustering coefficient, and average shortest path length of each port in the maritime network in the Northwest Pacific and the northern Indian Ocean are obviously different and the data also exhibit regional differences. In order to see the main hubs, we mapped the inverse of the clustering coefficient in Figure 1, keeping zero values unchanged. From Figure 1, we can observe that there are more hub ports located in coastal areas of the Northwest Pacific.
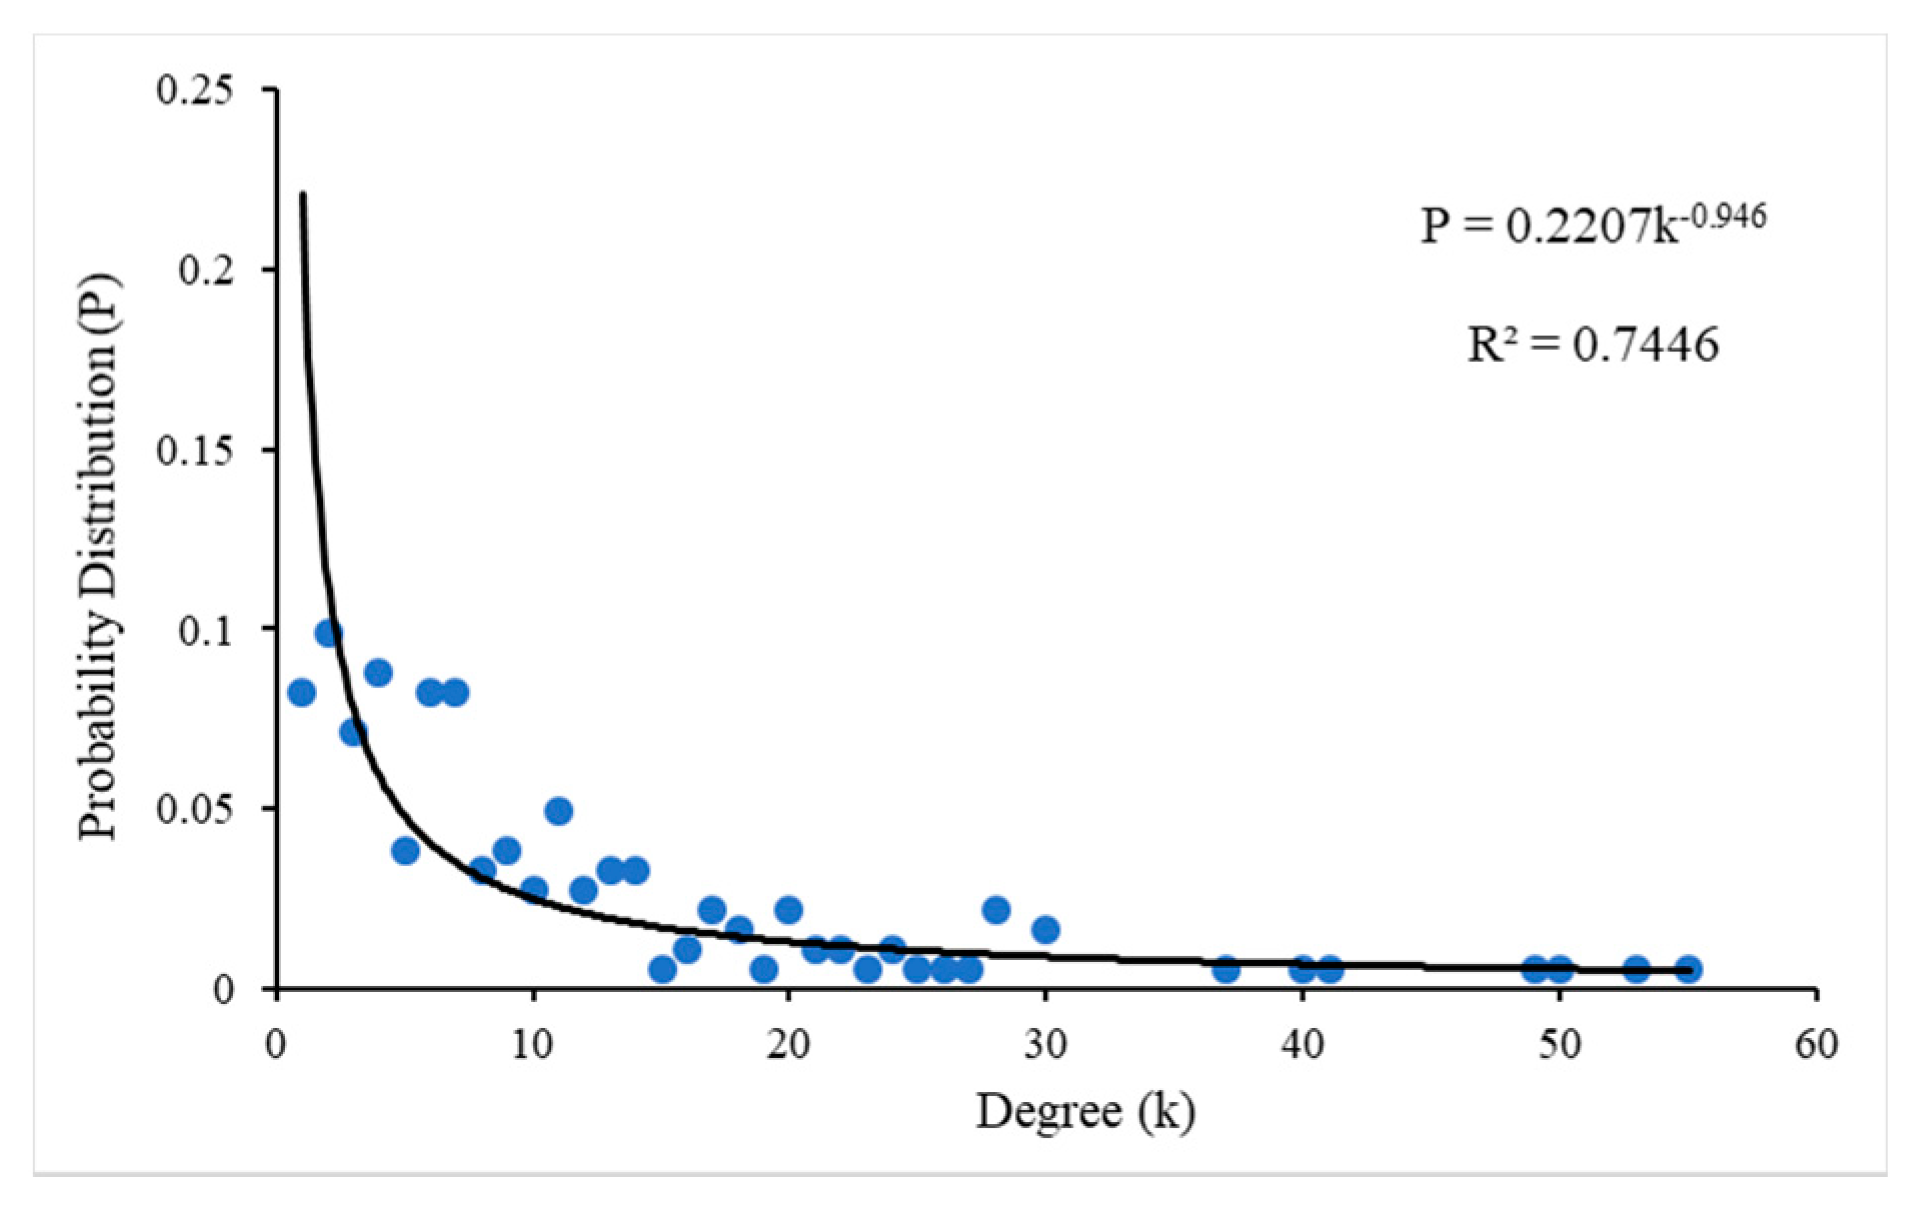
The average degree of the entire network is 10.4, which indicates that each port can be connected with 10 other ports in average. As Table 2 indicates, the top ten ports with the highest degree values include Shanghai, Busan, Hong Kong, Singapore, Ningbo, Kelang, Shenzhen, Kaohsiung, Kobe, and Dubai, and these ten ports are the only ports with degree values of 30 in this maritime network. We also find that half of these ports are located in China. As shown in Figure 1a, most ports in this network have a relatively low degree. The network is a multi-hub network. Through calculating the percentages of the degree values and drawing the degree distribution diagram (Figure 2), we can easily find that the degree distribution of ports follows a power law distribution. To further confirm these characteristics, we performed power law curve fitting and obtained a port degree distribution probability curve of .
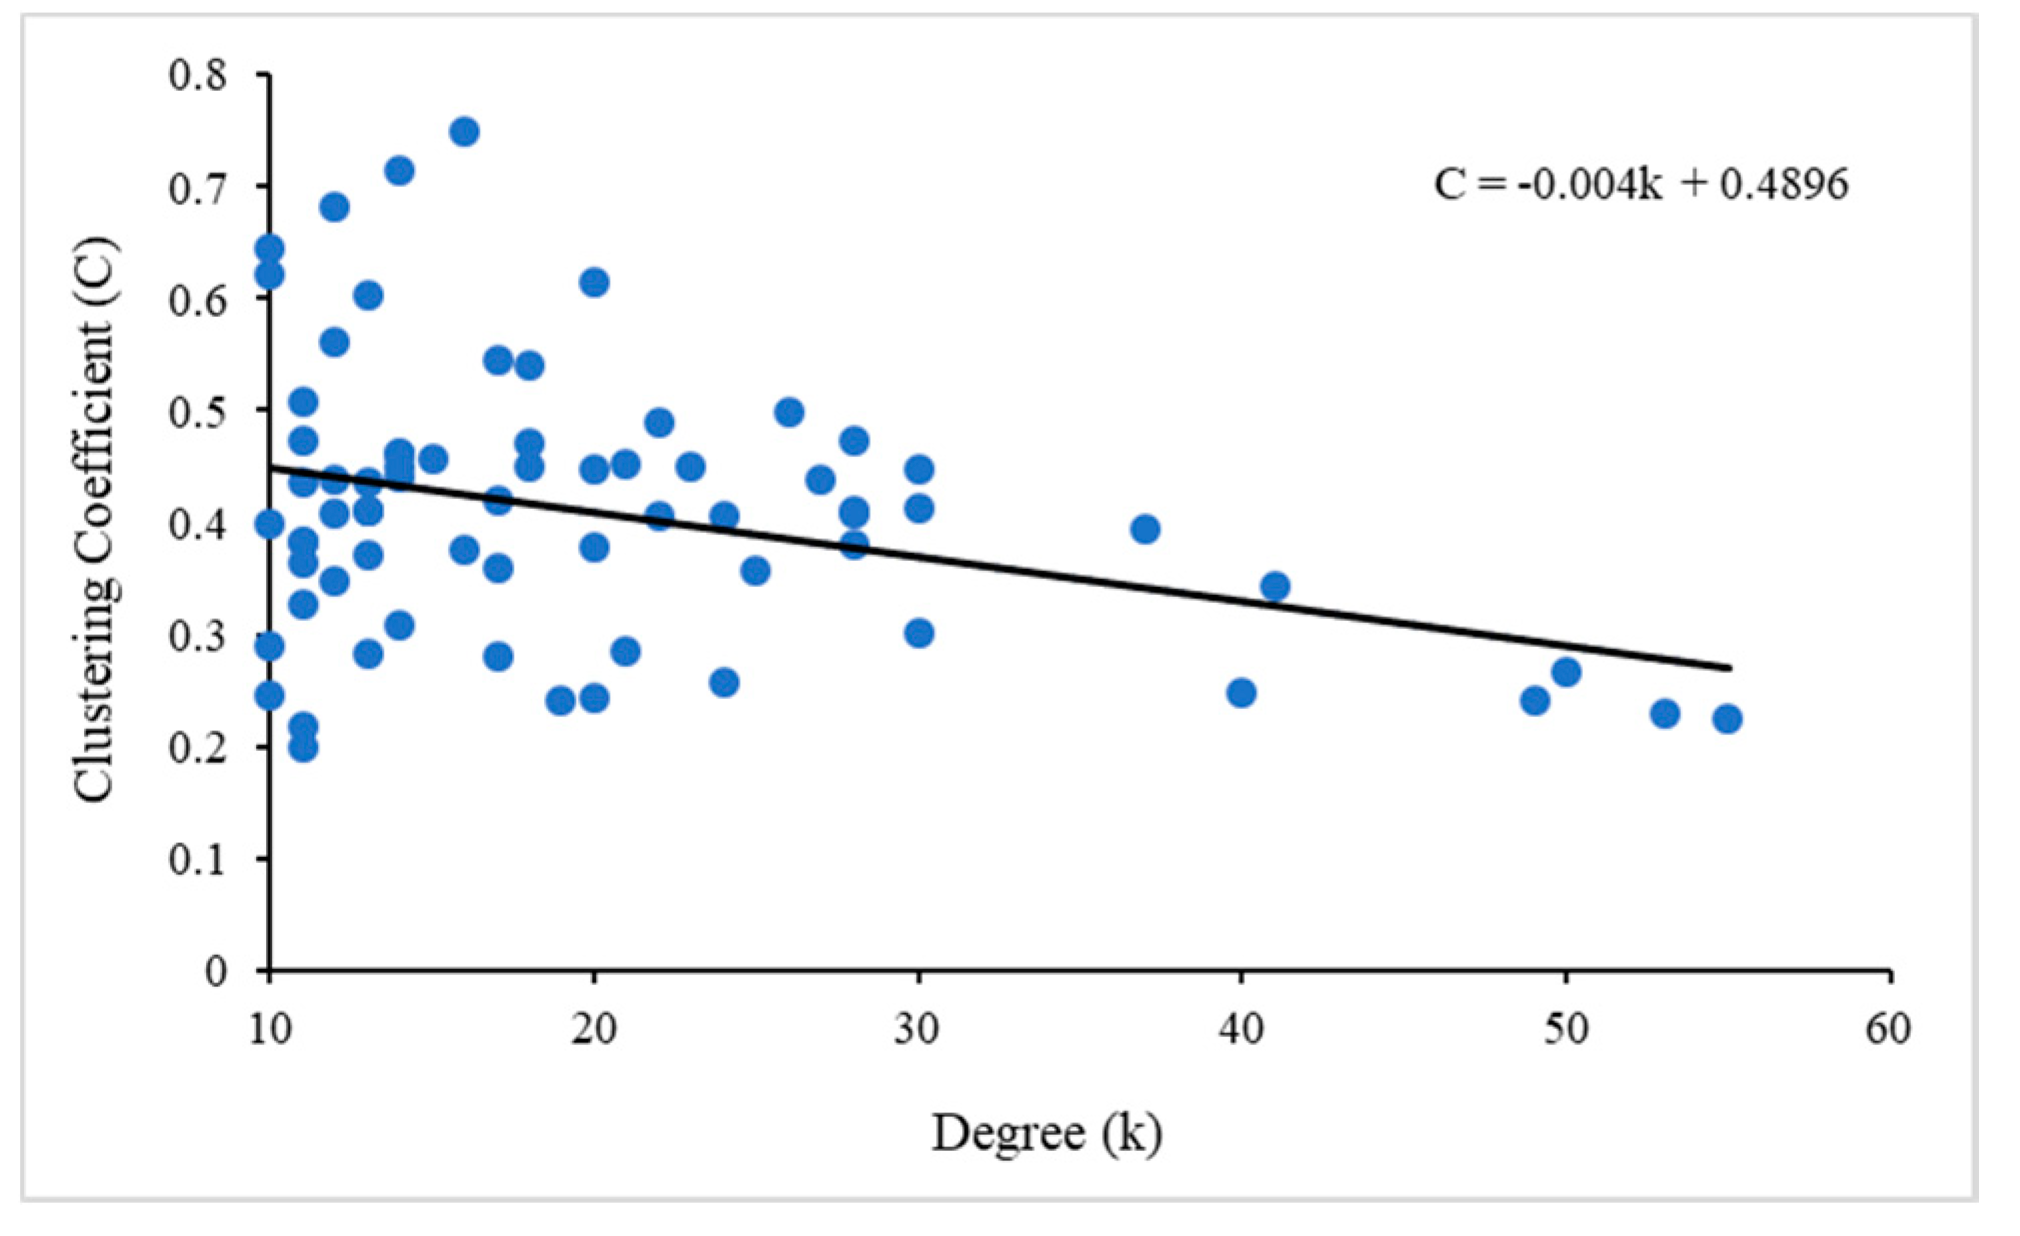
The overall clustering coefficient of the network is 0.38. Figure 3 shows the relationship between the degree and clustering coefficient of ports with a degree value reach 10. In general, ports with relatively high degrees have relatively low clustering coefficients in the maritime network. The clustering coefficients of the top 10 ports with the highest degree values are less than 0.45. Thus, the maritime network exhibits a hub-and-spoke structure.
The average shortest path length of the entire network is 2.9, indicating that port pairs can reach each other through almost two trans-shipment ports. The ports with the shortest path lengths equal to 2, 3, or 4 accounting for 62%, 31%, and 4% of all ports, respectively, which indicates that 62% of the ports require two cargo transits, 31% require three transits, and only 4% require four transits. There are only five ports with shortest path lengths less than 2 in the maritime network. These ports are Singapore, Ningbo, Busan, Hong Kong, and Shanghai, which are the ports with the highest degree values.
Compared with a random network on the same scale with a clustering coefficient of 0.05 and an average shortest path length of 2.5, the maritime network of the Northwest Pacific Ocean and the northern Indian Ocean has a similar average shortest path length but much higher clustering coefficient. Therefore, this maritime network also has small-world network characteristics.
3.2. Spatial Distribution Characteristics of Ports Considering Tropical Cyclone Hazards
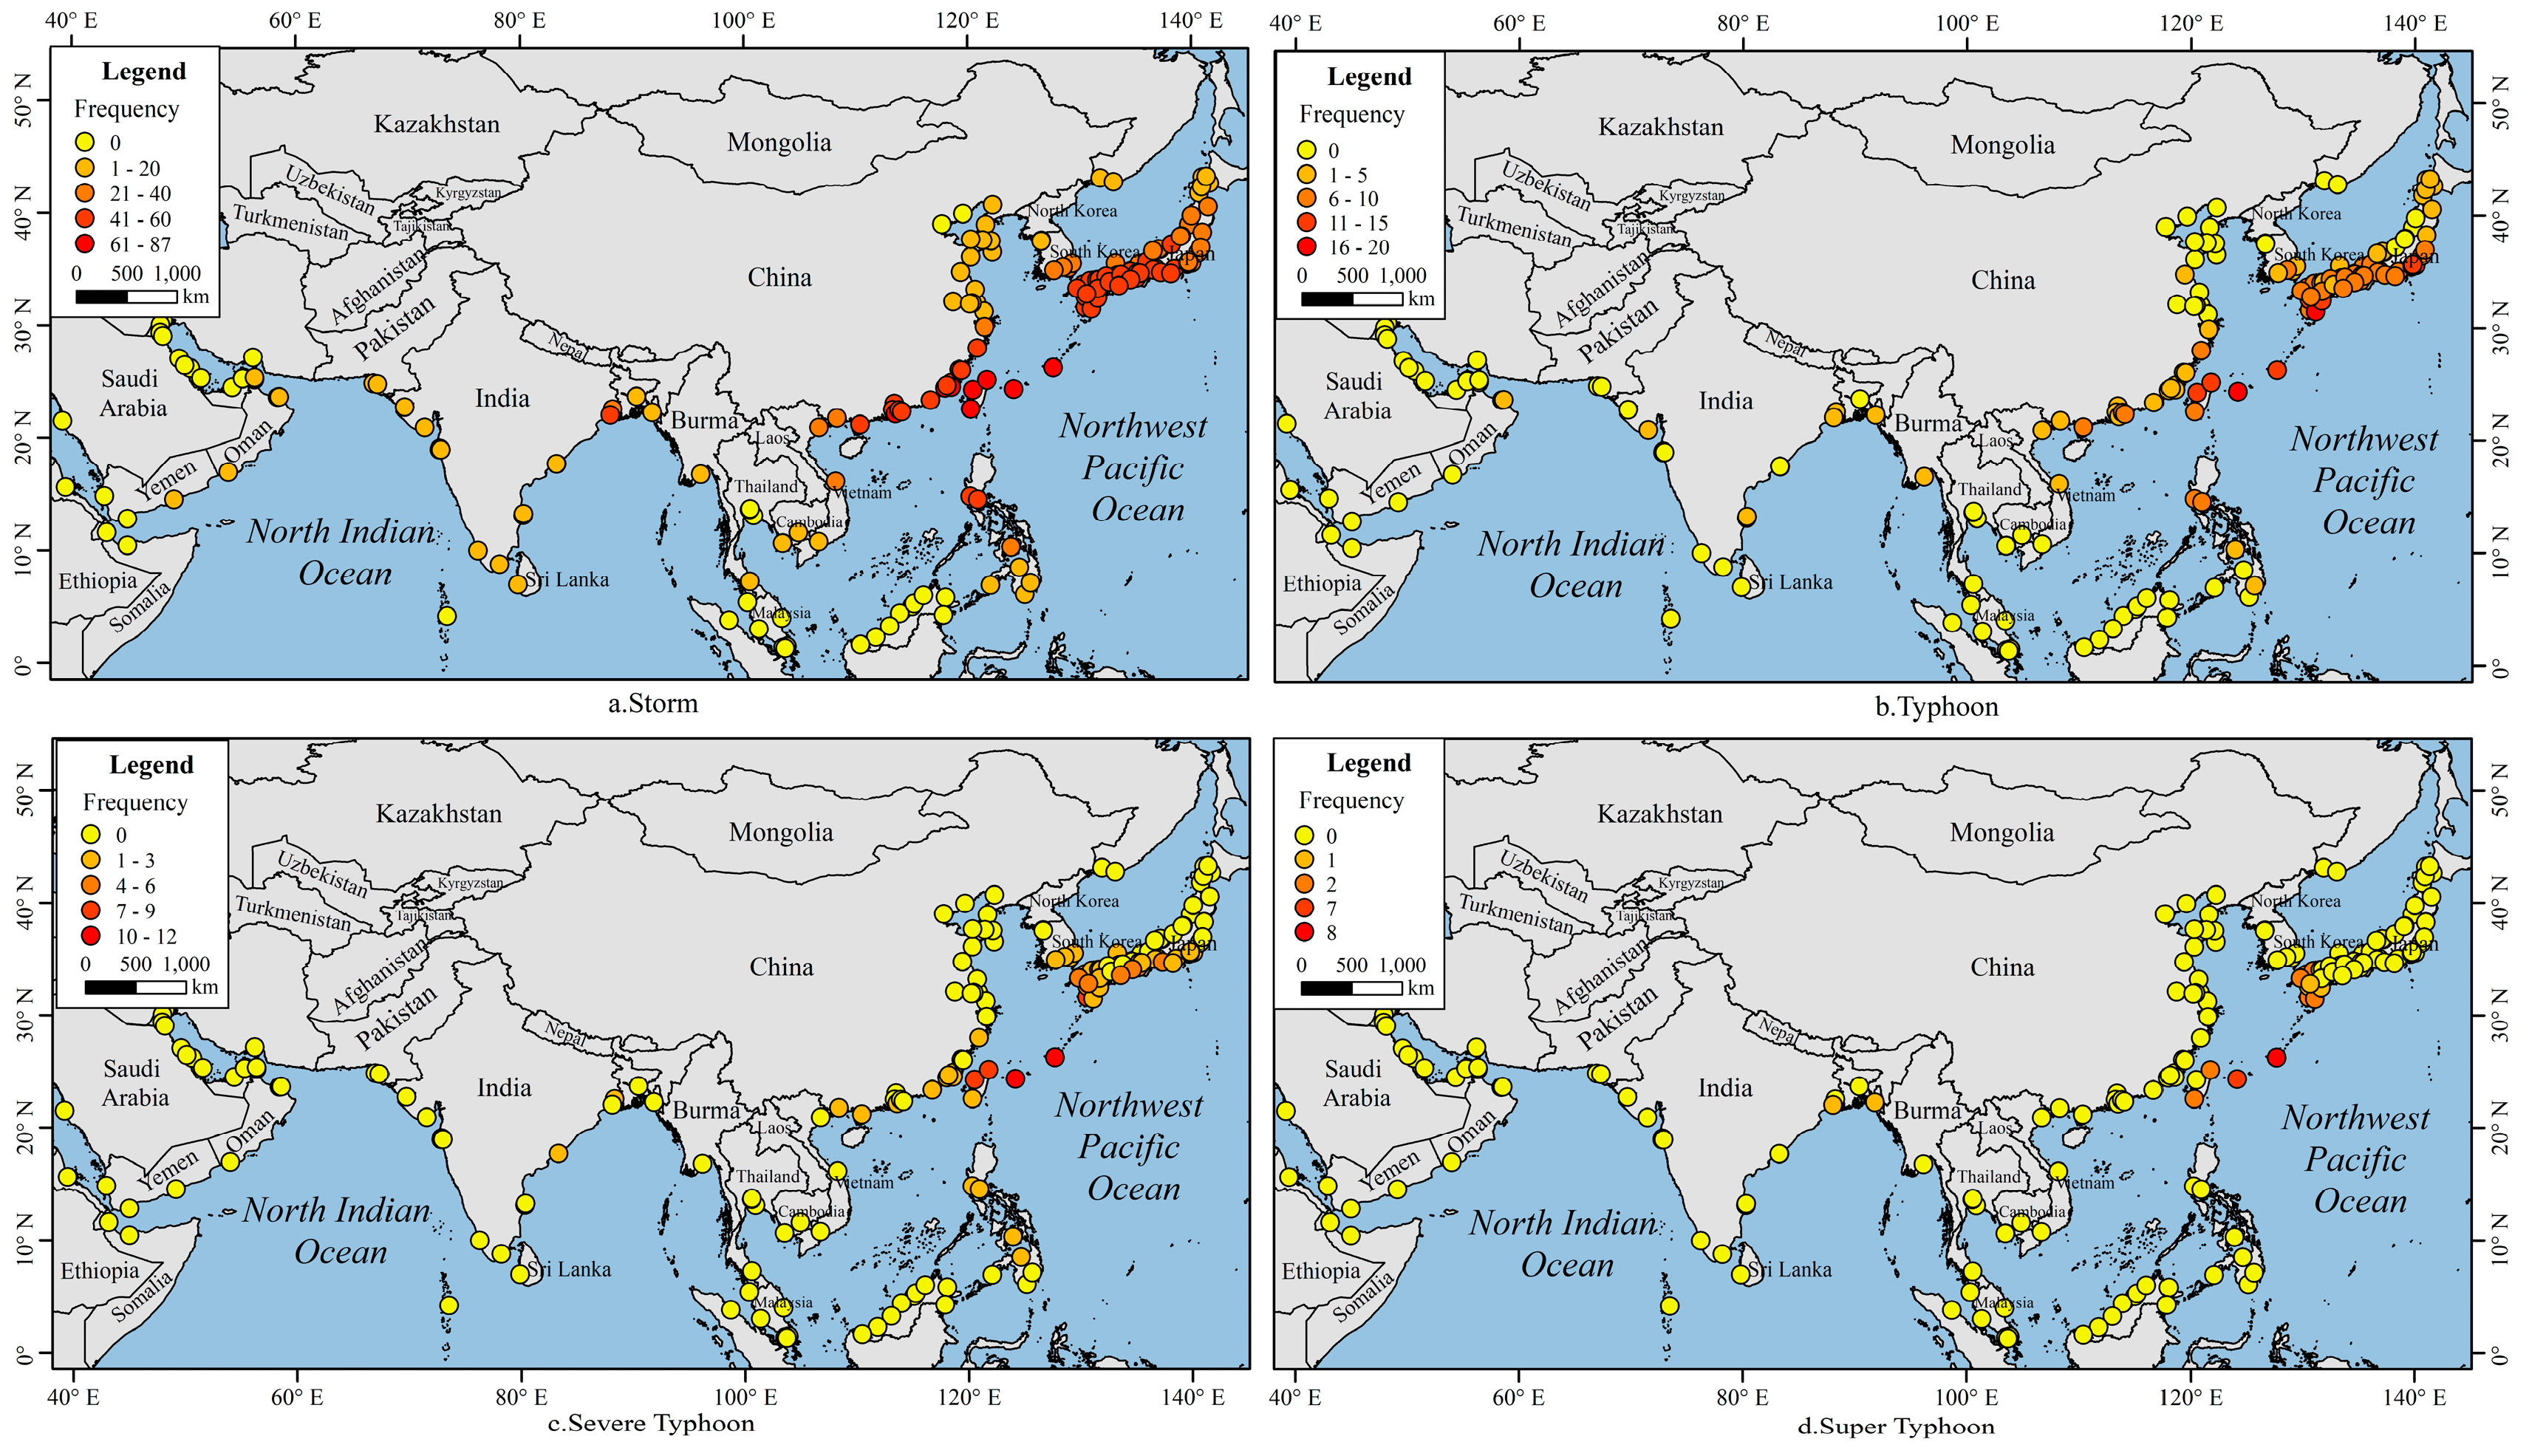
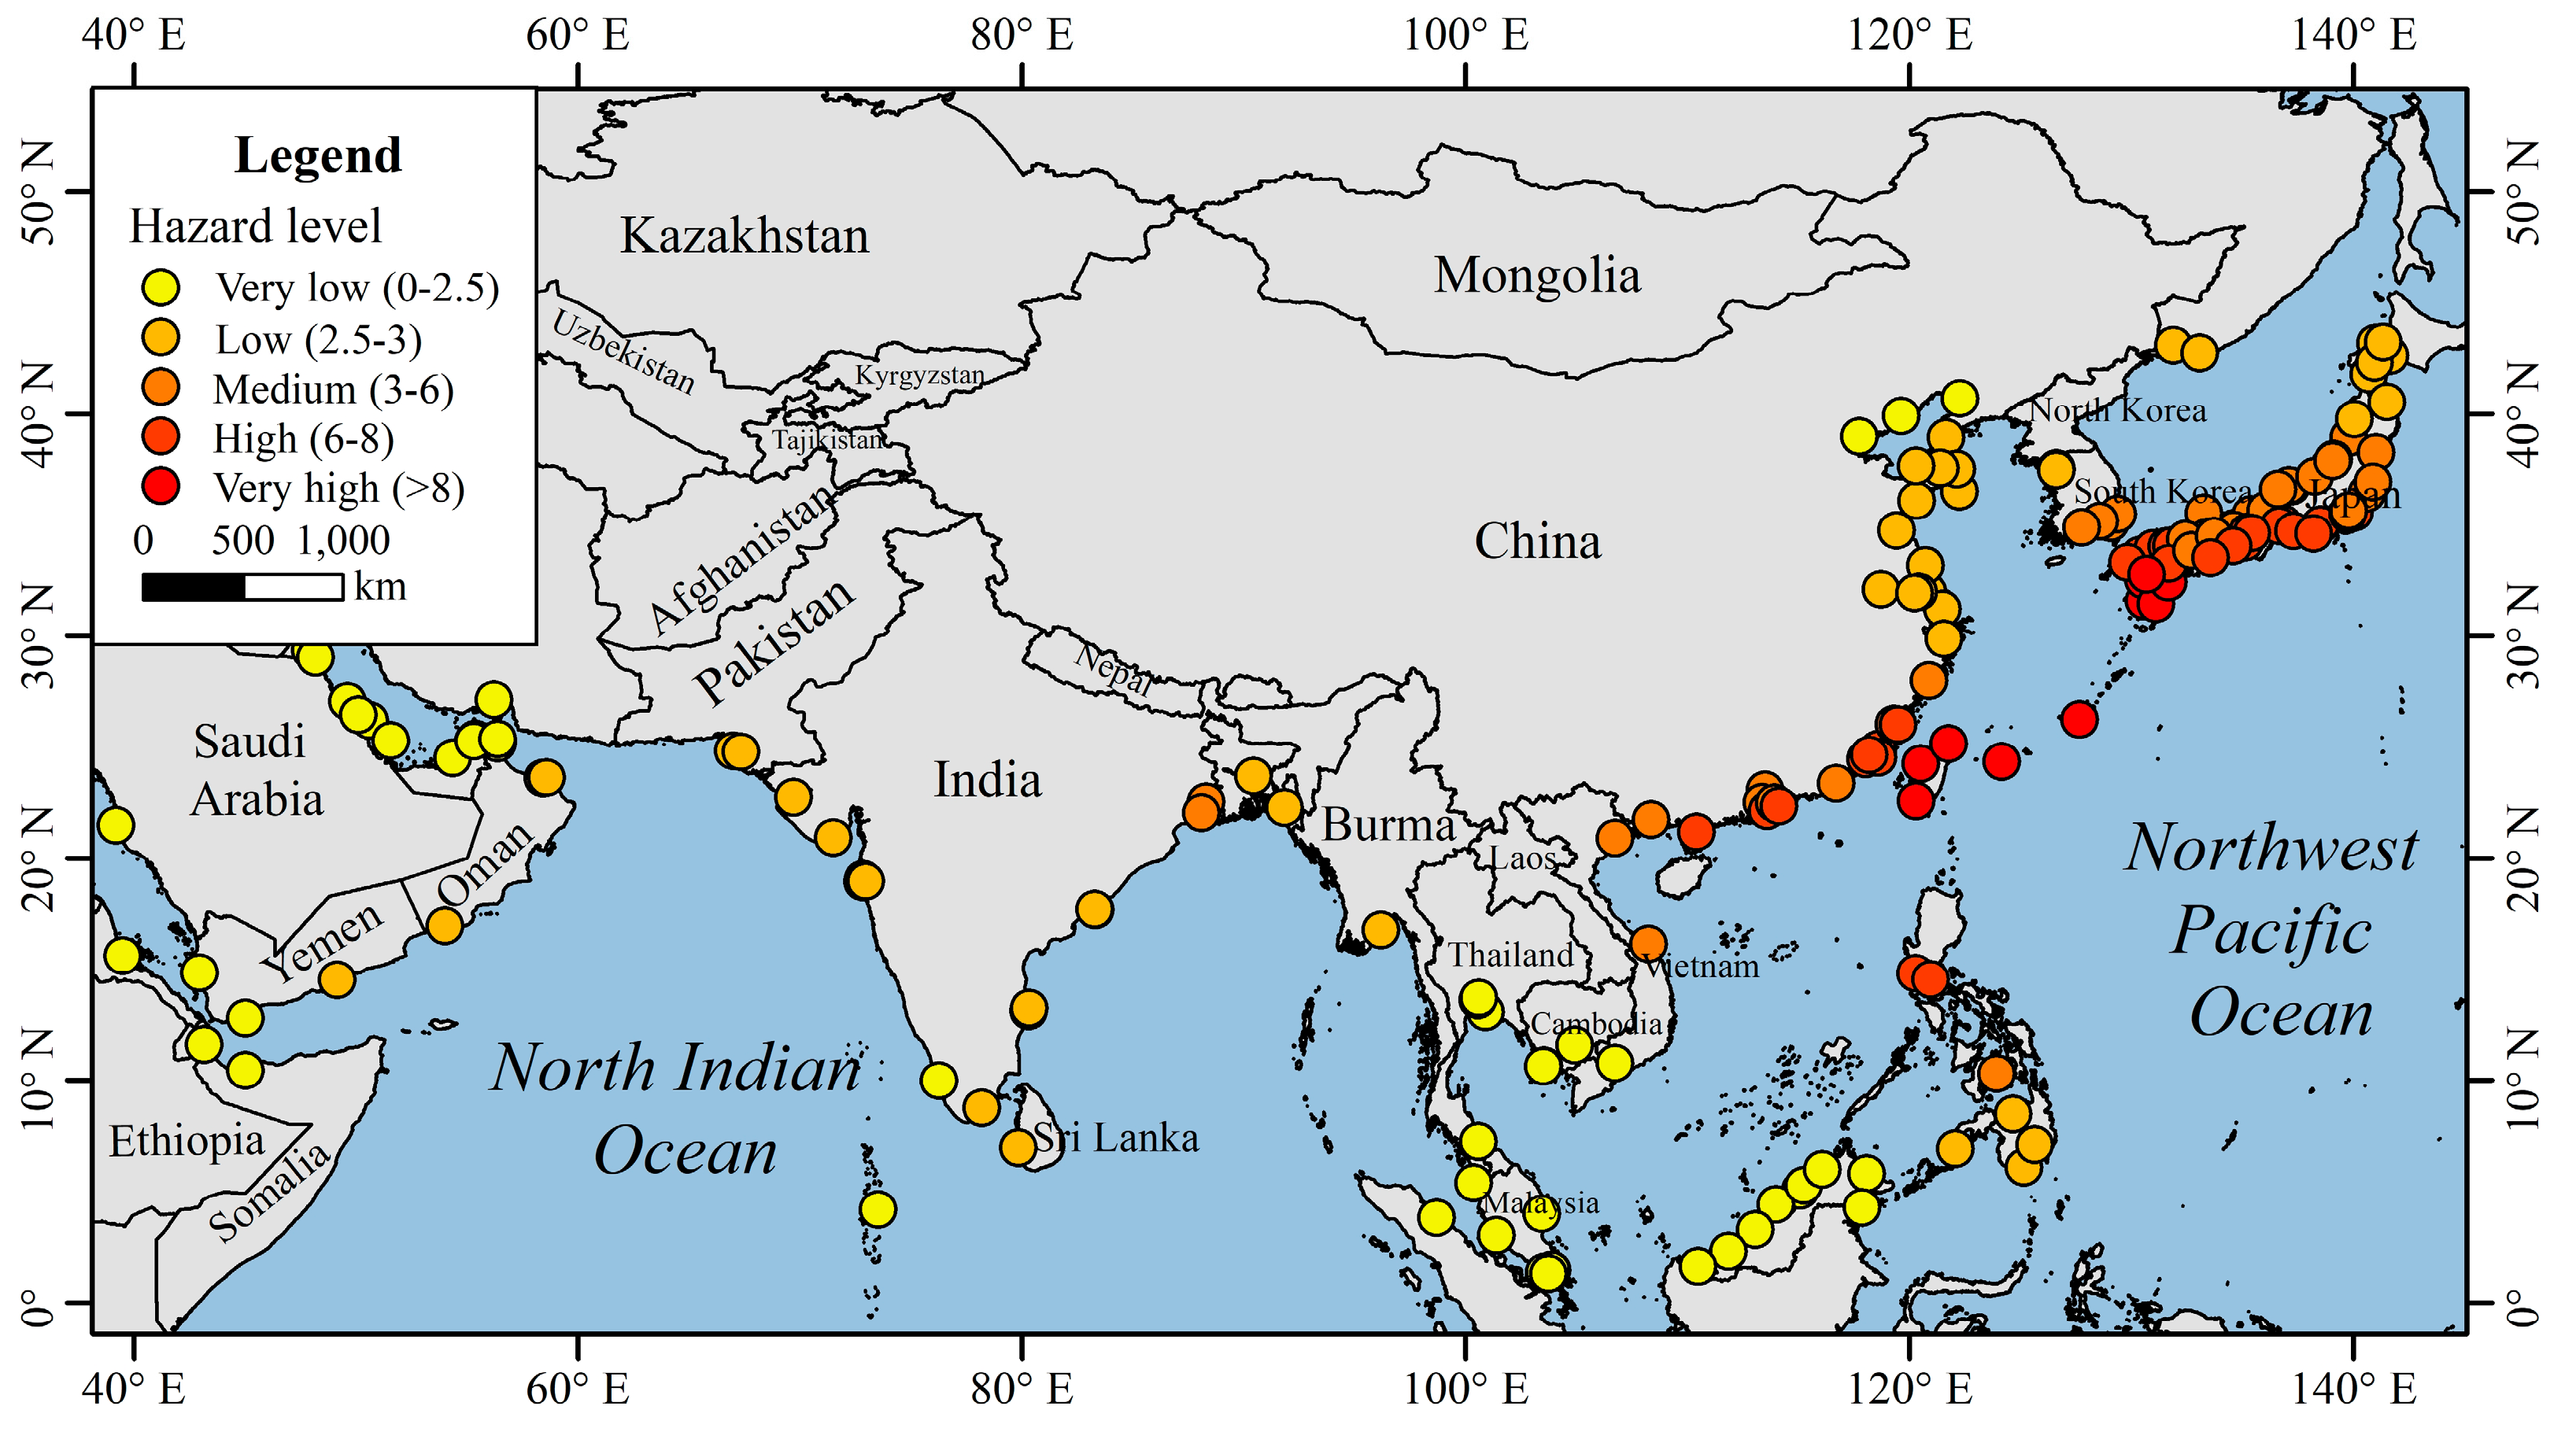
Because of the preconditions for the formation of tropical cyclones, such as sufficient convective energy and Coriolis force momentum, tropical cyclones have a clear latitudinal distribution. As Figure 4 shows, tropical cyclones mainly occurred at ports north of 5° N. Additionally, compared with the ports of the northern Indian Ocean, the frequency of tropical cyclones at ports in the Northwest Pacific is relatively high.
In our study, the tropical cyclone hazard index of a port is a function of the frequency of occurrence of tropical cyclones. As shown in Figure 5 and Table 3, the spatial distribution of the tropical cyclone hazard level at ports is similar to the spatial distribution of the tropical cyclone occurrence frequency. Twenty-eight percent of the ports have a very low hazard level, 27% have a low hazard level, 21% have a medium hazard level, 18% have a high hazard level, and only 6% have a very high hazard level. Thus, most of the ports have very low to medium hazard levels. The ports with very high hazard levels are located on the coasts of China and Japan between 20 and 30° N. The five ports with the highest hazard index values are Ishigaki, Naha, Keelung, Taichung, and Kaohsiung. Compared with the ports of the Northwest Pacific Ocean, the ports located on the coast of the northern Indian Ocean have relatively low hazard levels, and only two ports present medium hazard levels. Moreover, among the ports at the high hazard level, 26% are located in China, 68% are located in Japan, and only two ports are located in the Philippines.
3.3. Vulnerability Analysis
A tropical cyclone is a severe meteorological disaster that impacts coastal ports and destroys facilities. Ports are often closed during tropical cyclones. If a port is hit by a cyclone, the route to it will be closed, and the entire maritime network will experience a chain reaction. This study selects ports at the high or very high hazard levels as impacted points and then deletes them in intervals of 10% based on the total number of ports selected to analyze the vulnerability of the maritime network in the Northwest Pacific Ocean and the northern Indian Ocean. The total number of ports selected to be removed accounts for 24% of the ports in the maritime network. We find that after 70% of ports are removed, the network begins to be disrupted, and an isolated port appears, i.e., Honshu, which is located in Japan. Moreover, the port of Honshu is the only isolated port that appears in the node deletion process and other survived ports remain well connected by a subgraph.
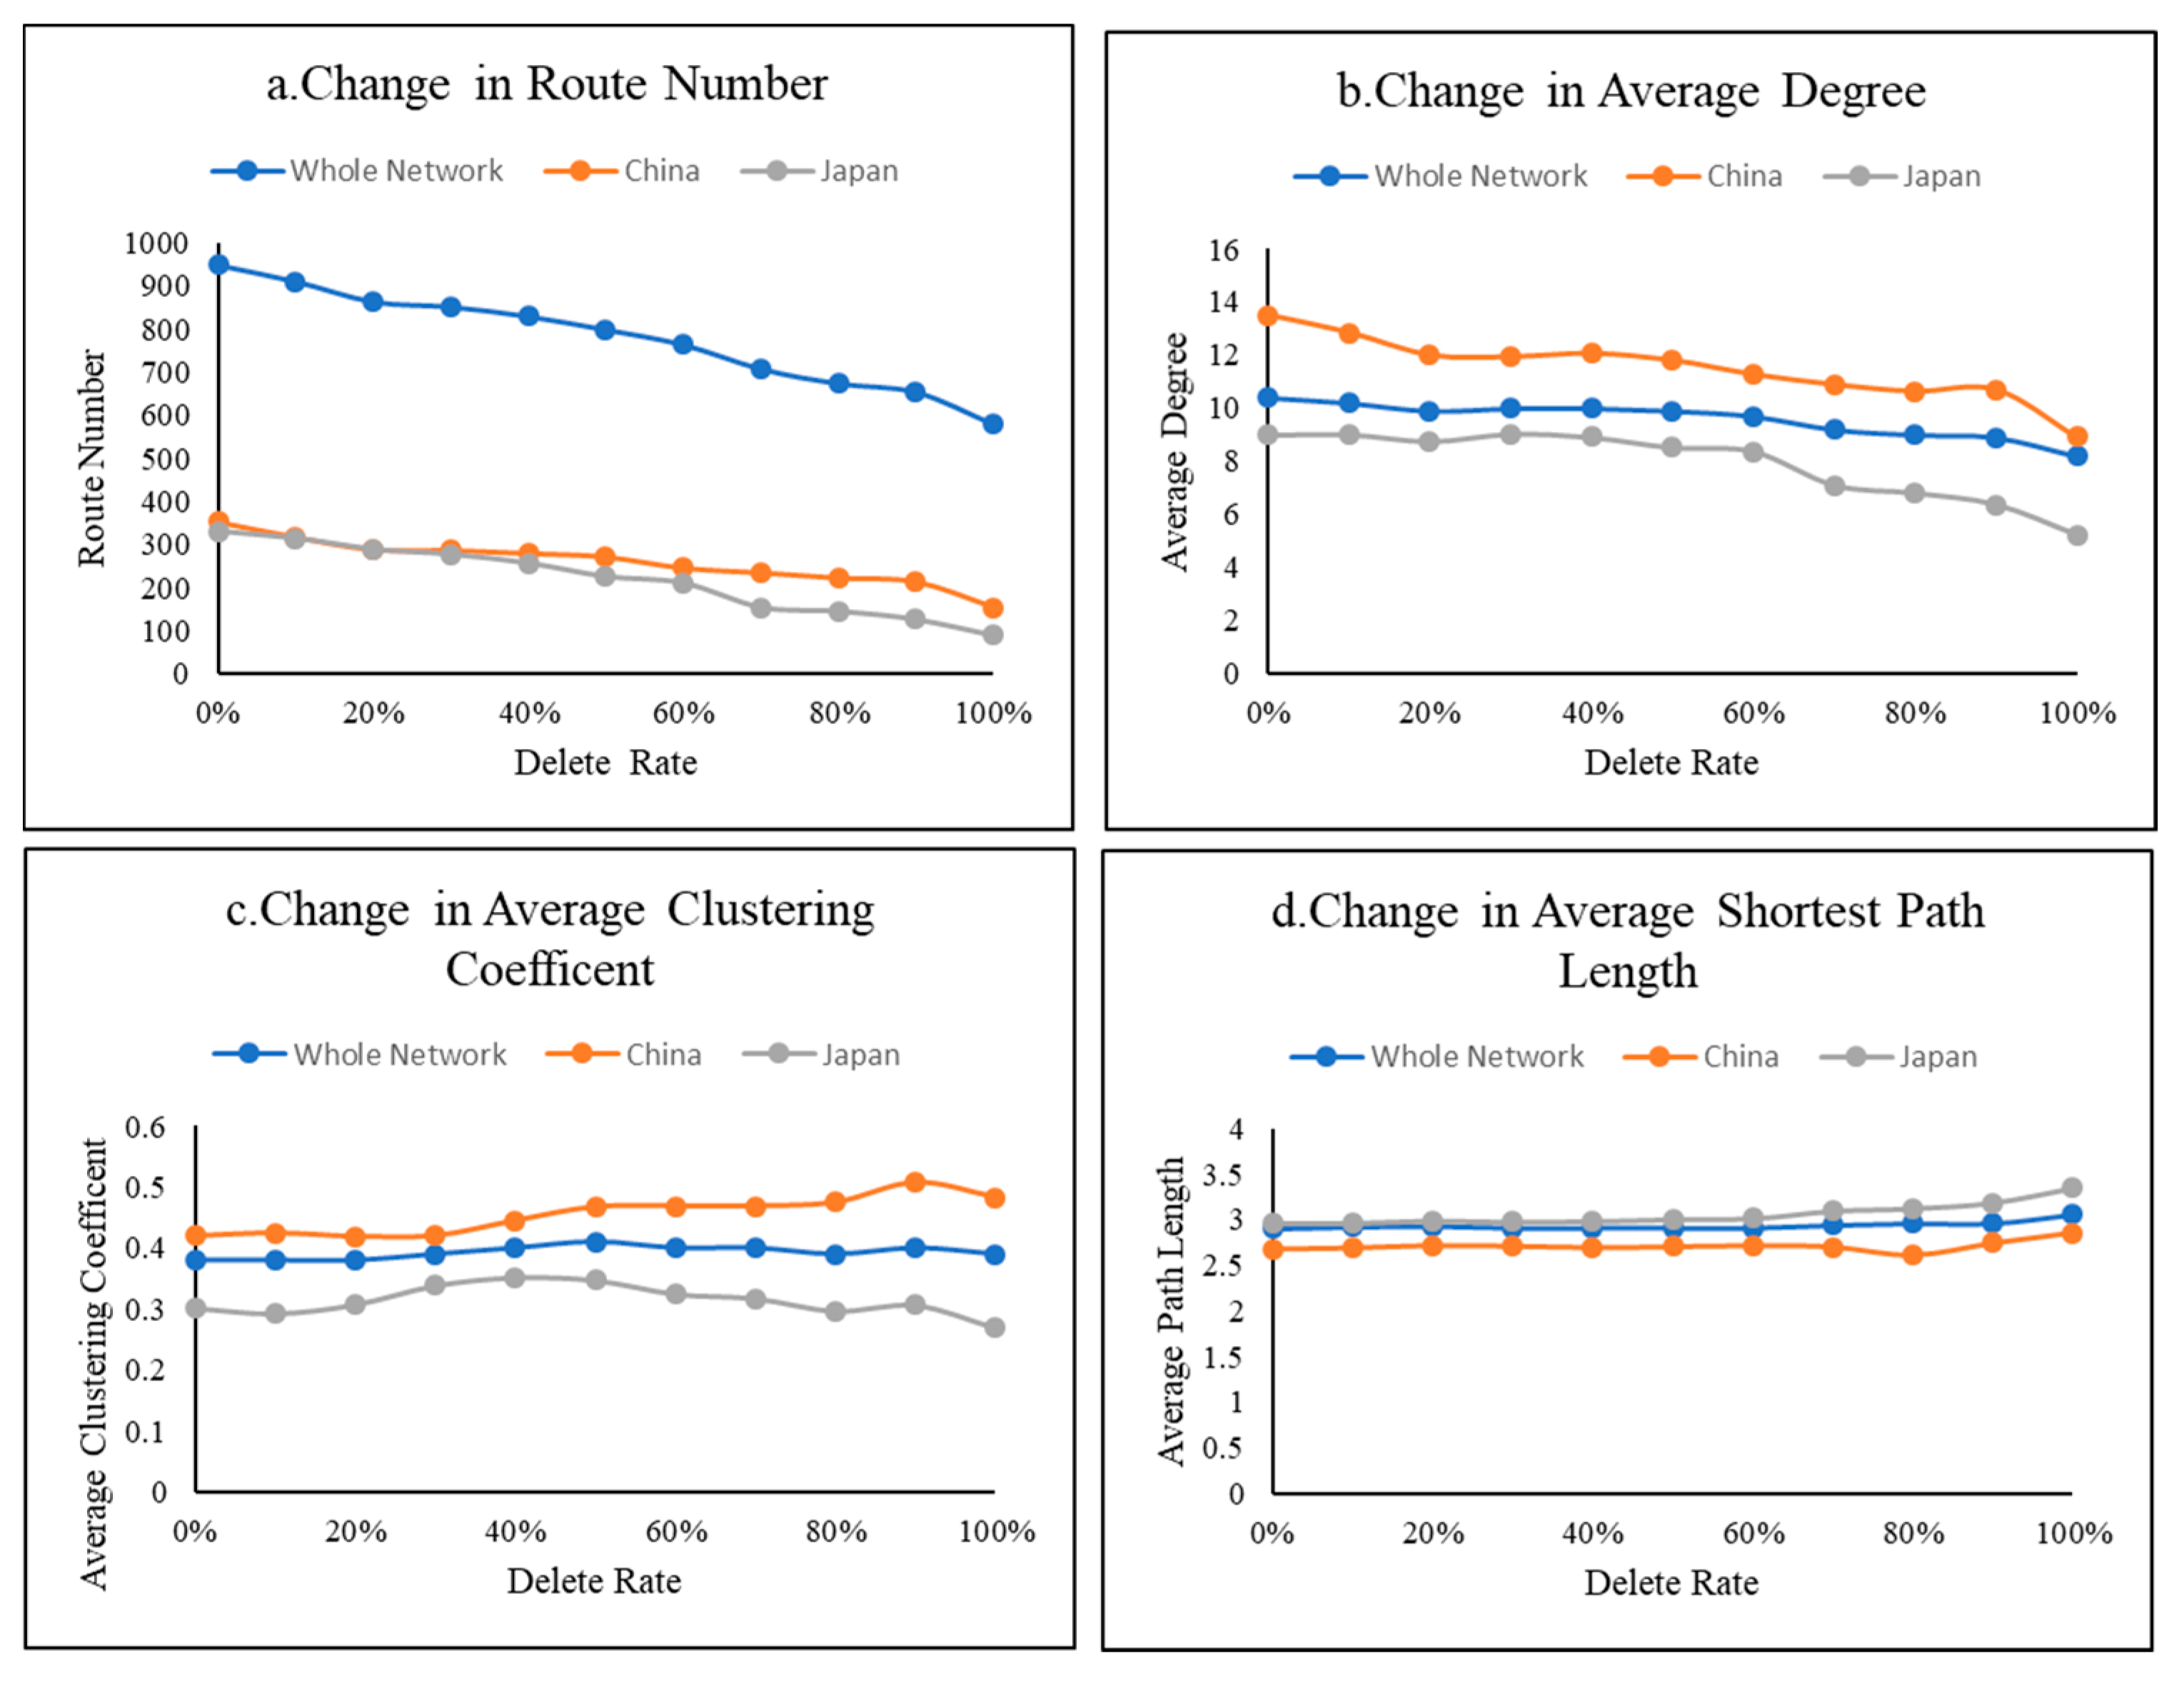
As Figure 6 shows, the average degree and number of routes decrease significantly as the ports with hazard levels greater than medium are gradually deleted. When all the selected ports are deleted (141 ports survived), the number of routes in the entire network decreases by approximately 39%, the average degree of the whole network decreases by approximately 21%, from 10.4 to 8.2, the average shortest path length of the network increases slightly, and changes in the average clustering coefficient are not obvious. These findings indicate that the connectivity of the network decreases but the shipping cost increases. Overall, the maritime network in the Northwest Pacific Ocean and northern Indian Ocean exhibits some vulnerability associated with the influence of tropical cyclones.
China and Japan are the two countries that are most seriously affected by tropical cyclones. Moreover, the two countries have an important position in the maritime network. As shown in Figure 6, the total number of routes of China and Japan accounts for 72% of the routes of the entire network. The trends in the network metrics for these two countries are similar to those for the entire network. In addition, the number of routes connected to China is higher than that for Japan. The average degree of Chinese ports is higher than that of the entire network, and the average degree of Japanese ports is lower than the average degree of the whole network. The average shortest path length for Japan is longer than that for the whole network, and the average shortest path length for China is shorter than that for the entire network. The average clustering coefficient for China is higher than that for the entire network, and the average clustering coefficient for Japan is lower than that for the entire network.
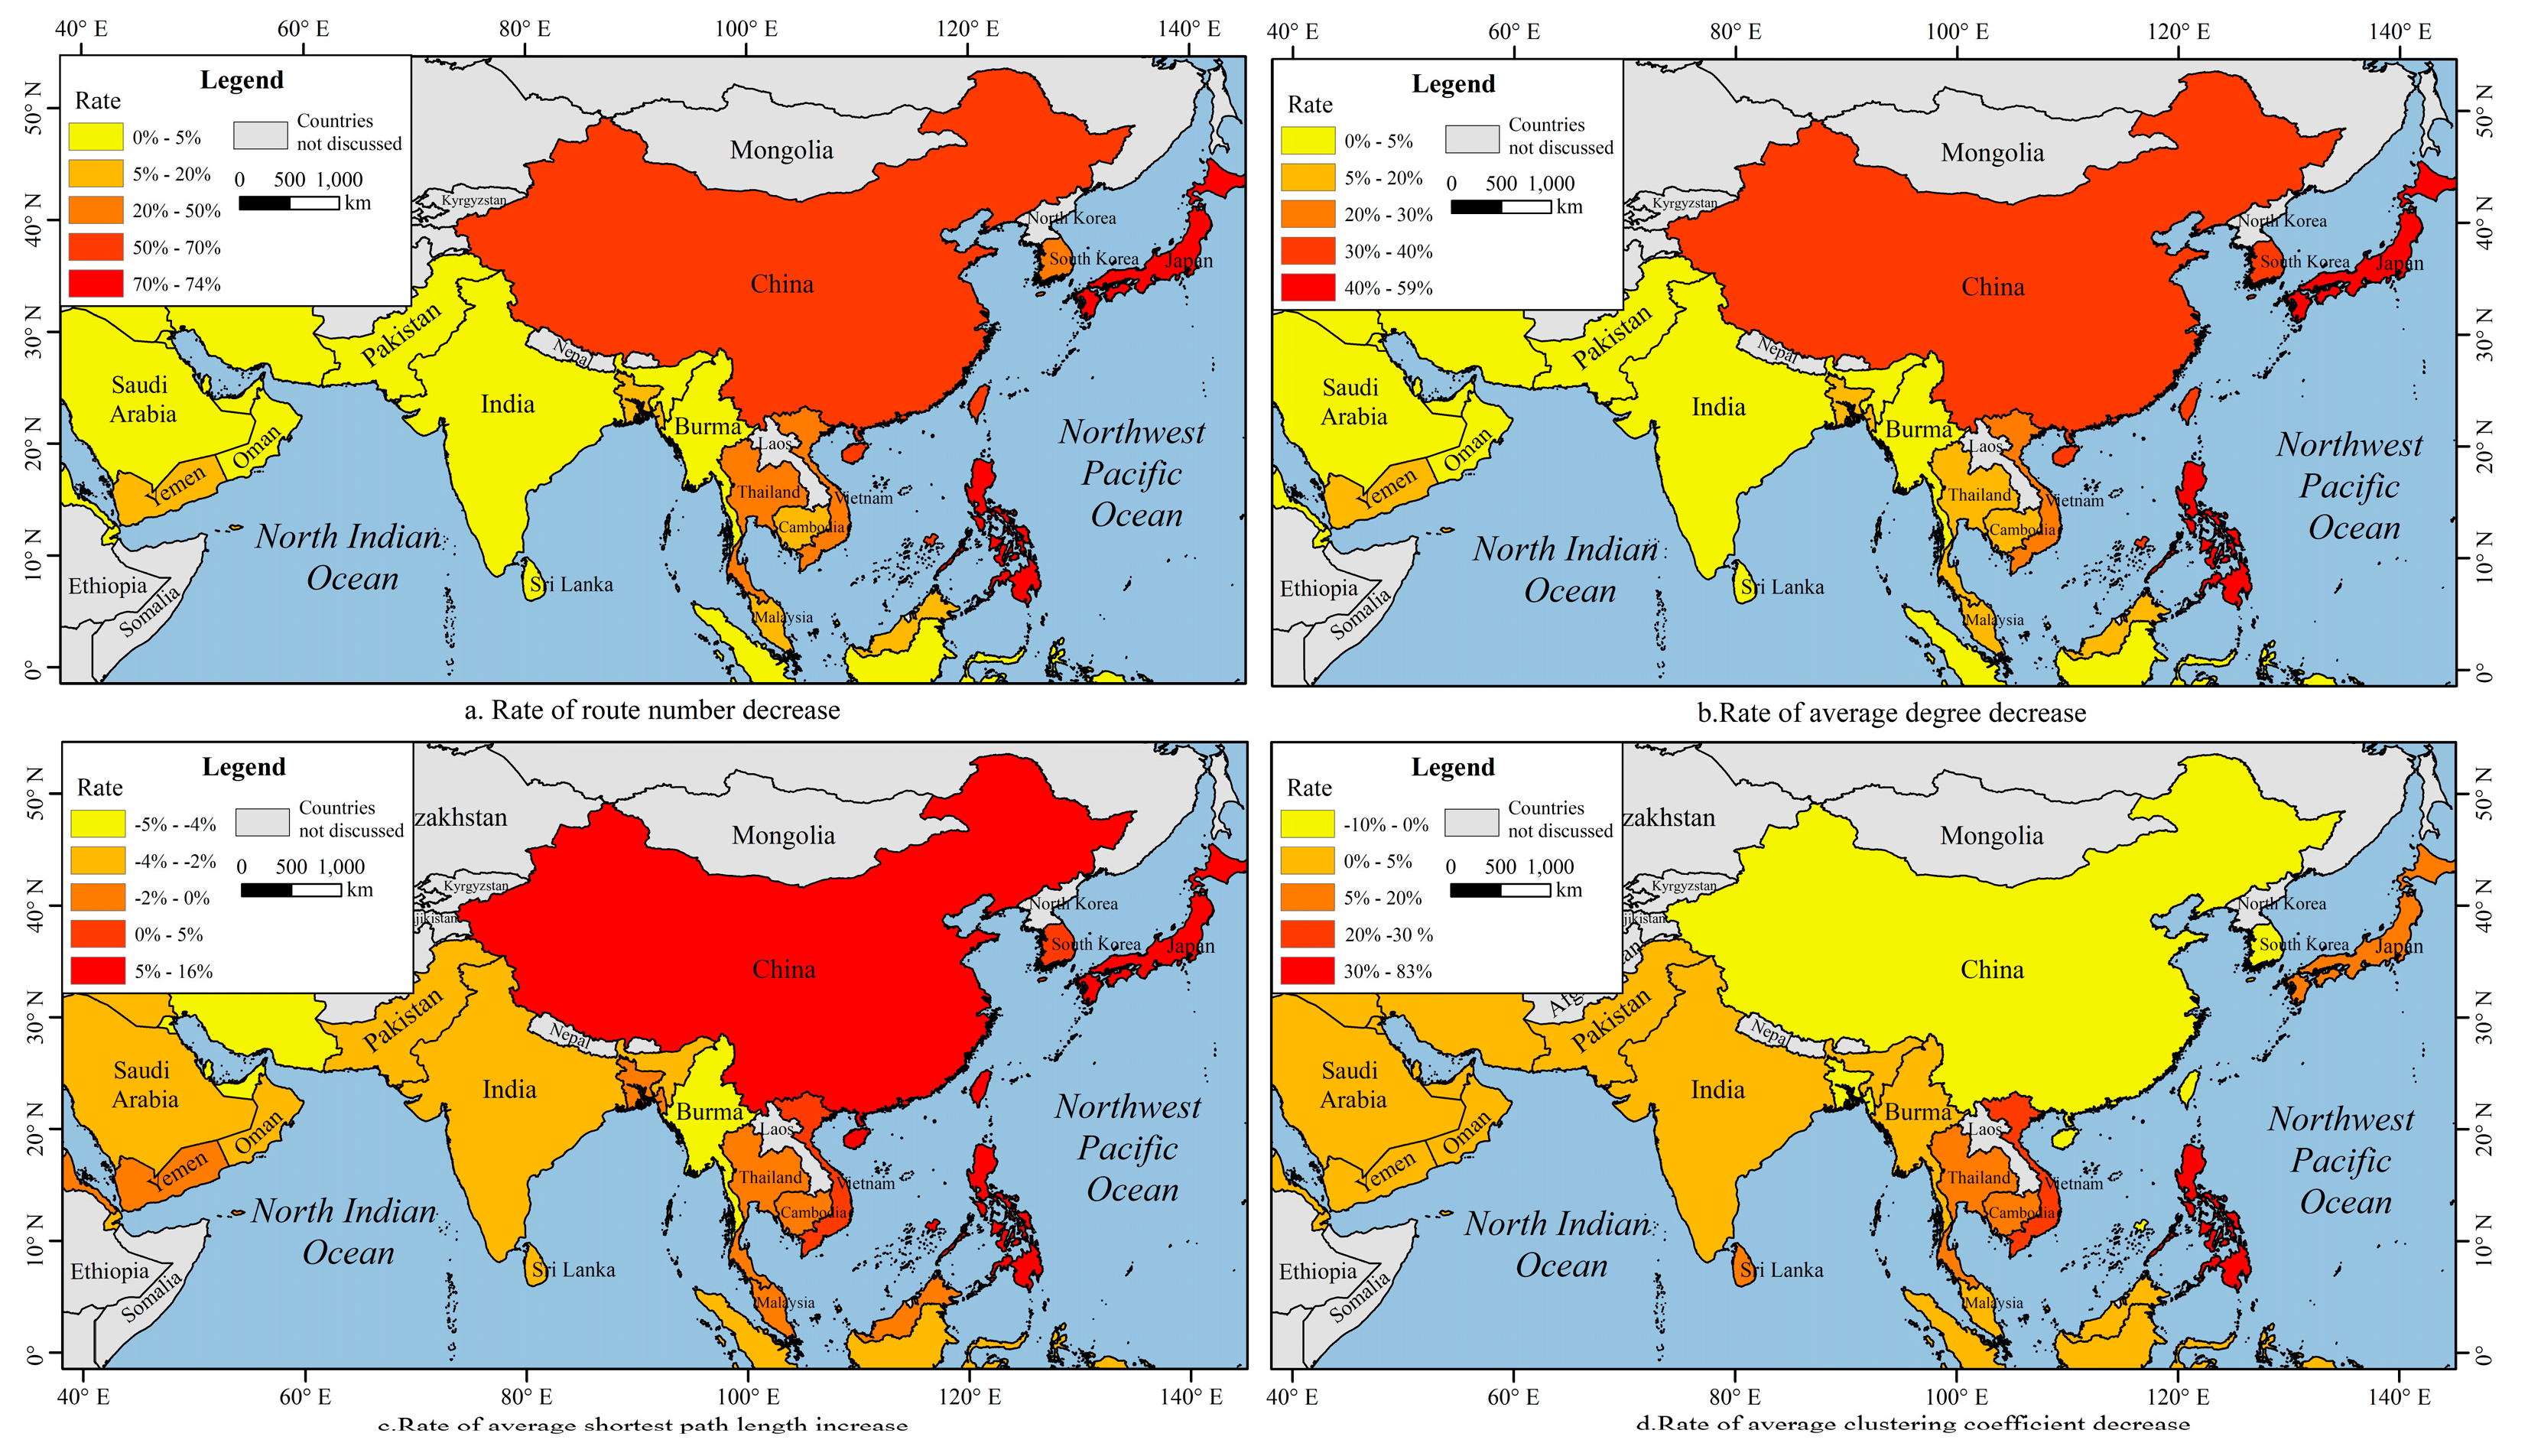
The network structure index changes for each country are shown in Figure 7 and Table 4, where 56% of the countries see a decrease in the number of routes. However, the rest of the countries exhibit no change in the number of routes, with the most of them bordering the northern Indian Ocean. The top three countries with highest route number decrease are Japan, China, and Korea, and the decreased route numbers are 240, 199, and 32, respectively. However, the top three countries with the highest rate of route number decrease are the Philippines, Japan, and China, and the rates are 74%, 73%, and 56%, respectively. For the average degree, the top three countries with the highest average degree decrease are Korea, China, and the Philippines, and the average degrees decreases are 5.3, 4.4, and 4.1, respectively. However, the top three countries with the highest rate of average degree decrease are the Philippines, Japan, and China, and the rates are 59%, 42%, and 33%, respectively.
According to Table 4, 18% of the countries see an increase in the average shortest path length and these countries are the Philippines, Japan, China, Korea, and Vietnam. The top three countries with the highest rate of average shortest path length increase are the Philippines, Japan, and China and the rates are 16%, 13%, and 6%, respectively. However, 70% of the countries exhibit increased average shortest path lengths increase, although the rates are less than 5%. This finding is mainly because many of the ports removed travel over long trans-shipment topological distances to reach ports in these countries. For the average clustering coefficient, the Philippines, Vietnam, Japan, and China exhibit obvious changes, and the rates of change of the average clustering coefficient are −89%, −23%, −13%, and 10%, respectively.
In general, from Table 4, the variations in the network metrics of the Philippines are the highest, even higher than those for Japan, mainly because the port of Manila in the Philippines is associated with a high tropical cyclone hazard level. When the port of Manila is impacted by a cyclone, the entire port system of the Philippines is affected. In addition to the Philippines, Japan, and China, the network metrics of Korea, Thailand, and Vietnam also exhibit notable changes, which means that the port systems of these countries are also easily affected by tropical cyclones.
4. Discussion
The degree distribution of ports in the maritime network that we studied follows a power law distribution, which means this network exhibits robustness under the random attacks and exhibits vulnerability under targeted attacks [30]. In our vulnerability analysis, we find that the maritime network in the Northwest Pacific Ocean and the northern Indian Ocean does not perform well under the influence of tropical cyclones and exhibits some vulnerability. However, we also find that only one port is isolated and other survived ports are connected well by the largest subgraph in our ports deletion process, which indicates that tropical cyclones do not have a significant influence on the interconnection of the survived ports. These results are similar to the findings of previous research [32].
As reported by the Clarkson Research Services (2014), traffic growth at global container ports has mainly occurred in East Asia since 2000 and is expected to continue increasing in this region. East Asia also has a dominant position in the maritime network of the Northwest Pacific Ocean and the northern Indian Ocean. However, East Asian nations have the most ports at relatively high tropical cyclone hazard levels, and if these ports are impacted by cyclones, then the individual port systems as well as the entire maritime network will be affected. Therefore, it is important for these nations to establish mechanisms for disaster prevention and reduction and take full advantage of the characteristics of multihub networks to reduce traffic pressure when tropical cyclones occur. Moreover, Japan and the Philippines are island countries, which means, maritime transport is especially important for these countries, which are severely affected by tropical cyclones. Although Japan is affected by tropical cyclones more severely, the port system of Japan is more dispersive than that of the Philippines, which not only helps Japan have a better performance when tropical cyclones occur but also eases the pressure and congestion on hub ports and achieves balanced city development [31].
In this study, we find that the network metrics of the countries bordering the northern Indian Ocean change less than those for countries bordering the Northwest Pacific based on the vulnerability analysis. This difference is mainly because all the ports we assessed with high hazard levels are located in coastal areas of the Northwest Pacific. As shipping is affected by marine geography, ships cannot sail at will, and most cross-regional routes require a transit step through certain straits. According to the sailing schedule data we used, we found that many shipping routes that connect the ports between the two oceans move through Singapore, Kelang, or other ports situated on the Strait of Malacca. However, there are six countries bordering the northern Indian Ocean that lose routes in our ports deletion process, including the United Arab Emirates, India, Saudi Arabia, Sri Lanka, Bangladesh, and Yemen. Most of the lost routes of these countries are direct connections to the port of Hong Kong. The port of Hong Kong is an international hub port that is not only important to regional logistics but also very important to cross-regional logistics [32]. With the implementation of China’s 21st Century Maritime Silk Road strategy and Guangdong-Hong Kong-Macao Greater Bay Area, the role of Hong Kong port in regional and international trade will be increasingly important. However, it is severely impacted by tropical cyclones. Moreover, climate change is likely to heighten the ferocity of future tropical cyclones [8,9]. Although Hong Kong has a protective system of defenses to weather tropical cyclones, these defenses need continuing evolvement [33].
Industry stakeholders, such as shippers, will suffer economic losses because of port disruption. The losses to the shippers consist of two parts, that is, the cost of inventory and the time value of money. The cost of inventory refers to the costs related to storing and maintaining the goods that are transported. The time value of money describes the purchasing power of money available at the present time, which can increase in the future due to its potential earning power [7]. Therefore, the shippers should choose the port that offers essential coordination and ship re-routing plans if this port is disrupted by tropical cyclones.
This article has certain limitations. For example, we considered only the tropical cyclones hazard level as indicator to determine the ports that will easily fail. Further studies will consider the ability of each port for tropical cyclone prevention, such as the number of shelters and protection structures. Moreover, if possible, further studies will use automatic identification system (AIS) data to construct a more intact maritime network in the Northwest Pacific and the northern Indian Ocean [34]. Finally, some particular ports may have necessary coordination and ship re-routing plans after port disruption occurs. These are not considered in the present study. However, this study is meaningful, and the overall results are consistent with the status quo.
5. Conclusions
This paper focuses on the maritime network in the Northwest Pacific and the northern Indian Ocean and applies complex network theory to obtain the structural characteristics of the network. Ports with high tropical cyclone hazard index values were then deleted to analyze the vulnerability of the maritime network to the influence of tropical cyclones. The key conclusions can be summarized as follows.
First, the maritime network has small-world characteristics and the degree distribution of ports follow a power law distribution. The tropical cyclone occurrence frequency and hazard levels of ports in the maritime network exhibit obvious regional differences. The ports in East Asia are impacted more severely by tropical cyclones. Moreover, among the ports at the high hazard level, the port of Hong Kong is the hub port that has an increasingly important role both in regional and cross-regional logistics. Continuing evolvement in the tropical cyclones defenses is vitally important for Hong Kong.
Second, the maritime network in the Northwest Pacific and northern Indian Ocean exhibits some vulnerability to the influence of tropical cyclones. Although a significant connectivity decline is observed when the network is attacked by tropical cyclones, the interconnection of the survived ports is not severely impacted.
Third, China and Japan are the two countries impacted most by tropical cyclones, and many ports in these two countries have high or very high hazard levels. However, the port system in the Philippines is most vulnerable to the influence of tropical cyclones, followed by the ports system in Japan and China. These three countries should establish mechanisms for tropical cyclone prevention. Moreover, the Philippines should establish a more even and more dispersed port system, such as that observed in Japan, which benefits disaster prevention and improves the city development balance.
Author Contributions
Data curation, J.L. and S.W.; writing—original draft, Z.S.; writing—review & editing, X.X.
Funding
This research was supported and funded by the Strategic Priority Research Program of the Chinese Academy of Sciences (Grant No. XDA20010302).
Conflicts of Interest
The authors declare no conflicts of interest.
References
- Li, Z.; Xu, M.; Shi, Y. Centrality in global shipping network basing on worldwide shipping areas. GeoJournal 2015, 80, 47–60. [Google Scholar] [CrossRef]
- Mou, N.; Liu, C.; Zhang, L.; Fu, X.; Xie, Y.; Li, Y.; Peng, P. Spatial pattern and regional relevance analysis of the maritime silk road shipping network. Sustainability 2018, 10, 977. [Google Scholar] [CrossRef]
- Jiang, J.; Lee, L.H.; Chew, E.P.; Gan, C.C. Port connectivity study: An analysis framework from a global container liner shipping network perspective. Transport. Res. Part E Log. Transp. Rev. 2015, 73, 47–64. [Google Scholar] [CrossRef]
- Choi, J.-W.; Cha, Y.; Kim, H.-D.; Kang, S.-D. Latitudinal change of tropical cyclone maximum intensity in the western North Pacific. Adv. Meteorol. 2016, 2016, 5829162. [Google Scholar] [CrossRef]
- Lam, J.S.L.; Liu, C.; Gou, X. Cyclone risk mapping for critical coastal infrastructure: Cases of East Asian seaports. Ocean Coast. Manag. 2017, 141, 43–54. [Google Scholar] [CrossRef]
- Tajima, Y.; Lapidez, J.P.; Camelo, J.; Saito, M.; Matsuba, Y.; Shimozono, T.; Bautista, D.; Turiano, M.; Cruz, E. Post-disaster survey of storm surge and waves along the coast of Batanes, the Philippines, caused by Super Typhoon Meranti/Ferdie. Coast. Eng. J. 2017, 59, 1750009. [Google Scholar] [CrossRef]
- Zhang, Y.; Lam, J.S.L. Estimating the economic losses of port disruption due to extreme wind events. Ocean Coast. Manag. 2015, 116, 300–310. [Google Scholar] [CrossRef]
- Webster, P.J.; Holland, G.J.; Curry, J.A.; Chang, H.-R. Changes in tropical cyclone number, duration, and intensity in a warming environment. Science 2005, 309, 1844–1846. [Google Scholar] [CrossRef]
- Emanuel, K. Increasing destructiveness of tropical cyclones over the past 30 years. Nature 2005, 436, 686–688. [Google Scholar] [CrossRef]
- Lam, J.S.L.; Lassa, J.A. Risk assessment framework for exposure of cargo and ports to natural hazards and climate extremes. Marit. Policy Manag. 2017, 44, 1–15. [Google Scholar] [CrossRef]
- Fang, Z.; Yu, H.; Huang, S. Review of research works on maritime network. Geo Inf. Sci. 2018, 20, 554–563. [Google Scholar]
- Tavasszy, L.; Minderhoud, M.; Perrin, J.-F.; Notteboom, T. A strategic network choice model for global container flows: Specification, estimation and application. J. Transp. Geogr. 2011, 19, 1163–1172. [Google Scholar] [CrossRef]
- Ducruet, C. Network diversity and maritime flows. J. Transp. Geogr. 2013, 30, 77–88. [Google Scholar] [CrossRef] [Green Version]
- Ducruet, C.; Lee, S.-W.; Ng, A.K. Centrality and vulnerability in liner shipping networks: Revisiting the Northeast Asian port hierarchy. Marit. Policy Manag. 2010, 37, 17–36. [Google Scholar] [CrossRef]
- Ducruet, C.; Notteboom, T. The worldwide maritime network of container shipping: Spatial structure and regional dynamics. Glob. Netw. 2012, 12, 395–423. [Google Scholar] [CrossRef]
- Kaluza, P.; Kölzsch, A.; Gastner, M.T.; Blasius, B. The complex network of global cargo ship movements. J. R. Soc. Interface 2010, 7, 1093–1103. [Google Scholar] [CrossRef]
- Fang, Z.; Yu, H.; Lu, F.; Feng, M.; Huang, M. Maritime network dynamics before and after international events. J. Geogr. Sci. 2018, 28, 937–956. [Google Scholar] [CrossRef] [Green Version]
- Laxe, F.G.; Seoane, M.J.F.; Montes, C.P. Maritime degree, centrality and vulnerability: Port hierarchies and emerging areas in containerized transport (2008–2010). J. Transp. Geogr. 2012, 24, 33–44. [Google Scholar] [CrossRef]
- Wang, N.; Wu, N.; Dong, L.L.; Yan, H.K.; Wu, D. A study of the temporal robustness of the growing global container-shipping network. Sci. Rep. 2016, 6, 34217. [Google Scholar] [CrossRef]
- Peng, P.; Cheng, S.; Liu, X.; Mei, Q.; Feng, L.U. The robustness evaluation of global maritime transportation networks. Acta Geogr. Sin. 2017, 72, 2241–2251. [Google Scholar]
- Tropical Cyclone Programme. Available online: https://www.wmo.int/pages/prog/www/tcp/Advisories-RSMCs.html (accessed on 1 April 2019).
- China Ports. Available online: http://www.chinaports.com/en/index (accessed on 1 April 2019).
- Calcaterra, D.; Parise, M.; Palma, B. Combining historical and geological data for the assessment of the landslide hazard: A case study from Campania, Italy. Nat. Hazards Earth Syst. Sci. 2003, 3, 3–16. [Google Scholar] [CrossRef]
- Lin, L.; Tseng, C. Operational performance evaluation of major container ports in the Asia-Pacific region. Marit. Policy Manag. 2007, 34, 535–551. [Google Scholar] [CrossRef]
- Mohapatra, M.; Tyagi, A. Best track parameters of tropical cyclones over the North Indian Ocean: A review. Nat. Hazards 2012, 63, 1285–1317. [Google Scholar] [CrossRef]
- Das, Y. Parametric modeling of tropical cyclone wind fields in India. Nat. Hazards 2018, 93, 1049–1084. [Google Scholar] [CrossRef]
- Holland, G.J.; Belanger, J.I.; Fritz, A. A revised model for radial profiles of hurricane winds. Mon. Weather Rev. 2010, 138, 4393–4401. [Google Scholar] [CrossRef]
- Takagi, H.; Wu, W.J. Maximum wind radius estimated by the 50 kt radius: Improvement of storm surge forecasting over the western North Pacific. Nat. Hazard. Earth Syst. Sci. 2016, 16, 705–717. [Google Scholar] [CrossRef]
- Phadke, A.C.; Martino, C.D.; Cheung, K.F.; Houston, S.H. Modeling of tropical cyclone winds and waves for emergency management. Ocean Eng. 2003, 30, 553–578. [Google Scholar] [CrossRef]
- Peng, P.; Yang, Y.; Cheng, S.F.; Lu, F.; Yuan, Z.M. Hub-and-spoke structure: Characterizing the global crude oil transport network with mass vessel trajectories. Energy 2019, 168, 966–974. [Google Scholar] [CrossRef]
- Guo, J.; Wang, S.; Wang, D.; Liu, T. Spatial structural pattern and vulnerability of China-Japan-Korea shipping network. Chin. Geogr. Sci. 2017, 27, 697–708. [Google Scholar] [CrossRef]
- Wu, D.; Wang, N.; Yu, A. Vulnerability and risk management in the Maritime Silk Road container shipping network. Acta Geogr. Sin. 2018, 73, 1133–1148. [Google Scholar]
- Yang, Z.; Xiu, Q.; Chen, D. Historical changes in the port and shipping industry in Hong Kong and the underlying policies. Transp. Policy 2019, 82, 138–147. [Google Scholar] [CrossRef]
- Viljoen, N.M.; Joubert, J.W. The vulnerability of the global container shipping network to targeted link disruption. Phys. A Stat. Mech. Appl. 2016, 462, 396–409. [Google Scholar] [CrossRef] [Green Version]
Figure 1.
Spatial distribution of the maritime network structural characteristics for each port.

Figure 2.
Degree probability distribution of maritime network nodes.

Figure 3.
Relation between degree and clustering coefficient.

Figure 4.
Frequency of occurrence of four grades of tropical cyclones between 1990 and 2017.

Figure 5.
Spatial distribution of the tropical cyclone hazard levels of ports.

Figure 6.
Changes in network metrics.

Figure 7.
The rate of network metrics change.


Table 1.
Tropical cyclone classification.
| Grade | Classification | Wind Speed (m/s) | Beaufort Level |
|---|---|---|---|
| 1 | Tropical storm | 17.2–32.6 | 8–11 |
| 2 | Typhoon | 32.7–41.4 | 12–13 |
| 3 | Severe typhoon | 41.5–50.9 | 14–15 |
| 4 | Super typhoon | ≥51 | ≥16 |
Table 2.
Ports with the 10 highest degree values.
| Port | Country | Degree |
|---|---|---|
| Shanghai | China | 55 |
| Busan | South Korea | 53 |
| Hong Kong | China | 50 |
| Singapore | Singapore | 49 |
| Ningbo | China | 41 |
| Kelang | Malaysia | 40 |
| Shenzhen | China | 37 |
| Kaohsiung | China | 30 |
| Kobe | Japan | 30 |
| Dubai | United Arab Emirates | 30 |
Table 3.
The count and proportion of the ports with different tropical cyclone hazard levels.
| Hazard Level | Count | Proportion |
|---|---|---|
| Very low | 52 | 28% |
| Low | 50 | 27% |
| Medium | 39 | 21% |
| High | 31 | 18% |
| Very high | 10 | 6% |
Table 4.
Changes in the network metrics for each country after all ports with hazard levels greater than medium are removed.
Table 4.
Changes in the network metrics for each country after all ports with hazard levels greater than medium are removed.
| Country | Route Number | Average Degree | Average Shortest Path Length | Average Clustering Coefficient | ||||
|---|---|---|---|---|---|---|---|---|
| Value | Rate | Value | Rate | Value | Rate | Value | Rate | |
| Bahrain | 0 | 0% | 0 | 0% | −0.1 | −3% | 0 | 0% |
| Bangladesh | −1 | −5% | −0.5 | −5% | −0.04 | −1% | 0.02 | 4% |
| Burma | 0 | 0% | 0 | 0% | −0.11 | −4% | 0 | 0% |
| Cambodia | −1 | −8% | −0.3 | −6% | −0.02 | −1% | −0.01 | −8% |
| China | −198 | −56% | −4.4 | −33% | 0.17 | 6% | 0.04 | 10% |
| Djibouti | 0 | 0% | 0 | 0% | −0.08 | −3% | 0 | 0% |
| Eritrea | 0 | 0% | 0 | 0% | 0.02 | 0% | 0 | 0% |
| India | −3 | −3% | −0.2 | −2% | −0.06 | −2% | 0 | 0% |
| Indonesia | 0 | 0% | 0 | 0% | −0.08 | −3% | 0 | 0% |
| Iran | 0 | 0% | 0 | 0% | −0.13 | −4% | 0 | 0% |
| Iraq | 0 | 0% | 0 | 0% | −0.1 | −3% | 0 | 0% |
| Japan | −240 | −73% | −3.8 | −42% | 0.38 | 13% | −0.04 | −13% |
| Korea | −32 | −36% | −5.3 | −33% | 0.12 | 5% | 0.03 | 4% |
| Kuwait | 0 | 0% | 0 | 0% | −0.14 | −4% | 0 | 0% |
| Malaysia | −11 | −10% | −0.7 | −7% | 0 | 0% | −0.01 | −3% |
| Maldives | 0 | 0% | 0 | 0% | −0.04 | −1% | 0 | 0% |
| Oman | 0 | 0% | 0 | 0% | −0.11 | −3% | 0 | 0% |
| Pakistan | 0 | 0% | 0 | 0% | −0.07 | −3% | 0 | 0% |
| Philippines | −29 | −74% | −4.1 | −59% | 0.5 | 16% | −0.17 | −89% |
| Qatar | 0 | 0% | 0 | 0% | −0.14 | −5% | 0 | 0% |
| Saudi Arabia | −1 | −3% | −0.5 | −3% | −0.07 | −3% | −0.01 | −2% |
| Singapore | −6 | −12% | −6 | −12% | −0.03 | −2% | −0.02 | −8% |
| Sri Lanka | −1 | −4% | −1 | −4% | −0.07 | −3% | −0.02 | −6% |
| Thailand | −8 | −21% | −2 | −19% | 0.01 | 0% | −0.02 | −6% |
| United Arab Emirates | −1 | −1% | −0.1 | −1% | −0.11 | −4% | 0 | 0% |
| Vietnam | −9 | −24% | −3 | −23% | 0.06 | 2% | −0.11 | −23% |
| Yemen | −1 | −5% | −0.4 | −6% | −0.02 | −1% | 0 | 0% |
© 2019 by the authors. Licensee MDPI, Basel, Switzerland. This article is an open access article distributed under the terms and conditions of the Creative Commons Attribution (CC BY) license (http://creativecommons.org/licenses/by/4.0/).
Share and Cite
MDPI and ACS Style
Shen, Z.; Xu, X.; Li, J.; Wang, S. Vulnerability of the Maritime Network to Tropical Cyclones in the Northwest Pacific and the Northern Indian Ocean. Sustainability 2019, 11, 6176. https://0-doi-org.brum.beds.ac.uk/10.3390/su11216176
AMA Style
Shen Z, Xu X, Li J, Wang S. Vulnerability of the Maritime Network to Tropical Cyclones in the Northwest Pacific and the Northern Indian Ocean. Sustainability. 2019; 11(21):6176. https://0-doi-org.brum.beds.ac.uk/10.3390/su11216176
Chicago/Turabian StyleShen, Zhicheng, Xinliang Xu, Jiahao Li, and Shikuan Wang. 2019. "Vulnerability of the Maritime Network to Tropical Cyclones in the Northwest Pacific and the Northern Indian Ocean" Sustainability 11, no. 21: 6176. https://0-doi-org.brum.beds.ac.uk/10.3390/su11216176
Note that from the first issue of 2016, this journal uses article numbers instead of page numbers. See further details here.