A Sustainability Assessment of Five Major Food Crops’ Water Footprints in China from 1978 to 2010

1
School of Social Science, Shanghai University of Engineering Science, Shanghai 201602, China
2
Institution of Sustainability Development and Management, Tongji University, Shanghai 200092, China
3
Office of the Vice-President (Research and Innovation) and Department of Economics, University of Alberta, Edmonton, AB T6G 2G7, Canada
4
School of Economics and Management, Tongji University, Shanghai 200092, China
5
Joint Center for Urban Studies between Oxford University and China Executive Leadership Academy Pudong, Shanghai 201204, China
6
School of Law, University of New South Wales, 2052 Sydney, Australia
*
Author to whom correspondence should be addressed.
Sustainability 2019, 11(21), 6179; https://0-doi-org.brum.beds.ac.uk/10.3390/su11216179
Submission received: 20 August 2019
/
Revised: 22 October 2019
/
Accepted: 28 October 2019
/
Published: 5 November 2019
(This article belongs to the Special Issue Sustainable Global Water Management)
Abstract
:Rice, wheat, corn, soybeans, and sorghum are the five major crops in China, which account for 92% of the country’s total grain production and 33% of its water consumption. Combining water footprint analysis tools with sustainability assessment tools, the water sustainability of the five major crops can be analyzed. Based on ecological economics theory, this paper constructs a sustainability evaluation system of China’s five major crops’ water footprints and analyzes the national and provincial diversity of the sustainability of the five major crops’ water footprints using three dimensions: scale, distribution, and equity. We find that the interprovincial distribution equity sustainability divergence is the key bottleneck factor that restricts sustainability (more than scale and configuration). One key strategy is to arrange grain production at the national level, on the basis of considering the differences of water-resource endowment between different provinces to break through the bottleneck of the water-resource distribution sustainability of these five major food crops. This paper determines a general management model that can improve the sustainability of water resource management at the interprovincial level by comparing and analyzing the most sustainable and least sustainable provinces for the water footprint production of these five major crops.
1. Introduction
Feeding 22% of the world’s population with 6% of the world’s water and 7% of the world’s arable land is a major practical problem that China needs to solve. Rice, wheat, corn, soybean, and sorghum are five major crops that account for 92% of the nation’s total grain output and 33% of the nation’s total water consumption [1]. It is of great practical significance to explore whether water resources are sustainable for China’s food security, as well as its water-resource security. It is also beneficial to explore ways to further enrich and improve the sustainability measurement of resource categories, especially water resources. Combining water footprint analysis tools with sustainability assessment tools can be used to analyze the five major crops’ water sustainability, which put both food safety and water-resource safety into consideration.
1.1. WF and Its Sustainability Assessment
Water footprints (WFs) are not only indicators that can evaluate the water consumed during production [2,3,4] but also can be situated within a broader sustainability assessment to evaluate water utilization once it is established in a sustainability system [1]. It is widely accepted that the assessment of WF sustainability indicators is helpful in reducing fresh water scarcity risks [5]. Existing articles related to WFs mainly focus on calculation but fail to summarize, focus, and condense complex information in a meaningful and manageable way for science, policy, and water managers, thereby losing the opportunity to use sustainability analysis to propose feasible management recommendations and development strategies [6].
WF is an indicator developed in 2002 with the goal of quantifying the virtual water content of water products and services. WF comprises green water (rainwater evapotranspiration), blue water (consumption of surface and ground water), and gray water (water needed to assimilate pollution in wastewater to meet ambient water-quality standards) and considers water content in products and services, as well as the achievable changes in production, diet, and market trade [7]. WF has been extensively studied since it was first developed, and it is so widely accepted that, in 2014, the International Organization for Standardization proposed the life cycle assessment (LCA)-based WF standard (ISO 14046) [8].
Globally, agriculture accounts for approximately 85% of ground-water and surface-water consumption [9]. Irrigation is generally the greatest use of water in the system [10], and cereals are the agricultural products that contribute the greatest WF, at 27% [11]. This has generated extensive research on the WF of food crops, which is related to the water–food nexus [12]. In early WF studies, the main goal was to assess products’ water trade on the global scale [11]. Later, the goal was the rigorous quantification of three components of specific crops in specific areas—for example, in a basin [13], in a city [12], in a province [14], or in a region [15,16,17]. Recent studies focused on WF assessment and similarities between the methodology and the employed tools have emerged. The assessment consists of WF productivity [17], water scarcity [17,18], and water or nutrient sustainability [19,20].
The WF, as a sustainability indicator, has begun to include greater complexity in its geographic models, developed at different time resolutions and spatial scales, in order to estimate water-consumption limits in the environment [21]. The WF has been widely used in water-system sustainability measurement studies, such as studies at a river basin level in China. WF sustainability was assessed by comparing blue WF with blue water availability at the river-basin level in this research. When blue WF exceeds blue-water availability, there is reason to be concerned about sustainability [22]. In another study, blue WF sustainability was estimated as the blue WF divided by blue-water availability. Gray water sustainability is measured by the gray WF of crops grown in the basin divided by the runoff or natural flow of the basin over time [19]. Thus, it can be seen that WF is often combined with other indicators, to form a mixed indicator to measure water resource sustainability.
1.2. Sustainability Assessment
Three decades have passed since the classic definition of “sustainable development” was published. Many studies have been carried out to define sustainable development and sustainability assessment [23].
Various sustainability assessment methodological approaches have been developed [23]. Methods used to evaluate sustainability can be grouped into three categories. The first employs existing indicators to represent sustainability in one dimension [24]. These indicators include the environmental sustainability index—ESI [25], the corporate sustainability index—CSI [26], the Environmental Performance Index [27], the human development index—HDI, well-being of nations—WN [28], ecological footprint—EF [29], and the Index for Sustainable Economic Welfare—ISEW [30].
The second conducts pure environmental impact assessments, using tools such as LCA (Life Cycle Assessment) [31], or methodologies originally designed to capture macroeconomic impacts of investment, such as IO (input–output analysis) [32], to obtain fixed quantitative values reflecting sustainability.
The third establishes an assessment index framework and then divides the top-level index into sub-indexes [24,33,34]. Most sustainability indices employ an aggregation methodology based on expert evaluations, although such expert evaluation contains some level of subjectivity [35]. Some articles employ an optimization model that includes the interaction coefficients and weights of the criteria in a multilevel hierarchy [36]. However, this expert evaluation method causes the whole evaluation system to become less persuasive [35].
These studies typically employ sustainability indicators or establish sustainability index systems but fail to form a uniform sustainability assessment standard in a specific region [6]. The reason for this failure is that their sustainability evaluation is insufficiently grounded in ecological economics [6,23,36,37,38,39,40]. Ecological economics transforms sustainable development from weak sustainability, which focuses on society and economics, to strong sustainability, which emphasizes environment, economics, and society. It puts the appropriate scale, equitable distribution, and rational allocation as the criteria, in which scale stands for environment capacity, distribution represents social equity, and allocation can reflect economic efficiency [24]. Here, environment should be considered first [24].
1.3. Sustainability Measurement
The ecological economics principle is defined as proper scale, equity distribution, and efficiency allocation. Proper scale refers to the fact that resource consumption does not exceed its ecological carrying capacity [34]. For proper scale measurement, the measure of natural resource stock is difficult in biological terms, but an approximate estimation is sometimes created by aggregating flows [41]. When the flows increase dramatically, natural resources can become scarce, and the proper scale can be threatened. Environmental or natural resource ‘carrying capacity’ research and ecological thresholds are relative concepts related to the ecological scale and are usually measured by system dynamics simulations [42].
Distribution equity means that a resource’s consumption during the present generation does not threaten the resource needs of other contemporary and future generations [34]. A distribution assessment can be discussed separately from the perspective of between-generation equity and within-generation equity assessments. A between-generation equity assessment assesses whether resources put into this generation’s products’ production would severely affect the next generation’s demand. A within-generation equity assessment discusses the resource consumption’s agreement with its endowment [24]. For distribution equity measurement, equity is subjective, so it is difficult to analyze scientifically [43]. However, natural resource distribution equity can be compared between different generations and in different areas [43]. Distribution between different generations can also be affected by scale. If the scale is improper, then the next generation’s natural resources could be threatened by the present generation, which may cause inequity between generations [24,33,34].
Efficiency allocation refers to whether resources are allocated efficiently [34]. While scale and water distribution equity are vital but hard to measure [44], the water allocation efficiency measurement is simple and has been discussed extensively [44,45,46,47]. Water allocation efficiency can be measured by the balance between water supply and water demand and explained by the marginal value of water allocation or the economic benefit to the agricultural, industrial, and domestic sectors [24,33,34]. This efficiency also can be explained by the need to guarantee water use in an area for multiple objectives [44]. Among all these explanations, water allocation efficiency is widely interpreted as the water economic outcome in different places or sectors [48].
1.4. The Study in the Context of SDGs (Sustainability Development Goals)
In September 2015, countries from all continents signed Transforming Our World: the 2030 agenda for sustainable development in the UN headquarters in New York, with the aim of achieving global sustainable-development goals [49]. The Agenda 2030 emphasizes that from 2015 to 2030, the three dimensions of social, economic, and environmental development will be handled in an integrated way [50], which is in line with the ecological economics’ principle [24].
Agenda 2030, which comprises 17 goals, 169 targets, and 230 subdivision indicators, is a complex, diverse, dynamic, and project-related system [50]. Among these goals, there are three especially related to this study: (i) eradicate hunger (SDG 2), (ii) clean drinking water and sanitation facilities (SDG 6), and (iii) responsible consumption and production (SDG 12). In China, only about 45% of the SDGs indicators have both methods and data, about 39% have methods and no data, and 16% of SDGs indicators have neither unified methods nor data. This is of great significance to study the indicators and data sources of SDGs-oriented subdivision objectives in China [51]. The Agenda 2030 implementation process would inevitably be greatly hampered if these indicators cannot be measured or data are not available.
Agricultural products often have complex, spatially disconnected production chains. It is difficult to quantify the gross versus net water abstraction, and WF is introduced to quantify water along a supply chain [11]. Research into China’s total agricultural or food-crop-specific WFs is not new [1]. Extensive work has been carried out to evaluate sustainability, and various sustainability assessment methodology approaches have been developed [23]. However, without a clear definition and a comprehensive understanding of these indicators, any sustainability analysis conclusion would be incomplete or misleading [41]. How to measure sustainability based on strong sustainability principles for China’s major food crops still needs further development.
The motivation of this paper is to explore better sustainability assessment methodologies so that they can be more closely linked with the management of key natural resources, such as water. We introduce ecological economics’ theory as the foundation for sustainability assessment and then analyze the WF of five major food crops in China [1]. We then proceed to analyze scale, equity, and allocation dimensions’ sustainability to form a sustainability evaluation system to determine policy implications for water management. The paper also sets out a general management model that can improve the sustainability of water-resource management at the interprovincial level by comparing and analyzing the most sustainable and the least sustainable provinces for the water footprint production of these five major crops. In addition to providing insights into these five major food crops’ sustainability improvements, the sustainability evaluation method can also be implemented in other resources’ sustainability analysis. The natural resources’ SDGs achievement would also benefit from this research.
2. Methodology
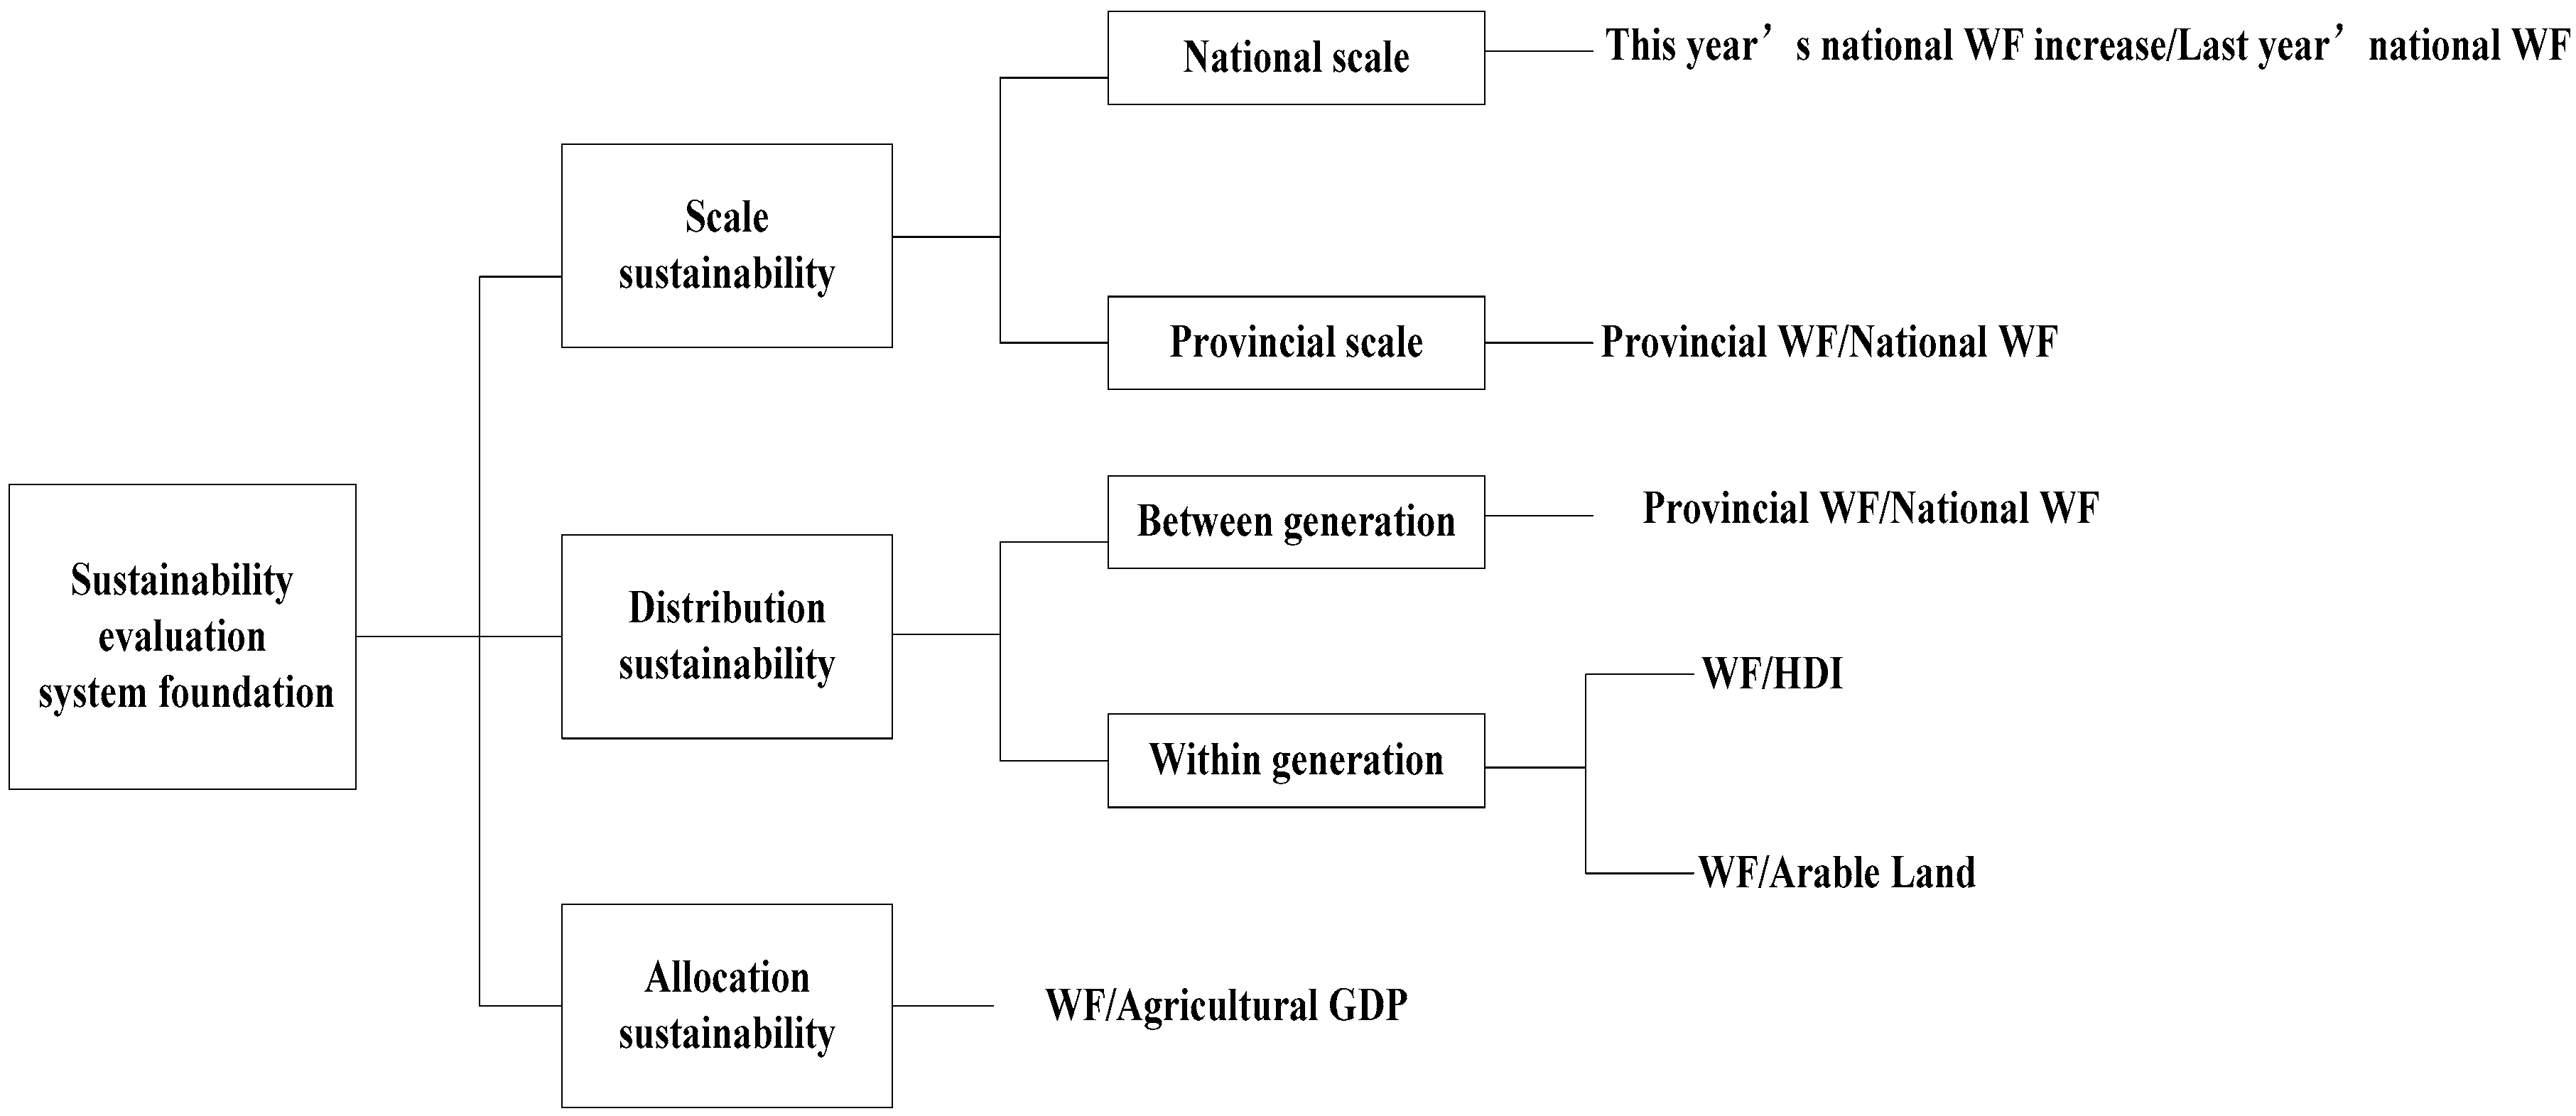
The sustainability assessment model framework utilizes proper scale, distribution sustainability, and equity allocation efficiency assessment indicators. We picked resource flow to calculate scale on the grounds that a resource’s stock is difficult to evaluate. Equity was measured by the provincial annual water resource availability’s ratio divided by the annual WF percentage in the total WF, which reflects the environment’s interaction at different levels. Equity can also be measured by each province’s annual WF percentage in the total WF, divided by its arable land ratio, to reflect the interaction between different environmental resources. ‘WF/HDI’ was also employed to evaluate equity distribution and measure the interaction between environment and society. Allocation efficiency was evaluated by ‘WF/GDP’ to reflect the interactions between the environment and economy. This section also introduces the data sources.
2.1. Sustainability Assessment Model Structure and Indicators
This assessment model framework consists of three dimensions: proper scale, equity distribution, and efficiency allocation. It introduces a selection of related indicators, discusses the implications of each indicator, and highlights the interaction between environment, society, and the economy that each indicator implies (Figure 1).
2.1.1. Proper Scale Analysis Classification
Scale equates to ‘stocks’ or ‘funds’ in ecological economics, which are difficult to measure but can be reflected by the flow of natural resources [24]. Proper scale implies that water consumption is not beyond its water endowment, and we used annual data on five main food crops’ WF variance, at both the national and provincial level, to evaluate whether or not the WF has achieved its proper scale goal. If the annual WF variance keeps on increasing dramatically, then this dimension’s sustainability goal would be threatened.
In order to evaluate and rank each province’s scale, this paper introduces an index equal to the WF ratio of one province’s five major crops divided by its water endowment ratio (Equation (1)) [1]. WF ratio refers to each province’s WF divided by the calculated provinces’ total. Water endowment ratio refers to each province’s water endowment divided by the calculated provinces’ total water endowment. Water endowment measures the total surface and underground water production formed by precipitation in the evaluation area, that is, the sum of surface runoff and precipitation infiltration to replenish underground water, excluding transit water. These water endowment data are collected from the Chinese Statistics Yearbook.
2.1.2. Equity Distribution Analysis
Equity distribution between generations can be reflected by annual WF variation. When the annual WF increases dramatically in water scarcity provinces, then future generations’ rights can be threatened. By regressing provincial annual WF variance on water resources per capita in different provinces, we can investigate whether or not water endowment in each province would influence its water variance.
Equity distribution within generations is reflected by two indicators. The first is the annual WF and its land-per-capita relationship [41]. Food crops are mainly planted in Northern China, where there is an abundance of arable land but relatively low water endowment. WF distribution can achieve equity if WF per capita is high in high arable-per-capita places. The second is annual WF and its water-resource-endowment-per-capita relationship. By comparing each province’s land per capita, the provinces were divided into four types: land abundant, land average, land limited, and land scarcity provinces. Then, we introduced variance analyses to see if the provinces’ WF was diversified under different arable land endowment. The same analysis was employed to test the relationship between each province’s WF consumption and its water endowment [41].
Equity distribution within a generation requires an HDI/WF indicator to see if each province’s WF production has a positive effect on welfare [28]. If the HDI increase has a negative correlational relationship with an increase in WF, which means that WF input into the production of five major crops would create social benefit variations and cause inequality in social development. This indicator directly measures the environment–society interaction [33].
WF/arable land and WF/HDI are two distribution equity measurement indicators that equally take 0.5 weights, which are shown as Equation (2):
2.1.3. Allocation Efficiency Analysis
This section first evaluates WF’s economic outcome in the agricultural sector in each province, over 33 years, from 1978 to 2010 [48]. Then, we explore the provinces’ WF/economic outcome to see the implications. This reflects the environment–economy interaction [45].
Then, we classify the provinces’ water governance into three different types: government oriented, government–enterprise cooperation oriented, and government–enterprise–public participation oriented. The aim of this classification was to see the different water government types’ influence on efficiency in different industrial sectors, by variance analysis. This indicator measures environment–economy–society interactions.
2.1.4. Case Study
To extend the proposed model to some uncertain cases, a case study analysis was also introduced by comparing and analyzing the most sustainable and least sustainable provinces of these five major crops’ WF production. This provides some policy suggestions for the water governance authorities.
2.2. Data Sources
Data on the WF of the five main food crops, at both the provincial and national level, were taken from Tian et al.’s article [1]. The net imported WF was calculated by the net imported water from other countries through food-crop trading, multiplied by the world’s average WF for each of these five major crops. Imported and exported food-crop data were taken from the FAOSTATA (Food and Agriculture Organization STATA) database. The world average WF of these food crops was taken from the WF Assessment Manual [9]. HDI data, population data, arable land data, and agricultural economic data were taken from China’s Statistical Yearbook [52]. Water-resource-management data were taken from each province’s statistical yearbooks [52], related research articles, and the government’s public administration information.
3. Sustainability Assessment and Results
The sustainability assessment framework described above was applied to the 33 years’ five main food crops’ WFs to analyze their environmental scale, economic outcome, and social influence. Scale, distribution, and efficiency are discussed in the following three sections. To extend the proposed model to some uncertain cases, a case-study analysis was also used to provide some policy suggestions for the water governance authorities.
3.1. Sustainability Assessment and Results
3.1.1. Scale Assessment
National-Level Scale Assessment
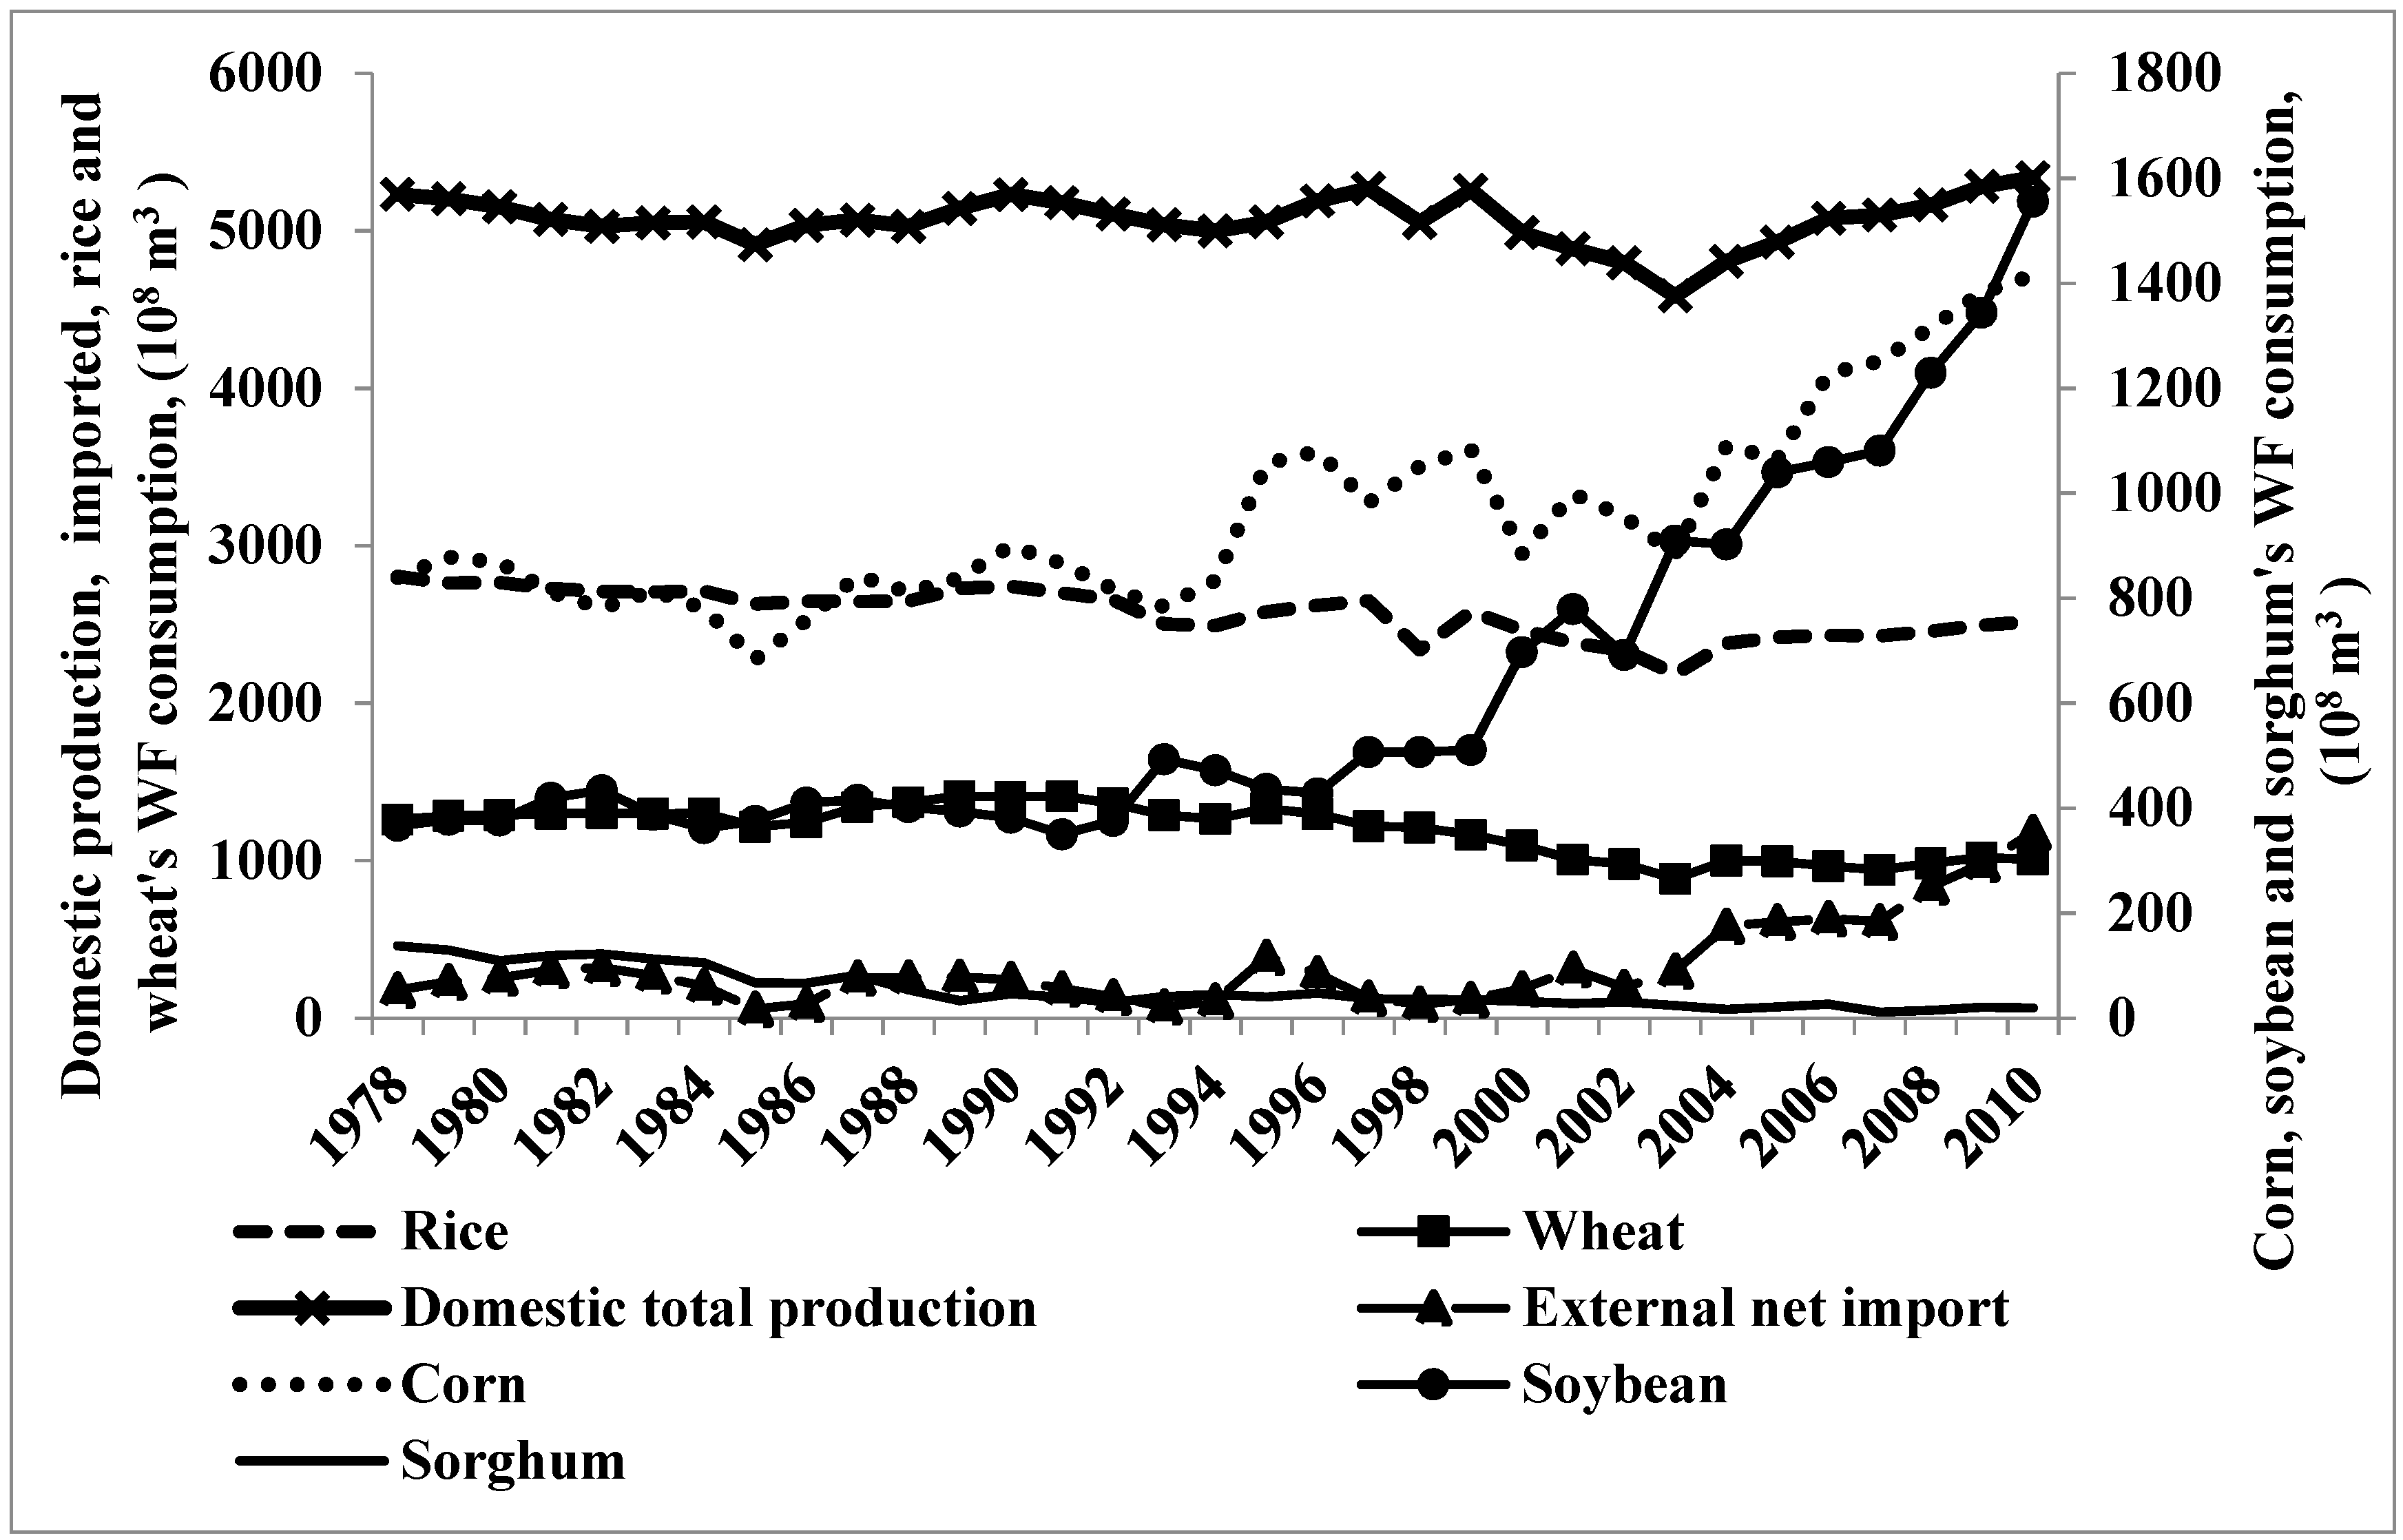
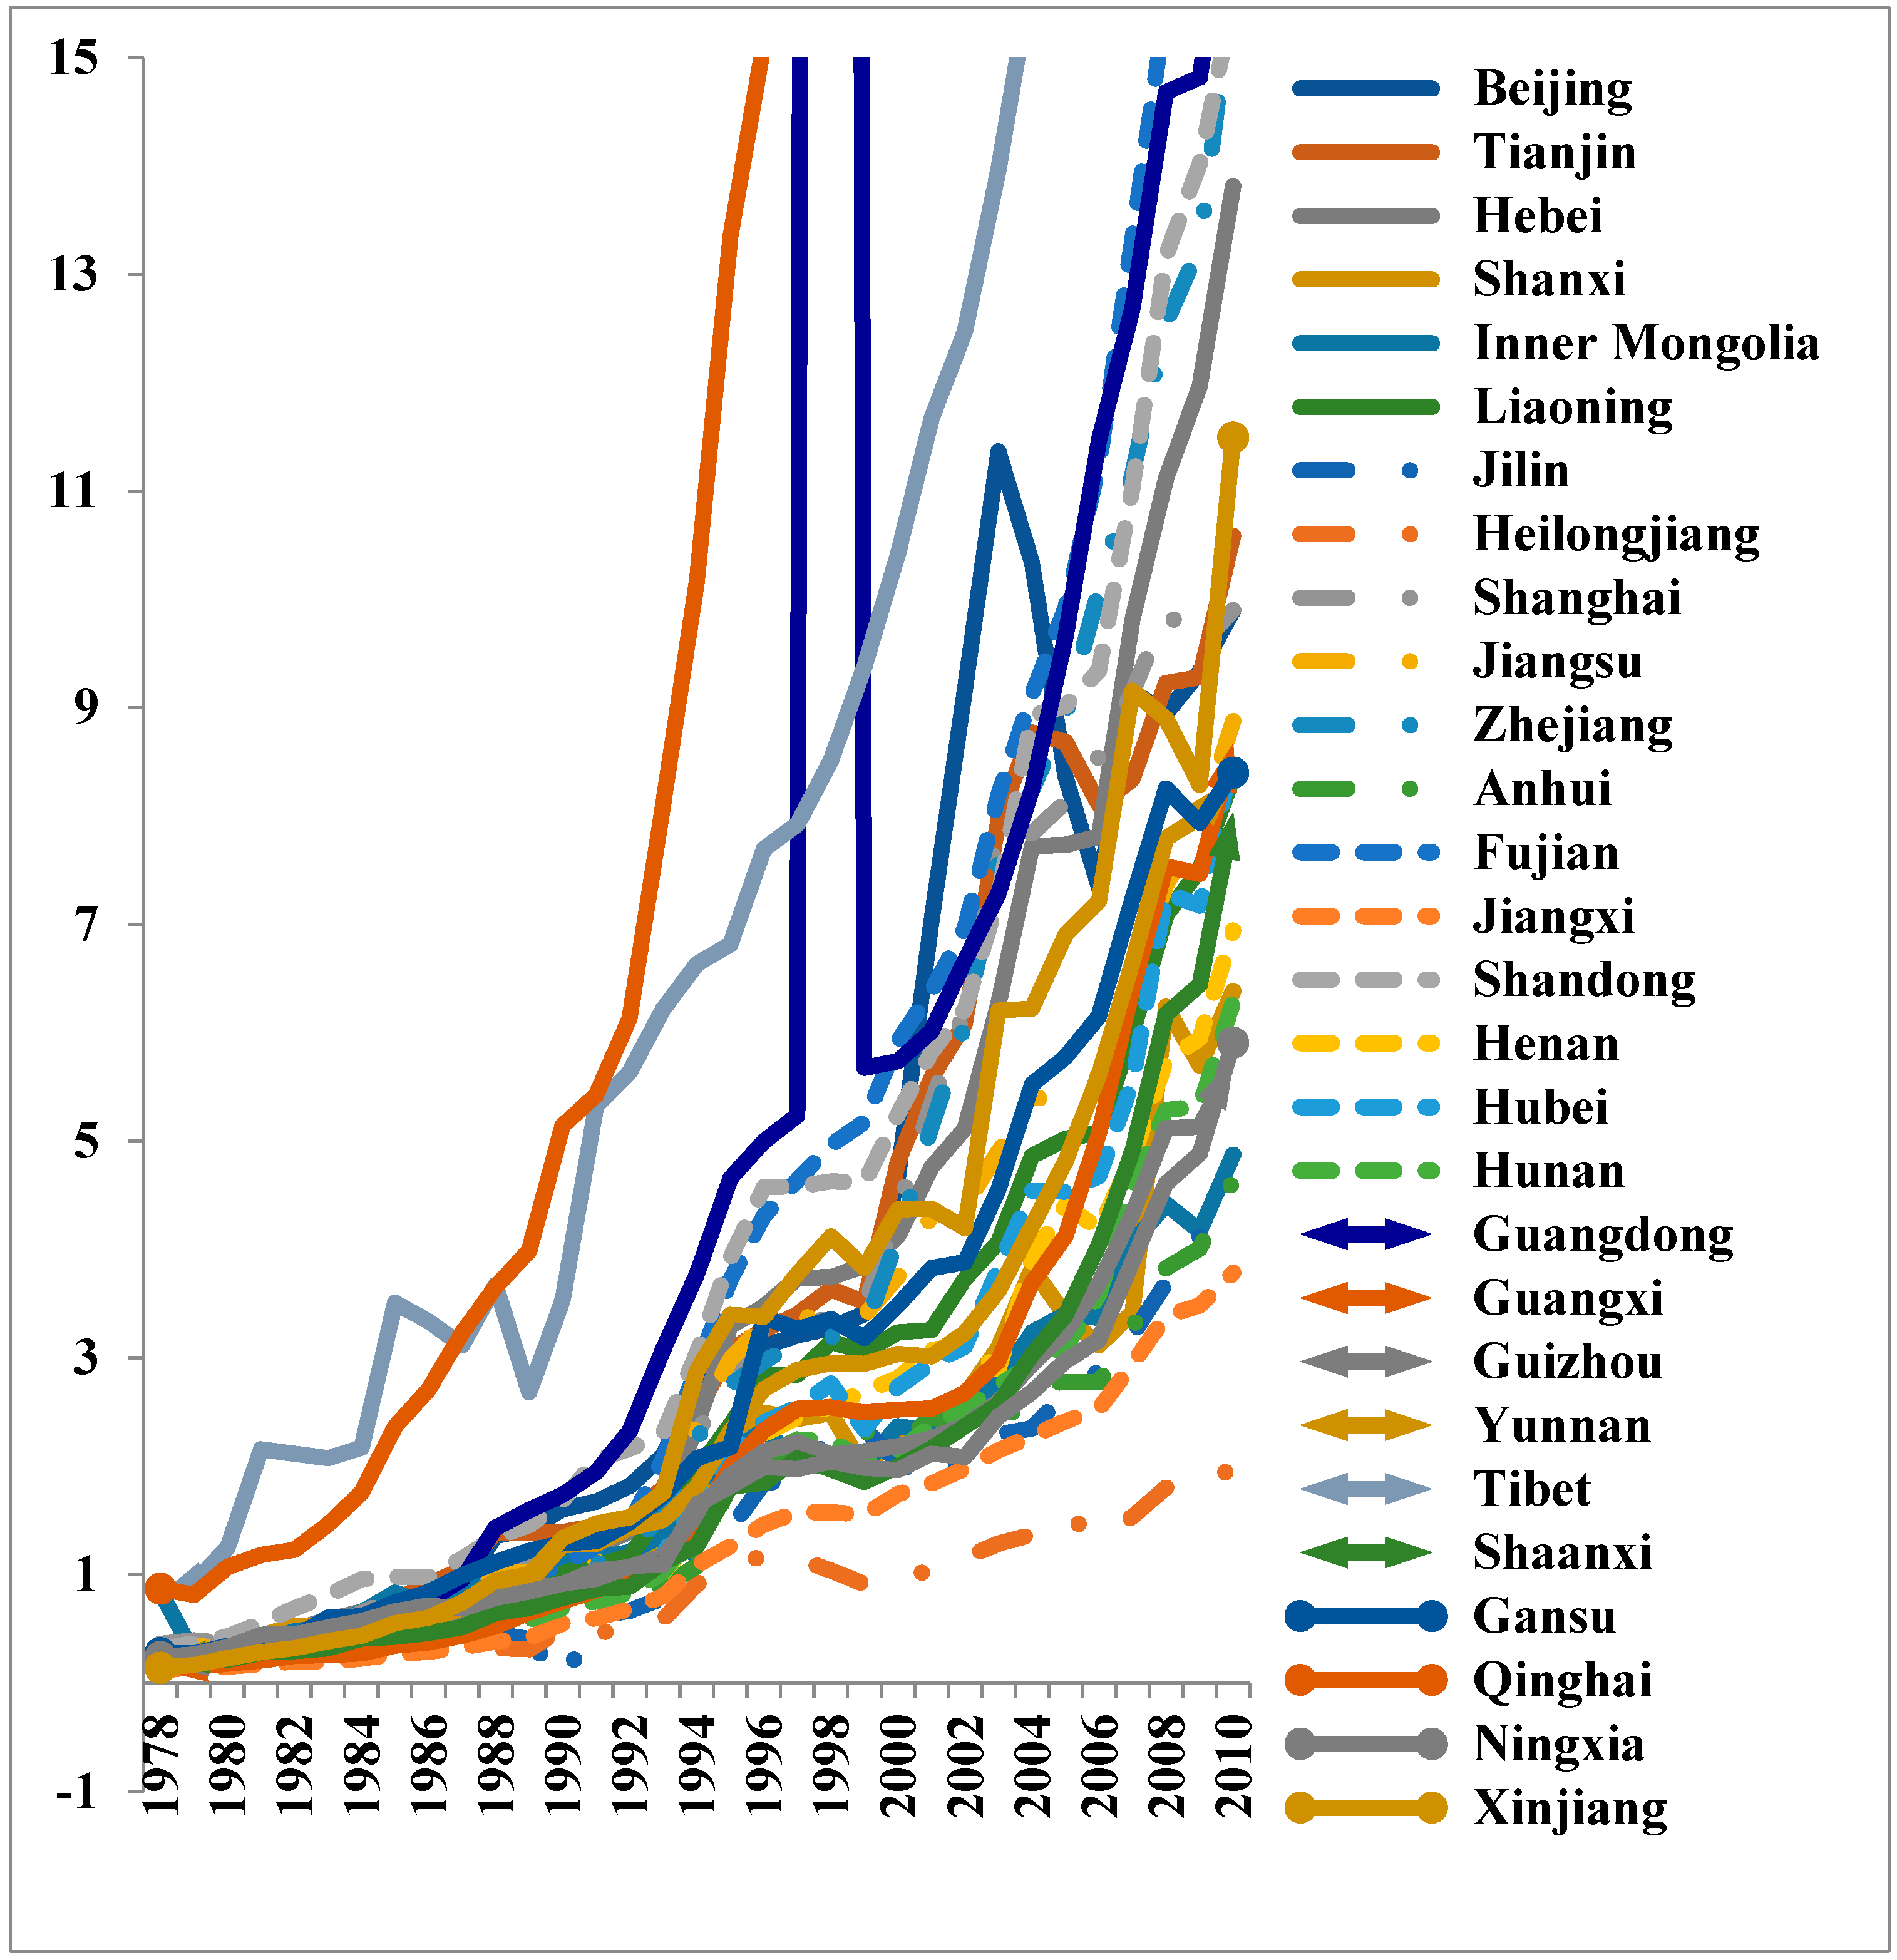
The five major food crops’ national consumption WFs increased by 20.5% from 7.96 × 10¹¹ m³ to 1.04 × 10¹² m³, from 1978 to 2010 (Figure 2). The production WF of the five major domestic foods increased from 5.23 × 10¹¹ m³ to 5.34 × 10¹¹ m³, which increased by 2.10% for the nation’s five major food crops’ domestic production WFs, and contributed 1.1 × 10¹⁰ m³ and 9.91% of the total WF consumption increase. In the same period, the five main food crops’ imported production WF increased from 2.62 × 10¹¹ tons to 5.06 × 10¹¹ tons, which is a 93.13% increase—95.7% of the total WF consumption increase, the main cause of the national WF consumption increase during this period (Figure 3).
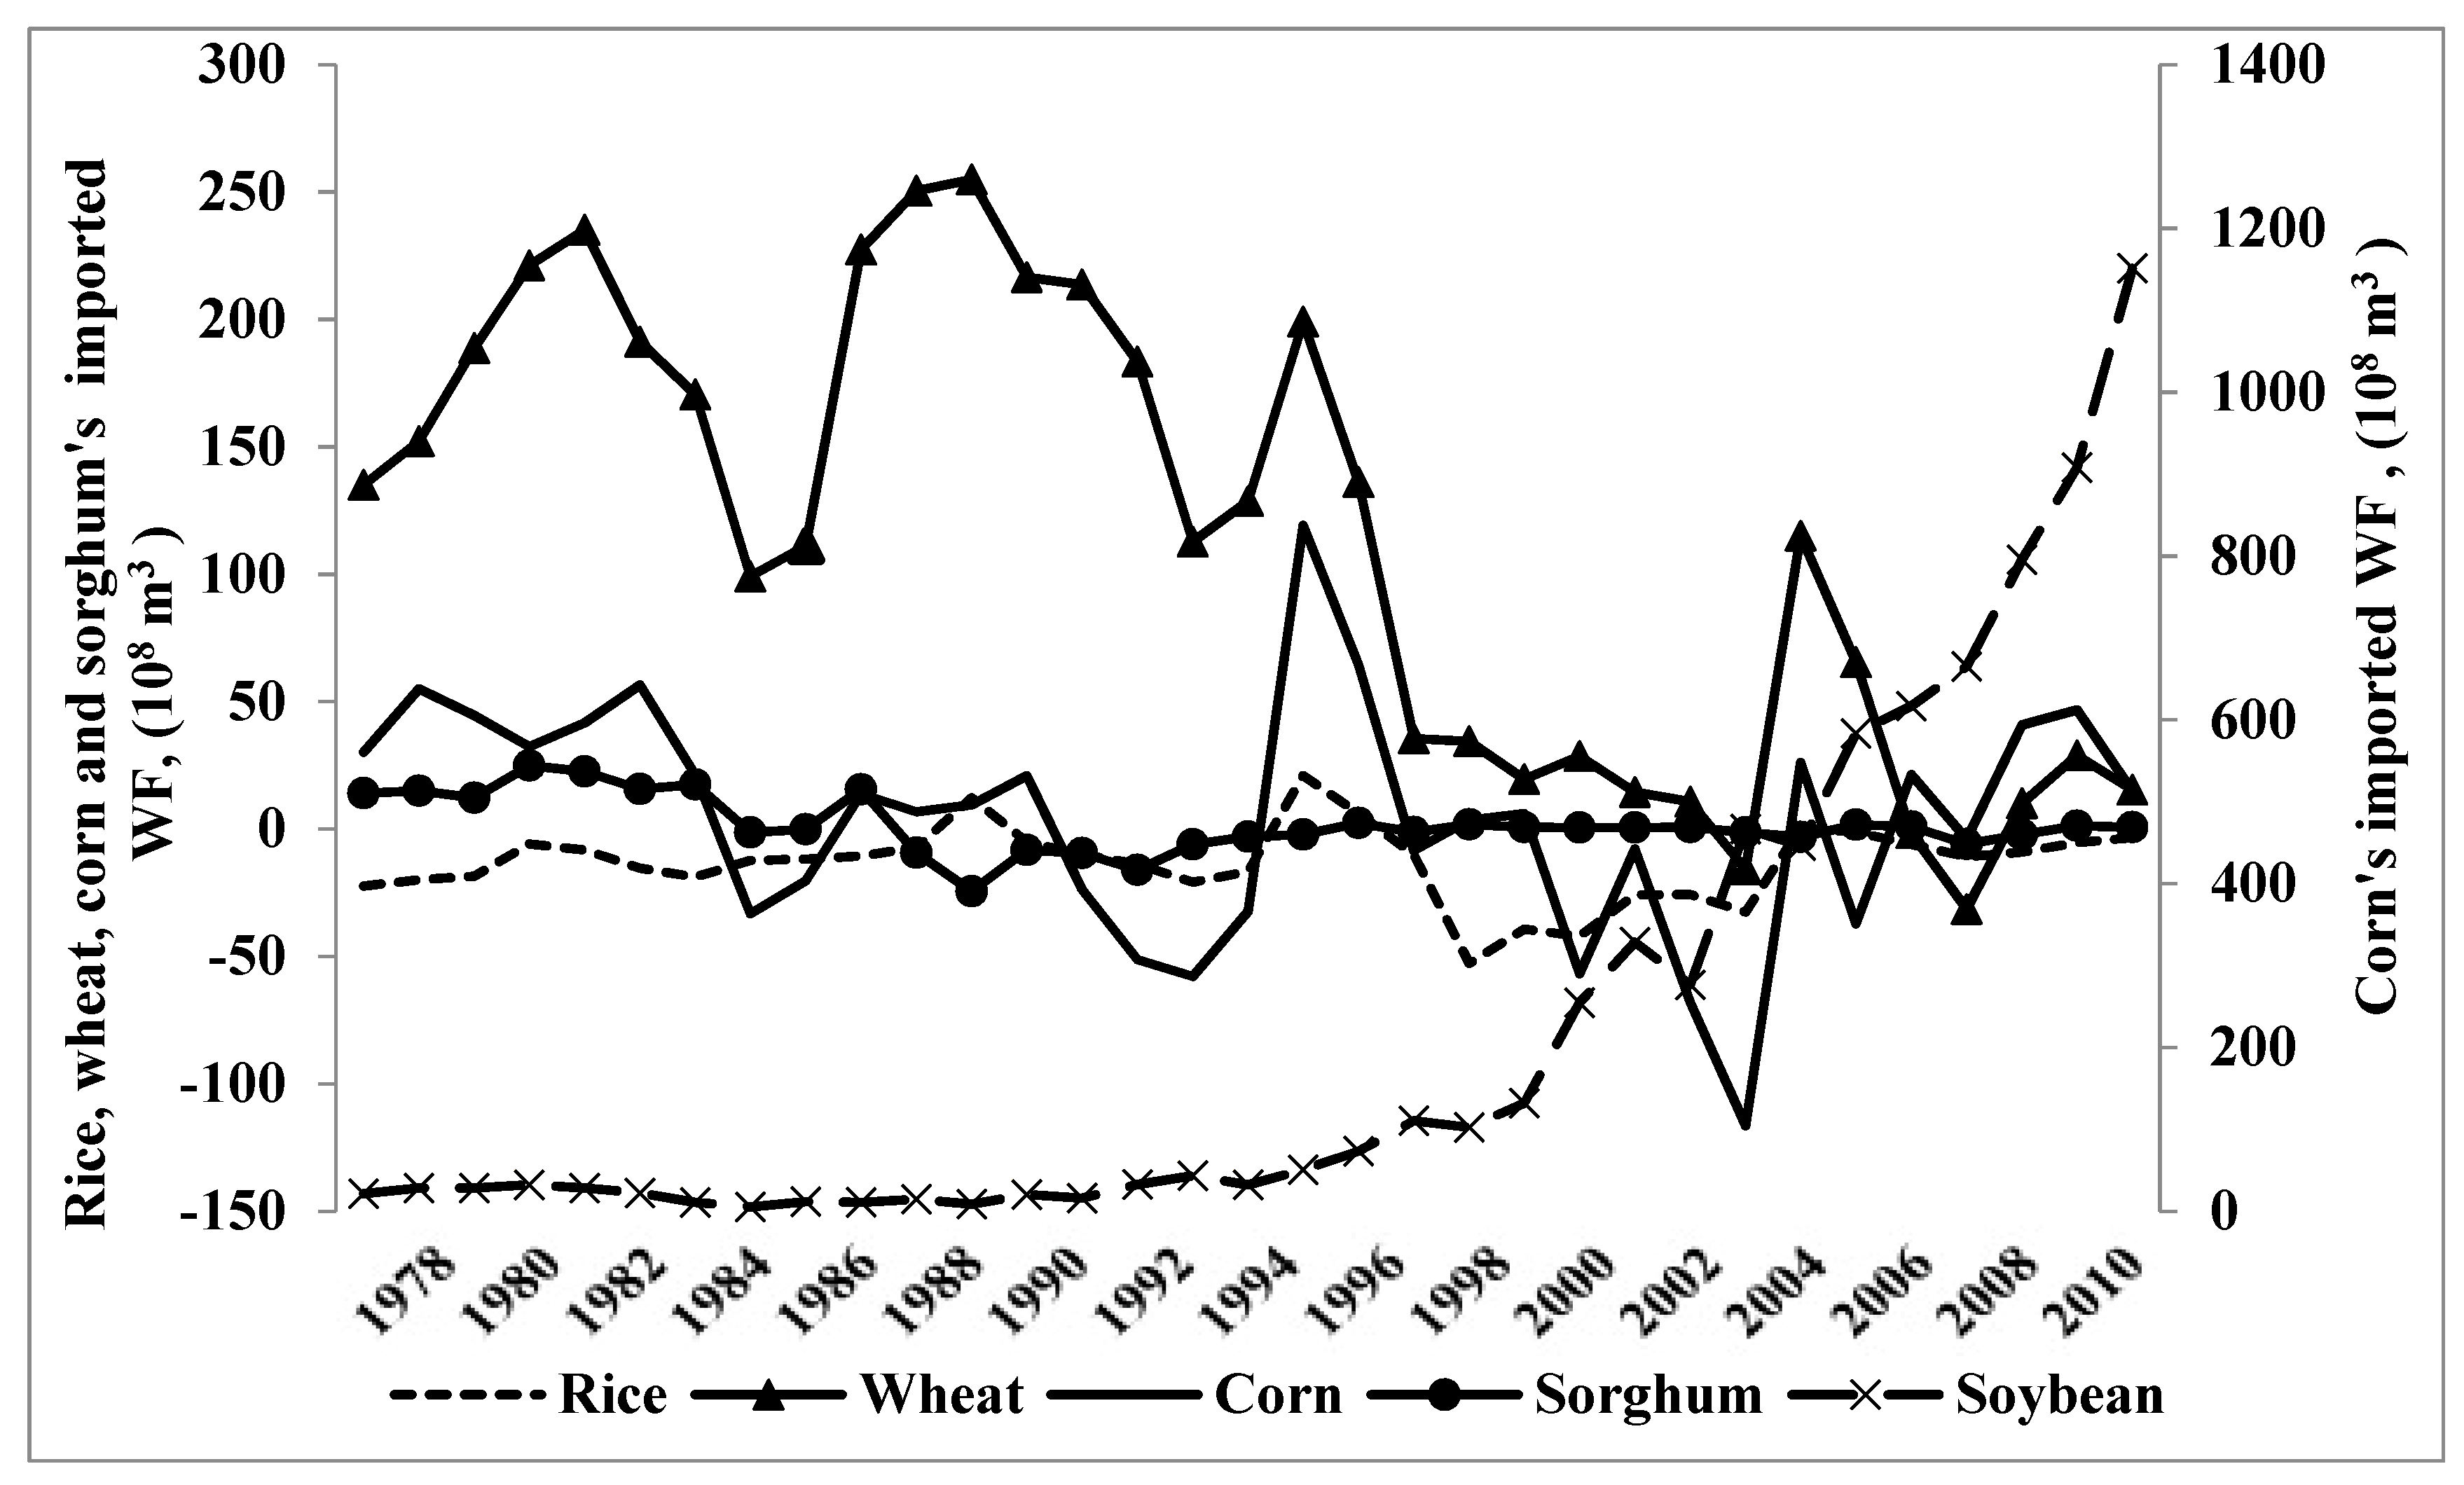
In 2010, the imported WF took up 19.88% of the whole nation’s WF consumption for the five major crops. The five major imported foods’ WFs were boosted mainly because the imported soybean WF increased 52 times from 1978 to 2010, which caused its share of the five major food crops’ imported WF to increase from 12.11% to 97.67%. In 2010, the imported soybean WF was 1.151 × 10¹¹ m³. In 1978, the imported wheat WF was 1.34 × 10¹⁰ m³, which puts it in first place among the five major crops’ imported WFs, with 75.68%, while in 2010, its ratio dropped to 1.30%. The traded rice WF also varied over the period. In 1978, China exported 2.23 × 10⁹ m³ of its rice’s WF, but in 2010, China exported 3.42 × 10⁸ m³ of its rice’s WF (Figure 3). The exported rice WF decreased by 84.68% from 1978 to 2010. In 2010, beyond the rice WF exported to other countries from China, the other four major food crops’ WFs were also imported into China. In 2010, the net imported portions of the five major food crops’ WFs were rice, 0.29%; wheat, 1.30%; corn, 1.26%; soybean, 97.67%; and sorghum, 0.06%. Except for soybean, the other four major food crops’ WFs almost retained their net import and export equilibrium (Figure 3). This result implies that China has transitioned from a pure economic-food-export nation to an economic-food-import nation, accompanied by an increase in imported WF.
For domestic production, the increase between the food production and the WF of these five major crops is unequal for two reasons. First, the production increase of water-extensive food crops, such as rice and sorghum, was much less than that of water-less-extensive food crops, such as wheat, corn, and soybean. The yield increases of these five major food crops over the period were rice, 42.96%; wheat, 113.9%; corn, 216.8%; soybean, 99.33%; and sorghum, 69.57% decrease (Figure 2). Their WF variations were as follows: rice, 122.49% increase; wheat, 19.21% decrease; corn, 64.62% decrease; soybean, 266.93% decrease; and sorghum, 84.84% decrease. Secondly, the average production WF of these five major food crops decreased during this period. The production WF now needs much less water to produce the same food output. The decrease of the green WF was rice, 41.9%; wheat, 58.71%; corn, 48.17%; soybean, 43.76%; and sorghum, 50.98%. The decrease of the blue WF was rice, 29.68%; wheat, 59.19%; corn, 37.98%; soybean, 31.57%; and sorghum, 41.29%.
Provincial Level Scale Assessment
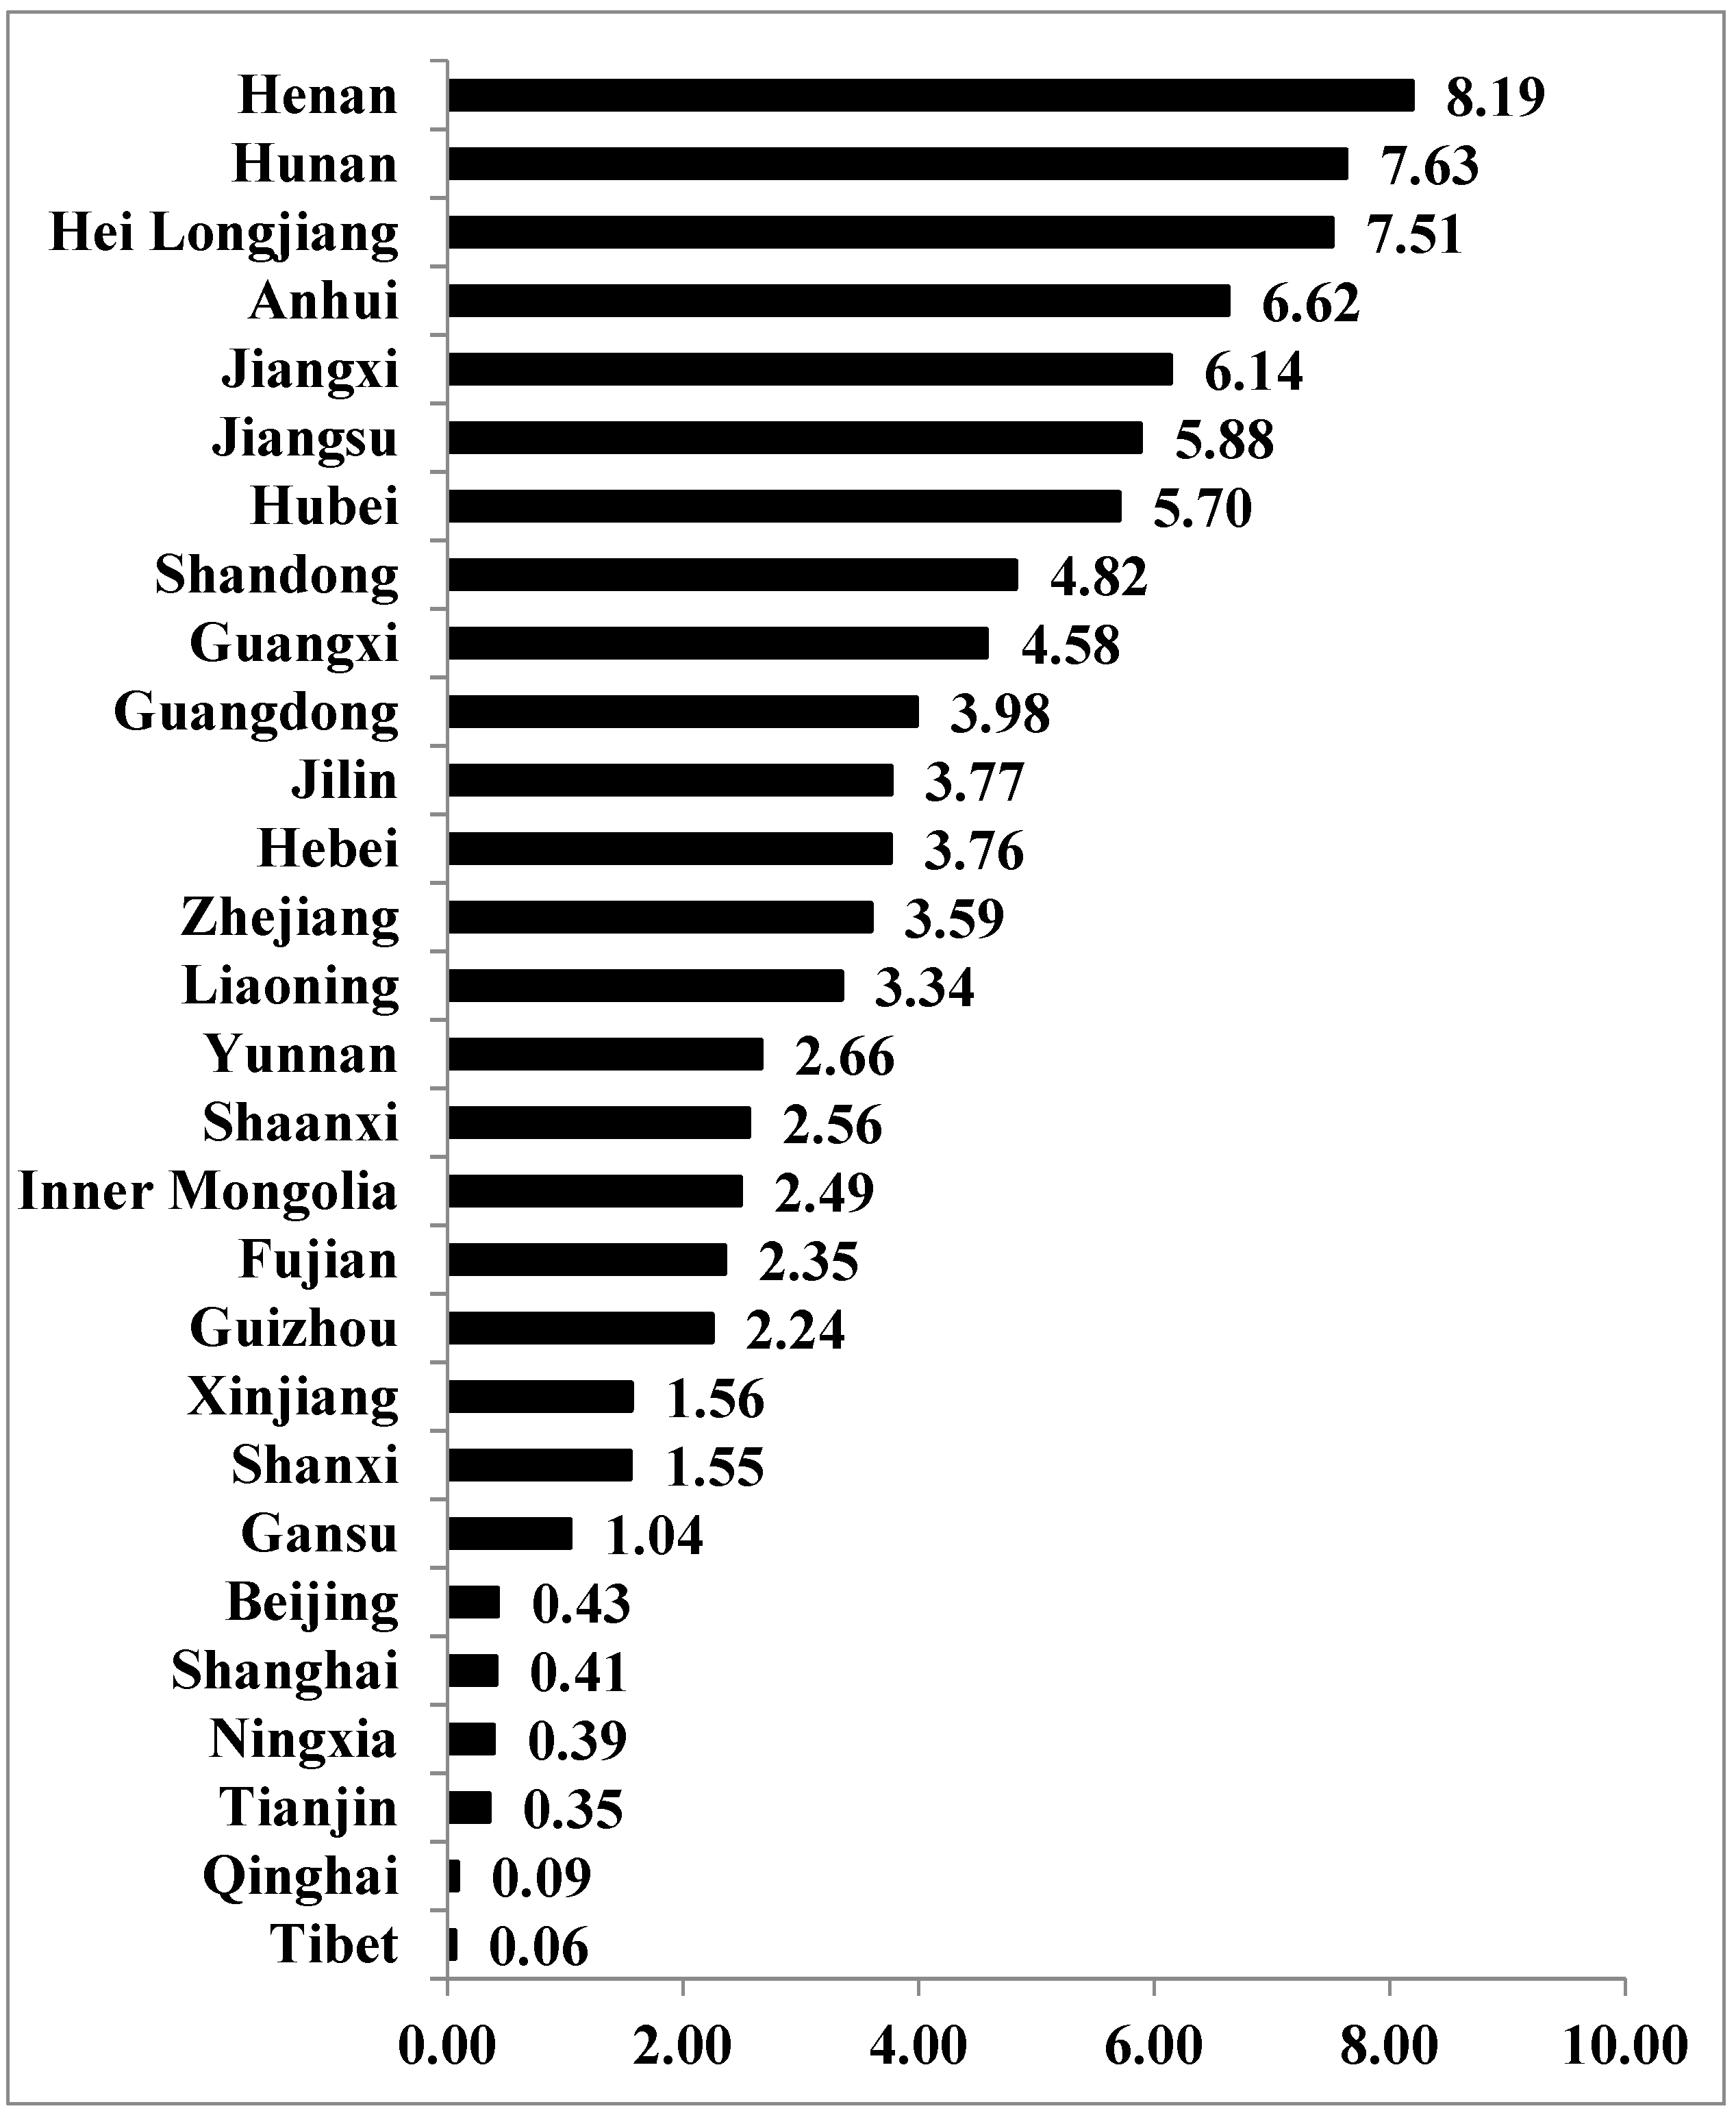
Nine provinces have contributed 60.90% of the nation’s total production for the WF of the five major crops (Figure 4). These nine provinces, and their WF portions for the whole nation, are Henan, Hunan, Heilongjiang, Anhui, Jiangxi, Jiangsu, Hubei, Shandong, and Guangxi, 4.58% (Figure 3). One-third of these provinces produce two-thirds of the total WF for the five major crops. Ten provinces’ five major crops’ WF variations are above zero, while the other 19 provinces’ variations are below zero. The nine WF scale-inflating provinces and their WF increases are Heilongjiang (4.01 × 10¹⁰ m³), Inner Mongolia (2.02 × 10¹⁰ m³), Henan (1.08 × 10¹⁰ m³), Jilin (7.10 × 10⁹ m³), Anhui (5.18 × 10⁹ m³), Gansu (2.28 × 10⁹ m³), Ningxia (1.40 × 10⁹ m³), Liaoning (1.21 × 10⁹ m³), and Shanxi (2.55 × 10⁹ m³). Comparing the data of the annual average provincial WF production and five major provincial crops’ WFs, it can be seen that Henan, Heilongjiang, and Anhui have increased their five major crops to attain high WF portions, while others such as Hunan, Jiangxi, Jiangsu, Hubei, and Shandong have reduced their absolute production WF but still possess relatively high WF production shares.
The WFs for most provinces’ five major crops are scale-shrinking, except for the following nine provinces: Shanxi, Liaoning, Ningxia, Gansu, Anhui, Jilin, Henan, Inner Mongolia, and Heilongjiang, which are WF-scale-expanding. In order to evaluate and rank each province’s scale, an index equal to the WF ratio of one province’s five major crops divided by its water endowment ratio is introduced in this paper (Equation (1)).
For this purpose, we utilized eight years of data for the five main food crops’ WF production, as well as the annual water resource endowment, to measure each province’s WF scale, because of annual water-resource endowment data limitations in certain provinces. These eight years are 2002, 2004, 2005, 2006, 2007, 2008, 2009, and 2010.
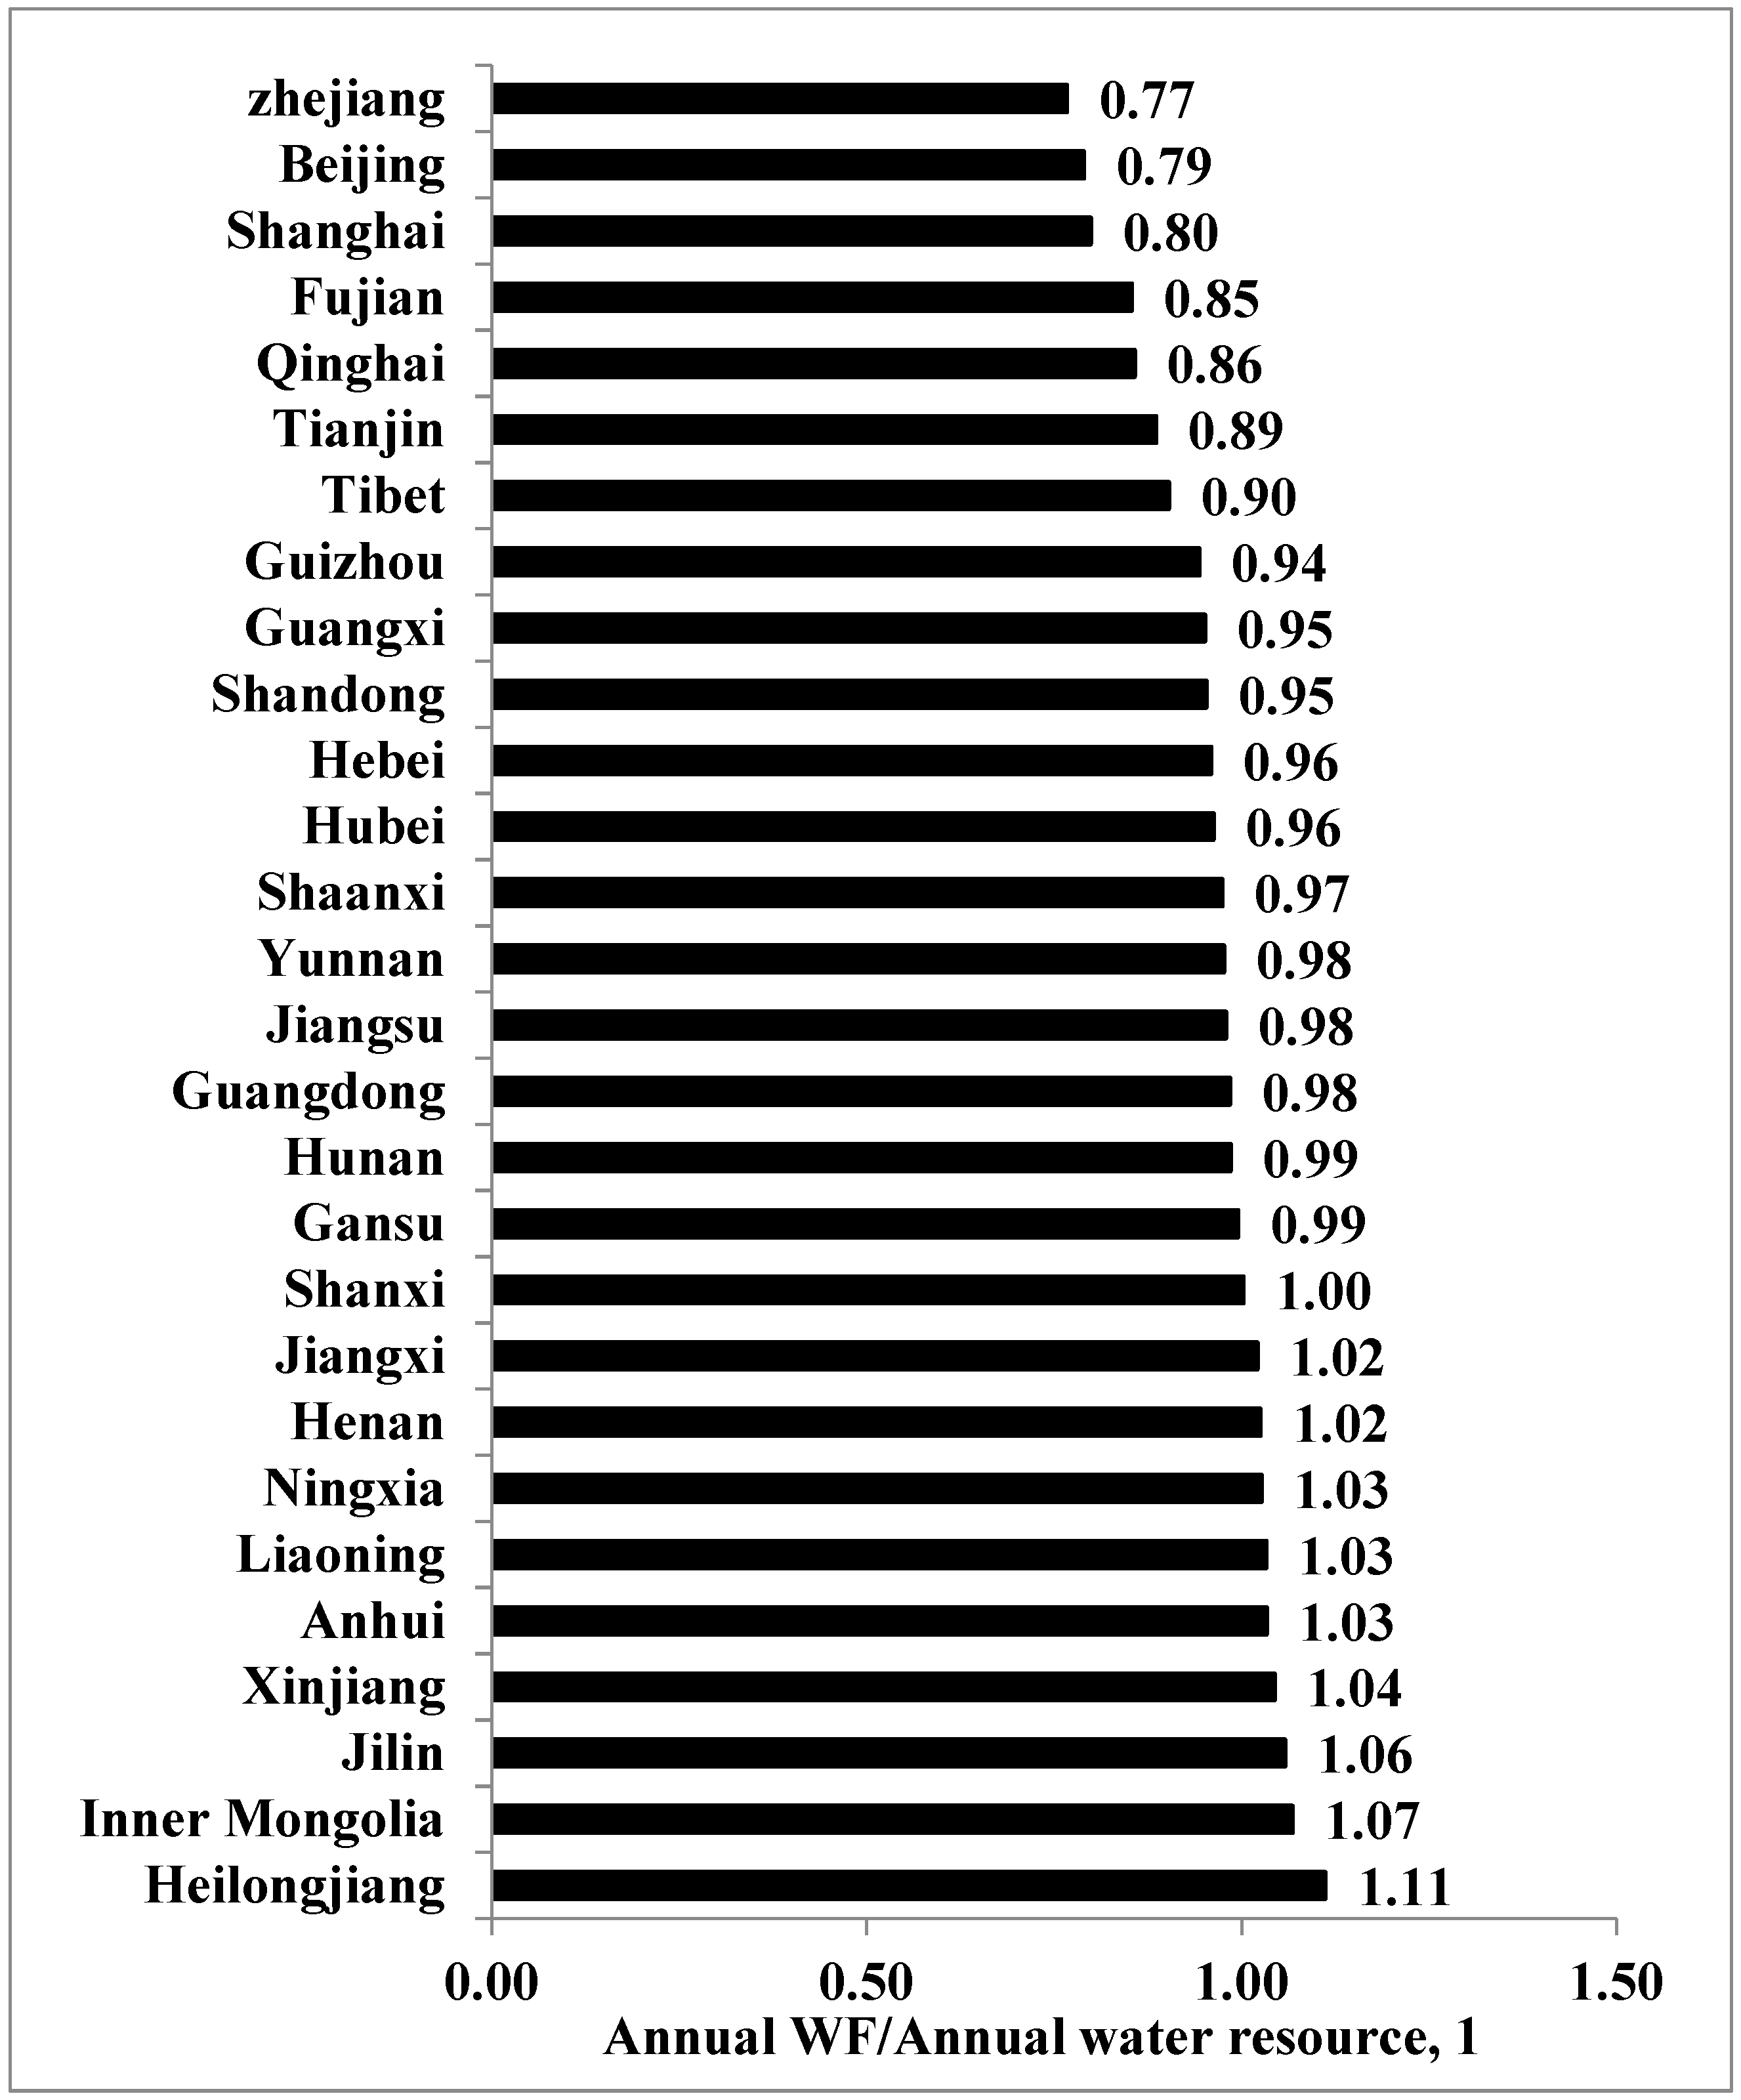
The results are presented in Figure 5. Nine out of these 28 provinces are scale-oversized (as their scale index is greater than 1), which implies they put more water into producing these five major crops than their water-resource endowment permits. These nine provinces and their WF scale indexes are Heilongjiang, 1.11; Inner Mongolia, 1.07; Jilin, 1.06; Xinjiang, 1.04; Anhui, 1.03; Liaoning, 1.03; Ningxia, 1.03; Henan, 1.02; and Jiangxi, 1.02. The higher the index is, the more unsustainable the provincial scale it exhibits.
3.1.2. Distribution Assessment
Between Generation Equity Distribution Assessment
The WF equity for the five major crops between different generations can be reflected by a scale analysis to test if the whole nation’s water consumed in producing these five major crops has a proper scale. It would threaten the next generation’s water supply in producing these five major crops if its scale is unsustainable. From the national scale analysis, we found that the increase of the five major crops’ domestic consumption WFs mainly relies on the import WF increase. The domestic production WF increased by 2.10% in 33 years, which is a small fluctuation that ensured that the next generation’s domestic WF demand would not be influenced. For the next generation’s WF demand, from a global aspect, the imported WF increase was mainly green WF, which improved the global water allocation but did not threaten the WF exported countries’ water consumption. Thus, other countries’ next-generation water demands would not be threated, either.
Within-Generation Equity-Distribution Assessment
Within-generation equity distribution explores whether the five major food crops’ production WFs are equally distributed in different provinces, as well as whether all the provinces can generate the same level of social benefits with the same production WF. We employed the provincial water endowment and arable land area as inputs to measure each province’s natural resource endowment. We also introduced HDI as an output measure to identify each province’s social benefits.
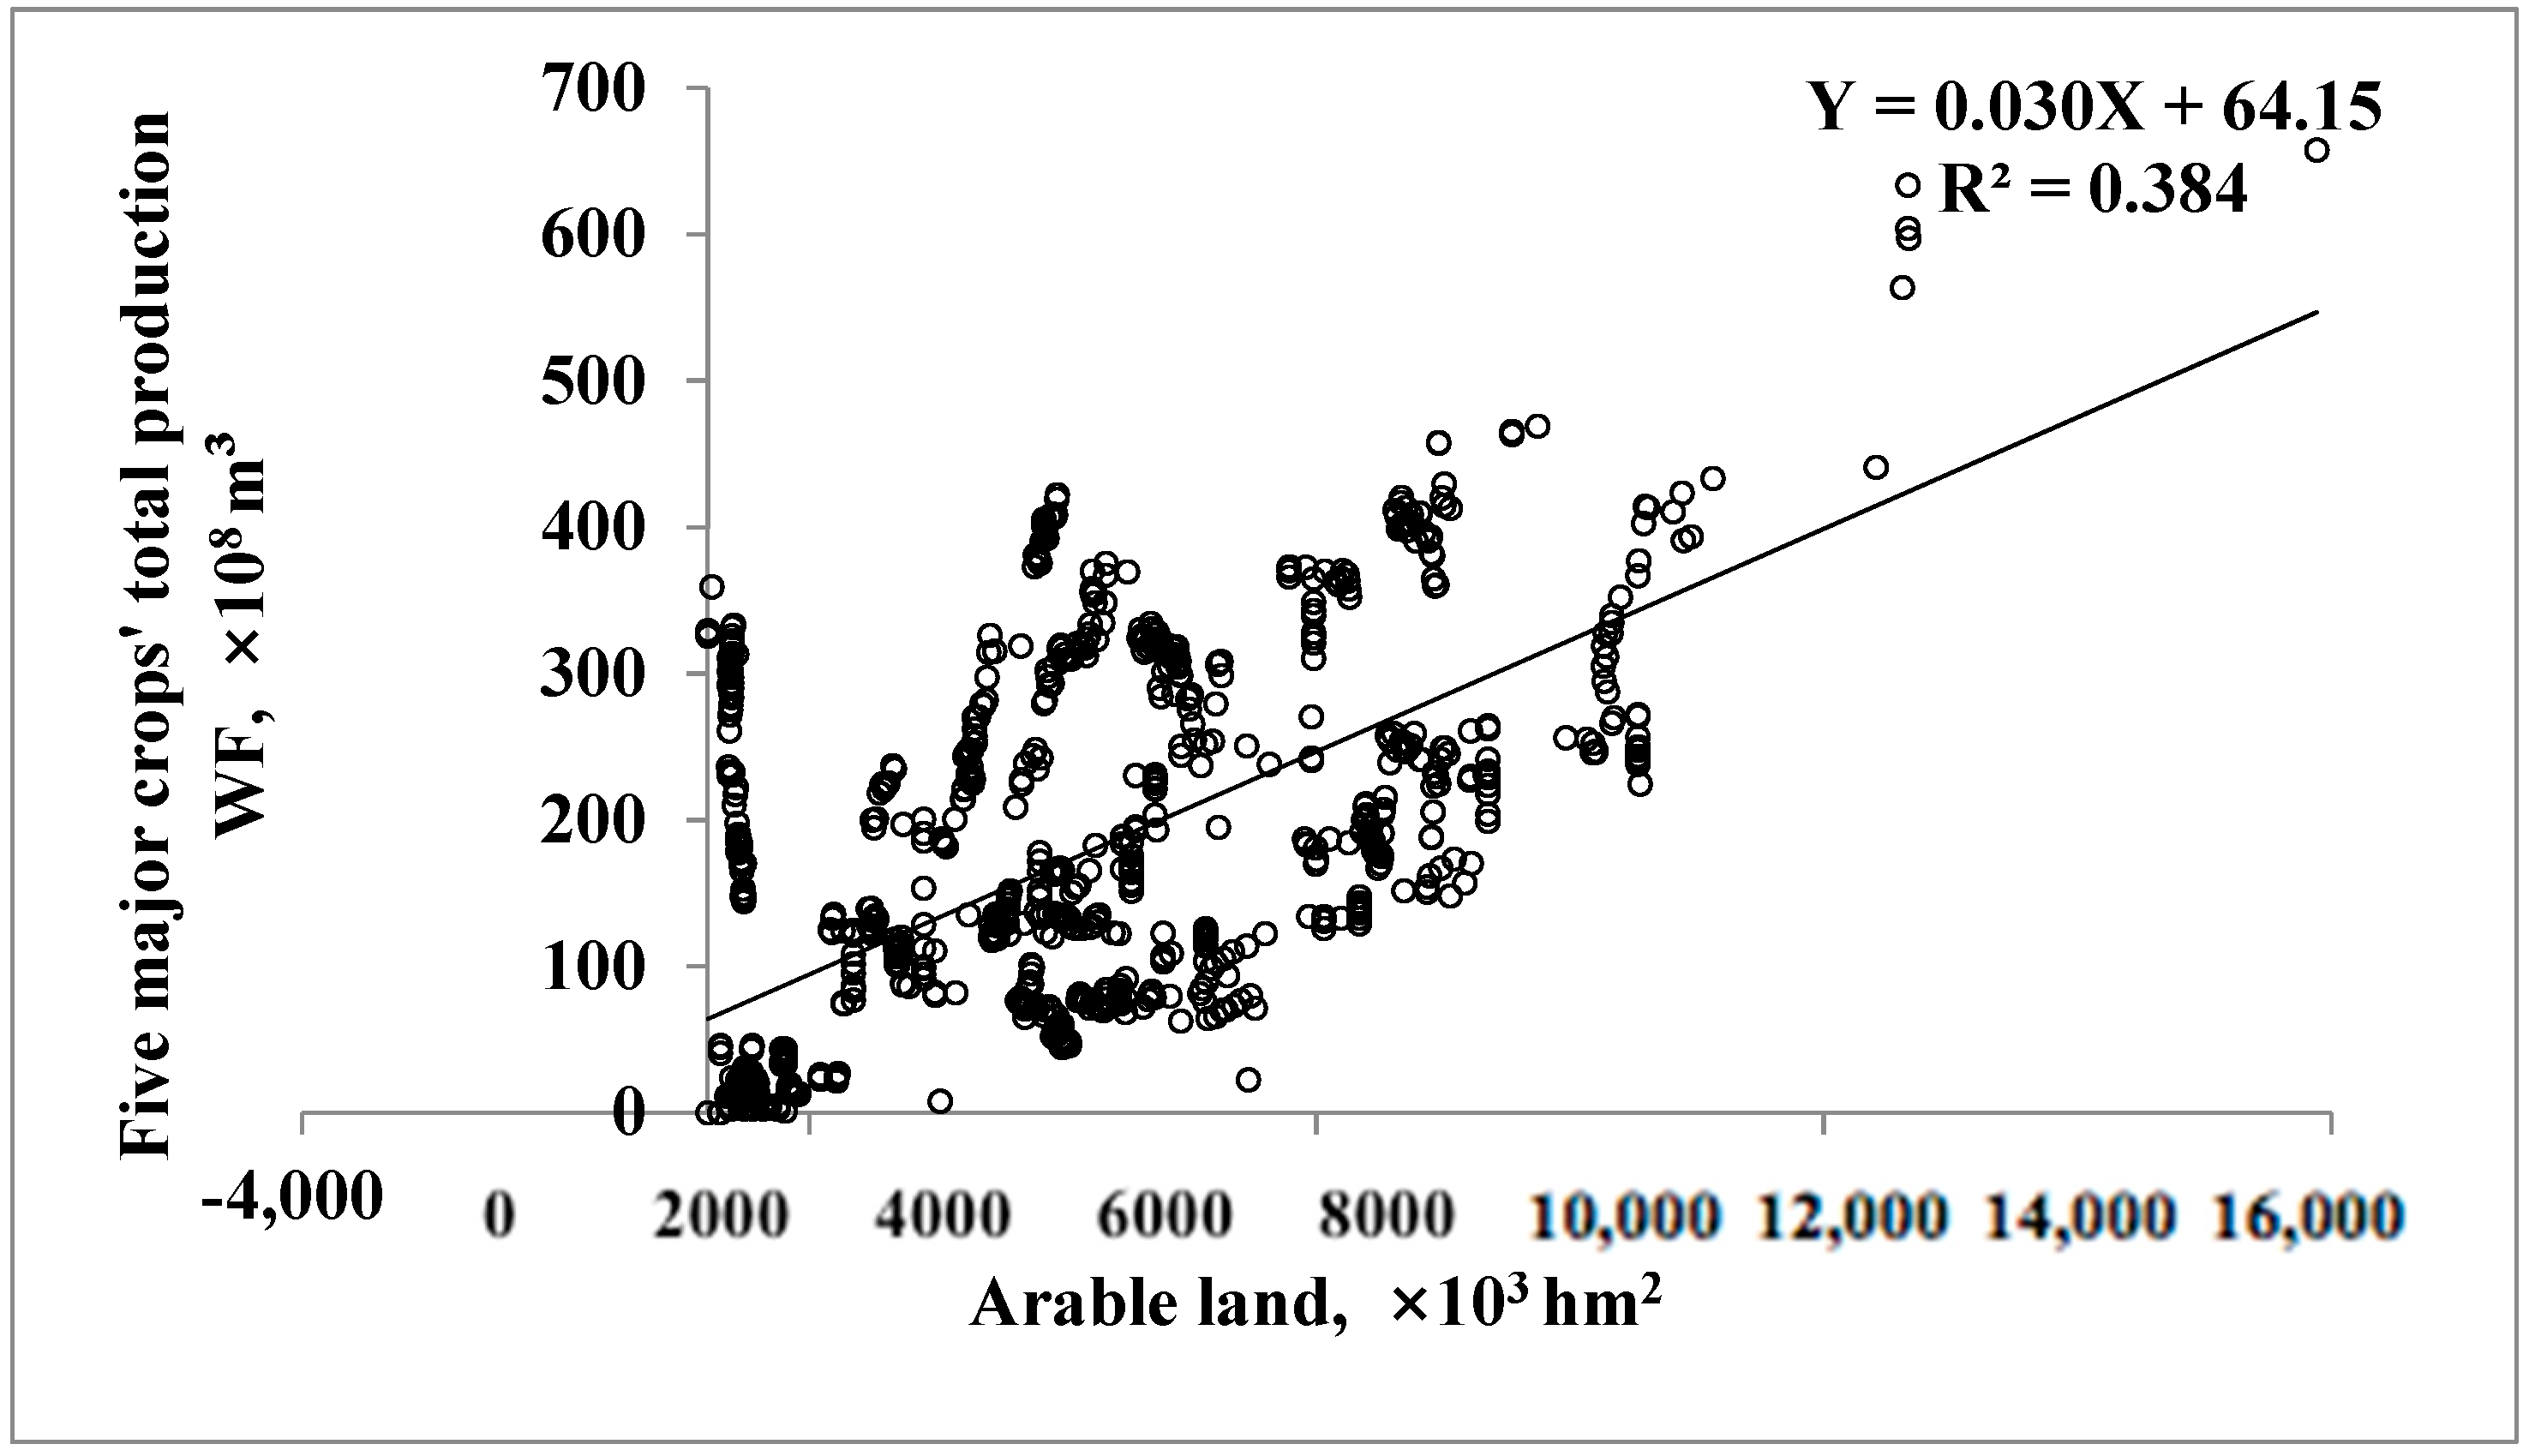
This paper introduces scatter plot graphs to describe the relationships between the five major crops’ total production WFs and the available water resources (the water endowment), the five major crops’ total production WFs, and the arable land, the five major crops’ total production WFs, and the HDI at the provincial level. The scatter plots suggest that the five major crops’ production WFs have more obvious correlations with the arable land than with the water resource endowment and the HDI index (Figure 6). This means that provinces make arable land endowment the first consideration when they make decisions on whether to expand the production of their five major crops, while water resource endowment is not usually a vital confining factor. Provinces with higher production WFs for their five major crops do not generate larger social benefits.
Distribution equity involves spatial considerations, accounting for both costs and income. Costs reflect resources put into production. The International Court of Justice has taken the view that equity should not seek to make equal what nature has made unequal. Therefore, resources put into production should not extend beyond a place’s resource endowment. Benefits are the outcomes that people receive in social exchanges, and the distribution is just if everyone is entitled to the holdings they possess under the distribution.
This analysis uses arable land as the input and HDI as the output for the WF production of the five major food crops. Employing arable land instead of water endowment as the input measurement factor was done for two reasons. First, arable land and water are important for food crops, and they are both variable across regions in China [41]. However, compared with water resource endowment, arable land has a more significant influence on the production WF distribution of the five major crops. Second, water-resource endowment was already employed in a proper scale assessment, and it does not need to be emphasized in the distribution dimension a second time.
As shown in Equation (2), WF/arable land and WF/HDI are two distribution equity measurement indicators that equally take 0.5 weights. For each province’s WF/HDI indicator, the results (in ascending sort) are Qinghai, 0.02; Ningxia, 0.02; Shanghai, 0.08; Tianjin, 0.08; Beijing, 0.08; Ningxia, 0.15; Gansu, 0.37; Xinjiang, 0.43; Fujian, 0.57; Shaanxi, 0.77; Zhejiang, 0.77; Guizhou, 0.82; Guangdong, 0.88; Yunnan, 0.91; Liaoning, 0.91; Inner Mongolia, 1.01; Hebei, 1.30; Shandong, 1.34; Guangxi, 1.35; Jilin, 1.43; Jiangsu, 1.54; Hubei, 1.55; Anhui, 2.09; Heilongjiang, 2.50; Henan, 2.55; and Hunan, 2.63. A smaller equity index means that the same WF can generate a greater HDI output, which is more sustainable.
The WF/Arable land indicators, in ascending sort, are Liaoning, 0.14; Beijing, 0.21; Guangdong, 0.29; Heilongjiang, 0.38; Guangxi, 0.38; Shaanxi, 0.40; Fujian, 0.45; Gansu, 0.65; Ningxia, 0.65; Anhui, 0.68; Jiangxi, 0.74; Xinjiang, 0.77; Inner Mongolia, 0.77; Qianghai, 1.13; Hebei, 1.16; Jiangsu, 1.20; Yunnan, 1.22; Henan, 1.30; Tibet, 1.32; Tianjin, 1.36; Zhejiang, 1.43; Hunan, 1.58; Hubei, 2.13; Shanghai, 2.24; Jilin, 5.58; and Shanxi, 16.09.
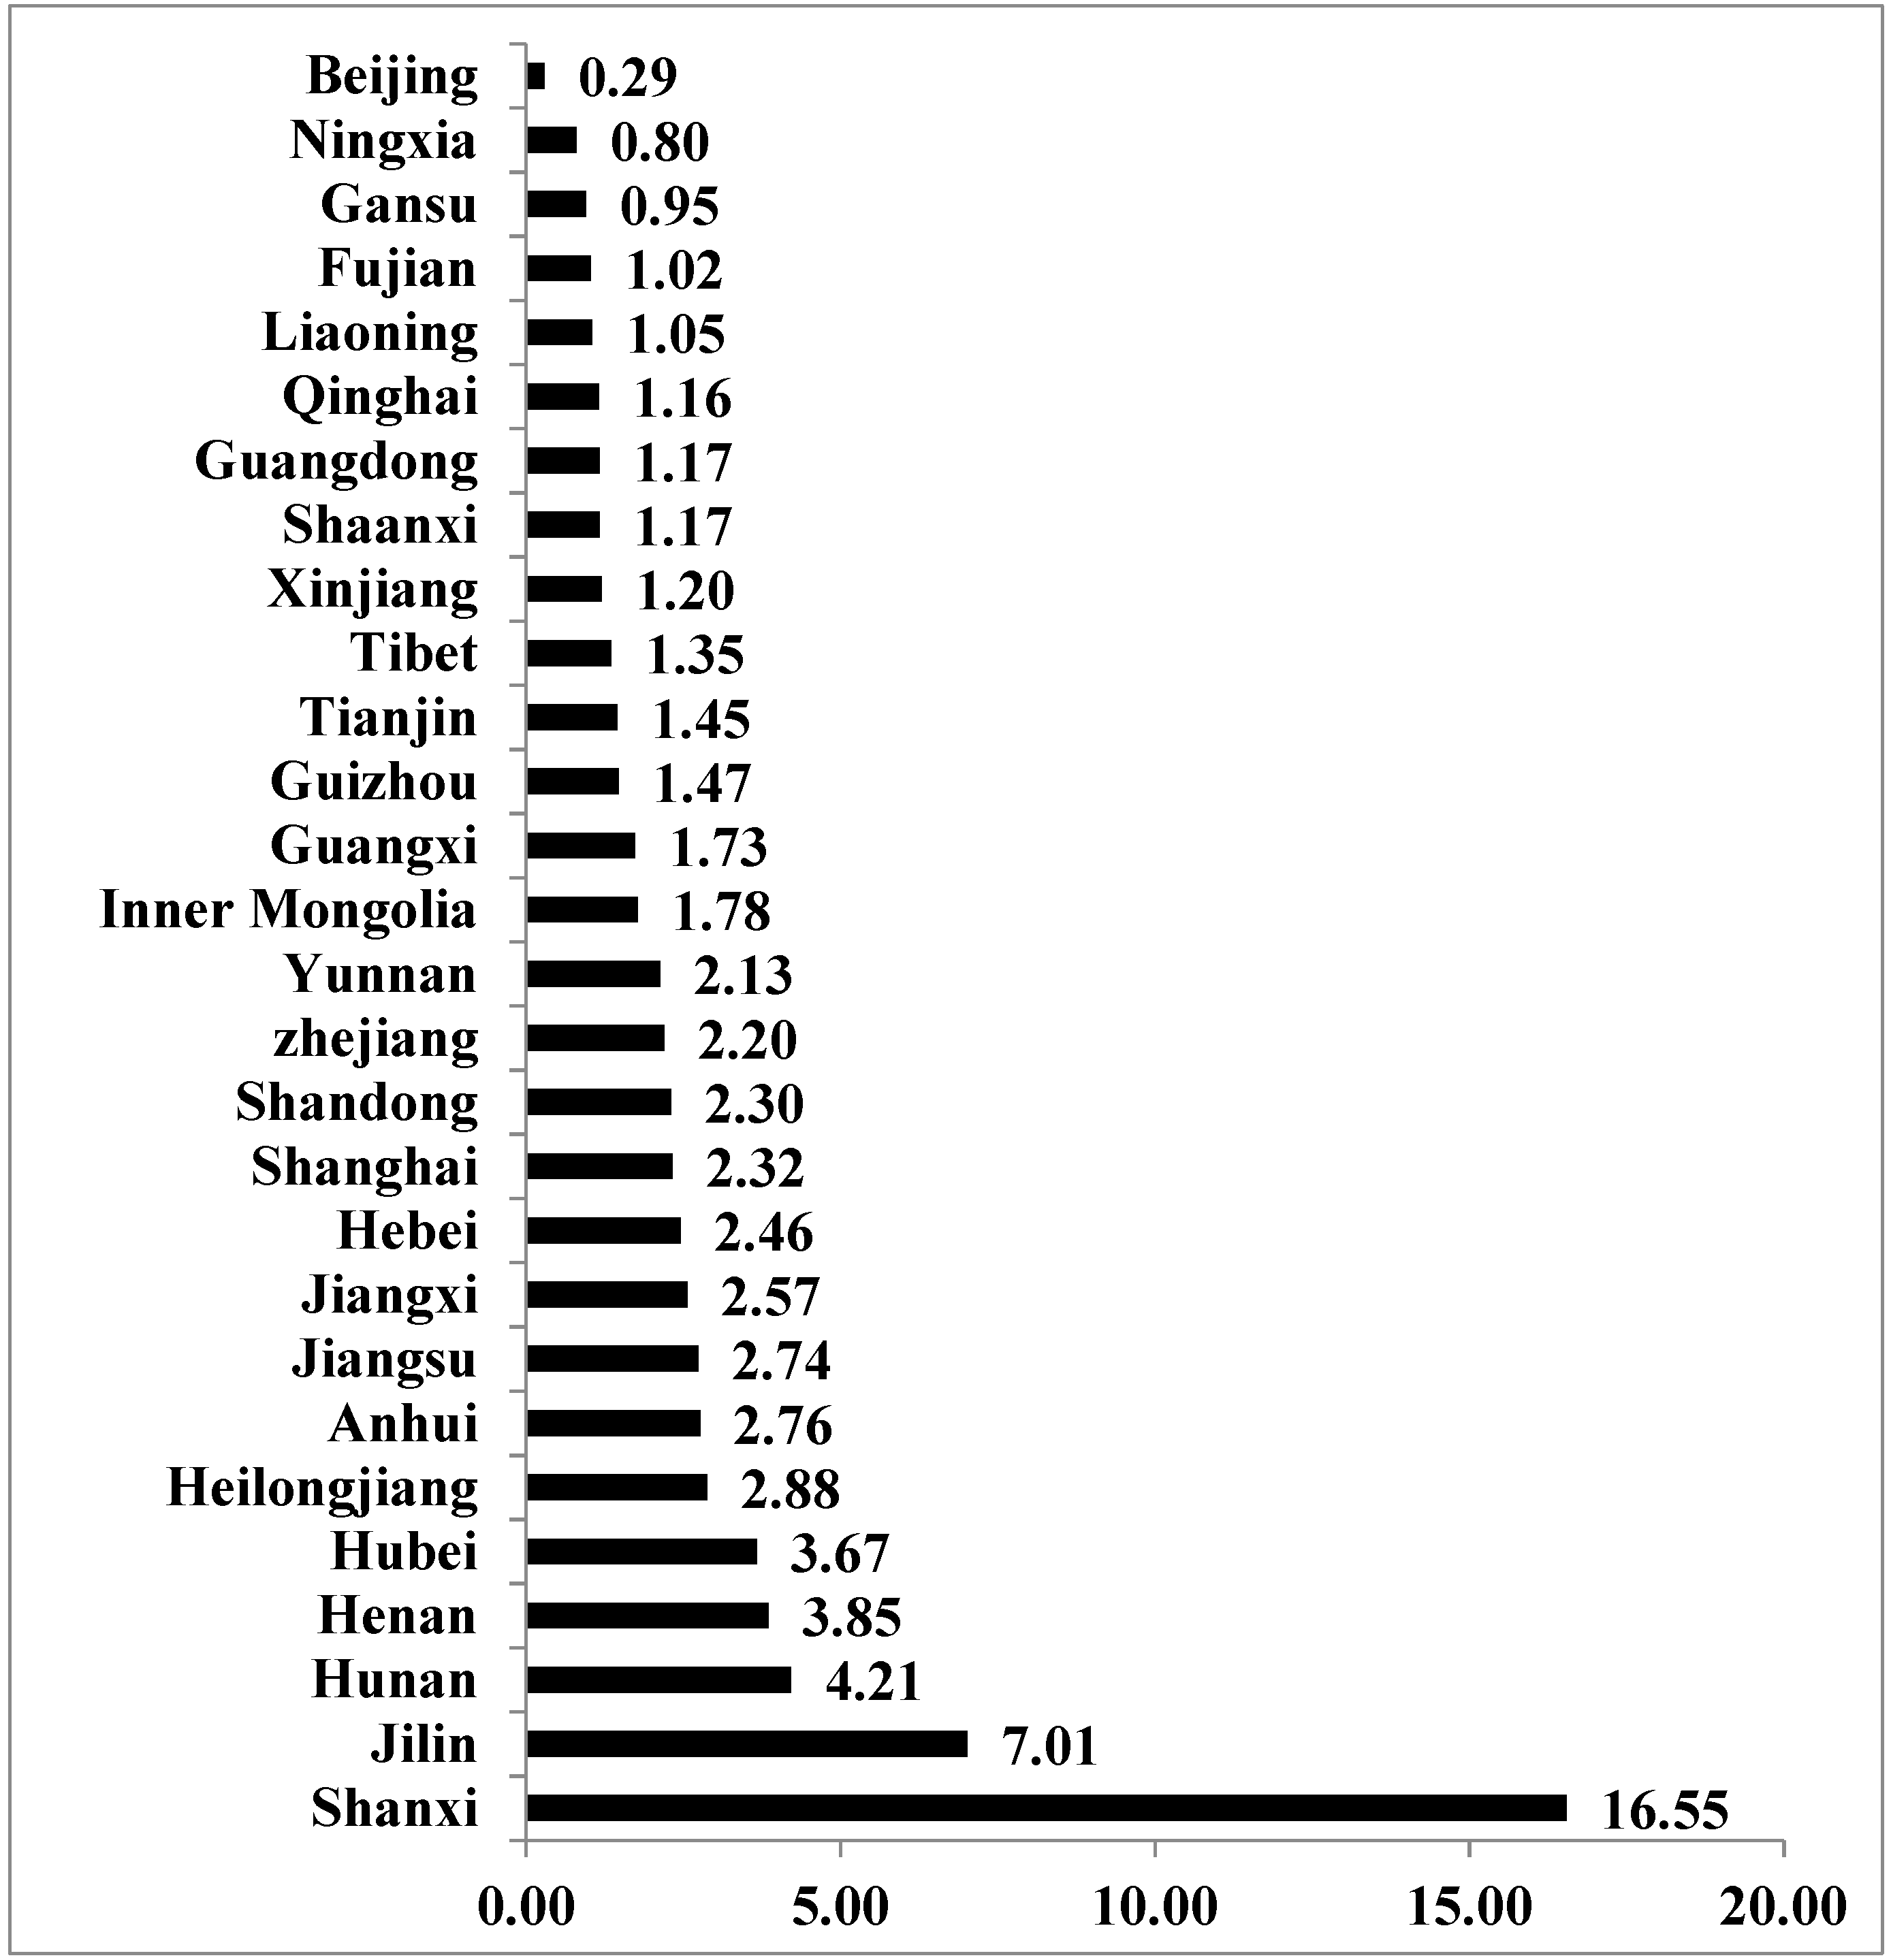
The results of the complex equity distribution indicator comprised by WF/HDI and HDI/Arable land are shown in Figure 7. A smaller equity index means that the same WF consumption needs less arable land input, and the same WF can generate a greater HDI output, which is more sustainable. Beijing, Ningxia, Gansu, Fujian, and Liaoning are the only five provinces for which the equity index is smaller than unity, while the other provinces have an index larger than unity. Jilin and Shanxi are the two provinces with distribution equity indexes larger than 5, while Shanxi is the only province that has an equity index of more than 10, which implies that the production of the five major crops in Shanxi province is nowhere near achieving distribution equity.
3.1.3. Efficiency Assessment
The allocation efficiency index is calculated by the outputs of the five major crops’ WFs, in the first industries, at the provincial level. Provinces with small allocation efficiency indexes need a smaller WF to generate, equally, the agricultural industry’s outcome and are more sustainable in the allocation dimension. In total, 26 out of these 28 provinces have an increase of less than 100 times for the WF output of the five major crops in the agricultural industry (Figure 8). In 2010, the top eight provinces with the highest WF outcomes in the agricultural industry were Qinghai, 149.78 CNY/m³; Tibet, 26.33 CNY/m³; Fujian, 18.32 CNY/m³; Guangdong, 16.91 CNY/m³; Zhejiang, 15.74 CNY/m³; Hebei, 13.82 CNY/m³; and Xinjiang, 11.50 CNY/m³. They are also major agricultural economy provinces, which makes the allocation efficiency analysis more convincing.
3.1.4. A Three-Dimensional Sustainability System Foundation
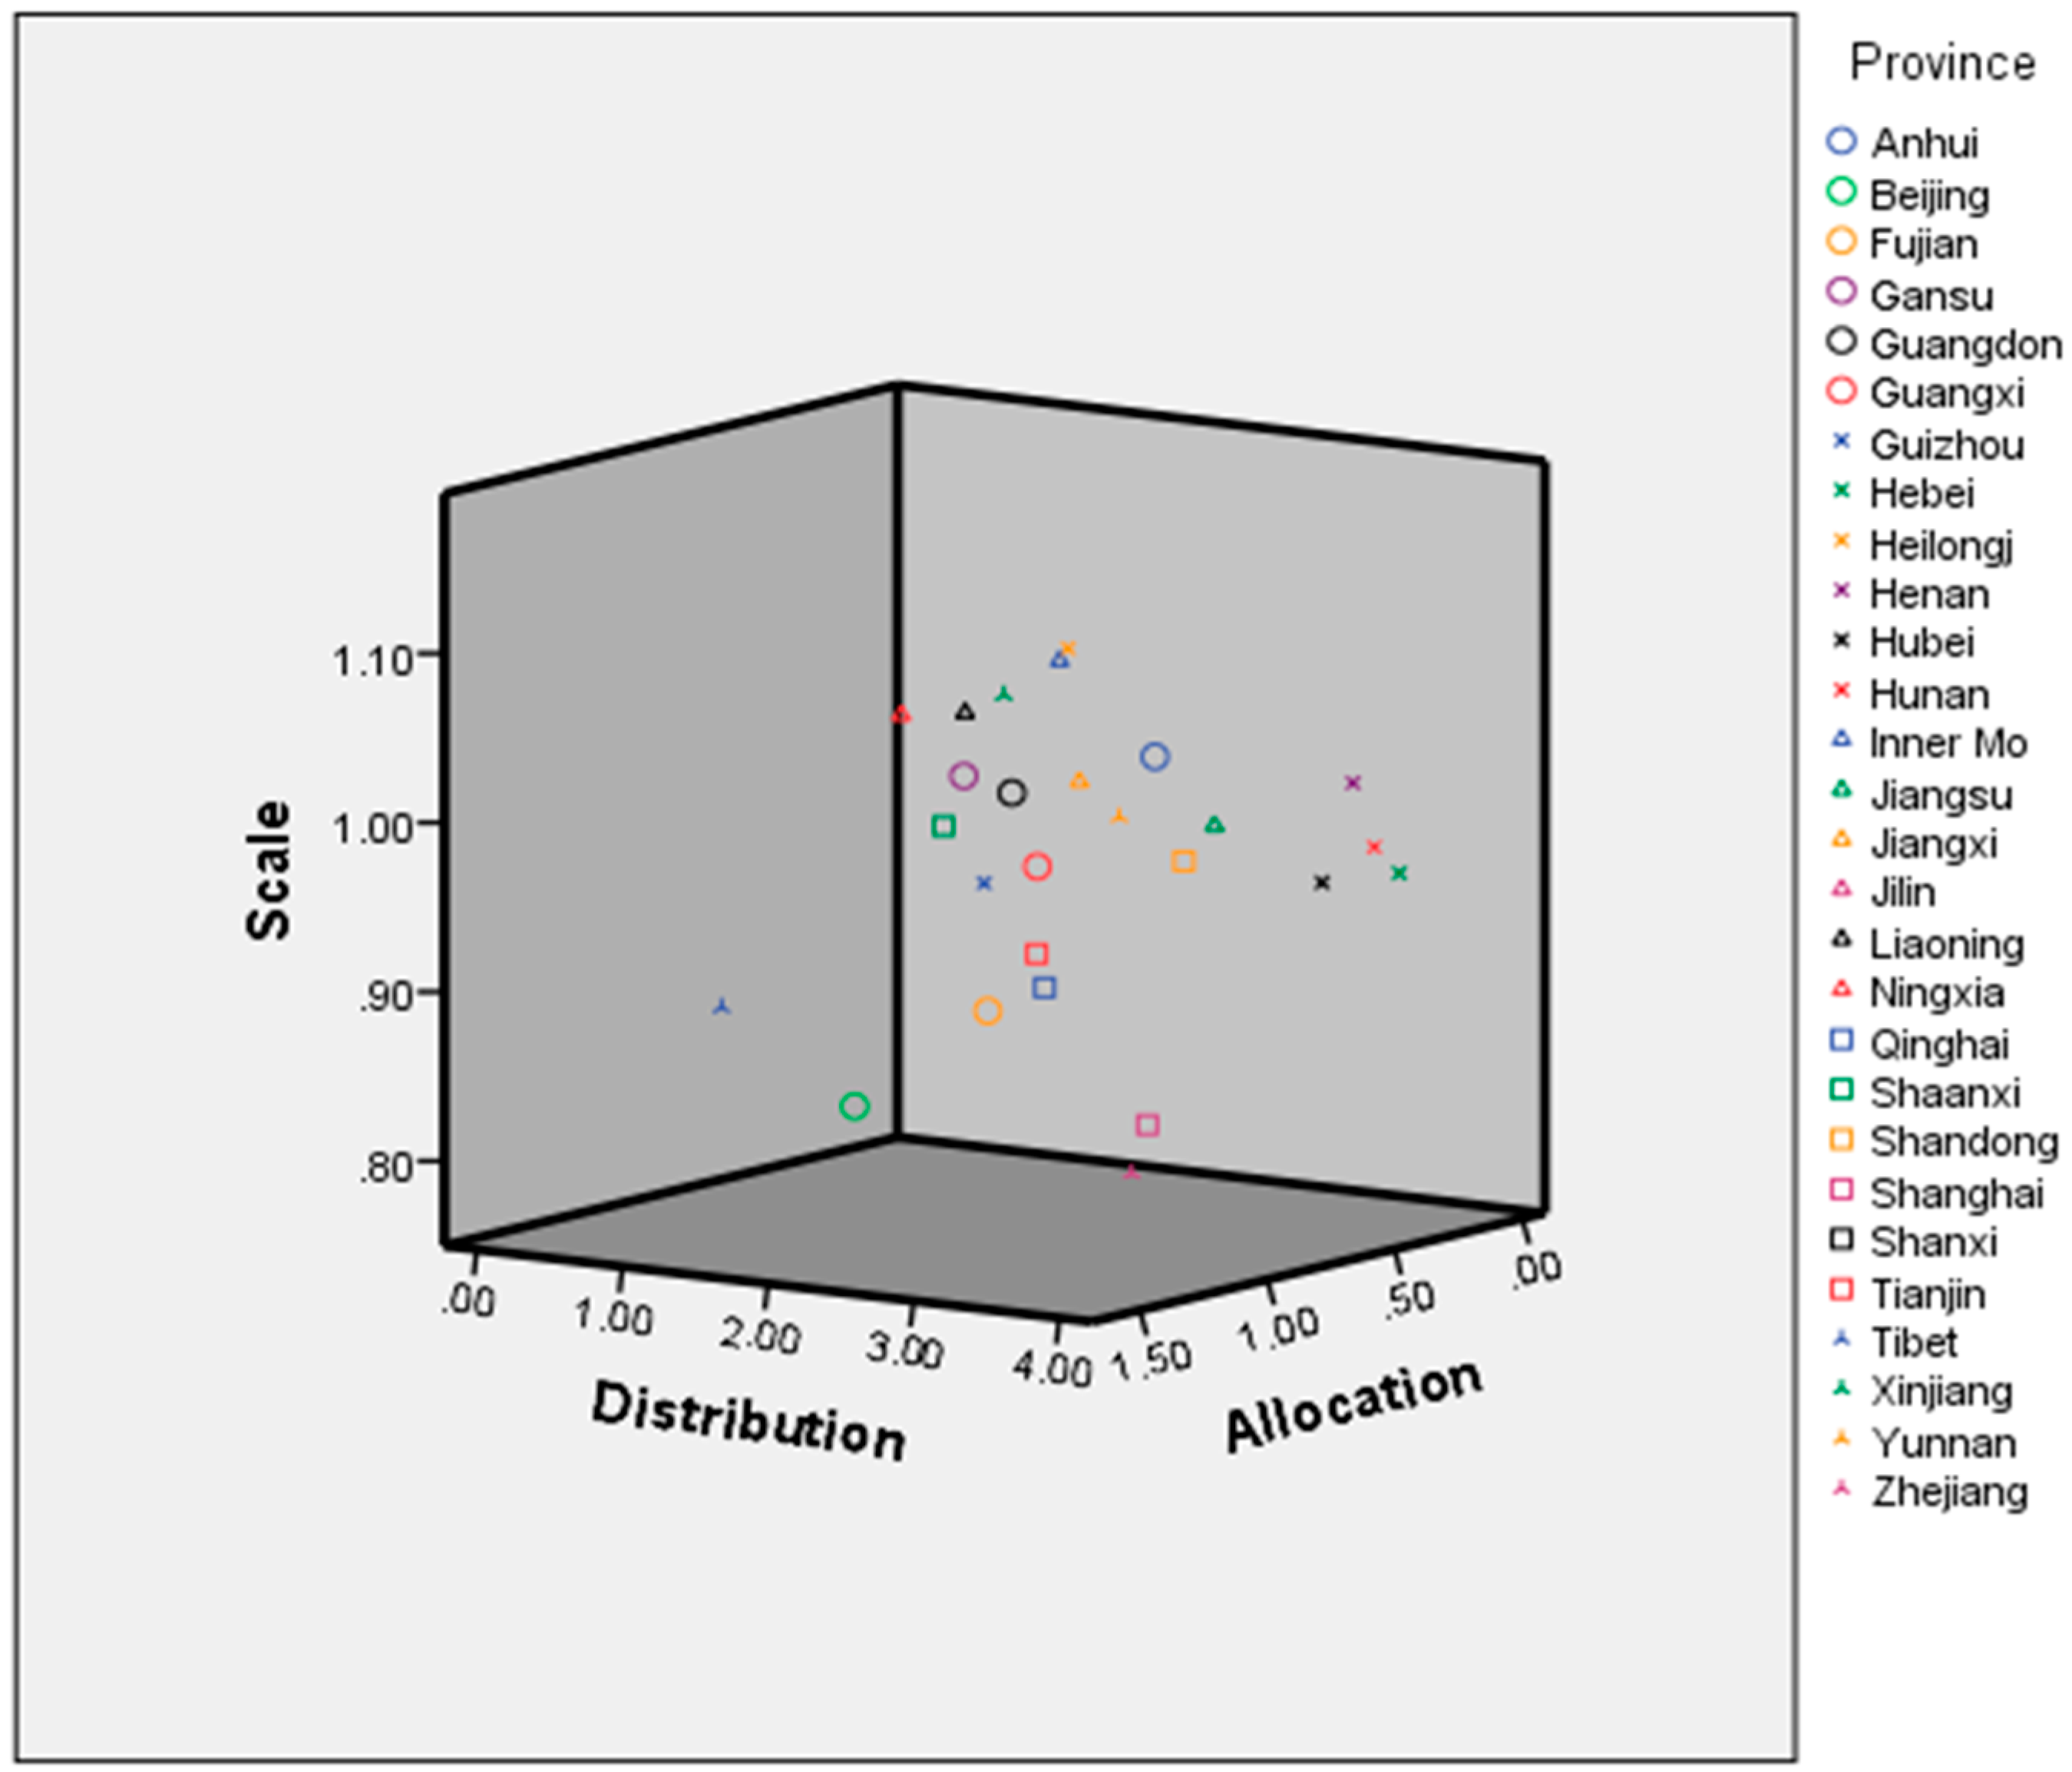
A three-dimensional sustainability image is plotted in Figure 9 by ranking the provinces’ sustainability according to their scale, distribution, and allocation dimensions (Figure 9).
Seven provinces have scale indexes larger than unity, which implies that they have an improper WF scale for the five main food crops. These provinces are Jiangxi, Henan, Liaoning, Anhui, Xinjiang, Jilin Inner Mongolia, and Heilongjiang. These provinces, located in China’s food-production region, take the responsibility of producing food for the whole nation. For these seven provinces, the highest-priority water-management task is bringing down its five major crops’ WFs to a level matching their water endowment.
Regarding distribution, the six provinces’ five major crops’ WF equity distribution indexes are larger than three and are unequally distributed. These provinces are Hubei, Hebei, Henan, Hunan, Jilin, and Shanxi. Of these six provinces, Henan and Jilin neither achieved proper scale nor distribution equity. The other four provinces have already achieved proper scale sustainability and, therefore, need to prioritize distribution equity.
On the allocation aspect, the nine provinces’ five major crops’ WF allocation efficiency indexes are larger than 0.5—much larger than other provinces—implying that they are not allocation efficient. These provinces are Shannxi, Guizhou, Shanxi, Hunan, Anhui, Jilin, Jiangxi, Heilongjiang, and Tibet.
When provinces have high-scale sustainability, their distribution and allocation sustainability are not low, and vice versa. There are also several provinces that have achieved high sustainability for one or two dimensions, but not for the other one or two dimensions. For example, Tibet ranks last in allocation dimension, while its scale sustainability is seventh, and its distribution dimension is 10th out of all 28 provinces. Shannxi, Guizhou, Hunan, and Tibet are four provinces that should focus their allocation efficiency advancement, as they have already achieved proper scale and equity distribution sustainability. This means that allocation is the vital factor to improve the province’s sustainability level. Anhui, Jiangxi, and Heilongjiang have unsustainable scale and allocation dimensions. Shanxi is the only province unsustainable in both the distribution and allocation dimensions.
This paper found only one province, Fujian, to take a top-five place in all three sustainability dimensions. Beijing and Qinghai reached the top five based on two sustainability dimensions. Qinghai is one of the top five best provinces based on the scale and allocation dimensions, while its distribution index takes the sixth place among all the provinces. Heilongjiang province ranks in the bottom five in scale and allocation dimensions, while its distribution sustainability, which ranks 22nd of all 28 provinces, is not high. Jilin province is the only unsustainable province based on these three dimensions.
3.1.5. Case Study of Water Governance in Jilin and Fujian Provinces
Scale Sustainability
From 1978 to 2010, Jilin province’s arable land took up 0.72% of the nation, which is much lower than that of Fujian province, 2.11%. But Jilin province’s five major crops’ WF is 1.60 times greater than that in Fujian province. Jilin province is located in Northeast China, which is recognized as the granary of China. This area includes three provinces, the other two being Heilongjiang and Jilin, which also have a relatively high arable endowment. Heilongjiang has 10.54%, and Liaoning has 4.22%, of the nation’s arable land. Therefore, this area takes the role as the nation’s granary, as well as the responsibility of producing large amounts of cereals. Jilin province, even though it has a relatively low arable endowment, also participates. This could be called the food-production economy’s concentration. Fujian province is widely recognized as a province with low arable land endowment. There is a common saying describing its land allocation: 30% mountain, 60% river, and 10% arable land. Because of its arable-land limitation, Fujian province does not produce much food; instead, it mainly relies on imported food from other provinces. East China, where Fujian province is located, tends to import food rather than produce food, which is the opposite of Northeastern China. These two regions’ food-production types are the main cause of these two province’s five major crops’ scale variation differences.
Distribution Sustainability
Jilin has 0.72% of the nation’s arable land but utilized 4.01% of the nation’s five major crops’ WF production from 1978 to 2010. Fujian has 2.11% of the nation’s arable land, while utilizing 2.51% of the nation’s five major crops’ WF production in the same period. In the analyzed six years, 1997, 1999, 2003, 2005, 2008, and 2010, Jilin province’s annual average HDI was 0.62, and Fujian province’s annual average HDI was 0.77. From both arable-land WF on the input side and HDI on the output side, Jilin lagged behind Fujian.
The input imbalance of Jilin between arable land and WF in five major crops’ production, because of its granary role, also causes its scale to be unsustainable. Even though this province has a relatively small portion of arable land, it put efforts into producing the five major crops, which causes it to have a high WF.
On the output side, food produced in Jilin may not be consumed inside the province but exported to other provinces. According to Zhang and Anadon’s research, Northeast China, where Jilin province is located, has 8.4% of the nation’s arable land endowment, while it only had 4.4% of the nation’s water endowment in 2007 [53]. This region is thus a net-virtual water-export region. In 2007, its net-virtue water export was 8.3 billion m³. East China, where Fujian province is located, was a net-virtual water-import region in 2007. It imported 20.7 billion m³ net-virtual water from other regions in China, 6.0 billion m³ of which comes from Northeast China [53]. The production and consumption separation of these five major crops is the main reason Jilin province’s WF and welfare growth are unsynchronized. For Fujian province, which is a food-crops-importer province, welfare improved notably.
Efficiency Sustainability
From the Food Bureau website, it can be seen that Fujian province makes extensive efforts to perform food-production inspection, grain-purchasing security checks, and food-quality inspection, etc., which can lead to high food-crop productivity. From its water endowment aspect, rivers have sources located in Fujian province and then run across this province and discharge into the sea directly, avoiding being polluted in other provinces, which makes water use efficiency higher than provinces which share rivers with other provinces.
Jilin province’s food bureau websites also mention how to secure food purchase quantity more often, which implies this province pays more attention to how to increase grain yield. As China’s granary, Jilin province takes responsibility to secure its food security, even by paying the price of expending more irrigation water. Food production orientation creates extensive water consumption in producing these five major crops and results in more WF consumption. Jilin province’s agricultural industry GDP is even smaller than Fujian province while its five major crops’ WF are much larger, which caused its WF allocation efficiency to be only 43% of Fujian province on average from 1978 to 2010.
3.2. Discussion
3.2.1. Sustainability Evaluation System
It is not easy to put ecological economics sustainability evaluation principles into practice. While allocation efficiency is easy to calculate, proper scale and equity distribution are not, which means that scale and distribution dimensions are usually omitted in sustainability evaluations. However, scale and distribution are often more important than allocation. For example, equity is more important than efficiency, as “efficiency leads to stronger [results] while equity leads to greater [results]” [54].
Based on the data analysis, the WFs of five major crops approached sustainability in both scale dimensions and allocation dimensions, while their equity distribution fell behind compared to the other two dimensions.
At the national-level scale dimension, the WFs of five major crops increased 5.41 × 10¹¹ m³ from 1978 to 2010, a 20.5% total increase, and a 0.62% annual increase in this period. The domestic WF increase was fairly smooth and caused the agricultural water ratio to drop from around 80% in 1978 to around 60% in 2010. Compared with the agricultural industry’s water increase, the other two industries’ water consumption increased sharply during this period.
At the global dimension, imported WF showed a 93.13% increase from 1978 to 2010, while the domestic production WF 20.5% increase was comparatively low. For domestic production, the result can be called scale sustainability, but the large amount of imports of these five major crops generates pressure on the international food-production markets, because the world took the burden to provide China’s food needs, but not from combined food, land, and water perspectives. This means that WF sustainability should be analyzed at both national and international levels.
For domestic food safety concerns, the explosion in import WFs has also affected domestic food security because of the food dependency and health problems caused by genetically modified food. China’s 5% food-production decrease caused the global food trade to increase by 20% [55]. The increase in imported genetically modified corn and soybean has produced public fears over their potential dangers to human health, the environment, and biodiversity, creating a series of social issues, as well [56].
At the provincial scale level, 19 out of the 28 provinces’ WF/water endowment index from 1978 to 2010 were below 1, while the WF/Water endowment index for the other nine provinces were all below 1.11. This suggests that the WF sustainability for the five major food crops at the provincial scale level was mostly correct.
The distribution equity still needs to be improved. From the input side, 15 out of these 28 analyzed provinces’ WF/Arable land indexes were below unity, while the other 13 provinces’ WF/Arable land indexes were greater than unity. Jilin Province and Shanxi Province were far greater than unity, which is unsustainable. From the output side, the WF/HDI indicators varied considerably, with the lowest being Qinghai and the highest being Hunan (77.17 times the lowest one). For both the input and output side, the equity distribution was far from sustainable.
A further finding from the distribution equity analysis was that food production depends on water and other resources, such as arable land and fossil fuels, thereby making it difficult to concentrate on only one resource’s sustainability, while neglecting the others’ sustainability achievements. This problem calls for multi-resource sustainability analyses in further research.
At the allocation efficiency level, the average WF/Agricultural GDP from 1978 to 2010 was the lowest in Qinghai (0.12) and the highest in Tibet (1.50), which is 12.11 times the lowest value. A total of 26 out of these 28 provinces have an allocation efficiency index lower than unity, which does not generate much variation among the different provinces. Differences exist because different provinces employ diverse kinds of agricultural water policies to improve their allocation efficiencies [1].
3.2.2. Achieving the Long-Term WF Sustainability for Main Food Crops
By comparing the sustainability analyses for the three aspects, it can be found that, in the long-term, distributional equity at the provincial level must be the key factor in achieving sustainable agriculture in China. Allocation efficiency can be achieved at the provincial level, but proper scale and equity distribution need to be arranged on the national level. As these five major crops are strategic commodities, some provinces take particular responsibility to produce food crops that have relatively low economic outcomes but require the input of many resources, such as water and arable land. These crops are goods sold to provinces that do not produce food but would like to pay for food crops. This is the main phenomenon that generates distribution equity unsustainability. For cities with a responsibility to produce food crops, utilizing water from rivers nearby, considering the water extraction and delivering cost, could alleviate its high water consumption in comparison to its water endowment. In the Heilongjiang province, this results with the highest annual WF/annual water resource. For example, Harbin could use water from the Songhua River for irrigation.
3.2.3. Policy Supporting System Foundation
According to ecological economics theory, different policies are required to achieve different dimensions of sustainability goals. These policies could help to achieve scale, distribution, and allocation goals independently. From a scale dimension, these policies would benefit from direct regulation, Pigovian taxes and subsidies, tradable permits, and quotas. Equity distribution policies could include minimum income, caps on income and wealth, rent, public subsidies, land tax, etc. Pricing nonmarket goods and services and subsidies for nonmarket goods would be helpful to achieve the allocation efficiency goal.
For example, in order to alleviate the distribution equity unsustainability, policies are needed to compensate provinces that concentrate on food production. Before 2003, farmers did not get any compensation but had to pay agricultural tax in grain if they produced food crops. After 2003, the situation started to improve, as the government canceled agricultural taxes and gave farmers agricultural subsidies, which are around 10 dollars per acre, on average, at a national level, with variations at a provincial level. These subsidies are relatively low compared to those of some giant food-production countries, such as those in the US. In 2000, in the US, a wheat plantation could get a direct subsidy of 10 dollars per acre. In addition to a direct subsidy, the US government offers farms a subsidy if their arable land reaches a certain area, to a maximum of 40 thousand dollars. The US government’s grain production subsidy is so high that it provides 40% of each farm’s present net income [57].
4. Conclusions
This article has established a sustainability evaluation system based on ecological economics theory, using the proper scale, equity distribution, and efficiency allocation dimensions. With this sustainability evaluation system, we have evaluated the WF sustainability of China’s five major crops from 1978 to 2010. While most provinces are approaching scale sustainability and efficiency sustainability with little provincial divergence, the provincial distribution equity divergence is more significant and represents the biggest hindrance to achieving long-term WF sustainability for the five major crops. The reason for this problem is that regions rich in arable land assume the responsibility of food production, but food trade takes part in the benefits generated by food production to net food imported provinces. Ensuring water-resource endowment as an important consideration in arranging food crop production throughout the country is the key strategy to promote its sustainability. Past research has seldom discussed the distribution of resource equity, while this paper has measured distribution systematically and innovatively.
Based on the WF sustainability divergence of the five major food crops, this research compared water management in the most unsustainable area (Jilin Province) and the most sustainable area (Fujian Province) to refine the general model to promote sustainability of these five major food crops from the perspective of policy. In the long run, it is a great challenge for China to feed 22% of the world’s population with 7% of the world’s arable land and 6% of the world’s water resources, but China remains committed to increasing domestic grain production productivity and reducing grain imports to secure food safety and avoid the threat of the import of genetically modified food.
Author Contributions
Conceptualization, Y.T. and M.R.; methodology, Y.T., M.R. and D.Z.; software, Y.T.; validation, Y.T. and J.D B.; formal analysis, Y.T.; investigation, Y.T.; resources, Y.T.; data curation, Y.T.; writing—original draft preparation, Y.T., M.R. and D.Z.; writing—review and editing, Y.T., M.R., J.D. and N.M.; visualization, Y.T.; supervision, M.R. and D.Z.; project administration, Y.T.; funding acquisition, Y.T.
Acknowledgments
The research presented here was supported in part by the Philosophy and Social Science Youth Program of Shanghai, Grant No. 2016ECK001 and National Science Foundation (Grant No. 71803130). The APC was funded by the Philosophy and Social Science Youth Program of Shanghai, Grant No. 2016ECK001. We appreciate their support. This research has benefited from the helpful comments by the anonymous reviewers.
Conflicts of Interest
The authors declare no conflicts of interest.
References
- Tian, Y.H.; Ruth, M.; Zhu, D.J. Using the IPAT identity and decoupling analysis to estimate WF variations for five major food crops in China from 1978 to 2010. Environ. Dev. Sustain. 2017, 19, 2355–2375. [Google Scholar] [CrossRef]
- Skouteris, G.; Ouki, S.; Foo, D.; Saroj, D.; Altini, M.; Melidis, P.; Cowley, B.; Ells, G.; Palmer, S.; O’Dell, S. WF and water pinch analysis techniques for sustainable water management in brick-manufacturing industry. J. Clean. Prod. 2018, 172, 786–794. [Google Scholar] [CrossRef]
- Murphy, E.; De Boer, I.J.M.; Van Middelaar, C.E.; Holden, N.M.; Shalloo, L.; Curran, T.P.; Upton, J. WF of dairy farming in Ireland. J. Clean. Prod. 2017, 140, 547–555. [Google Scholar] [CrossRef]
- Northey, S.A.; Mudd, G.M.; Saarivuori, E.; Wessman-Jääskeläinen, H.; Haque, N. Water footprint and mining: Where are the limitations and opportunities? J. Clean. Prod. 2016, 135, 1098–1116. [Google Scholar] [CrossRef]
- Sekyere, E.O.; Jordaan, H.; Chouchane, H. Evaluation of WF and economic water productivities of diary products of South Africa. Ecol. Indic. 2017, 83, 32–40. [Google Scholar] [CrossRef]
- Pires, A.; Morato, J.; Peixoto, H.; Botero, V.; Zuluaga, L.; Figueroa, A. Sustainability Assessment of indicators for integrated water resources management. Sci. Total Environ. 2017, 578, 139–147. [Google Scholar] [CrossRef]
- Lovarelli, D.; Bacenetti, J.; Fiala, M. Water footprint of crop productions: A review. Sci. Total Environ. 2016, 548, 236–251. [Google Scholar] [CrossRef]
- ISO 14046. ISO 14046: Environmental Management-Water Footprint-Principles, Requirements and Guidelines; International Organization for Standardization (ISO): Geneva, Switzerland, 2014. [Google Scholar]
- Mekonnen, M.M.; Hoekstra, A.Y. The green, blue and grey water footprint of crops and derived crop products. Hydrol. Earth Syst. Sci. 2011, 15, 1577–1600. [Google Scholar] [CrossRef] [Green Version]
- Gustafson, D.; Gutman, A.; Leet, W.; Drewnowski, A.; Fanzo, J.; Ingram, J. Seven food system metrics of sustainable nutrition security. Sustainability 2016, 8, 196. [Google Scholar] [CrossRef]
- Hoekstra, A.Y.; Chapagain, A.K.; Aldaya, M.M.; Mekonnen, M.M. The WF assessment manual: Setting the global standard. In WF Network, 1st ed.; Earthscan: New York, NY, USA, 2011. [Google Scholar]
- Zhao, X.; Tillotson, M.R.; Liu, Y.W.; Guo, W.; Yang, A.H.; Li, Y.F. Index decomposition analysis of urban crop water footprint. Ecol. Model. 2017, 348, 25–32. [Google Scholar] [CrossRef] [Green Version]
- Muratoglu, A. Water footprint assessment within a catchment: A case study for Upper Tigris River Basin. Ecol. Indic. 2019, 106, 105–467. [Google Scholar] [CrossRef]
- Zhai, Y.J.; Tan, X.F.; Ma, X.T.; An, M.G.; Zhao, Q.L.; Shen, X.X.; Hong, J.L. Water footprint analysis of wheat production. Ecol. Indic. 2019, 102, 95–102. [Google Scholar] [CrossRef]
- Cao, X.; Huang, X.; Huang, H.; Liu, J.; Guo, X.; Wang, W.; She, D. Changes and driving mechanism of water footprint scarcity in crop production: A study of Jiangsu Province, China. Ecol. Indic. 2018, 95, 444–454. [Google Scholar] [CrossRef]
- Luan, X.; Wu, P.; Sun, S.; Wang, Y.; Gao, X. Quantitative study of the crop production water footprint using the SWAT model. Ecol. Indic. 2018, 89, 1–10. [Google Scholar] [CrossRef]
- Xu, Z.; Chen, X.; Wu, S.R.; Gong, M.; Du, Y.; Wang, J.; Li, Y.; Liu, J. Spatial-temporal assessment of water footprint, water scarcity and water productivity in a major crop production region. J. Clean. Prod. 2019, 224, 375–383. [Google Scholar] [CrossRef]
- Vanham, D.; Hoekstra, A.Y.; Wada, Y.; Bouraoui, F.; De Roo, A.; Mekonnen, M.M.; Van de Bund, W.J.; Batelaan, O.; Pavelic, P.; Bastiaanssen, W.G.M.; et al. Physical water scarcity metrics for monitoring progress towards SDG target 6.4: An evaluation of indicators 6.4.2 Level of water stress. Sci. Total Environ. 2018, 614, 218–232. [Google Scholar] [CrossRef]
- Novoa, V.; Rudolph, R.A.; Rojas, O.; Munizaga, J.; Sáez, K.; Arumí, J.L. Sustainability assessment of the agricultural water footprint in the Cachapoal River Basin, Chile. Ecol. Indic. 2019, 98, 19–28. [Google Scholar] [CrossRef]
- Sokolow, J.; Kennedy, G.; Attwood, S. Managing crop tradeoffs: A methodology for comparing the water footprint and nutrient density of crops for food system sustainability. J. Clean. Prod. 2019, 225, 913–927. [Google Scholar] [CrossRef]
- Richter, B.D.; Davis, M.M.; Apse, C.; Konrad, C.A. A presumptive standard for environmental flow protection. River Res. Appl. 2011, 8, 1312–1321. [Google Scholar] [CrossRef]
- Zeng, Z.; Liu, J.; Koeneman, P.H.; Zarate, E.; Hoekstra, A.Y. Assessing water footprint at river basin level: A case study for the Heine River Basin in northwest China. Hydrol. Earth Syst. Sci. 2012, 16, 2771–2781. [Google Scholar] [CrossRef]
- Juwana, I.; Muttil, B.J.C.; Perera, B.J.C. Indicator-based water sustainability assessment—A review. Sci. Total Environ. 2012, 438, 357–371. [Google Scholar] [CrossRef] [PubMed]
- Farley, J.; Daly, H.E. Ecological Economics: Principles and Applications; Island Press: Washington, DC, USA, 2003; Available online: http://library.uniteddiversity.coop/Measuring_Progress_and_Eco_Footprinting/Ecological_Economics-Principles_and_Applications.pdf (accessed on 31 October 2019).
- Esty, D.C.; Levy, M.; Srebotnjak, T.; De Sherbinin, A. 2005 Environmental Sustainability Index: Benchmarking national environmental stewardship. New Haven Yale Cent. for Environ. Law Policy 2005. Available online: https://sedac.ciesin.columbia.edu/es/esi/ESI2005_Main_Report.pdf (accessed on 31 October 2019).
- Spangenberg, J.H. Reconciling sustainability and growth: Criteria, indicators, policies. Sustain. Dev. 2004, 12, 74–86. [Google Scholar] [CrossRef]
- Yale Center for Environmental Law & Policy, Yale University and Center for International Earth Science Information Network, Columbia University 2018 Environmental Performance index. Available online: https://epi.envirocenter.yale.edu/downloads/epi2018reportv06191901.pdf (accessed on 31 October 2019).
- Allen, R.P. The wellbeing of nations. Soc. Indic. Res. 2002, 91, 5–21. [Google Scholar]
- Wakernagel, M.; Rees, W.E. Our Ecological Footprint: Reducing Human Impact on the Earth; New Society Publishers: Gabriola Island, BC, Canada, 1996; ISBN 9780865713123. [Google Scholar]
- Cobb, J.B.; Daly, H.E. For the Common Good: Redirecting the Economy Towards Community, the Environment, and A Sustainable Future; Beacon Press: Boston, MA, USA, 1989; ISBN 0-8070-3702-3. [Google Scholar]
- Rodríguez-Serrano, I.; Caldés, N.; De la Rúa, C.; Lechón, Y. Assessing the three sustainability pillars through the Framework for Integrated Sustainability Assessment (FISA): Case study of a Solar Thermal Electricity project in Mexico. J. Clean. Prod. 2017, 149, 1127–1143. [Google Scholar] [CrossRef]
- Wiedmann, T.; Lenzen, M.; Turner, K.; Barrett, J. Examining the global environmental impact of regional consumption activities-Part 2; review of input-output models for the assessment of environmental impacts embodied in trade. Ecol. Econ. 2007, 61, 15–26. [Google Scholar] [CrossRef]
- Daly, H.E. The return of Lauderdale’s paradox. Ecol. Econ. 1998, 25, 21–23. [Google Scholar] [CrossRef]
- Farley, J.; Daly, H.E. Natural capital: The limiting factor—A reply to Aronson, Blignaut, Milton and Clewell. Ecol. Econ. 2006, 28, 6–10. [Google Scholar]
- Carraro, C.; Campagnolo, L.; Eboli, F.; Lanzi, E.; Parrado, R.; Portale, E. Quantifying Sustainability: A New Approach and World Rankings; Fondazione Eni Enrico Mattei (FEEM): Venice, Italy, 2012. [Google Scholar]
- Zhang, X.; Wang, Y.; Qi, Y.; Wu, J.; Liao, W.; Shui, W.; Zhang, Y.; Deng, S.; Peng, H.; Yu, X.; et al. Evaluating the trends of China’s ecological civilization construction using a novel indicator system. J. Clean. Prod. 2016, 133, 910–923. [Google Scholar] [CrossRef]
- Buyukozkan, G.; Karabulut, Y. Energy project performance evaluation with sustainability perspective. Energy 2017, 119, 549–560. [Google Scholar] [CrossRef]
- Martínez, F.P.; Paz, J.M.M. The WF as an indicator of environmentalsustainability in water use at the river basin level. Sci. Total Environ. 2016, 571, 561–574. [Google Scholar] [CrossRef]
- Spiller, M. Adaptive capacity indicators to assess sustainability of urban water systems—Current application. Sci. Total Environ. 2016, 569, 751–761. [Google Scholar] [CrossRef] [PubMed]
- Srivastava, M. Framework to assess city-scale sustainability. Procedia Eng. 2016, 145, 1440–1447. [Google Scholar] [CrossRef]
- Zhang, C.; Chen, W.Q.; Liu, G.; Zhu, D.J. Economic growth and the evaluation of material cycles: An analytical framework integration material flow and stock indicators. Ecol. Econ. 2017, 140, 263–274. [Google Scholar] [CrossRef]
- Kang, P.; Xu, L.Y. Water environmental carrying capacity assessment of an industrial park. Procedia Environ. Sci. 2012, 13, 879–890. [Google Scholar] [CrossRef]
- Young, P.H. Equity: In Theory and Practice; Princeton University Press: Princeton, NJ, USA, 1994. [Google Scholar]
- Hu, Z.N.; Chen, Y.Z.; Yao, L.M.; Wei, C.; Li, C. Optimal allocation of regional water resources: From a perspective of equity-efficiency trade off. Resour. Conserv. Recycl. 2016, 109, 102–113. [Google Scholar] [CrossRef]
- Gunn, E.L.; Zorrilla, P.; Prieto, F.; Llamas, M.R. Lost in translation? Water efficiency in Spanish agriculture. Agric. Water Manag. 2016, 108, 83–95. [Google Scholar] [CrossRef]
- Zhu, X.J.; Yu, G.R.; Wang, Q.F.; Hu, Z.M.; Zheng, H.; Li, S.G.; Sun, X.M.; Zhang, Y.P.; Yan, J.H.; Wang, H.M.; et al. Spatial variability of water use efficiency in China’s terrestrial eco-systems. Glob. Planet. Chang. 2015, 129, 37–44. [Google Scholar] [CrossRef]
- Halsema, G.E.; Vincent, L. Efficiency and productivity terms of water management: A matter of contextual relativism versus general absolutism. Agric. Water Manag. 2012, 108, 9–15. [Google Scholar] [CrossRef]
- Wang, L.Z.; Fang, L.P.; Hipel, K.W. Basin-wide cooperative water resources allocation. Eur. J. Oper. Res. 2008, 190, 798–817. [Google Scholar] [CrossRef]
- Jarillo, M.P.; Pedraza, L.; Ger, P.M.; Bocos, E. Challenges of online higher education in the face of the sustainability objectives of the United Nations: Carbon footprint, accessibility and social inclusions. Sustainability 2019, 11, 5580. [Google Scholar] [CrossRef]
- UN. Transforming Our World: The 2030 Agenda for Sustainable Development; United Nations: New York, NY, USA, 2015. [Google Scholar]
- CAS. Report on the Sustainable Development Goals Supported by Big Data of the Earth; Chinese Academy of Sciences: Beijing, China, 2019. [Google Scholar]
- National Bureau of Statistics of China (NBSC). China Statistical Yearbook; China Statistics Press: Beijing, China, 2012. [Google Scholar]
- Zhang, C.; Anadon, L.D. A multi-regional input-output analysis of domestic virtual water trade and provincial water footprint in China. Ecol. Econ. 2014, 100, 159–172. [Google Scholar] [CrossRef]
- Leung, H.L. The Cultural DNA of Western Civilization; Sdxjoint Publishing Company: Shanghai, China, 2014. [Google Scholar]
- Guan, J.W.; Liu, W.C. Forecast of Africa’s food problems in 2030 and its impacts on China. Territ. Resour. Inf. 2017, 8, 31–38. [Google Scholar]
- Garau, G.; Ranchhod, A. The futures of genetically-modified foods: Global threaten or panacea? Futures 2016, 83, 24–36. [Google Scholar] [CrossRef]
- Xu, H.J. U.S grain production subsidies and its revelation to China. Price Issue 2010, 3, 6–18. [Google Scholar]
Figure 1.
Sustainability indicators and evaluation method.

Figure 2.
Five main food crops’ production and net import water footprints (WFs) (1978 to 2010).

Figure 3.
Five major crops’ net imported WF (1978 to 2010).

Figure 4.
Annual average WF percentage of the five major crops (1978 to 2010).

Figure 5.
The provincial proper scale index for the five major food crops’ WFs.

Figure 6.
Scatter plot of the arable land endowment and the five major crops’ total WF.

Figure 7.
Five major crops’ production WF distribution equity index, 1.

Figure 8.
Effect of the agricultural industry’s economic growth on the WF variance of the five main food crops in China (1978–2010), CNY /m3.
Figure 8.
Effect of the agricultural industry’s economic growth on the WF variance of the five main food crops in China (1978–2010), CNY /m3.

Figure 9.
Three-dimensional graph of a sustainability assessment for the five major crops’ WFs in China (1978–2010).
Figure 9.
Three-dimensional graph of a sustainability assessment for the five major crops’ WFs in China (1978–2010).

© 2019 by the authors. Licensee MDPI, Basel, Switzerland. This article is an open access article distributed under the terms and conditions of the Creative Commons Attribution (CC BY) license (http://creativecommons.org/licenses/by/4.0/).
Share and Cite
MDPI and ACS Style
Tian, Y.; Ruth, M.; Zhu, D.; Ding, J.; Morris, N. A Sustainability Assessment of Five Major Food Crops’ Water Footprints in China from 1978 to 2010. Sustainability 2019, 11, 6179. https://0-doi-org.brum.beds.ac.uk/10.3390/su11216179
AMA Style
Tian Y, Ruth M, Zhu D, Ding J, Morris N. A Sustainability Assessment of Five Major Food Crops’ Water Footprints in China from 1978 to 2010. Sustainability. 2019; 11(21):6179. https://0-doi-org.brum.beds.ac.uk/10.3390/su11216179
Chicago/Turabian StyleTian, Yuanhong, Matthias Ruth, Dajian Zhu, Jinfeng Ding, and Nicholas Morris. 2019. "A Sustainability Assessment of Five Major Food Crops’ Water Footprints in China from 1978 to 2010" Sustainability 11, no. 21: 6179. https://0-doi-org.brum.beds.ac.uk/10.3390/su11216179
Note that from the first issue of 2016, this journal uses article numbers instead of page numbers. See further details here.