Article

Performance Evaluation of Unconcentrated Photovoltaic-Thermoelectric Generator Hybrid System under Tropical Climate

by
Nursyahirah Mohd Shatar
1,
Mohd Azizi Abdul Rahman
1,*,
Mohd Nabil Muhtazaruddin
2,
Sheikh Ahmad Zaki Shaikh Salim
3,
Baljit Singh
4,
Firdaus Muhammad-Sukki
5,*,
Nurul Aini Bani
2,
Ahmad Shakir Mohd Saudi
6,* and
Jorge Alfredo Ardila-Rey
7
1
Advanced Vehicle System Research Group, Universiti Teknologi Malaysia, Jalan Sultan Yahya Petra, Kuala Lumpur 54100, Malaysia
2
Razak Faculty of Technology and Informatics, Universiti Teknologi Malaysia, Jalan Sultan Yahya Petra, Kuala Lumpur 54100, Malaysia
3
Wind Engineering for (Urban, Artificial, Man-made) Environment Laboratory, Universiti Teknologi Malaysia, Jalan Sultan Yahya Petra, Kuala Lumpur 54100, Malaysia
4
Faculty of Mechanical Engineering, Universiti Teknologi MARA (UiTM), Shah Alam 40450, Selangor, Malaysia
5
School of Engineering, Robert Gordon University, Garthdee Road, Aberdeen, Scotland AB10 7GJ, UK
6
Environmental Health Research Cluster, Environmental Healthcare Section, Institute of Medical Science Technology, Universiti Kuala Lumpur, Kajang 43000, Selangor, Malaysia
7
Department of Electrical Engineering, Universidad Técnica Federico Santa María, Santiago de Chile 8940000, Chile
*
Authors to whom correspondence should be addressed.
Sustainability 2019, 11(22), 6192; https://0-doi-org.brum.beds.ac.uk/10.3390/su11226192
Submission received: 9 October 2019 / Revised: 1 November 2019 / Accepted: 4 November 2019 / Published: 6 November 2019
(This article belongs to the Special Issue Suitable Agronomic Techniques for Sustainable Agriculture)

Abstract

:
Indoor farming is among the approaches which can be adapted to improve agricultural sustainability and ensure the food security of countries. However, adopting indoor farming requires a high amount of energy to sustain the system. Incorporating a renewable energy system for supplying power to agricultural activities will allow the system to be more sustainable in the long run. An unconcentrated photovoltaic-thermoelectric generator (PV-TEG) hybrid system is designed based on the load requirement of an indoor farm. The hybrid system performance under Malaysia’s weather conditions was investigated and analyzed over three months. The designed system has shown its ability to provide sufficient power to the load, as well as supporting an additional load. Besides that, the TEGs power output was found to be dependent on the temperature as well as the types of connections used, where a higher temperature difference and series connection exhibited a better power output. Overall, the combination of the system showed that the addition of a TEG affects the efficiency and power output as compared to a standalone PV. Therefore, this implies that the hybrid system is able to exhibit a more positive outcome in certain weather conditions than a PV standalone system.

1. Introduction

Indoor farming has been considered as an alternative measure to dealing with low and inconsistent food supplies from conventional agriculture. Drastic weather changes caused by global warming have pushed farmers and the agriculture industry to seek other forms of farming which provide a more dependable food source [1]. Urban farming methods, which include vertical farming, rooftop greenhouses and indoor farms, have been highly adopted as the human population continues to increase [2,3]. Urban indoor farms have advantages when compared to conventional outdoor farms, including lower carbon footprints, more efficient use of farming inputs, and year-round crop output. Nonetheless, the strongest disadvantage of adopting indoor farms is the high amount of energy sources required to maintain an optimum growth environment [4]. A large amount of electricity is needed to sustain indoor farms due to the usage of artificial lighting, automatic devices, heating, cooling, and ventilation. More than half of the share of electricity production comes from fossil fuel sources, which include coal, natural gas, and oils [5]. The emission of greenhouses gases from the burning of fossil fuels has negatively impacted the environment, causing global warming, acid rains, and rising sea levels [6]. Increasing the use of alternative energy sources is crucial in order to avoid causing further damage to the environment. The usage of renewable energy sources, such as wind, hydro, biomass, wave, solar and geothermal, have shown an increase in the recent years [7]. This change is expected to continue and accelerate the conversion of primary energy sources from fossil fuels to renewable energy sources. Solar energy is the most easily obtainable form of energy, especially with the availability of solar photovoltaic (PV) panels and solar thermal collectors.
Solar energy has been implemented on agricultural land as a cost-saving measure by mitigating the power supply from the grid by using solar PV panels, as well as helping farmers gain additional income from selling electricity [8]. Adopting solar PV for electricity generation while growing crops has shown its benefits, thus leading to a substantial amount of different research on the feasibility of implementing this approach [9,10,11,12]. Moreover, the crucial need for sustainable agriculture causes a shift in the farming approach to introducing solar energy technologies to support the electricity usage for agricultural activities [13]. However, the reliability of a standalone PV is questionable since the power output is entirely dependent on the solar irradiation received and is sensitive to ambient temperature changes [14,15]. Thus, combining solar PV with other renewable energy technologies could help to improve its reliability and performance. Recently, solar photovoltaic-thermoelectric generator (PV-TEG) hybrid systems have been gaining the interest of many researchers as one of the more promising solar hybrids. A TEG is a solid-state device with no moving parts, which makes it easily integrated with other applications. Due to its principle of converting heat into electricity, it is usually used in waste heat recovery applications. This makes TEGs attractive to be coupled with solar PV, where excess heat from the PV panel can be used to produce additional electricity.
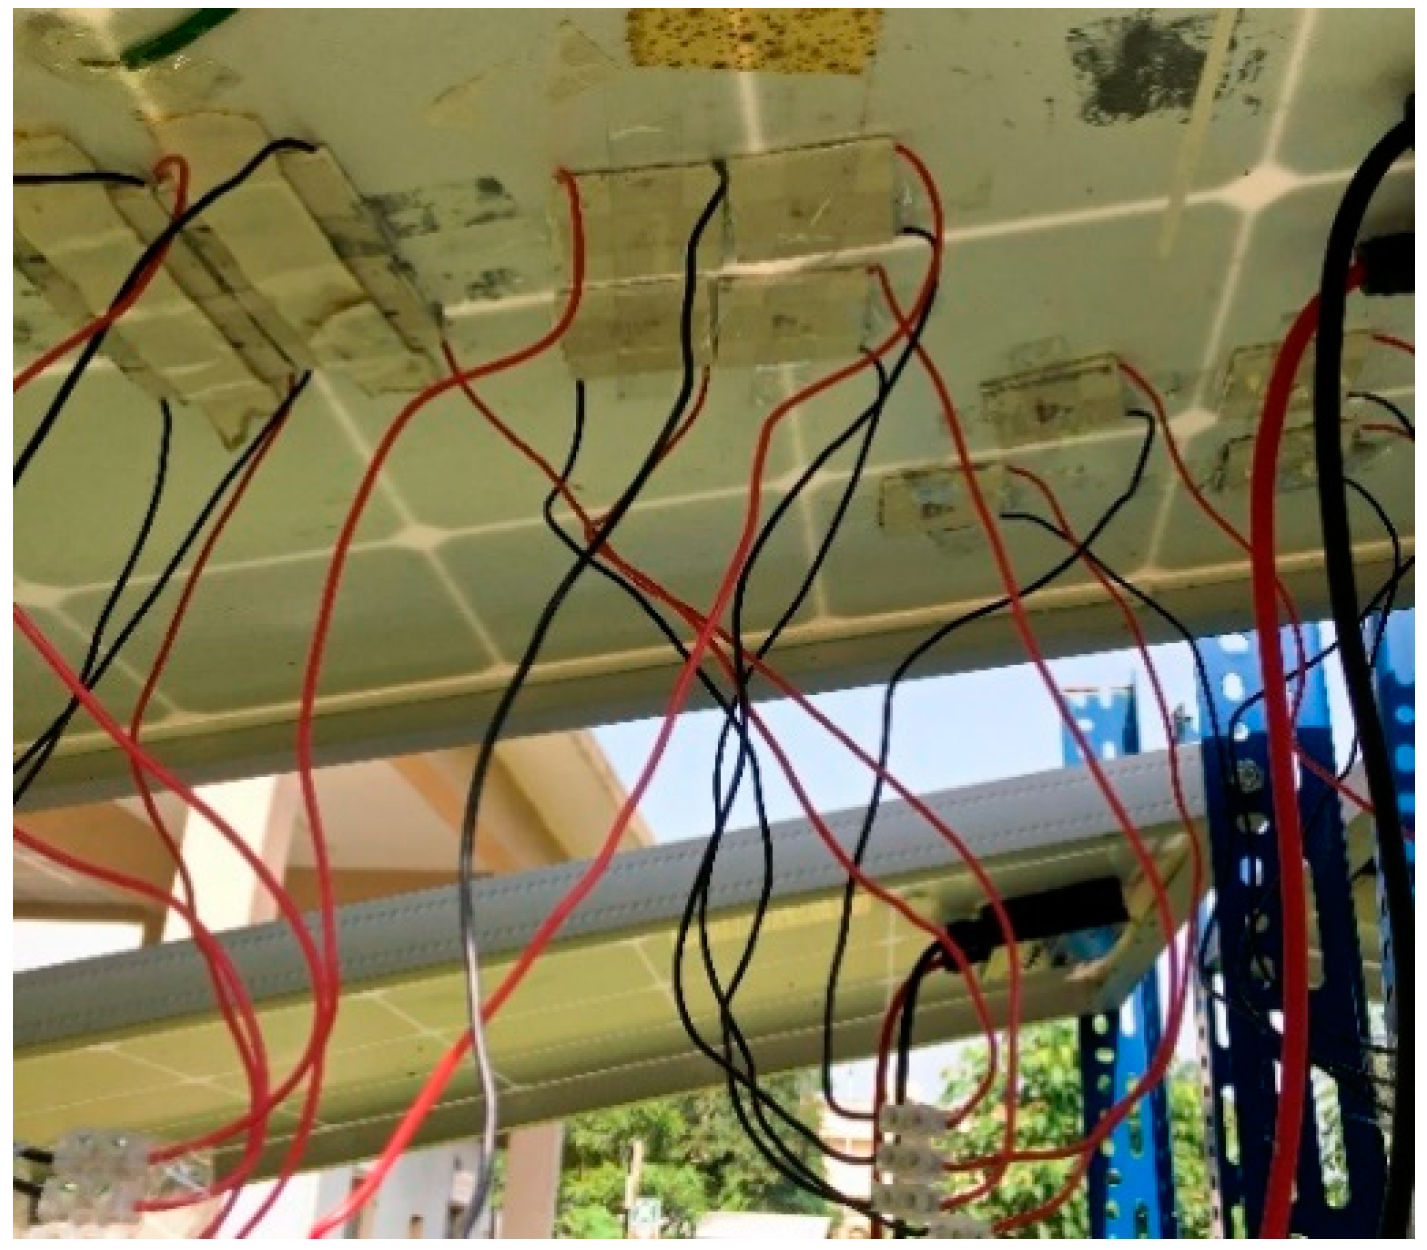
The unconcentrated PV-TEG is the most commonly studied system. The typical arrangement of the hybrid system is to attach the TEG behind the PV panel. Often a heat sink is introduced in order to maintain a constant cold side temperature [16,17,18]. The arrangement of TEG with PV plays a vital role in producing the maximum overall power output by the hybrid system. In an unconcentrated PV-TEG system, PV and TEG would thermally benefit more with a series connection, as opposed to a separate tandem arrangement as reported by Bjørk and Nielsen, 2018 [19]. The analytical investigation showed that a tandem arrangement using spectrum separation only increased the maximum efficiency by 1.8%, as compared to a combined system of 4.5%. Zhang and Xuan, 2019 [20] found that a V-type groove arrangement for a PV-TEG achieved a slightly higher efficiency than the typical flatly combined arrangement, due to an improvement in the PV cell’s absorptivity.
Besides that, the types of solar PV used in the hybrid system also impact the overall efficiency of the system. Kossyvakis et al., 2016 [21], carried out some lab experiments using different solar cells combined with a TEG. The hybrid system is able to provide a higher power output when combined with dye-sensitized solar cell than with a polysilicon solar cell at room temperature operation. This finding aligned with Bjørk and Nielsen, 2015 [22], where cadmium telluride achieved the highest efficiency compared to polysilicon, amorphous, and copper indium gallium selenide (CIGS). However, both studies found that the overall efficiency of the system deteriorates with increment in temperature due to the loss of efficiency from the PV cells.
Other factors, such as a TEG’s figure of merit (zT) and weather conditions, play a crucial role in ensuring that the maximum power output is achievable for the hybrid system. Van Sark, 2011 [16], investigated the feasibility of PV-TEG hybrid modules where a model of the hybrid system was created and simulated. The author found that the hybrid system produces an increase in efficiency between 8% and 23% according to the type of PV module integration at a constant figure of merit value. The author emphasized on possible further improvement in the overall efficiency through increment on the figure of merit value of the TEG. This was supported by Chávez-Urbiola et al., 2012 [17], through theoretical analysis on the efficiency of a TEG, which was higher for zT = 4 than zT = 2.4. Other than that, the internal resistance of the combined system circuit must be minimized in order to avoid unnecessary power losses. Park et al., 2013 [18], reported an increase of 3.8% through the addition of a TEG to a sole PV circuit, given that coupling losses were made between the PV cell and the TEG. The author mentioned that the potential of upscaling the hybrid system would result in a better overall performance.
Moreover, the PV-TEG system has also been modelled to investigate the effect of actual weather conditions on the hybrid system. Rezania et al., 2016 [23], evaluated the potential of the hybrid system under the weather of several sample cities in Europe using a thermal equivalent model. The authors found that the summer weather condition produces a higher power output than in winter for the hybrid system. However, the opposite holds for the overall efficiency of the system where a slight drop in efficiency was observed in July as compared to in January. Yin et al., 2018 [24], used one day weather data in Nanjing, China to analyze the one day performance of the PV-TEG system. The findings showed an improved performance of the hybrid system, especially during 11:00 to 13:00, where the highest TEG efficiency was obtained.
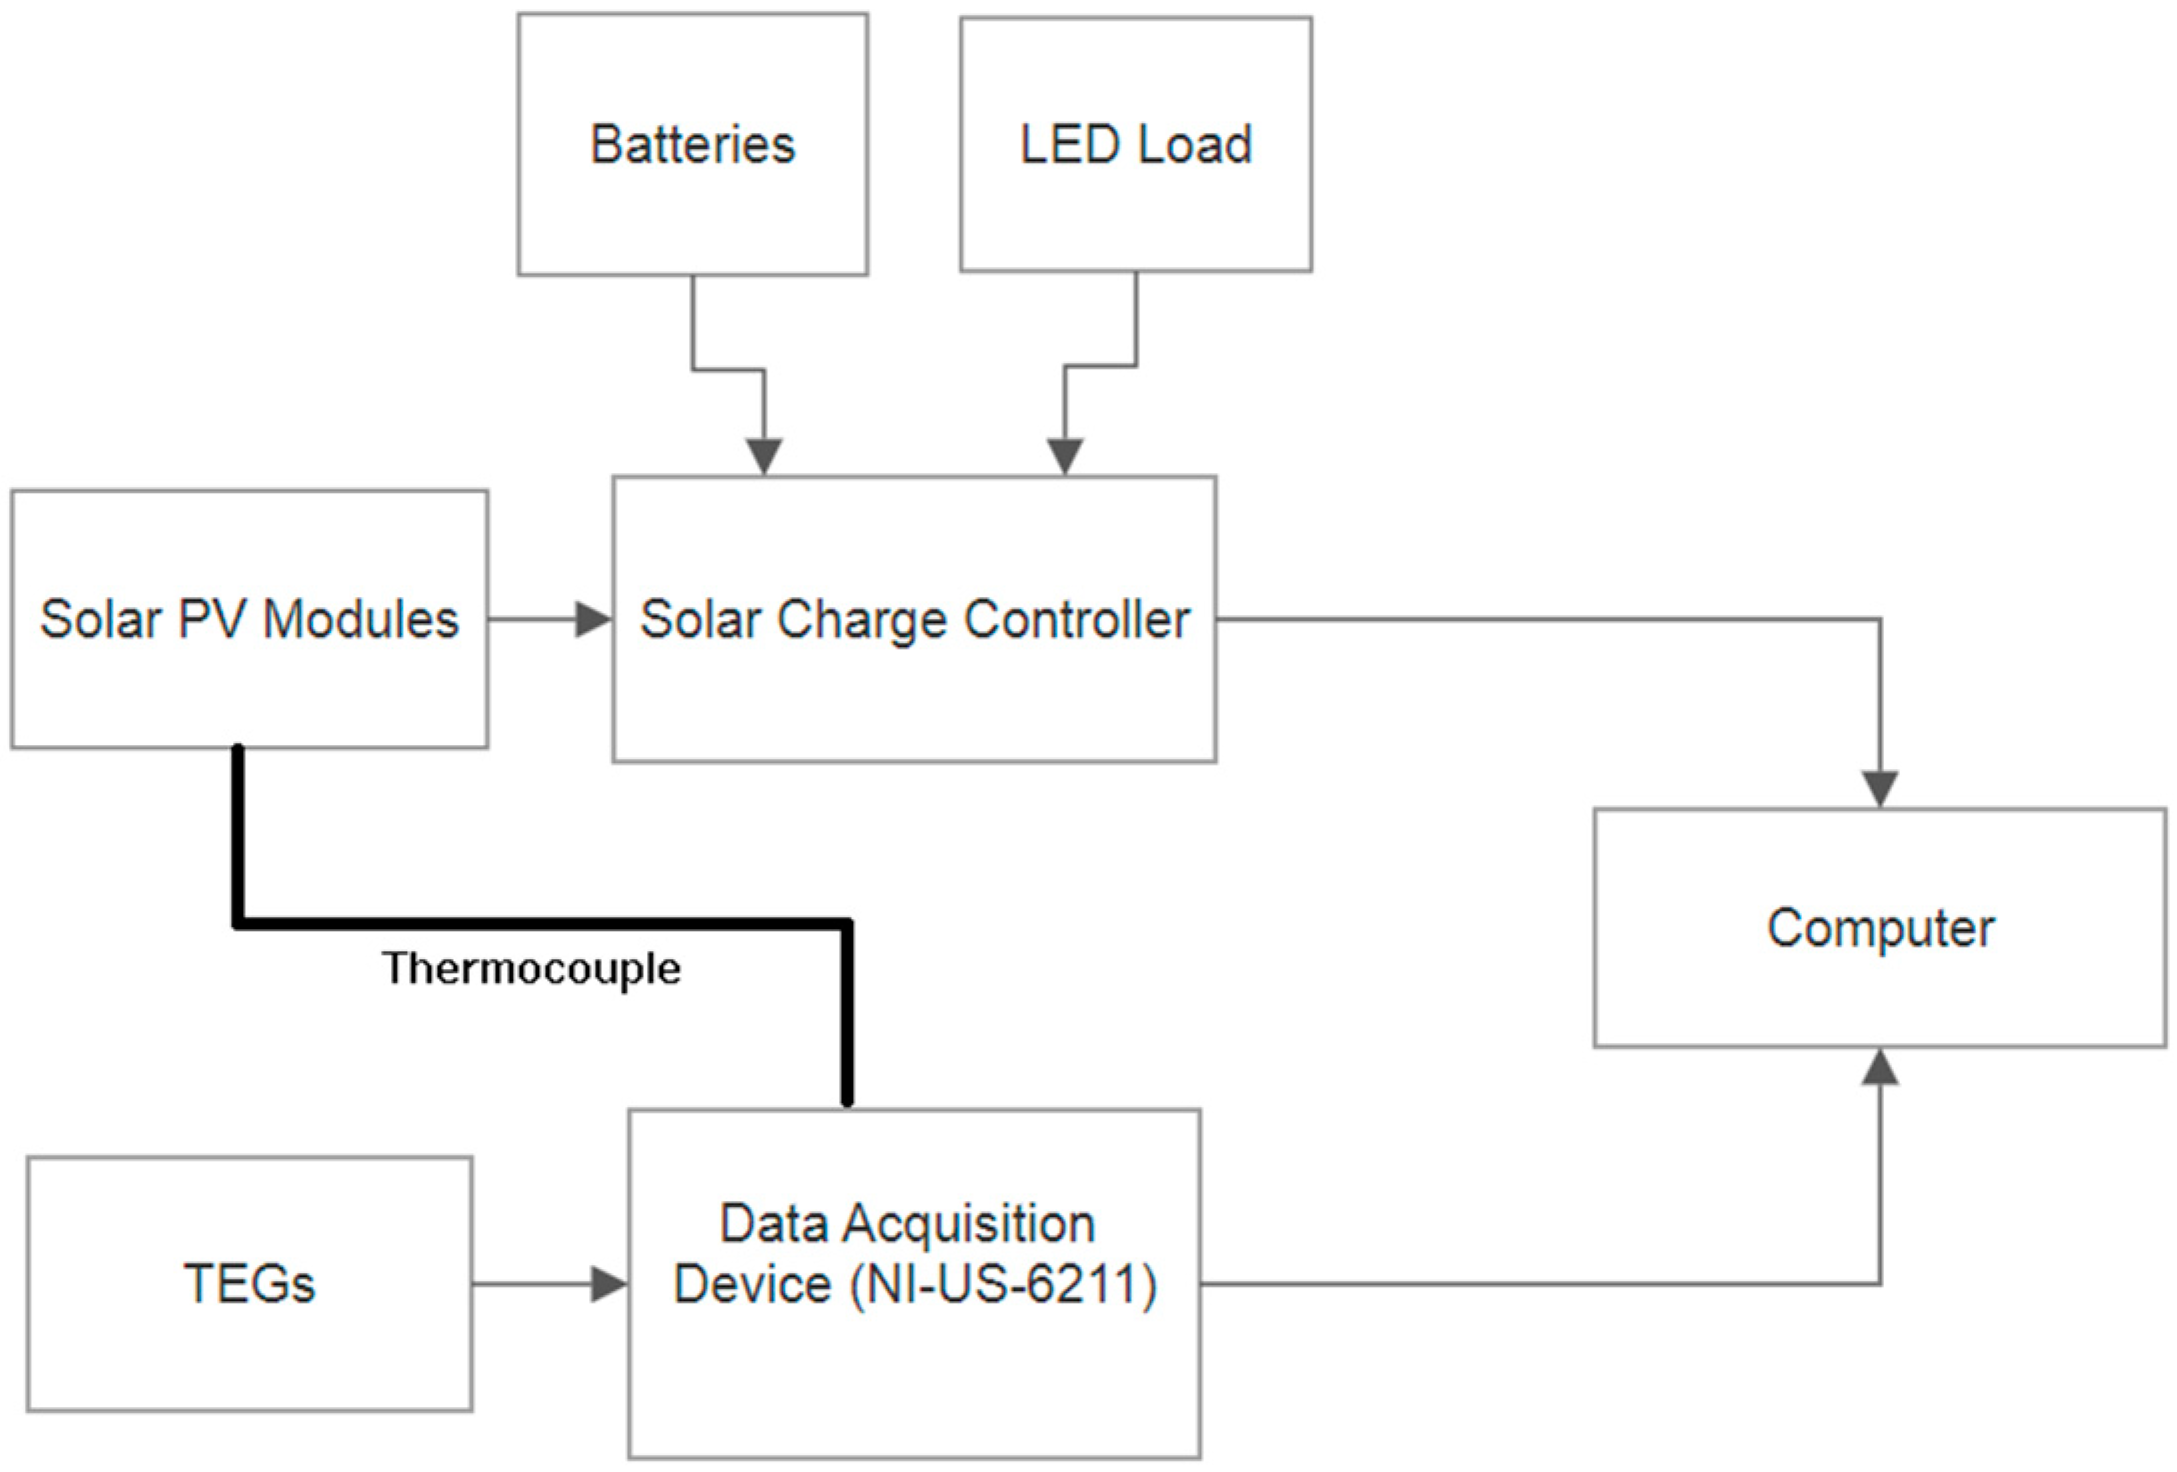
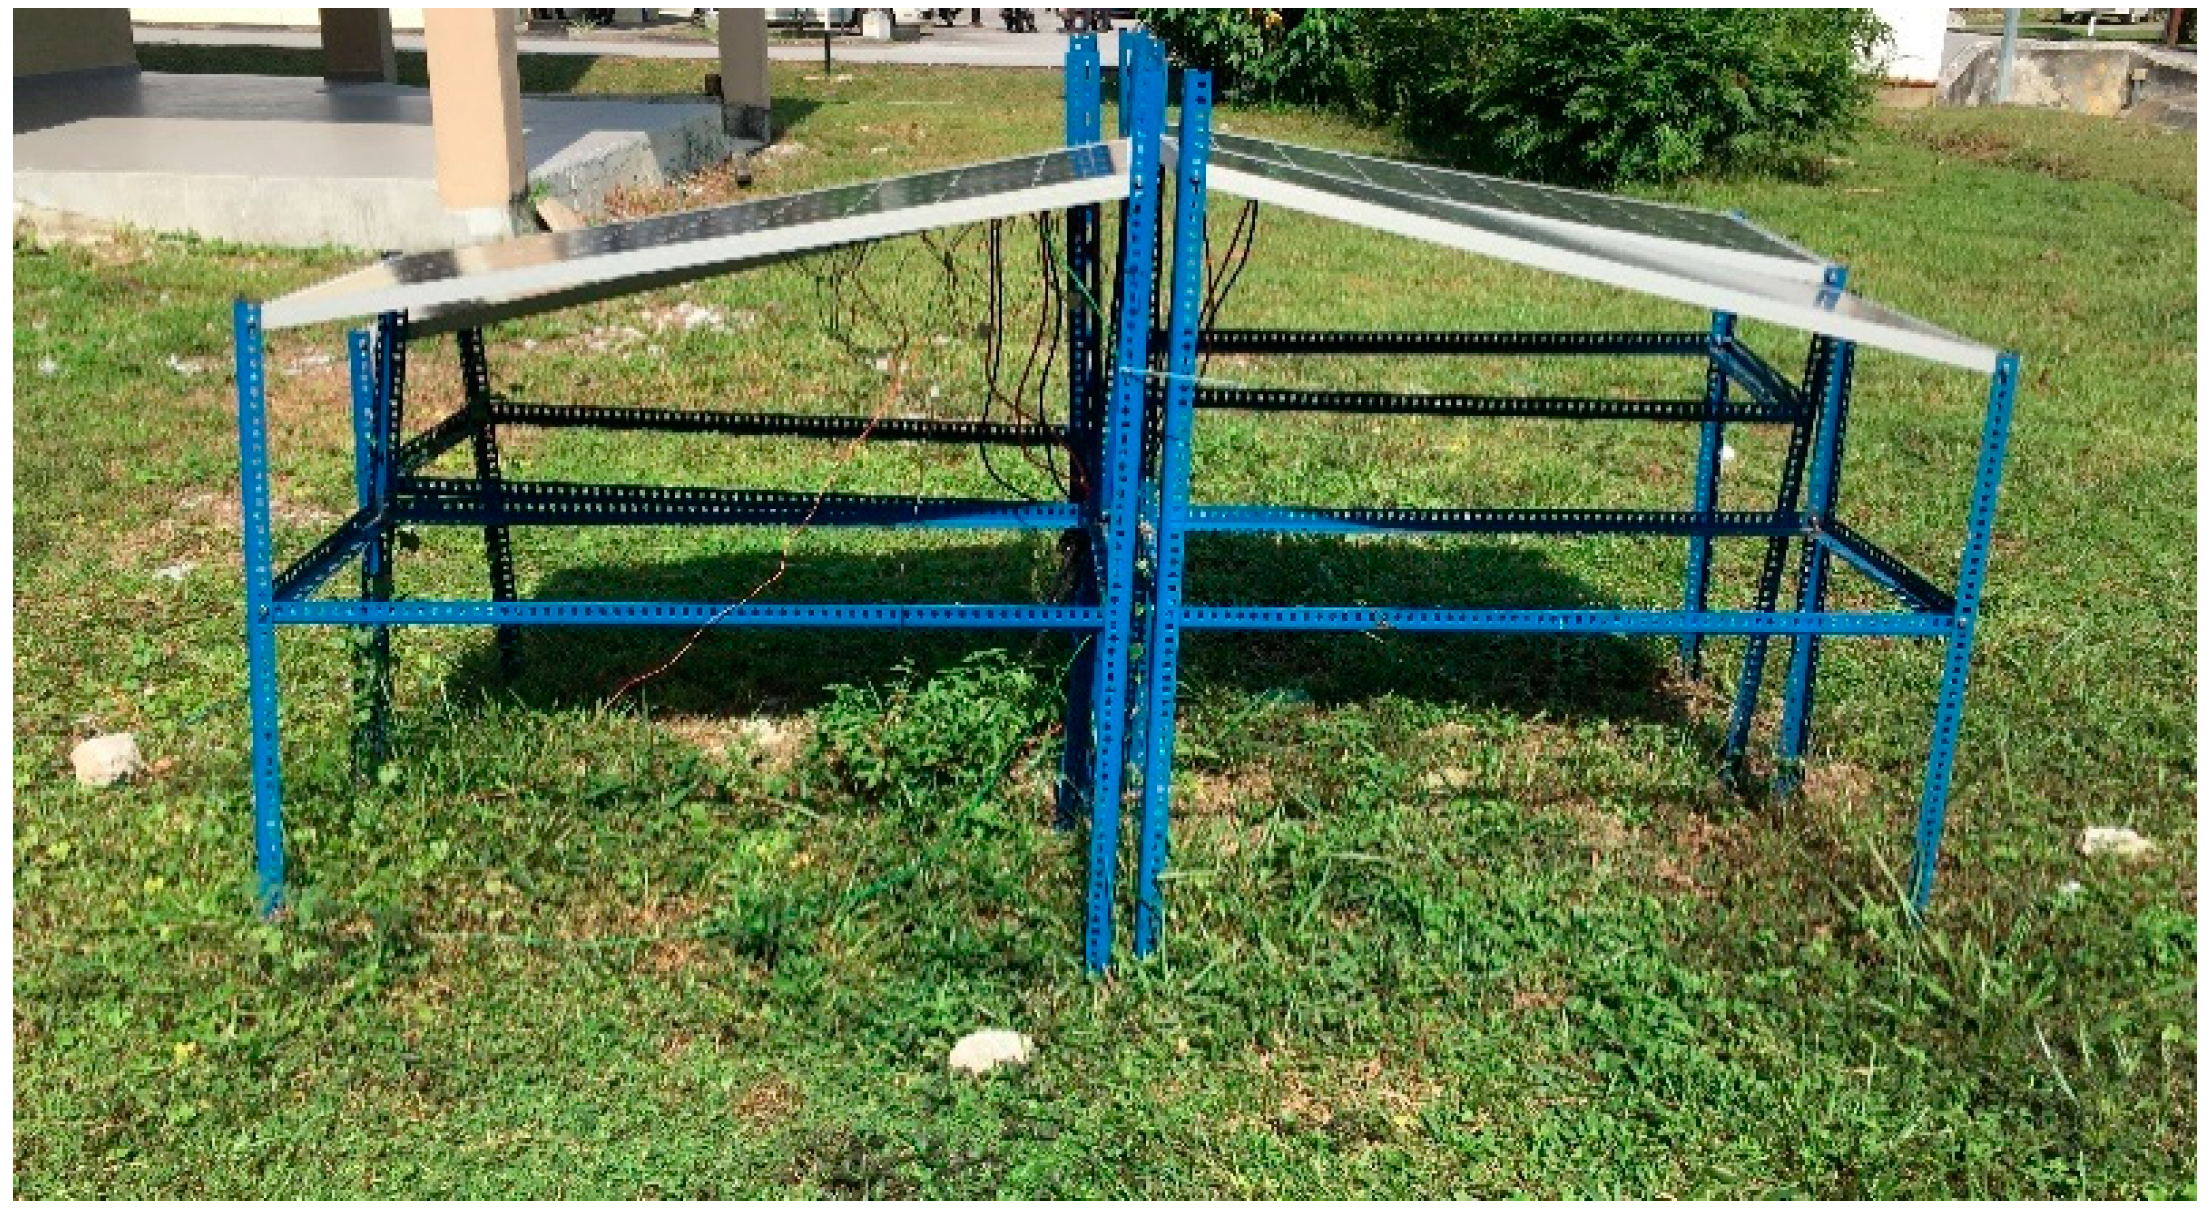
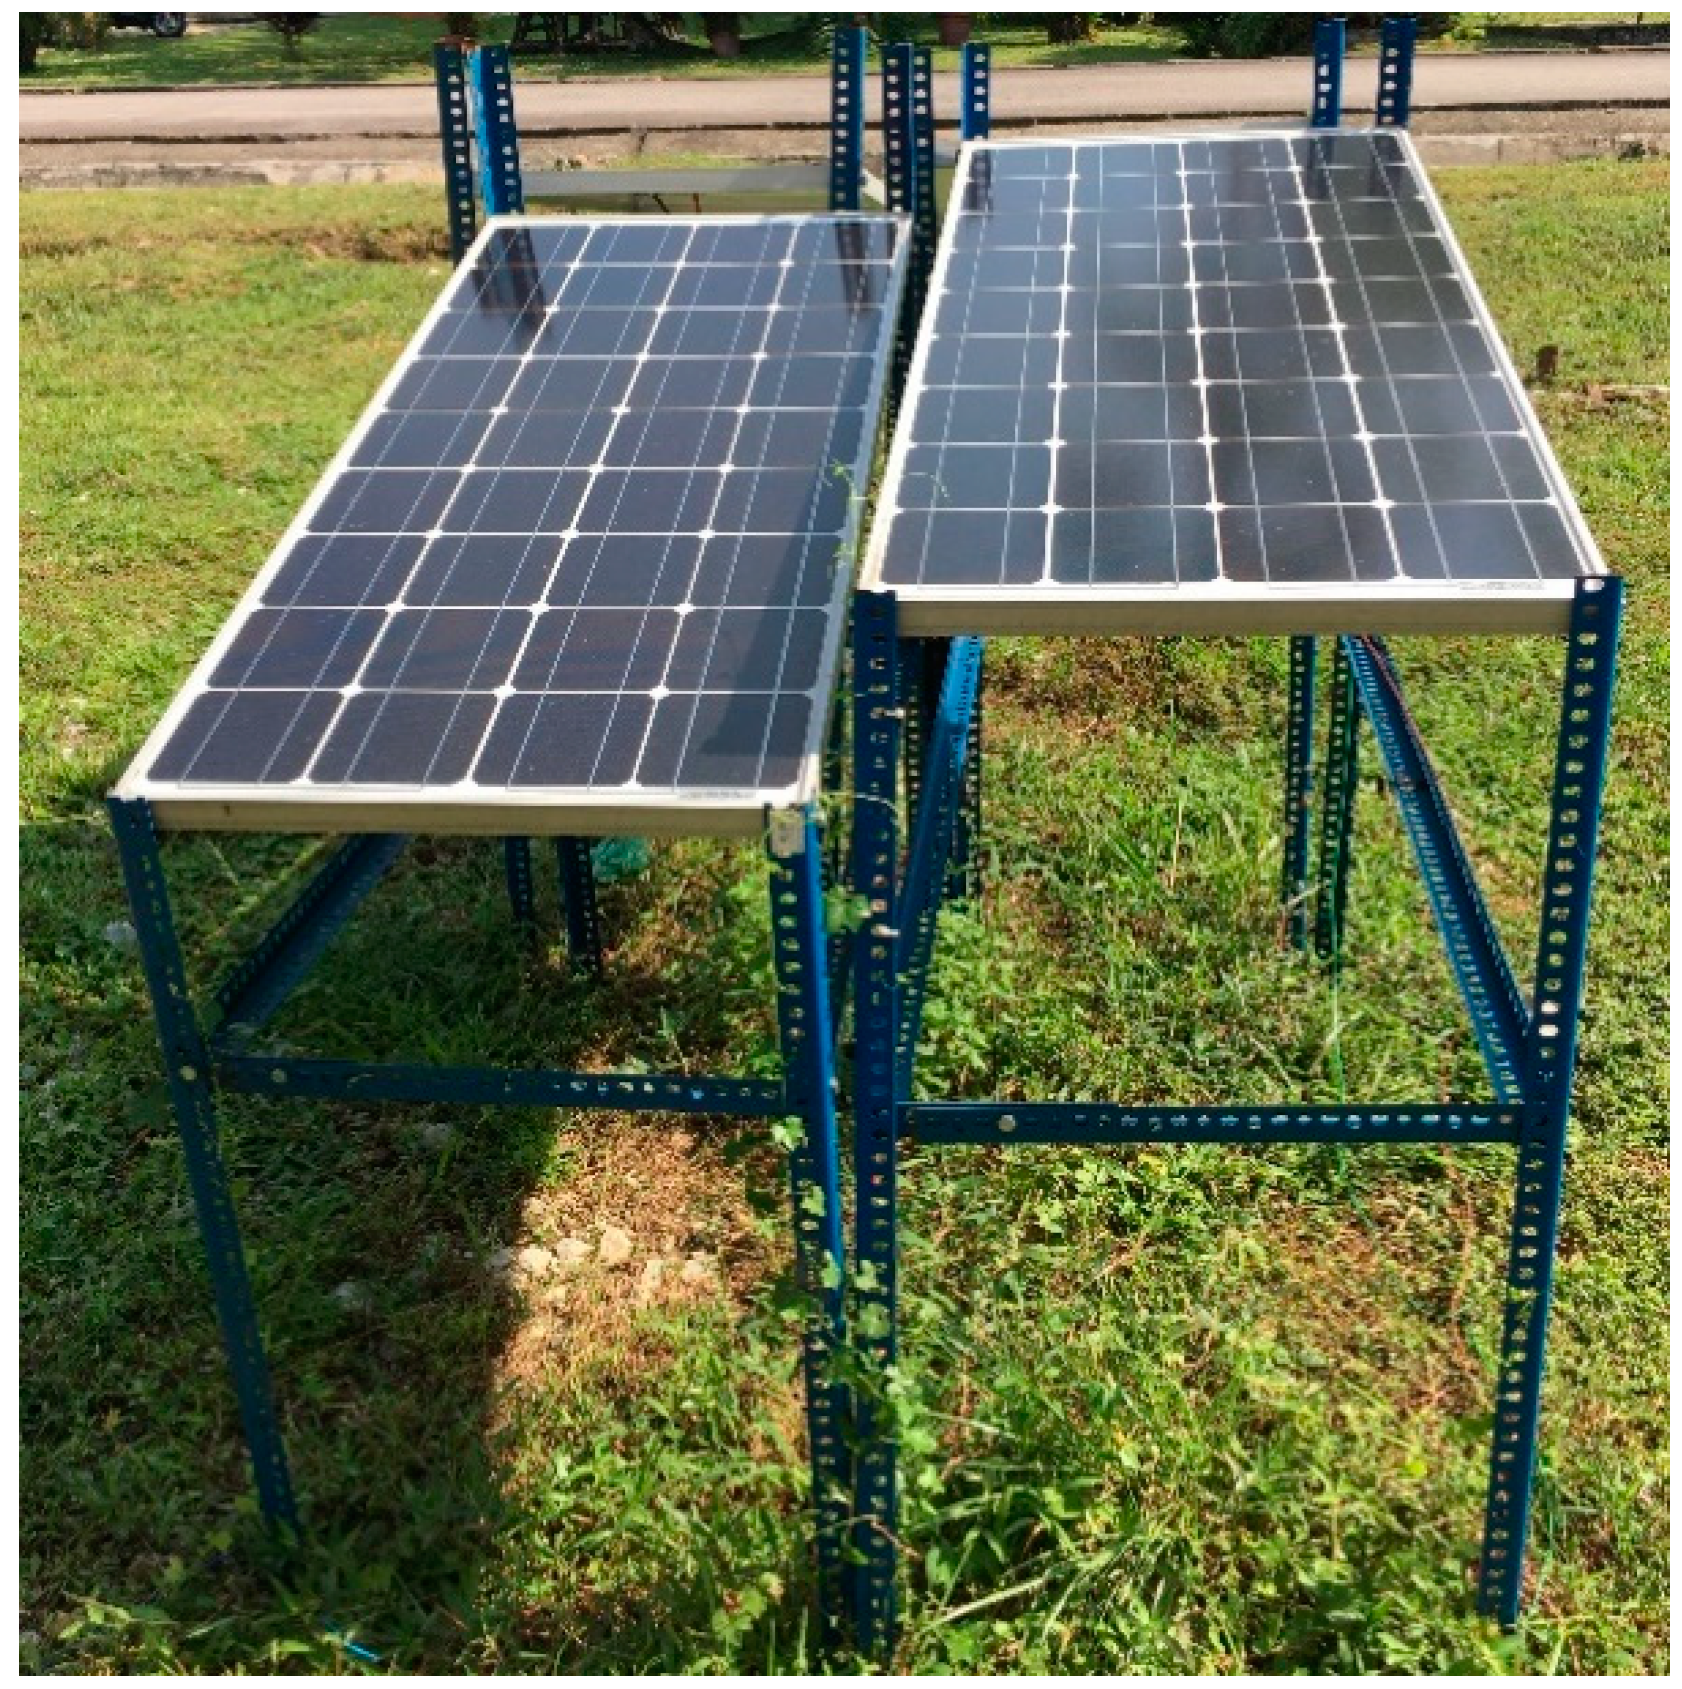
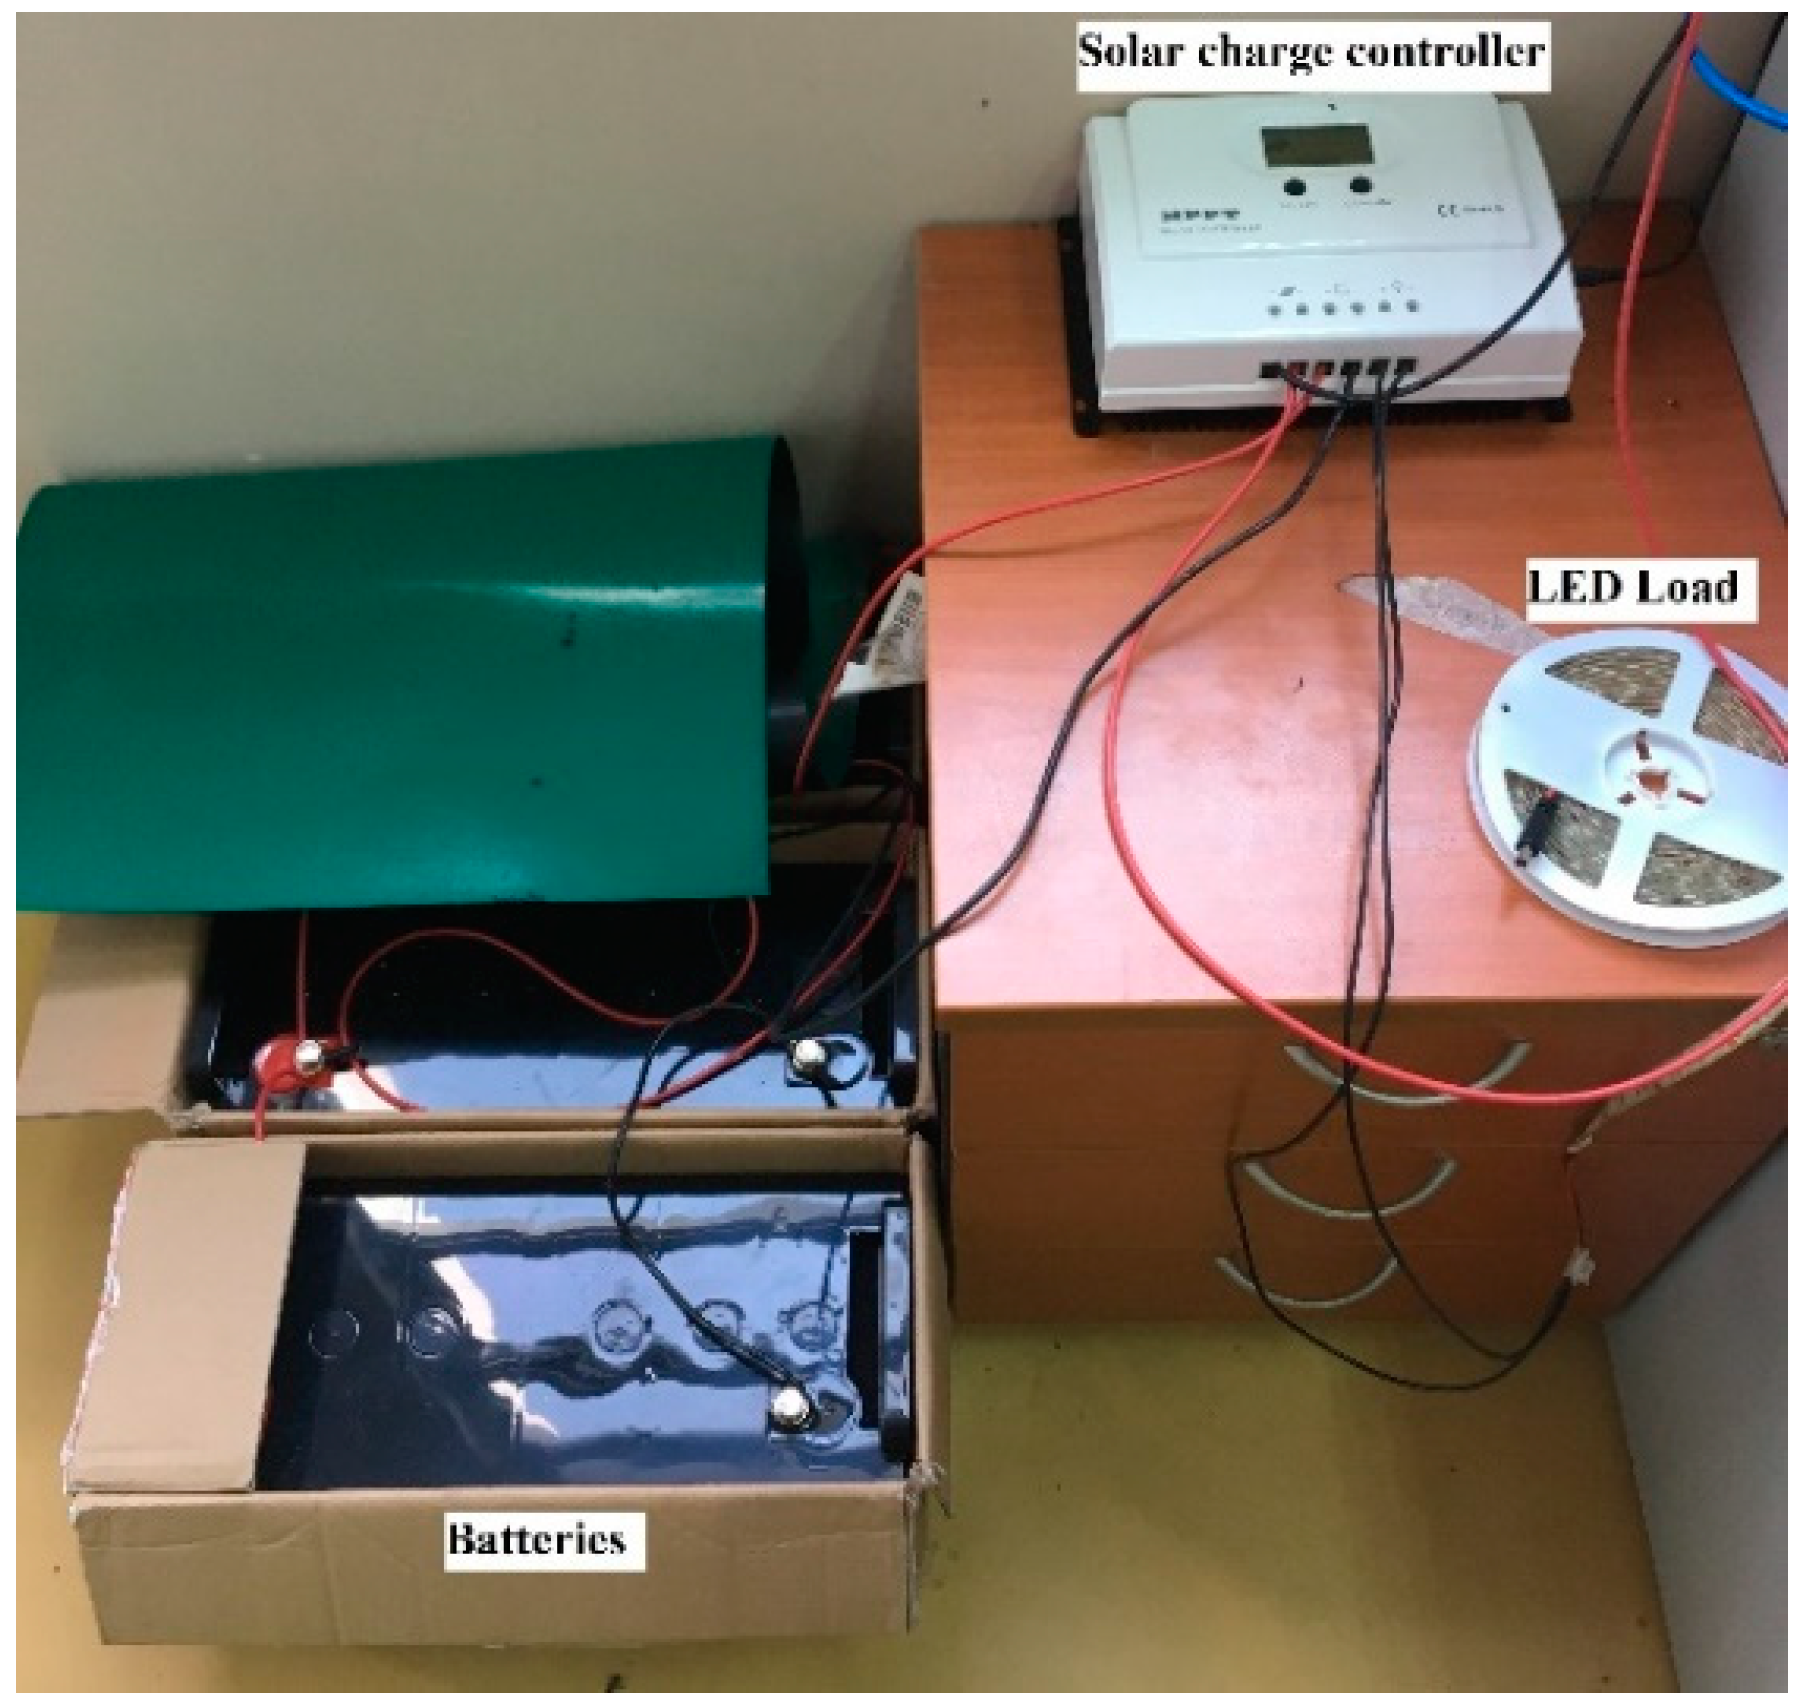
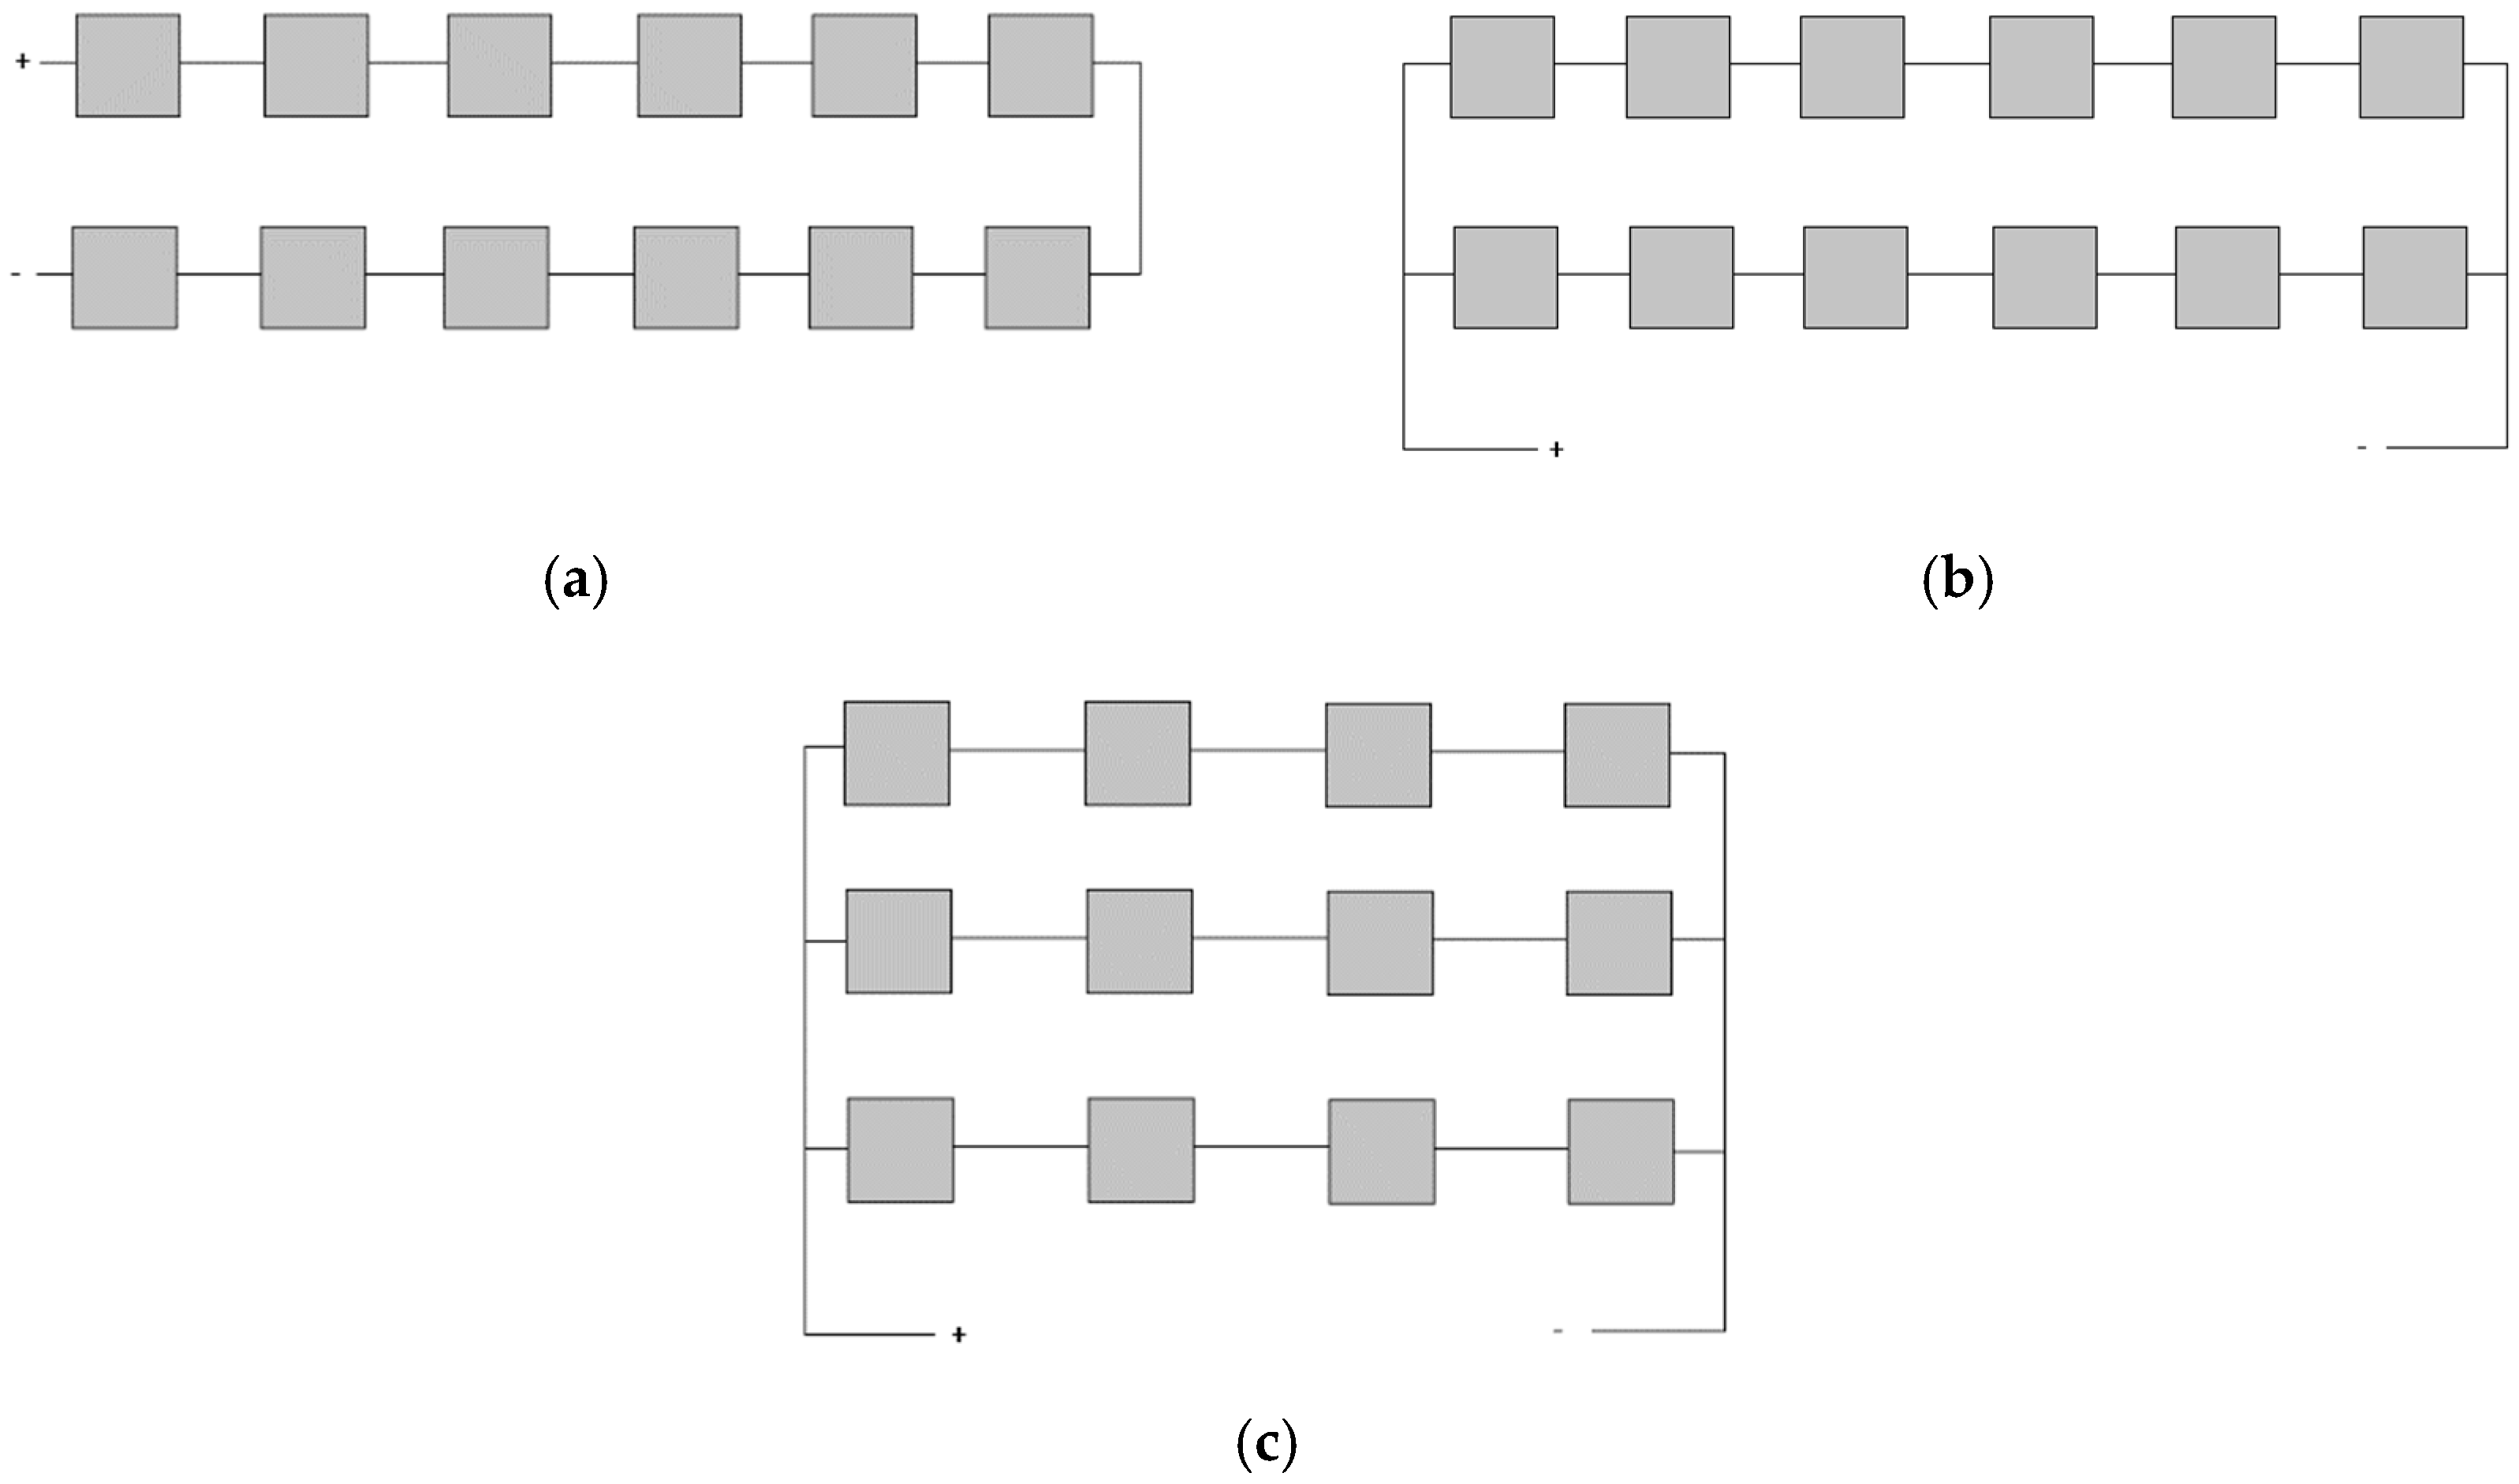
In this paper, a functional prototype of an unconcentrated PV-TEG hybrid system is designed and sized based on the power output supply required by the load used for indoor farming. An experimental investigation to test the performance of the hybrid system under Malaysia’s weather conditions was carried out. The PV-TEG hybrid system performance as a combined system and individually were obtained and are discussed. The possibility of night time power production from the TEGs are also examined. The effects of changing TEG circuit connections using a combination of series and parallel in fluctuating temperature differences are explored. The sufficiency of power output generated by the hybrid system with the load requirement is evaluated. Finally, the feasibility of the designed hybrid system is analyzed through comparison with a sole PV system in regard to the efficiency of systems.

2. Materials and Methods

2.1. System Design

2.1.1. Load Requirement

The hybrid system was designed based on the load applied for indoor farming, which was the lighting used in this research. High pressure sodium (HPS) is usually used as artificial lighting for indoor plant cultivation. However, due to its low efficiency and high power usage, the currently more preferred artificial lighting is light emitting diode (LED) [25]. There are variations in the amount of light required for optimal indoor plant growth. According to Al-Chalabi, most plants can thrive with the usage of artificial light for 18 h/day [26]. Figure 1 shows the designed LED arrangement in the indoor farming area.
Figure 1 illustrates the arrangement of LED lights used for the area, where the total length of LED used was 4.2 m. Based on the data sheet provided by the manufacturer, the LED lights rated power usage is assumed to be 14.4 W/m. Table 1 summarizes the power required from the LED lights.

2.1.2. System Sizing

Based on the energy load requirement obtained in the previous section, system sizing can be calculated and determined. This study used a PV panel (model: ADL100–12V), a TEG (model: SP1848–27145), and a battery (model: PGEL 100–12). The specifications of PV panel, battery, and TEG are shown in Table 2, Table 3 and Table 4, respectively.
Malaysia has an estimated annual average daily solar irradiation (Irr) ranging from 4.21 kWh/m2 to 5.56 kWh/m2 [28]. For system sizing purposes, the value of solar irradiation (Irr) assumed was 4.21 kWh/m2. A solar PV panel has a standard testing condition with a solar irradiation (IrrSTC) value of 1000 W/m2. The following equations, Equations (1)–(5), used for system sizing refer to the equations given by Khatri [29]. The panel generation factor (εgen) can be determined using Equation (1), as follows:
ε gen   =   Irr / Irr STC .
The Watt peak rating (Wp) for a PV module is the ratio of total energy required from load (ET) to panel generation factor (εgen) as given by Equation (2), as follows:
W p   =   E T / ε gen .
Thus, the number of PV modules required can be found using Equation (3), as follows:
No .   of   modules   =   W p / ε gen .
Batteries are incorporated with the system to support the hybrid in cases where there is lack of sunlight, such as during nighttime and cloudy days. The required battery capacity (C) can be calculated with the known parameter of battery nominal voltage (Vnom), efficiency (η), and depth of discharge (DOD), as given in Table 3. Assuming that the days of autonomy (N) is one, the required battery capacity (C) is calculated using Equation (4), as follows:
C   =   ( E T   ×   N ) / ( V nom   ×   η   ×   ( 1     DOD ) ) .
Thus, the number of batteries required is based on Equation (5), as follows:
No .   of   battery   =   C / C nom .
A solar charge controller is required for managing the current received from PV modules. It acts as a surge protector and current management between the PV panels, battery, and load. A solar charge controller of 30 A was used based on the PV module’s short circuit current (Isc), with an added safety factor of 25%. The TEG module used in this study is a SP1848–27145, with a dimension of 40 mm × 40 mm × 3.4 mm. Table 5 summarizes the hybrid system sizing based on the equations given.

2.2. Experimental Setup

The overall experimental setup of the hybrid system is as shown in Figure 2.
The PV panels and TEGs were placed outside of the G3 building in Universiti Teknologi Malaysia (UTM), which is located in Kuala Lumpur, Malaysia (Longitude/Latitude: 101°43’ E/ 3°10’ N). Other equipment, such as the solar charge controller, LED light, batteries, and measuring equipment, were placed indoors to avoid any malfunctioning when subjected to weather conditions. The experiment was run for a duration of three months, which were in December, February, and March. The length of the experiment allowed for varying weather conditions. The average ambient temperature and typical weather conditions are summarized as shown in Table 6.

2.2.1. PV System

The PV panels were positioned outside of the G3 building, with two panels facing south and another two panels facing north, as shown in Figure 3 and Figure 4. The PV placement was chosen in order to fully maximized the solar energy harvested for the stationary PV installation. The panels and batteries were connected electrically in parallel and were directly connected to the solar charge controller. The batteries, LED load, and solar charge controller were placed indoors, as shown in Figure 5.

2.2.2. TEG Connection

The design of this hybrid system includes the TEGs to be arranged behind the solar PV panel, as shown in Figure 6. A layer of thermal paste was placed on the adhered surface of the TEG to the PV panel for minimizing the thermal contact resistance, thus allowing better thermal conductivity between the PV panel and the TEG. The TEGs were connected in three different arrangements, as shown in Figure 7.

2.2.3. Data Collection

The PV panels and TEG used different data acquisition systems due to the distinct output measured. For the PV, the power, voltage, and current were measured, whereas, for the TEG, the open circuit voltage (Voc) was measured. The PV panels power output, battery state of charge, load power output, and ambient temperature were logged using a maximum power point tracker (MPPT) solar charge controller. The MPPT solar charge controller has an efficiency of 99.5% and a converter efficiency of 98%. The TEGs Voc were logged using the NI-USB-6211 data acquisition device (DAQ). The DAQ has a maximum sampling rate of 250 kS/s and an analog input absolute accuracy of 0.088% ± 0.13 mV (for a nominal range of 0.2 V–10 V). The temperature of the PV panel was obtained using K-type thermocouple with specifications, as presented in Table 7, and the temperature obtained was logged using the DAQ.

2.2.4. Efficiency of System

TEG efficiency (ηTEG) relies on the temperature difference between the two junctions. It is the ratio of power output from the TEG (PTEG) to the rate of heat transfer ( Q ˙ ), given by Equation (6), as follows:
η TEG   =   P TEG / Q ˙ ,
where ( Q ˙ ) is calculated based on temperature difference (ΔT) and the thermal conductivity of bismuth telluride Bi2Te3, (Kth) in Equation (7), as follows:
Q ˙   =   Δ T / K th .
Whereas, PV module efficiency (ηPV) is dependent on the solar irradiance absorbed by the area of PV cells. It is calculated based on the ratio of power output from the PV (PPV) to the area of PV (Ap) exposed to solar irradiance. Referring to the equation used by Rezania et al., it can be defined by the following Equation (8) [23]:
η PV   =   P PV / ( Irr   ×   A p ) .
The overall electrical efficiency of the combined PV-TEG system (ηPVTEG) can be denoted using Equation (9), as follows:
η PVTEG   =   ( P PV   +   P TEG ) / ( Irr   ×   A p ) .

3. Results and Discussion

3.1. PV with Added Battery System Performance

This section elaborates on the PV with added battery system performance. The energy profile for load, PV, and battery were shown for all three months and the results were explained in detail. Furthermore, the effect of load addition to the system was discussed in the following subsection.

3.1.1. PV, Battery, and Load Energy Profile

A 5 m LED light was used as the load requirement for the indoor farm. On average, the LED light required about 20 W of electricity and the light was adjusted to be switched on and off at a specific time during the day. The power distribution between the batteries and the PV with load, as well as the battery’s state of charge (SOC), are shown in Figure 8, Figure 9 and Figure 10. In December, the usage of the LED light was only for 13.5 h. It was switched on from 08:00 to 16:00 and was switched off for 2.5 h before it was continually used during the night time. In February, LED light usage was increased to 18 h. The load had a more prolonged night time usage of 10 h compared to a mere 8 h usage during day time. Whereas, a continuous 24 h usage of the LED light was done in March.
Malaysia is blessed with an abundance of sunlight, which allowed the PV panel to produce consistent power for a duration of 12 h; thus, supporting the load during day time and charging the batteries during offload period. The amount of solar irradiance available, however, differed between the three months, with December having the lowest amount of irradiance followed by March, while February had the highest. Typically, the availability of solar irradiance begins from 07:30 h until 19:30 h. During night time, in the absence of power from PV panels, batteries were the sole power provider for running the load. As shown, the PV-battery system was correctly sized, thus enabling it to fully support the LED load under all conditions. However, in the real case for indoor farming, the LED load does not need to be in the ‘ON’ state for a duration of 24 h [26]. The breaks should preferably be during the availability of PV power in order to recharge the battery sufficiently for night time usage, as done in December and February.
The solar panel used has an open circuit voltage and a short circuit current of 22.45 V and 5.99 A. At standard testing conditions of G = 1000 W/m2 and Top = 25 °C, the PV panel had a maximum power output of 100 W. The total active area of the PV module used was 2.5 m2 under no shading conditions and 1.25 m2 under partial shading conditions. These conditions changed due to the position of the PV panel, which was observed to be under partial shading conditions starting from 13:30 h. As a result, the shading condition may have contributed to an inconsistent power output of the panels. In December, higher power output was observed, ranging from 15 W to 20 W. Whereas, February and March had a slightly lower power output of around 15 W maximum. The performance of the solar panels was also dependent on many other factors such as dust accumulation, increased solar cell temperature, and losses from wiring and connections.

3.1.2. Effect of Load to the System

The PV-battery system was tested with an additional load from a submersible pump to emulate the usage of a pump for the irrigation of crops in the indoor farm, as shown in Figure 11. Firstly, the system was run with the usual LED load of about 20 W. A slight drop in the battery SOC by 5% was observed, which was similar to that as previously shown in Figure 8, Figure 9 and Figure 10. Next, the system load was switched to the pump, with a power requirement of about 90 W. A further drop in the battery SOC, by 5%, was noted. The system managed to sustain the load without any further reduction in the battery SOC within the duration of 100 min. Finally, both the pump and LED load were used simultaneously for a short period of 60 min. Although this increased the power requirement from the loads to above 100 W, the battery maintained an SOC of 70% throughout the duration of usage. This proved that the system was able to perform even with the addition of a greater load, providing sufficient power to the load regardless of the low PV power output.

3.2. TEG Performance

This section discusses the TEGs performance for the three months. The temperature profile for both panel and ambient temperature obtained in the three months is shown and elaborated upon. Moreover, the power output obtained for the three different connections are depicted and compared. The effect of resistance to the three different connections are also illustrated and discussed in the final subsection.

3.2.1. Temperature Profile for Panel and Ambient Temperature

Figure 12, Figure 13 and Figure 14 show the average ambient temperature and panel temperature for the months of December, February, and March. The end of the year, between October and December, is the monsoon season in West Peninsular Malaysia, which means that a low ambient temperature is often observed during this duration of time. Thus, in December, a lower temperature difference was produced during the daytime compared to the other months, as shown in Figure 12. February had the highest average ambient temperature, followed by March, as shown in Figure 13 and Figure 14. The panel temperature was highly affected by the ambient temperature and the amount of precipitation, which explained the low panel temperature in December, which reached only up to 35 °C, whereas in February and March the panel temperature reached 55 °C and 45 °C, respectively.
Figure 15 depicts the difference between the PV panel and ambient temperature for the three months. The temperature difference in February and March were very similar, where, during the night time, a temperature difference of 14 °C to 16 °C was reached. During day time, a maximum temperature difference of 20 °C and 18 °C were achieved in February and March, respectively. However, the temperature difference obtained for December was slightly less than other months, with a night time temperature range of 12 °C to 14 °C and a maximum day time temperature difference of 8 °C, as shown in Figure 15.

3.2.2. TEGs Power Output for December, February, and March

Different TEG connections were done for the three months, where it was firstly connected in series during December. Among the other months, it had the lowest power output, varying between 0 mW and 0.5 mW, as shown in Figure 16. Nonetheless, this connection shows the most promising in terms of power production during the night time. The TEGs were able to produce power starting from 19:30 to 07:30 the following day. Next, the TEG was connected in a combination of series and parallel in February, where four TEG were in series and the three groups were connected in parallel. The power output of the TEG in this month peaked at 1.6 mW at 13:00 h and maintained at a higher range than in December, as shown in Figure 17.
In March the TEGs were connected similar to in February, except that six TEG were in series and the two groups were connected in parallel. This month had the highest power output, which indicated its superiority compared to other connections, regardless of it having similar temperature differences during the day. The highest recorded power output reached 3 mW and maintained a power output of higher than 2 mW from 12:00 to 16:00, as shown in Figure 18. Generally, starting from 12:00 to 16:00, the system produced the most power from the TEG for the three months, regardless of the connections. It could be related to the high temperature difference between the PV panel and ambient temperature. Nonetheless, the connection of series and parallel combination is not recommended during night time due to the possibility of producing a short circuit from uneven temperature distribution amongst the TEGs.

3.2.3. Resistance Effect from Different TEG Configurations

TEG connections play an important role in determining total power output for TEG, besides the temperature difference between the hot and cold side. This is due to the variation in matched load resistance with changing TEG connections. Figure 19, Figure 20 and Figure 21 show the changing resistance value of the TEG with differing TEG connections. Different connections seem to produce a different power output at the same temperature difference, wherein series connections produced the highest power output at 12 °C than the series and parallel combination connections. A similar pattern was also observed with the resistance for the different TEG connections, where an all series connection had the highest internal resistance, which approximately matched the optimal load at maximum power output [30]. The optimal load of about 55 Ω to 60 Ω was found for an all series connections, whereas a combination of series and parallel connections with six TEG in series had a smaller optimal load of about 15 Ω to 18 Ω. A smaller number of TEG used in series would result in a smaller optimal load, as shown in Figure 21, with four TEGs in series.
It is worth noting that a circuit with all series connections may be ideal to be used for power production during night time. This connection has also shown its capability in producing a higher power output than the combination of series and parallel, with respect to temperature difference. An all parallel circuit has been deemed as unsuitable in this case due to the heat dissipation produced from the flow of high current in the circuit, which may negatively impact the PV panel [31]. Besides that, a threshold for an optimum number of TEGs to be used is highly dependent on the type of TEG connections [31]. Only a specific number of TEGs can be connected in a circuit for maximum power output. Therefore, limiting the amount of TEG used in an upscale of this hybrid system may be more beneficial for the overall system performance.

3.3. PV-TEG Hybrid System Overall Performance

The PV-TEG hybrid system performance was determined based on the overall efficiency of the combined system. The efficiencies of the solar PV, TEG, and the PV-TEG hybrid systems are shown in Table 8.
Power outputs from TEGs are much smaller compared to the power output of solar PV. Therefore, the efficiency of the overall hybrid system relies heavily on the efficiency of the PV panels. Solar irradiance can be seen to have a linear relationship with the panel temperature where higher levels of solar irradiance result in a higher PV panel temperature, as shown in the previous sections. Solar PV efficiency is directly related to the solar cell temperature during operation [32]. The mono-silicon PV panel has been known to have a lower temperature coefficient of the maximum power output ranging from 0.35 to 0.4%/°C compared to other PV materials [33,34]. Nonetheless, a high PV panel temperature of 55 °C in February and 45 °C in March results in a significant drop of the PV efficiency. An average efficiency of 7.66% and 8.61% was obtained for February and March, respectively. December had the best PV panel efficiency of 12.49% as the panel temperature reached only up to a maximum of 35 °C.
On the other hand, TEG efficiency is also is inversely proportional to the efficiency of the PV panel. The efficiency of TEG relies on the temperature difference between the two junctions, where a higher temperature would result in improved efficiency for the TEG. The Bi2Te3 TEG used in this study showed an increase in efficiency with increasing temperature difference, as can be seen in Figure 22.
According to Table 8, the average efficiency obtained by the TEGs was highest in March, with 4.92%, followed by in February, with 4.44%, and finally December, with 1.86%. The results are proportional with the average temperature difference values of 6.49 °C, 5.63 °C, and 2.06 °C attained in March, February, and December, respectively; thus, explaining the low efficiency obtained by the TEG in the month of December. Although the months of February and March had different maximum temperature differences, with February having a higher maximum temperature difference of 20 °C, on average March had a more significant temperature difference than in February; therefore, justifying the minor difference in TEG efficiency between the two months.
The overall efficiency of the hybrid system was similar to the PV panel efficiency, with zero to less than 1% efficiency increment. The hybrid system in December had the highest efficiency of 10.81%, whereas in February and March had an overall system electrical efficiency of 7.72% and 8.68%, respectively. February and March showed a slight improvement in efficiency while December showed a dropped in efficiency by 1.68%. This implies that, although the overall efficiency relied mostly on the PV panel efficiency, it was still affected by the efficiency of the TEGs. March and February had a higher TEG efficiency due to their larger temperature difference as opposed to the December temperature difference. Thus, March and February had a better overall system efficiency in contrast to a sole PV-battery system, while December had a poorer overall system efficiency. Nonetheless, the hybrid system fared better in the colder month of December than in March or February, as confirmed with Rezania et al. who found that the hybrid system performed better in January during the winter season than in July during summer [23].
The PV average daily energy production for the December, February, and March were 177.22 Wh, 148.1 Wh, and 132.57 Wh. Meanwhile, the average daily energy production of the TEGs for December, February, and March were 4.04 mWh, 3.02 mWh, and 6.16 mWh. The PV and TEG power output do not seem to have any correlation where the highest PV output observed was in December, whereas the highest TEG output was in March. This is because of the different input of the system, where PV relies on the availability of solar irradiance and is greatly affected by temperature, whereas TEG output is purely influenced by temperature difference. Previous studies have confirmed that TEG only contributed a small amount of power to an unconcentrated hybrid system and is incomparable to the amount produced from solar PV [23]. Nonetheless, the addition of TEG to a hybrid system of a lower efficiency PV panel, such as a-Si or polymer, may be able to contribute more to the overall power output of the system [19]. Due to the usage of mono silicon PV in this study, the addition of power produced from the TEGs was deemed insignificant as opposed to the high-power output generated from the PV panels. Proper modification for producing an upscale of the unconcentrated PV-TEG system, such as by incorporating a heat sink and using better semiconductor material with a higher figure of merit (zT), may result in further improvement to the system.

4. Conclusions

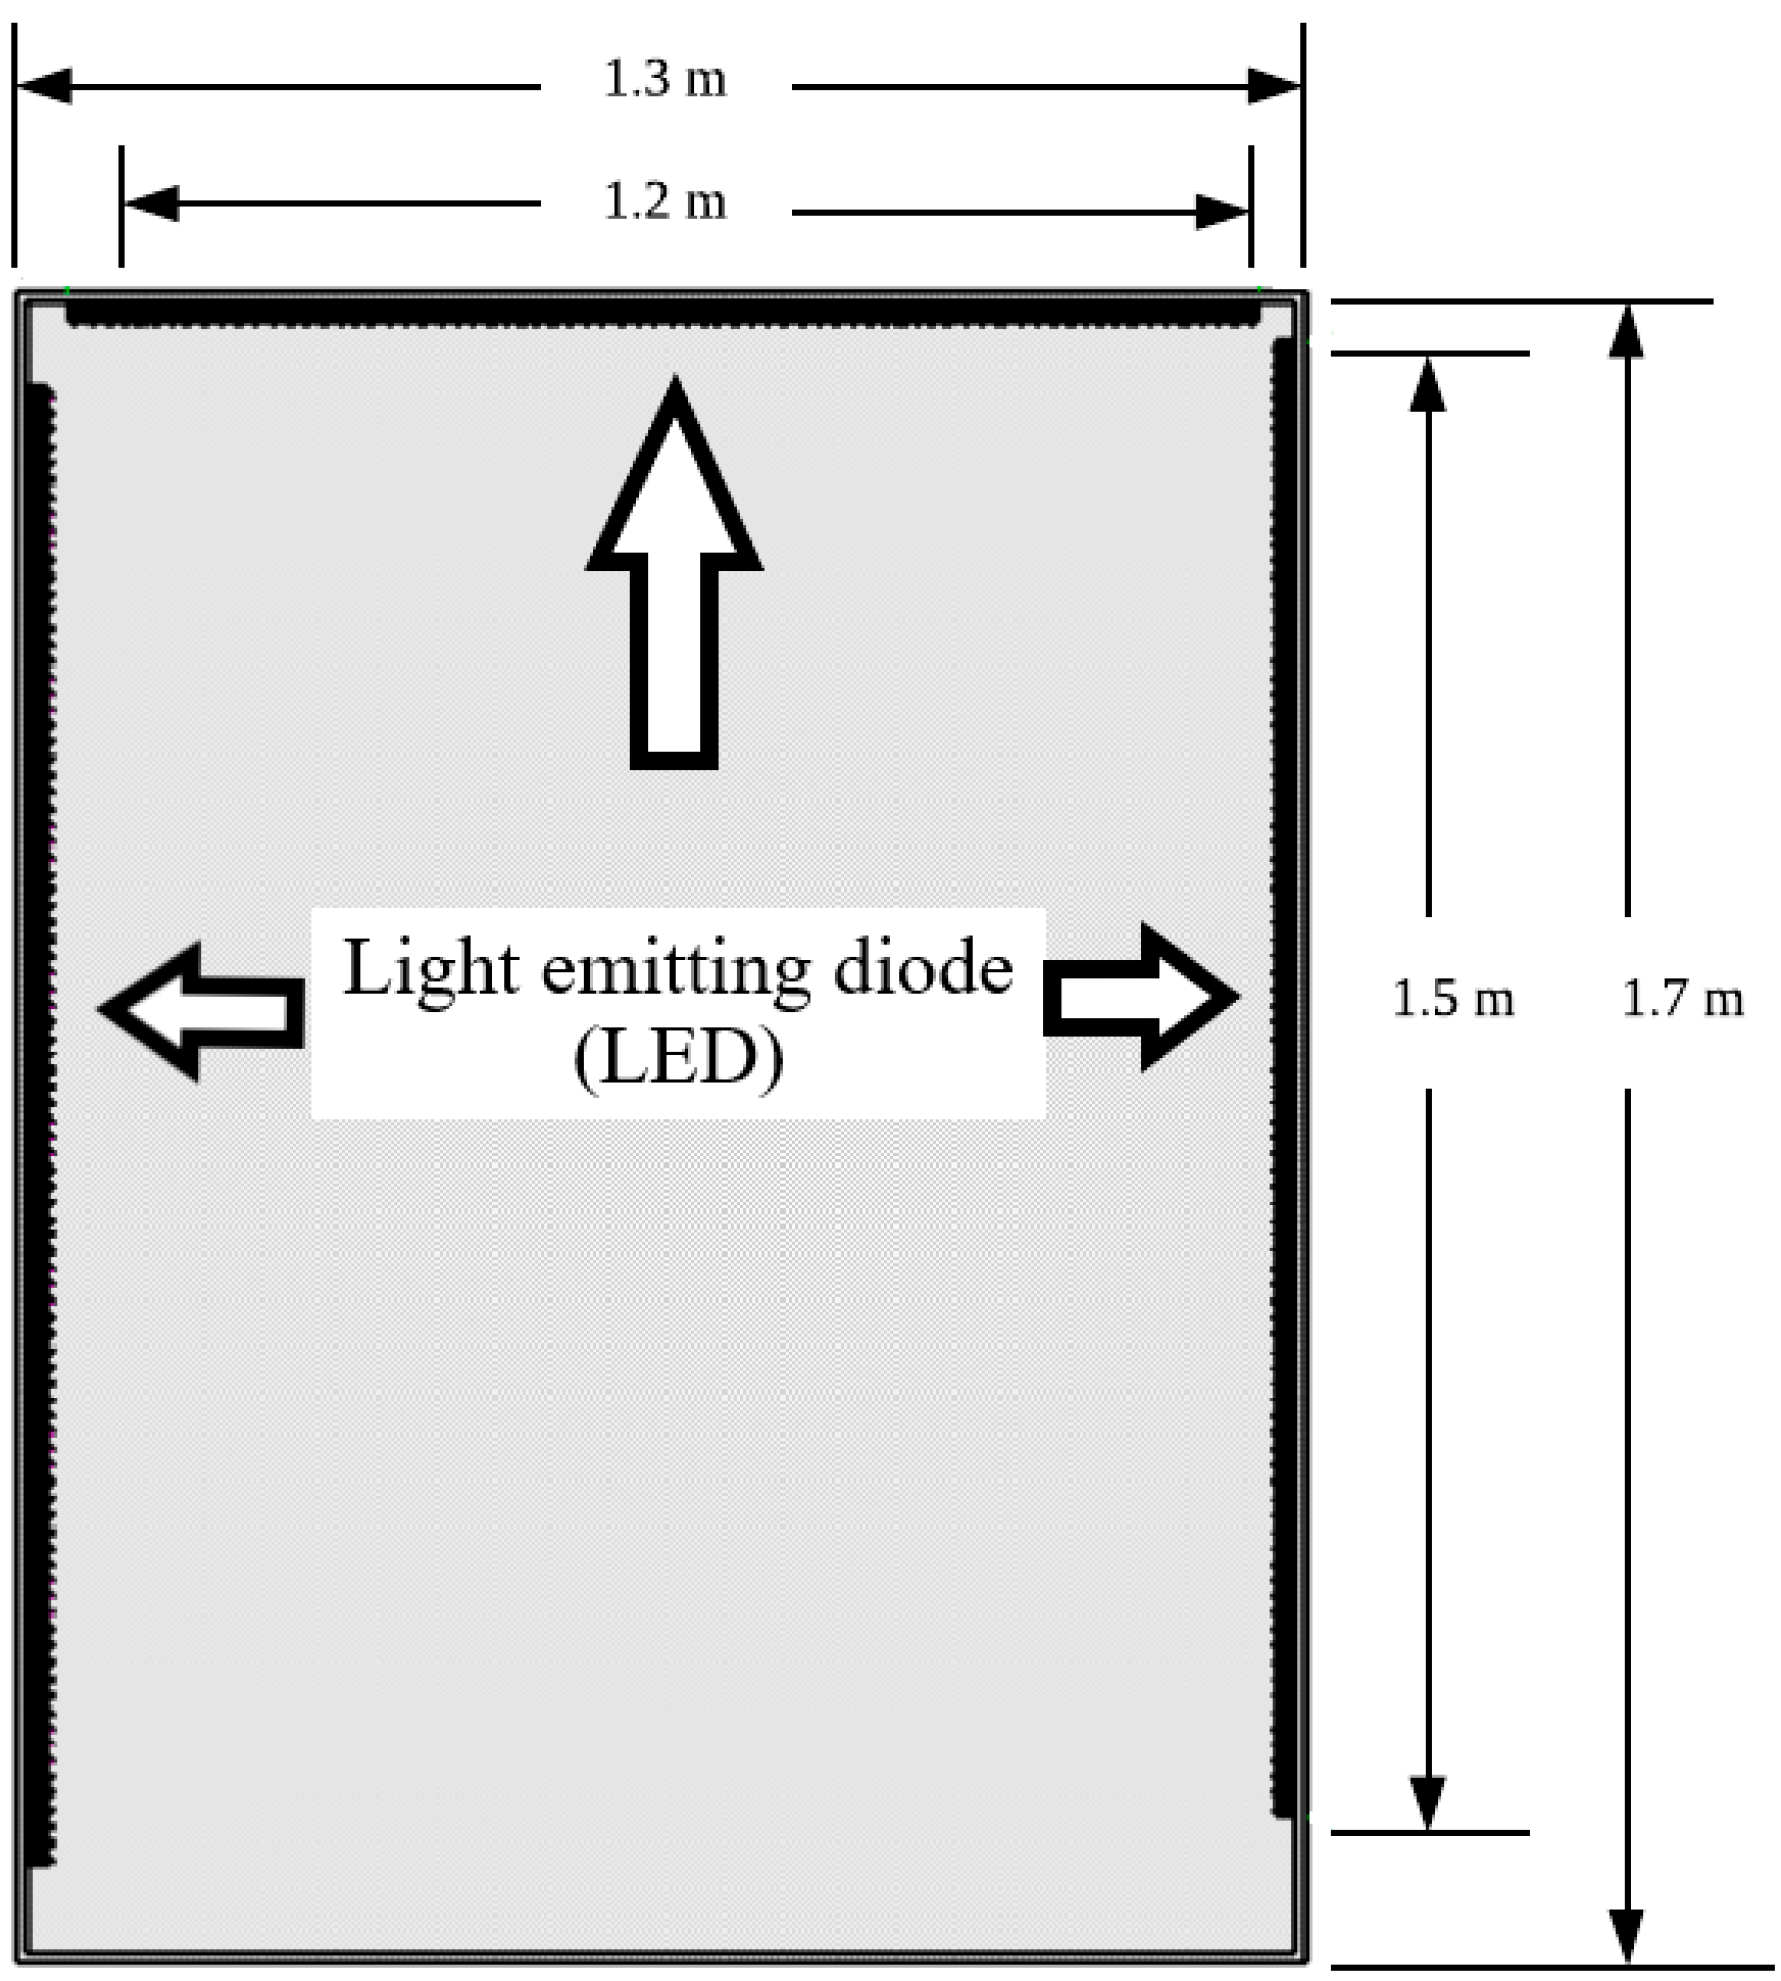
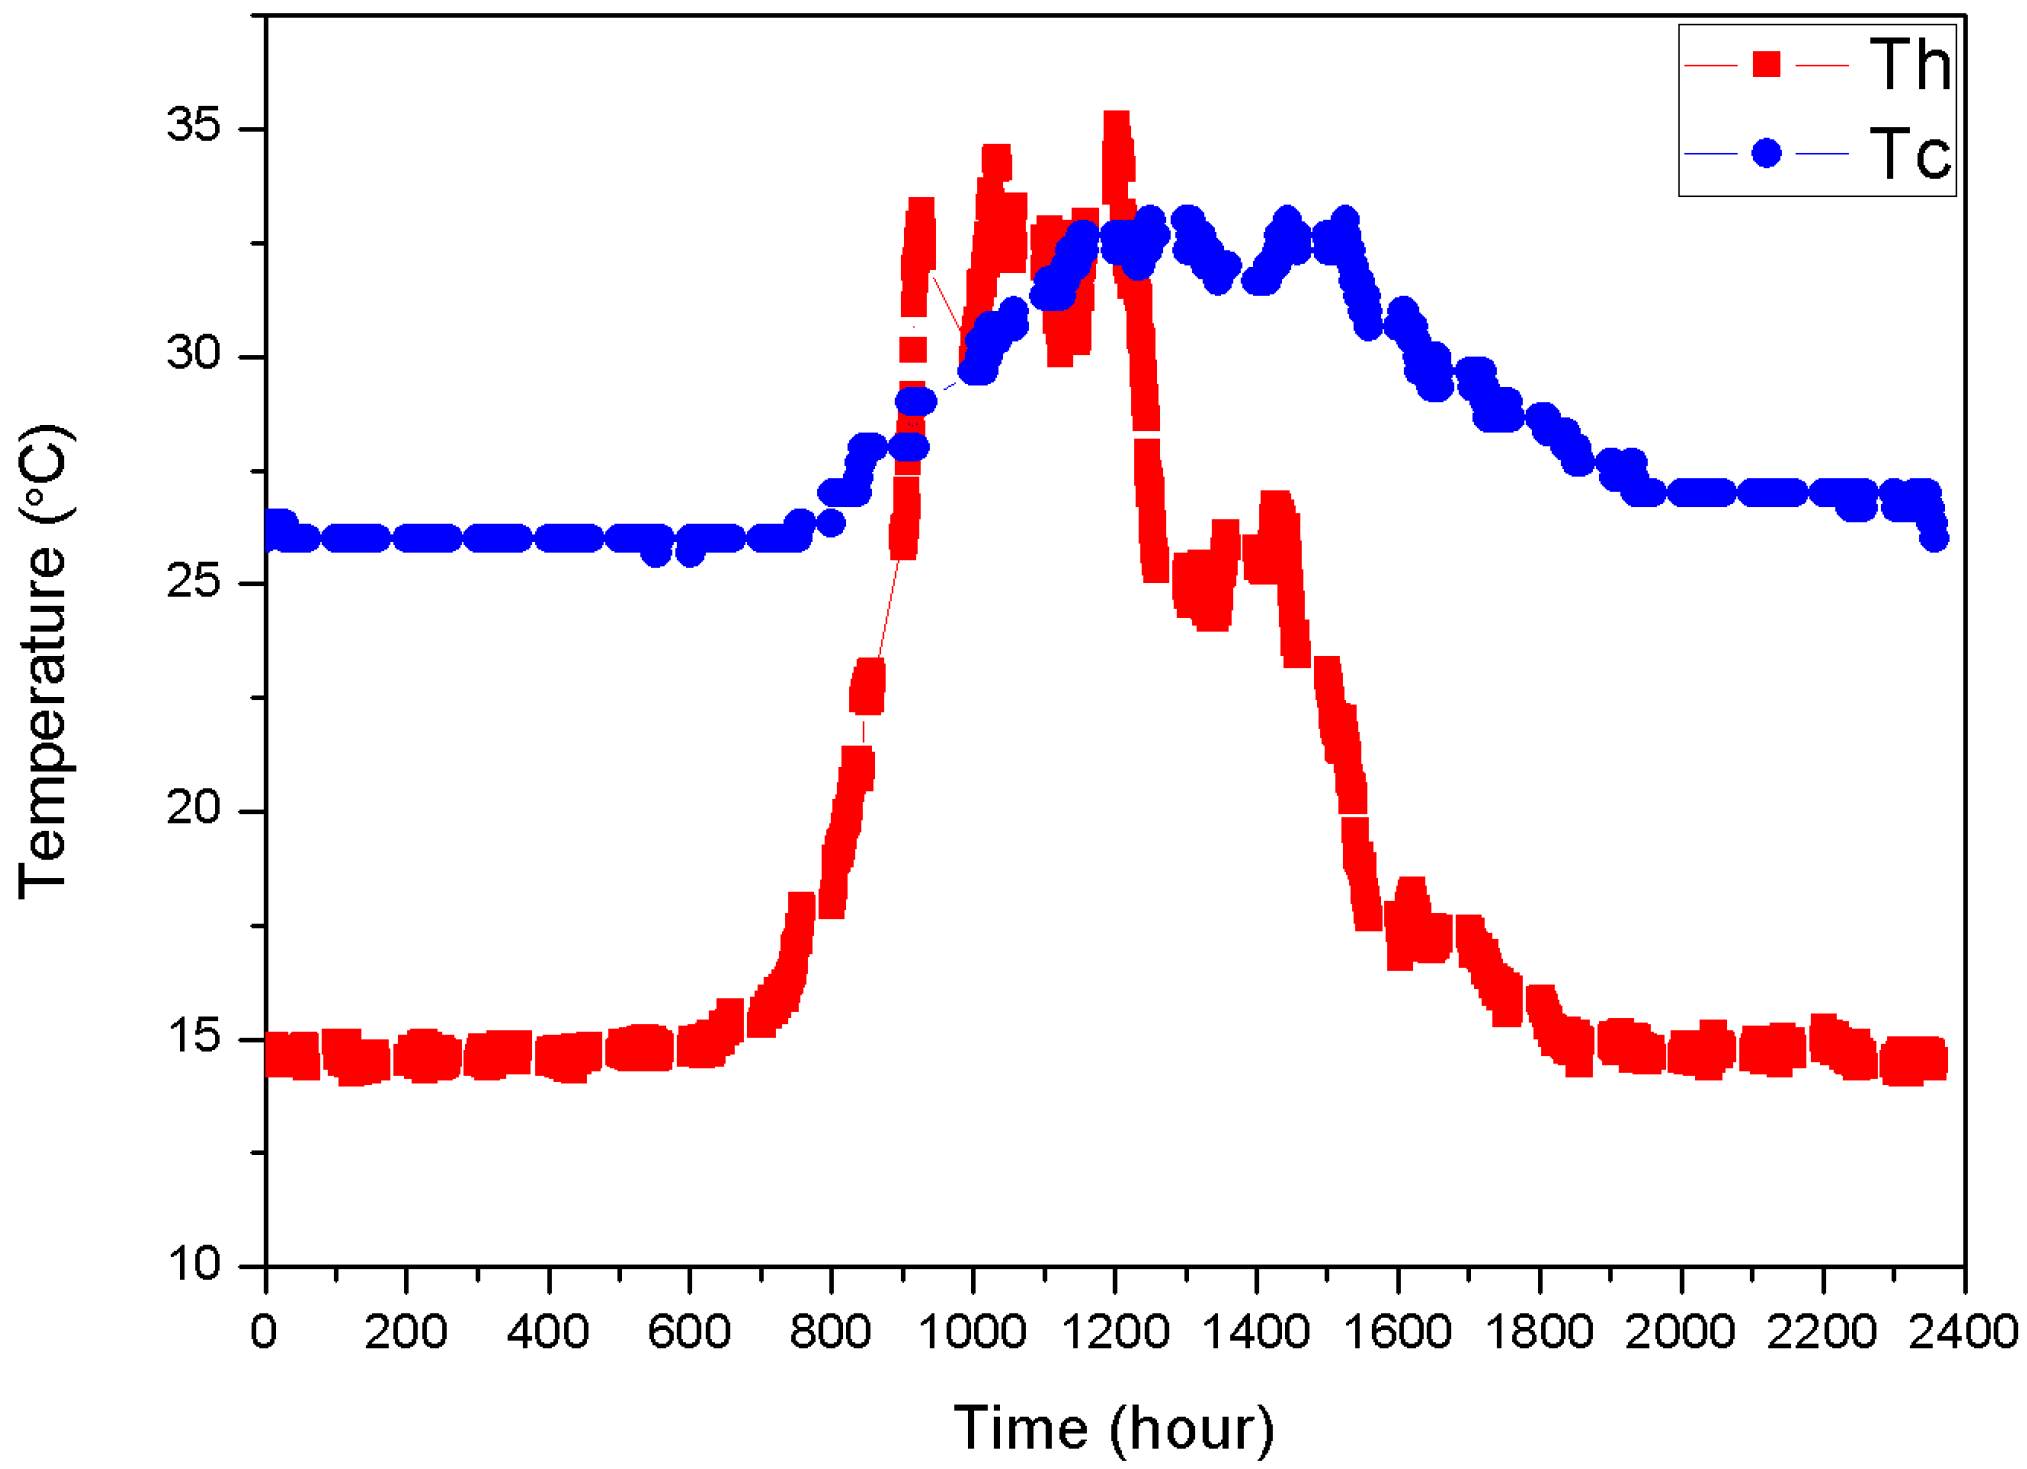
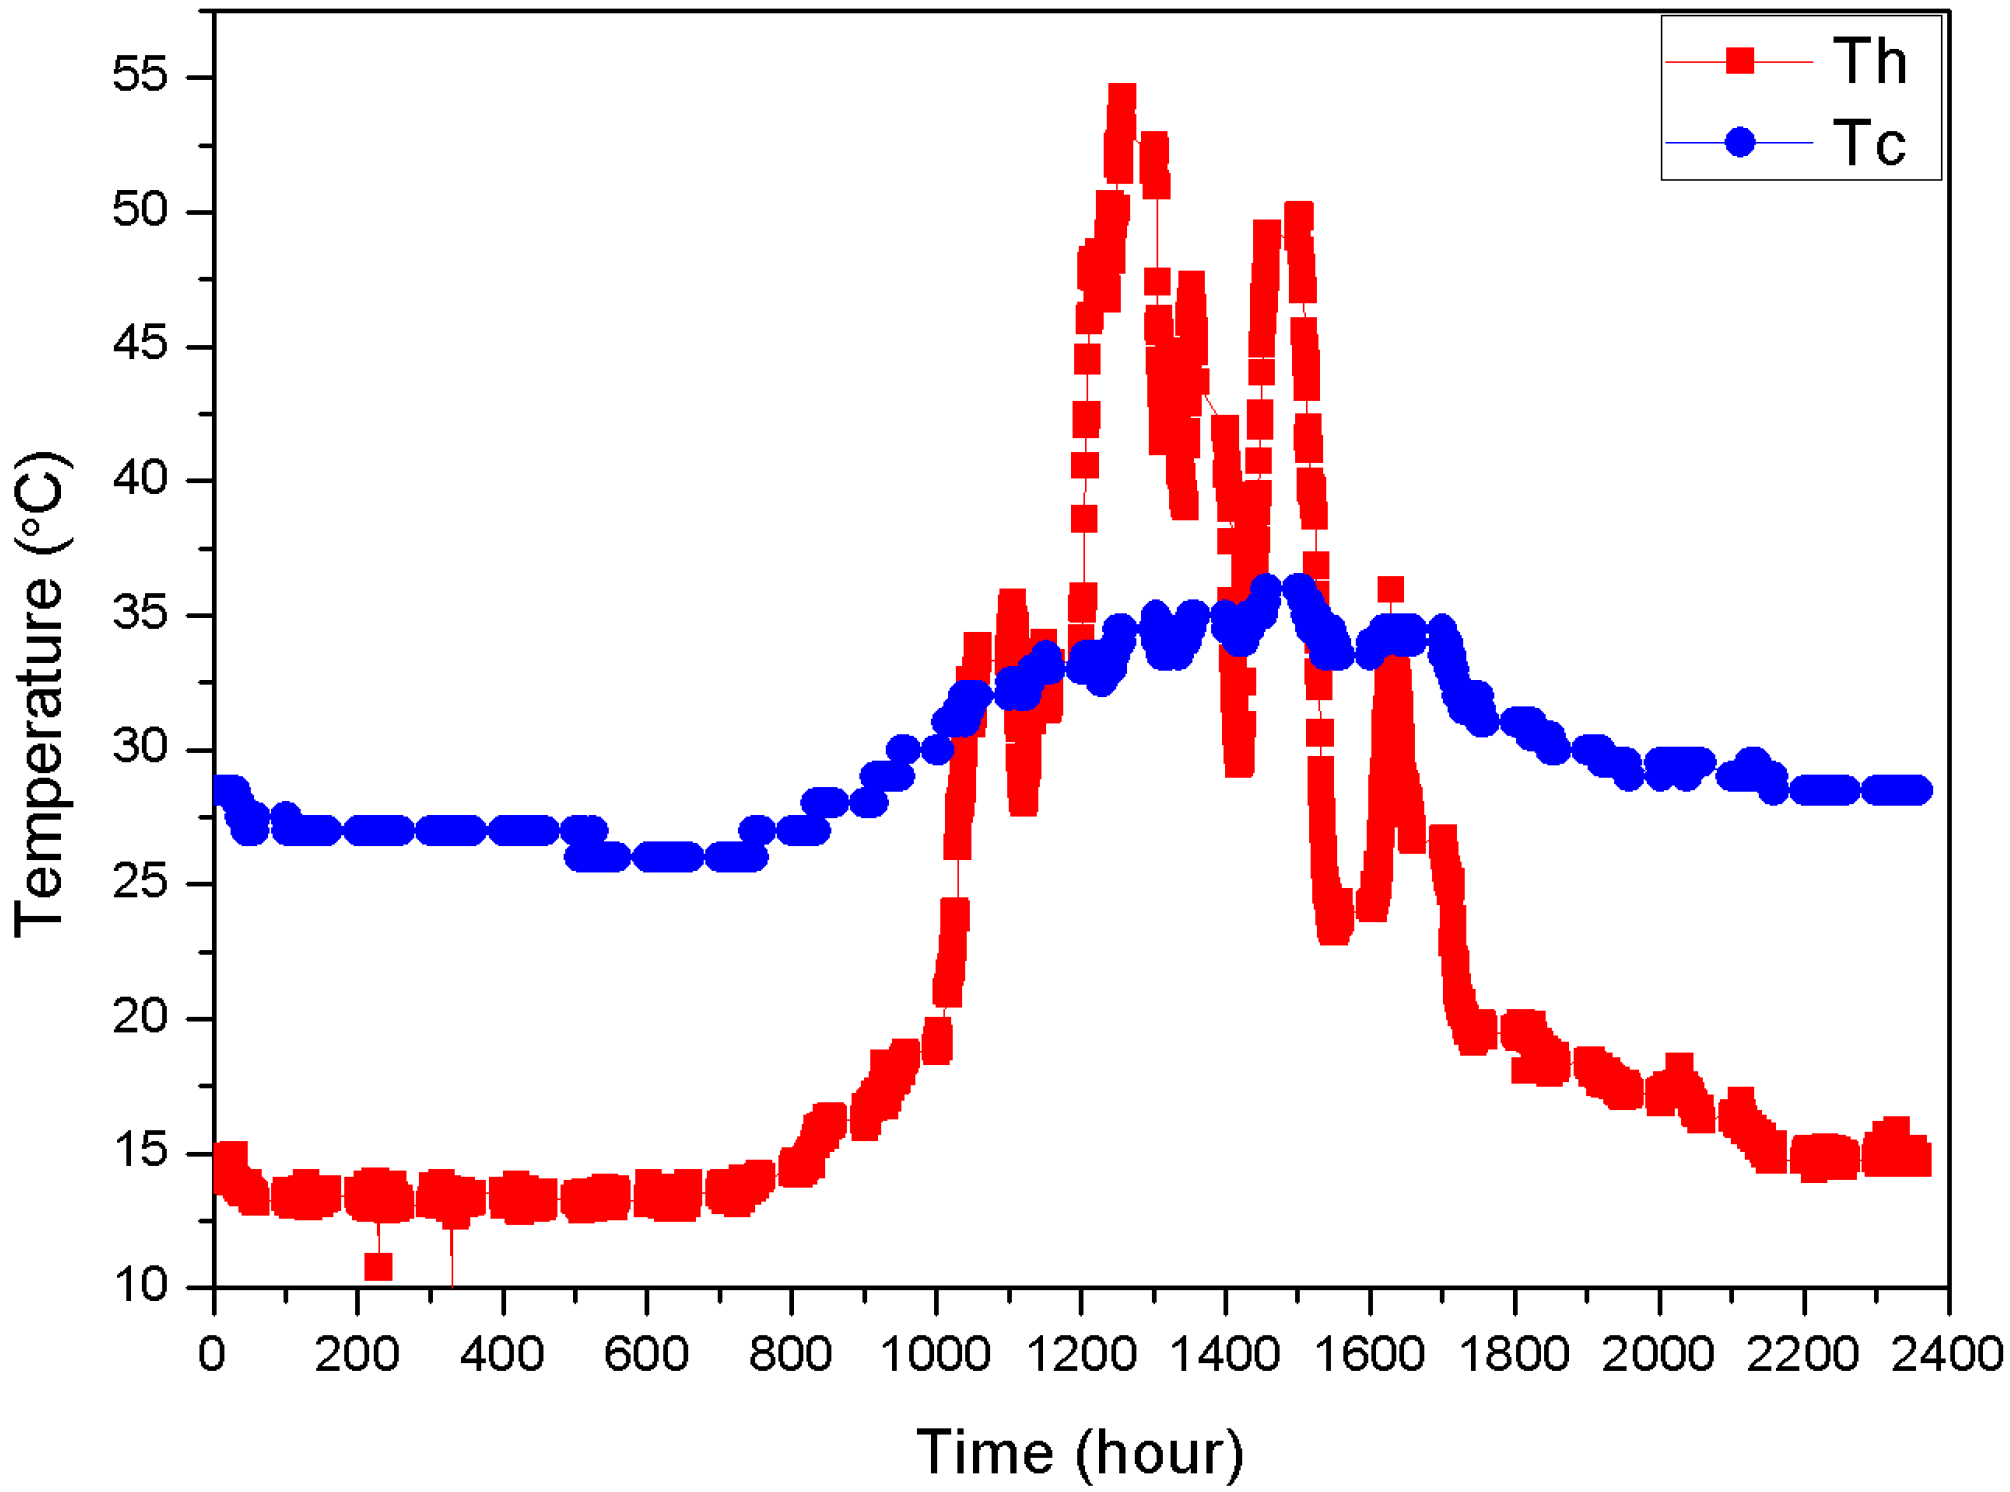
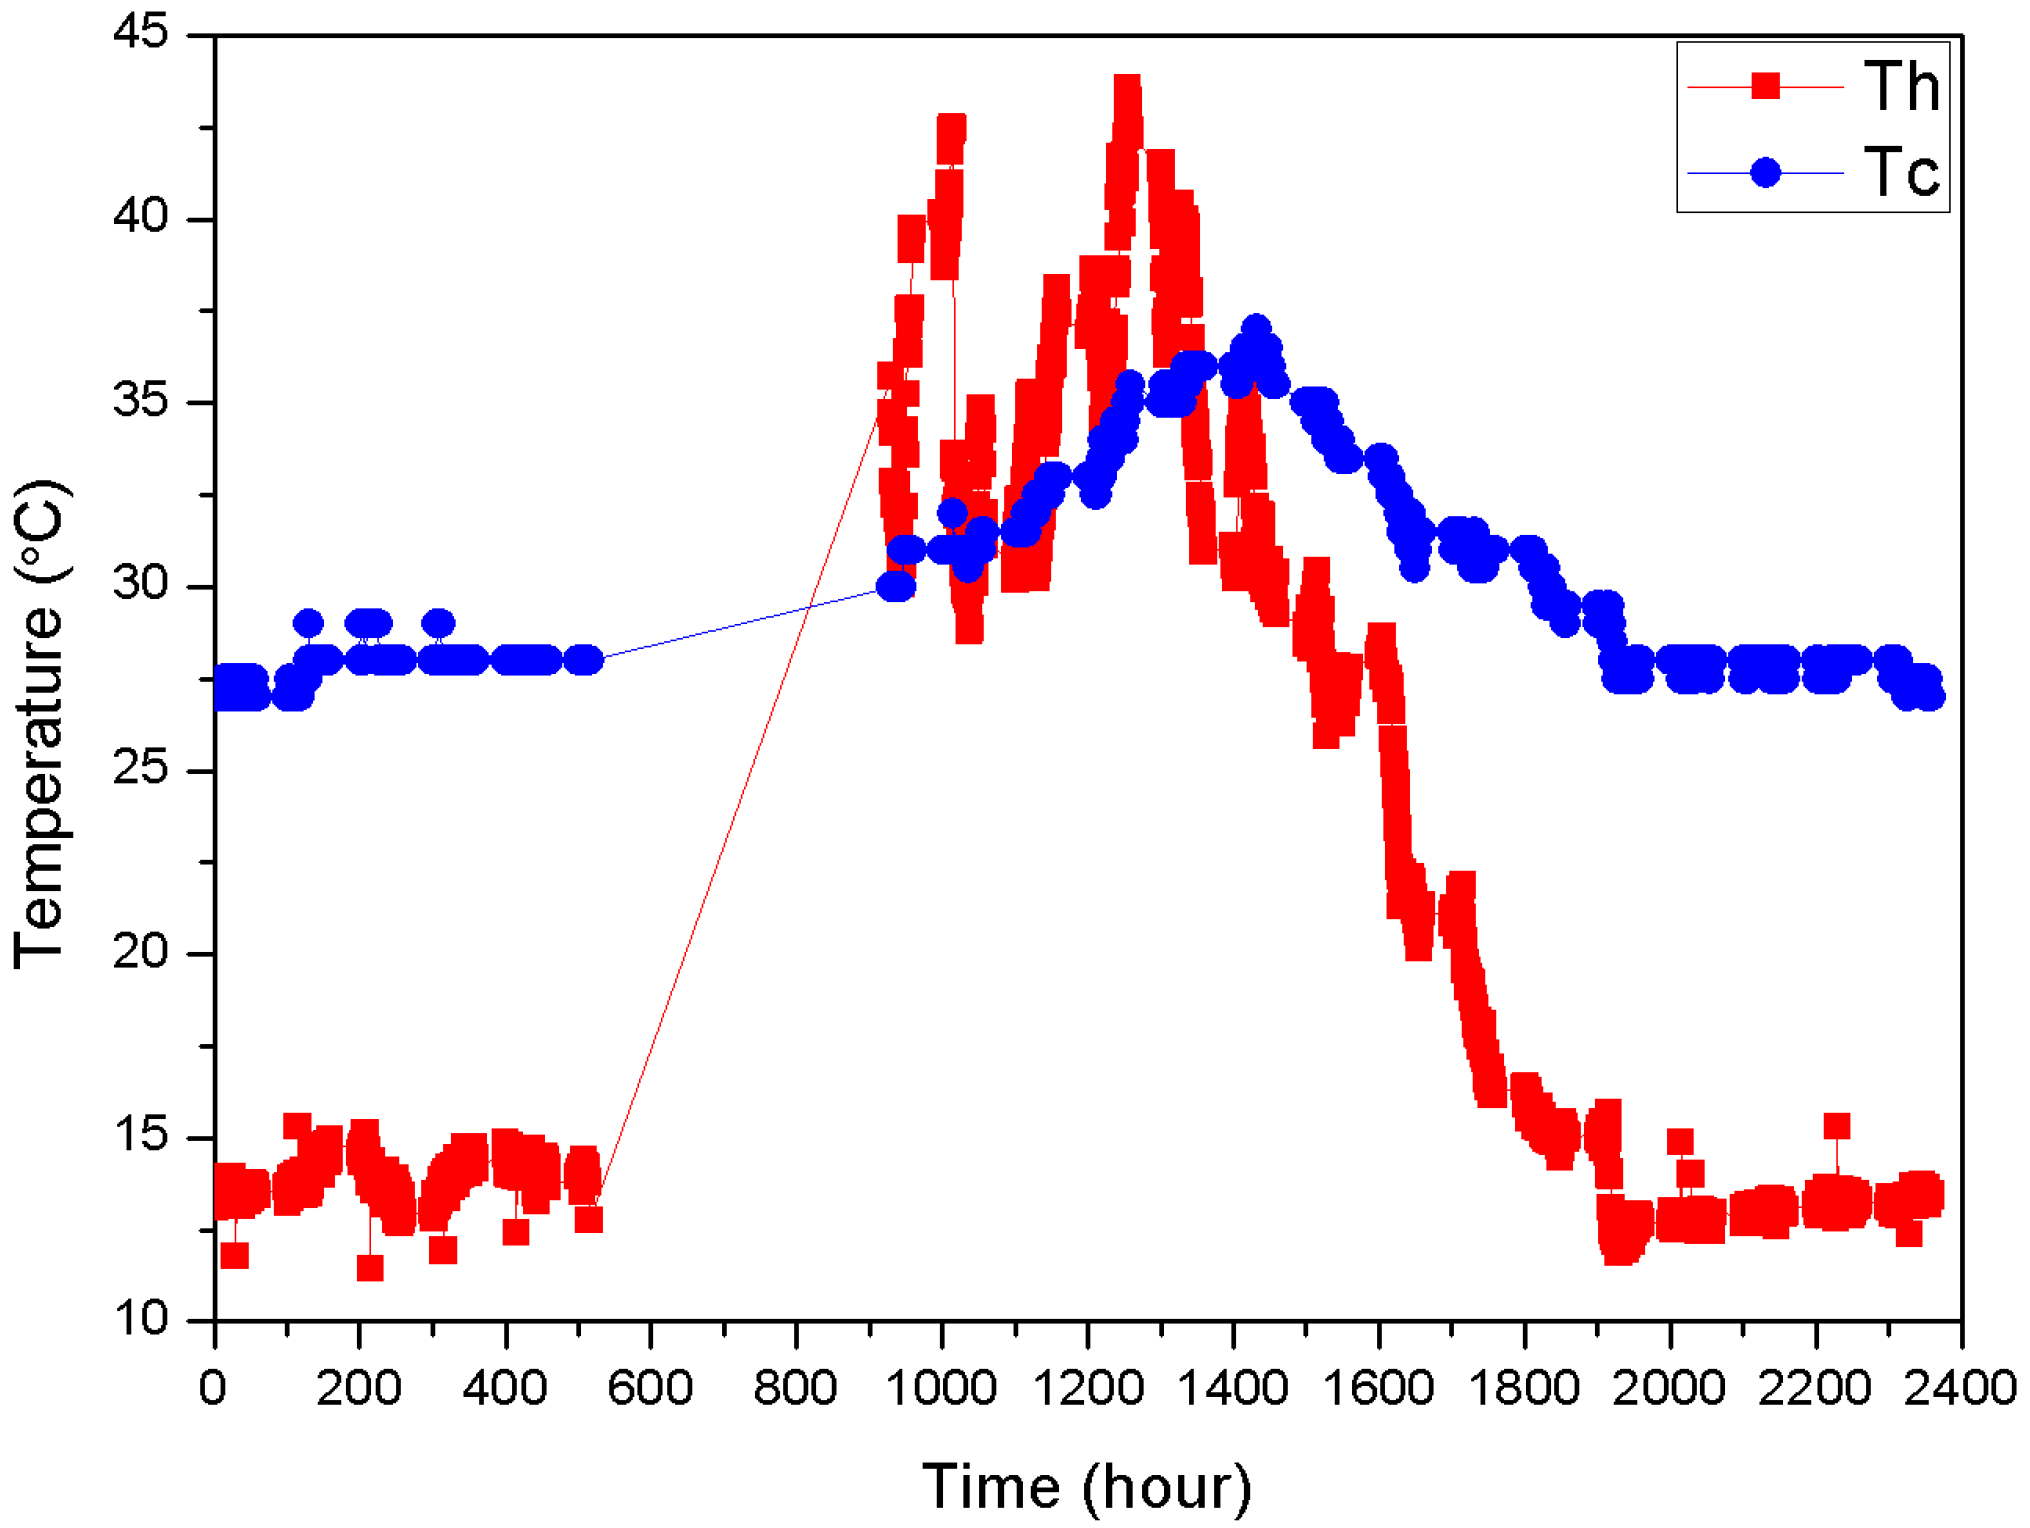
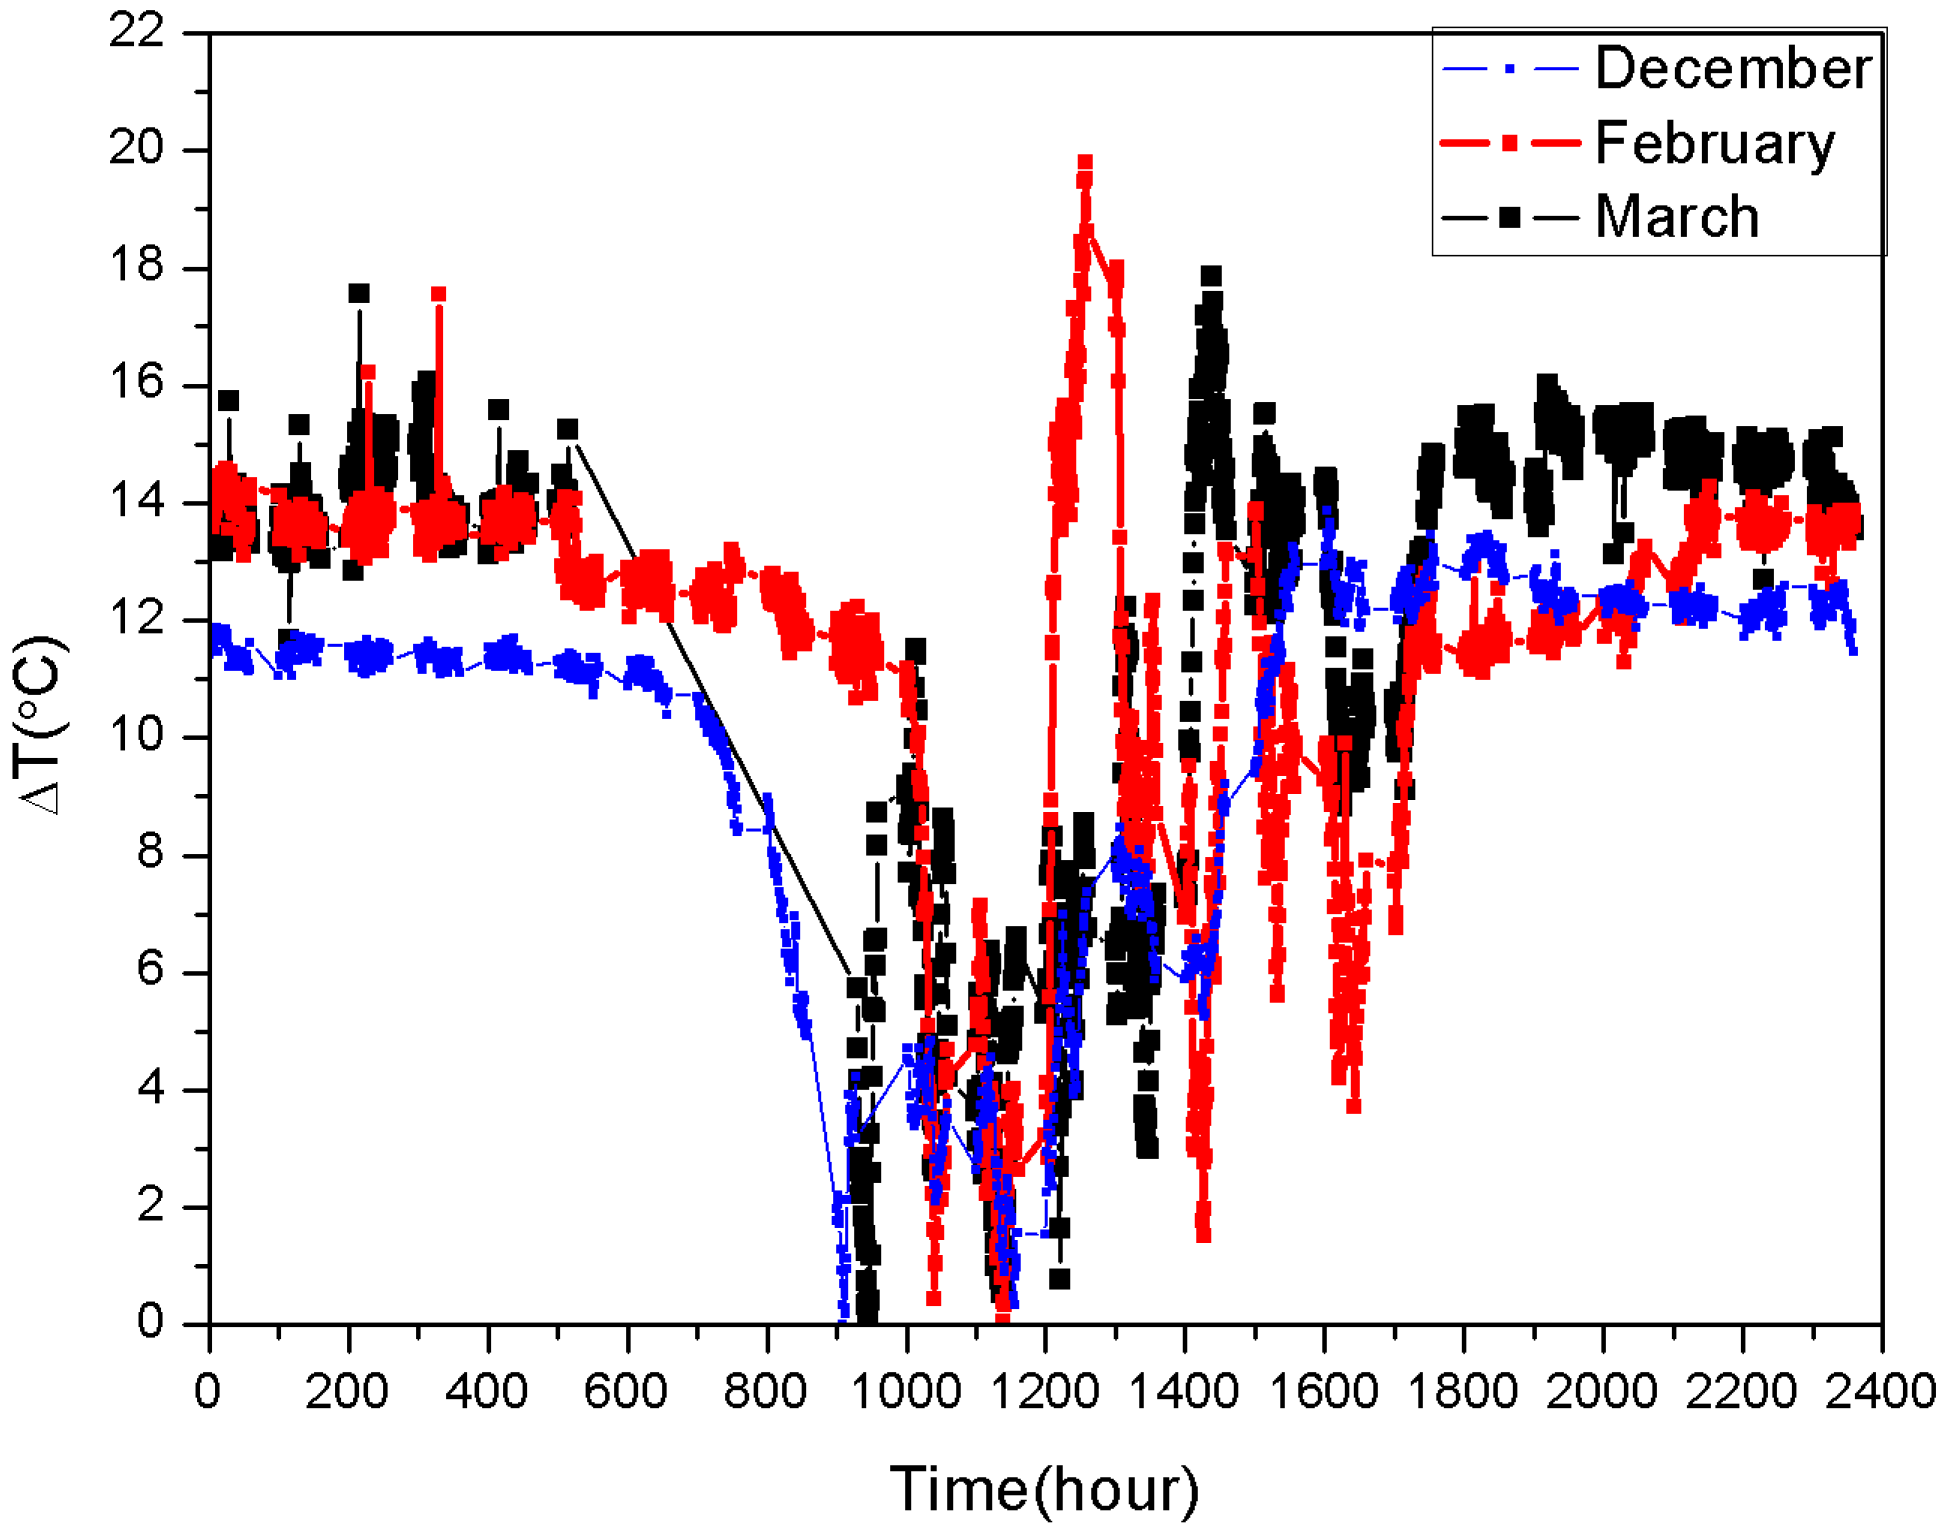
This research focused on the design of a PV-TEG hybrid system for potential indoor farming applications. In striving for agricultural sustainability, usage of renewable energy for agriculture activities was placed as a priority, especially with the continually improved methods used in agriculture, such as the indoor farming approach. Solar energy technologies, particularly solar PV, were the most suitable choice for countries with a hot and humid climate like Malaysia. In order to combat the unreliability of solar PV systems, a hybrid PV-TEG system was designed to further improve the efficiency of a sole PV system. The hybrid system was designed to provide sufficient load to the LED used in indoor farming. The system was experimentally tested under actual Malaysian weather conditions in the months of December, February, and March. The system performance was analyzed based on the changing ambient and panel temperature, solar irradiance, and the effect of TEG connections to the overall power output. From the experiment conducted, the significant findings are summarized as follows:
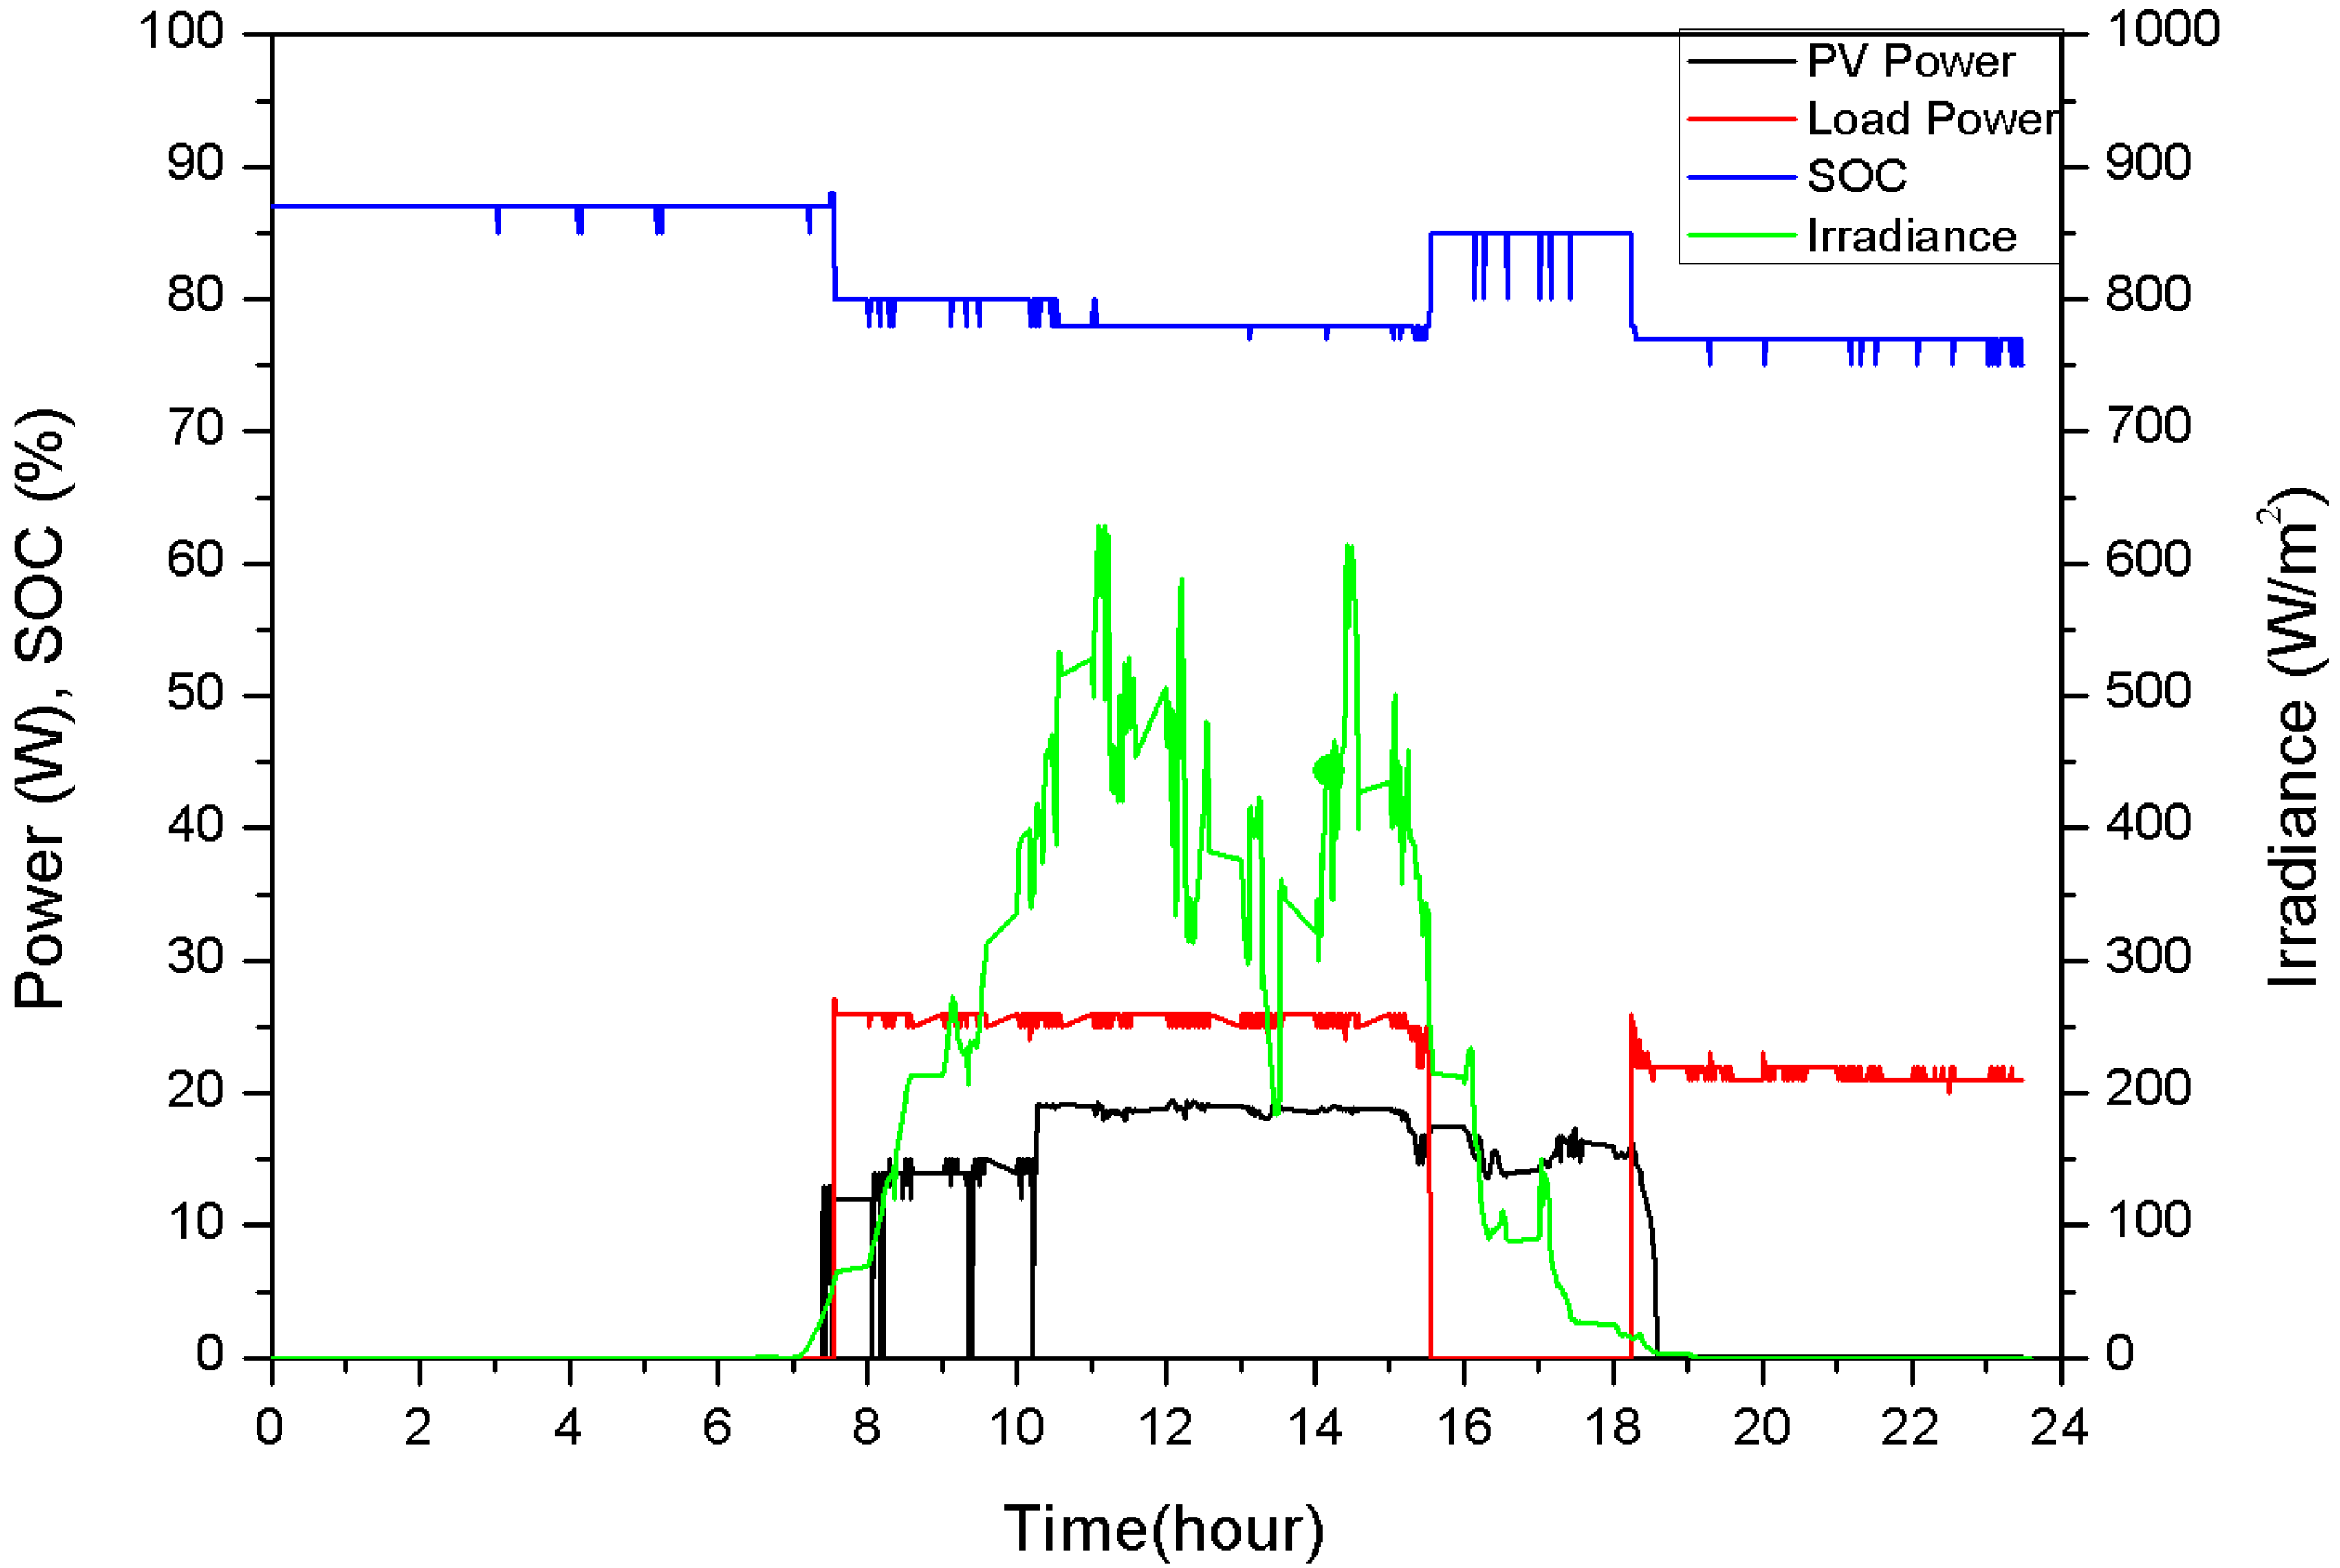
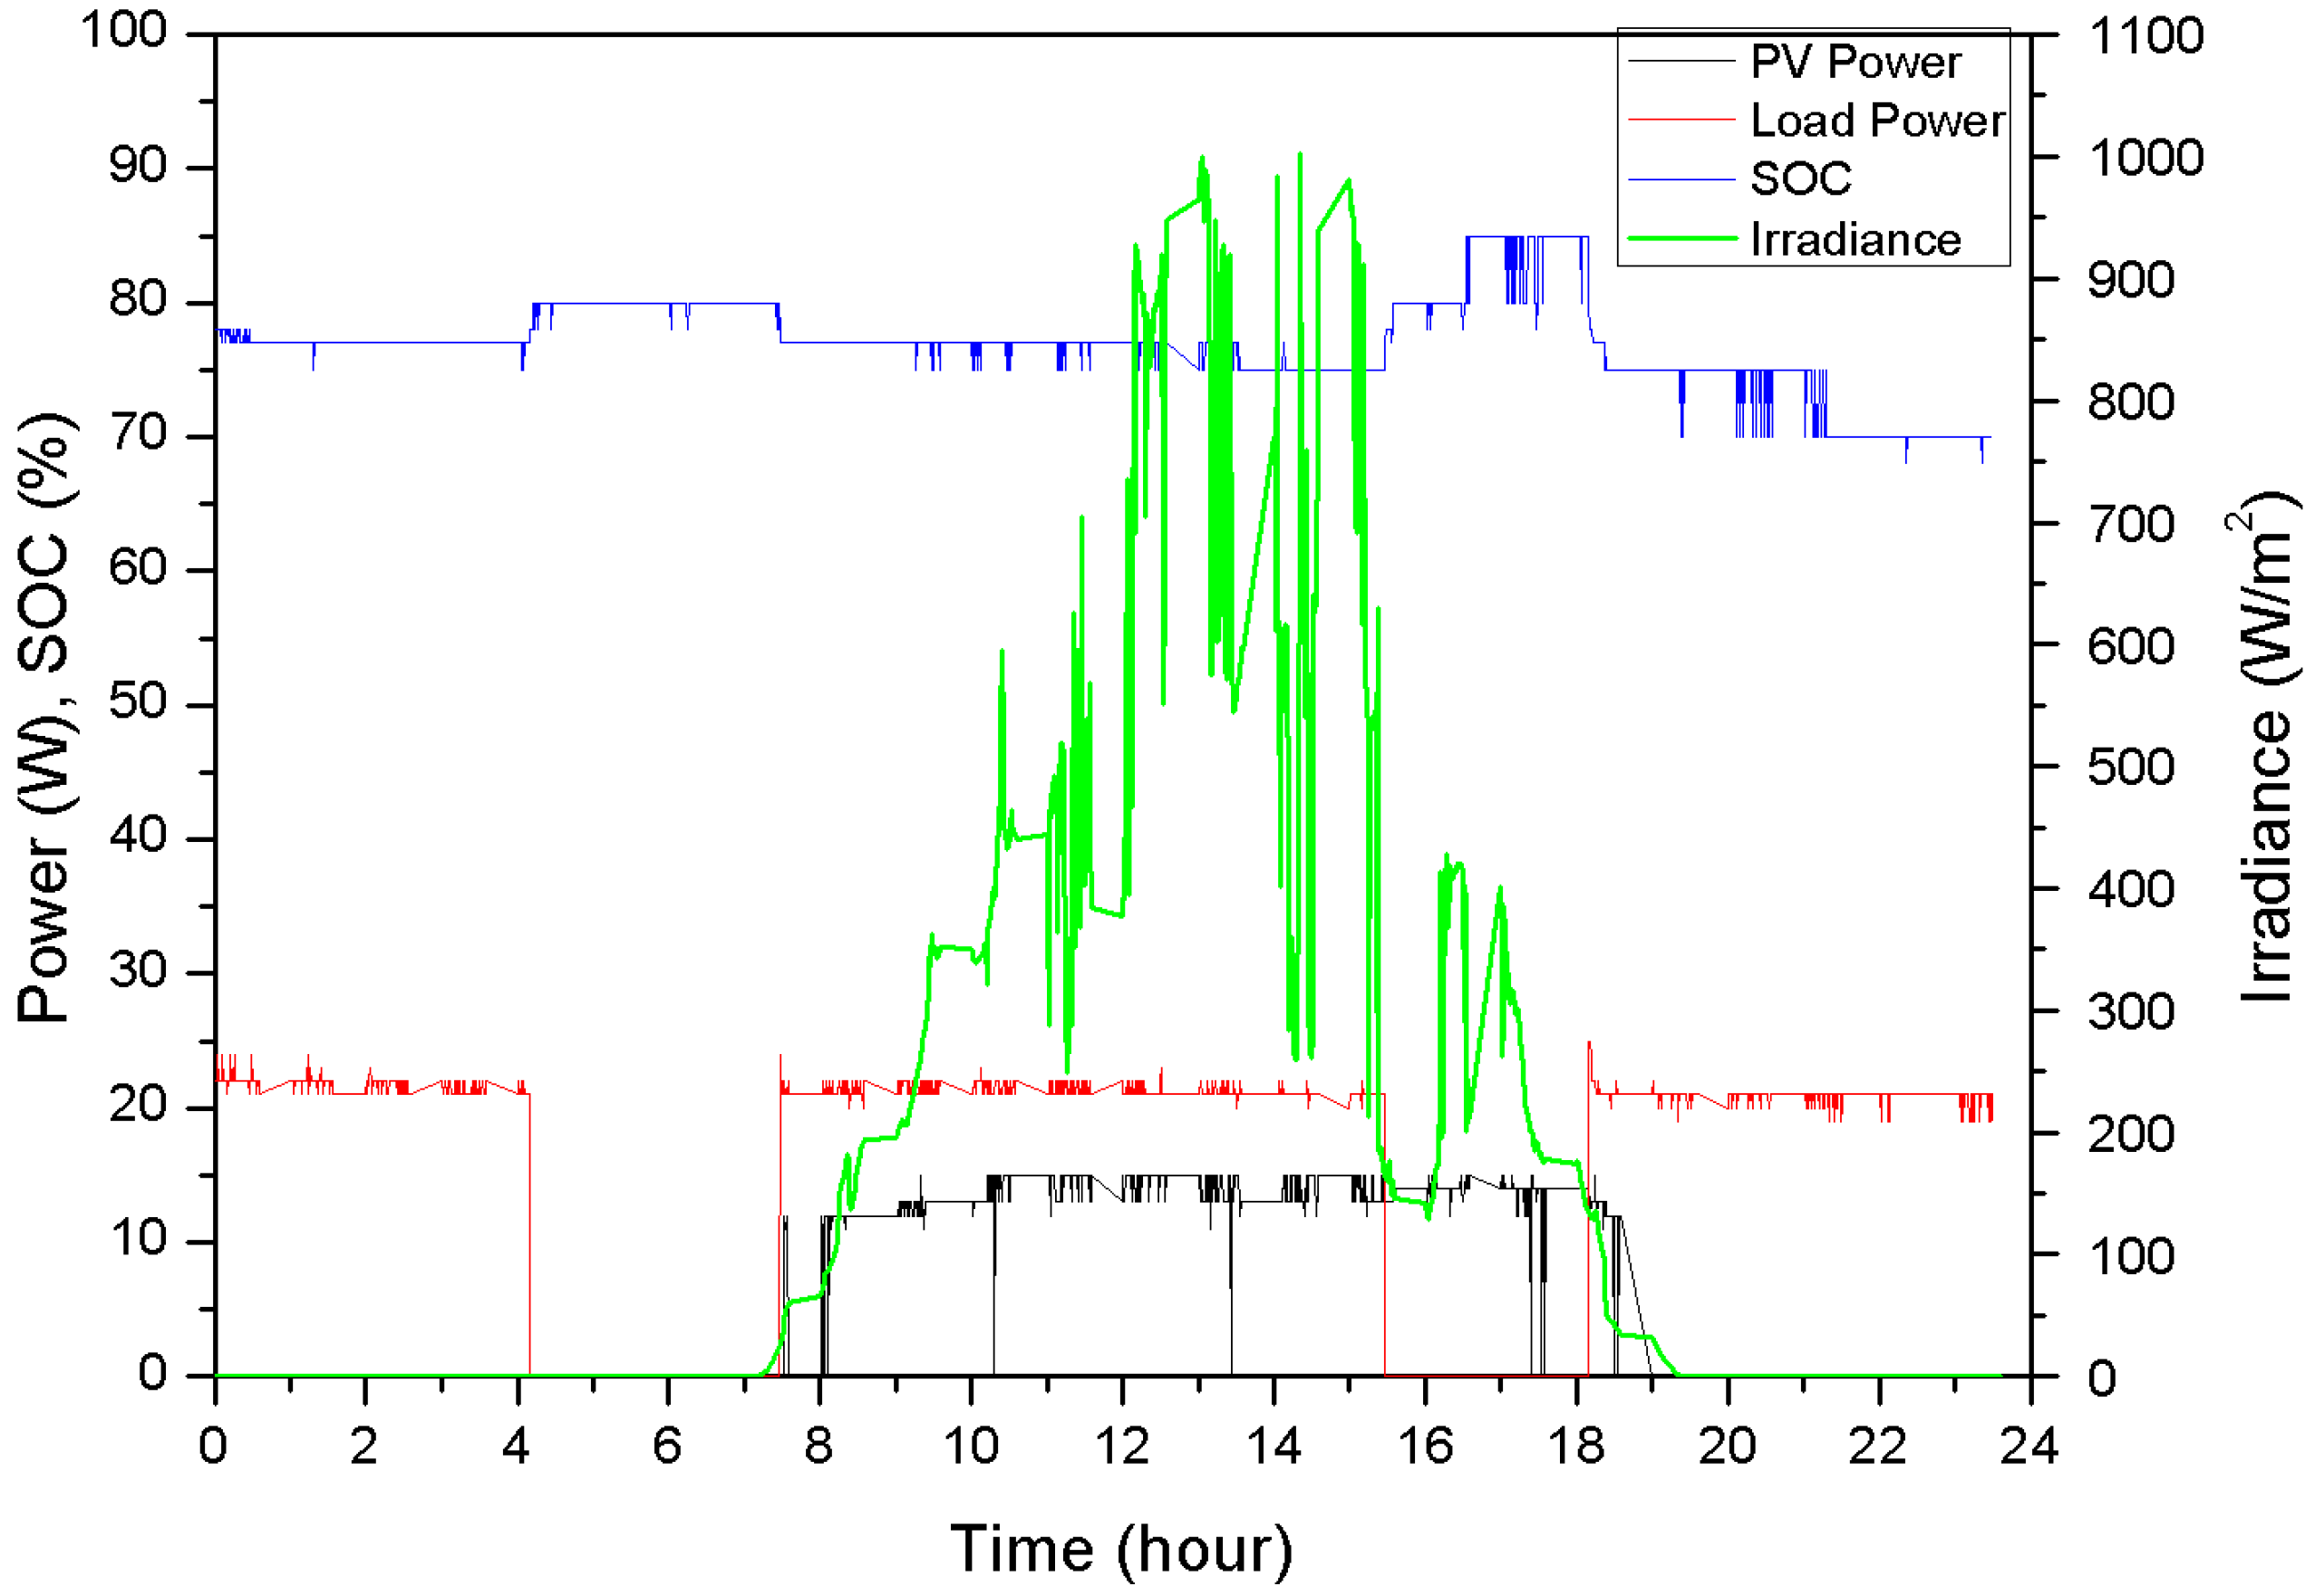
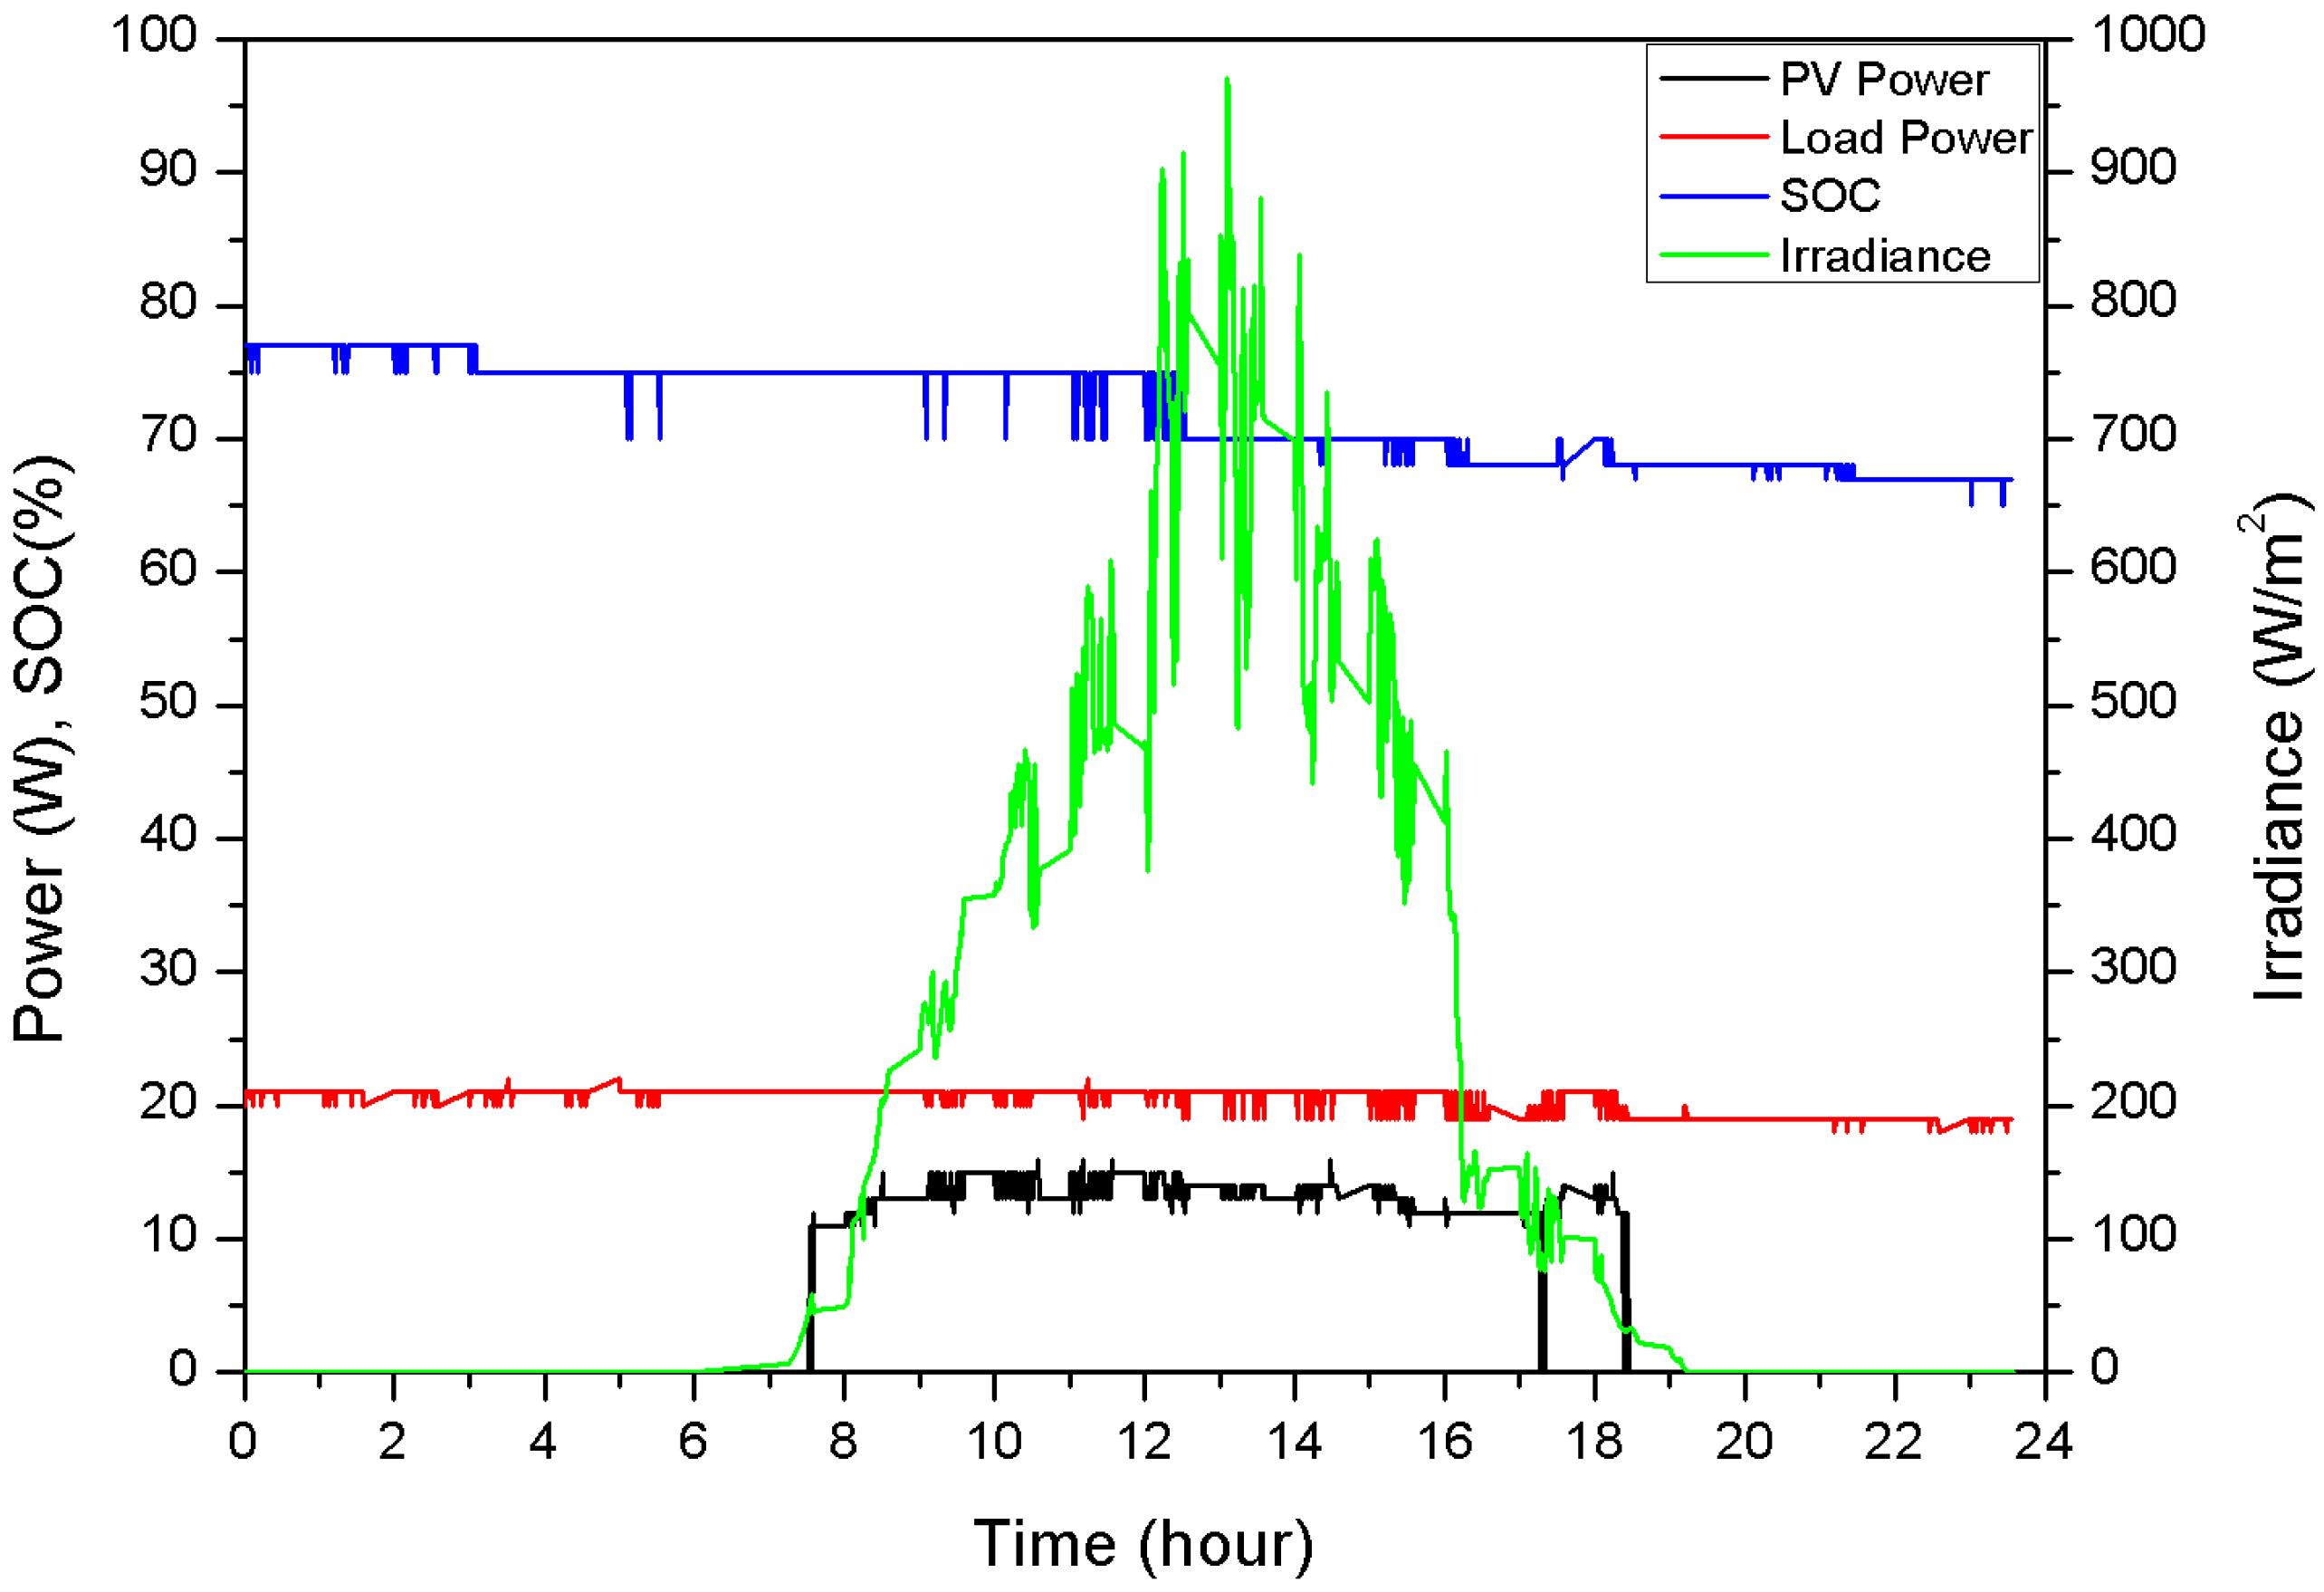
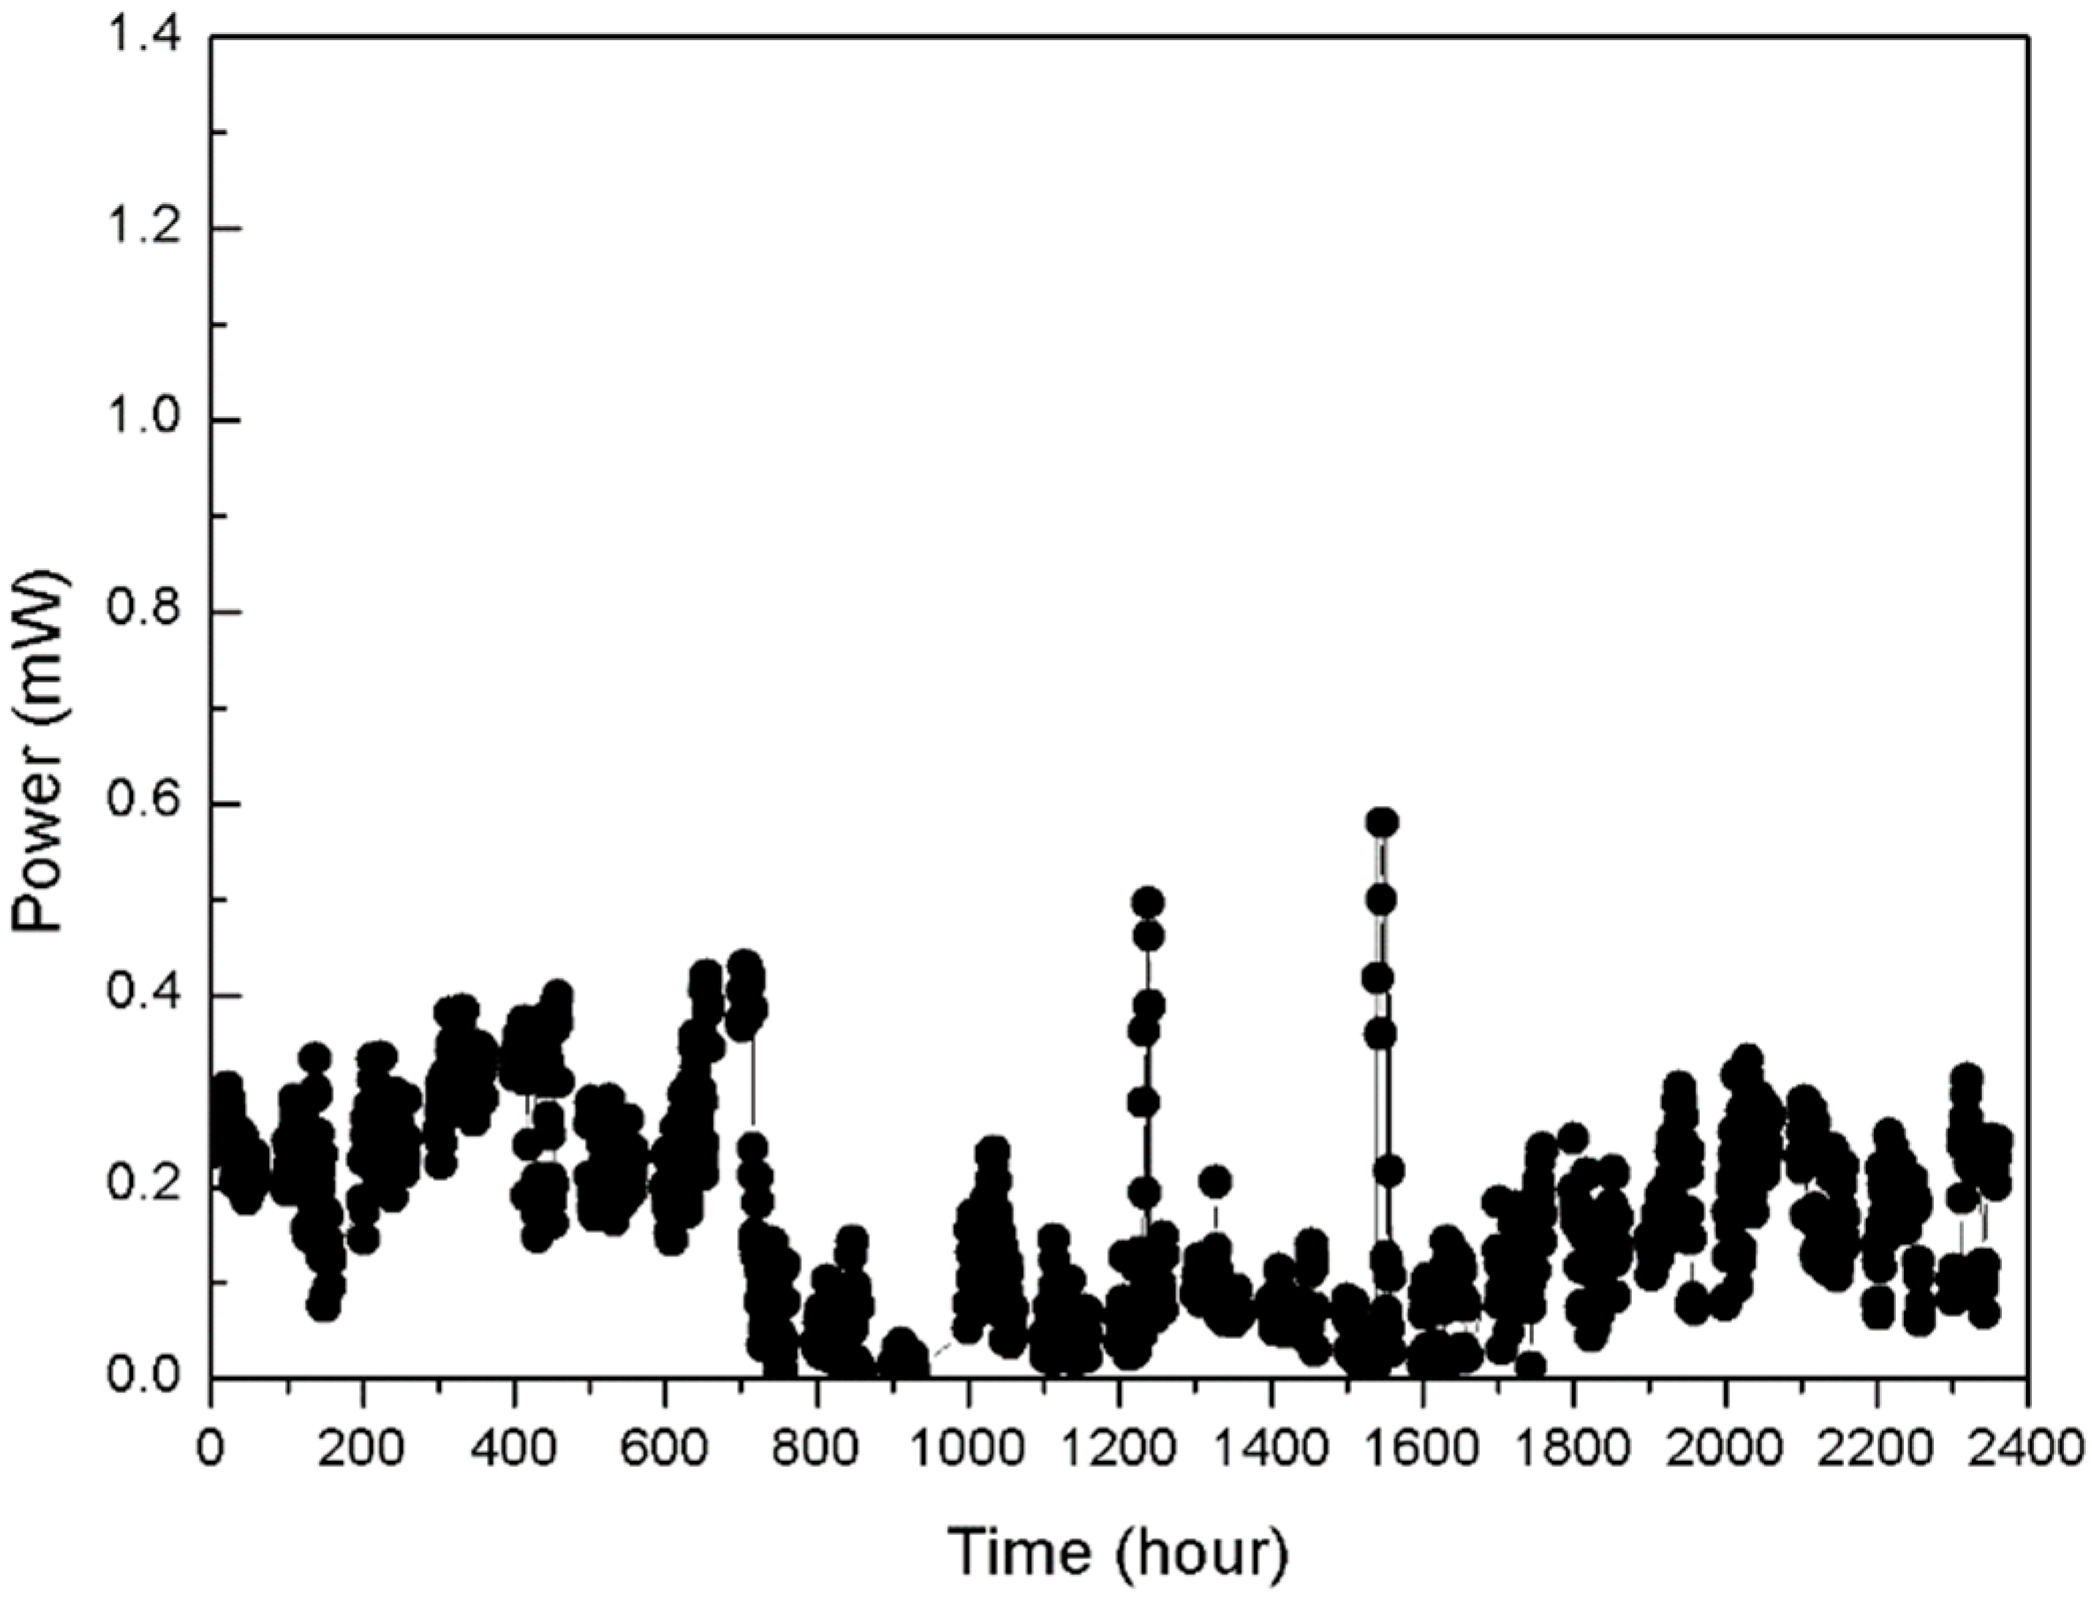
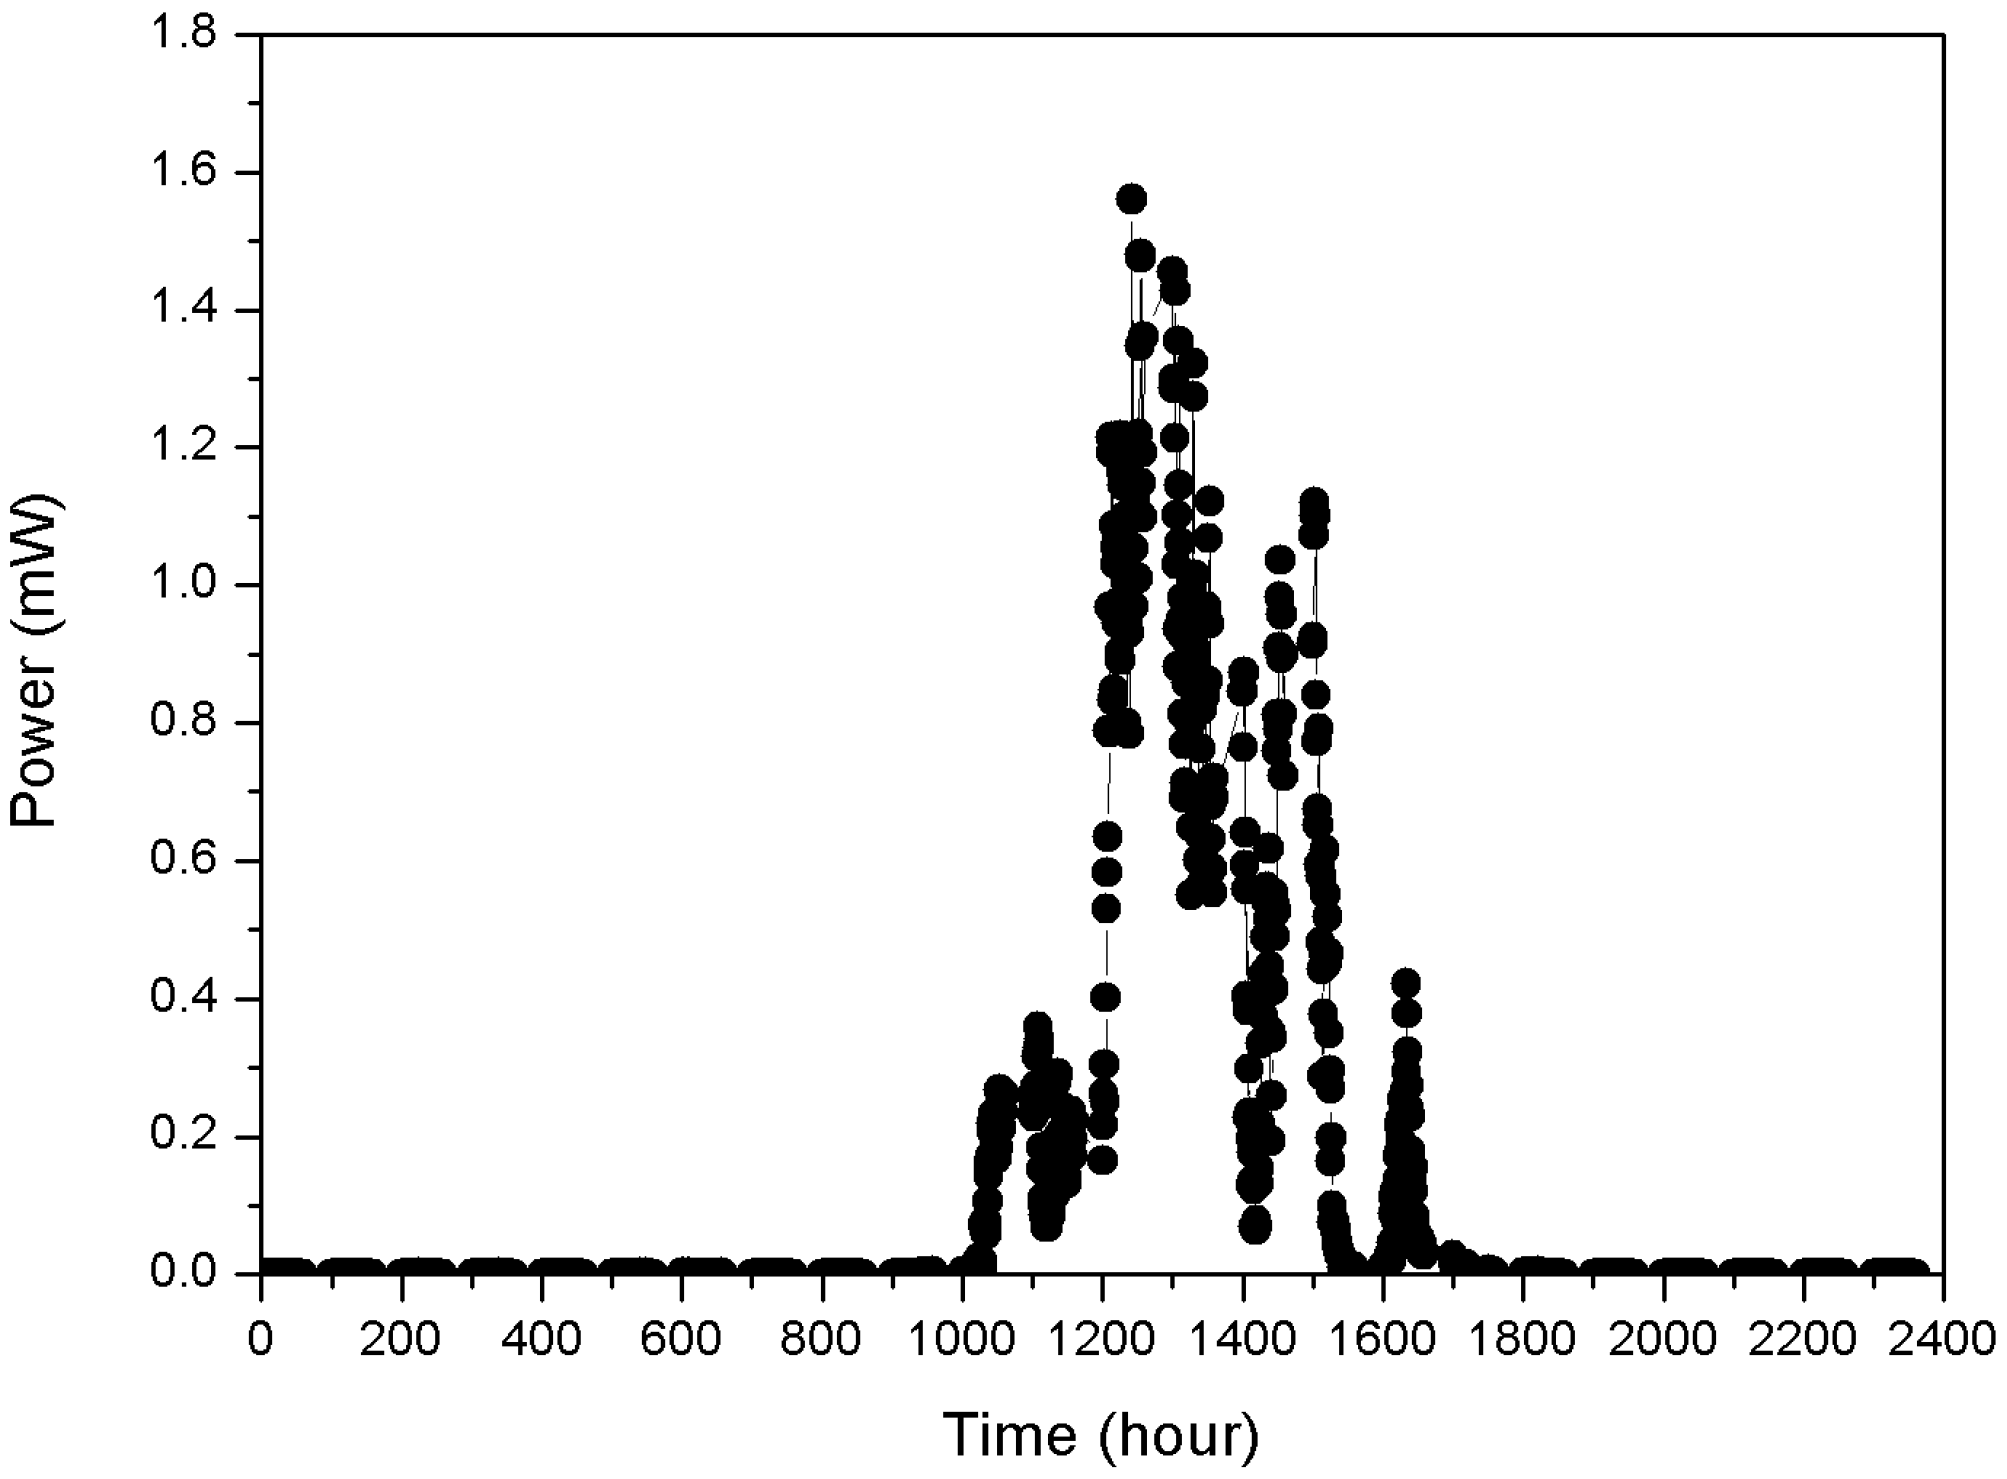
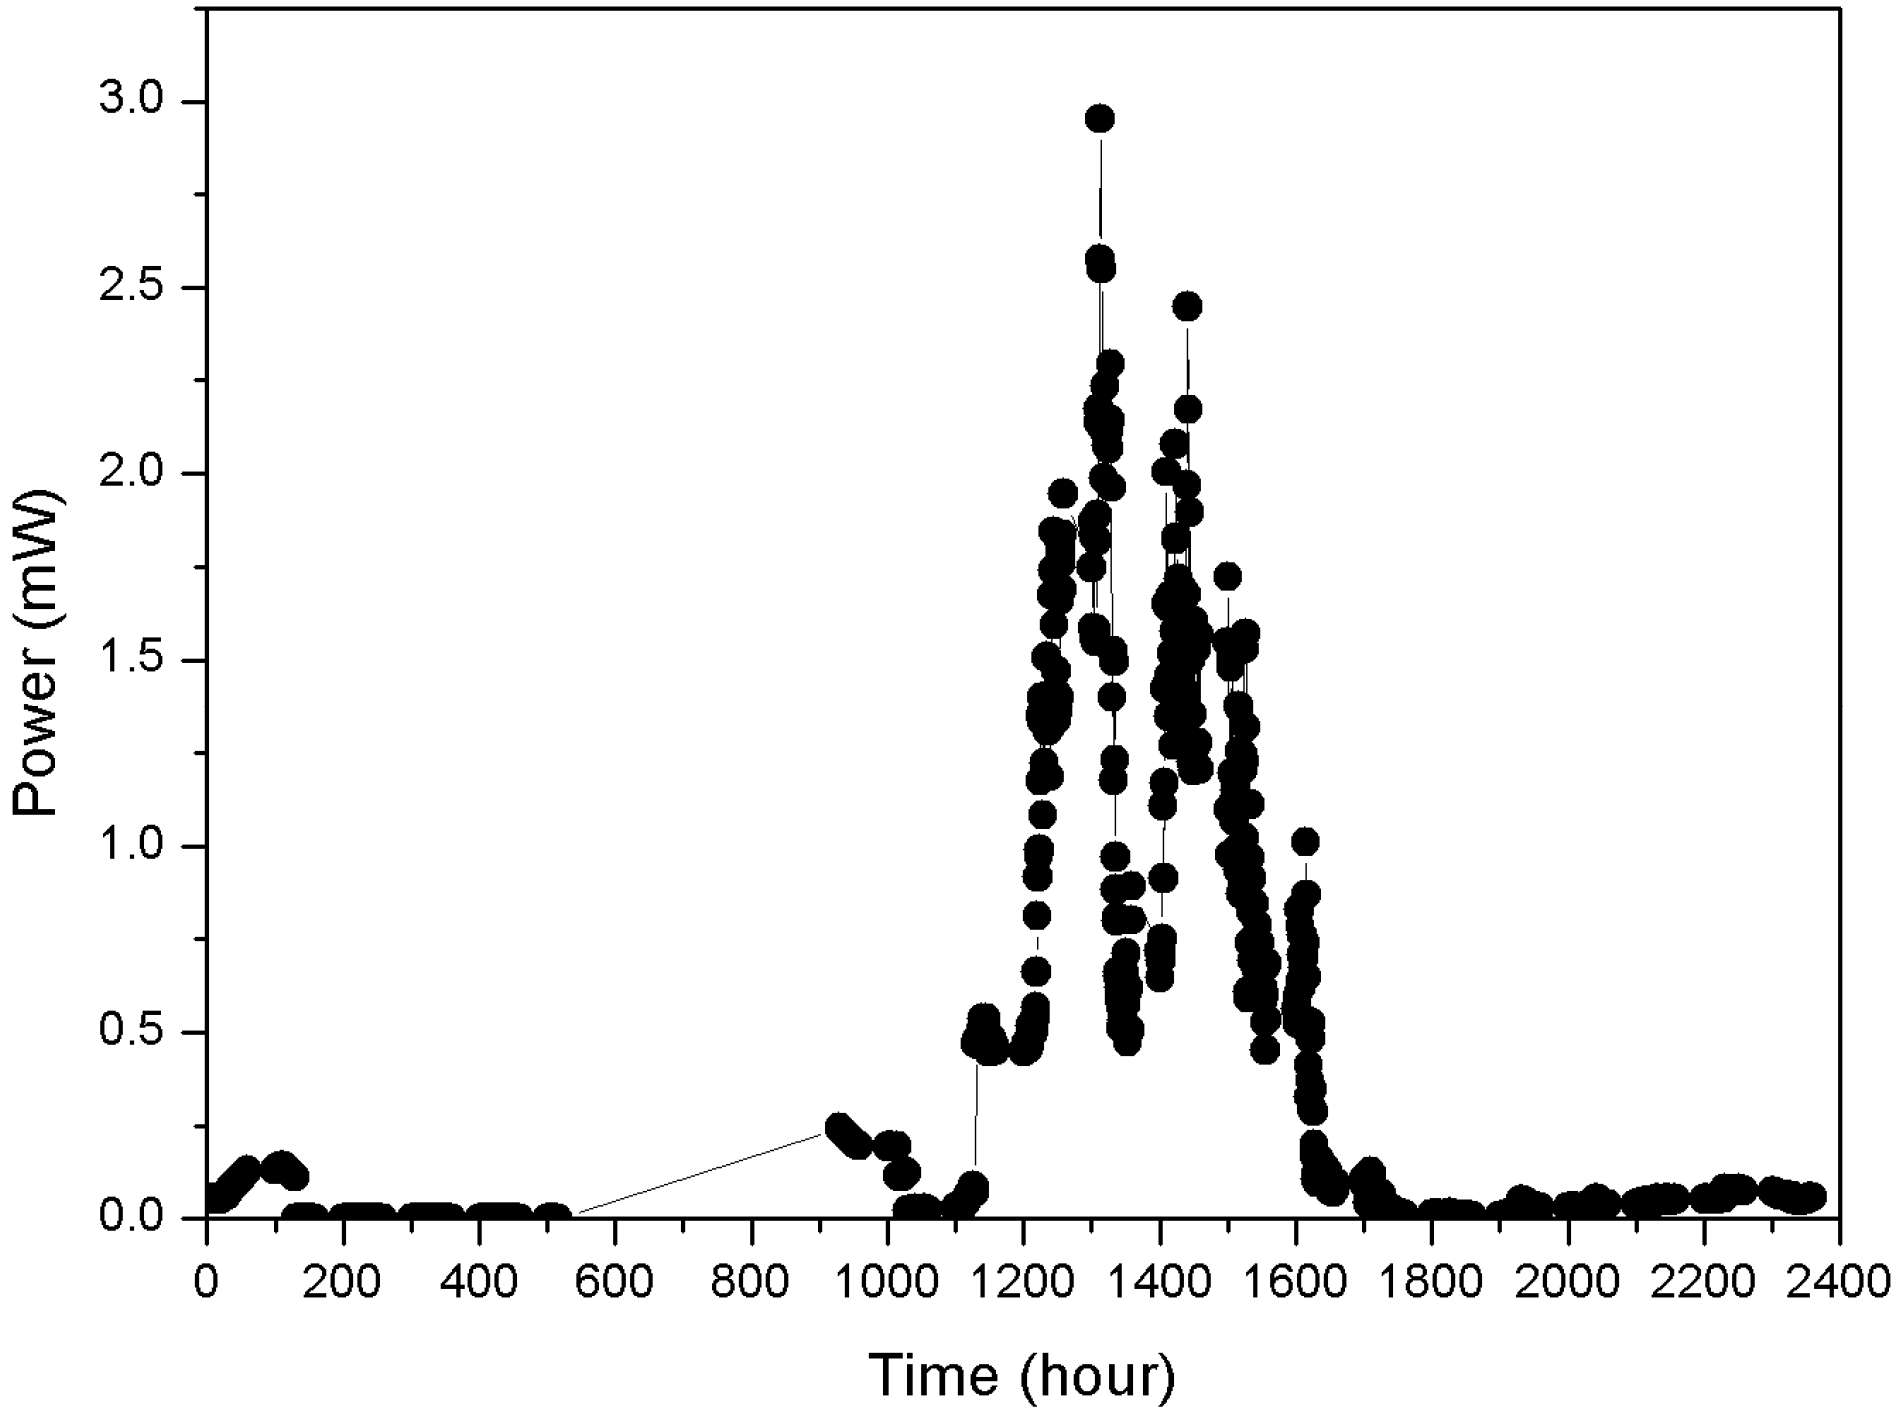
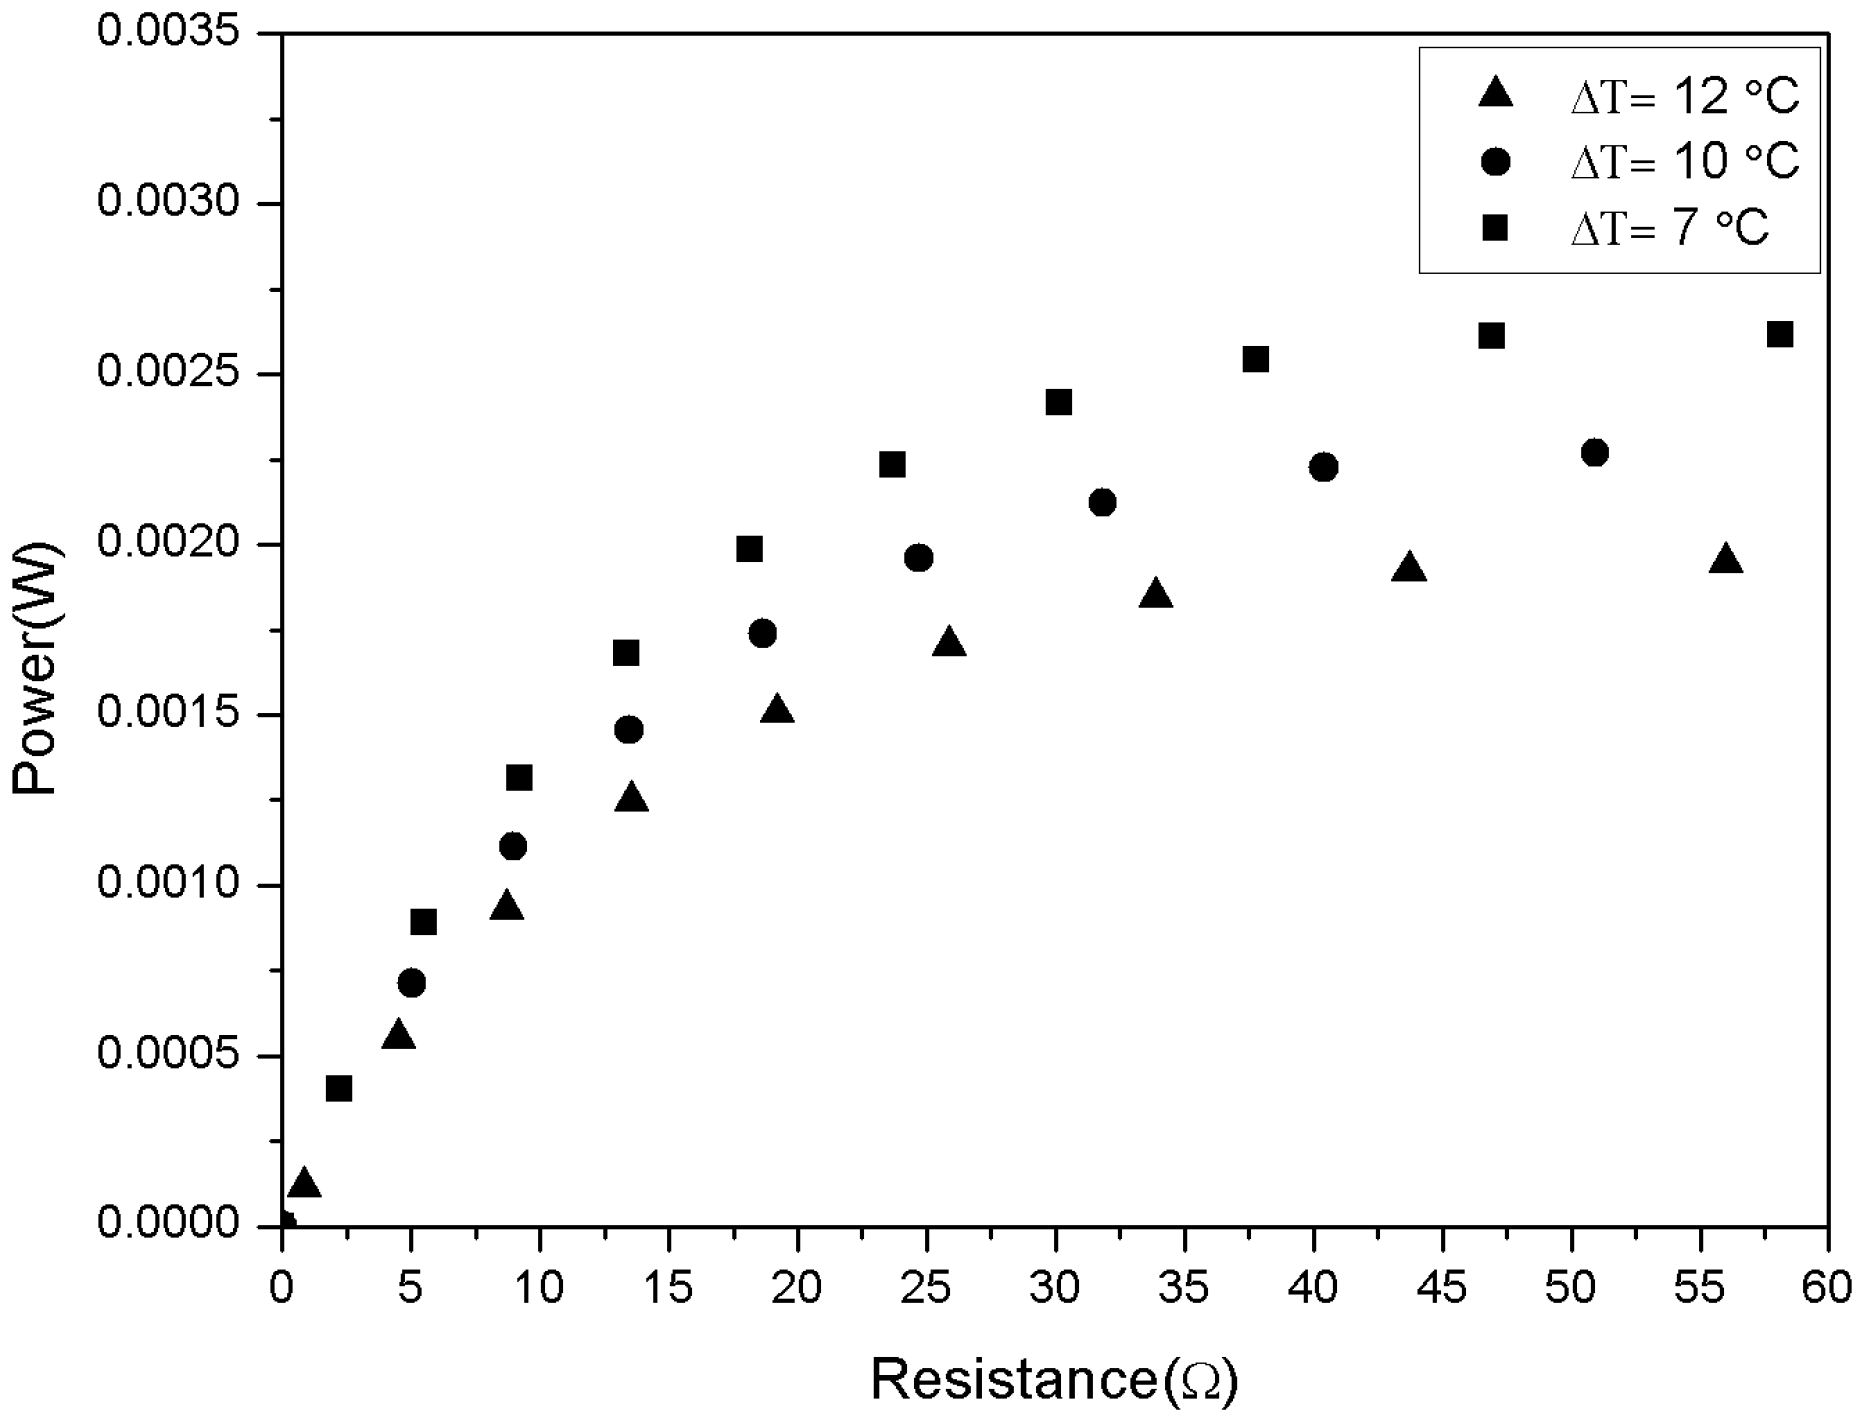
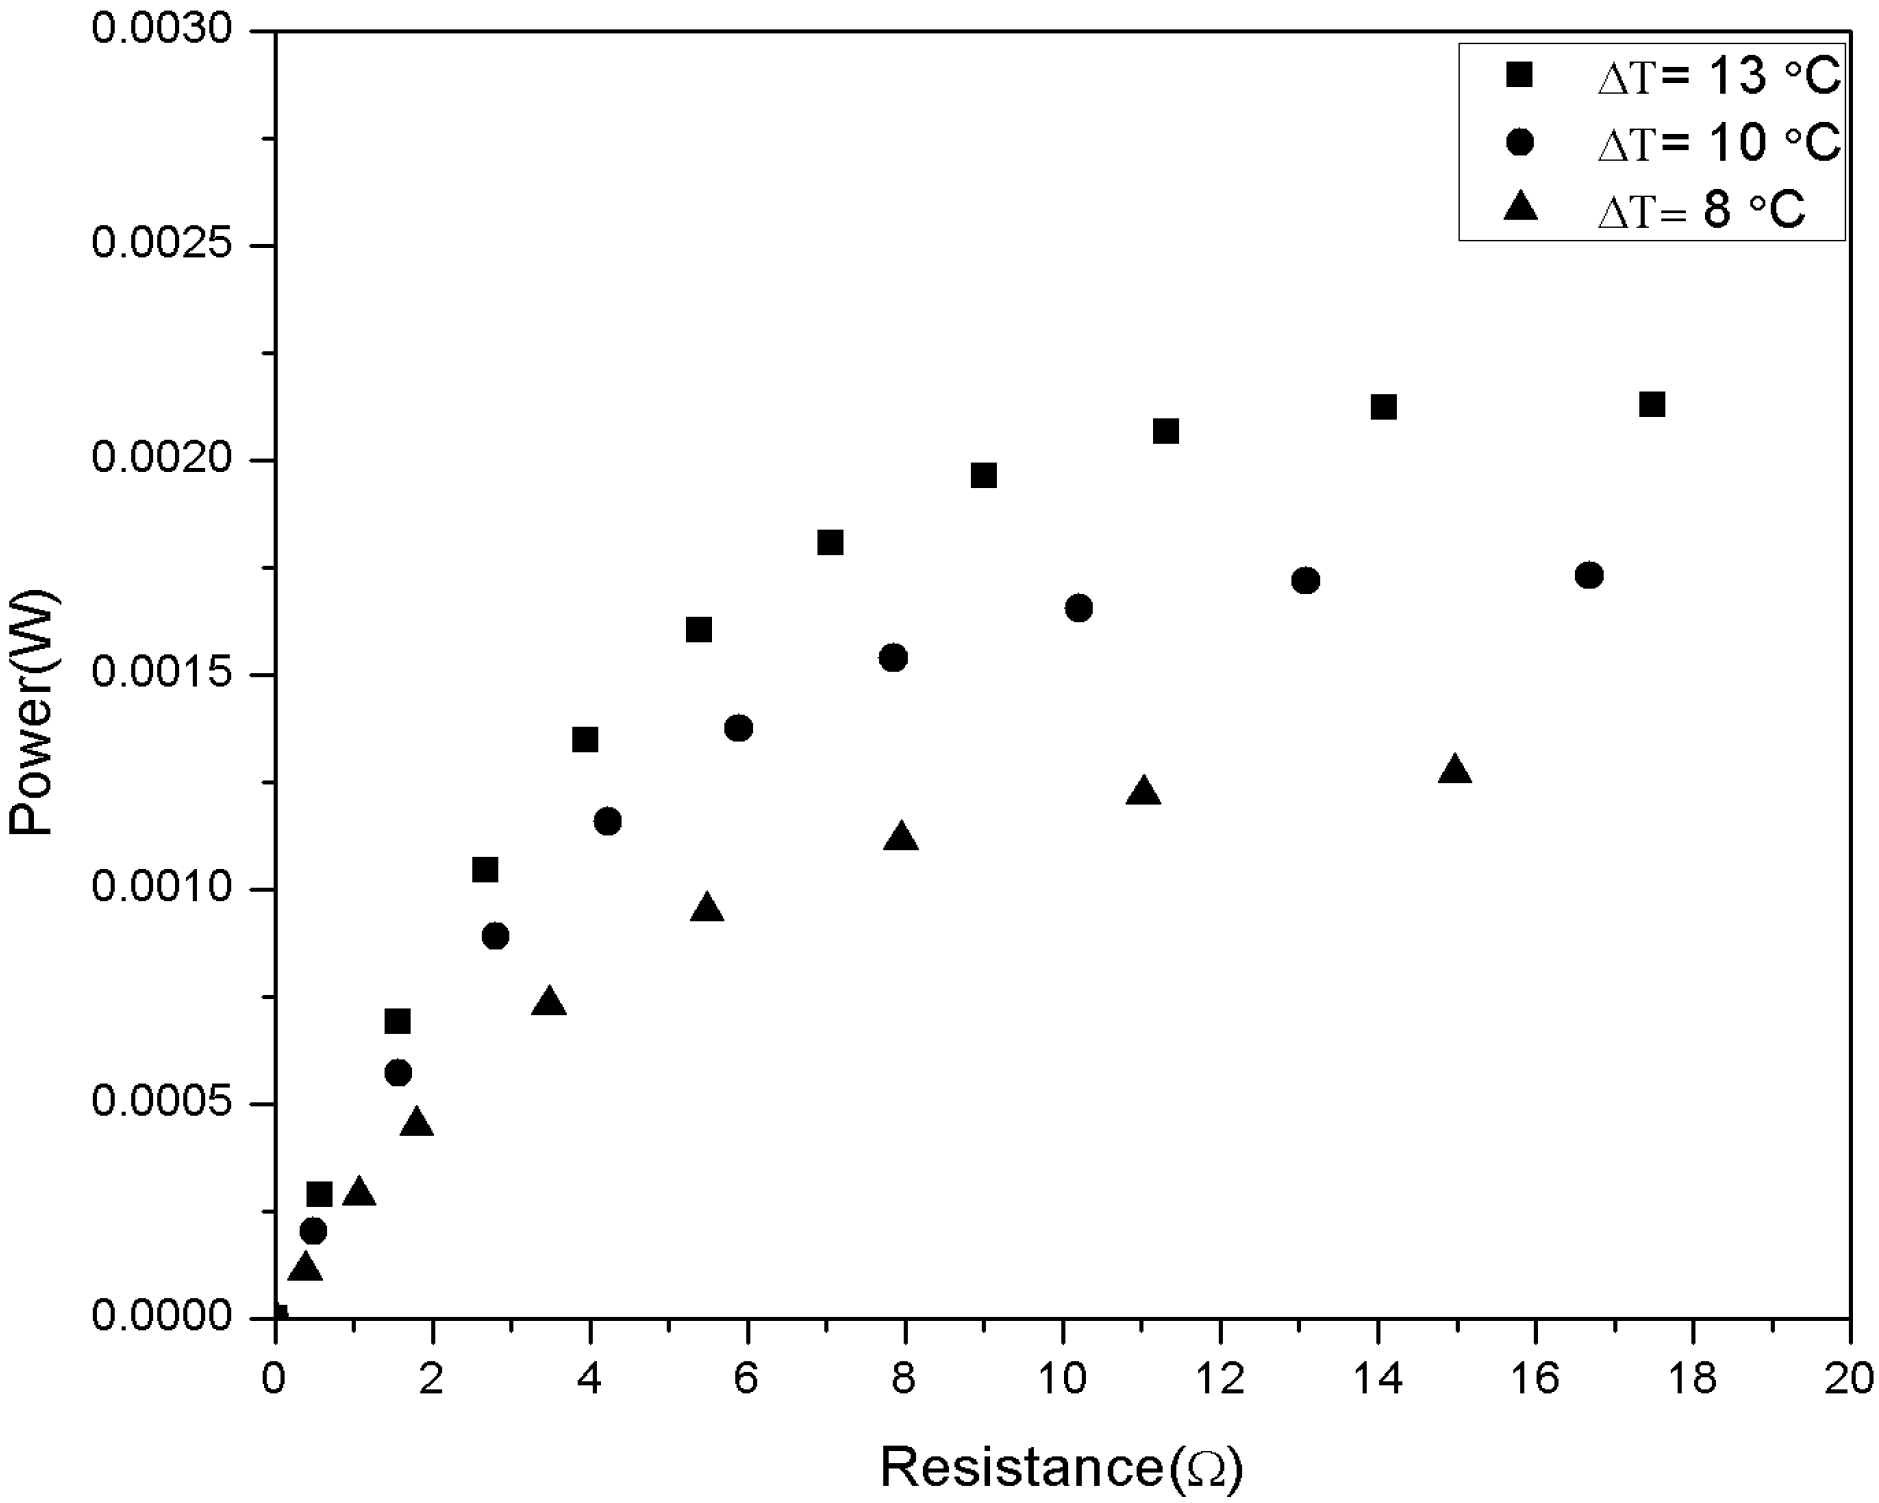
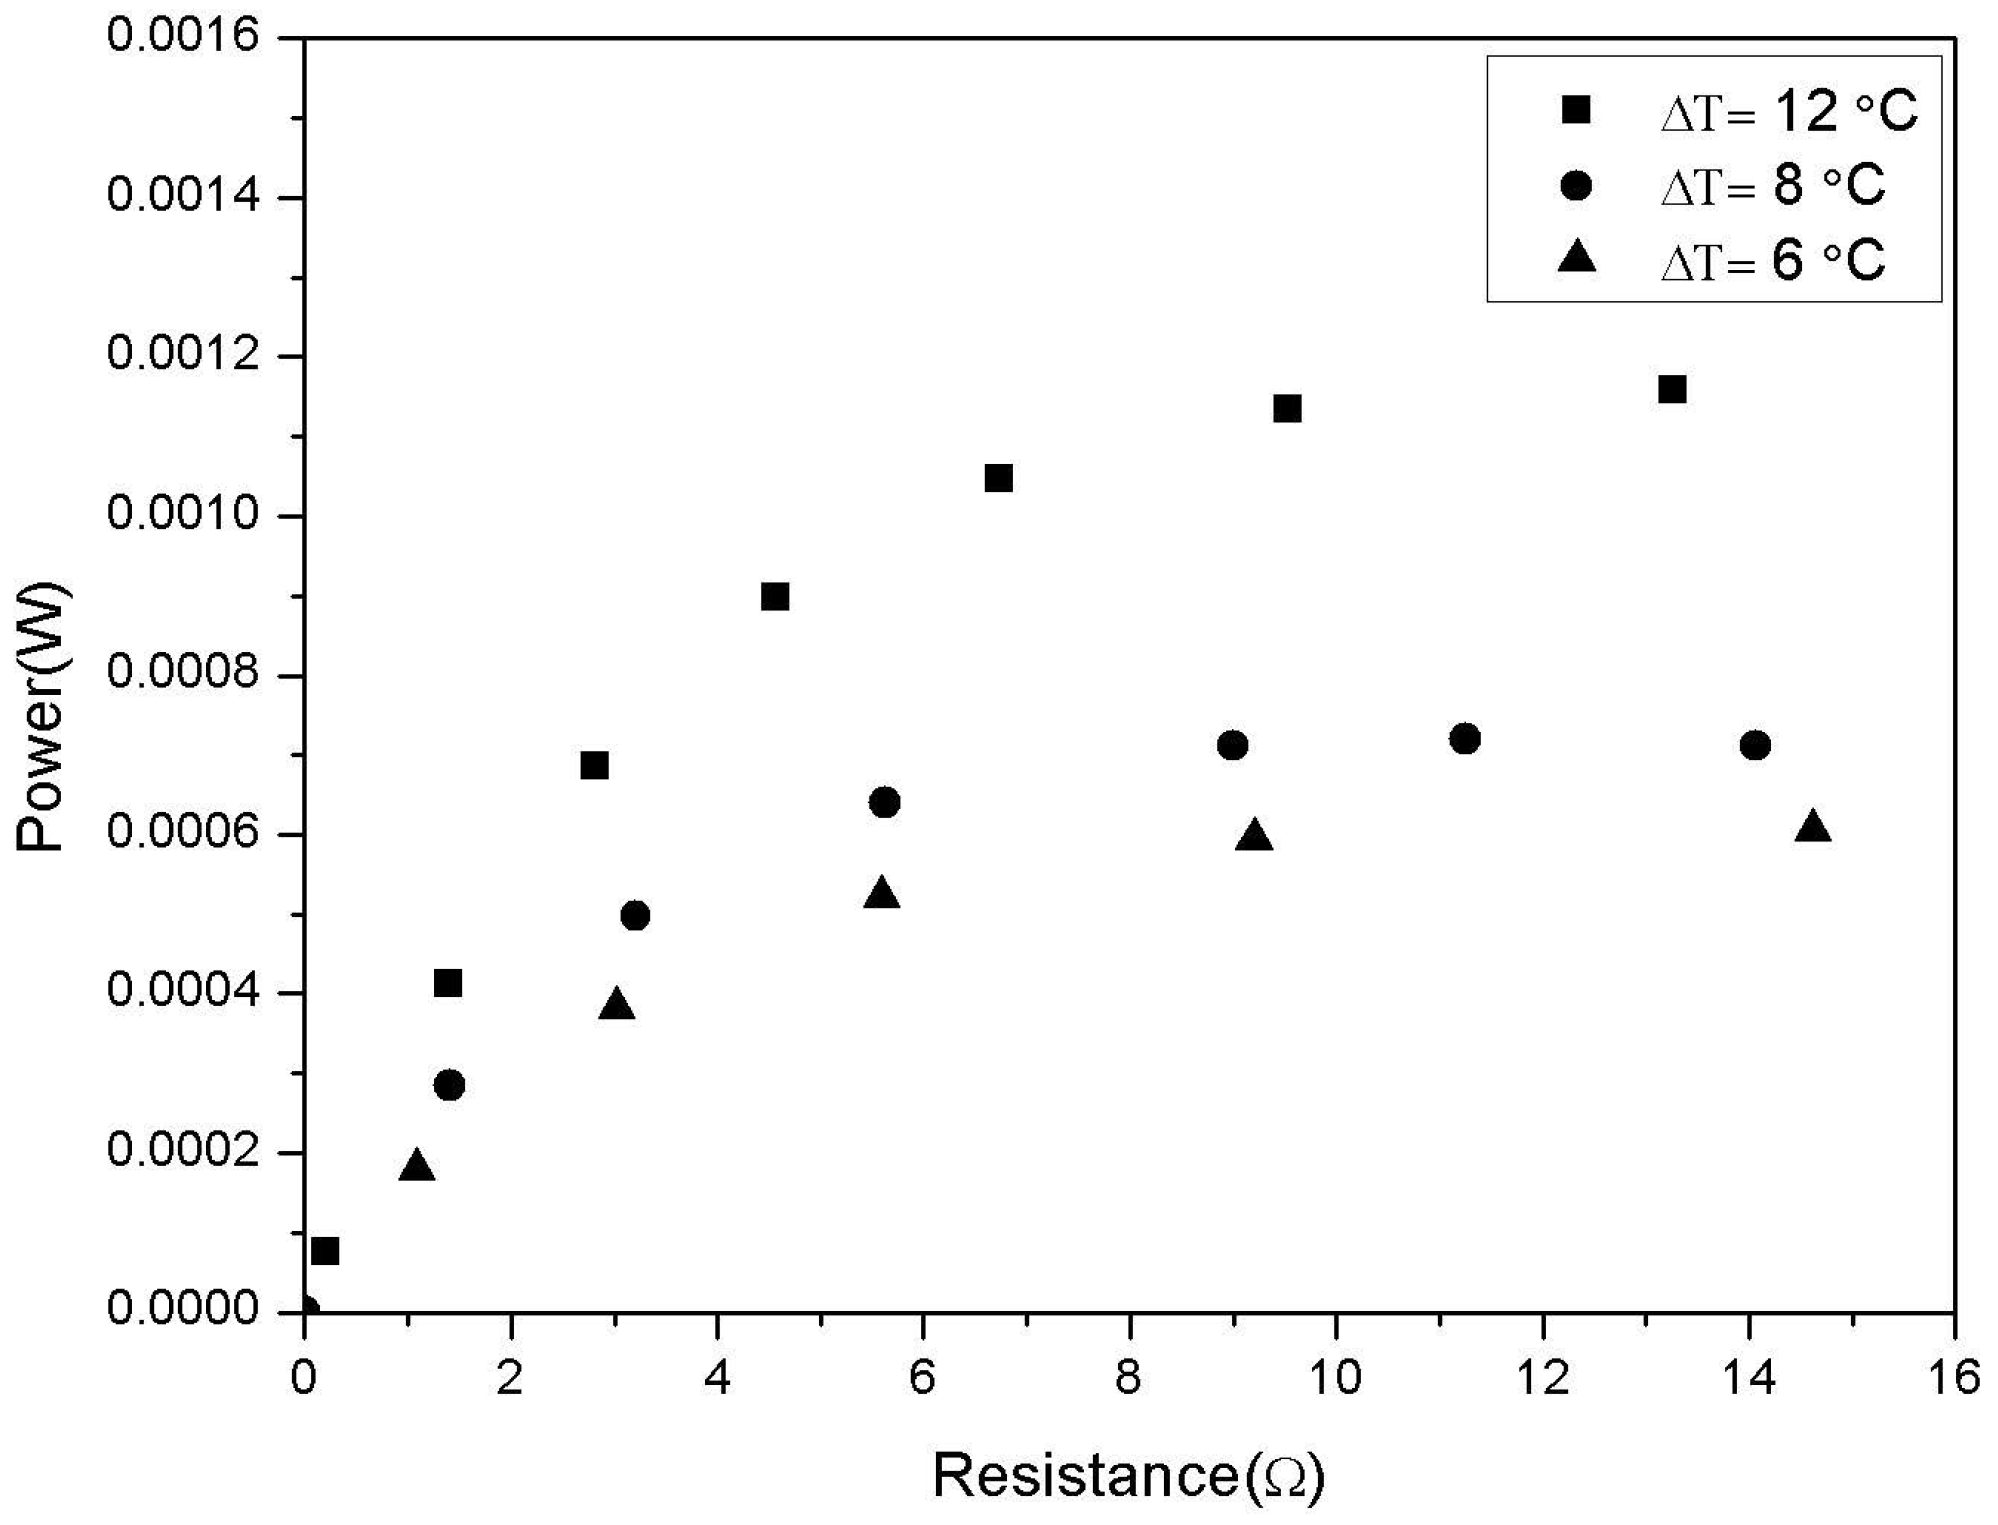
The power outputs of PV for December, February, and March were slightly varied, ranging between 15 W and 20 W. The variation was caused by factors such as partial shading and solar module temperature while running the experiment. Whereas the TEGs power output was profoundly affected by the weather conditions, with the lowest power output obtained in December, followed by February and March. Different connections of the TEGs in the hybrid system were investigated in this study. The findings showed that the best connection for high and consistent power output from the TEGs throughout the day was a series connection. The matched optimal load for the series was considerably higher than a parallel and series combination, with a range between 50 Ω and 60 Ω, which affected the power output when used in the colder month. Although night time power production was possible with series connections, it also raised some uncertainties when applying for long term usage. Thus, for practical reasons, a combination of parallel and series connections with higher TEG numbers in series is preferred, such as that done for the month of March.
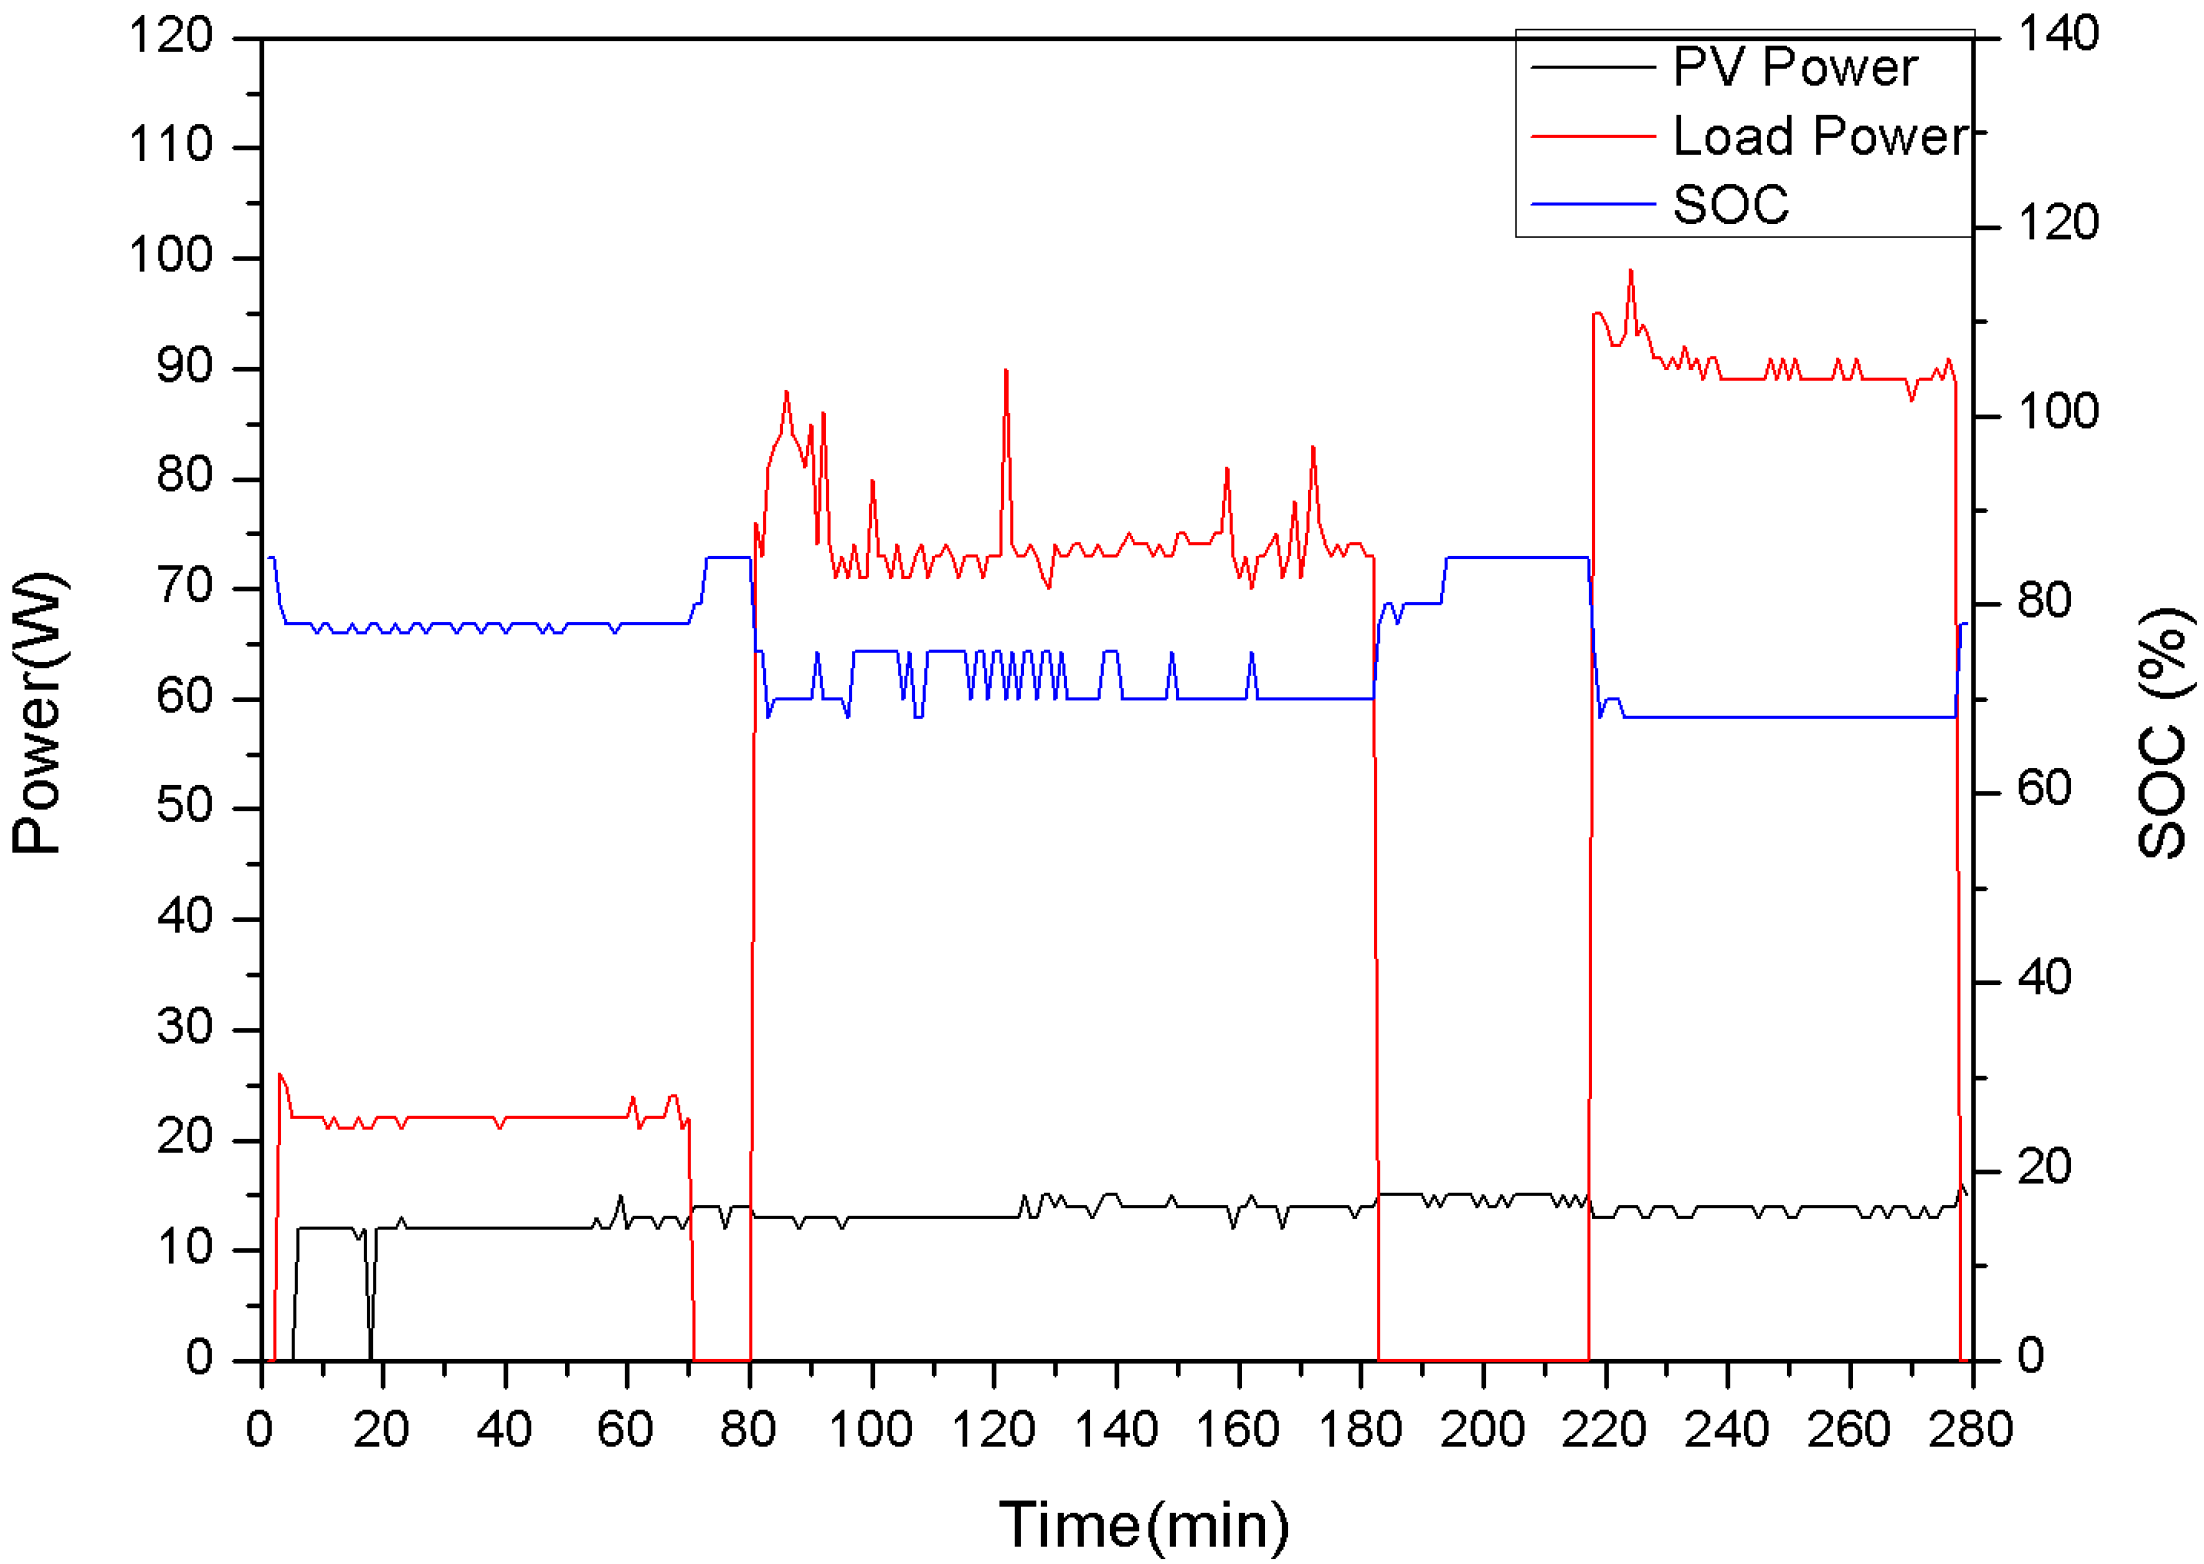
The hybrid system designed was able to successfully provide sufficient power output to the LED load for the months of December, February, and March. This study affirmed that the hybrid system main power output was from the PV panels, whereas additional power output produced from the TEGs was minor and incomparable to the PV output. Thus, the load was fully supported by the PV system instead of the hybrid system. The PV system was able to support not only the existing load, but also an additional load of a pump, despite it having a low power output of 15 W to 20 W in February and March. This suggests that a fully independent indoor farm relying on only renewable energy sources is possible with the hybrid system designed in Malaysia.
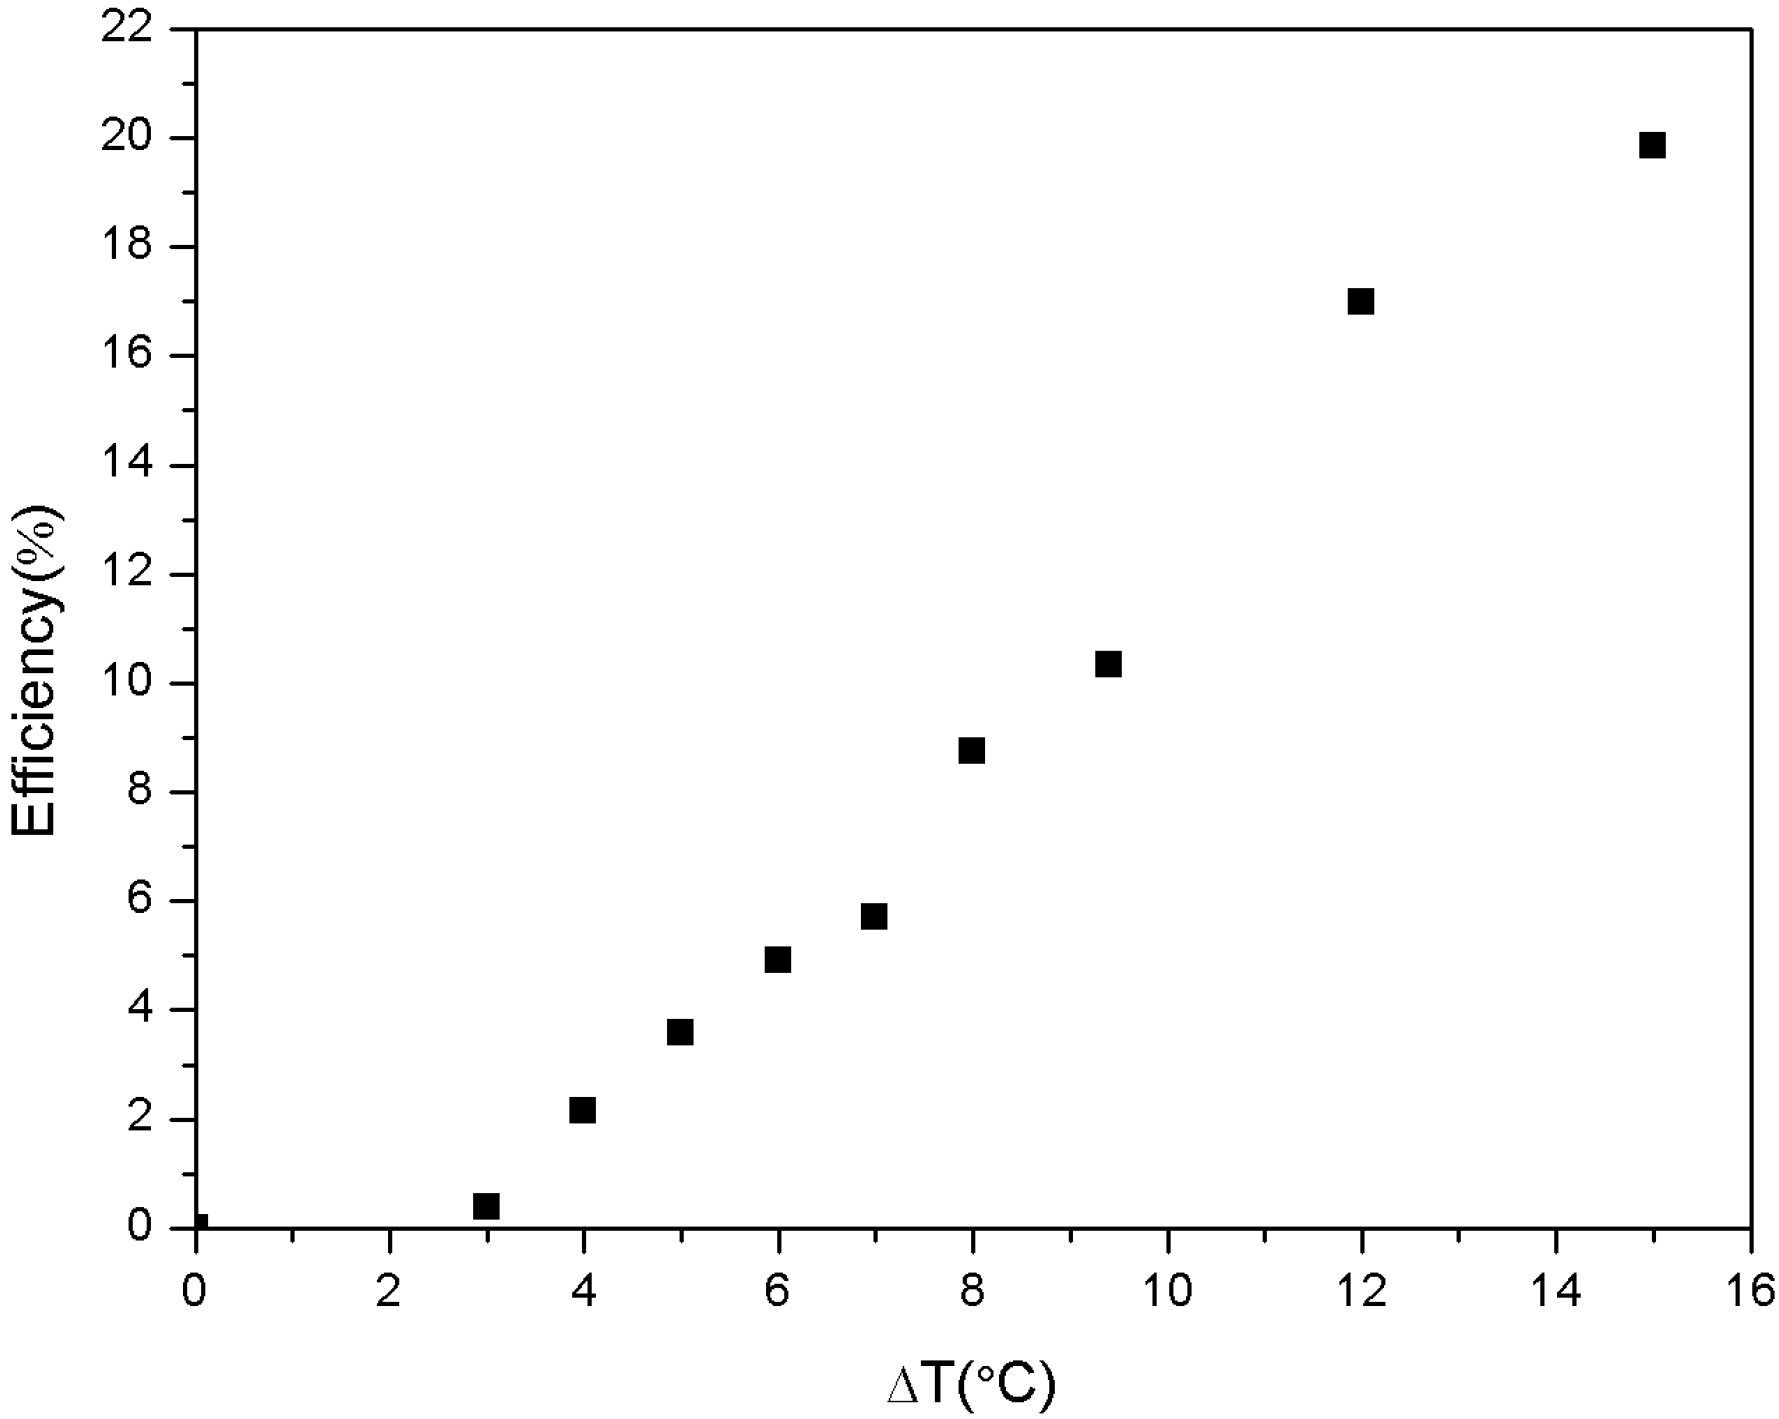
In the present result, the combination of PV-TEG has shown that the performance of the hybrid system was slightly improved when compared with a sole PV system. The hybrid system was found to have an increase in efficiency of 0.06%, as compared to stand alone PV. The hybrid system efficiency was also shown to be affected by TEG efficiency. A drop in efficiency by 1.68% was found when the hybrid system operated in cooler temperature, where the lowest TEG efficiency was obtained in the month of December. Regardless, this study showed the possibility of an improved hybrid system during favourable weather conditions, which were in hotter and less rainy months. Nonetheless, the hybrid system performance was better in a cooler month as compared to hotter months. Future work on improving the design of the PV-TEG system, such as by incorporating heat sinks, may provide a better outcome for the hybrid system.

Author Contributions

Conceptualization, N.M.S. and M.A.A.R.; Data curation, N.M.S. and S.A.Z.S.S.; Formal analysis, N.M.S., M.A.A.R., M.N.M., and B.S.; Funding acquisition, M.A.A.R., F.M.-S., A.S.M.S., and J.A.A.-R.; Investigation, N.M.S.; Methodology, N.M.S.; Project administration, M.A.A.R.; Resources, S.A.Z.S.S. and B.S.; Software, S.A.Z.S.S. and B.S.; Supervision, M.A.A.R., M.N.M., and B.S.; Validation, M.A.A.R. and M.N.M.; Visualization, N.M.S.; Writing—original draft, N.M.S.; Writing—review & editing, N.M.S., M.A.A.R., M.N.M., S.A.Z.S.S., B.S., F.M.-S., N.A.B., A.S.M.S., and J.A.A.-R.

Funding

The work presented in this research study is funded by the Ministry of Education and Universiti Teknologi Malaysia under research university grant VOTE NO: 19H94, the Chilean Research Council (CONICYT), under the project Fondecyt 11160115 and the project PI_m_19_01, and Universiti Kuala Lumpur under the Short Term Research Grant (STRG) STR18022.

Conflicts of Interest

The authors declare no conflict of interest. The funders had no role in the design of the study; in the collection, analyses, or interpretation of data; in the writing of the manuscript, or in the decision to publish the results.

References

  1. Masud, M.M.; Azam, M.N.; Mohiuddin, M.; Banna, H.; Akhtar, R.; Alam, A.S.A.F.; Begum, H. Adaptation barriers and strategies towards climate change: Challenges in the agricultural sector. J. Clean. Prod. 2017, 156, 698–706. [Google Scholar] [CrossRef]
  2. Benis, K.; Turan, I.; Reinhart, C.; Ferrão, P. Putting rooftops to use—A Cost-Benefit Analysis of food production vs. energy generation under Mediterranean climates. Cities 2018, 78, 166–179. [Google Scholar] [CrossRef]
  3. Montero, J.I.; Baeza, E.; Heuvelink, E.; Rieradevall, J.; Muñoz, P.; Ercilla, M. Productivity of a building-integrated roof top greenhouse in a Mediterranean climate. Agric. Syst. 2017, 158, 14–22. [Google Scholar] [CrossRef]
  4. Kalantari, F.; Tahir, O.M.; Lahijani, A.M.; Kalantari, S. A review of vertical farming technology: A guide for implementation of building integrated agriculture in cities. Adv. Eng. Forum 2017, 24, 76–91. [Google Scholar] [CrossRef]
  5. International Energy Agency. Statistics: Electricity Generation by Source, World 1990–2017. Available online: https://www.iea.org/statistics/ (accessed on 4 October 2019).
  6. Ong, H.C.; Mahlia, T.M.I.; Masjuki, H.H. A review on energy scenario and sustainable energy in Malaysia. Renew. Sustain. Energy Rev. 2011, 15, 639–647. [Google Scholar] [CrossRef]
  7. REN21. Renewables 2018 Global Status Report; Secretariat REN21: Paris, France, 2018; ISBN 978-3-9818911-3-3. [Google Scholar]
  8. Othman, N.F.; Ya, M.E.; Abdul-rahim, A.S.; Shahwahid, M.; Radzi, M.A.M.; Hizam, H.; Wang, Y.D.; Ya, A.M.; Jaafar, H.Z.E. Embracing new agriculture commodity through integration of Java Tea as high Value Herbal crops in solar PV farms. J. Clean. Prod. 2015, 91, 71–77. [Google Scholar] [CrossRef]
  9. Yano, A.; Kadowaki, M.; Furue, A.; Tamaki, N.; Tanaka, T.; Hiraki, E.; Kato, Y.; Ishizu, F.; Noda, S. Shading and electrical features of a photovoltaic array mounted inside the roof of an east-west oriented greenhouse. Biosyst. Eng. 2010, 106, 367–377. [Google Scholar] [CrossRef]
  10. Cossu, M.; Cossu, A.; Deligios, P.A.; Ledda, L.; Li, Z.; Fatnassi, H.; Poncet, C.; Yano, A. Assessment and comparison of the solar radiation distribution inside the main commercial photovoltaic greenhouse types in Europe. Renew. Sustain. Energy Rev. 2018, 94, 822–834. [Google Scholar] [CrossRef]
  11. Amaducci, S.; Yin, X.; Colauzzi, M. Agrivoltaic systems to optimise land use for electric energy production. Appl. Energy 2018, 220, 545–561. [Google Scholar] [CrossRef]
  12. Trypanagnostopoulos, G.; Kavga, A.; Souliotis, M.; Tripanagnostopoulos, Y. Greenhouse performance results for roof installed photovoltaics. Renew. Energy 2017, 111, 724–731. [Google Scholar] [CrossRef]
  13. Cuce, E.; Harjunowibowo, D.; Cuce, P.M. Renewable and sustainable energy saving strategies for greenhouse systems: A comprehensive review. Renew. Sustain. Energy Rev. 2016, 64, 34–59. [Google Scholar] [CrossRef]
  14. Zhou, J.; Zhang, Z.; Liu, H.; Yi, Q. Temperature distribution and back sheet role of polycrystalline silicon photovoltaic modules. Appl. Therm. Eng. 2017, 111, 1296–1303. [Google Scholar] [CrossRef]
  15. Mun, K.; Nor, N.; Adam, M. Assessment of solar radiation on diversely oriented surfaces and optimum tilts for solar absorbers in Malaysian tropical latitude. Int. J. Energy Environ. 2014, 5, 5. [Google Scholar] [Green Version]
  16. van Sark, W.G.J.H.M. Feasibility of photovoltaic—Thermoelectric hybrid modules. Appl. Energy 2011, 88, 2785–2790. [Google Scholar] [CrossRef]
  17. Cha’vez-Urbiola, E.A.; Vorobiev, Y.V.; Bulat, L.P. Solar hybrid systems with thermoelectric generators. Sol. Energy 2012, 86, 369–378. [Google Scholar] [CrossRef]
  18. Park, K.; Shin, S.; Tazebay, A.S.; Um, H.; Jung, J.; Jee, S.W.; Oh, M.W.; Park, S.D.; Yoo, B.; Yu, C.; et al. Photovoltaic and thermoelectric devices. Sci. Rep. 2013, 3, 1–6. [Google Scholar] [CrossRef]
  19. Bjørk, R.; Nielsen, K.K. The maximum theoretical performance of unconcentrated solar photovoltaic and thermoelectric generator systems. Energy Convers. Manag. 2018, 156, 264–268. [Google Scholar] [CrossRef] [Green Version]
  20. Zhang, J.; Xuan, Y. An integrated design of the photovoltaic-thermoelectric hybrid system. Sol. Energy 2019, 177, 293–298. [Google Scholar] [CrossRef]
  21. Kossyvakis, D.N.; Voutsinas, G.D.; Hristoforou, E.V. Experimental analysis and performance evaluation of a tandem photovoltaic—Thermoelectric hybrid system. Energy Convers. Manag. 2016, 117, 490–500. [Google Scholar] [CrossRef]
  22. Bjørk, R.; Nielsen, K.K. The performance of a combined solar photovoltaic (PV) and thermoelectric generator (TEG) system. Sol. Energy 2015, 120, 187–194. [Google Scholar] [CrossRef] [Green Version]
  23. Rezania, A.; Sera, D.; Rosendahl, L.A. Coupled thermal model of photovoltaic-thermoelectric hybrid panel for sample cities in Europe. Renew. Energy 2016, 99, 127–135. [Google Scholar] [CrossRef]
  24. Yin, E.; Li, Q.; Xuan, Y. One-day performance evaluation of photovoltaic-thermoelectric hybrid system. Energy 2018, 143, 337–346. [Google Scholar] [CrossRef]
  25. Yeh, N.; Chung, J. High-brightness LEDs—Energy efficient lighting sources and their potential in indoor plant cultivation. Renew. Sustain. Energy Rev. 2009, 13, 2175–2180. [Google Scholar] [CrossRef]
  26. Al-chalabi, M. Vertical farming: Skyscraper sustainability? Sustain. Cities Soc. 2015, 18, 74–77. [Google Scholar] [CrossRef]
  27. Shatar, N.M.; Rahman, M.A.A.; Shaikh, S.A.Z.S.; Ariff, M.H.M.; Badlisah, A.K.A. Design of photovoltaic-thermoelectric generator (PV-TE) hybrid system for precision agriculture. In Proceedings of the IEEE 7th International Conference on Power and Energy, Kuala Lumpur, Malaysia, 3–4 December 2018; pp. 50–55. [Google Scholar]
  28. Humada, A.M.; Hojabri, M.; Hamada, H.M.; Samsuri, F.B.; Ahmed, M.N. Performance evaluation of two PV technologies (c-Si and CIS) for building integrated photovoltaic based on tropical climate condition:A case study in Malaysia. Energy Build. 2016, 119, 233–241. [Google Scholar] [CrossRef]
  29. Khatri, R. Design and assessment of solar PV plant for girls hostel (GARGI) of MNIT University, Jaipur city: A case study. Energy Rep. 2016, 2, 89–98. [Google Scholar] [CrossRef] [Green Version]
  30. Li, G.; Zhou, K.; Song, Z.; Zhao, X.; Ji, J. Inconsistent phenomenon of thermoelectric load resistance for photovoltaic—Thermoelectric module. Energy Convers. Manag. 2018, 161, 155–161. [Google Scholar] [CrossRef]
  31. Cózar, I.; Pujol, T.; Lehocky, M. Numerical analysis of the effects of electrical and thermal configurations of thermoelectric modules in large-scale thermoelectric generators. Appl. Energy 2018, 229, 264–280. [Google Scholar] [CrossRef]
  32. Mohsenzadeh, M.; Shafii, M.B.; Jafari mosleh, H. A novel concentrating photovoltaic / thermal solar system combined with thermoelectric module in an integrated design. Renew. Energy 2017, 113, 822–834. [Google Scholar] [CrossRef]
  33. Haiping, C.; Jiguang, H.; Heng, Z.; Kai, L.; Haowen, L.; Shuangyin, L. Experimental investigation of a novel low concentrating photovoltaic/thermal-thermoelectric generator hybrid system. Energy 2019, 166, 83–95. [Google Scholar] [CrossRef]
  34. Lan, Y.; Minnich, A.J.; Chen, G.; Ren, Z. Enhancement of thermoelectric figure-of-merit by a bulk nanostructuring approach. Adv. Funct. Mater. 2010, 20, 357–376. [Google Scholar] [CrossRef]
Figure 1. Light emitting diode (LED) arrangement in the crop cultivation area [27].
Sustainability 11 06192 g001
Figure 2. Complete experimental setup of the hybrid system.
Sustainability 11 06192 g002
Figure 3. The front view of the photovoltaic (PV) panel arrangement at the G3 building in UTM, KL.
Sustainability 11 06192 g003
Figure 4. The side view of the PV panel arrangement at the G3 building in UTM, KL.
Sustainability 11 06192 g004
Figure 5. Batteries, LED load, and solar charge controller placed inside the G3 building in UTM, KL.
Sustainability 11 06192 g005
Figure 6. Back view of PV panel with TEG attached.
Sustainability 11 06192 g006
Figure 7. Three different TEG configurations. (a) All in series, (b) Six in series, two groups in parallel, (c) Four in series, three groups in parallel.
Sustainability 11 06192 g007
Figure 8. PV power output and battery state of charge (SOC) with ongoing load in December.
Sustainability 11 06192 g008
Figure 9. PV power output and battery SOC with ongoing load in February.
Sustainability 11 06192 g009
Figure 10. PV power output and battery SOC with ongoing load in March.
Sustainability 11 06192 g010
Figure 11. PV battery system performance with added load.
Sustainability 11 06192 g011
Figure 12. Temperature of PV panel (Th) and ambient temperature (Tc) in December.
Sustainability 11 06192 g012
Figure 13. Temperature of PV panel (Th) and ambient temperature (Tc) in February.
Sustainability 11 06192 g013
Figure 14. Temperature of PV panel (Th) and ambient temperature (Tc) in March.
Sustainability 11 06192 g014
Figure 15. Temperature difference (ΔT) for all three months.
Sustainability 11 06192 g015
Figure 16. Power output of TEGs in December.
Sustainability 11 06192 g016
Figure 17. Power output of TEGs in February.
Sustainability 11 06192 g017
Figure 18. Power output of TEGs in March.
Sustainability 11 06192 g018
Figure 19. TEG power output for TEG connections shown in Figure 7a under increasing resistance.
Sustainability 11 06192 g019
Figure 20. TEG power output for TEG connections shown in Figure 7b under increasing resistance.
Sustainability 11 06192 g020
Figure 21. TEG power output for TEG connections shown in Figure 7c under increasing resistance.
Sustainability 11 06192 g021
Figure 22. Changes in efficiency with increasing temperature difference for a single Bi2Te3TEG.
Sustainability 11 06192 g022
Table 1. LED load requirement.
Load RequirementValue
Length of LED (m)4.2
Power (W/m)14.4
Operation hours (hr)18
Safety factor1.3
Total energy required, ET (Whr)1415.23
Table 2. Photovoltaic (PV) panel specification.
Solar PV Module ModelADL100–12V
Maximum power at standard testing condition (Wp)100 W
Optimum operating voltage (Vmp)18 V
Optimum operating current (Imp)5.4 A
Open circuit voltage (Voc)22.45 V
Short circuit current (Isc)5.99 A
Dimension (mm)1200 × 540 × 30
Table 3. Battery specification.
Battery ModelPGEL-100–12
Battery TypeLead Acid
Nominal voltage (Vnom)12 V
Nominal capacity (Cnom)100 Ah
Battery efficiency (η)85%
Depth of Discharge (DOD)0.4
Table 4. Thermoelectric generator (TEG) specification.
TEG ModelSP1848–27145
TEG TypeBismuth Telluride (Bi2Te3)
Wire length (mm)300
Open circuit voltage (V)0.97 (at ∆T = 20 K)
Short circuit current (mA) 225 (at ∆T = 20 K)
Dimension (mm)40 × 40 × 3.4
Table 5. Hybrid system sizing based on the load requirement.
ItemCapacity (Per Item)Quantity
Solar panel100 W, 12 V4
Battery100 Ah, 12 V3
TEG-12
Solar charge controller30 A1
Table 6. Weather conditions in the data collection month.
MonthTemperature RangePrecipitation
December 201824 °C–32 °C160.9 mm
February 201924 °C–33 °C116.9 mm
March 201924 °C–33 °C138.0 mm
Table 7. Thermocouple specification.
Thermocouple TypeK Type
Temperature range−10 °C to +105 °C
Core number2
Length10 m
Insulation typeUnscreened PVC sheath
Table 8. Average efficiency of PV-TEG hybrid system.
MonthPV Stand AloneTEGPV-TEG System
December 201812.49%1.86%10.81%
February 20197.66%4.44%7.72%
March 20198.61%4.92%8.68%

