Development of a Carbon Emissions Analysis Framework Using Building Information Modeling and Life Cycle Assessment for the Construction of Hospital Projects

 , , , and
Abstract
:1. Introduction
2. Literature Review
2.1. LCA in the Building Sector
2.2. Applying LCA to BLCCE
2.3. Integration of LCA and BIM in BLCCE
2.4. Factors Related to BLCCE
2.5. Research Gaps
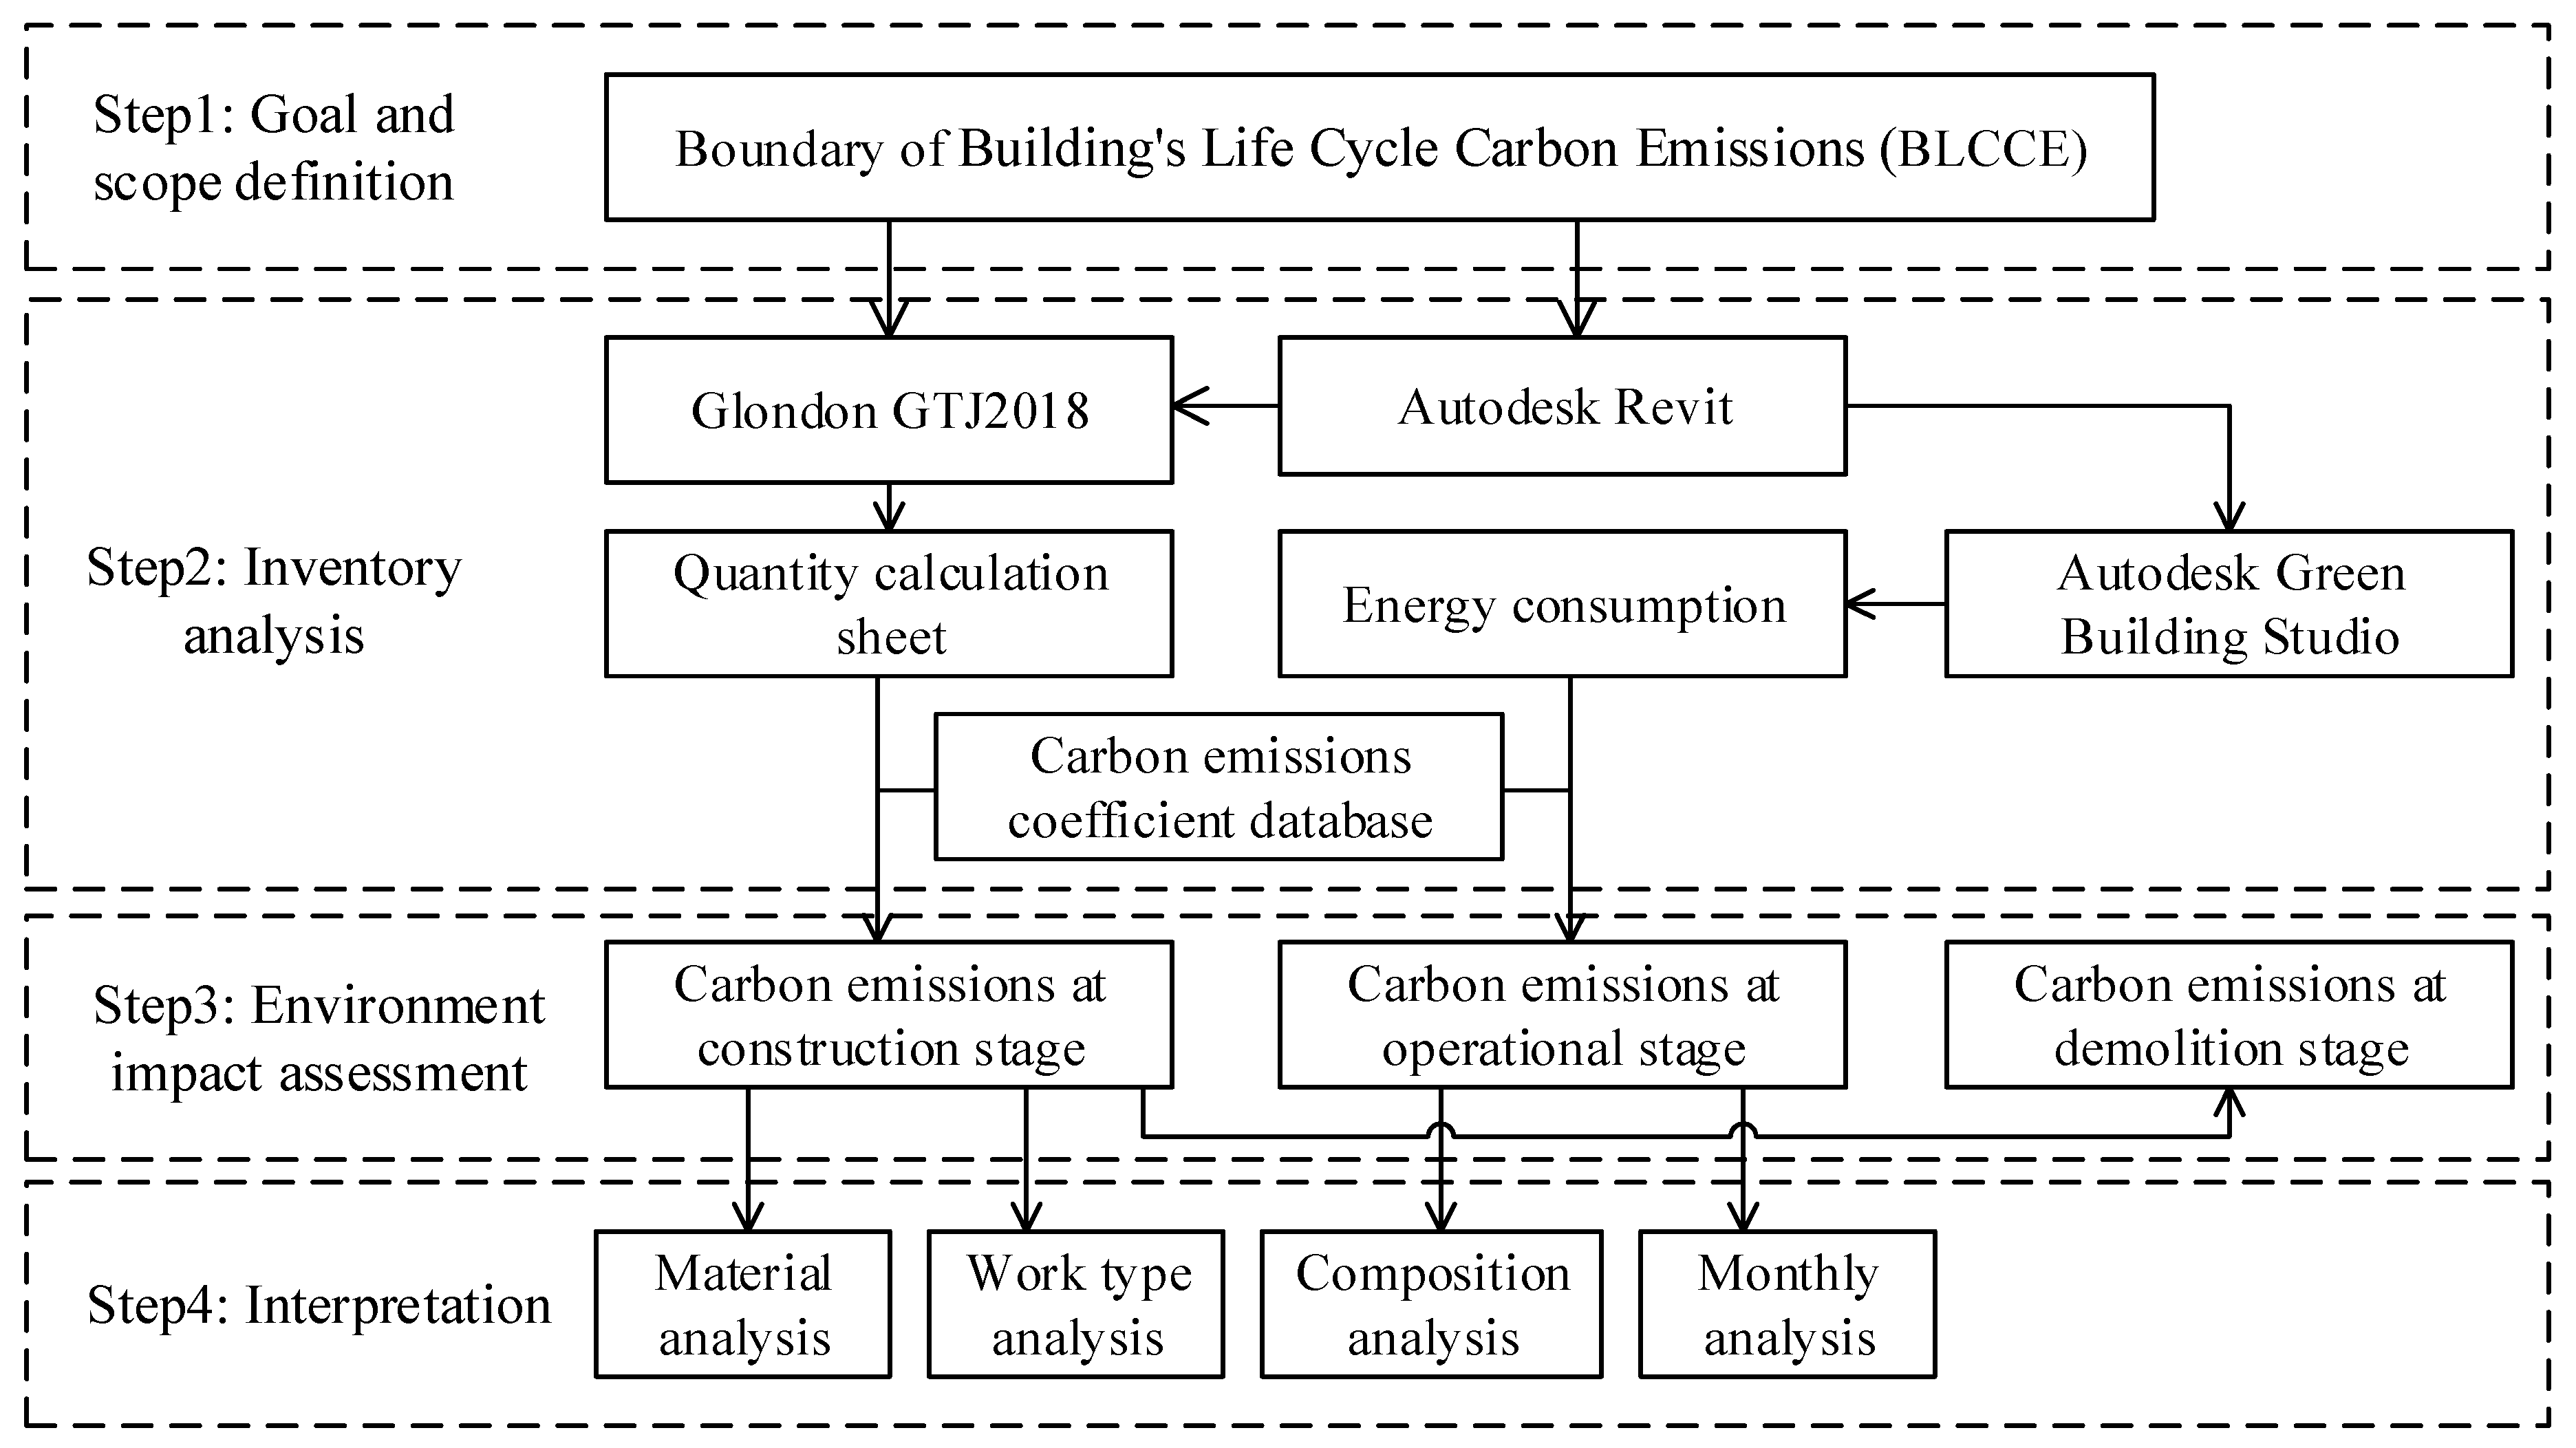
3. Methodologies
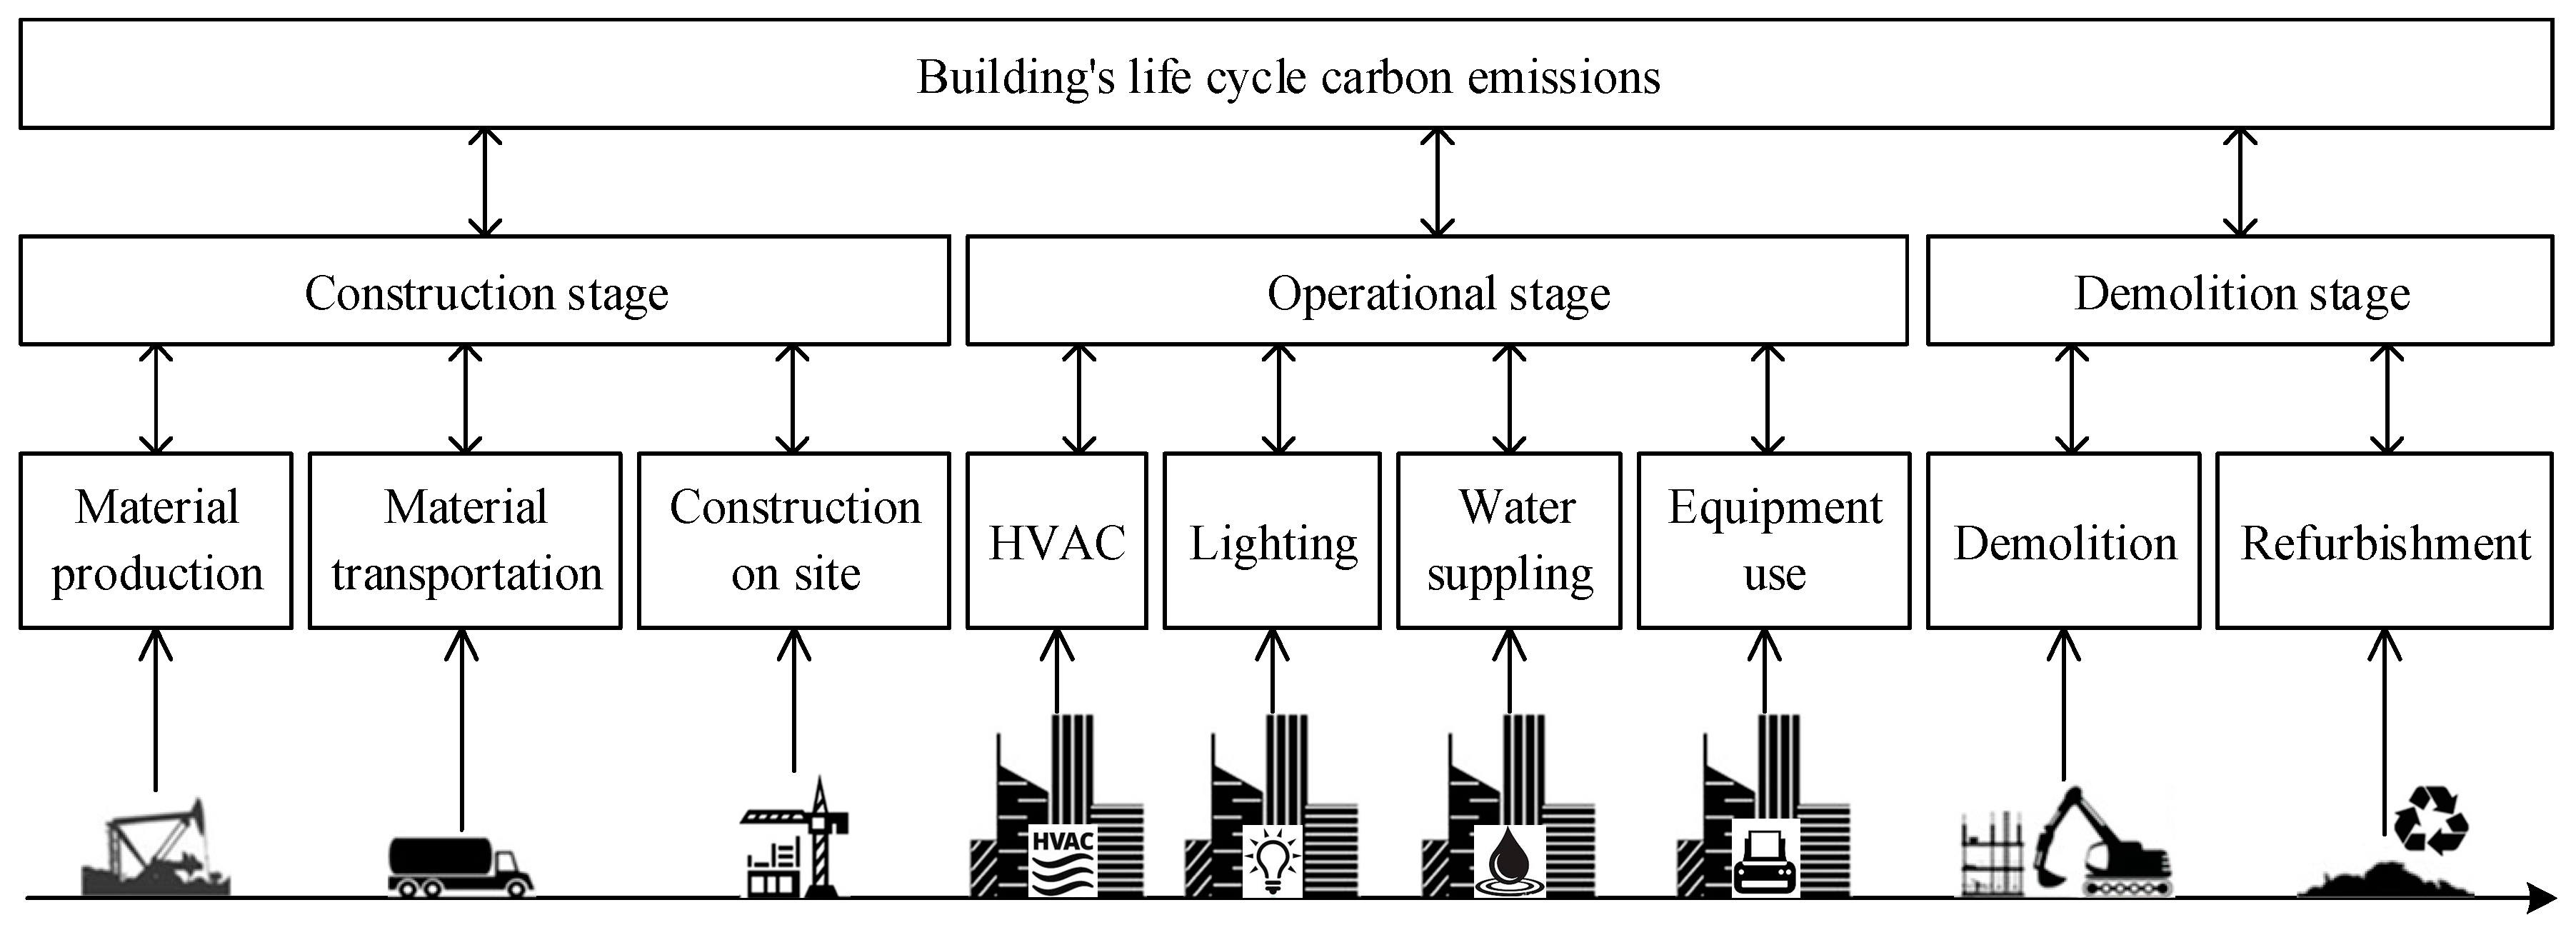
3.1. Goal and Scope Definition
3.2. Inventory Analysis
3.3. Environment Impact Assessment
3.4. Interpretation
4. Case Study
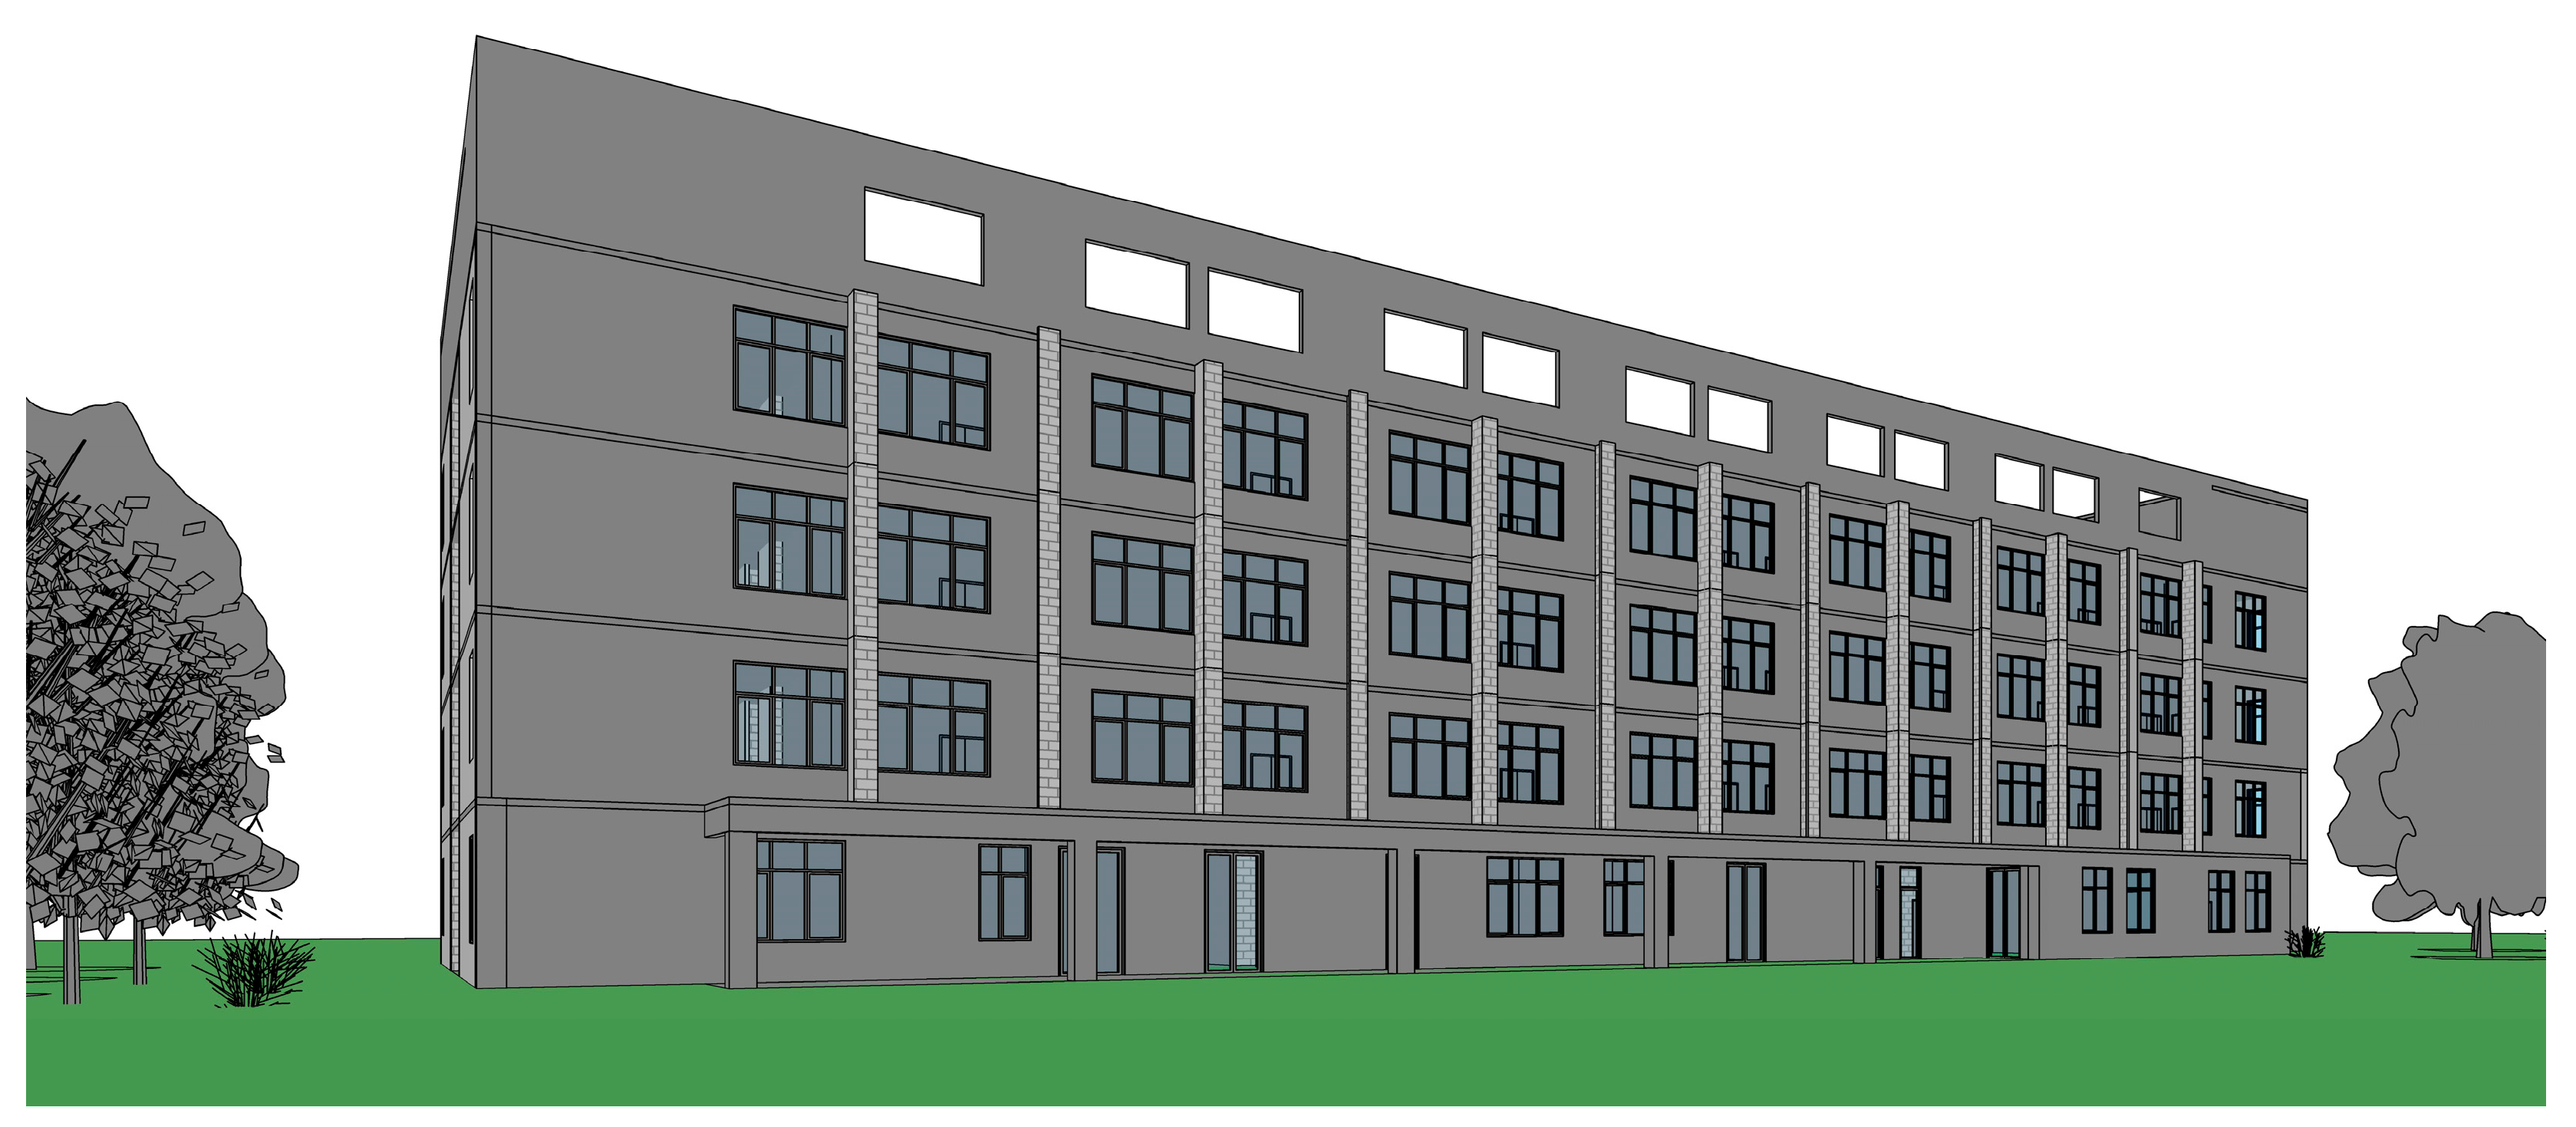
4.1. Background Information of the Hospital Building
4.2. Calculation Result of Carbon Emissions
4.3. Carbon Emissions Analysis of Construction Materials at the Construction Stage
4.4. Carbon Emissions Analysis of Work Type at the Construction Stage
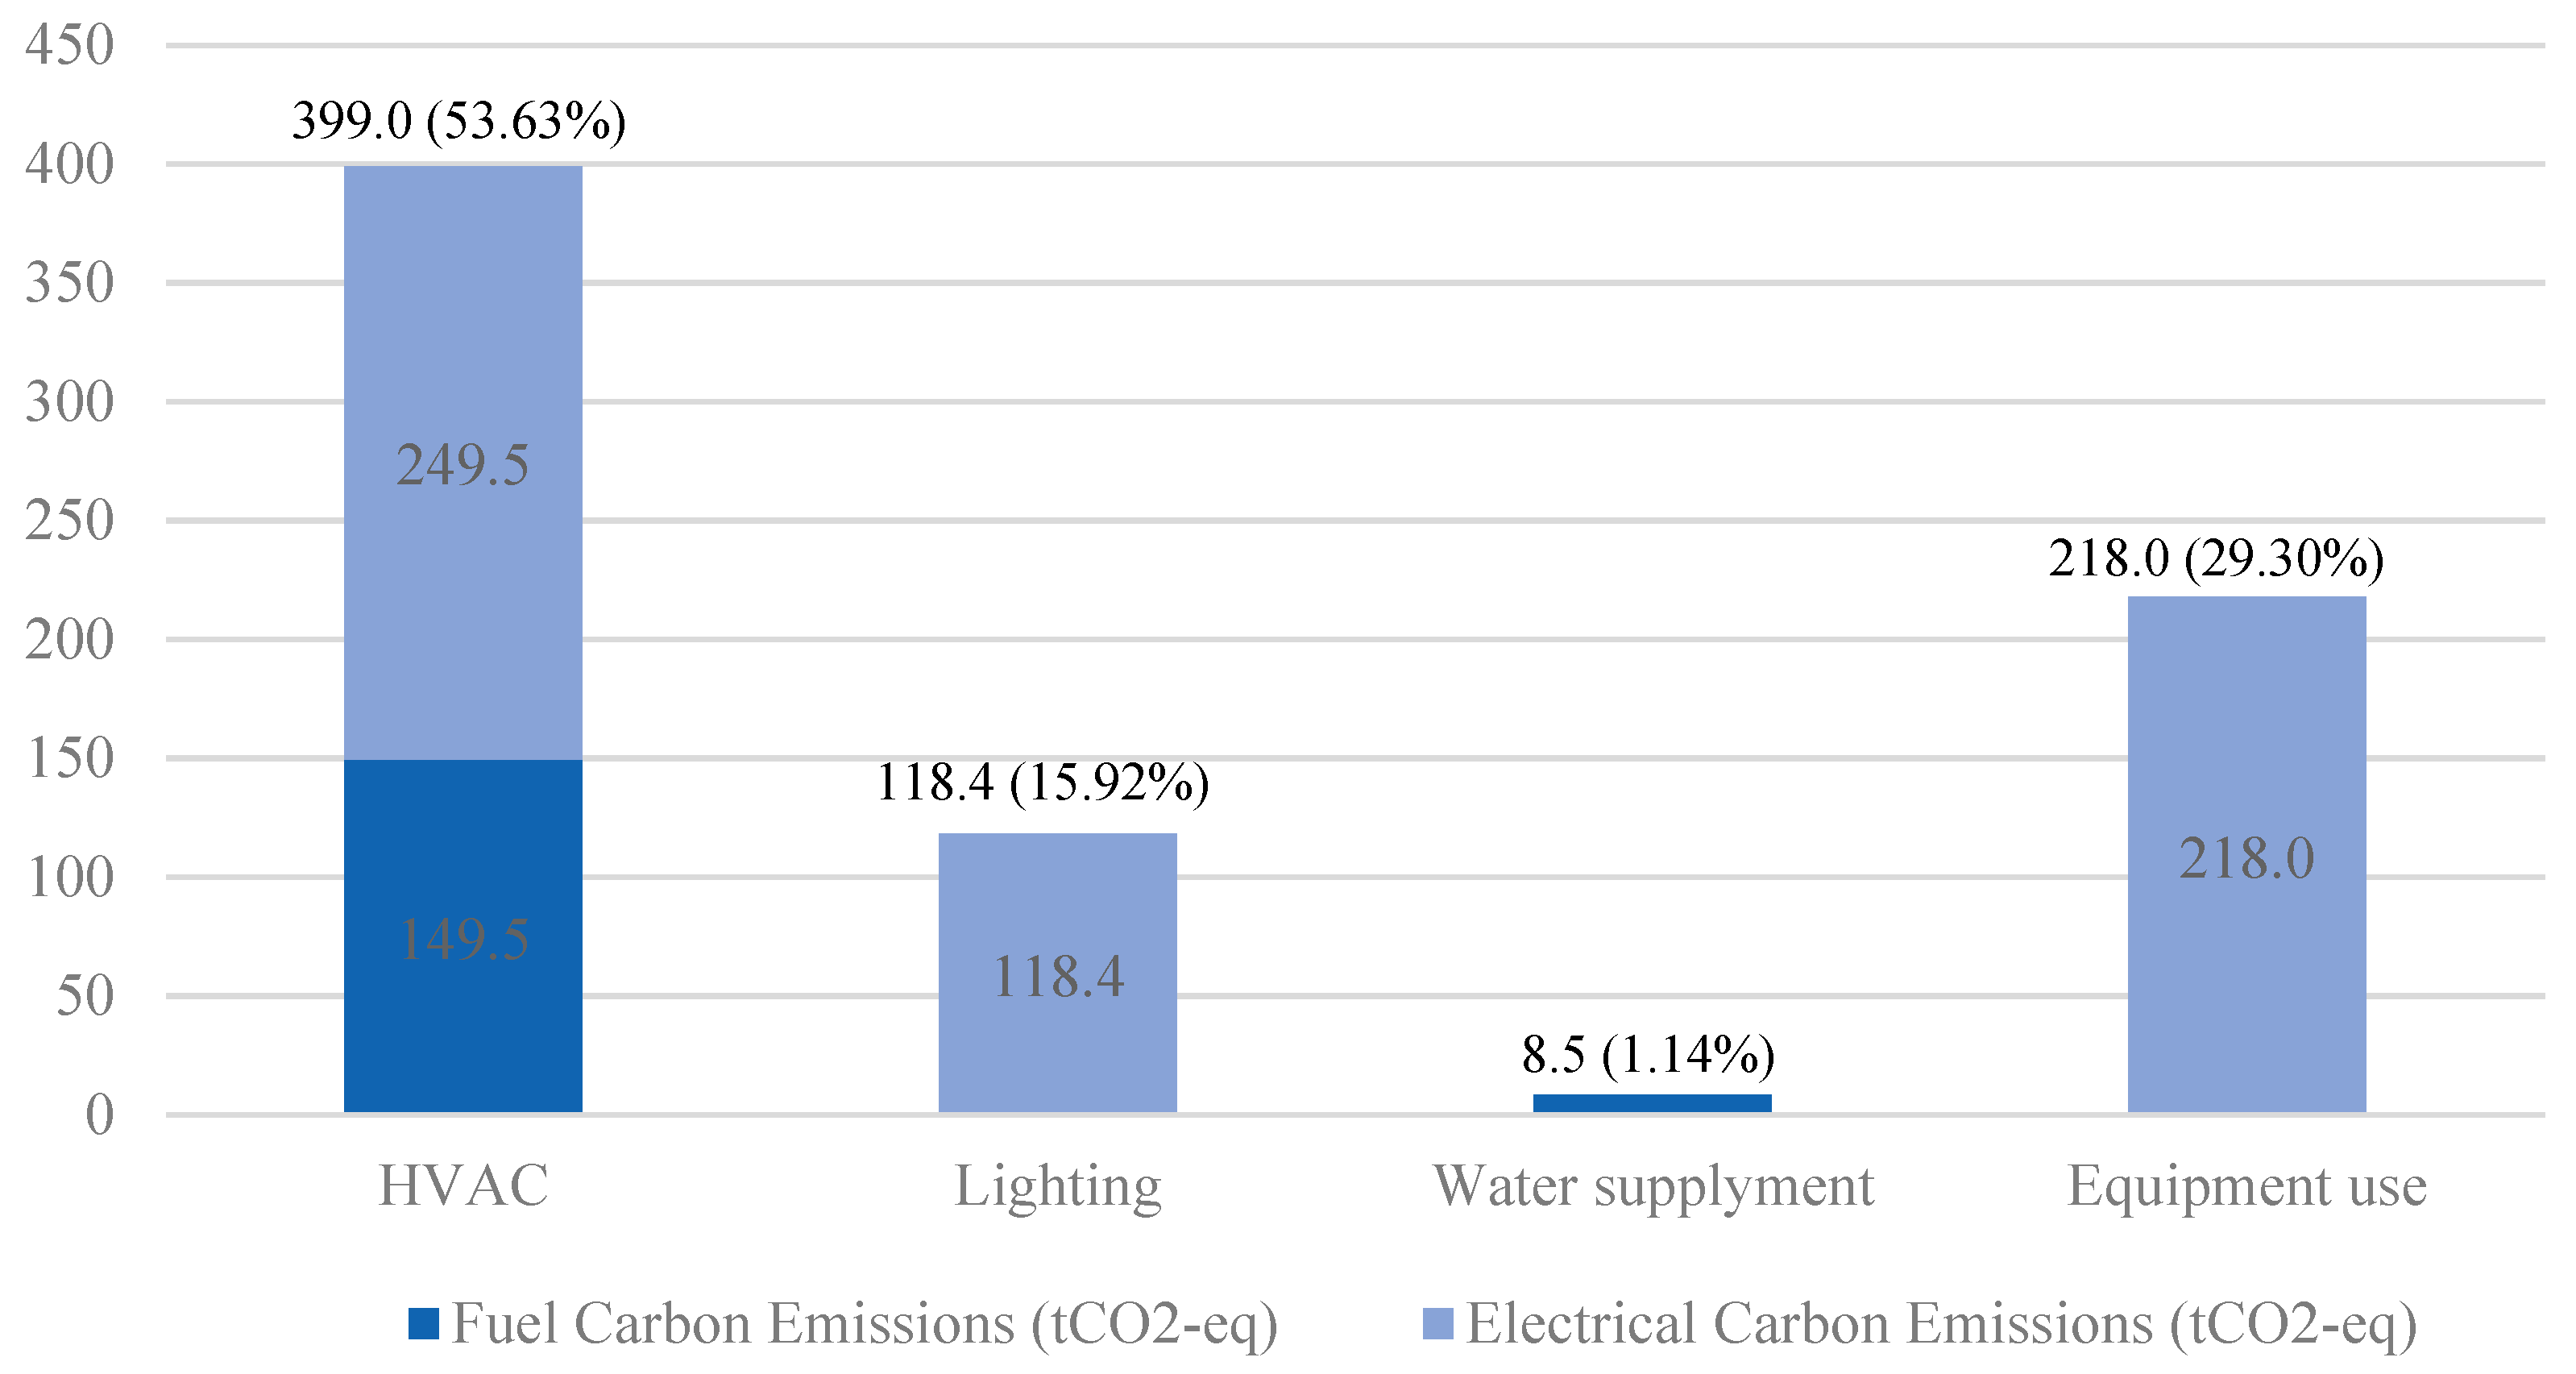
4.5. Composition Analysis of Carbon Emissions at the Operational Stage
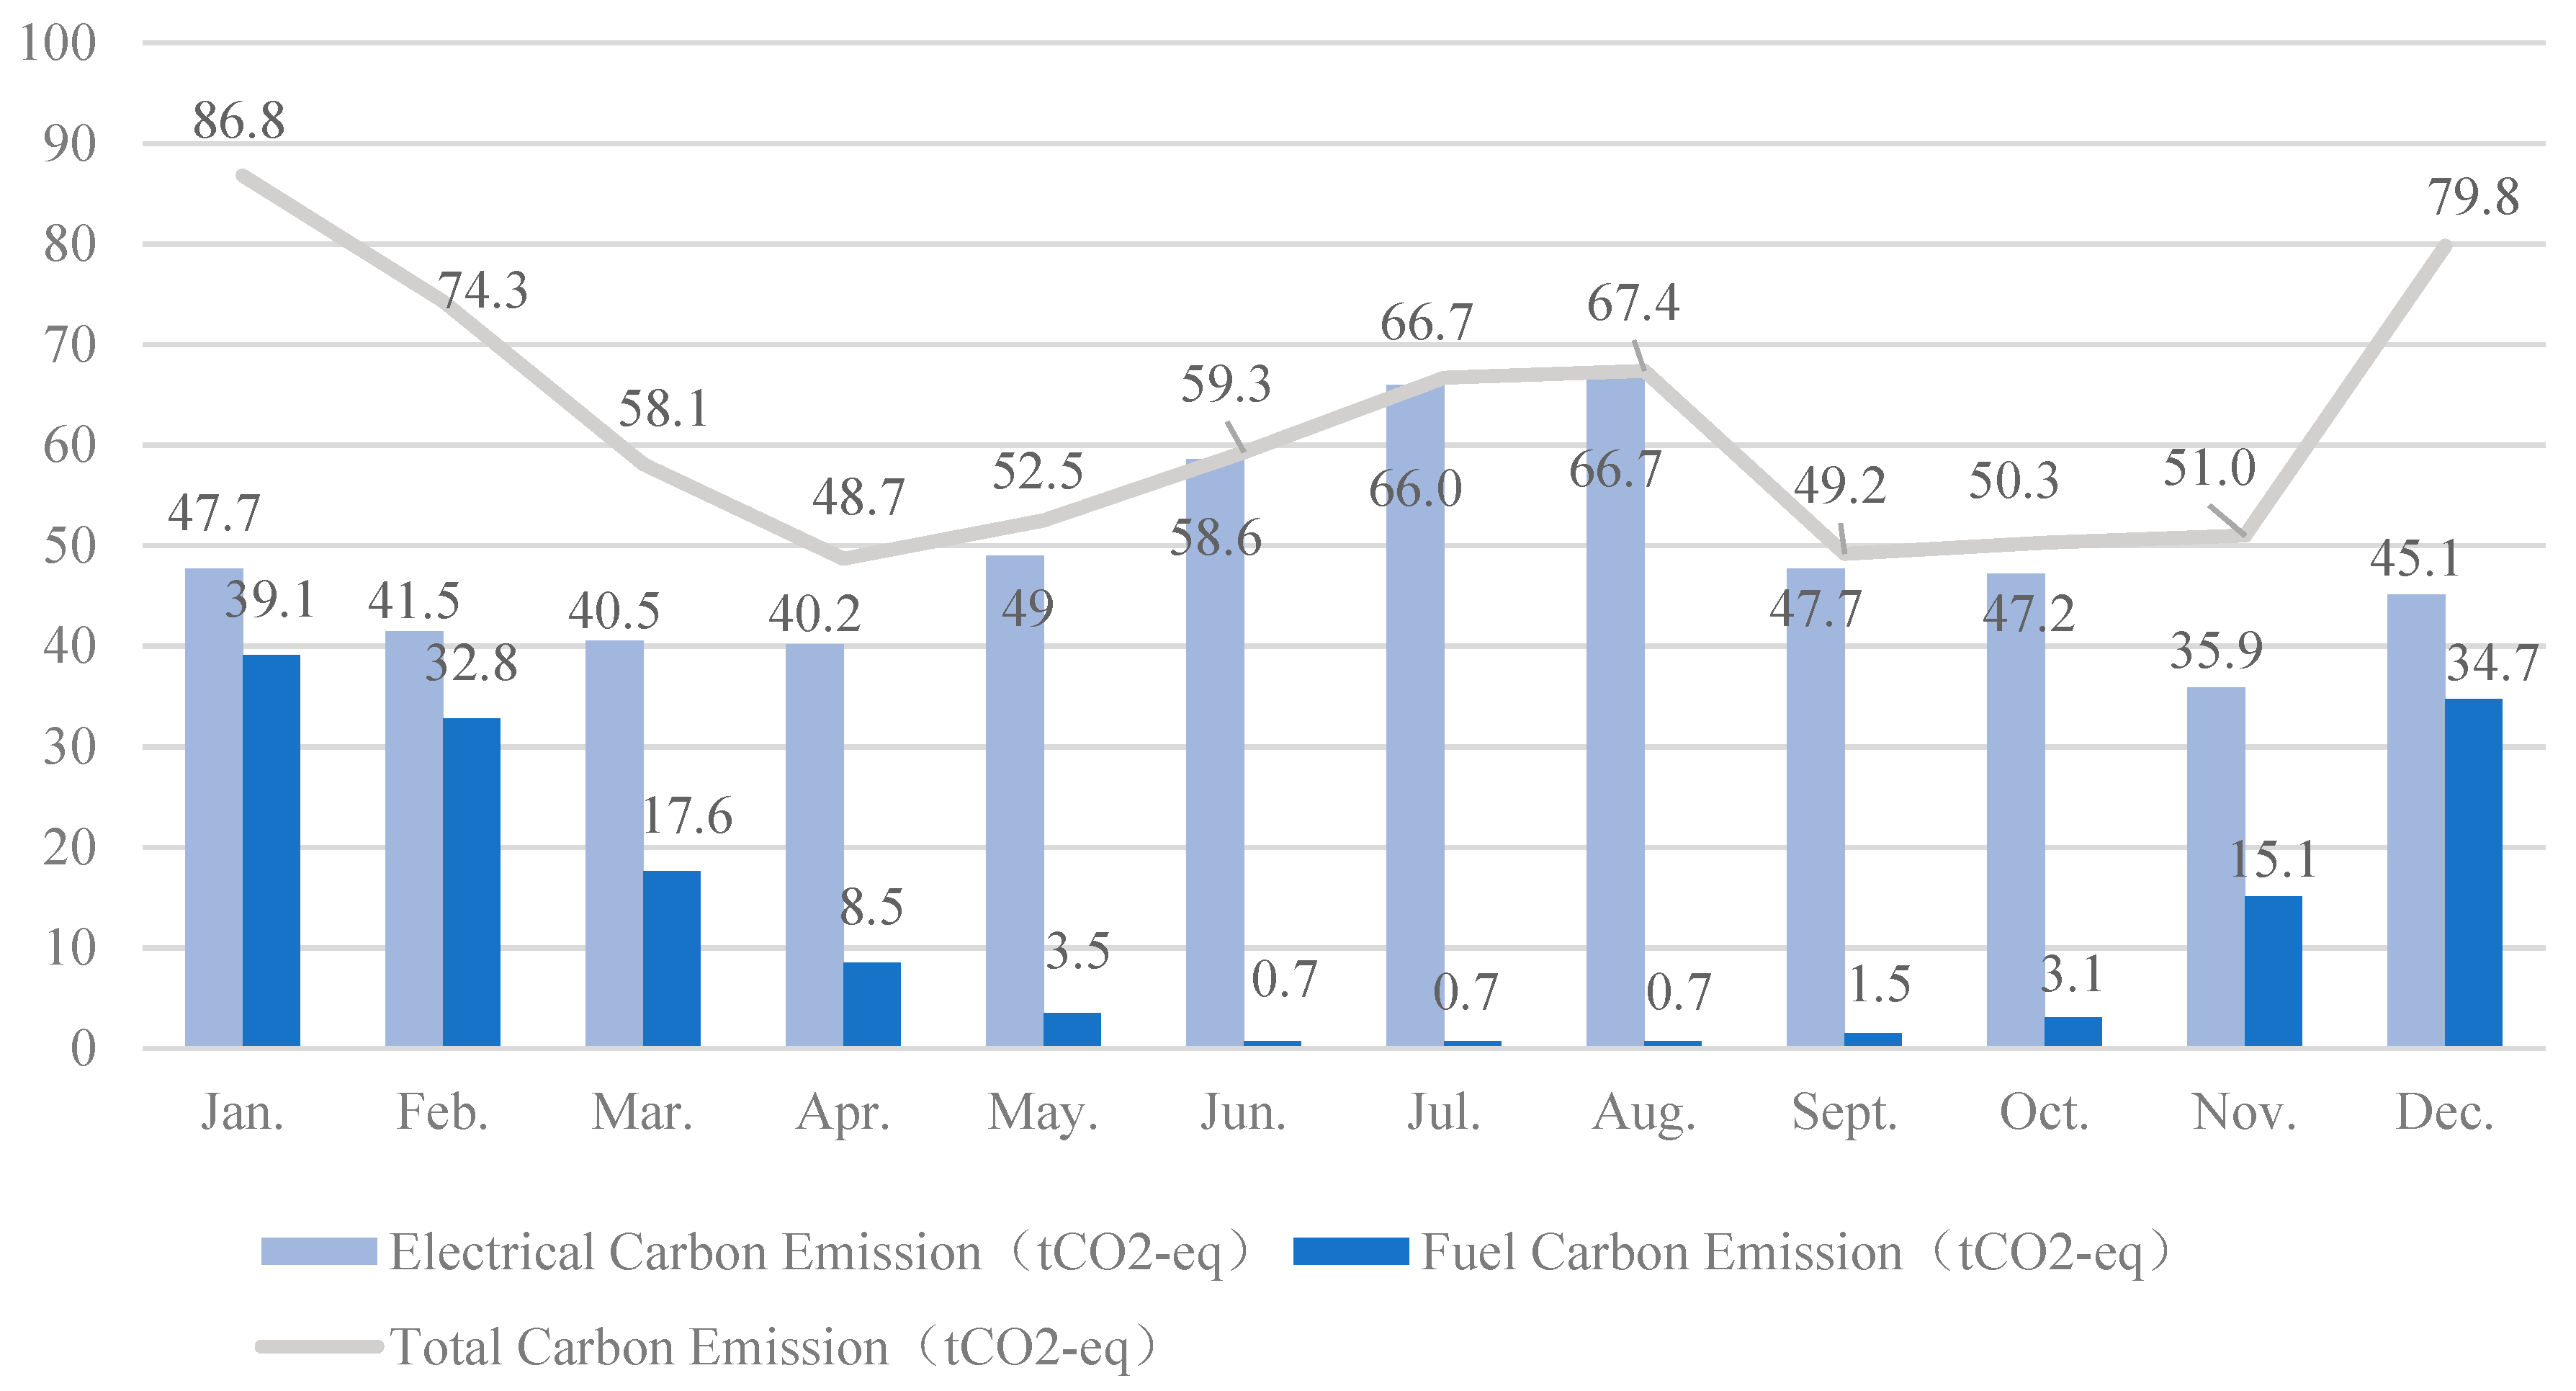
4.6. Monthly Analysis of Carbon Emissions at the Operational Stage
5. Discussion
5.1. Discussion of Methods
5.2. Discussions of the Case Study
6. Conclusions
Supplementary Materials
Author Contributions
Funding
Acknowledgments
Conflicts of Interest
References
- Zhang, D.; Zhang, J.; Guo, J.; Xiong, H. A Semantic and Social Approach for Real-Time Green Building Rating in BIM-Based Design. Sustainability 2019, 11, 3973. [Google Scholar] [CrossRef]
- Le, K.N.; Tran, C.N.N.; Tam, V.W.Y. Life-Cycle greenhouse-gas emissions assessment: An Australian commercial building perspective. J. Clean. Prod. 2018, 199, 236–247. [Google Scholar] [CrossRef]
- Tam, V.W.Y.; Le, K.N.; Tran, C.N.N.; Illankoon, I.M.C.S. A review on international ecological legislation on energy consumption: Greenhouse gas emission management. Int. J. Constr. Manag. 2019, 1–2. [Google Scholar] [CrossRef]
- Yang, X.; Hu, M.; Wu, J.; Zhao, B. Building-information-modeling enabled life cycle assessment, a case study on carbon footprint accounting for a residential building in China. J. Clean. Prod. 2018, 183, 729–743. [Google Scholar] [CrossRef]
- Cabeza, L.F.; Rincón, L.; Vilariño, V.; Pérez, G.; Castell, A. Life cycle assessment (LCA) and life cycle energy analysis (LCEA) of buildings and the building sector: A review. Renew. Sustain. Energy Rev. 2014, 29, 394–416. [Google Scholar] [CrossRef]
- Baek, C.; Tae, S.; Kim, R.; Shin, S. Life Cycle CO2 Assessment by Block Type Changes of Apartment Housing. Sustainability 2016, 8, 752. [Google Scholar] [CrossRef]
- Gan, V.J.L.; Deng, M.; Tse, K.T.; Chan, C.M.; Lo, I.M.C.; Cheng, J.C.P. Holistic BIM framework for sustainable low carbon design of high-rise buildings. J. Clean. Prod. 2018, 195, 1091–1104. [Google Scholar] [CrossRef]
- Feng, C.; Wang, M. The economy-wide energy efficiency in China’s regional building industry. Energy 2017, 141, 1869–1879. [Google Scholar] [CrossRef]
- Lee, J.; Tae, S.; Kim, R. A Study on the Analysis of CO2 Emissions of Apartment Housing in the Construction Process. Sustainability 2018, 10, 365. [Google Scholar] [CrossRef]
- Li, H.; Deng, Q.; Zhang, J.; Xia, B.; Skitmore, M. Assessing the life cycle CO2 emissions of reinforced concrete structures: Four cases from China. J. Clean. Prod. 2019, 210, 1496–1506. [Google Scholar] [CrossRef]
- Norris, G.A. Integrating life cycle cost analysis and LCA. Int. J. Life Cycle Assess. 2001, 6, 118–120. [Google Scholar]
- Klüppel, H.-J. ISO 14041: Environmental management-life cycle assessment-goal and scope definition-inventory analysis. Int. J. Life Cycle Assess. 1998, 3, 301. [Google Scholar] [CrossRef]
- Chau, C.K.; Leung, T.M.; Ng, W.Y. A review on Life Cycle Assessment, Life Cycle Energy Assessment and Life Cycle Carbon Emissions Assessment on buildings. Appl. Energy 2015, 143, 395–413. [Google Scholar] [CrossRef]
- Zhang, X.; Wang, F. Life-Cycle assessment and control measures for carbon emissions of typical buildings in China. Build. Environ. 2015, 86, 89–97. [Google Scholar] [CrossRef]
- Peng, C. Calculation of a building’s life cycle carbon emissions based on Ecotect and building information modeling. J. Clean. Prod. 2016, 112, 453–465. [Google Scholar] [CrossRef]
- Soust-Verdaguer, B.; Llatas, C.; García-Martínez, A. Critical review of bim-based LCA method to buildings. Energy Build. 2017, 136, 110–120. [Google Scholar] [CrossRef]
- Basbagill, J.; Flager, F.; Lepech, M.; Fischer, M. Application of life-cycle assessment to early stage building design for reduced embodied environmental impacts. Build. Environ. 2013, 60, 81–92. [Google Scholar] [CrossRef]
- Iddon, C.R.; Firth, S.K. Embodied and operational energy for new-build housing: A case study of construction methods in the UK. Energy Build. 2013, 67, 479–488. [Google Scholar] [CrossRef]
- Shadram, F.; Johansson, T.D.; Lu, W.; Schade, J.; Olofsson, T. An integrated BIM-based framework for minimizing embodied energy during building design. Energy Build. 2016, 128, 592–604. [Google Scholar] [CrossRef]
- Zhang, Y.; Zheng, X.; Zhang, H.; Chen, G.; Wang, X. Carbon emission analysis of a residential building in China through life cycle assessment. Front. Environ. Sci. Eng. 2016, 10, 150–158. [Google Scholar] [CrossRef]
- Li, D.; Cui, P.; Lu, Y. Development of an automated estimator of life-cycle carbon emissions for residential buildings: A case study in Nanjing, China. Habitat Int. 2016, 57, 154–163. [Google Scholar] [CrossRef]
- Ramesh, T.; Prakash, R.; Shukla, K.K. Life cycle energy analysis of buildings: An overview. Energy Build. 2010, 42, 1592–1600. [Google Scholar] [CrossRef]
- Natephra, W.; Yabuki, N.; Fukuda, T. Optimizing the evaluation of building envelope design for thermal performance using a BIM-based overall thermal transfer value calculation. Build. Environ. 2018, 136, 128–145. [Google Scholar] [CrossRef]
- Galiano-Garrigós, A.; García-Figueroa, A.; Rizo-Maestre, C.; González-Avilés, Á. Evaluation of BIM energy performance and CO2 emissions assessment tools: A case study in warm weather. Build. Res. Inf. 2019, 47, 787–812. [Google Scholar] [CrossRef]
- Marzouk, M.; Abdelkader, E.M.; Al-Gahtani, K. Building information modeling-based model for calculating direct and indirect emissions in construction projects. J. Clean. Prod. 2017, 152, 351–363. [Google Scholar] [CrossRef]
- MOHURD. GB50176-2016 Standard for Thermal Design Code for Civil Building; Ministry of Housing and Urban-Rural Development of the People’s Republic of China: Beijing, China, 2016. Available online: http://www.mohurd.gov.cn/wjfb/201702/t20170213_230579.html (accessed on 3 November 2019).
- Turner, L.K.; Collins, F.G. Carbon dioxide equivalent (CO2-e) emissions: A comparison between geopolymer and OPC cement concrete. Constr. Build. Mater. 2013, 43, 125–130. [Google Scholar] [CrossRef]
- Chen, C.; Habert, G.; Bouzidi, Y.; Jullien, A.; Ventura, A. LCA allocation procedure used as an incitative method for waste recycling: An application to mineral additions in concrete. Resour. Conserv. Recycl. 2010, 54, 1231–1240. [Google Scholar] [CrossRef] [Green Version]
- Fenner, A.E.; Kibert, C.J.; Woo, J.; Morque, S.; Razkenari, M.; Hakim, H.; Lu, X. The carbon footprint of buildings: A review of methodologies and applications. Renew. Sustain. Energy. Rev. 2018, 94, 1142–1152. [Google Scholar] [CrossRef]
- Akbarnezhad, A.; Xiao, J. Estimation and Minimization of Embodied Carbon of Buildings: A Review. Buildings 2017, 7, 5. [Google Scholar] [CrossRef]
- Yan, H.; Shen, Q.; Fan, L.C.H.; Wang, Y.; Zhang, L. Greenhouse gas emissions in building construction: A case study of One Peking in Hong Kong. Build. Environ. 2010, 45, 949–955. [Google Scholar] [CrossRef] [Green Version]
- Suh, S.; Huppes, G. Methods for Life Cycle Inventory of a product. J. Clean. Prod. 2005, 13, 687–697. [Google Scholar] [CrossRef]
- Gardezi, S.S.S.; Shafiq, N. Operational carbon footprint prediction model for conventional tropical housing: A Malaysian prospective. Int. J. Environ. Sci. Technol. 2019, 1–10. [Google Scholar] [CrossRef]
- Najjar, M.K.; Figueiredo, K.; Evangelista, A.C.J.; Hammad, A.W.A.; Tam, V.W.Y.; Haddad, A. Life cycle assessment methodology integrated with BIM as a decision-making tool at early-stages of building design. Int. J. Constr. Manag. 2019, 1–15. [Google Scholar] [CrossRef]
- Nwodo, M.N.; Anumba, C.J. A review of life cycle assessment of buildings using a systematic approach. Build. Environ. 2019, 162, 106290. [Google Scholar] [CrossRef]
- Mateus, R.; Bragança, L. Sustainability assessment and rating of buildings: Developing the methodology SBToolPT–H. Build. Environ. 2011, 46, 1962–1971. [Google Scholar] [CrossRef]
- Alshamrani, O.S.; Galal, K.; Alkass, S. Integrated LCA–LEED sustainability assessment model for structure and envelope systems of school buildings. Build. Environ. 2014, 80, 61–70. [Google Scholar] [CrossRef]
- Srinivasan, R.S.; Ingwersen, W.; Trucco, C.; Ries, R.; Campbell, D. Comparison of energy-based indicators used in life cycle assessment tools for buildings. Build. Environ. 2014, 79, 138–151. [Google Scholar] [CrossRef]
- Vilches, A.; Garcia-Martinez, A.; Sanchez-Montañes, B. Life cycle assessment (LCA) of building refurbishment: A literature review. Energy Build. 2017, 135, 286–301. [Google Scholar] [CrossRef]
- Nicolae, B.; George-Vlad, B. Life cycle analysis in refurbishment of the buildings as intervention practices in energy saving. Energy Build. 2015, 86, 74–85. [Google Scholar] [CrossRef]
- Weiler, V.; Harter, H.; Eicker, U. Life cycle assessment of buildings and city quarters comparing demolition and reconstruction with refurbishment. Energy Build. 2017, 134, 319–328. [Google Scholar] [CrossRef]
- Islam, H.; Jollands, M.; Setunge, S. Life cycle assessment and life cycle cost implication of residential buildings—A review. Renew. Sustain. Energy. Rev. 2015, 42, 129–140. [Google Scholar] [CrossRef]
- Mostavi, E.; Asadi, S.; Boussaa, D. Development of a new methodology to optimize building life cycle cost, environmental impacts, and occupant satisfaction. Energy 2017, 121, 606–615. [Google Scholar] [CrossRef]
- Hoogmartens, R.; Van Passel, S.; Van Acker, K.; Dubois, M. Bridging the gap between LCA, LCC and CBA as sustainability assessment tools. Environ. Impact Assess. Rev. 2014, 48, 27–33. [Google Scholar] [CrossRef]
- Guggemos Angela, A.; Horvath, A. Decision-Support Tool for Assessing the Environmental Effects of Constructing Commercial Buildings. J. Arch. Eng. 2006, 12, 187–195. [Google Scholar] [CrossRef]
- Junnila, S.; Horvath, A.; Guggemos Angela, A. Life-Cycle Assessment of Office Buildings in Europe and the United States. J. Infrastruct. Syst. 2006, 12, 10–17. [Google Scholar] [CrossRef]
- Wan Omar, W.-M.-S.; Doh, J.-H.; Panuwatwanich, K. Variations in embodied energy and carbon emission intensities of construction materials. Environ. Impact Assess. Rev. 2014, 49, 31–48. [Google Scholar] [CrossRef] [Green Version]
- Roh, S.; Tae, S. An integrated assessment system for managing life cycle CO2 emissions of a building. Renew. Sustain. Energy Rev. 2017, 73, 265–275. [Google Scholar] [CrossRef]
- Onat, N.C.; Kucukvar, M.; Tatari, O. Scope-based carbon footprint analysis of U.S. residential and commercial buildings: An input–output hybrid life cycle assessment approach. Build. Environ. 2014, 72, 53–62. [Google Scholar] [CrossRef]
- Li, X.; Zhu, Y.; Zhang, Z. An LCA-based environmental impact assessment model for construction processes. Build. Environ. 2010, 45, 766–775. [Google Scholar] [CrossRef]
- Ylmén, P.; Peñaloza, D.; Mjörnell, K. Life Cycle Assessment of an Office Building Based on Site-Specific Data. Energies 2019, 12, 2588. [Google Scholar] [CrossRef]
- Cavalliere, C.; Habert, G.; Dell’Osso, G.R.; Hollberg, A. Continuous BIM-based assessment of embodied environmental impacts throughout the design process. J. Clean. Prod. 2019, 211, 941–952. [Google Scholar] [CrossRef]
- Santos, R.; Costa, A.A.; Silvestre, J.D.; Pyl, L. Integration of LCA and LCC analysis within a BIM-based environment. Autom. Constr. 2019, 103, 127–149. [Google Scholar] [CrossRef]
- Röck, M.; Hollberg, A.; Habert, G.; Passer, A. LCA and BIM: Visualization of environmental potentials in building construction at early design stages. Build. Environ. 2018, 140, 153–161. [Google Scholar] [CrossRef]
- Schultz, J.; Ku, K.; Gindlesparger, M.; Doerfler, J. A benchmark study of BIM-based whole-building life-cycle assessment tools and processes. Int. J. Sustain. Build. Tech. Urban Dev. 2016, 7, 219–229. [Google Scholar] [CrossRef]
- Solís-Guzmán, J.; Rivero-Camacho, C.; Alba-Rodríguez, D.; Martínez-Rocamora, A. Carbon footprint estimation tool for residential buildings for non-specialized users: OERCO2 project. Sustainability 2018, 10, 1359. [Google Scholar] [CrossRef]
- Soust-Verdaguer, B.; Llatas, C.; García-Martínez, A.; Gómez De Cózar, J.C. BIM-Based LCA Method to Analyze Envelope Alternatives of Single-Family Houses: Case Study in Uruguay. J. Arch. Eng. 2018, 24, 05018002. [Google Scholar] [CrossRef]
- Wang, J.; Wu, H.; Duan, H.; Zillante, G.; Zuo, J.; Yuan, H. Combining life cycle assessment and Building Information Modelling to account for carbon emission of building demolition waste: A case study. J. Clean. Prod. 2018, 172, 3154–3166. [Google Scholar] [CrossRef]
- Bonamente, E.; Cotana, F. Carbon and Energy Footprints of Prefabricated Industrial Buildings: A Systematic Life Cycle Assessment Analysis. Energies 2015, 8, 12685–12701. [Google Scholar] [CrossRef] [Green Version]
- Teng, Y.; Pan, W. Systematic embodied carbon assessment and reduction of prefabricated high-rise public residential buildings in Hong Kong. J. Clean. Prod. 2019, 238, 117791. [Google Scholar] [CrossRef]
- Dong, L.; Wang, Y.; Li, X.H.; Jiang, B.; Al-Hussein, M. Carbon Reduction Measures-Based LCA of Prefabricated Temporary Housing with Renewable Energy Systems. Sustainability 2018, 10, 718. [Google Scholar] [CrossRef]
- Švajlenka, J.; Kozlovská, M. Houses Based on Wood as an Ecological and Sustainable Housing Alternative—Case Study. Sustainability 2018, 10, 1502. [Google Scholar] [CrossRef]
- Švajlenka, J.; Kozlovská, M.; Pošiváková, T. Analysis of Selected Building Constructions Used in Industrial Construction in Terms of Sustainability Benefits. Sustainability 2018, 10, 4394. [Google Scholar] [CrossRef]
- Švajlenka, J.; Kozlovská, M. Effect of accumulation elements on the energy consumption of wood constructions. Energy Build. 2019, 198, 160–169. [Google Scholar] [CrossRef]
- Liu, S.; Meng, X.; Tam, C. Building information modeling based building design optimization for sustainability. Energy Build. 2015, 105, 139–153. [Google Scholar] [CrossRef]
- Zhang, S.; Chan, A.P.C.; Feng, Y.; Duan, H.; Ke, Y. Critical review on PPP Research—A search from the Chinese and International Journals. Int. J. Proj. Manag. 2016, 34, 597–612. [Google Scholar] [CrossRef]
- MOHURD. GB/T51366-2019 Standard for Building Carbon Emission Calculation; Ministry of Housing and Urban-Rural Development of the People’s Republic of China: Beijing, China, 2019. Available online: http://www.mohurd.gov.cn/wjfb/201905/t20190530_240723.html (accessed on 3 November 2019).
- Wong, J.K.W.; Kuan, K.L. Implementing ’BEAM Plus’ for BIM-based sustainability analysis. Autom. Constr. 2014, 44, 163–175. [Google Scholar] [CrossRef]
- Inyim, P.; Rivera, J.; Zhu, Y. Integration of building information modeling and economic and environmental impact analysis to support sustainable building design. J. Manag. Eng. 2014, 31. [Google Scholar] [CrossRef]
- Najjar, M.; Figueiredo, K.; Palumbo, M.; Haddad, A. Integration of BIM and LCA: Evaluating the environmental impacts of building materials at an early stage of designing a typical office building. J. Build. Eng. 2017, 14, 115–126. [Google Scholar] [CrossRef]
- Stadel, A.; Eboli, J.; Ryberg, A.; Mitchell, J.; Spatari, S. Intelligent sustainable design: Integration of carbon accounting and building information modeling. J. Prof. Issues Eng. Educ. Pract. 2011, 137, 51–54. [Google Scholar] [CrossRef]
- Lu, K.; Wang, H. Estimation of Building’s Life Cycle Carbon Emissions Based on Life Cycle Assessment and Building Information Modeling: A Case Study of a Hospital Building in China. J. Geosci. Environ. Prot. 2019, 7, 147–165. [Google Scholar] [CrossRef]
- Hua, H.; Wang, X.; Deng, P.; He, J.; Chen, C.; Zeng, B.; Zhang, X.; Zhang, Y. Study on Low-Carbon Design Analysis and Carbon Emission Measure of Public Building Based on BIM (in Chinese). J. Civ. Eng. Manag. 2014, 31, 62–67. [Google Scholar]
- Cao, D.; Wang, G.; Li, H.; Skitmore, M.; Huang, T.; Zhang, W.; Skitmore, R. Practices and effectiveness of building information modelling in construction projects in China. Autom. Constr. 2015, 49, 113–122. [Google Scholar] [CrossRef] [Green Version]
- Wong, K.-D.; Fan, Q.; Wong, K. Building information modelling (BIM) for sustainable building design. Facilities 2013, 31, 138–157. [Google Scholar] [CrossRef]
- Eleftheriadis, S.; Duffour, P.; Mumovic, D. BIM-embedded life cycle carbon assessment of RC buildings using optimised structural design alternatives. Energy Build. 2018, 173, 587–600. [Google Scholar] [CrossRef]
- Biswas, W.K. Carbon footprint and embodied energy consumption assessment of building construction works in Western Australia. Int. J. Sustain. Environ. 2014, 3, 179–186. [Google Scholar] [CrossRef] [Green Version]


| Material Name | Unit | Amount | Material Name | Unit | Amount |
|---|---|---|---|---|---|
| C15 commercial concrete (no pumping) | m3 | 220.41 | Colored glazed floor tile | m2 | 217.43 |
| C30 commercial concrete (pumping) | m3 | 1915.57 | Floor tile 300 × 300 | m2 | 399.29 |
| C30 commercial concrete (no pumping) | m3 | 21.41 | Polycrystalline anti-slip floor tile 300 × 300 | m2 | 1420.89 |
| C20 commercial concrete (no pumping) | m3 | 317.68 | Polycrystalline anti-slip floor tile 600 × 600 | m2 | 3341.29 |
| C35 commercial concrete (pumping) | m3 | 52.59 | Granite plate 10 cm | m2 | 6.85 |
| C40 commercial concrete (pumping) | m3 | 63.07 | Granite plate 3 cm | m2 | 5.28 |
| Steel pipe | t | 3.93 | Granite plate 4 cm | m2 | 210.77 |
| Steel bar (Φ10 or less) | t | 115.03 | Granite plate (other size) | m2 | 516.99 |
| Steel bar (more thanΦ10) | t | 230.44 | Petroleum asphalt | kg | 5684.45 |
| Steel support | kg | 6500.76 | SBS-modified asphalt waterproofing roll | m2 | 2481.37 |
| Welding rod | kg | 2791.04 | Water | m3 | 2765.60 |
| Structural Steel | kg | 70.60 | Crushed stone (particle size 40) | t | 279.77 |
| Nails | kg | 2726.10 | Crushed stone (other size) | t | 59.26 |
| Expanded metal mesh (Steel wire mesh) | m2 | 4054.64 | Light steel keel 600 × 600 | m2 | 3316.32 |
| Calcium silicate cement | t | 12.20 | All-ceramic wall tile 300 × 450 | m2 | 2757.28 |
| Portland cement | t | 542.61 | All-ceramic wall tile 300 × 600 | m2 | 2133.20 |
| Gypsum | t | 34.96 | PVC-steel window | m2 | 1373.96 |
| Standard brick 240 × 115 × 53 | 100 blocks | 174.17 | Window-shades | m2 | 386.59 |
| Coal gangue standard brick 240 × 115 × 53 | 100 blocks | 161.94 | Class-A fire-proof door | m2 | 9.66 |
| Coal gangue solid brick 240 × 115 × 53 | 100 blocks | 23.56 | Class-B fire-proof door | m2 | 45.99 |
| Cork brick 240 × 115 × 90 | 100 blocks | 1679.73 | Class-C fire-proof door | m2 | 49.32 |
| Coal gangue cork brick 240 × 180 × 115 | 100 blocks | 2096.15 | Compound wood template | m2 | 4285.90 |
| Energy Consumption | HVAC | Lighting | Water Suppling | Equipment Use | Total |
|---|---|---|---|---|---|
| Fuel consumption (MJ) | 2,999,421 | 0 | 170,578 | 0 | 3,169,999 |
| Electricity consumption (kWh) | 570,736 | 270,864 | 0 | 498,660 | 1,340,260 |
| Stage | Carbon Emissions (tCO2-eq) | Percentage (%) | CAt (kgCO2-eq/(m2 y)) |
|---|---|---|---|
| Construction stage | 3166.87 | 7.90 | 248.69 |
| Operational stage | 36,600.00 | 91.31 | 114.97 |
| Demolition stage | 316.69 | 0.79 | 99.48 |
| Total | 40,083.56 | 100.00 | 119.91 |
© 2019 by the authors. Licensee MDPI, Basel, Switzerland. This article is an open access article distributed under the terms and conditions of the Creative Commons Attribution (CC BY) license (http://creativecommons.org/licenses/by/4.0/).
Share and Cite
Lu, K.; Jiang, X.; Tam, V.W.Y.; Li, M.; Wang, H.; Xia, B.; Chen, Q. Development of a Carbon Emissions Analysis Framework Using Building Information Modeling and Life Cycle Assessment for the Construction of Hospital Projects. Sustainability 2019, 11, 6274. https://0-doi-org.brum.beds.ac.uk/10.3390/su11226274
Lu K, Jiang X, Tam VWY, Li M, Wang H, Xia B, Chen Q. Development of a Carbon Emissions Analysis Framework Using Building Information Modeling and Life Cycle Assessment for the Construction of Hospital Projects. Sustainability. 2019; 11(22):6274. https://0-doi-org.brum.beds.ac.uk/10.3390/su11226274
Chicago/Turabian StyleLu, Kun, Xiaoyan Jiang, Vivian W. Y. Tam, Mengyun Li, Hongyu Wang, Bo Xia, and Qing Chen. 2019. "Development of a Carbon Emissions Analysis Framework Using Building Information Modeling and Life Cycle Assessment for the Construction of Hospital Projects" Sustainability 11, no. 22: 6274. https://0-doi-org.brum.beds.ac.uk/10.3390/su11226274