Article

Construction of the Ecological Security Pattern of Urban Agglomeration under the Framework of Supply and Demand of Ecosystem Services Using Bayesian Network Machine Learning: Case Study of the Changsha–Zhuzhou–Xiangtan Urban Agglomeration, China

1
College of Resources and Environmental Sciences, Hunan Normal University, Changsha 410081, China
2
Hunan Key Laboratory of Land Resources Evaluation and Utilization, Changsha 410007, China
3
Key Laboratory of Regional Sustainable Development Modeling, Institute of Geographic Sciences and Natural Resources Research, Chinese Academy of Sciences, Beijing 100101, China
*
Author to whom correspondence should be addressed.
Sustainability 2019, 11(22), 6416; https://0-doi-org.brum.beds.ac.uk/10.3390/su11226416
Submission received: 15 October 2019 / Revised: 8 November 2019 / Accepted: 13 November 2019 / Published: 14 November 2019

Abstract

:
Coordinating ecosystem service supply and demand equilibrium and utilizing machine learning to dynamically construct an ecological security pattern (ESP) can help better understand the impact of urban development on ecological processes, which can be used as a theoretical reference in coupling economic growth and environmental protection. Here, the ESP of the Changsha–Zhuzhou–Xiangtan urban agglomeration was constructed, which made use of the Bayesian network model to dynamically identify the ecological sources. The ecological corridor and ecological strategy points were identified using the minimum cumulative resistance model and circuit theory. The ESP was constructed by combining seven ecological sources, “two horizontal and three vertical” ecological corridors, and 37 ecological strategy points. Our results found spatial decoupling between the supply and demand of ecosystem services (ES) and the degradation in areas with high demand for ES. The ecological sources and ecological corridors of the urban agglomeration were mainly situated in forestlands and water areas. The terrestrial ecological corridor was distributed along the outer periphery of the urban agglomeration, while the aquatic ecological corridor ran from north to south throughout the entire region. The ecological strategic points were mainly concentrated along the boundaries of the built-up area and the intersection between construction land and ecological land. Finally, the ecological sources were found primarily on existing ecological protection zones, which supports the usefulness of machine learning in predicting ecological sources and may provide new insights in developing urban ESP.

1. Introduction

The continued urbanization has led to a sharp increases in population among urban areas and the rapid expansion of built-up areas [1,2,3]. The haphazard expansion of built-up spaces and the intrusion into natural ecosystems have restricted sustainable development in cities. In particular, the status of urban agglomerations in regional development has become increasingly crucial. As the leading form of new urbanization, urban development faces environmental security threats such as biodiversity reduction, soil erosion, and water shortage [4,5,6]. Ensuring the structural stability and functional safety of urban agglomeration ecosystems and achieving high-quality development of urban agglomerations have become a focal point of interest among researchers and policy-makers from around the globe.
The ecological security pattern (ESP) can characterize the integrity and health of current natural ecosystems, and the long-term potential of biodiversity conservation and landscape ecological restoration [7,8]. Compared with similar concepts such as urban growth boundary [9] and urban development boundary [10], the theoretical basis for ESP is the principle of landscape ecology, which is focused on the spatial (or functional) association between important patches from the perspective of corridors [4]. Two fundamental steps in the construction of the ESP include identifying the ecological sources and determining the ecological corridors. In identifying ecological sources consisting of critical natural habitat patches, two main approaches are used. The first deals with directly selecting nature reserves, scenic spots, and vast ecological lands [11,12,13]. The other is based on the framework of “importance-sensitivity-connectivity” [14,15,16], which has become more acceptable since it focuses on the structural and functional aspects of the ecosystem. As for identifying ecological corridors, there are numerous techniques available [17,18,19]. The minimum cumulative resistance (MCR) model is the most widely used approach, which simulates the cost of the ecological sources to overcome the different resistance of landscape media in the process of ecological expansion and reconstructs the potential ecological corridor reflecting species migration [20,21,22]. The existing research on developing ESP has mainly focused on solitary cities and often neglects the context of urban agglomerations. Traditional methods of ecological sources identification have been based largely on the static evaluation of ecological service importance, ecological sensitivity, and landscape connectivity. Even though the ESP construction method based on the flow of ecosystem services (ES) has become part of the current mainstream research [4], the identification of ecological source and ecological corridors remains to have a mismatch between supply and demand space [4]. This approach fails to consider the correlation between different ecological processes and neglects the dynamic transformations in ecological land use, thereby reducing the effectiveness of source identification. Also, while the MCR model can adequately describe the direction of the ecological corridor, it fails to provide information regarding its scope [23]. Moreover, the current literature has often overlooked ecological strategy points [4,23], which, in the context of urban planning, are essential for maintaining and improving ecological corridors. Therefore, conducting an in-depth analysis of the correlation between different ecological processes is essential in understanding the ESP in urban agglomerations and in establishing new methods for analyzing ESP.
As one of the most important urban clusters in China, the Changsha–Zhuzhou–Xiangtan urban agglomeration serves as a prototype for China’s integrated development. During the period of 1995–2018, urbanization in the Changsha–Zhuzhou–Xiangtan region resulted in a number of adverse ecological impacts, including habitat loss, water shortage, soil erosion, and air pollution [24,25]. Given the challenges of balancing ecological protection with economic expansion, demonstrating the connection between the supply and demand patches of ES and establishing the correlations between different ecological processes can contribute substantially to high-quality economic, social, and ecological development. Taking the Changsha–Zhuzhou–Xiangtan urban agglomeration as an example, this study made use of a Bayesian network model that integrates the historical characteristics of the ecological sources, the geographical factors, the ecosystem health, and the supply and demand of ES, in order to identify the ecological sources. The minimum cumulative resistance model and the circuit theory were incorporated to build the ecological corridor and ecological strategic point, which are necessary for the development of the ESP. The results would provide useful, practical reference for future works in ESP development of urban agglomerations.
The main contribution of this study can be summarized as follows. First, in using the supply and demand equilibrium of ES, the construction of the ESP considers ecosystem integrity and the integration of urban agglomerations, thereby increasing the effectiveness of the ESP. Second, machine learning was employed to dynamically identify ecological sources, which enabled combining the changes of ecological land (empirical knowledge) with the influence of the current situation (observation data) in executing comprehensive identification of ecological sources. Previous researches have focused on the “importance-sensitivity-connectivity” in identifying ecological sources [14,15,16], which often neglected the lessons of historical land use. Moreover, traditional techniques cannot adequately present the dynamic characteristics of ecological land use, since ecological lands can be encroached by cultivated land and construction land.

2. Study Area and Methodologies

2.1. Study Area

The Changsha–Zhuzhou–Xiangtan urban agglomeration is located in the middle and lower reaches of the Xiangjiang River, in the northeast of Hunan Province, with a total area of 28,000 km2 (see Figure 1). The region has a unique spatial combination of the intraregional basins alternating with hills, and towns interspersed with villages. The Xiangjiang River runs through the entire urban agglomeration from south to north, splitting the urban agglomeration into two. The forest and cultivated lands constitute a unique landscape in the area, where cultivated land accounts for 34.59% of the total land area, and the forest land is 53.68%. The whole region is situated in the subtropical monsoon climate zone, with an average annual temperature of 16–18 °C and an average annual precipitation of about 1200–1500 mm. The metropolitan area of the Changsha–Zhuzhou–Xiangtan urban agglomeration was selected as the study area, which includes the urban zones of Changsha City, Zhuzhou City, and Xiangtan City, as well as Changsha County, Zhuzhou County, and Xiangtan County [26,27]. With an estimated population of 8.79 million (2018) and gross domestic product (GDP)of 1063 billion yuan, the study area of roughly 8629 km2 in size and a built-up area of 1039 km2 is the most representative area of significant urbanization and ecological environment change in the entire urban agglomeration.

2.2. Data Sources and Processing

The research datasets included the vector diagram of administrative divisions, the spatial distribution data of soil texture, soil erosion, land-use data, average temperature, average precipitation, population, and GDP of the Changsha–Zhuzhou–Xiangtan urban agglomeration for 1995 and 2018, which were all acquired from the Resource and Environmental Science Data Center of the Chinese Academy of Sciences. The elevation, slope, and distance from roads, water bodies, and construction land of the urban agglomeration were obtained using ArcGIS 10.2 (developed by Environmental Systems Research, Inc., USA) spatial analysis and Euclidean distance tools. The ES supply was calculated using the ecosystem value coefficient developed by Xie Gaodi [28]; the ES demand data was based on the ES demand model developed by Jing Yongcai et al. [29]; and, the ecosystem vitality was quantified by adopting the net primary production (NPP) [30]. NPP data utilize the MOD17A3 product with 1 km resolution provided by NASA EOS/MODIS (from http://ladswed.nascom.nasa.gov). The ecosystem organization data was determined by the weight coefficient model with the use of landscape indices, such as landscape heterogeneity, landscape connectivity, and prominent land cover [31,32] (see Table 1). The dominant land-use types in the area included cultivated land, forest land, grassland, water area, construction land, and unused land. In this study, forest lands, grasslands, and water areas were classified as ecological land [33,34]. Its main functions include maintaining ecosystem stability and providing ES, thereby resulting in a far-reaching impact on ecological sustainability. The cultivated land in the region’s core had considerably been urbanized with its agricultural functions significantly undercut and was therefore excluded in analyzing the ecological land use.

2.3. Methodology

The framework used in analyzing the ESP was the “ecological source-ecological corridor-ecological strategic point” approach (see Figure 2). Based on the supply and demand relationship of ES, the Bayesian network was used to dynamically identify the ecological sources. The ecological corridor and the ecological strategy were identified using the minimum cumulative resistance model (MCR). Specifically, the MCR model was used to determine the basic spatial orientation of the ecological corridor and the circuit theory to extract ecological strategic points based on barriers to the ecological corridor.

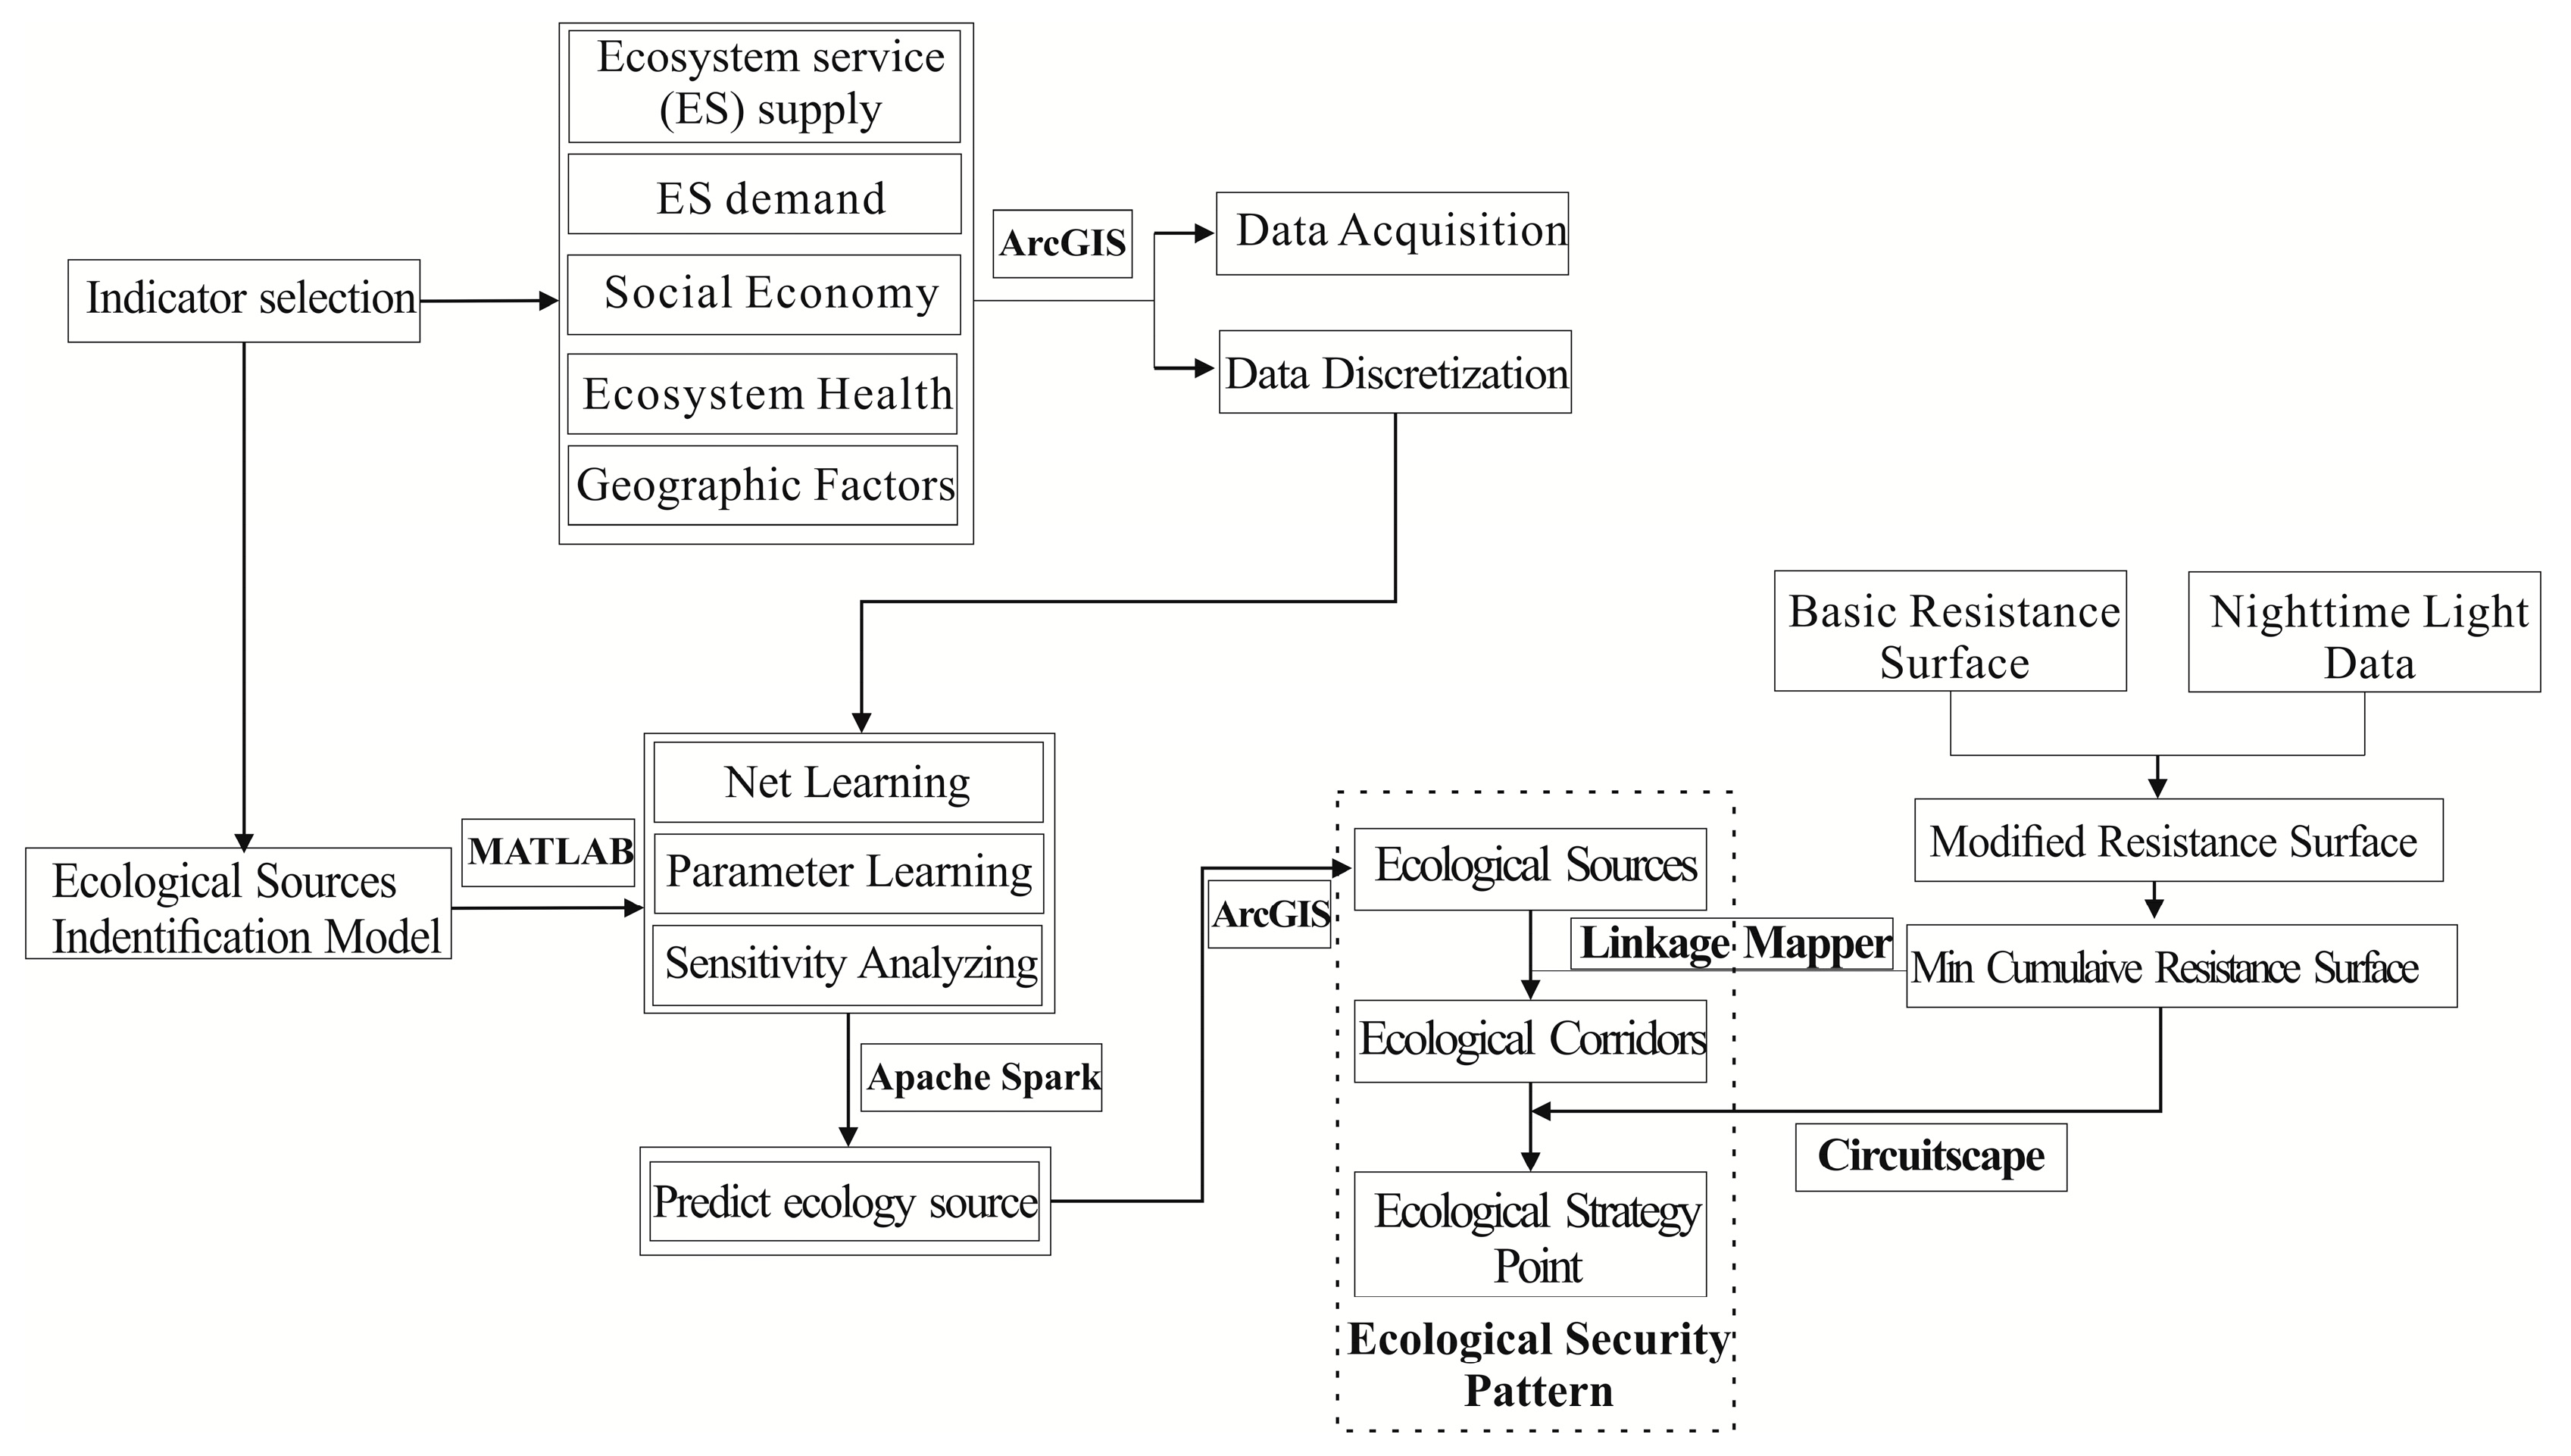
2.3.1. Ecological Source Identification Based on Bayesian Network Machine Learning

The Bayesian network machine learning model included selecting indicators required for the identification of ecological sources, learning of evolution characteristics of ecological sources, and simulating the detection of ecological sources.

Indicator Selection

Ecological sources serve as the primary component of ESP and refer to the most critical patch in supplying regional ES and maintenance of regional landscape ecological processes. Essential aspects such as topography, society, economy, and ES were included in reconstructing the ESP. These fundamental elements were categorized into four groups: geographic factors (e.g., topography, climate, and soil texture), social economy (e.g., population density and GDP density), ecosystem health (e.g., ecosystem organization and ecosystem vitality), and supply and demand of ES. For reference, ecosystem health is the metaphor for how the composition, structure, and function of urban agglomeration ecosystems are kept intact by anthropogenic activities and can provide sustainable and stable resources and services for human survival. The specific indicators and their discrete classification are summarized in Table 1. All indicator datasets were processed using the ArcGIS 10.2 Spatial Analyst and distance calculation tool to obtain the corresponding indicator raster maps, and the resolution was unified to 30 m.

Ecological Source Identification Model Construction

Note that 1714 random sample points were generated using the vector map of 1995 urban agglomeration ecological land. The sample points were superimposed over the indicator raster map, and the ArcGIS 10.2 Extract-Values-to-Table function was used to obtain the indicator value for each sample. The sample points were then overlapped with the 2018 land-use map to determine whether the sample points were on ecological land. Samples located on ecological land were assigned a value of 1; otherwise, the value assigned was 0. Since most of the indicator data were discrete, MATLAB R2016a (developed by MathWorks, USA) was employed to divide the indicators into two to four grades, similar to those used in previous research [35]. The specific indicator discretization results are shown in Table 1. MATLAB R2016a was also used to construct the Bayesian network model and parameter learning, and in analyzing the sensitivity of the model. Larger variance reduction means that the indicator has a greater influence on ecological lands (see Table 2). From the results, the Bayes method in Apache Spark was used to predict and measure the changes in ecological use. Kriging interpolation using ArcGIS 10.2 Spatial Analyst was employed to obtain the ecological safety land probability (referring to the probability of conversion from ecological land to nonecological land), which was reclassified based on the Jenk’s optimization method. Patches with resulting probability greater than 0.5 were designated as land for ecological use, while those with probability greater than 0.65 were assigned as the ecological sources.

2.3.2. Ecological Corridor Construction Based on Minimum Cumulative Resistance (MCR) Model

The MCR model was used to calculate the cost of a species moving from a source region to a target region. The corridor range was determined based on the cumulative resistance threshold, and the area exceeding the threshold was excluded from the ecological corridor. The ArcGIS 10.2 plug-in Linkage Mapper Arc10 was utilized to identify the ecological corridors [32]. The formula used in calculating the minimum cumulative resistance is:
M C R = f min j = n i = m D i j × R i
where M C R is the minimum cumulative resistance value, D i j is the spatial distance of the species from the source j to the target i , R i is the resistance coefficient of the landscape unit to the movement of a particular species, and f is a positive correlation function between M C R and the ecological process.
The MCR model requires two parameters: the ecological sources and the ecological resistance surface coefficient. The ecological sources were identified by Bayesian network machine learning, while the ecological resistance surface coefficient was set based on relevant literature [32,36]. Since the Xiangjiang River runs through the entire urban agglomeration, a unique ecological landscape has been formed with a significant difference between land and water species migration. Thus, this study arranged different ecological resistance surface coefficients and simulated the construction of terrestrial and aquatic ecological corridors, which constitute the ecological corridor system of Changsha–Zhuzhou–Xiangtan urban agglomerations. For the terrestrial ecological resistance coefficients, construction land had the highest coefficient value, while forest land had the lowest. The terrestrial resistance surface coefficients for the various land cover types are as follows: forest land (1), grassland (10), water area (200), cultivated land (150), unused land (300), and construction land (500). For the hydrologic-ecological resistance surface coefficients, the coefficient for construction land was highest, while the coefficient of the water area was lowest. The hydrological resistance surface coefficients for the various land cover types are as follows: water area (1), forest land (150), cultivated land (200), grassland (150), unused land (300), and construction land (500). Since the urban ecological corridor has significantly been affected by anthropogenic disturbance, the impact of human interference on the corridor construction was reduced using the nighttime light index as correction to the M C R [32,37,38]:
R = T L I i T L I a × R
where R is the modified resistance value, R is the initial resistance value, T L I i is the night light index of the grid, and T L I a is the average night light index of the land-use type corresponding to the grid i in the urban agglomeration.

2.3.3. Ecological Strategy Point Identification Based on Circuit Theory

As for the spatial distribution, the discontinuous (mutation) points in the ecological corridor were mainly caused by ecological high-resistance patches cutting off the ecological corridor, comparable to the concept of “pinch” in circuit theory. These points, which are critical to the efficiency of species migration and are significantly impacted by human activities, are defined as ecological strategy points. The ArcGIS 10.2 plug-in Circuitscape was used to identify the ecological strategy points in this study [32].

3. Results

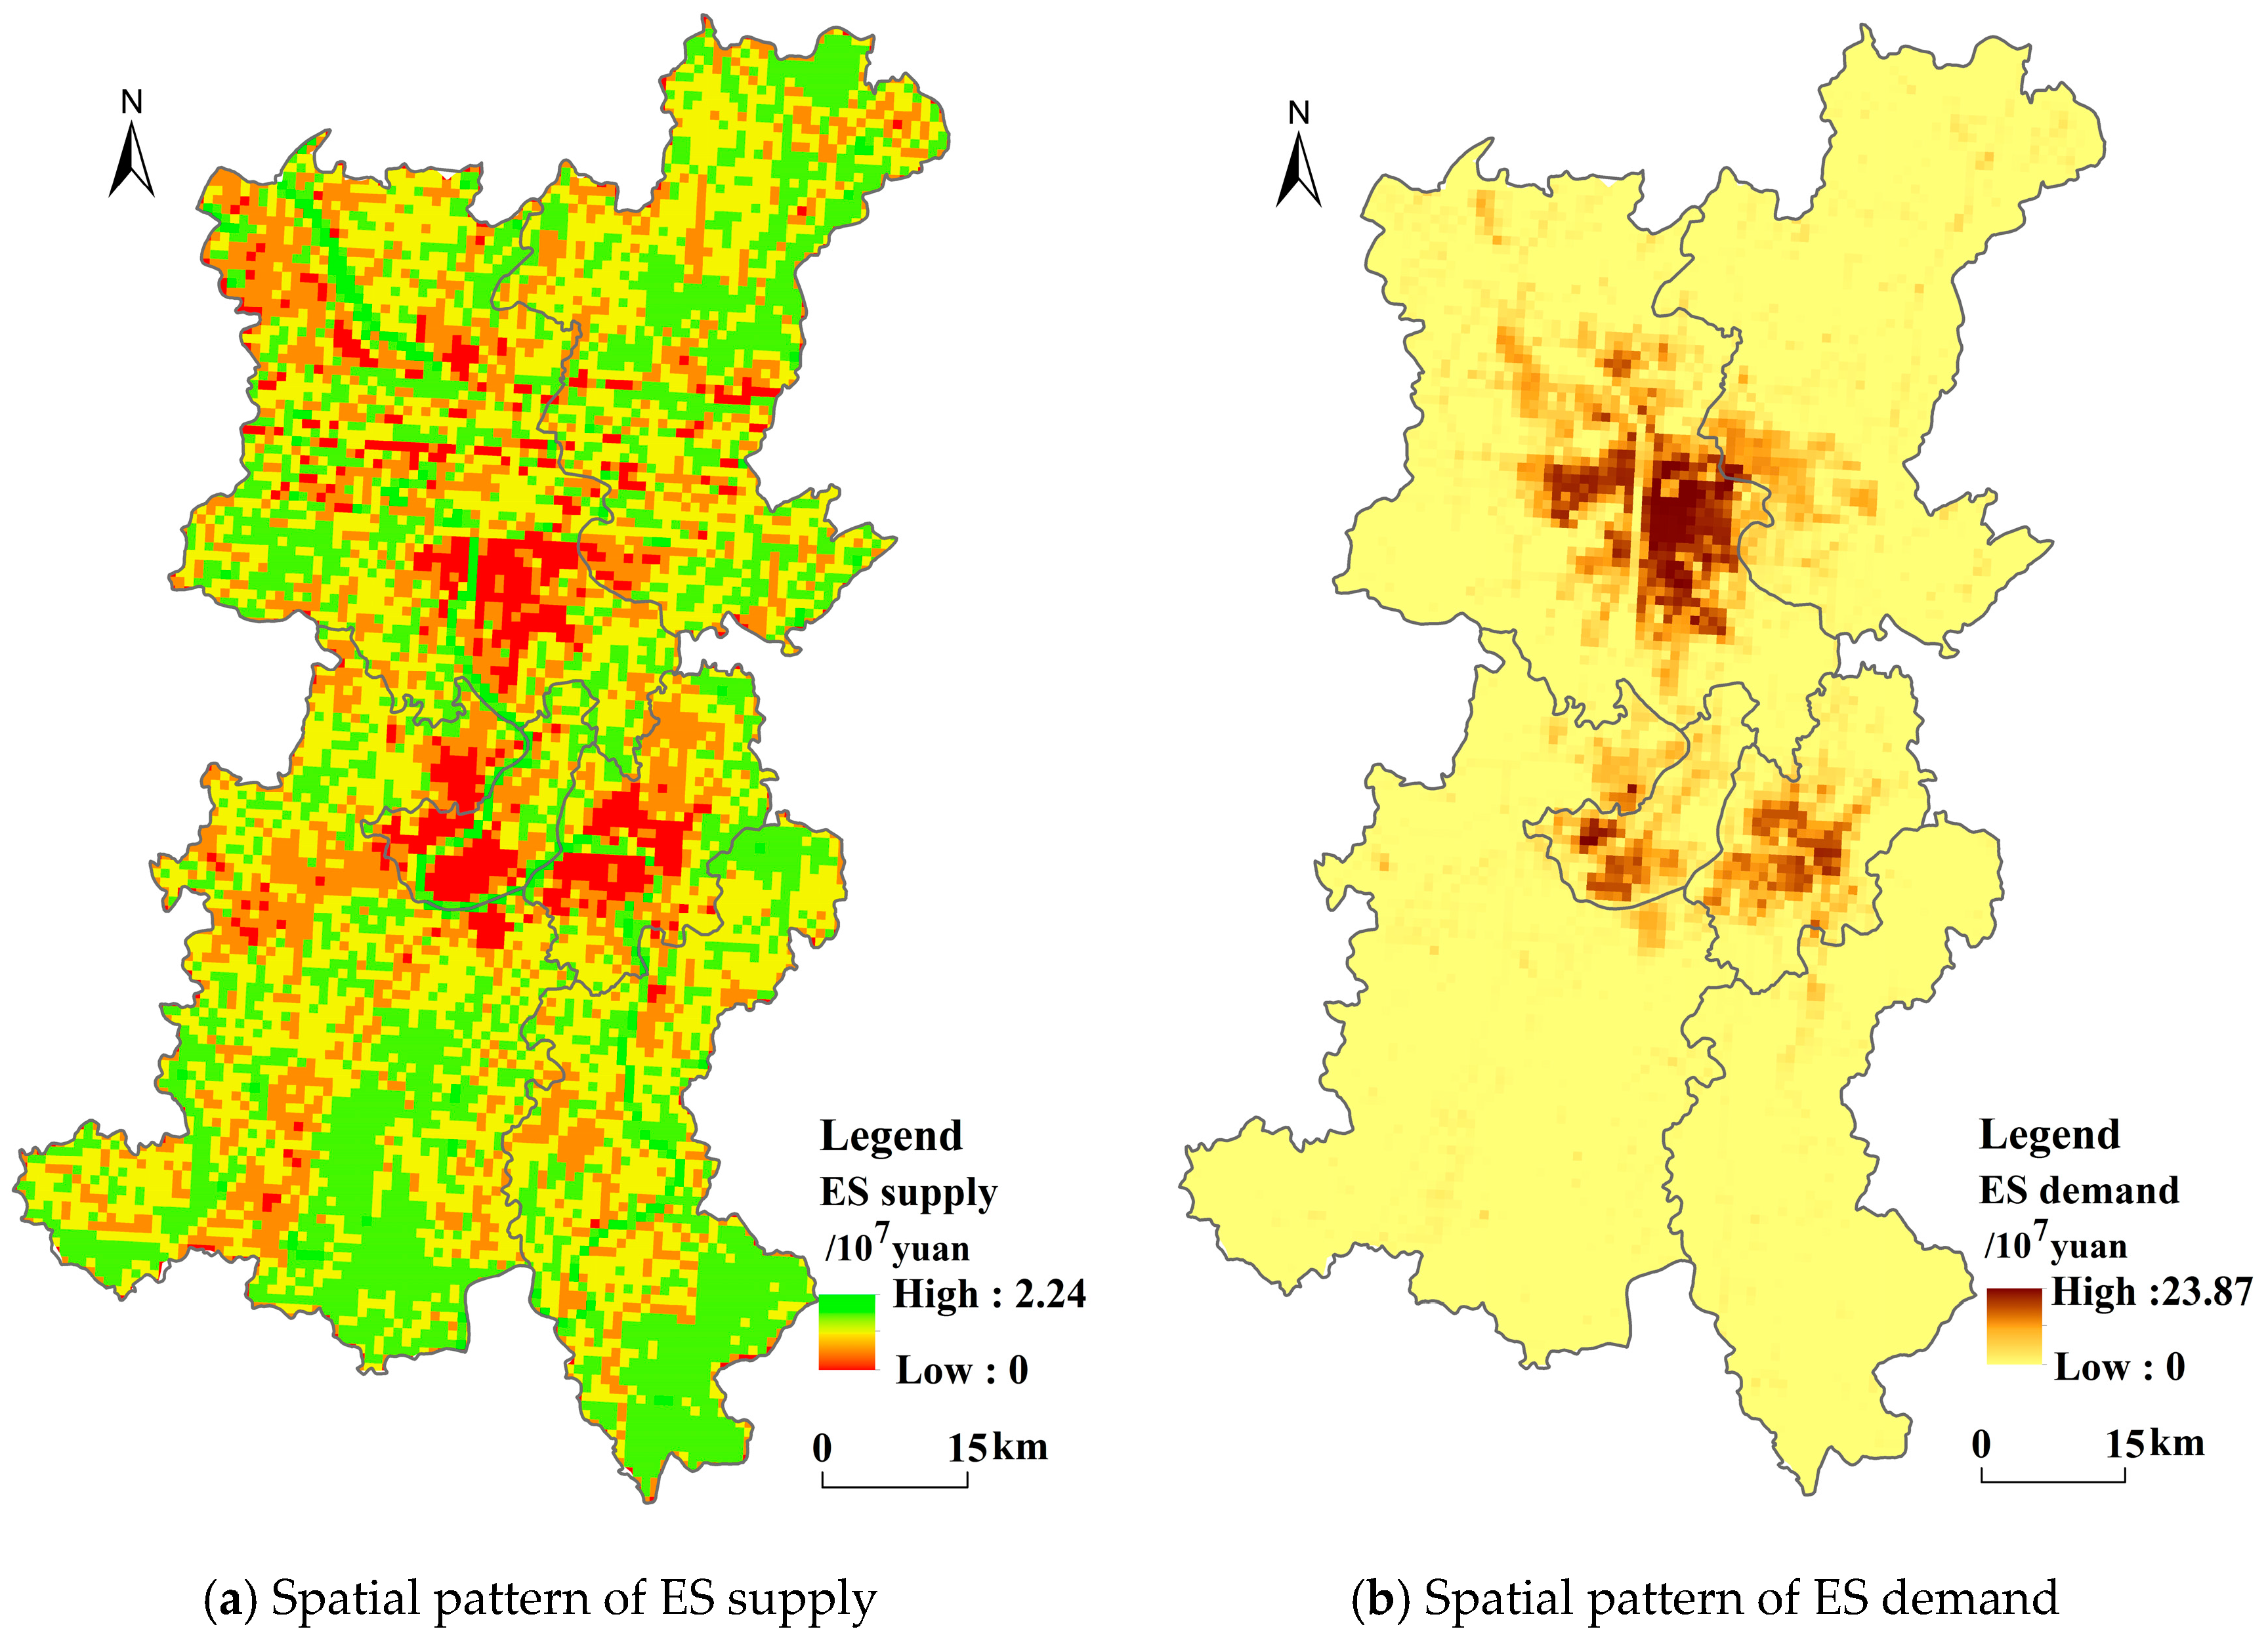
3.1. ES Supply and Demand Space Pattern

As for the spatial formation of ES supply (see Figure 3a), the spatial distribution of ES supply showed significant differences among the various administrative units inside the Changsha–Zhuzhou–Xiangtan urban agglomerations due to the differences in land-use structure and natural environment. The economic value of ES ranged from 0 to 2.24 × 10⁷ yuan. The high ES value areas were mainly concentrated on vegetated areas of Changsha County in the north, of Zhuzhou County in the southeast, and of Xiangtan County in the south. The low ES value areas were mainly located in the urban areas of Changsha City, Zhuzhou City, and Xiangtan City. Overall, the value of ES exhibited a “central-periphery” model in terms of spatial patterns and showed a radial trend that increases towards the periphery. This spatial distribution pattern was a reflection of the development model that had urbanization spreading from the center to the periphery and was indicative that the proportion of construction land was higher in the urban zones, and the ES value of construction land was 0. The value of ES in urban areas was low, while the value of ES in the surrounding counties was higher for vegetation and water areas. This suggests that the spatial distribution of ES had been completely affected by land-use type.
With regards to the demand for ES (see Figure 3b), the spatial distribution pattern of the ES demand for the Changsha–Zhuzhou–Xiangtan urban agglomeration corresponded to that of the urbanization level [39]. The region’s urban areas were clusters of high-value ES demand, exhibiting a spatial distribution that is decreasing from the urban zones to the surrounding areas. A regional difference in the demand for ES was observed, caused mainly by variations in growth factors such as population, economy, and infrastructure development. Specifically, urban agglomerations have significant advantages in terms of urban construction, development policies, and scale of development in urban areas, which promote economic growth, population clustering, and rapid land development. As a result, the demand for ecological services in the region has become high.

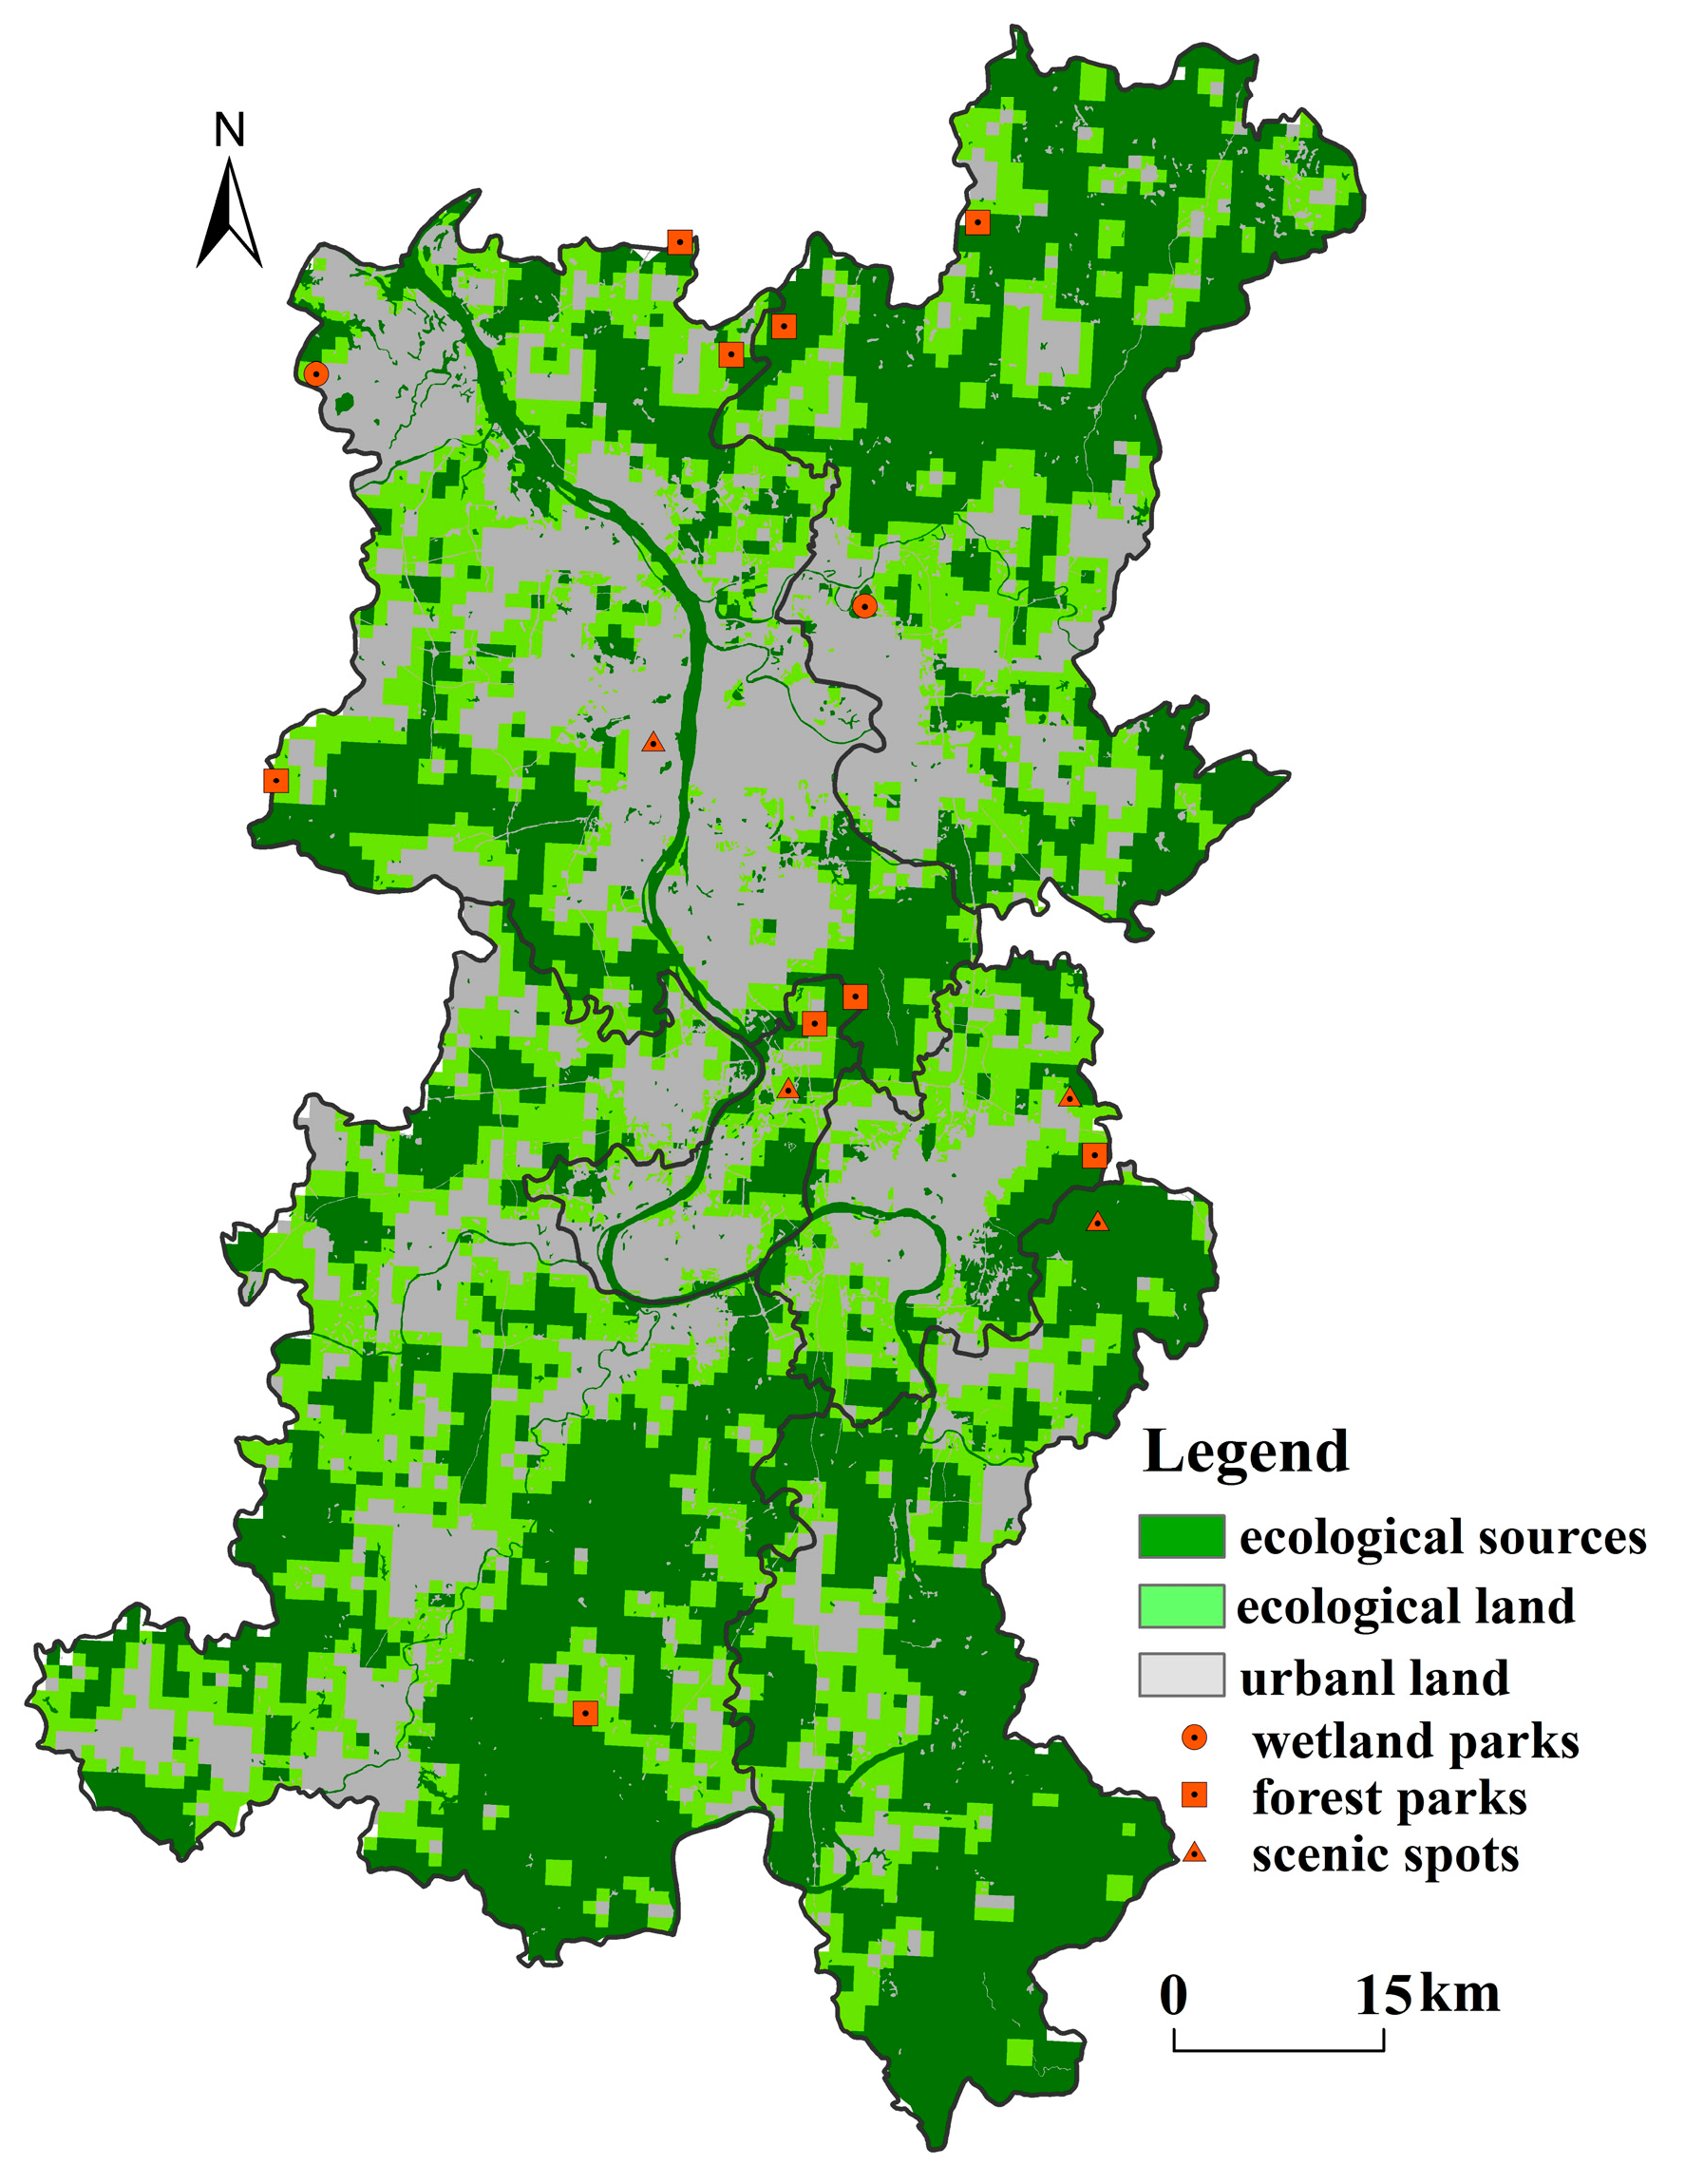
3.2. Ecological Sources

As shown by the distribution map of ecological sources in Figure 4, the areas with a high number of ecological sources were located in the northeast and the southeast, while the middle part had very few ecological sources. The central region (Changsha City, Zhuzhou City, Xiangtan City) had the smallest ecological source area, being the economic development center of the urban agglomeration. This area holds the highest degree of urbanization and is the most densely populated, which consequently constrains the number of ecological sources, except for the protected green heart zone. In the mountainous northeast and southeast, vegetation cover is high, and the ecological source area was large. Overall, the ecological source area of the whole urban agglomeration is 3686 km2, accounting for 56.12% of the total ecological land area and 42.72% of the urban area. In terms of the land-use type, the ecological sources were mainly found in the forest lands (3051 km2) and water areas (404 km2), which account for 93.74% of the entire area covered by ecological sources.

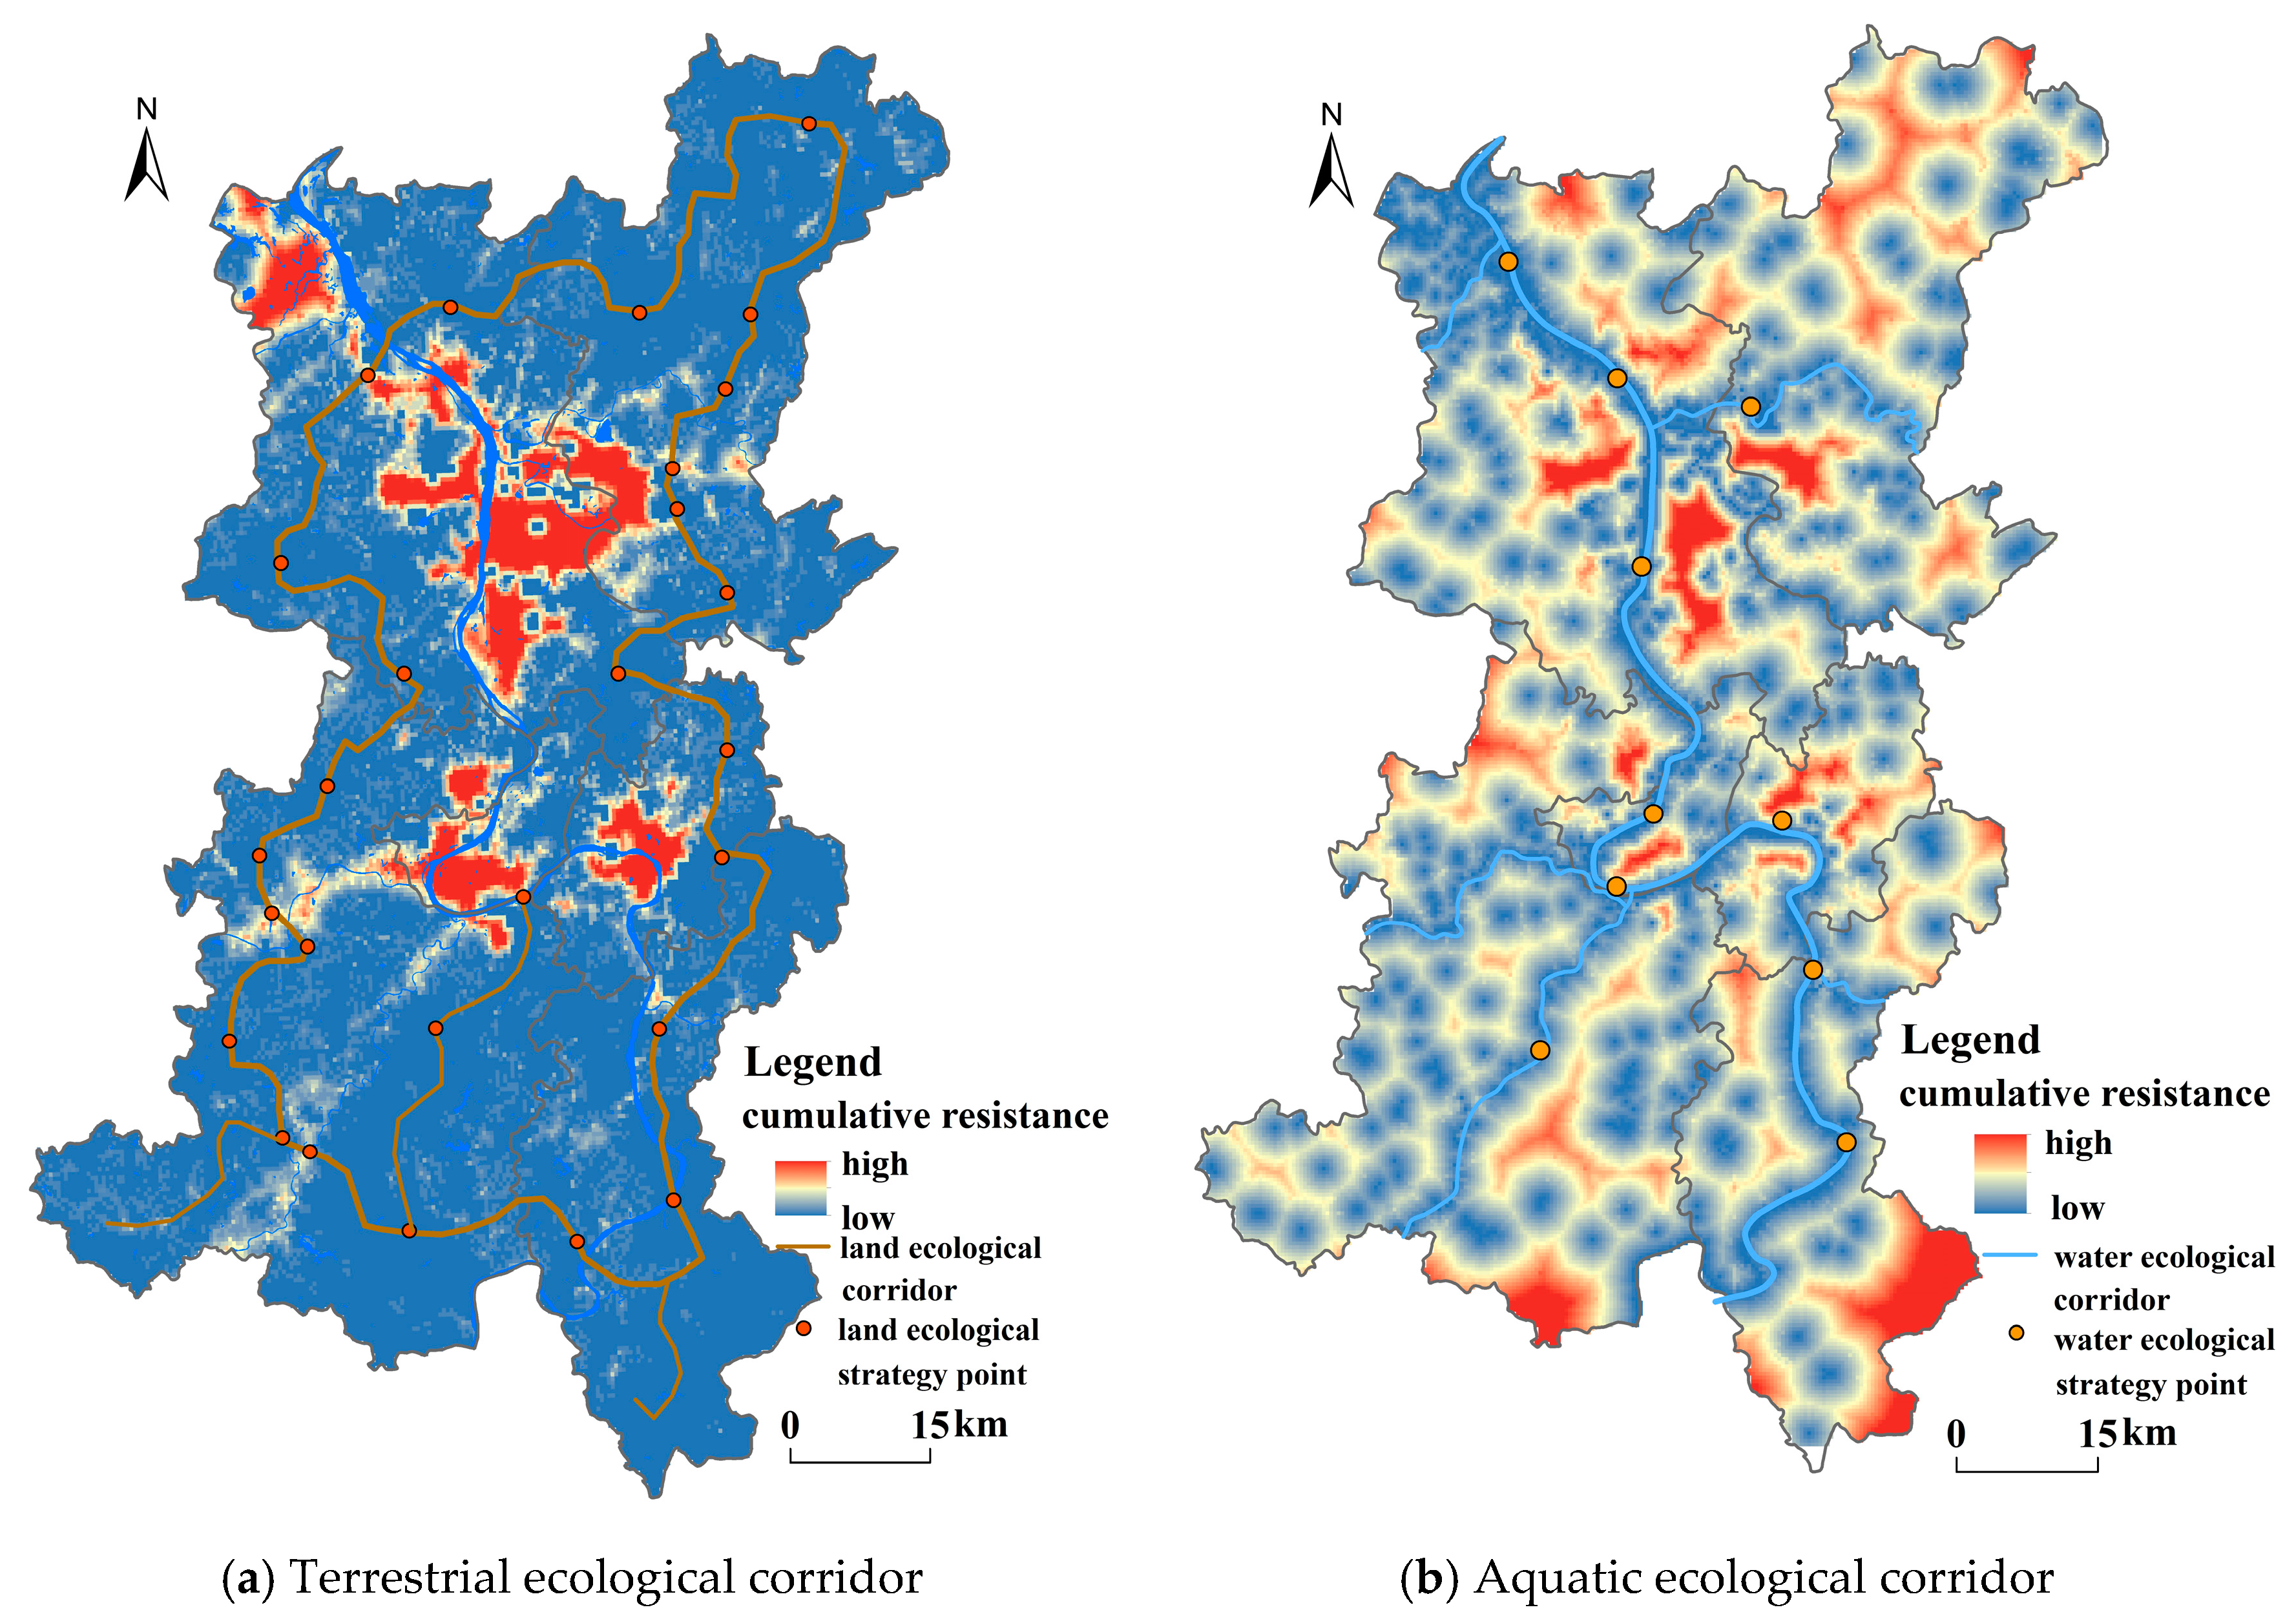
3.3. Ecological Corridors and Ecological Strategic Points

Two ecological corridors for both land and water were identified in the Changsha–Zhuzhou–Xiangtan urban agglomeration, as shown in Figure 5. The terrestrial ecological corridor was 504 km, while the aquatic ecological corridor was 366 km, for a total length of 870 km. The results showed that the average ecological resistance value for land was 16.88, and that the values were high at the urban centers and diminished towards the surrounding areas. There were 27 “strategic points” on the terrestrial ecological corridor, 17 of which were located in the peripheral areas of Changsha City, Zhuzhou City, and Xiangtan City. The high ecological resistance values in these places indicate that these areas are not conducive to wildlife mobility. In addition, 10 points were located in the periphery of ecological sources found in the northeast and south, indicating that movement of wildlife in these places is frequent. The average ecological resistance value for water areas was 43.31, and the regions with high ecological resistance values were mainly found in the Xiangjiang River Basin. The major tributaries and wetlands within the urban agglomeration were found to be connected with each other. Ten “strategic points” were identified along the aquatic ecological corridors, seven of which were located at the intersection of the urban construction land and the rivers running through the urban districts of the three cities. These included the Changsha integrated shipping hub, Xiangtan’s Zhubu Port, Xia Shesi Street, Zhuzhou’s Qingshuitang area, and other pollution control areas along the Xiangjiang River. These areas have serious pollution problems and high ecological resistance, which significantly hinder the movement of aquatic organisms.

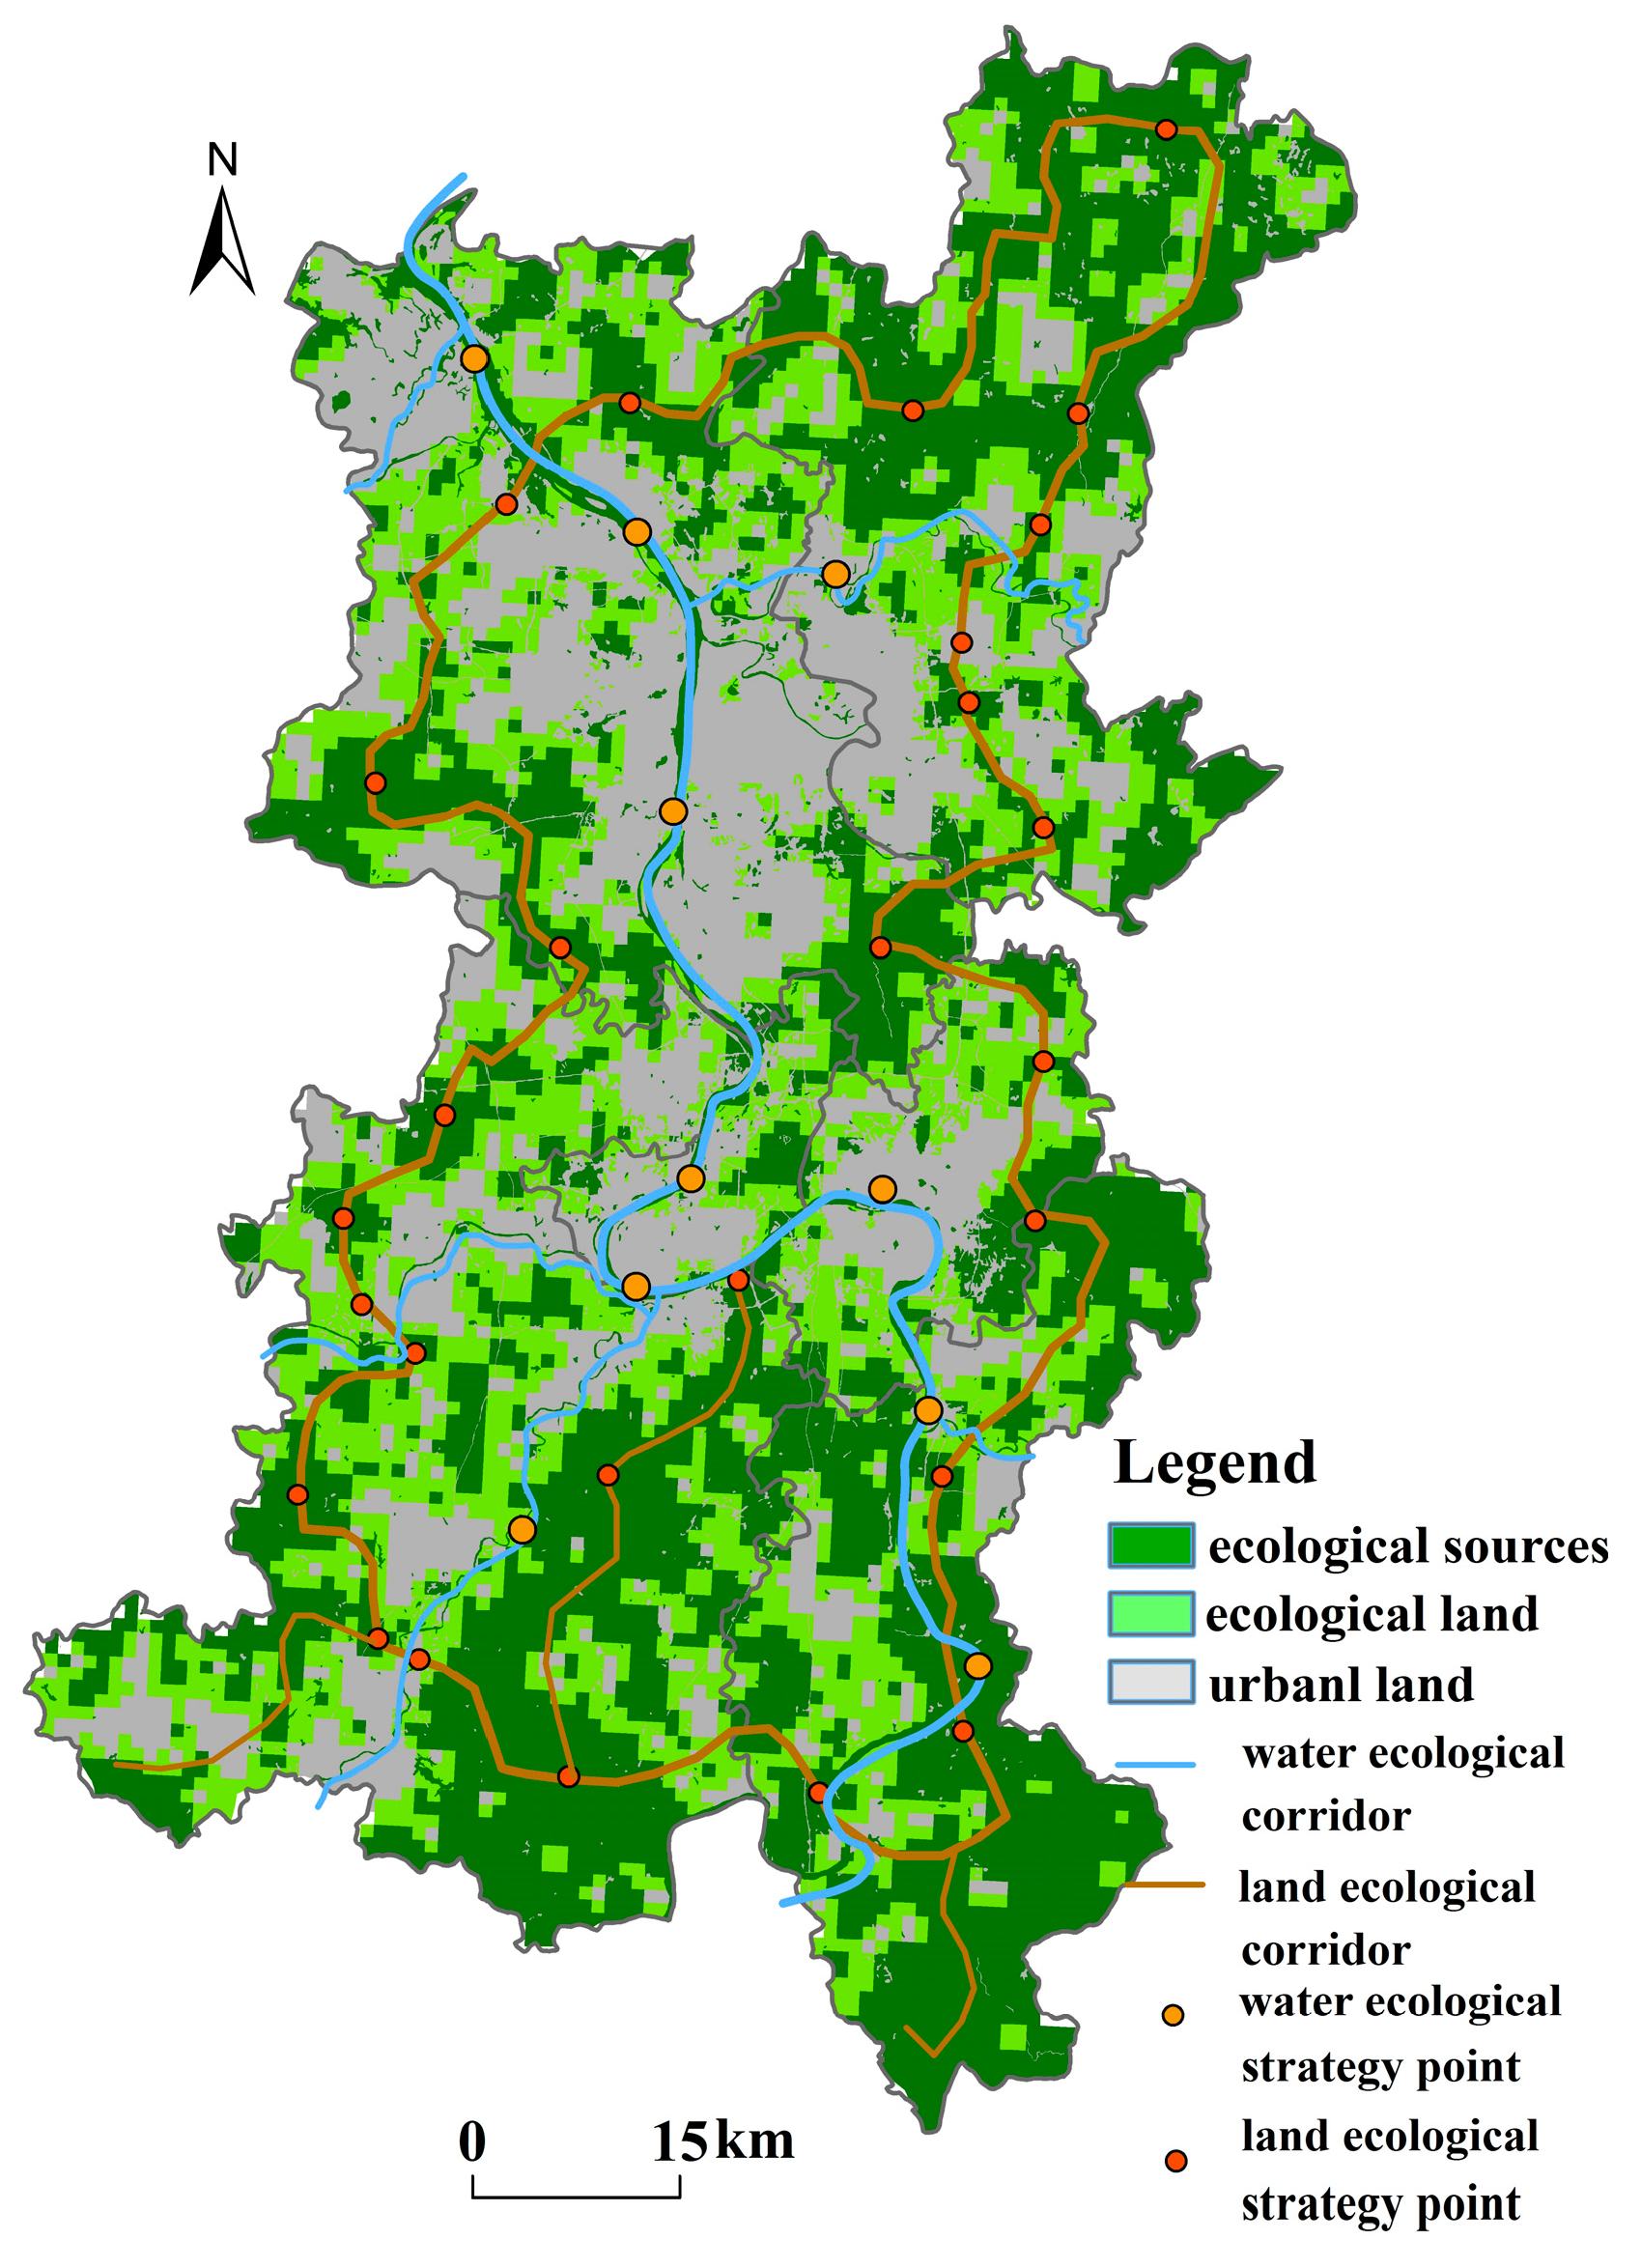
3.4. Ecological Security Pattern

As shown in Figure 6, the ecological sources of the Changsha–Zhuzhou–Xiangtan urban agglomerations were located mainly along the Xiangjiang River and its tributaries, the wetlands (e.g., Qianlong Lake and Songya Lake), and the mountain forests (e.g., Goose Mountain, Yingzhu Mountain, Mount Hei Mi, and North Mountain). These areas can be divided into seven groups based on their spatial distribution. The ecological corridor showed a spatial pattern of “two horizontal and three vertical” lines, with the terrestrial ecological corridor exhibiting a circular formation. The aquatic ecological corridor included the river system coursing throughout the region, which serves the path for biological movement and maintains connectivity between ecological organizations within the urban agglomeration. The ecological strategic points were mainly located at the periphery of the urban areas, the intersection between construction zones and ecological lands, and the periphery of vast ecological source areas found in the north and south. These critical regions require urgent environmental restoration to ensure seamlessness in ecological corridors and integrity in the ecological structure.

4. Discussion

4.1. Effectiveness of Constructing an ESP for Urban Agglomerations

Identifying and maintaining an ecological security landscape is critical to ensuring the integrity of regional ecosystem structures and processes. Previous studies have focused on the quantification of ecological importance to determine the spatial extent of ecological sources and the direction of ecological corridors [35,36]. This study proposed an ESP construction framework based on the integration of machine learning and MCR methods in the context of ES supply and demand. Through spatial superposition of 15 national (provincial) forest parks, wetland parks, and scenic spots in the urban agglomeration of the Hunan Ecological Protection Red Line, all these areas were found to be within the ESP generated in this study (see Figure 7). This validates the reliability of the proposed approach in this study.
The constructed ESP is shown in Figure 6. The ecological sources were mainly distributed in the waters and the mountain forests (e.g., Goose Mountain, Yingzhu Mountain, Mount Hei Mi, and North Mountain). These areas comprise high vegetation cover, abundant species, and higher ES values and are of considerable significance to the ecological security of urban agglomerations. The terrestrial ecological corridors were mainly located on the hilly areas with better vegetation cover. They had generally been segregated from construction areas with high human disturbance, which may contribute to its functions of bridging species migration and energy circulation among the source areas. The aquatic ecological corridor was considerably consistent with the location of the river, mainly because the resistance coefficient of the water body was set quite low, which is consistent with the results obtained in many studies [35,36]. This suggests that water bodies provide the most accessible network for species migration.

4.2. Supplement to the Relevant Urban Agglomeration Ecological Protection Planning

Urban agglomerations have explored the use of various conservation strategies, such as red lines for ecological protection [40] and ecological network [41]. Existing ecological protection plans may include determining ecological sources through land-use types and protected areas, or identifying the ecological sources based on the importance of ES, habitat quality, and landscape connectivity. Most traditional planning strategies are static and lack dynamic simulations of ecological processes (e.g., ecological land use and species migration). As a result, fundamental aspects of ESP, such as ecological corridors and ecological strategic points, have been overlooked in discussions on ecological protection. This study is based on the supply and demand equilibrium for ES and the historical transformation of ecological land use. Bayesian network machine learning is used to comprehensively analyze the supply of ES, ecosystem health, and ES demand. The ecological sources can be identified dynamically, while simultaneously extracting ecological corridors for water and land with ecological strategic points. ESP of urban agglomerations can provide an essential supplement in planning ecological red lines and ecological functional areas.
In 2014, China released its National New-type Urbanization Plan, which detailed a number of goals, including a 1% annual increase in urbanization rate and 60% urbanization by 2020 [42]. Since increased urbanization, coupled with population growth, equates to higher demands for construction land, protecting critical ecological lands from being converted into built-up spaces would be top-priority. The construction of the ESP would enable clear delineation of critical zones in urban regions, identify the areas that are ecological sources, and balance economic development with ecological protection, particularly in urban agglomerations. The ESP provides the spatial organization of “source-corridor-strategic point,” which focuses on optimizing the overall landscape of urban agglomerations and implements risk prevention and habitat protection from multiple perspectives, rather than isolated management of regional ecological elements. Overall, the ecosecurity scheme provides the necessary tools in supporting integrated macro-level planning, particularly for urban agglomerations.

4.3. Limitations of Research

The proposed framework in this study made use of ES parameters and machine learning in order to build ESP for urban agglomerations with higher accuracy and objectivity compared with existing methods. However, some limitations remain. For instance, setting critical thresholds would require a more in-depth understanding of a number of factors, including the adequate proportion of ecological sources over the study area, the appropriate width of the ecological corridors, and how to properly integrate the ESP at different scales. Also, significant differences may exist between ES valuations due to the complexities of land-use and land-cover dynamics [43]. The ES from comparable land-use types can differ from each other due to the complexity of the landscape structure [44] and varying effects of other ES functions (including groundwater quality and habitat integrity) [45]. Therefore, landscape patterns should also be considered in future ES assessments, coupled with the use of other ES assessment models, in order to overcome these limitations.
Climatic factors, such as rainfall and temperature, had been added to the machine learning model. The variance of the average rainfall was 0.58% and an average temperature of 0.49%, indicating that climatic factors are essential in affecting ecological sources. However, this study did not consider the impact of rainfall and temperature on ES. Existing studies have suggested that the impact of these meteorological parameters on ES is nonlinear, or could be extensive [46,47,48]. For future studies, developing approaches that would incorporate climate factors into the assessment of ES supply and demand would be worth exploring.

5. Conclusions

Some developed countries (e.g., Sweden, England, and Finland) possess high levels of urbanization, low population density, and often prioritize the conservation and protection of natural ecosystems. Conversely, natural environments in developing countries are often under pressure from human interference, mainly as a result of rapid urbanization. Only by shifting towards ecological bottom-line thinking can a win–win situation be achieved between environmental protection and economic development. Using the relationship between supply and demand of ES, this study employed machine learning models, minimum cumulative resistance models, and circuit theory to identify the spatial extent of ecological sources, ecological corridors, and strategic points. The results of this study provide new insights into developing ESP, particularly for urban agglomerations. The main conclusions are as follows:
  • Areas with high supply of ecosystem services (ES) were concentrated in the vegetation areas in the north and south of the urban agglomeration, while the high-demand areas of ES were concentrated in the built-up area at the center. Due to the differential impacts of developing factors such as urban construction, development policies, and development scale, the relationship between supply and demand of ES in urban agglomerations can demonstrate significant spatial decoupling, resulting in degradation in areas with high demand of ES.
  • The simulation accuracy of the machine learning model reached 0.98, which suggests that the framework is suitable in simulating ecological sources for urban agglomeration. The ecological sources in the region had an area of 3686 km2, which accounted for 42.72% of the urban agglomeration and were mainly located on forestlands and water areas.
  • The total length of the ecological corridor of the urban agglomeration was 870 km, with a 504 km terrestrial ecological corridor and a 366 km aquatic ecological corridor. The region’s ecological corridor presented an overall spatial pattern of “two horizontal and three vertical.” There were 37 ecological restoration sites, mainly located at the margins of the built-up area and along the intersections of construction land and ecological land.

Author Contributions

X.O. and X.Z. conceived and designed the research; X.O. drafted the manuscript and prepared figures and revised the manuscript; Z.W. discussed the results. All authors read and approved the final manuscript.

Funding

This research was funded by the “Major Program of National Social Science Foundation of China” (NO. 18ZDA040) and “The Open Topic of Hunan Key Laboratory of Land Resources Evaluation and Utilization” (NO. SYS-ZX-201902).

Acknowledgments

We would like to thank Sui Li (a researcher in Shenyang Jianzhu Univ.) for his comments on this research. We sincerely appreciate the four anonymous reviewers’ constructive comments and the editor’s efforts in improving this manuscript. Special thanks to the professional English editing service from EditX.

Conflicts of Interest

The authors declare no conflict of interest.

References

  1. Larson, K.L.; Nelson, K.C.; Samples, S.R.; Hall, S.J.; Bettez, N.; Cavender-Bares, J.; Groffman, P.M.; Grove, M.; Heffernan, J.B.; Hobbie, S.E.; et al. Ecosystem services in managing residential landscapes: priorities, value dimensions, and cross-regional patterns. Urban Ecosyst. 2016, 19, 95–113. [Google Scholar] [CrossRef]
  2. Li, H.L.; Li, D.H.; Li, T.; Qiao, Q.; Yang, J.; Zhang, H.M. Application of least-cost path model to identify a giant panda dispersal corridor network after the Wenchuan earthquake—Case study of Wolong Nature Reserve in China. Ecol. Model. 2010, 221, 944–952. [Google Scholar] [CrossRef]
  3. Su, S.L.; Li, D.; Yu, X.; Zhang, Z.H.; Zhang, Q.; Xiao, R.; Zhi, J.J.; Wu, J.P. Assessing land ecological security in Shanghai (China) based on catastrophe theory. Stoch. Environ. Res. Risk A 2011, 25, 737–746. [Google Scholar] [CrossRef]
  4. Peng, J.; Zhao, H.J.; Liu, Y.X.; Wu, J.S. Research progress and prospect on regional ecological security pattern construction. Geogr. Res. 2017, 36, 407–419. [Google Scholar]
  5. Fang, C.L. Important progress and prospects of China’s urbanization and urban agglomeration in the past 40 years of reform and opening-up. Econ. Geogr. 2018, 38, 1–9. [Google Scholar]
  6. Fang, C.L.; Wang, Z.B.; Ma, H.T. The theoretical cognition of the development law of China’s urban agglomeration and academic contribution. Acta Geogr. Sin. 2018, 73, 651–665. [Google Scholar]
  7. Su, Y.; Chen, X.; Liao, J.; Zhang, H.; Wang, C.; Ye, Y.; Wang, Y. Modeling the optimal ecological security pattern for guiding the urban constructed land expansions. Urban. For. Urban. Gree. 2016, 19, 35–46. [Google Scholar] [CrossRef]
  8. Teng, M.; Wu, C.; Zhou, Z.; Lord, E.; Zheng, Z. Multipurpose greenway planning for changing cities: A framework integrating priorities and a least-cost path model. Landsc. Urban. Plan. 2011, 103, 1–14. [Google Scholar] [CrossRef]
  9. Long, Y.; Han, H.; Lai, S.; Mao, Q. Urban growth boundaries of the Beijing Metropolitan Area: Comparison of simulation and artwork. Cities 2013, 31, 337–348. [Google Scholar] [CrossRef]
  10. Rockstrom, J.; Steffen, W.; Noone, K.; Persson, A.; Chapin, F.S.I.; Lambin, E.; Lenton, T.M.; Scheffer, M.; Folke, C.; Schellnhuber, H.J.; et al. Planetary boundaries: Exploring the safe operating space for humanity. Ecol. Soc. 2009, 14, 292–325. [Google Scholar] [CrossRef]
  11. Zhao, X.Q.; Xu, X.H. Research on landscape ecological security pattern in a Eucalyptus introduced region based on biodiversity conservation. Russ. J. Ecol. 2015, 46, 59–70. [Google Scholar] [CrossRef]
  12. Aminzadeh, B.; Khansefid, M. A case study of urban ecological networks and a sustainable city: Tehran’s metropolitan area. Urban. Ecosyst. 2010, 13, 23–36. [Google Scholar] [CrossRef]
  13. Vergnes, A.; Kerbiriou, C.; Clergeau, P. Ecological corridors also operate in an urban matrix: A test case with garden shrews. Urban. Ecosys. 2013, 16, 511–525. [Google Scholar] [CrossRef]
  14. Lin, Y.; Lin, W.; Wang, Y.; Lien, W.; Huang, T.; Hsu, C.; Schmeller, D.S.; Crossman, N.D. Systematically designating conservation areas for protecting habitat quality and multiple ecosystem services. Environ. Modell. Softw. 2017, 90, 126–146. [Google Scholar] [CrossRef]
  15. Mandle, L.; Douglass, J.; Lozano, J.S.; Sharp, R.P.; Vogl, A.L.; Denu, D.; Walschburger, T.; Tanis, H. OPAL: An open-source software tool for integrating biodiversity and ecosystem services into impact assessment and mitigation decisions. Environ. Modell. Softw. 2016, 84, 121–133. [Google Scholar] [CrossRef]
  16. Pierik, M.; Dell’Acqua, M.; Confalonieri, R.; Bocchi, S.; Gomarasca, S. Designing ecological corridors in a fragmented landscape: A fuzzy approach to circuit connectivity analysis. Ecol. Indic. 2016, 67, 807–820. [Google Scholar] [CrossRef]
  17. Rouget, M.; Cowling, R.; Lombard, A.; Knight, A.; Kerley, G. Designing Large-Scale Conservation Corridors for Pattern and Process. Conserv. Biol. 2006, 20, 549–561. [Google Scholar]
  18. Parks, S.; McKelvey, K.; Schwartz, M. Effects of Weighting Schemes on the Identification of Wildlife Corridors Generated with Least-Cost Methods. Conserv. Biol. 2013, 27, 145–154. [Google Scholar] [CrossRef]
  19. Bras, R.; Cerdeira, J.; Alagador, D.; Araújo, M. Linking habitats for multiple species. Environ. Modell. Softw. 2013, 40, 336–339. [Google Scholar] [CrossRef]
  20. Kong, F.; Yin, H.; Nakagoshi, N.; Zong, Y. Urban green space network development for biodiversity conservation: Identification based on graph theory and gravity modeling. Landsc. Urban. Plan. 2010, 95, 1–27. [Google Scholar] [CrossRef]
  21. Hepcan, Ç.C.; Özkan, M.B. Establishing ecological networks for habitat conservation in the case of Çeşme-Urla Peninsula, Turkey. Environ. Monit. Assess. 2011, 174, 157–170. [Google Scholar] [CrossRef] [PubMed]
  22. Wang, Y.; Yang, K.; Bridgman, C.; Lin, L. Habitat suitability modeling to correlate gene flow with landscape connectivity. Landscape Ecol. 2008, 23, 989–1000. [Google Scholar]
  23. Zhang, L.; Peng, J.; Liu, Y.; Wu, J. Coupling ecosystem services supply and human ecological demand to identify landscape ecological security pattern: A case study in Beijing-Tianjin-Hebei region, China. Urban. Ecosyst. 2017, 20, 701–714. [Google Scholar] [CrossRef]
  24. Xiong, Y.; Sun, W.J.; Wang, M.; Peng, Z.L.; Cui, Z.Z. Spatio-Temporal matching between water resource and economic development elements in Changsha-Zhuzhou-Xiangtan urban agglomeration. Econ. Geogr. 2019, 39, 88–95. [Google Scholar]
  25. Zhou, G.H.; Chen, L.; Tang, C.L.; He, Y.H.; Ran, Z. Research progress and prospects on Changsha-Zhuzhou-Xiangtan urban agglomeration. Econo Geogr. 2018, 38, 52–61. [Google Scholar]
  26. He, Y.H.; Tang, C.L.; Zhou, G.H.; He, S.; Qiu, Y.H.; Shi, L.; Zhang, H.Z. The analysis of spatial conflict measurement in fast urbanization region from the perspective of geography: A case study of Changsha-Zhuzhou-Xiangtan Urban agglomeration. J. Nat. Resour. 2014, 29, 1660–1674. [Google Scholar]
  27. He, Y.H.; Zhou, G.H. Delimination of the Changsha-Zhuzhou-Xiangtan city-and-town concentrated area. Trop. Geogr. 2007, 27, 521–525, 547. [Google Scholar]
  28. Xie, G.D.; Zhang, C.X.; Zhang, C.S.; Xiao, Y.; Lu, C.X. The value of ecosystem services in China. Resour. Sci. 2015, 37, 1740–1746. [Google Scholar]
  29. Jing, Y.C.; Chen, L.D.; Sun, R.H. A theoretical research framework for ecological security pattern construction based on ecosystem services supply and demand. Acta Ecol. Sin. 2018, 38, 4121–4131. [Google Scholar]
  30. Tian, G.; Qiao, Z. Assessing the impact of the urbanization process on net primary productivity in China in 1989–2000. Environ. Pollut. 2014, 184, 320–326. [Google Scholar] [CrossRef]
  31. Frondoni, R.; Mollo, B.; Capotorti, G. A landscape analysis of land cover change in the Municipality of Rome (Italy): Spatio-temporal characteristics and ecological implications of land cover transitions from 1954 to 2001. Landsc. Urban. Plan. 2011, 100, 117–128. [Google Scholar] [CrossRef]
  32. Huang, L.Y.; Liu, S.H.; Fang, Y.; Zou, L. Construction of Wuhan’s ecological security pattern under the “quality-risk-requirement” framework. Chin. J. App. Ecol. 2019, 30, 615–626. [Google Scholar]
  33. Peng, J.; Zhao, M.; Guo, X.; Pan, Y.; Liu, Y. Spatial-temporal dynamics and associated driving forces of urban ecological land: A case study in Shenzhen City, China. Habitat Int. 2017, 60, 81–90. [Google Scholar] [CrossRef]
  34. Pantus, F.J.; Dennison, W.C. Quantifying and Evaluating Ecosystem Health: A Case Study from Moreton Bay, Australia. Environ. Manag. 2005, 36, 757–771. [Google Scholar] [CrossRef] [PubMed]
  35. Li, B.; He, J.H.; Qu, S.; Huang, J.L.; Li, Y.H. A method of delimiting urban ecological red line protection area based on Bayesian network. Acta Ecol. Sin. 2018, 38, 800–811. [Google Scholar]
  36. Chen, X.; Peng, J.; Liu, Y.X.; Yang, Y.; Li, G.C. Constructing ecological security patterns in Yunfu City based on the framework of importance-sensitivity-connectivity. Geogr. Res. 2017, 36, 471–484. [Google Scholar]
  37. Peng, J.; Pan, Y.; Liu, Y.; Zhao, H.; Wang, Y. Linking ecological degradation risk to identify ecological security patterns in a rapidly urbanizing landscape. Habitat Int. 2018, 71, 110–124. [Google Scholar] [CrossRef]
  38. Peng, J.; Yang, Y.; Liu, Y.; Hu, Y.; Du, Y.; Meersmans, J.; Qiu, S. Linking ecosystem services and circuit theory to identify ecological security patterns. Sci. Total Environ. 2018, 644, 781–790. [Google Scholar] [CrossRef]
  39. Ouyang, X.; Zhu, X.; He, Q.H. Spatial interaction between urbanisation and ecosystem services: A case study in Changsha-Zhuzhou-Xiangtan urban agglomeration. Acta Ecol. Sin. 2019, 39, 1–12. [Google Scholar]
  40. Lin, J.; Li, X. Large-scale ecological red line planning in urban agglomerations using a semi-automatic intelligent zoning method. Sust. Cit. Soc. 2019, 46, 101410. [Google Scholar] [CrossRef]
  41. Zhang, Y.; Li, Y.; Zheng, H. Ecological network analysis of energy metabolism in the Beijing-Tianjin-Hebei (Jing-Jin-Ji) urban agglomeration. Ecol. Model. 2017, 351, 51–62. [Google Scholar] [CrossRef]
  42. Bai, X.; Shi, P.; Liu, Y.S. Society: Realizing China’s urban dream. Nature 2014, 509, 158–160. [Google Scholar] [CrossRef] [PubMed]
  43. Kindu, M.; Schneider, T.; Teketay, D.; Knoke, T. Changes of ecosystem service values in response to land use/land cover dynamics in Munessa–Shashemene landscape of the Ethiopian highlands. Sci. Total Environ. 2016, 547, 137–147. [Google Scholar] [CrossRef] [PubMed]
  44. Pacheco, F.A.L.; Varandas, S.G.P.; Sanches Fernandes, L.F.; Valle Junior, R.F. Soil losses in rural watersheds with environmental land use conflicts. Sci. Total Environ. 2014, 485–486, 110–120. [Google Scholar] [CrossRef]
  45. Valle Junior, R.F.; Varandas, S.G.P.; Pacheco, F.A.L.; Pereira, V.R.; Santos, C.F.; Cortes, R.M.V.; Sanches Fernandes, L.F. Impacts of land use conflicts on riverine ecosystems. Land Use Policy 2015, 43, 48–62. [Google Scholar] [CrossRef]
  46. Zhang, F.; Yushanjiang, A.; Jing, Y. Assessing and predicting changes of the ecosystem service values based on land use/cover change in Ebinur Lake Wetland National Nature Reserve, Xinjiang, China. Sci. Total Environ. 2019, 656, 1133–1144. [Google Scholar] [CrossRef]
  47. Maragno, D.; Gaglio, M.; Robbi, M.; Appiotti, F.; Fano, E.A.; Gissi, E. Fine-scale analysis of urban flooding reduction from green infrastructure: An ecosystem services approach for the management of water flows. Ecol. Model. 2018, 386, 1–10. [Google Scholar] [CrossRef]
  48. Gaglio, M.; Aschonitis, V.; Pieretti, L.; Santos, L.; Gissi, E.; Castaldelli, G.; Fano, E.A. Modelling past, present and future Ecosystem Services supply in a protected floodplain under land use and climate changes. Ecol. Model. 2019, 403, 23–34. [Google Scholar] [CrossRef]
Figure 1. Location of the study area.
Sustainability 11 06416 g001
Figure 2. The methodology framework of the study.
Sustainability 11 06416 g002
Figure 3. The spatial pattern of supply and demand for ecological services.
Sustainability 11 06416 g003
Figure 4. The spatial pattern of the ecological sources.
Sustainability 11 06416 g004
Figure 5. The spatial pattern of the ecological corridors.
Sustainability 11 06416 g005
Figure 6. Ecological security pattern.
Sustainability 11 06416 g006
Figure 7. Ecological reserve.
Sustainability 11 06416 g007
Table 1. Explanation of the key ecological security pattern indicators.
Key IndicatorsDefinitionExplanation
Ecosystem service (ES) supply E S V k = A k × V C k E S V k is the ecosystem service value (ESV) of each land-use type (k). A k is the area (in hectares) for each land-use type. V C k is the value parameter (in Yuan/hectare) for land-use types.
Ecosystem organization E O = 0.35 × L C + 0.35 × L H + 0.3 × I C E O is the structural stability of ecosystems, determined by landscape patterns. L C is the landscape connectivity. L H is landscape heterogeneity. I C is the patch connectivity of important land (e.g., forest, wetland).
Ecosystem vitality N P P Ecosystem vitality is the ecosystem’s metabolism or primary productivity. The net primary production (NPP) is used to assess ecosystem vigor, which has been proven useful in assessing the primary productivity of ecosystems [30].
ES demand L D I = C o n × lg ( P O P D ) × lg ( G D P D ) L D I is the demand for ESV. C o n is the proportion of developed land. P O P D is the population density. G D P D is the economic density.
Table 2. Ecological sources identification indicator system and sensitivity to target variable.
Variable NameGrade CodeVariance Reduction/%
1234
ES supply0–0.40.4–0.70.7–1.0≥1.012.3
Ecosystem organization0–0.220.22–0.270.27–0.31≥0.3112
Ecosystem vitality<0.460.46–0.660.66–0.75≥0.7511.07
Elevation<7070–150150–250≥2502.03
slope0–55–1010–15≥152.27
Distance to the road<50005000–10,00010,000–20,000≥20,0000.0707
Distance to water body<40004000–80008000–15,000≥15,0003.27
Distance to construction land<750750–19501950–4500≥45000.77
Population density<14501450–45004500–9000≥90000.723
Gross domestic product (GDP) density<20,00020,000–60,00060,000–150,000≥150,0000.554
Severity of water erosion123 0.025
Soil sand content<3636–4344–53≥540.315
Soil particle content<2121–2829–34≥350.281
Soil clay content<2626–3233–39≥400.252
Average rainfall<16001600–16701670–17001700–17800.58
Average temperature<1818–18.518.5–18.8≥18.80.49
ES demand<22–77–14≥140.74
Ecological landYes (1)No (0)

