Article

A Geospatial Approach to Sustainable Urban Planning: Lessons for Morogoro Municipal Council, Tanzania

1
State Key Laboratory for Information Engineering in Surveying, Mapping and Remote Sensing, Wuhan University, Wuhan 430079, China
2
Department of Mathematics Informatics and Computational Science, Solomon Mahlangu College of Science and Education, Sokoine University of Agriculture, Morogoro P.O. Box 3038, Tanzania
3
School of Remote Sensing and Information Engineering, Wuhan University, 129 Luoyu Road, Wuhan 430079, China
4
Centre for Sustainability and Resilient Infrastructure and Communities (SaRIC), London South Bank University, London SE1 0AA, UK
5
Cities Research Institute and School of Environment and Science, Griffith University, Brisbane, QLD 4111, Australia
*
Author to whom correspondence should be addressed.
Sustainability 2019, 11(22), 6508; https://0-doi-org.brum.beds.ac.uk/10.3390/su11226508
Submission received: 9 October 2019 / Revised: 1 November 2019 / Accepted: 12 November 2019 / Published: 19 November 2019
(This article belongs to the Special Issue Smart Urban Planning and Land Management)

Abstract

:
Sustainable urban planning is essential in mediating the natural and built environments globally, yet, there is little progress as regards its attainment in developing countries. Rapid and unplanned urbanization continue to threaten the sustainability of many cities in Africa. By selecting Morogoro Municipal Council (MMC) in Tanzania as an example, this study applied well-known remote sensing techniques to understand the dynamics of urban growth and the implications for sustainable urban planning. The study analyzes spatio-temporal characteristics for eighteen years (2000–2018) based on urban land density using gradient and grid-based analysis to further examine land use and urban land density nexus. The results indicate declining urban land densities with distance to the city center, indicating a less compact and fragmented development at the urban fringes; and northward development with limited development to the south of MCC. The knowledge and understanding of the patterns of spatio-temporal conditions, land use planning, and management interventions in MMC are necessary for addressing the inadequacies associated with rapid urbanization within the study area. On this basis, we propose a shift from the modernist to the communicative planning strategy that strongly integrates the urban social, economic, and environmental imperatives, while being adaptable to evolving realities. This plan should also aim to curtail urban sprawl and create a viable city system and economically prosperous city structure for MMC.

1. Introduction

Cities have long emerged as engines of economic growth and centers of development. Today, cities are centers for education, employment, innovation, technological transfer, and ready market for manufactured goods and agricultural products [1]. In developing countries, this is even more prominent, given that limited resources and poor governance structures [2,3,4] have resulted in governments focusing on providing infrastructure in cities at the expense and neglect of smaller towns and rural areas. This investment tends to accelerate countryside to urban migration, in search of perceived employment and economic opportunities in cities. However, high population growth in cities places enormous stress on natural resources and imposes “ecological footprints” on urban areas [5,6,7,8,9] as the growth creates an outward (mostly radial or semi-radial) form. Generally, the outward expansion of cities results in changes in land use with extensive loss of prime agricultural lands for residential, commercial, and other urban-related uses [4,10,11,12] in many cases, without recourse to laid-down planning guidelines [13]. Since urbanization and city expansion are inevitable [8,13,14,15], it is important for cities to continually improve their capacities to cope with population growth [16,17,18] which triggers city expansion. Therefore, planning and land use policies are becoming even more crucial tools required for the mitigation, control, and management of the magnitude, dimension, and pattern of urban growth in cities, both in developed and developing countries.
Essentially, land use planning seeks to achieve sustainability through orderly physical development that culminates in an environment that is functional and livable. It is also a process of examining different land use options; deliberate attempts to alter land use form for the desired purpose, be it aesthetics, convenience, harmony, human and animal health and safety, etc. [5]. Effective land use is, therefore, considered important in addressing the needs of people, and also to control externalities [19].
Tanzania is currently undergoing an urban transformation which, by 2050, is estimated to consist of increases in its urban population from less than 15 million people in 2012 to more than 60 million people [20,21]. Tanzania is, thus, set to become the ninth largest contributor to the global urban population increase behind Asia (India, China, Indonesia) and Africa (Nigeria and the Democratic Republic of the Congo) [22,23,24]. It is obviously clear that there is an urgent need to reconsider planning, not only for basic urban infrastructure and services, but also for sustainable land use. Indeed, this is in tandem with the United Nations New Urban Agenda, which seeks to revolutionize the way in which cities are planned and governed, with the aim of achieving sustainable urban growth—a requirement for inclusive prosperity. This paper seeks to contribute to the body of knowledge required to support sustainable urbanization efforts if cities in Tanzania are to realize the Sustainable Development Goals (SDGs), commitments made at the COP 21 in Paris to reduce emissions, and New Urban Agenda, agreements to which Tanzania is a signatory [25,26].
Tanzania’s urban population has been on an upward trajectory in recent years. This increasing population density associated with urban growth would offer three main opportunities. The first is accommodating infrastructure and services to achieve scale economies, whereby population density lower the capital costs [27,28]. The second is the necessary accompaniment to land use transformation, whereby labor moves from agrarian to industry and services. The third is the clustering of businesses and workforces in urban areas, which can produce cluster economies, whereby specialized supply chains, services, and labor develop in an area to serve an industry, thereby reducing production costs, stimulating innovation, and encouraging specialization [29,30,31]. Nonetheless, it is important to note that there are many challenges thrown up by rapid urbanization in Tanzania. Worrall et al. [32] suggested the 3C model (compact growth, connected infrastructure, and coordinated governance) for cities in Tanzania, one of which dwells largely on physical planning and land use policies.
As the sixth largest city in Tanzania, Morogoro has experienced rapid population expansion and spatial sprawl over the last two decades. Thus, the general goal of this paper was to (1) examine the extent, rate, and pattern of urbanization in Morogoro Municipal Council (MMC); and (2) to ascertain a planning approach that can curtail sprawl and control and manage rapid urbanization within the city. To achieve this aim, time series geo-spatial data, multi-temporal remote sensing data, and GIS analysis were adopted to analyze the spatial and temporal growth patterns of MMC (for 2000–2018). We found increasing fragmented and dispersed spatial development patterns with every kilometer away from the city center. While the findings show that the evolution of MMC conforms to mainstream urban models where development proceed from the central core [33], planning strategy that can guarantee compact growth, deliver a viable city structure, support social and economic development, and protect the environment is proposed for MMC.
The remaining parts of the study are organized as follows: Section 2 presents the background of the case study, data collection methods, and analysis. In Section 3, the results and discussion are presented. Section 4 is about a planning approach that responds to the evolving spatial reality in MMC. In Section 5, we reflect on the broader implications of the study for other sub-Saharan cities and provide a conclusion.

2. Methodology

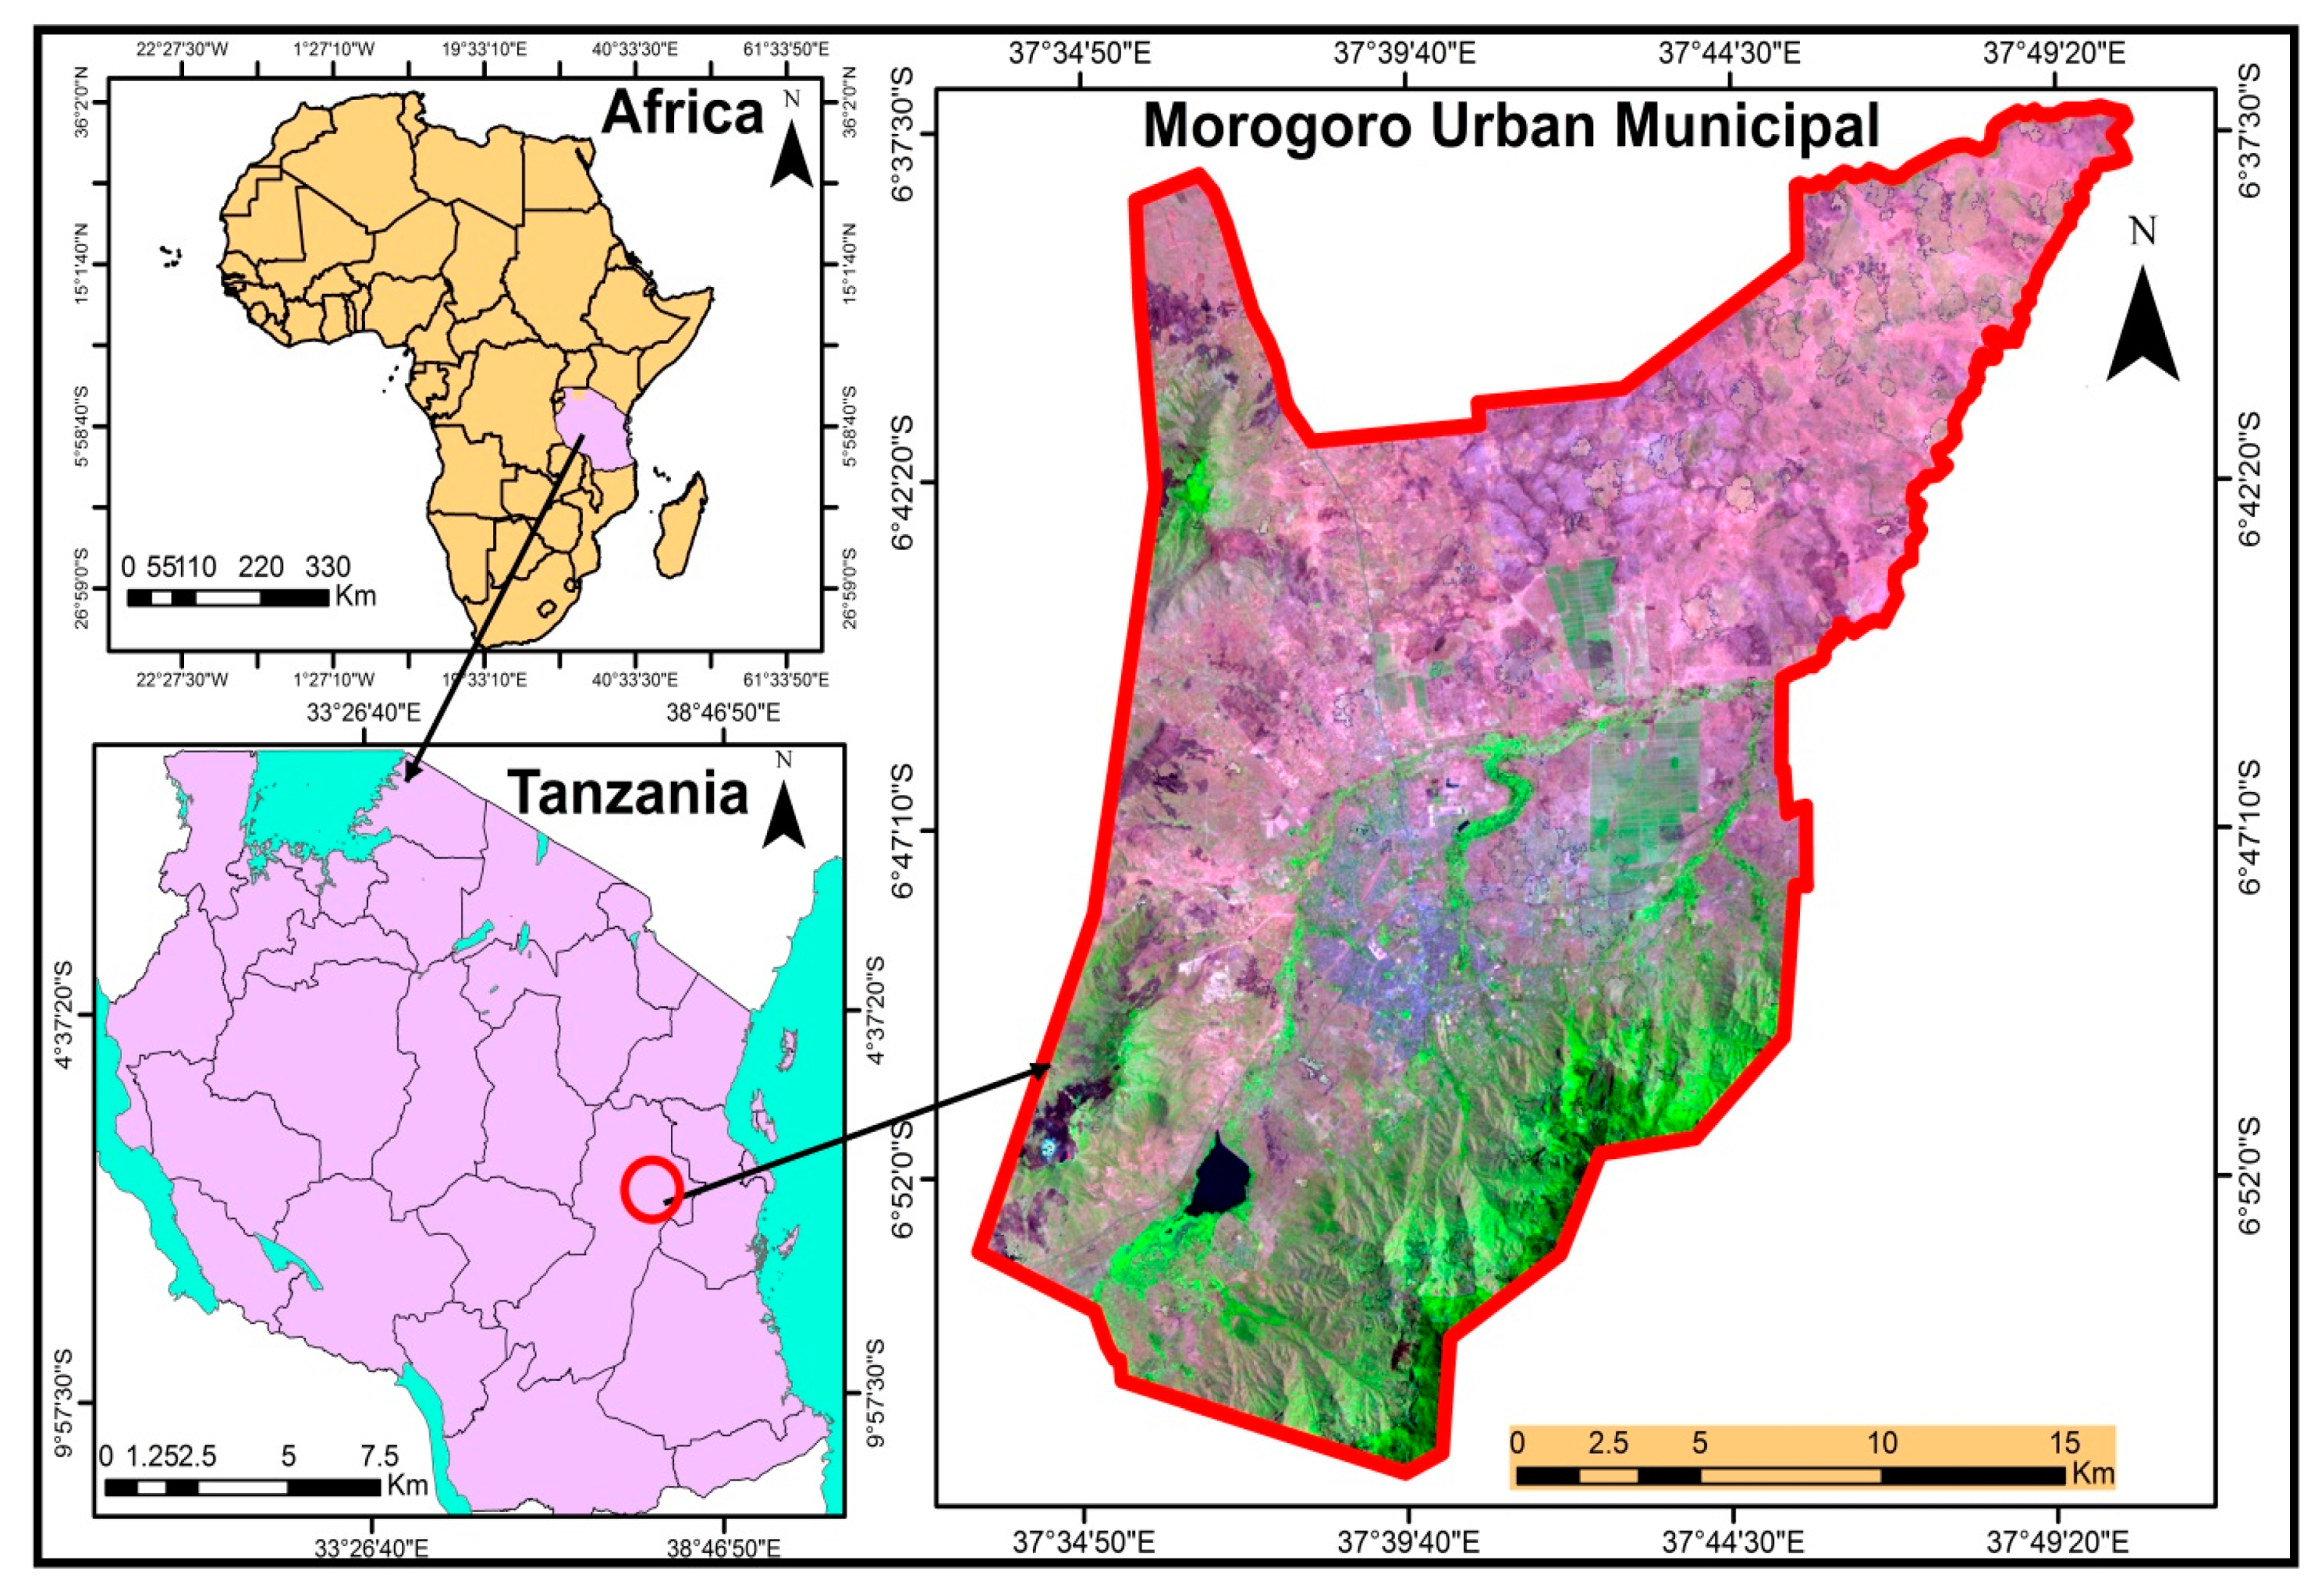
2.1. Case Study Location

The study area is Morogoro Municipal Council (MMC) (see Figure 1), which is a city in the region of Morogoro in Tanzania. The municipality is the capital of Morogoro region, which is one of the 30 administrative regions in Tanzania. The population of MMC is estimated to be 305,000 inhabitants with an annual urban population growth rate (1988–2002) of 2.6% and 540 km2 of total area [34]. Due to the rapid growth, MMC is facing major urban challenges in managing social and economic changes within the municipality while 65% of the city’s population live on unplanned area [25].

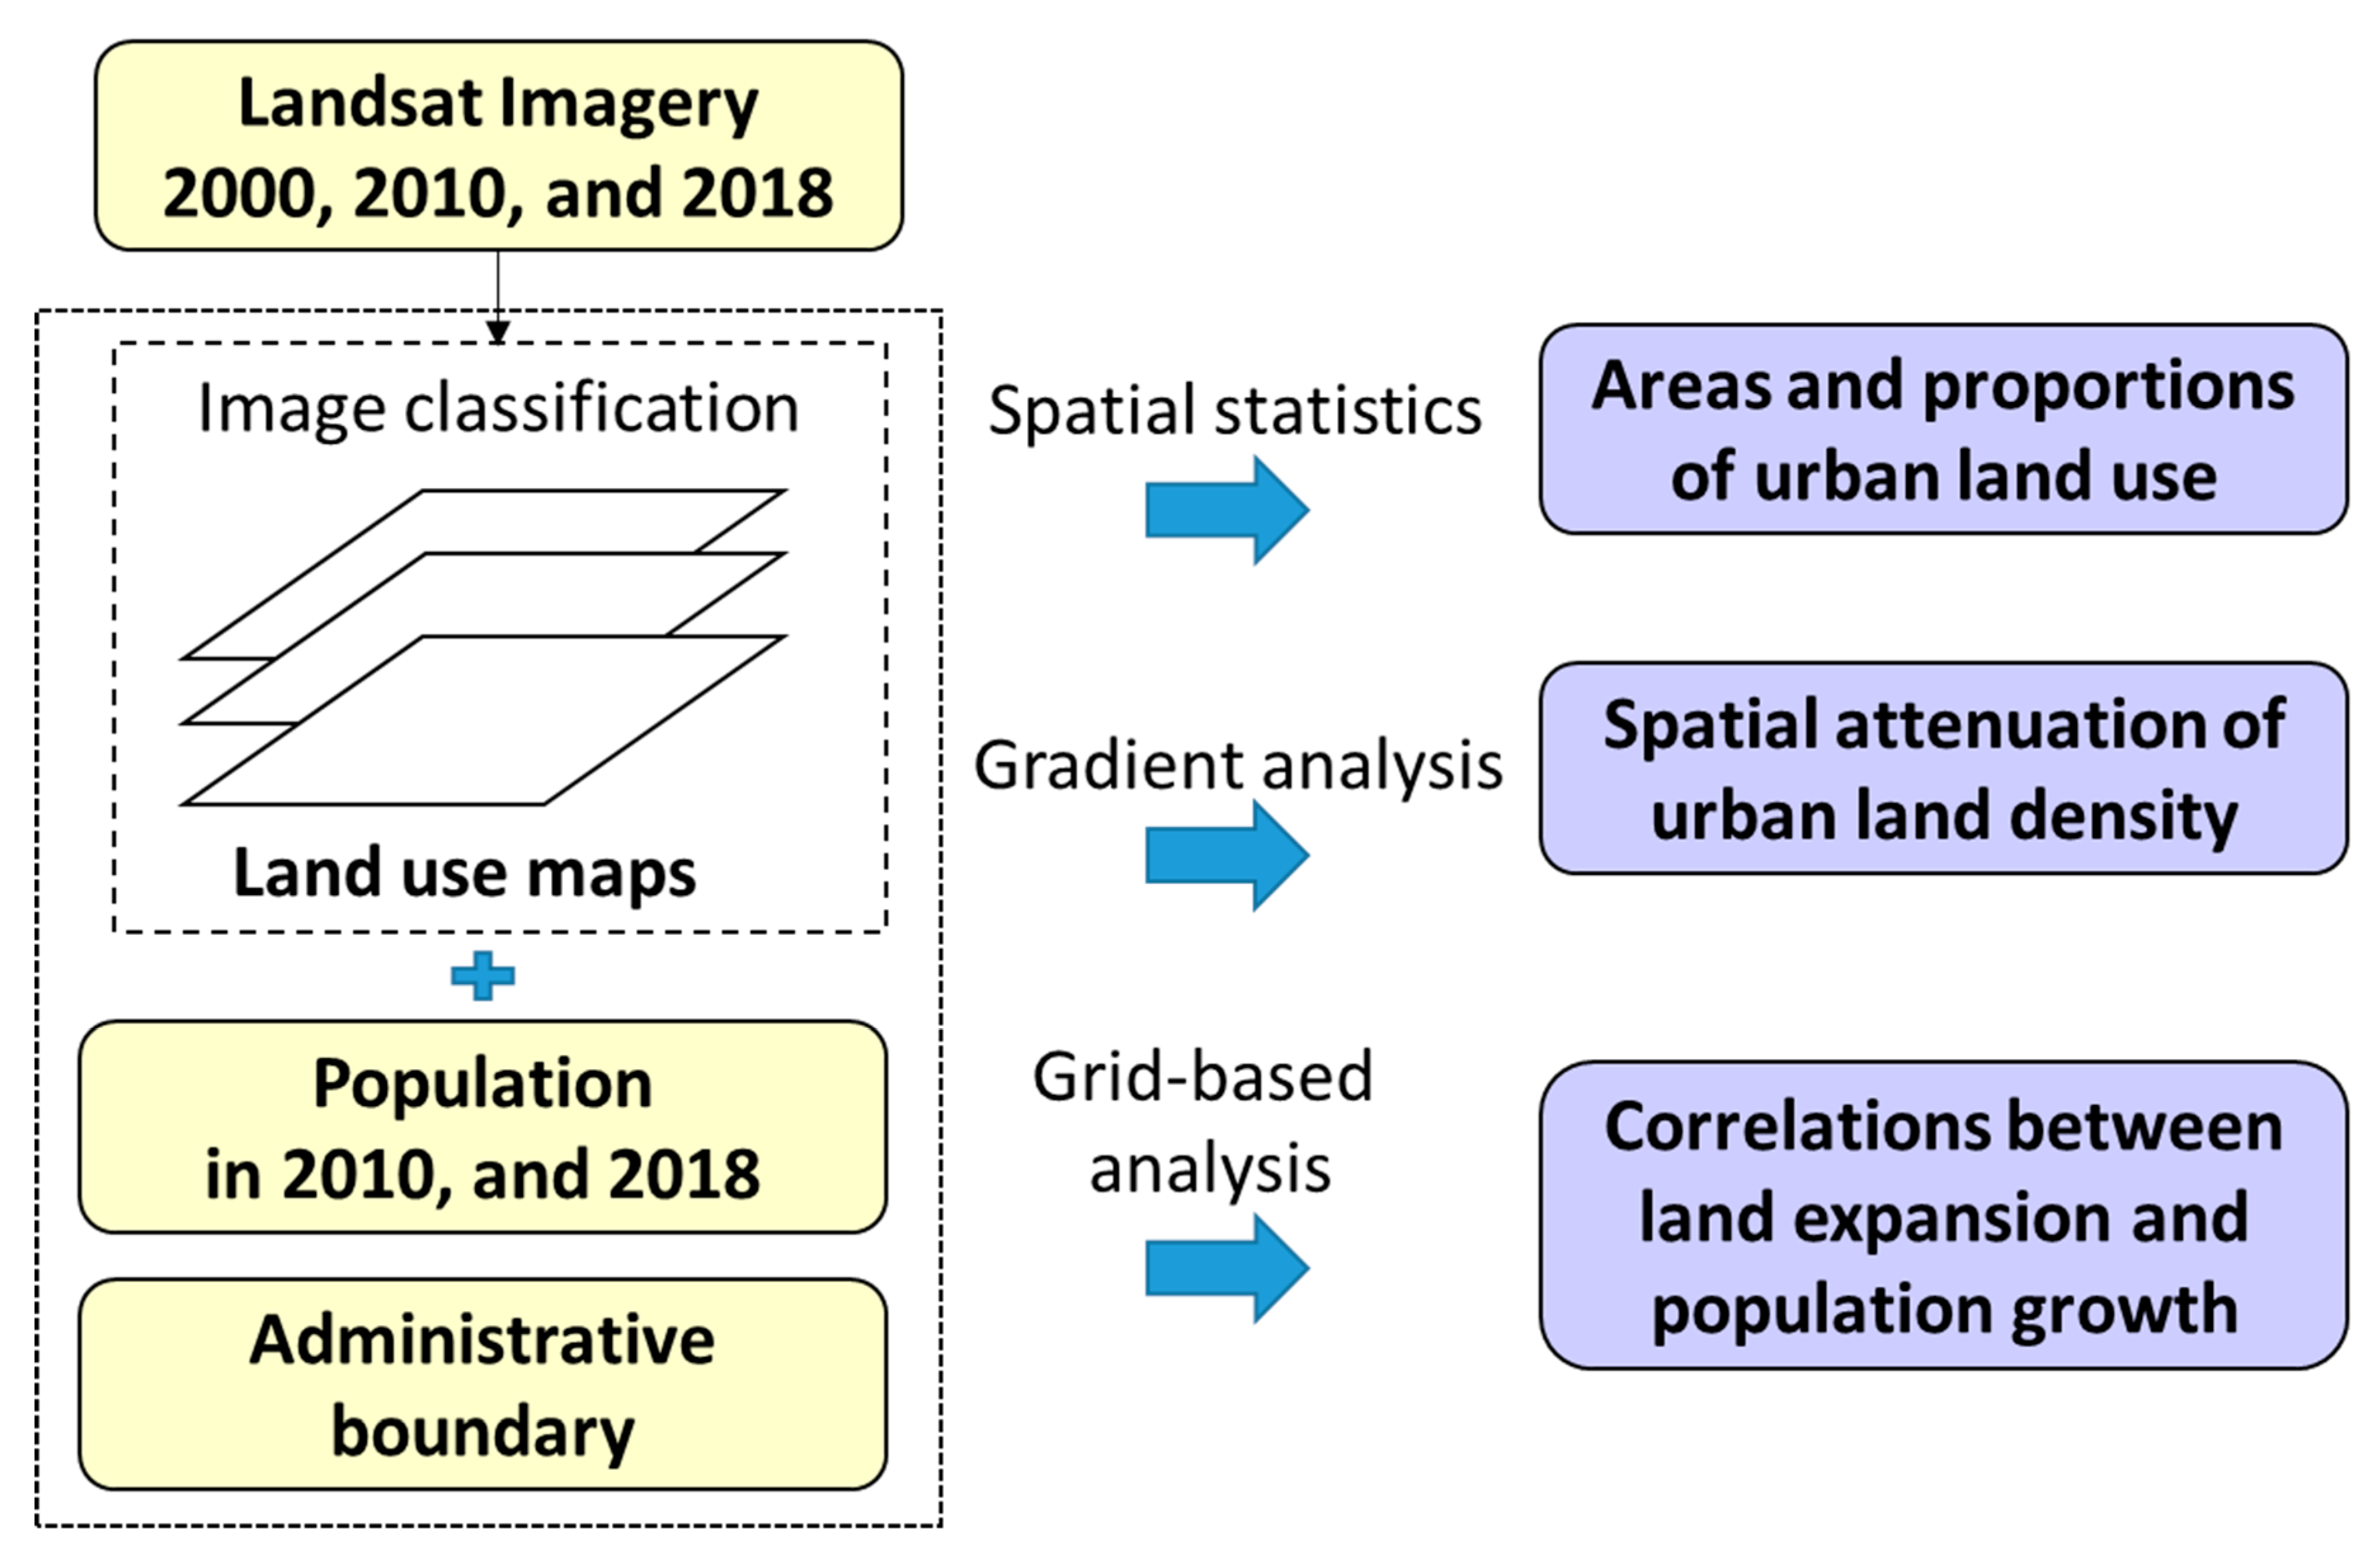
2.2. Data Collection and Preprocessing

The workflow of this study is divided into three parts (see Figure 2). First, the Landsat imagery was processed, including atmospheric correction and geometric correction. Second, random forest supervised classification techniques were determined. Third, the results of the change detection in the land use map were presented as the final output of the classification. In this study, multi-temporal remote sensing data were used as data source for retrieving urban land use. The study used Landsat satellite images obtained from the United States Geological Survey website (http://earthexplorer.usgs.gov/) to show the growth rate of urbanization and spatio-temporal characteristics between 2000 and 2018 (see Table 1). In addition, population datasets were used [35].
Change detection provides essential information for decision making in the monitoring of land use, assessing global changes, and the nature of the change over the period of time. Change detection was used to identify land use change rates such as urban growth, flooding, drought, and any transition in vegetation [8,20,36,37]. The monitoring of land use/land cover (LULC) change is relevant and useful for understanding the driving force of the change [38]. This change analysis used was calculated for three periods (2000, 2010, and 2018) for the overall study area. We compared our results and showed no differences with global land cover data at 30 m resolution (GlobeLand30) images used by Xi et al. [39].

2.3. Spatio-Temporal Characteristics of Urban Growth

The detailed urban land use maps in Morogoro at three-time points (2000, 2010, and 2018) were derived from Landsat imagery. We analyzed the spatio-temporal characteristics of urban expansion and population growth using two paradigms: Gradient analysis and grid-based analysis. The physiognomies of town dissemination within an expanse were determined by studying the correlation between the categorization of large and small urban in the expanse and its scale. The order-scale rule studies the dissemination size of the town system from the correlation between urban size and built-up density in each size order [40,41,42]. Built-up density (urban land density) is defined as the ratio of the built-up area to the buildable area in a ring. In this study, water bodies cannot convert to built-up area, so the buildable area equals the total area of land excluding the area of water bodies in a ring (Equation (1)).
D e n s =   S b u i l t - u p S a r e a S w a t e r
where D e n s stands for the built-up density in a ring, S b u i l t - u p is the area of built-up in a ring, S a r e a is the area with land use information in a ring, and S w a t e r is the area of water bodies in a ring.
Jiao [24] has proposed the urban land density function to characterize the spatial attenuation of urban land density from the city center which is shown in Equation (2):
f ( r ) = 1 c 1 + e α ( 2 r / D 1 ) + c
where r is the distance to the city center, f ( r ) is the urban land density in a ring with a distance of r to the city center, α , c and D are parameters, and e is Euler’s number. These parameters have physical meanings. Parameter α stands for compactness of urban form of a city (the higher α indicates the more compact urban from of a given area). Parameter c represents the background density of built-up area of a city, and D represents the extent of a city, an approximate boundary between the urban fringe and the hinterland. The detailed explanations of the urban land density can be found in references [24].

3. Results

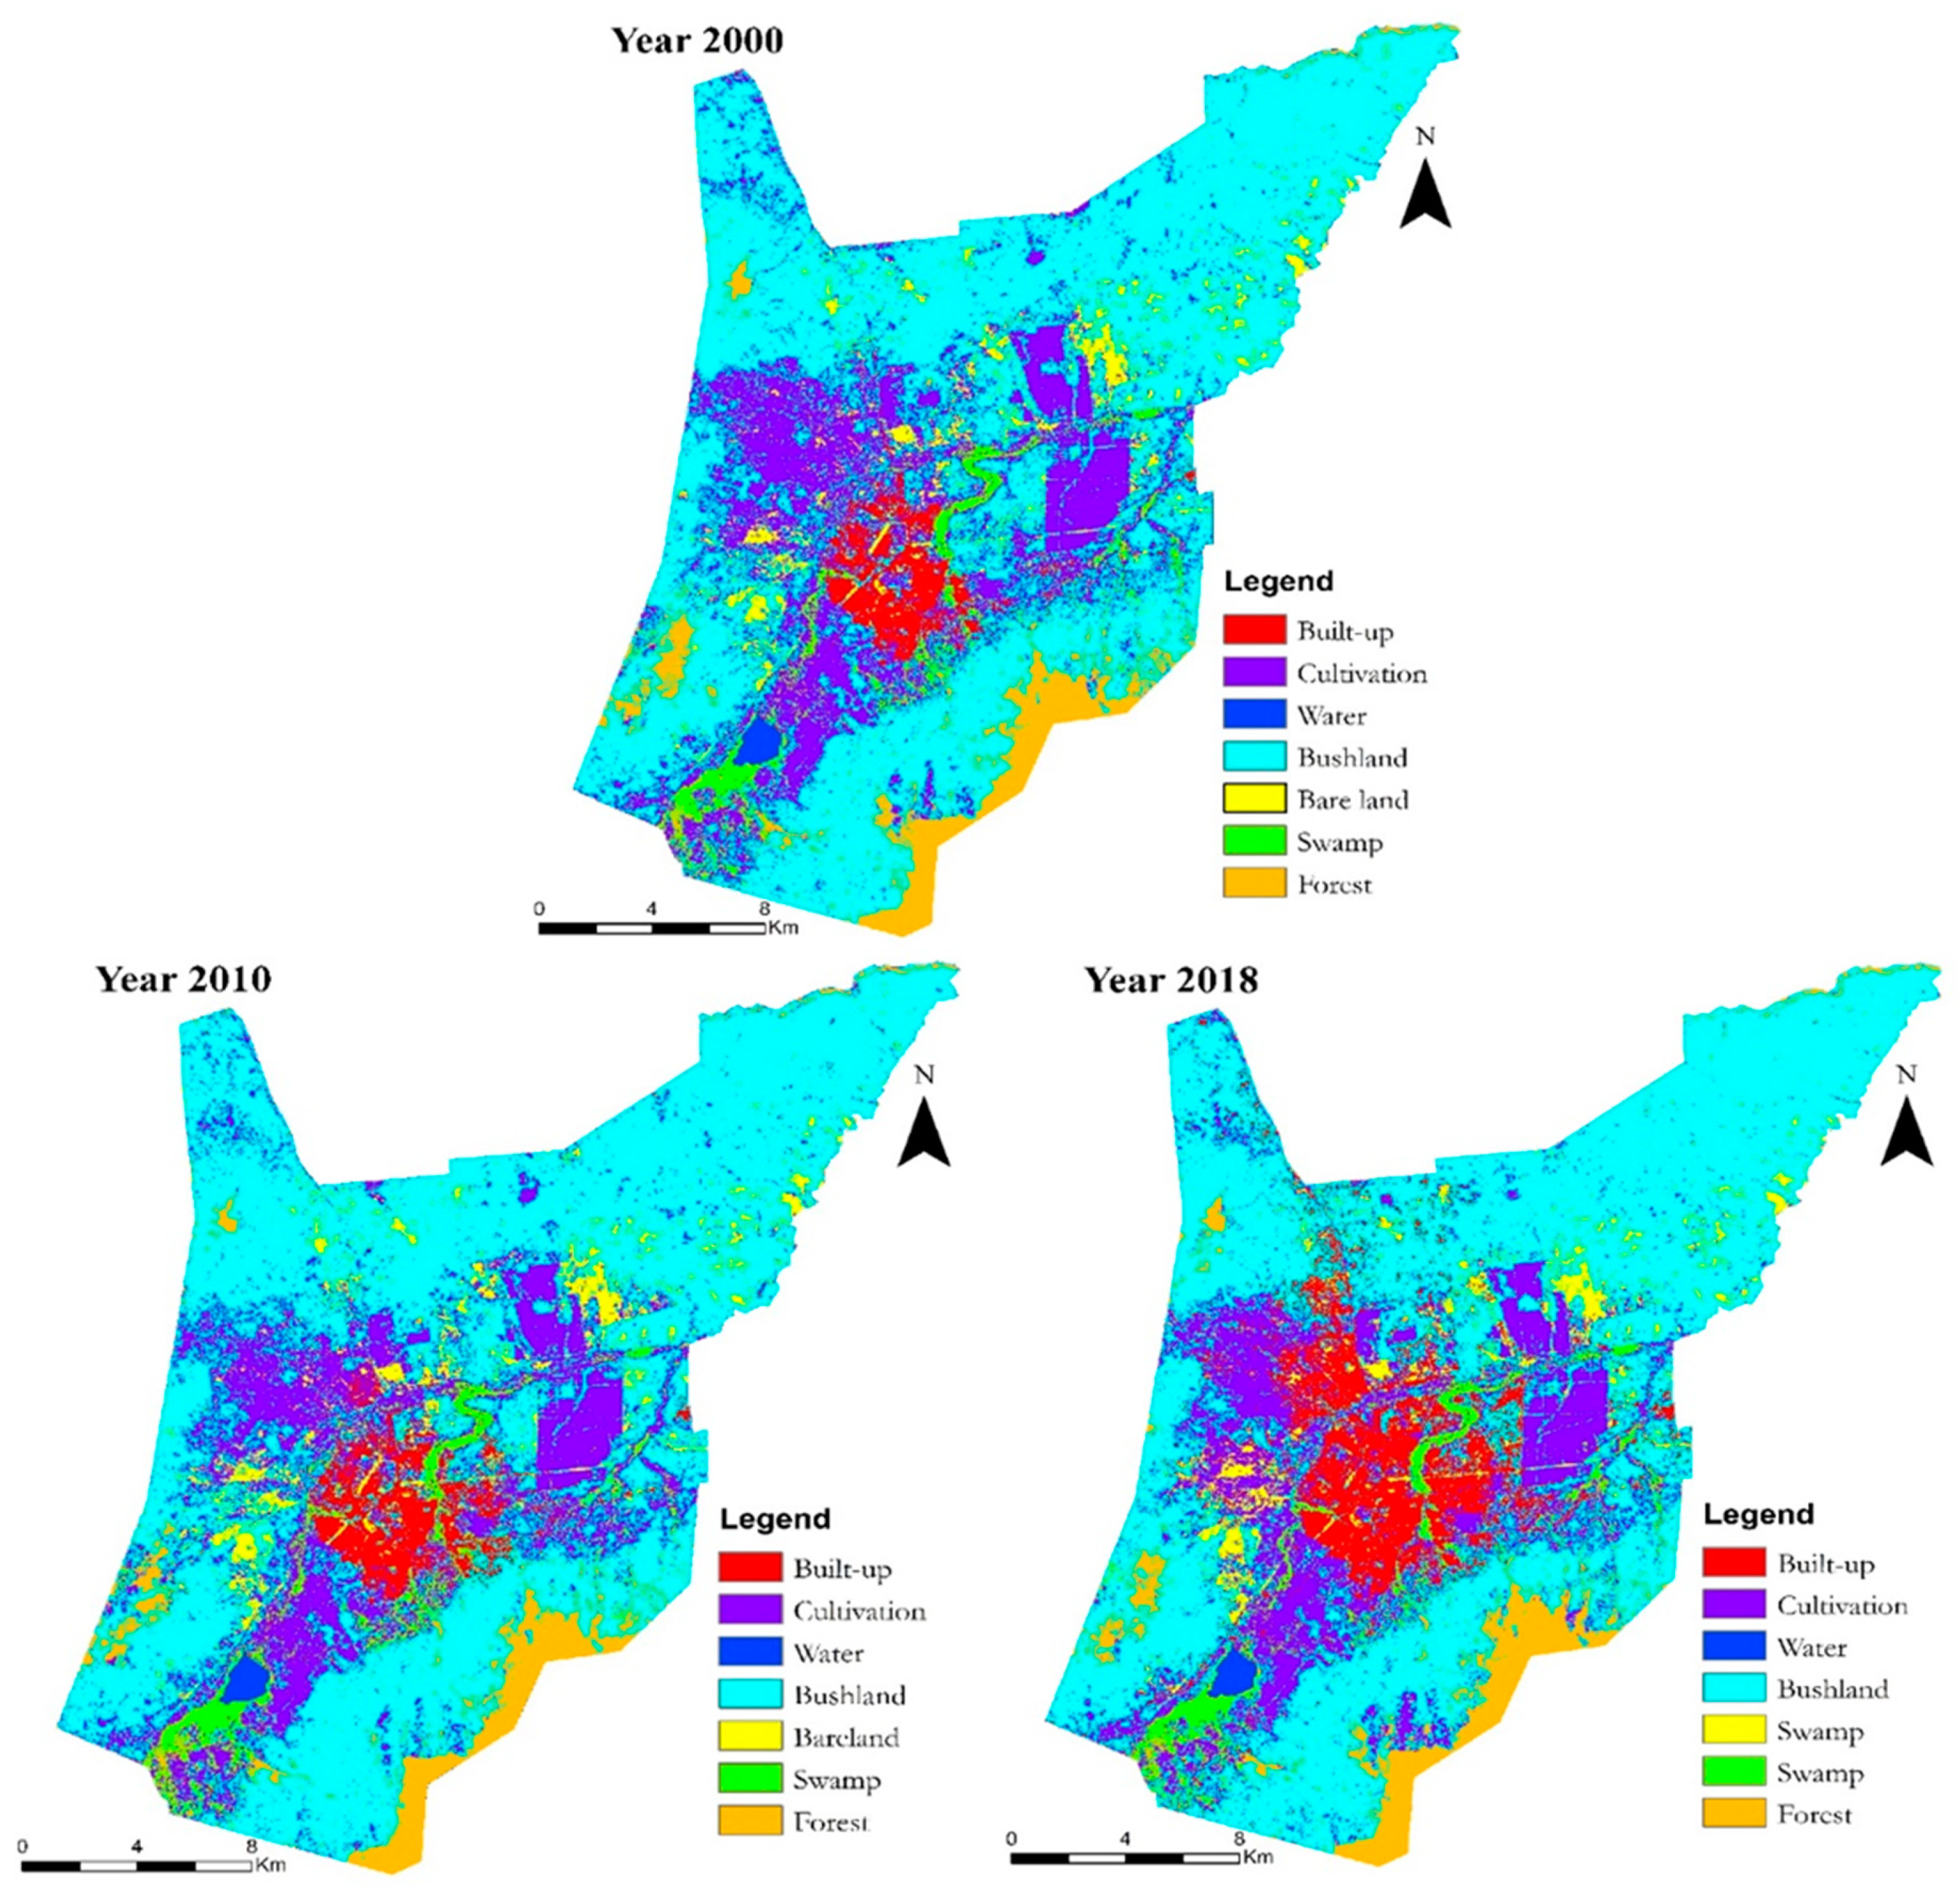
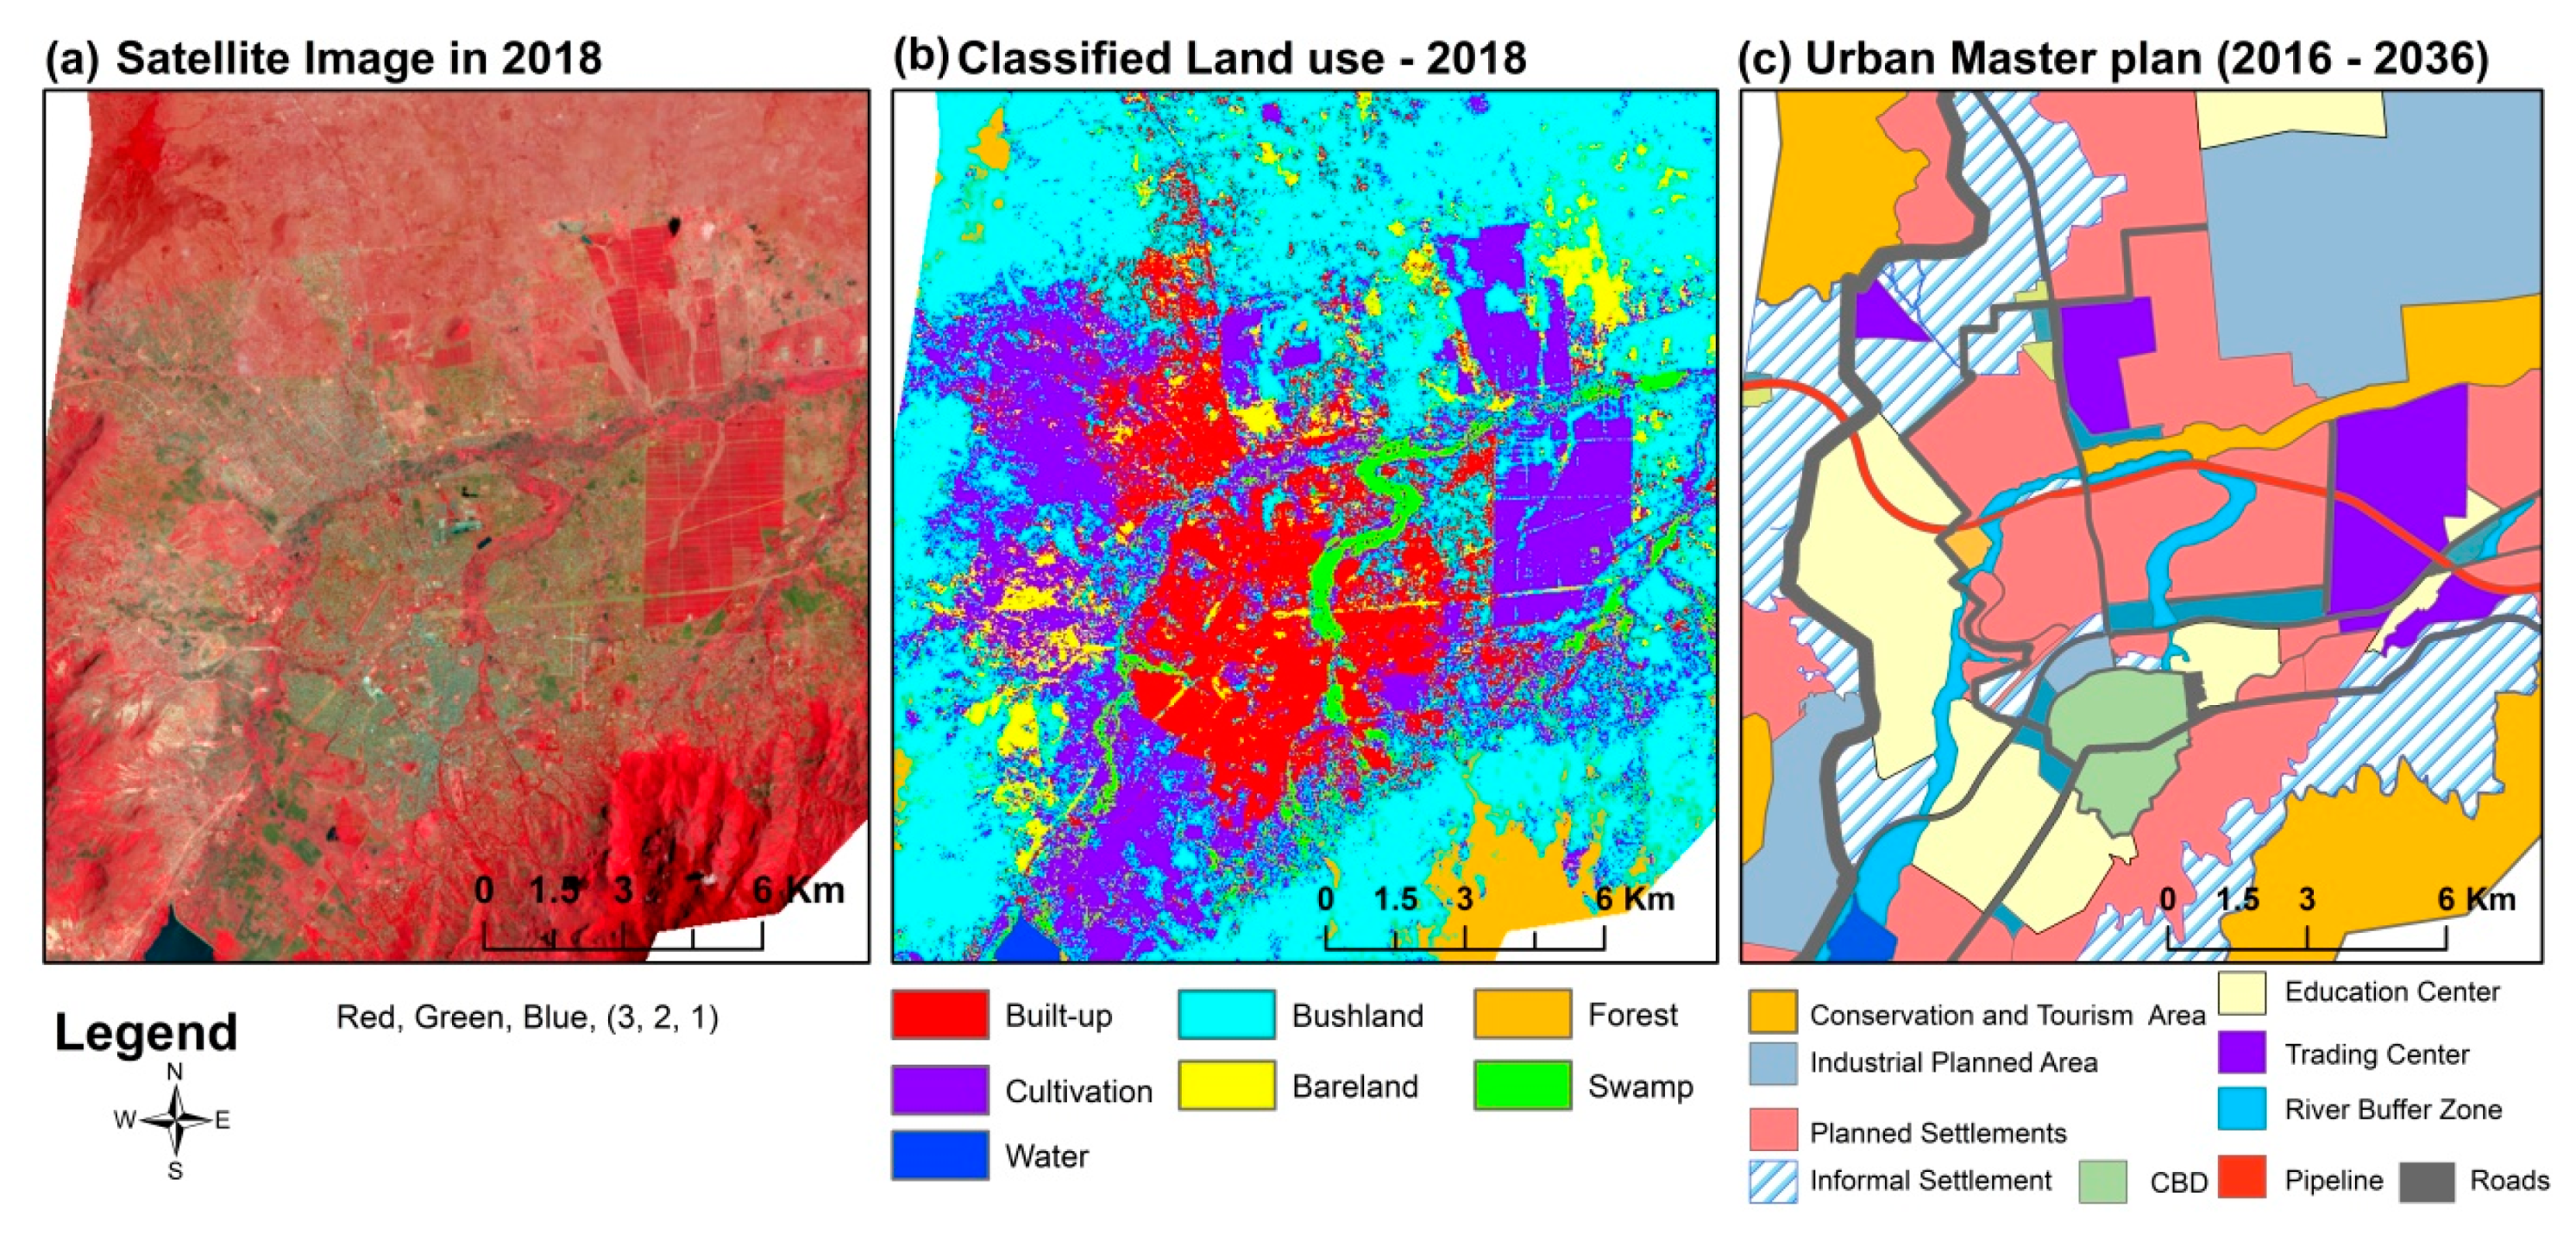
3.1. Spatial Distribution of Land Use and Land Cover

The summary of land coverage for the seven land cover categories shows that, in spite of decline from 2000 to 2018, the bushland cover remains the highest land cover category, with a total area of coverage of 62.53%, 63.06%, and 59.48% for years 2000, 2010, and 2018, respectively. Conversely, built-up is the only land cover category that consistently expanded from 2.85% in 2000 to 4.14% in 2010 and 9.45% in 2018 (Table 1). Basically, cultivation and bushland categories declined over the three study epochs, while water, bareland, wetland, and forest land cover fluctuated during the study period. Figure 3 shows the classified satellite images of the study area, which clearly show that the built-up land cover category continued to expand over the 18 years of study. Out of the 28 wards comprising the MMC, Mwembesongo was the most built-up in 2000 (with 0.3% of total built-up), while Kichangani topped the built-up category in 2010 (with 0.53% of total built-up), and Kihonda with the highest built-up coverage in 2018 (with 1.17% of total built-up). Mwembesongo and Kichangani are generally within the central and most urbanized area of the MMC, whereas Kihonda is mainly located on the adjoining outer fringes of the MMC central district. In the year 2000, Tungi ward had no development whatsoever, but by 2010, it contained about 0.16% and further expanded to 0.65% of total built-up area of the MMC.
Generally, the expansion of the built-up category of land cover takes an outwardly radial form into wards such as Boma, Chamwino, Mafisa, Tungi, Kihonda, Mindu, Magadu, and a couple of others.

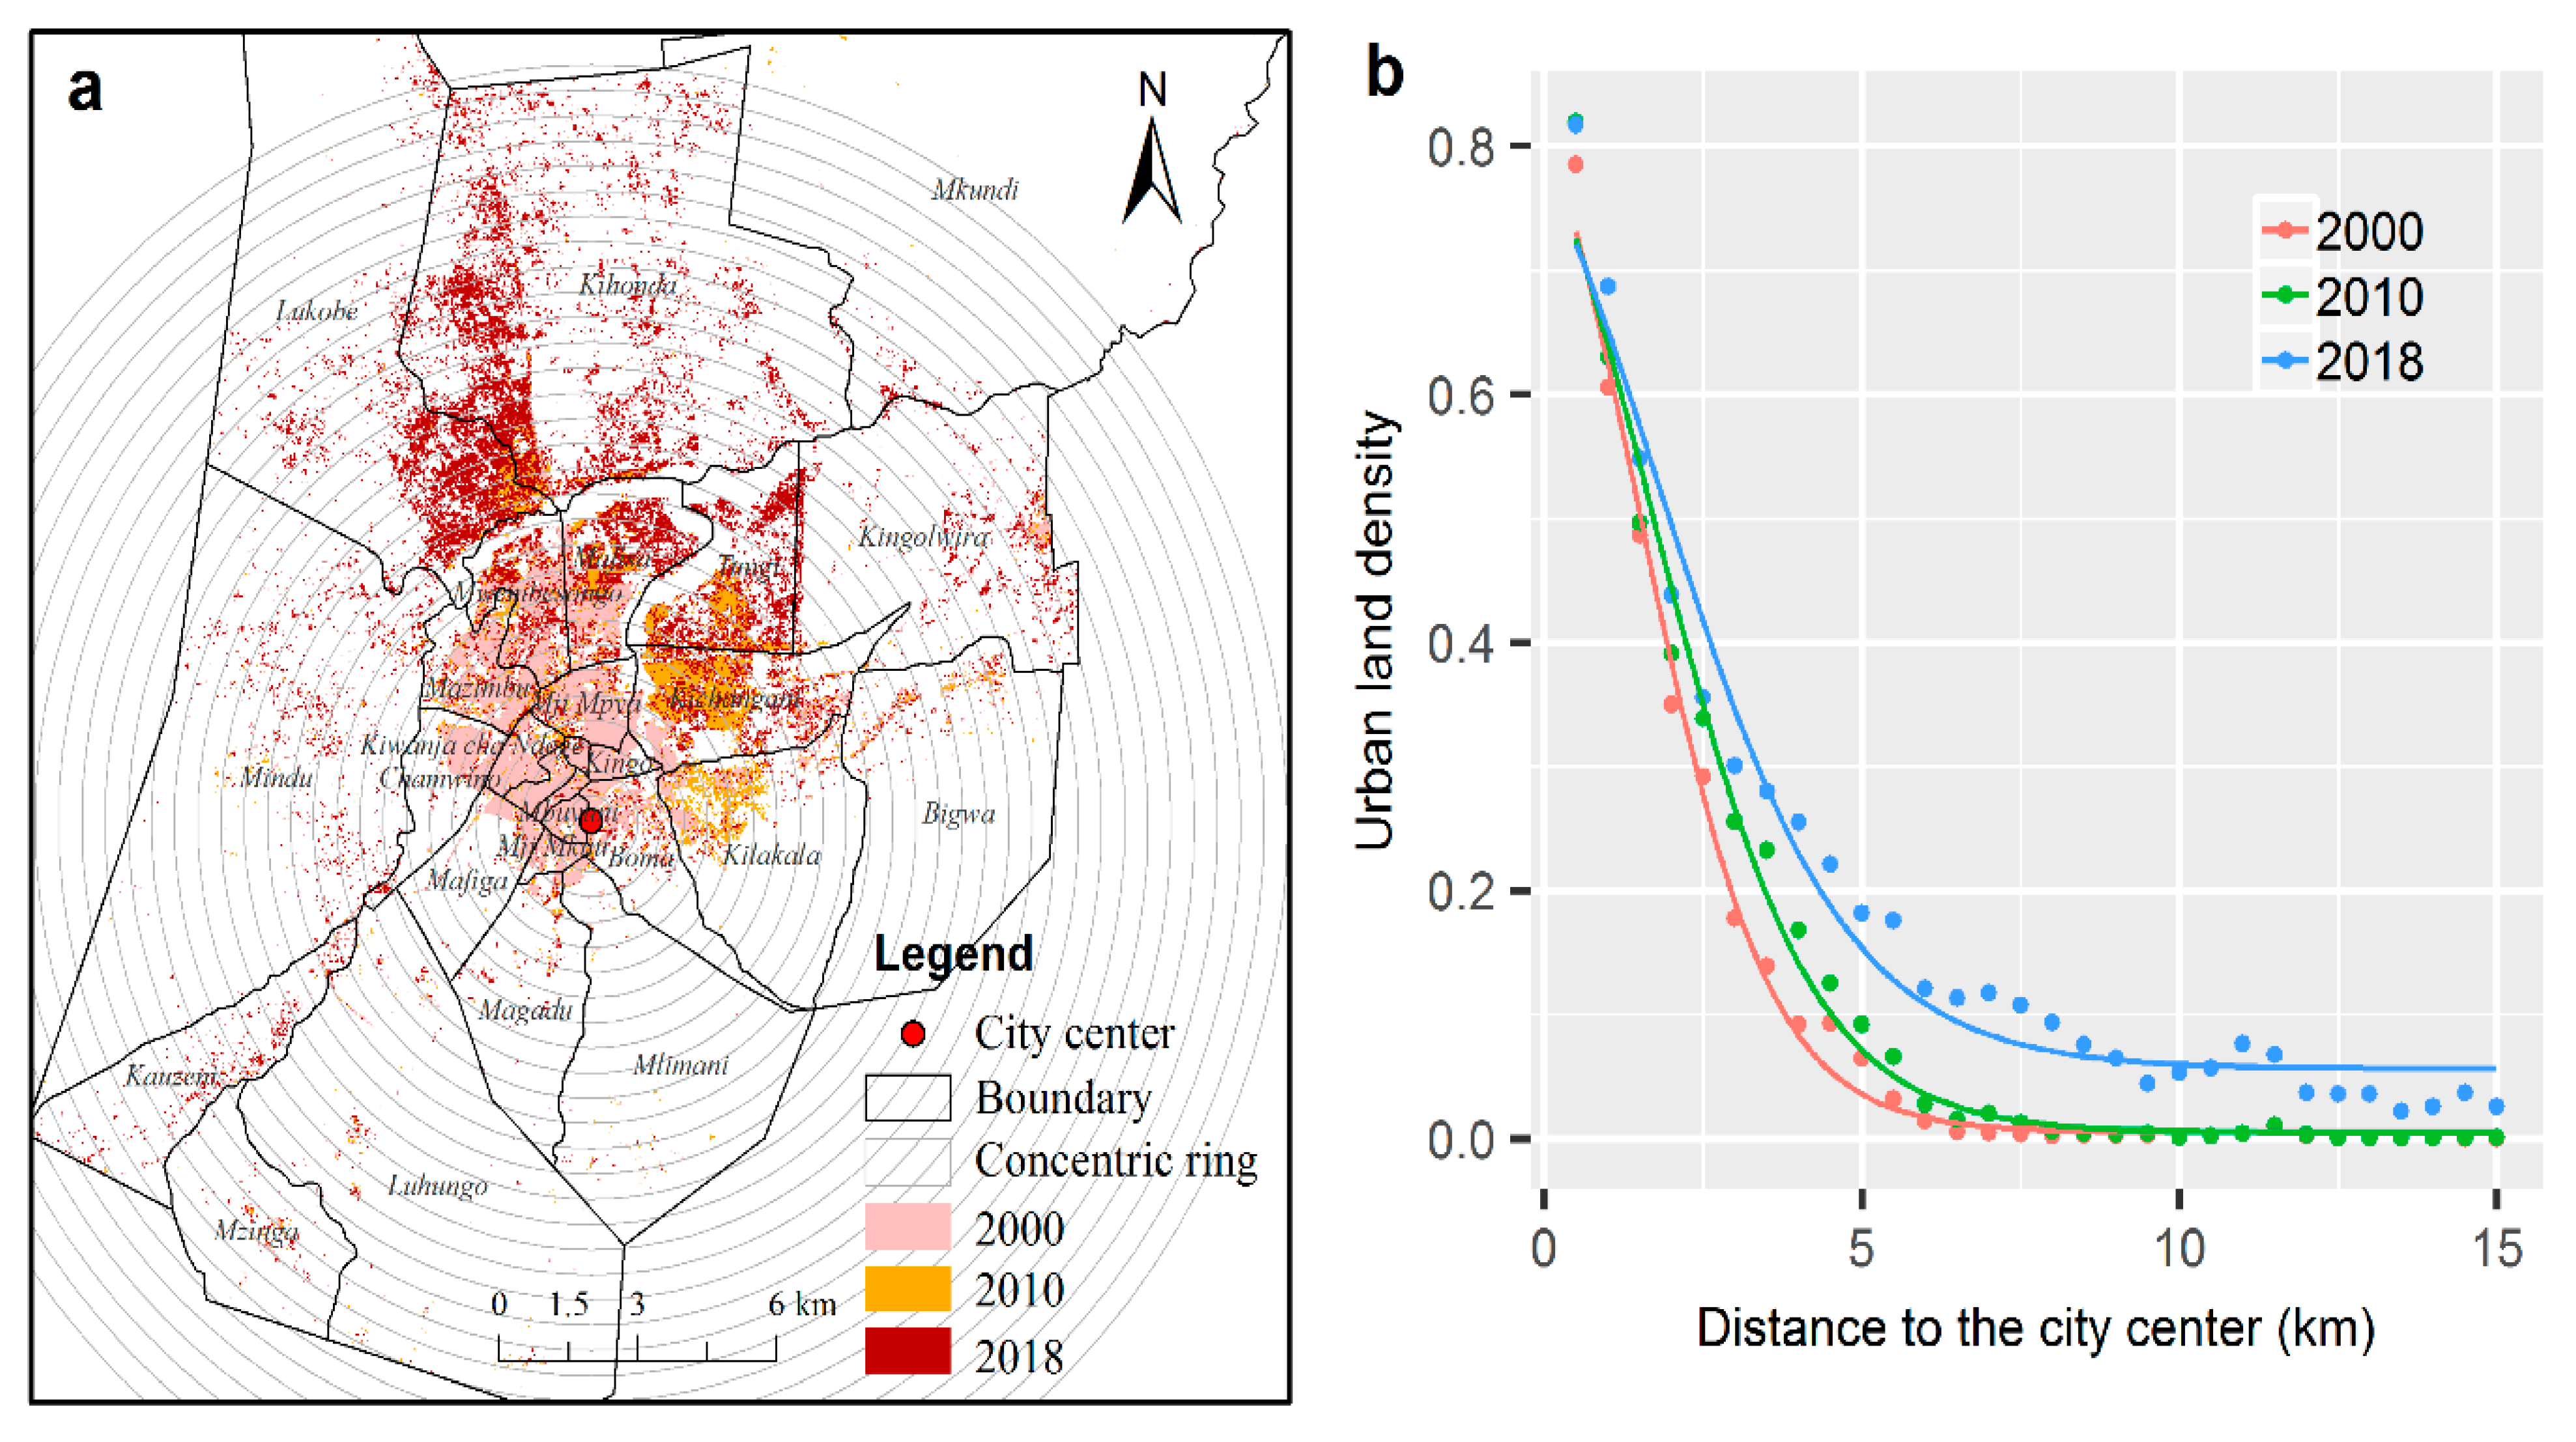
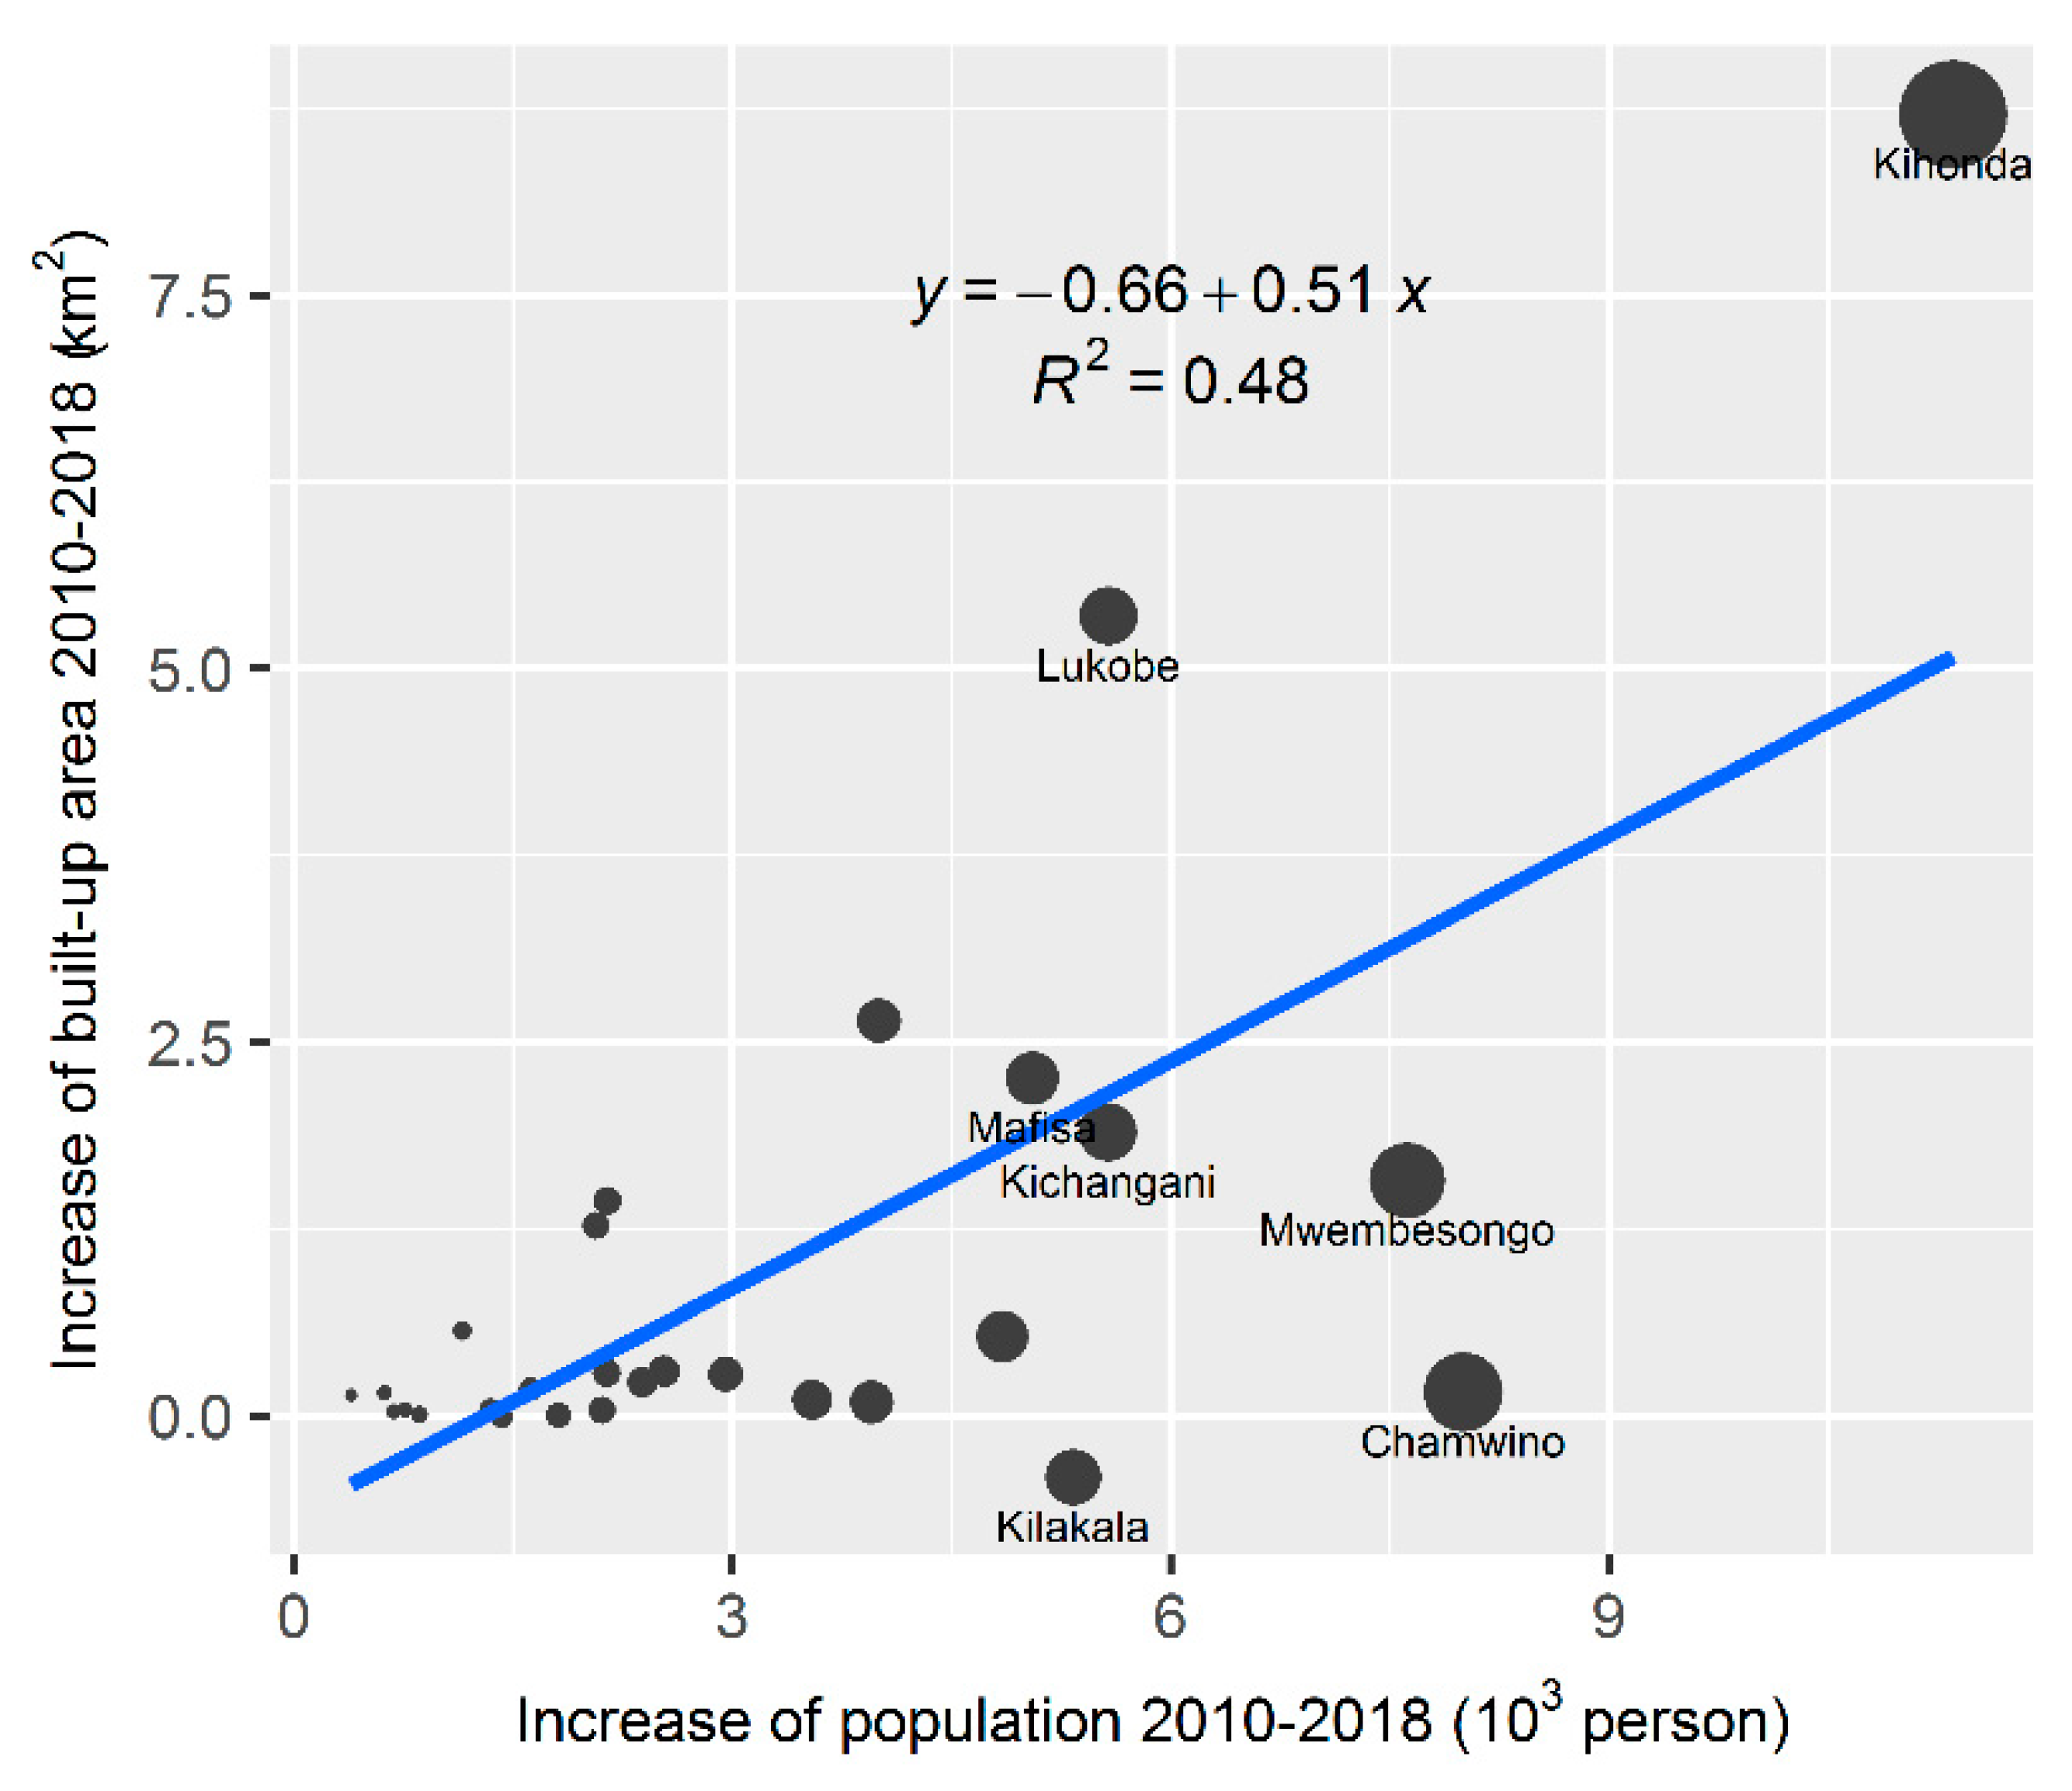
3.2. Urban Expansion and Its Correlation with Population Growth

The spatial distribution of built-up areas for 2000, 2010, and 2018 is presented in Figure 4a, and series buffers with a 0.5 km interval are built from the city center. Overall, the city is mainly expanding northward. From 2000 to 2010, the new built-up area was mainly located in the east of the city; in the last decade, the city has clearly expanded to the north. The distance decrease of the built-up area in each ring and the fitted curves, as shown in Figure 4b, and the parameters of urban land density function are presented in Table 2. Generally, the density of built-up area decreases with distance to the city center. The built-up density is about 80% around the center of the city, but it slightly decreases in a given expanse of the city. The curves move above from 2000 to 2010 and even further by 2018, which indicates the urban expansion in concentric rings. The parameter α decreases during the study period of 18 years (2000 to 2018), implying a more dispersed urban form as the city expands. Parameter D show the urban extent, which increased from 3 km in 2000 to 3.4 km in 2010 and further to 3.6 km in 2018.
Urban population and land are two crucial elements within a city. Cell-based analysis unifies population growth and land expansion in sub-regions. This study used the sub-districts (ward) as cells and calculated the increment of built-up area and population from 2010 to 2018 in each sub-district. Thereafter, the correlations between population growth and urban land expansion in sub-districts were examined. The increments of the urban population and the built-up area in sub-districts are highly correlated (Figure 5). The sub-district of Kihonda is located in the north of the city, where urban land expanded most from 2010 to 2018 and with the most population growth. Some other sub-districts experienced a relatively large amount of population growth, but with a small increase of built-up areas, like Chamwino, Mwembesongo, because they are near the city center with limited buildable space.

4. Discussion

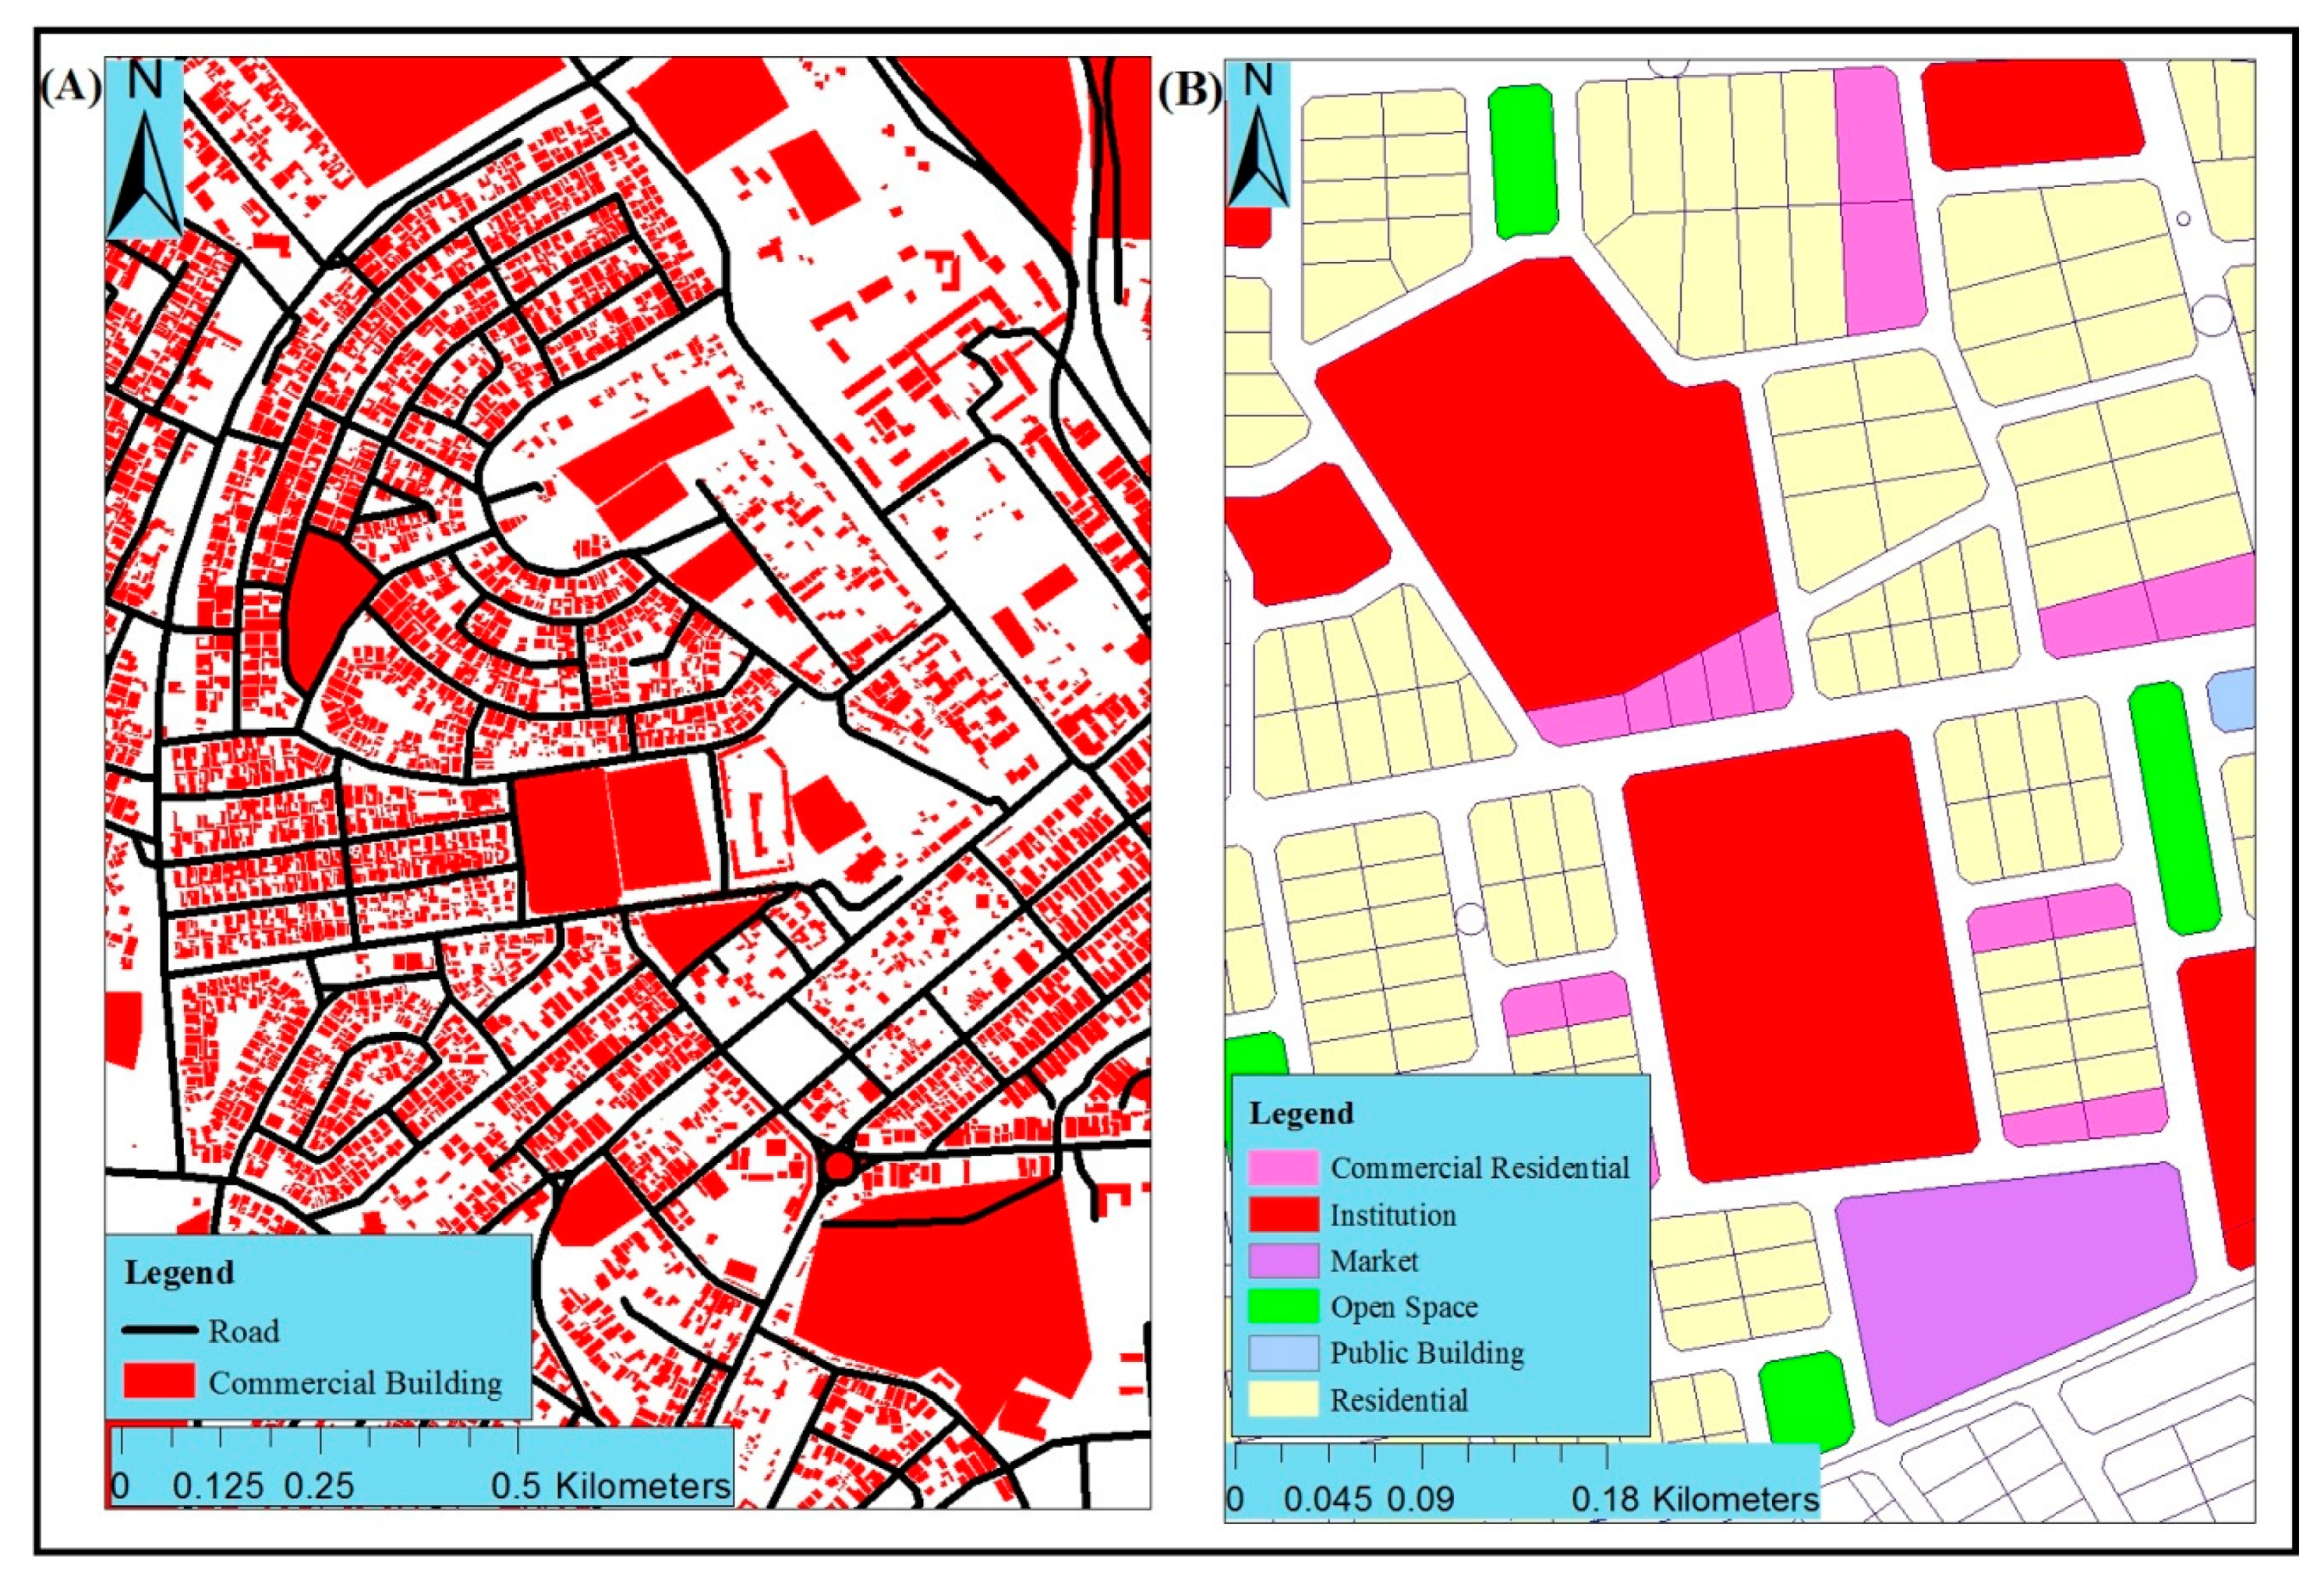
4.1. The Prevailing Pattern of Urban Morphology in MMC

The basic urban morphology of MMC shows that informal development is largely occurring northward from the city center, while development is generally limited southward of the city (Figure 6). It also appears that the master plan did not consider, perhaps, addressing the possible plethora of issues that inhibit development (formal or informal) towards the south of Morogoro, but rather focused on formalizing the informal neighborhoods within the study area. The current urban plan of MMC provides a categorization of land uses into legal and non-legal areas for development and natural reserve. Over the study period, it was observed that the physical development and expansion of MMC is limited toward the south-west from the city center at Mlimani, Luhongo, Mindu, and Magadu wards, where population increase is also minimal. This area is a Military Reserve Area and is also a mountainous region. To address the current pattern of urban morphology would, therefore, require well-thought efforts by the Planning Authorities of MMC beyond just seeking to formalize the informal/non-legal developments into legal/formal neighborhoods.

4.2. Reinventing Urban Planning: Implications for Sustainable Urban Development in MMC

Cities are expected to keep growing, owing to natural increase and influx of migrants. This study shows that city planning is therefore an integral component of the whole urbanization process (Figure 6). However, several studies [22,43,44,45,46,47,48,49] indicate that contemporary city planning is expected to be integrated (infrastructure, land use, culture, natural resources, and education) and multi-sectoral (to include residents, leaders, employers, investors, and so on), in addition to major consideration given to local circumstances, needs, and requirements, as well as gender considerations, involvement of and responsiveness to the diverse city populations in order to achieve a robust urban planning architecture. A key characteristic of a modern urban plan is the multi-scale/multi-level integration to support sustainable and coordinated road, transit, housing, economic development, and land use across geographic and political boundaries. All of these can only be supported by adequate professional planning capacity, especially in developing countries. UN Habitat [22] reveal that there are about 38 professional and qualified planners per 100,000 in the developed countries (Britain, as example), while there are about 1.44 to 0.23 per 100,000 in developing countries (using Nigeria and India as examples). It is thus not unexpected that cities in these countries continue to experience infrastructural and economic decline and degradation.
Currently, many cities in the world still rely on somewhat outdated modes of planning, while expecting to achieve sustainable urban development. It is crucial to note that as cities continue to sprawl, densities are dramatically declining. It is projected that in developing countries, a 1% decline in densities per year between 2000 and 2050 would quadruple the urban land area, hence leading to various outcomes such as loss of agricultural land, socio-spatial segregation and segmentation, higher commuting times and costs, and increased greenhouse gas (GHG) emissions [22]. Reinventing urban planning entails adopting planning measures that are on-going and inclusive, rather than a one-off encapsulation in a master plan. The problem with this kind of planning is that it is built to address specific challenges within a particular year, after which they appear to be of little relevance over the years as new challenges arise.
In this regard, Farmer et al. [44] suggested 10 principles to be incorporated in modern urban planning. These include:
  • Promotion of sustainable development;
  • Focusing on achieving integrated planning;
  • Integration of city plans with available budgets;
  • Inclusive planning (with planners and stakeholders);
  • Considering the secondary principle;
  • Encouraging and promoting marketing;
  • Ensuring access to land;
  • Developing a planning mechanism;
  • Planning that considers the poor and less privileged strata for urban planning; and,
  • Recognizing (and preserving) social behavior diversities.
In essence, these principles of city planning serve as a vehicle of “transition and evolution of planning from a modernist process in which planning is viewed as a scientific, the universally valid instrument of progress (which largely benefits only a select elite), toward a communicative process, in which planning is viewed as politically engaged, inclusive and empowering, strategic and integrated” [22], [43]. A more radical approach to sustainable urban planning is anti-fragilism, proposed by Taleb [50]. Roggema [47] explains the anti-fragilism concept as “a system that is not only able to respond to changes in an agile way, but more than this, it is able to use these responses to make itself stronger and more capable of dealing with unexpected changes in the future”. Other approaches also highlighted by Roggema [40] include those classified as environmental resilience [46,51,52] and spatial resilience [51,53,54,55,56,57]. According to Roggema [47], the former aims to “fix the future” by building environmental resilience of urban centers, while the latter is a strategy of “indulging the future” by increasing spatial resilience of the urban environment.
The current planning approach adopted by authorities for the MMC is the modernist approach, where a one-off master plan is designed for implementation over a specified timeframe, without recourse to prevailing or unforeseen urban challenges. Basically, the master plan focuses on formalizing the informal developments within the MMC, with limited attention given to sustainability in planning future urban expansion. The current MMC master plan was developed in 2015 and is expected to be under implementation from 2015/2016 up until 2035/2036. The master plan is built on eight Tanzanian policies and legal frameworks, including Vision 2025, National 5-Year Development Plan (2016/2017–2020/2021), Poverty Eradication Strategy II, Human Settlement Development Policy of 2000, National Land Policy of 1995, Land Act No. 4 of 1999, Urban Planning Act No. 8 of 2007, and the Local Government Act. The central objective of the MMC master plan is to examine the problem of informality and to propose contextualized strategies to control and reverse the proliferation of informal neighborhoods within MMC. The plan is designed to achieve this objective via three main steps: First is to describe and classify the type and nature of informality; second is to expound a framework within which informality in MMC can be managed; and, third is to list actions for each proposed strategy. This is further evidenced in the adoption of zoning of land use (as shown in Figure 7) for commercial use only in Mji mpya, and mixed uses (commercial, residential, and green areas) for Kihonda.
Generally, the pattern of informal development observed in MMC shows a mostly northwardly, outwardly orientation away from the city center (Figure 7), at locations considered abandoned or unsuitable for development (for example, at Mkundi, Mindu, and Lukobe) and typically located about 15 km from the city center, while land for development of public utilities in these informal neighborhoods is not appropriated. Much of the land tenure is informal and held under customary ownership. The development has been increasing in tandem with population increase, with 2018 recording the highest population and urban expansion rate for MMC.
Clearly, what is required for sustainable development of MMC is a planning strategy that can contain urban sprawl, protect natural habitats, promote connectivity, and stimulate productivity. This is a challenge that planned city extension can achieve. UN Habitat promotes planned city extensions—an urban planning strategy that can deliver sustainability targets such as ensuring compact development, minimizing informal development, and protection of ecosystems [26]. Planned city extensions (PCE) have been tried and tested in both the developed and developing countries with huge successes (ibid). Some of the benefits of PCE include: Viable spatial structure for the city, inclusive development, a more integrated city, connected and livable city. PCE have been implemented in some sub-Saharan cities such as Ouagadougou in Burkina Faso and Tema, the industrial city of Ghana. In Ouagadougou, among others, the PCE led to a clear city structure with an interconnected and hierarchical street network that makes it easier for infrastructure delivery. In addition, there is less fragmentation in the city, with informal housing reducing drastically from about 70% to 7%. Similarly, in Tema, Ghana, PCE has resulted in a livable, structured, and accessible network of neighborhoods. This structure still exists today, and notwithstanding the present decay of most buildings, has promoted economic activities with street shops, pedestrian mobility, and adequate public spaces.
Essentially, several city-specific critical issues should be addressed by a PCE for MMC if sustainability is the target. Kithakye et al. [58] reported that about 65% of the city’s population lives on unplanned land with limited or no basic services, which in turn is driving the growing urban poverty. Similarly, URT-PRSP [22] stated that MMC has more than 50 unplanned and un-serviced high-density settlements with poor infrastructure and absence of basic services such as water and sanitation, and with little or no access to secure land tenure, which is generally indicative of the inadequacy of housing needs of the poor, where the majority of the population lives below the poverty line of US$1 a day [22,43,59].
In terms of governance, Kithakye et al. [58] revealed a general lack of capacity which constrains effective and efficient regulatory roles such as land development and control, policy enforcement, and local level involvement. These deficiencies have led to unaffordable and inadequate mass housing options for low-income families, thus leading to unregulated “self-help” housing by low-income families and subsequent proliferation of unplanned settlements in the municipality. Also, human resources and financial capacities are especially weak, while the local government lacks the ability to cope with and the flexibility to adjust its planning strategies to match contemporary socio-political, demographic, economic, and environmental changes within MMC.
The governance system of the MMC needs to build planning capacity, strengthen its planning unit, and adopt a participatory planning approach that is more sensitive, inclusive, and responsive to stakeholders/residents in upgrading current informal neighborhoods and also ensuring land regularization to enable low-income owners access to secure tenure, as well as social and financial credit across the MMC.

5. Conclusions and Recommendations

This study analyzed the spatio-temporal characteristics of urban expansion and population growth in MMC using two paradigms: Gradient analysis and grid-based analysis. The results show declining urban densities with every kilometer away from the city center. Furthermore, the study found a positive correlation between urban population increase and built-up area. The implications of these findings are that MMC is growing in an unsustainable manner. Yet, the current planning system used to manage the growth of MMC is limited and unable to cope with the prevailing spatial reality. There is also limited capacity of spatial planning personnel, which hampers effective land use development and control, enforcement of local plans, and the lack of local level participation in the planning process. The planning inadequacies and absence of a formal land tenure system reinforces spontaneous development and subsequent proliferation of informal settlements without the necessary infrastructure and services expected of sustainable urban center. This study proposes that for MMC to become sustainable, inclusive, and safe, there is the need for new approaches to its planning and governance, beginning with a shift from the modernist to a communicative urban planning approach. The implementation of a PCE—which can generate a viable spatial structure for the MMC—would serve the purpose of minimizing informal development, and ensuring a more integrated city. Regarding efforts towards achieving SDG 11 and its 15 target indicators, evolving a planning approach as outlined in this study is not only necessary, but must be done with utmost urgency, given the rate at which city expansion (driven by population increase) is occurring in MMC.
Rapid urbanization, as recorded within MCC and many cities across Africa, has resulted in sprawl, fragmented, and unsustainable urban development patterns (see also [11]). This study has generated an insight into the nature of urbanization and growth dynamics in MMC. The methods applied herein this paper could be used in other rapidly growing sub-Saharan cities to generate insight into their spatio-temporal growth patterns to support the implementation of a PCE to serve as a long-term spatial strategy that guides the city’s growth, while, at the same time, allowing socio-economic forces and local realities to evolve.

Author Contributions

N.S.S. and G.X., Methodology; N.S.S., G.X., F.U., and P.I.K., Writing-Original Draft Preparation; N.S.S., F.U., O.J.E., and N.N.L., Writing—Review and Editing; N.S.S., G.X., F.U., and P.I.K., Visualization; F.U., and G.X., Supervision; G.X., Funding Acquisition.

Funding

This work was funded by the China Postdoctoral Science Foundation (BX20190251).

Conflicts of Interest

The authors declare no conflicts of interest.

References

  1. Delahunty, T.; Lewis-Gonzales, S.; Phelps, J.; Sawicki, B.; Roberts, C.; Carpenter, P. Land cover change and remote sensing in the classroom: An exercise to study urban growth. J. Geogr. 2012, 111, 113–122. [Google Scholar] [CrossRef]
  2. Cobbinah, P.B.; Amoako, C. Urban sprawl and the loss of peri-urban land. Int. J. Soc. Hum. Sci. 2012, 6, 388–397. [Google Scholar]
  3. Chai, B.; Seto, K.C. Conceptualizing and characterizing micro-urbanization : A new perspective applied to Africa Landscape and Urban Planning Conceptualizing and characterizing micro-urbanization : A new perspective applied to Africa. Landsc. Urban Plan. 2019, 190, 103595. [Google Scholar] [CrossRef]
  4. Xu, G.; Dong, T.; Cobbinah, P.B.; Jiao, L.; Sumari, N.S.; Chai, B.; Liu, Y. Urban expansion and form changes across African cities with a global outlook : Spatiotemporal analysis of urban land densities. J. Clean. Prod. 2019, 224, 802–810. [Google Scholar] [CrossRef]
  5. Korah, P.I.; Cobbinah, P.B.; Nunbogu, A.M. Spatial planning in ghana: Exploring the contradictions. Plan. Pract. Res. 2017, 7459, 1–24. [Google Scholar] [CrossRef]
  6. Ujoh, F.; Kwabe, I.D.; Commission, F.C. Understanding urban sprawl in the Federal Capital City, Abuja : Towards sustainable urbanization in Nigeria. J. Geogr. Reg. Plan. 2010, 3, 106–113. [Google Scholar]
  7. Zhang, L.; Weng, Q.; Shao, Z. An evaluation of monthly impervious surface dynamics by fusing Landsat and MODIS time series in the Pearl River Delta, China, from 2000 to 2015. Remote Sens. Environ. 2017, 201, 99–114. [Google Scholar] [CrossRef]
  8. Shao, Z.; Fu, H.; Li, D.; Altan, O.; Cheng, T. Remote sensing monitoring of multi-scale watersheds impermeability for urban hydrological evaluation. Remote Sens. Environ. 2019, 232, 2018. [Google Scholar] [CrossRef]
  9. Gross-Camp, N.; Rodriguez, I.; Martin, A.; Inturias, M.; Massao, G. The Type of Land We Want : Exploring the Limits of Community Forestry in Tanzania and Bolivia. Sustainability 2019, 11, 1643. [Google Scholar] [CrossRef]
  10. Ujoh, F.; Igbawua, T.; Paul, M.O. Suitability mapping for rice cultivation in Benue State, Nigeria using satellite data Suitability mapping for rice cultivation in Benue State, Nigeria using satellite data. Geo Spat. Inf. Sci. 2019, 22, 332–344. [Google Scholar] [CrossRef]
  11. Korah, P.I.; Matthews, T.; Tomerini, D. Land Use Policy Characterising spatial and temporal patterns of urban evolution in Sub-Saharan Africa : The case of Accra, Ghana. Land Use Policy 2019, 87, 104049. [Google Scholar] [CrossRef]
  12. Msofe, N.K.; Sheng, L.; Lyimo, J. Land Use Change Trends and Their Driving Forces in the Kilombero Valley Floodplain, Southeastern Tanzania. Sustainability 2019, 11, 505. [Google Scholar] [CrossRef]
  13. Xu, G.; Jiao, L.; Yuan, M.; Dong, T.; Zhang, B.; Du, C. How does urban population density decline over time? An exponential model for Chinese cities with international comparisons. Landsc. Urban Plan. 2019, 183, 59–67. [Google Scholar] [CrossRef]
  14. Antwi, E.K.; Boakye-danquah, J.; Asabere, S.B. Paper : Land use and landscape structural changes in the ecoregions of Ghana. J. Disaster Res. 2014, 9, 452–467. [Google Scholar] [CrossRef]
  15. Shao, Z.; Tian, Y.; Shen, X. BASI : a new index to extract built-up areas from high-resolution remote sensing images by visual attention model. Remote Sens. Lett. 2014, 5, 305–314. [Google Scholar] [CrossRef]
  16. Greco, S.E. Geo-spatial Information Science Seven possible states of geospatial data with respect to map projection and definition : A novel pedagogical device for GIS education de fi nition : A novel pedagogical device for GIS education. Geo Spat. Inf. Sci. 2018, 21, 288–293. [Google Scholar] [CrossRef]
  17. Silva, P.; Li, L. Mapping urban expansion and exploring its driving forces in the city of Praia, Cape Verde, from 1969 to 2015. Sustainability 2017, 9, 1434. [Google Scholar] [CrossRef]
  18. Terfa, B.K.; Chen, N.; Liu, D.; Zhang, X.; Niyogi, D. Urban Expansion in Ethiopia from 1987 to 2017: Characteristics, Spatial Patterns, and Driving Forces. Sustainability 2019, 11, 2973. [Google Scholar] [CrossRef]
  19. Dambeebo, D.; Jalloh, C.A. Sustainable urban development and land use management : Wa municipality in perspective, Ghana. J. Sustain. Dev. 2018, 11, 235–248. [Google Scholar] [CrossRef]
  20. Bhanjee, S.; Zhang, C.H. Mapping latest patterns of urban sprawl in dar es salaam, Tanzania. Pap. Appl. Geogr. 2018, 4, 292–304. [Google Scholar] [CrossRef]
  21. Ernest, S.; Nduganda, A.R.; Kashaigili, J.J. Urban climate analysis with remote sensing and climate observations: A case of Morogoro municipality in Tanzania. Adv. Remote Sens. 2017, 6, 120–131. [Google Scholar] [CrossRef]
  22. UN Habitat. Planned City Extensions: Analysis of Historical Examples; United Nations Human Settlements Programme (UN-Habitat): Nairobi, Kenya, 2015. [Google Scholar]
  23. Usman, V.A.; Makinde, E.O.; Salami, A.T. Geospatial Assessment of the impact of Urban Sprawl in Akure, Southwestern Nigeria. J. Geosci. Environ. Prot. 2018, 6, 123–133. [Google Scholar] [CrossRef]
  24. Jiao, L. Urban land density function: A new method to characterize urban expansion. Landsc. Urban Plan. 2015, 139, 26–39. [Google Scholar] [CrossRef]
  25. United Nations. The world’s cities in 2016: Data booklet. Econ. Soc. Aff. 2016, 29. [Google Scholar] [CrossRef]
  26. Desa, U.N. Transforming Our World: The 2030 Agenda for Sustainable Development; UN DESA: New York, NY, USA, 2015. [Google Scholar]
  27. Emanuel Gombe, K.; Asanuma, I.; Park, J.-G. Quantification of annual urban growth of Dar es Salaam Tanzania from Landsat time Series data. Adv. Remote Sens. 2017, 6, 175–191. [Google Scholar] [CrossRef]
  28. Xu, G.; Jiao, L.; Liu, J.; Shi, Z.; Zeng, C.; Liu, Y. Understanding urban expansion combining macro patterns and micro dynamics in three Southeast Asian megacities. Sci. Total Environ. 2019, 660, 375–383. [Google Scholar] [CrossRef]
  29. Kilawe, C.J.; Mertz, O.; Silayo, D.S.A.; Birch-Thomsen, T.; Maliondo, S.M. Transformation of shifting cultivation: Extent, driving forces and impacts on livelihoods in Tanzania. Appl. Geogr. 2018, 94, 84–94. [Google Scholar] [CrossRef]
  30. Li, D.; Ma, J.; Cheng, T.; van Genderen, J.L.; Shao, Z. Challenges and opportunities for the development of megacities. Int. J. Digit. Earth 2018, 1–14. [Google Scholar] [CrossRef]
  31. Sumari, N.S.; Shao, Z.; Huang, M.; Sanga, C.A.; van Genderen, J.L. Urban expansion: A geo-spatial approach for temporal monitoring of loss of agricultural land. Int. Arch. Photogramm. Remote Sens. Spat. Inf. Sci. Arch. 2017. [Google Scholar] [CrossRef]
  32. Worrall, L.; Colenbrander, S.; Palmer, I.; Makene, F.; Mushi, D.; Mwijage, J.; Godfrey, N. Better Urban Growth in Tanzania: Preliminary Exploration of the Opportunities and Challenges. Working Paper. 2017.
  33. Blumenfeld, H. The tidal wave of metropolitan expansion. J. Am. Inst. Plann. 1954, 20, 3–14. [Google Scholar] [CrossRef]
  34. United Republic of Tanzania (URT). The 2012 Population and Housing Census: Population Distribution by Administrative Areas. National Bureau of Statistics, Ministry of Finance, Dar es Salaam; and Office of the Chief Government Statistician, Ministry of State, President’s Office, State House and Good Governance Zanzibar, Government printer; Dar es Salaam. 2013. Available online: http://www.tzdpg.or.tz/fileadmin/documents/dpg_internal/dpg_working_groups_clusters/cluster_2/water/WSDP/Background_information/2012_Census_General_Report.pdf (accessed on 15 November 2019).
  35. United Republic of Tanzania (URT). National Population Projections. National Bureau of Statistics; Ministry of Finance and planning Dar es Salaam and Office of Chief Government Statistician Ministry of Finance and planning Zanzibar; Tanzania. 2018. Available online: https://www.nbs.go.tz/nbs/takwimu/census2012/Projection-Report-20132035.pdf (accessed on 15 November 2019).
  36. Shao, Z.; Deng, J.; Wang, L.; Fan, Y.; Sumari, N.; Cheng, Q. Remote sensing fuzzy autoencode based cloud detection for remote sensing imagery. Remote Sens. 2017, 9, 311. [Google Scholar] [CrossRef]
  37. Cattani, E.; Merino, A.; Guijarro, J.A.; Levizzani, V. East Africa Rainfall trends and variability 1983–2015 using three long-term satellite products. Remote Sens. 2018, 10, 1–26. [Google Scholar] [CrossRef]
  38. Cobbinah, P.B.; Darkwah, R.M. African urbanism: The geography of urban greenery. Urban Forum 2016, 27, 149–165. [Google Scholar] [CrossRef]
  39. Yu, X.; Zhang, B.Q.; Li, Q.; Chen, J. A method characterizing urban expansion based on land cover map at 30 m resolution. Sci. China Earth Sci. 2016, 59, 1738–1744. [Google Scholar] [CrossRef]
  40. Jiao, L.; Liu, J.; Xu, G.; Dong, T.; Gu, Y.; Zhang, B.; Liu, Y.; Liu, X. Proximity Expansion Index: An improved approach to characterize evolution process of urban expansion. Comput. Environ. Urban Syst. 2018, 70, 102–112. [Google Scholar] [CrossRef]
  41. Jiao, L.M.; Tang, X.; Liu, X.P. Spatial linkage and urban expansion: An urban agglomeration view. Int. Arch. Photogramm. Remote Sens. Spat. Inf. Sci. Arch. 2017, 42, 1203–1211. [Google Scholar] [CrossRef] [Green Version]
  42. Jiao, L.; Xu, G.; Xiao, F.; Liu, Y.; Zhang, B. Analyzing the impacts of urban expansion on green fragmentation using constraint gradient analysis. Prof. Geogr. 2017, 69, 553–566. [Google Scholar] [CrossRef]
  43. UN-HABITAT. Tanzania: Morogoro Profile; United Nations Human Settlements Programme: Nairobi, Kenya, 2009; ISBN 978-92-1-132129-6. [Google Scholar]
  44. Farmer, P.; Frojmovic, M.; Hague, C.; Harridge, C.; Narang, S.; Shishido, R.; Siegel, D.; Taylor, P.; Vogelij, J. Reinventing planning: A new governance paradigm for managing human settlements. Plan Canada 2006, 46, 19–21. [Google Scholar]
  45. Foxon, T.J.; Hammond, G.P.; Pearson, P.J. Developing transition pathways for a low carbon electricity system in the UK. Technol. Forecast. Soc. Chang. 2010, 77, 1203–1213. [Google Scholar] [CrossRef] [Green Version]
  46. Freytag, T.; Gössling, S.; Mössner, S. Living the green city: Freiburg’s Solarsiedlung between narratives and practices of sustainable urban development. Local Environ. 2014, 19, 644–659. [Google Scholar] [CrossRef]
  47. Roggema, R. The future of sustainable urbanism: A redefinition. City Territ. Archit. 2016, 3, 1–12. [Google Scholar] [CrossRef] [Green Version]
  48. Sumari, N.S.; Shao, Z.; Genderen, J.L.; Van Musakwa, W. Status of geoinformatics education and training in Sub-Saharan Africa: Initiatives taken and challenges. J. Geogr. High. Educ. 2019, 43, 224–243. [Google Scholar] [CrossRef]
  49. Tanveer, H.; Balz, T.; Sumari, S.; Shan, R. Pattern analysis of substandard and inadequate distribution of educational resources in urban–rural areas of Abbottabad, Pakistan. GeoJournal 2019, 1–13. [Google Scholar] [CrossRef]
  50. Taleb, N.N. Antifragile—Things that Gain from Disorder; Random House: New York, NY, USA, 2012. [Google Scholar]
  51. Beatley, T. Green Urbanism; Learning from European Cities; Island Press: Washington, DC, USA, 2000. [Google Scholar]
  52. Kristinsson, J. Integrated Sustainable Design; van den Dobbelsteen, A., Ed.; Delft Digital Press: Delft, The Netherlands, 2012. [Google Scholar]
  53. Portugali, J. Self-Organisation and the City; Springer: Berlin, Germany, 2000. [Google Scholar]
  54. Ikeda, S. Urban interventionism and local knowledge. Rev. Austrian Econ. 2004, 17, 247–264. [Google Scholar] [CrossRef]
  55. Andersson, D.E. (Ed.) The Spatial Market Process; Emerald: Bingley, UK, 2012. [Google Scholar]
  56. Bettencourt, L.M. The origin of scaling in cities. Science 2013, 340, 1438–1441. [Google Scholar] [CrossRef] [Green Version]
  57. Bettencourt, L.M. Cities as complex systems. In Modeling Complex Systems for Public Policies; Furtado, B.A., Ed.; Spinger: Heidelberg, Germany, 2015. [Google Scholar]
  58. Kithakye, D.; Mutashubirwa, P.; Kayani, L. Tanzania: Dar es Salaam city profile; Uited Nations Human Satellent programme: Nairobi, Kenya, 2009. [Google Scholar]
  59. Habitat III secretatiat, The united repulic of tanzania ministry of lands, housing and human settlements development. habitat iii national report tanzania; Dar es Salaam. 2015. Available online: http://habitat3.org/wp-content/uploads/Tanzania-HABITAT-III-NATIONAL-REPORT.pdf (accessed on 15 November 2019).
Figure 1. Location of study area, Morogoro Municipal Council (MMC).
Sustainability 11 06508 g001
Figure 2. Conceptual framework and proposed workflow of the study.
Sustainability 11 06508 g002
Figure 3. Classified land use and land cover of study area.
Sustainability 11 06508 g003
Figure 4. The distance decay of urban land density. (a) The concentric rings with 0.5 km interval are used to measure the density of urban land in each ring at three time points. (b) Fitted curves of the urban land density.
Sustainability 11 06508 g004
Figure 5. Correlations of increments of population and built-up area in each sub-district (ward) from 2010 to 2018. The size of each dot scales with their population size in 2018.
Sustainability 11 06508 g005
Figure 6. Urban land use patterns in 2018 in Morogoro Municipal Council.
Sustainability 11 06508 g006
Figure 7. The current land use zoning. (A) Commercial at Mji mpya; (B) mixed-use at Kihonda.
Sustainability 11 06508 g007
Table 1. Summary of a land use change matrix form 2000, 2010, and 2018.
Classes200020102018
%Km2%Km2%Km2
Built-up2.8515.454.1422.389.4551.12
Cultivation21.11114.1619.52105.5718.0997.80
Water0.462.520.492.660.392.10
Bushland62.53338.0363.06340.9359.46321.42
Bareland4.3023.094.6225.013.9921.58
Swamp3.2517.623.4218.503.2717.68
Forest5.4929.714.7225.535.3328.80
Table 2. Parameters and goodness of fit of the urban land density function in 2000, 2010, and 2018.
Year α c D R2
20001.4840.0053.0070.993
20101.3630.0043.4090.987
20181.2060.0563.5800.972

