Comparisons between Aquaponic and Conventional Hydroponic Crop Yields: A Meta-Analysis


1
Department of Horticulture, Auburn University, Auburn, AL 36849, USA
2
CSIR-Savanna Agricultural Research Institute, Nyankpala-Tamale, P.O. Box TL 52, Ghana
3
Department of Energy and Environment, Southern Research, Birmingham, AL 35205, USA
4
School of Fisheries, Aquaculture, and Aquatic Sciences, Auburn University, Auburn, AL 36849, USA
*
Author to whom correspondence should be addressed.
Sustainability 2019, 11(22), 6511; https://0-doi-org.brum.beds.ac.uk/10.3390/su11226511
Submission received: 22 October 2019
/
Revised: 9 November 2019
/
Accepted: 11 November 2019
/
Published: 19 November 2019
Abstract
:Aquaponic is a relatively new system of farming, which has received much research attention due to its potential for sustainability. However, there is no consensus on comparability between crop yields obtained from aquaponics (AP) and conventional hydroponics (cHP). Meta-analysis was used to synthesize the literature on studies that compared crop yields of AP and cHP. Factors responsible for differences were also examined through subgroup analysis. A literature search was conducted in five databases with no time restriction in order to capture any publication on AP and cHP crop yield comparisons. The search was, however, limited to journal and conference articles published in English. Study characteristics and outcome measures of food crops were extracted. A natural log response ratio effect size measure was used to transform study outcomes. An unweighted meta-analysis was conducted through bootstrapping to calculate overall effect size and its confidence interval. Between-study heterogeneity (I2) was estimated using a random effects model. Subgroup and meta-regression were used to assess moderators, in an attempt to explain heterogeneity in the effect size. The results showed that although crop yield in AP was lower than conventional cHP, the difference was not statistically significant. However, drawing conclusions on the overall effect size must be done with caution due to the use of unweighted meta-analysis. There were statistically significant effects of aquatic organism, hydroponic system type, and nutrient supplementation used in the studies on crop yield comparisons. Nutrient supplementation, particularly, led to on average higher crop yield in AP relative to cHP. These findings are a vital information source for choosing factors to include in an AP study. These findings also synthesize the current trends in AP crop yields in comparison with cHP.
1. Introduction
Aquaponics (AP) is a farming system that integrates a recirculating aquaculture system (RAS) with hydroponics (HP) into a single production system [1]. Conventional hydroponics (hereafter, cHP) has been described as an intensive cultivation of crops in soilless media, and RAS is intensive farming of aquatic animals (e.g., fish, crawfish, and shrimp). The concept of aquaponics was introduced due to the need for nutrient recycling of aquaculture waste [2]. AP is suggested to reduce impacts of eutrophication, water usage, and geographic footprint of aquaculture as a result of the symbiotic ecosystem created by integrating aquaculture with HP [3]. Aquaponics systems also efficiently use water and nutrients [4]. Aquaponics offers a potential for sustainability in crop production [5,6,7,8,9] by combining the benefits of controlled environment agriculture and nutrient recycling. However, a major constraint to AP sustainability is crop yield comparability between the system and cHP. Since aquaponics is a new approach, its acceptance depends on its ability to compete with, or at least compare well in crop yield to, cHP. The ability of AP crop yield to compare with cHP depends on several factors, which have been examined sparingly in the literature. However, there is still no consensus on how well AP crop yields compare with cHP. Whereas some studies show that aquaponically-grown crops have lower crop yields than cHP systems [10,11,12,13], other studies show that higher or similar crop yields could be obtained for aquaponics compared to cHP systems [14,15,16]. Economic assessment of AP sustainability [17,18,19] and life cycle assessment have been done elsewhere in the literature [20]. Therefore, the aim of this meta-analysis was not to assess the economic or environmental sustainability of aquaponics, but to focus on crop productivity.
Contrasting reports on AP crop yield comparisons with cHP are due to the rather numerous factors that contribute to crop yield variability in AP. Factors such as fish species, feed protein content, flow rates, aquaculture effluent pH [21], fish density [22], feeding rate [23], and AP coupling type, among other factors, greatly contribute to variability in nutrient quantity and quality in AP systems, thereby affecting crop yield. Generally, aquaculture effluent is usually low in essential crop nutrients required for optimum plant growth, warranting the need for nutrient supplementation. Reports show that nutrient supplementation leads to similar, or even higher, AP crop yield as cHP [24,25,26]. Other factors that influence AP crop yield include crop species [27,28], substrate/grow media type [14,28,29], HP system type, and a myriad of others, which affect nutrient availability and uptake by crops [2,30,31,32,33]. A combination of factors from the aquaculture and HP components interact to affect crop yields in AP and how they compare with cHP systems. Therefore, comparing crop yields between AP and cHP requires accounting for these factors. Studies that compare AP and cHP are unable to include all these factors in a single experiment due to obvious practical reasons of cost and labor.
Meta-analysis enables the synthesis of all studies that compare AP and cHP and a delineation of factors responsible for any difference between the two systems. Meta-analysis is a quantitative approach used to synthesize research findings [34]. The approach allows for an estimation of an effect size that enables the comparison across studies with a similar research question [34,35]. An effect size can be quantified using various effect size metrics [35]. Due to the quantitative nature of meta-analysis, data from various studies that compared AP and cHP crop yield were combined. Meta-analysis also allowed us to separate the contribution of the factors listed above to the overall crop yield difference. The objectives of this study were to (1) quantify the magnitude of crop yield difference between aquaponics and conventional hydroponics, (2) estimate between study heterogeneity in estimating a summary effect size, and (3) conduct subgroup analysis to account for the heterogeneity in quantifying summary effect size.
2. Methodology
2.1. Literature Search
The search began on 4 March 2019 in Web of Science, CAB Abstracts, Agricola, Aquatic Science and Fisheries Abstracts (ASFA), and ProQuest Dissertations and Theses Global. These databases are known to index aquaponics-related publications. The search terms “aquaponic* AND hydroponic* AND crop yield”, were used to search Agricola, CAB Abstracts, while “aquaponic* OR recirculat* aquaculture AND hydroponic*) AND TOPIC: (crop* yield OR crop* growth OR vegetable*)” were used in Web of Science, ASFA, and ProQuest Dissertations and Theses Global. The Boolean truncation (*) was used to capture all variations of the words. The literature search was constrained to publications in English. Reviews and editorial materials were also excluded. Any study that had the words “Aquaponics” and “Hydroponics” was captured by the search. There was no publication date limitation placed on the search range so as not to miss earlier publications related to aquaponics.
2.2. Inclusion Criteria
The studies were screened based on the criteria described in Preferred Reporting Items for Systematic reviews and Meta-Analysis (PRISMA) [36]. The following criteria were used to screen the main text of articles for inclusion: (1) Studies that compared AP with conventional HP, (2) conducted on a food crop, (3) contained replicated controlled trials, and (4) reported a mean and associated sample size. Any measure of variance was not considered in the inclusion criteria because (1) most studies did not report any measure of variance, and (2) the effect size metric chosen for this meta-analysis did not require a measure of variance.
2.3. Data Extraction and Processing
Data from included studies were extracted into Microsoft (MS) Excel for further processing. Important variables extracted included author(s) first name and year of publication, focal fish/aquatic species used in each study, mean fish stocking density, protein content of fish feed, type of AP system (coupled or decoupled), HP system type (media-based, nutrient film technique, or deep water culture), type of grow media, crop, and whether nutrients were supplemented or not. Categorical design variables were used for subgroup analysis, while continuous variables were used in meta-regression. The study outcomes extracted included the sample sizes, mean and variance components (standard deviation (SD), standard error, or 95% confidence intervals) of yield and yield components, although the variance measures were not used in the analysis. For leafy vegetables such as lettuce, basil, and spinach, shoot fresh weight was used as yield. Studies that presented their data in graphs were extracted using ImageJ, following best practices of the software.
2.4. Effect Size Calculation and Estimation of Overall Effect Size
In the current study, a log response ratio was chosen due to its ability to accommodate studies that do not report measures of variance, such as standard error or confidence intervals [35]. The effect size measure used was the log response ratio [37,38], which is estimated using Equation (1):
where YAp, and YHp are the mean yields from the AP and HP systems, respectively, and lnR is the natural log response. Effect size was transformed back to the response ratio for the easy biological interpretation of results. The random-effects model with a restricted maximum likelihood estimator (REML) was used to calculate the overall (summary) effect size, its 95% confidence intervals (CIs), and heterogeneity. Estimation of overall effect was done using an unweighted meta-analysis by bootstrapping. The open-source, cross-platform software for ecological and evolutionary meta-analysis (OPENMEE) was used for bootstrapping meta-analysis. Unweighted analysis was adopted to enable inclusion of studies that did not report any variance measure (standard deviation, standard error, or CIs). Moreover, the calculation of lnR does not require variance measures. In total, 50 effect sizes were obtained from 22 studies.
2.5. Subgroup Analysis and Meta-Regression
Subgroup analysis was conducted on type of fish/aquatic species, type of AP system, HP system type (media-based, nutrient film technique, or deep-water culture), type of grow media, crop, and whether nutrients were supplemented or not. Subgroup analysis was done using OPENMEE and the R metafor package. Results of subgroup analysis were then extracted from the program and plotted using MS Excel. Meta-regression was conducted to determine the relationship between effect size and feed protein content and mean fish stocking density. Meta-regression was done in R [39] with the “meta” package. The “bubble” function in the package was used to visualize the meta-regression (see code in supplementary materials). Meta-regression usually assumes a linear relationship between the explanatory variable(s) and the outcome measure, where p-values are based on the null hypothesis that the slope of the regression line is zero, and significant outcomes simply suggest that the slope significantly differs from zero and that there is a relationship (positive or negative) between the factor and outcome being compared [40]. Subgroup analysis that adopts a meta-regression approach also allows for formal statistical tests for differences between subgroups where they are categorical [40]. However, the current assessment did not adopt the meta-regression approach for categorical subgroup analysis, but only for the continuous independent variables.
3. Results
3.1. Study Descriptions
There was a steady growth in number of publications (K used here to distinguish number of studies from number of effect sizes n) that compare AP and cHP in a single trial from 2009 to 2018. The distribution of articles for the period were 2009 (K = 1), 2011 (K = 10), 2012 (K = 2), 2014 (K = 1), 2015 (K = 1), 2016 (K = 4), 2017 (K = 4), and 2018 (K = 8). The results also show that tilapia (K = 8), followed by carp (K = 6), were the most common fish used in these experiments. Rainbow trout and Pangasius fish appeared in two studies each. It was also found that some studies used crayfish and shrimp in their AP systems. The number for carp was high because all types of carp, including koi, were grouped together. The distribution of fish in studies could be due to ease of management. Tilapia, for instance, is a hardy fish and can tolerate a wide range of water quality conditions and densities, whereas other aquatic species such as crayfish and shrimp are quite difficult to manage. Feed crude protein (CP) content ranged from 30% (K = 1) to 48% (K = 2). In one study, the CP was estimated as 84% from the description of feed given in that study. This might be a possible outlier for meta-regression between effect size and feed CP. Most of the studies used feed containing CP of 46% (K = 6), followed by 32% and 38% with K = 3 each. Fish stocking density ranged from 0.5 kg·m−3 (K = 1) to about 53 kg·m−3 (K = 1). A substantial number of studies did not report the stocking density (K = 8). The predominant stocking density used was 7 kg·m−3 (K = 3), followed closely by 6.4 kg·m−3 (K = 3). Most of the studies used homogenous age composition (K = 12), while nine other studies used heterogeneous ages of their aquatic/fish species. One study did not report age composition of the aquatic/fish species. Assessment of aquaponics coupling type showed that almost all studies used coupled/single loop aquaponics system (K = 20), whereas one study used a decoupled system and one study did not indicate the type of coupling used.
Hydroponics systems were mainly deep-water culture (DWC, K = 9), media-based (K = 6), and nutrient film technique (NFT, K = 7). It should be noted that both organic and inorganic media were grouped as media-based system. Grow media used were light expanded clay aggregates (LECA, K = 1) and perlite (K = 3). Coconut coir, expanded vermiculite, and coconut shell fiber were grouped together as ‘other’ (K = 3). Grow media used in studies that adopted DWC and NFT systems were grouped as none (K = 15). This implied that more studies used DWC and NFT than all media-based systems combined. Distribution of crops showed that most of the trials were conducted using lettuce (K = 10) as their test crop, while a few studies used crops such as spinach, strawberry, tomato, basil, and cucumber. It was found that 13 out of the 22 studies examined did not supplement their aquaculture effluent.
3.2. Crop Yield across Studies
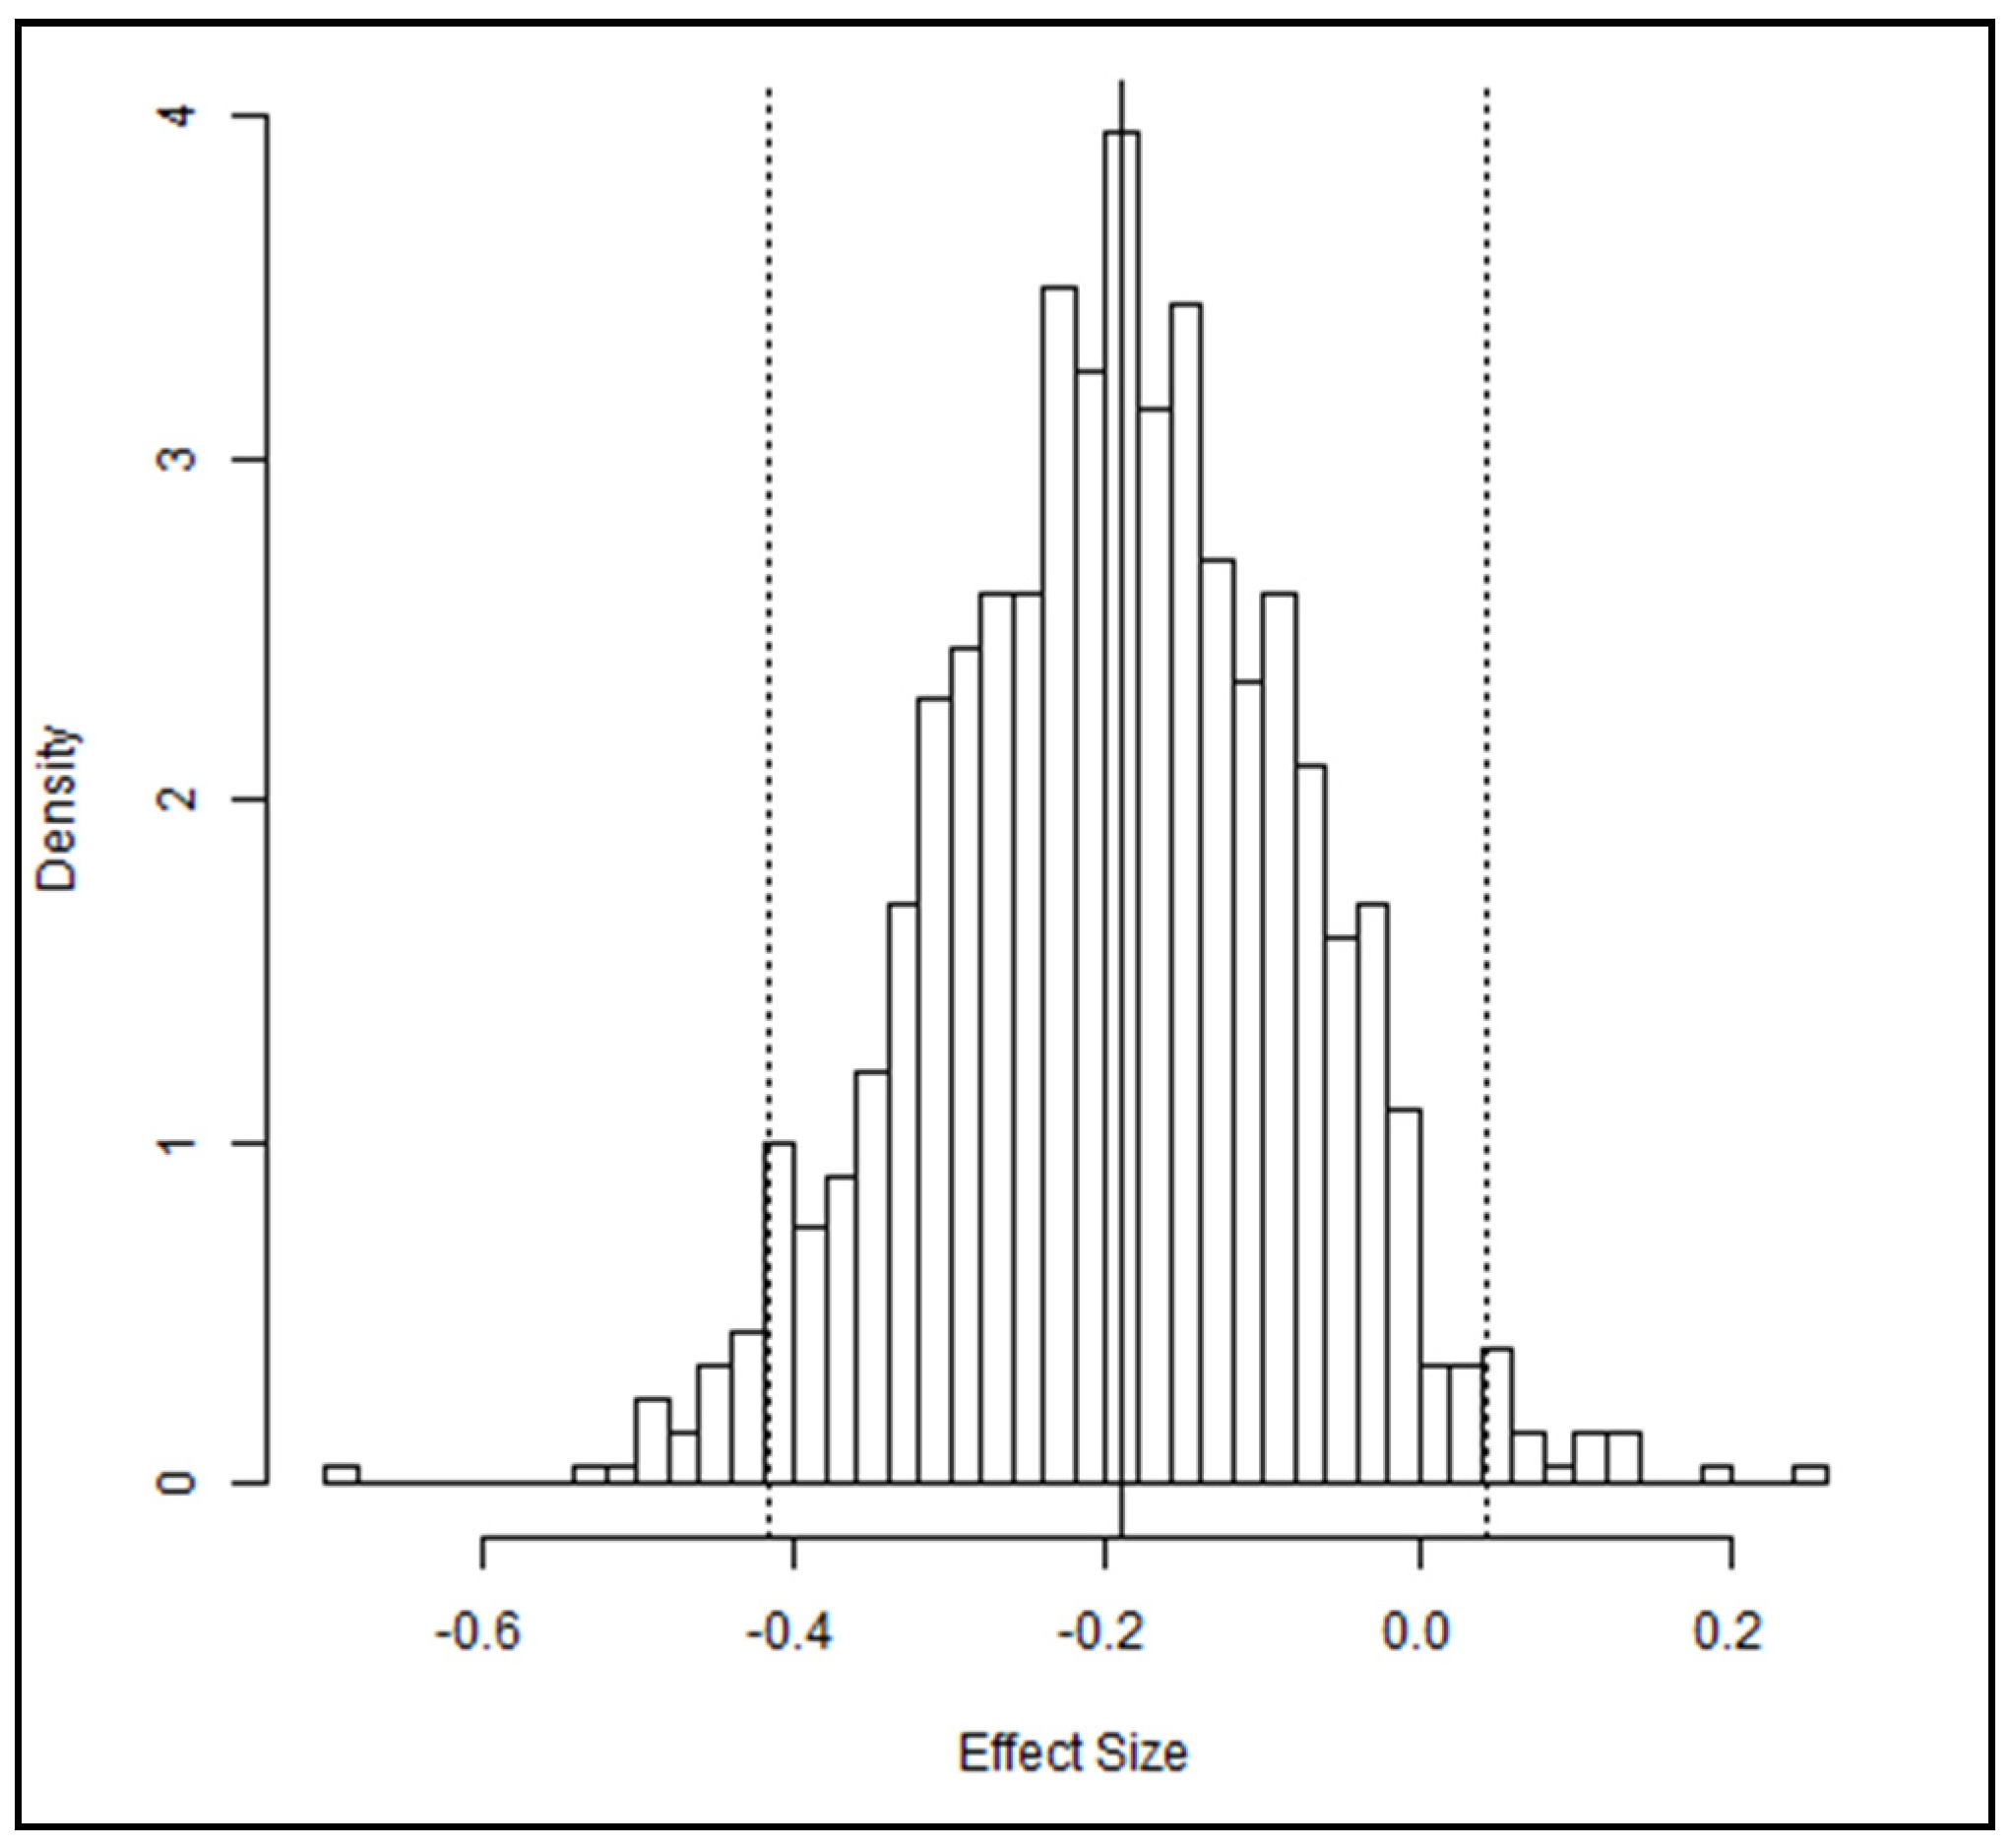
To understand crop yield across studies, there was the need to understand heterogeneity between studies. Heterogeneity between studies confound the pooling of data across studies into a common effect size. In our case, there was high between-study heterogeneity, which called for the need of subgroup analysis. Heterogeneity among the studies was assessed using the restricted maximum likelihood estimator (REML) and inconsistency index (I2) [41]. The authors classified I2-values into 0–25%, 30–50%, and ≥75% as small, moderate, and substantial heterogeneity, respectively. The current review therefore revealed that substantial between-study heterogeneity (I2 = 100%; not shown) existed in the studies used for estimating the overall effect size for AP and HP crop yield comparisons. Therefore, drawing conclusions on the overall effect size must be done with caution. This high heterogeneity could be due to high variability in aquaponics experiments. The slightest change in one component, either from the aquaculture or the hydroponic side, can result in tremendous influence in heterogeneity. The results shown here (Figure 1) are the overall effect sizes and the bootstrapped 95% confidence intervals (CIs).
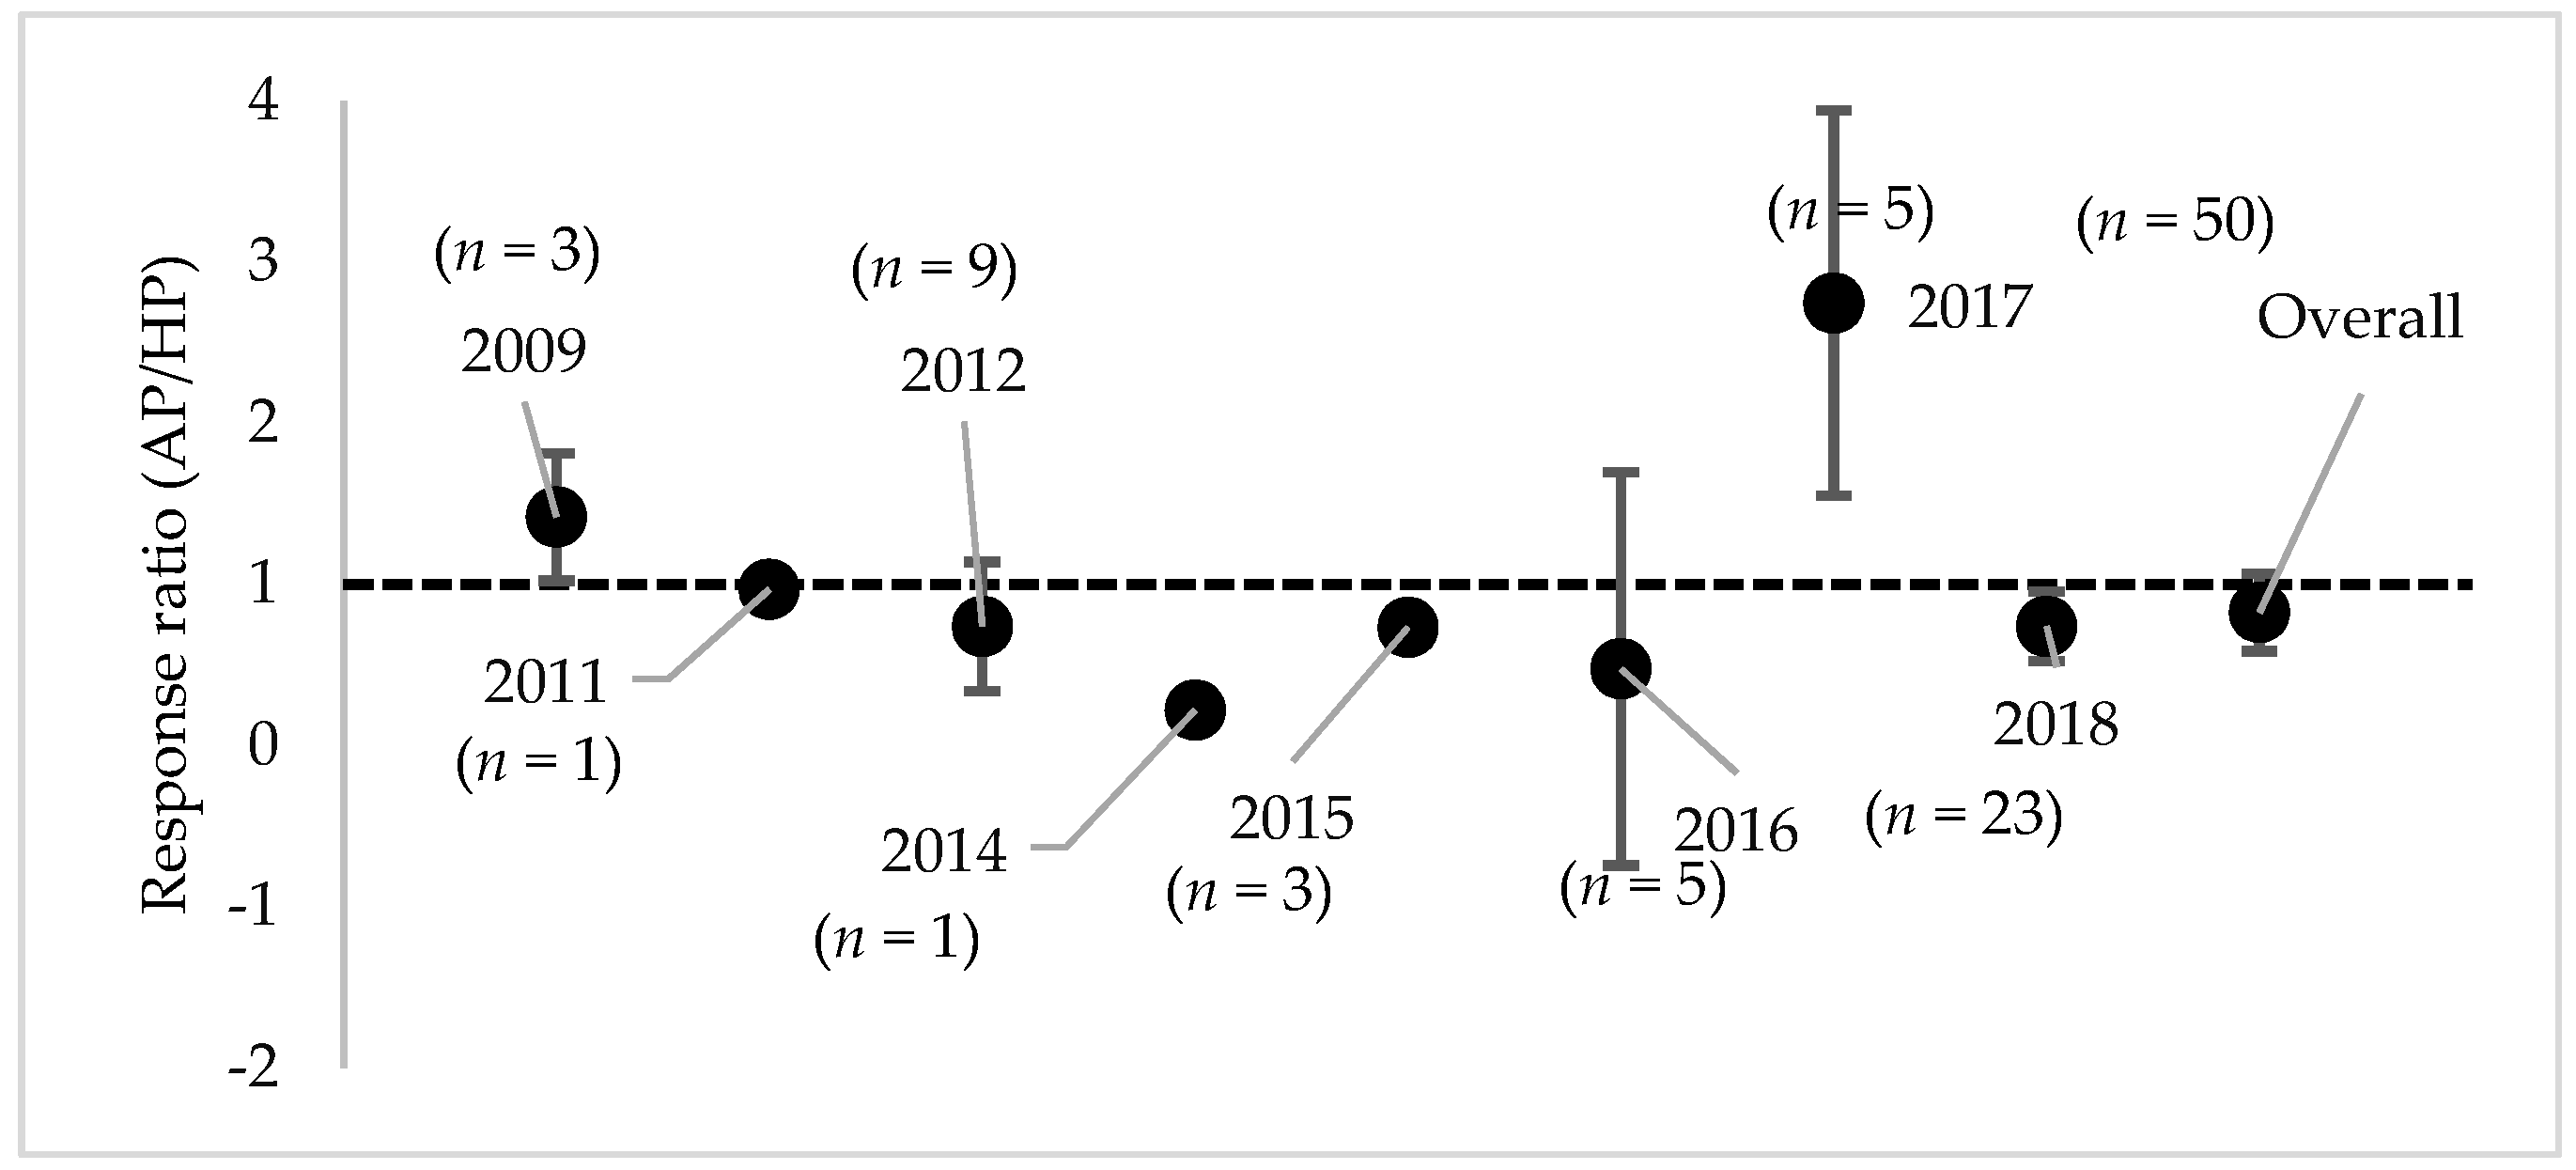
When categorized based on study year, it was realized that effect sizes were variable for different study years. However, apart from studies in 2009 and 2017, all other study years suggest that cHP crop performance is superior to AP performance (Figure 2).
3.3. Publication Bias
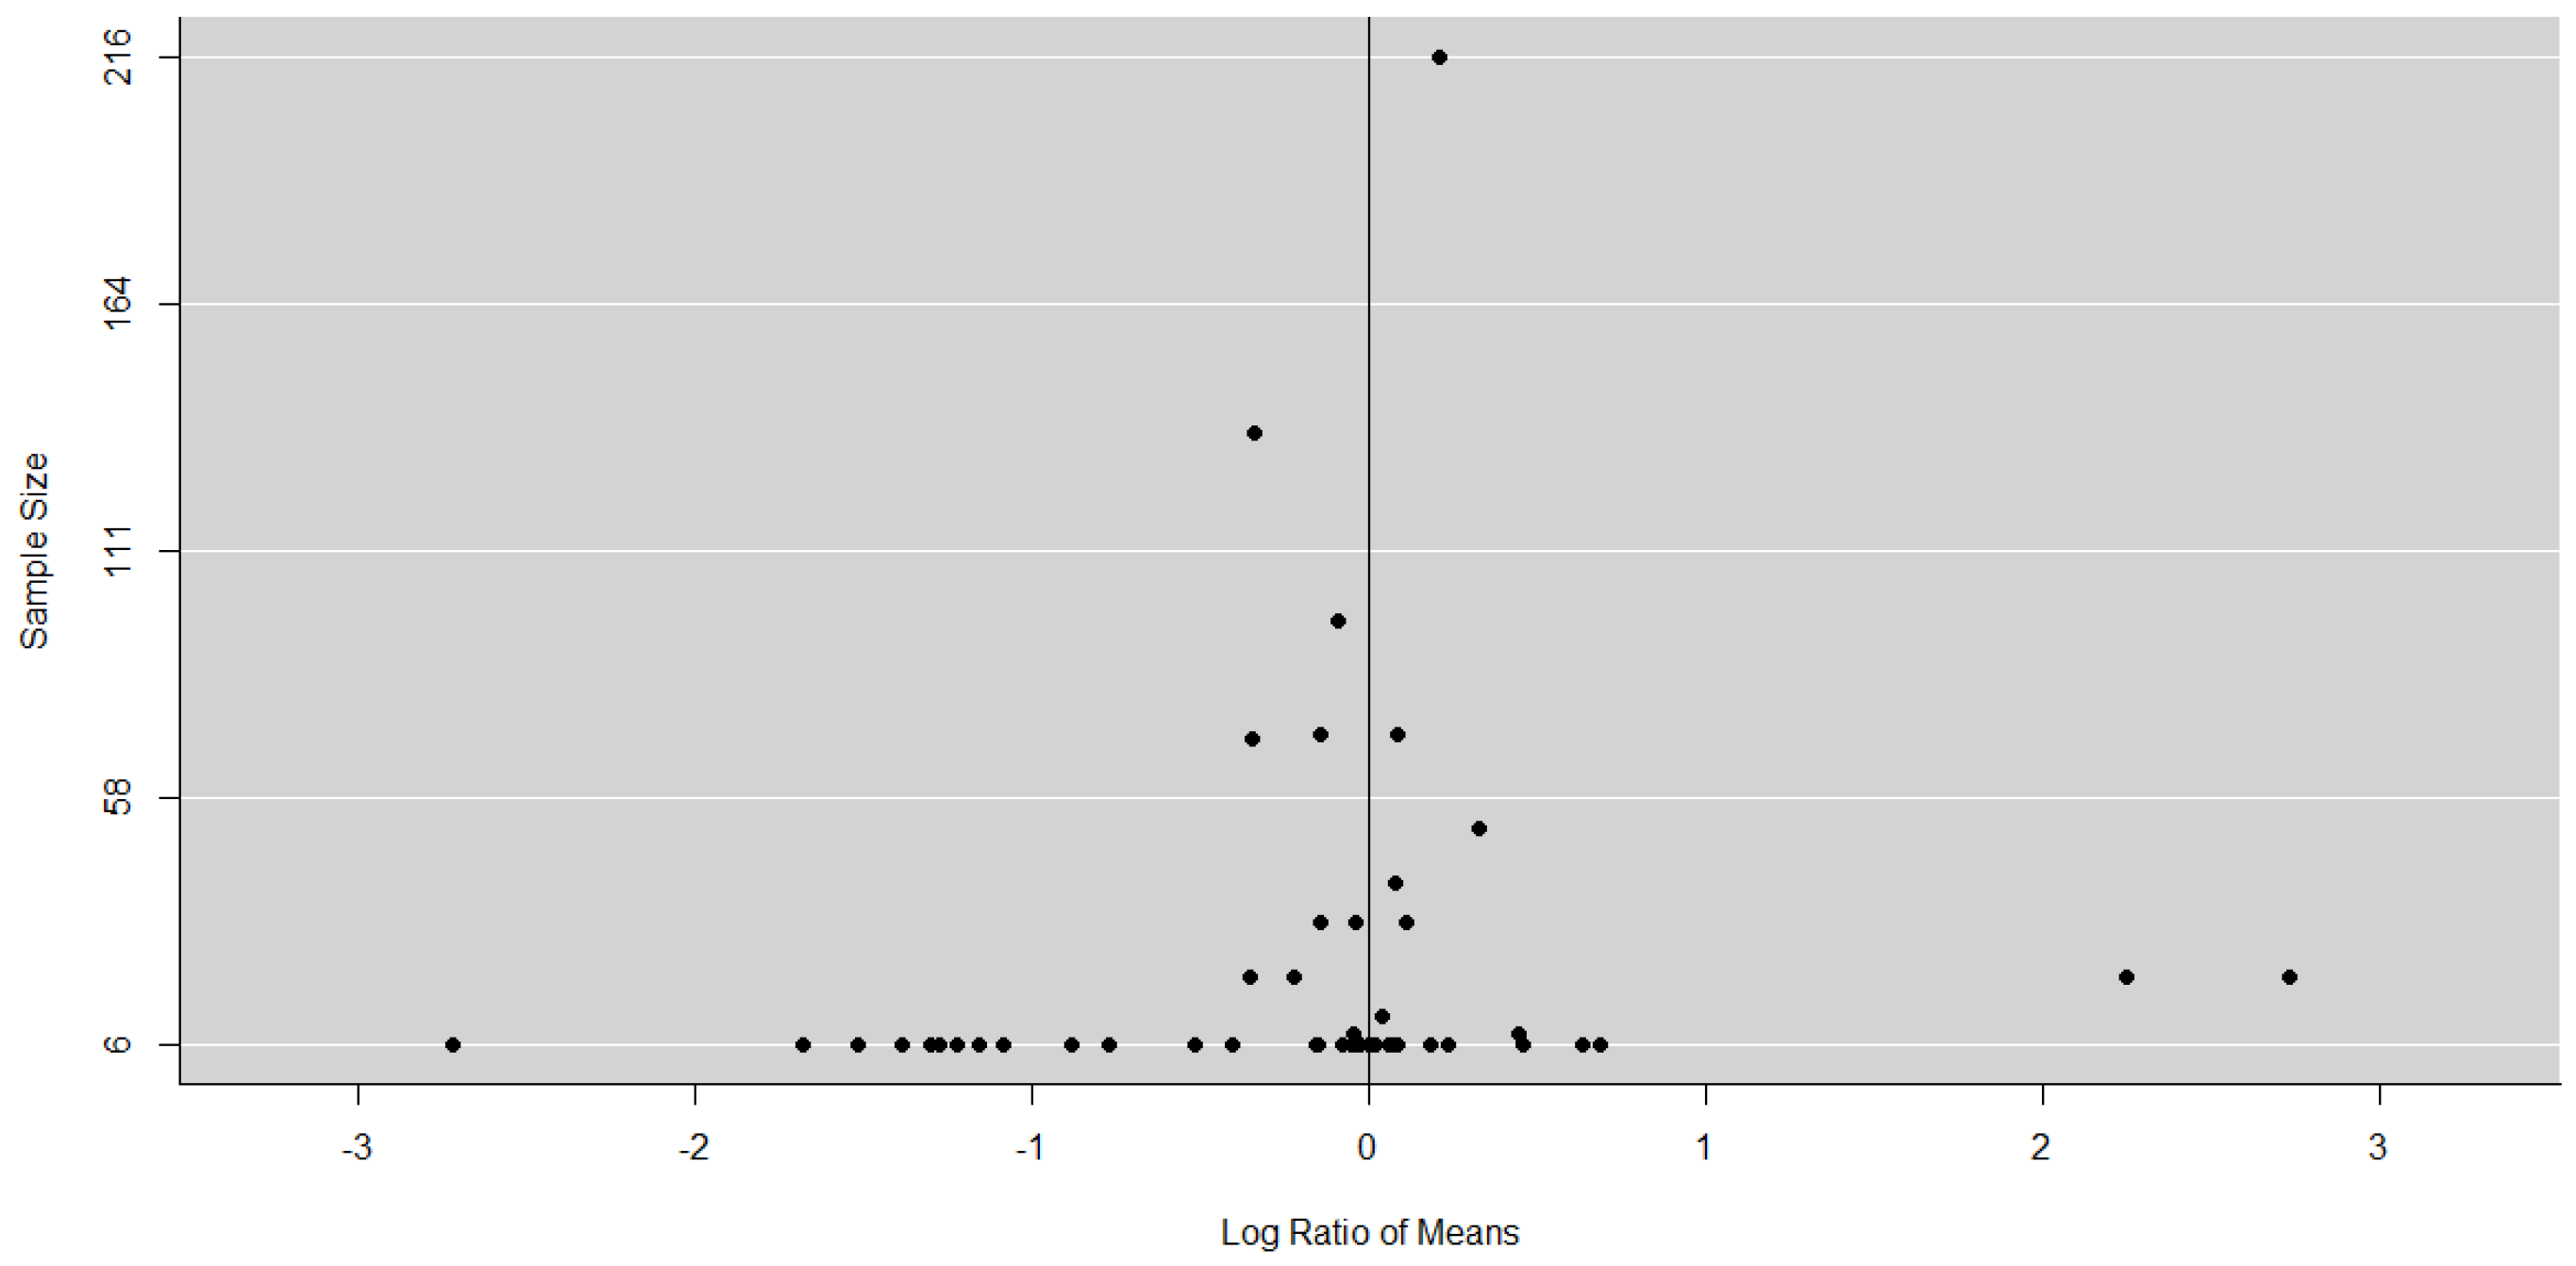
Publication bias was assessed with Rosenthal’s fail-safe number and a funnel plot (Figure 3). The fail-safe number is an estimate of the number of non-significant studies required to nullify the results of the meta-analysis. A fail-safe number (FSN) greater than 5k + 10 (where k is the number of studies) is enough to consider publication bias inconsequential [42]. That is, for our study, a fail-safe number greater than 120 would make publication bias inconsequential. A fail-safe number of 353 was obtained in the current study. Both the funnel plot and FSN were executed using the metafor package in R. The funnel plot was constructed with effect size (x-axis) against sample size (y-axis), because this study adopted an unweighted analysis approach.
3.4. Moderators
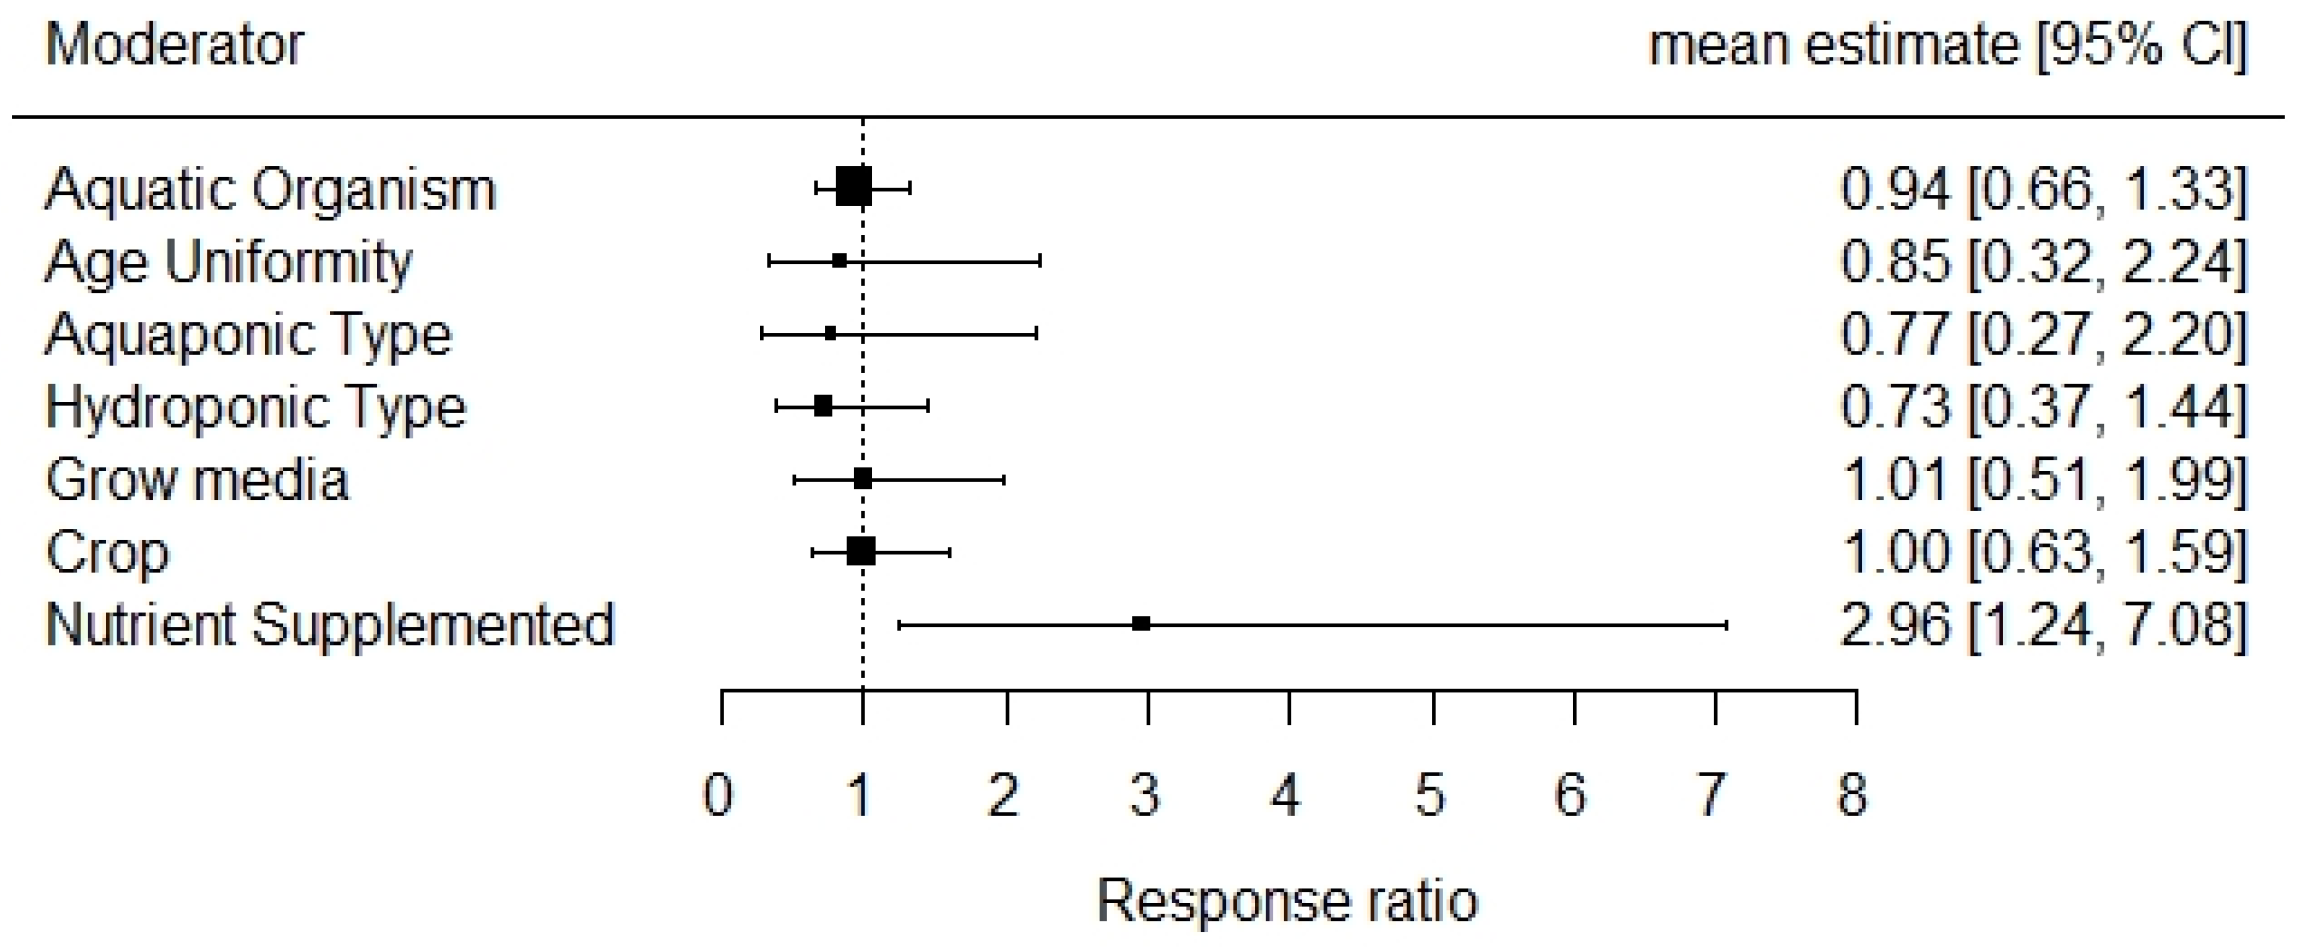
There was a significant effect of the moderator type that helped explain heterogeneity observed in our results (Figure 4)
A. Hydroponic Components
1. Hydroponic System and Media Type
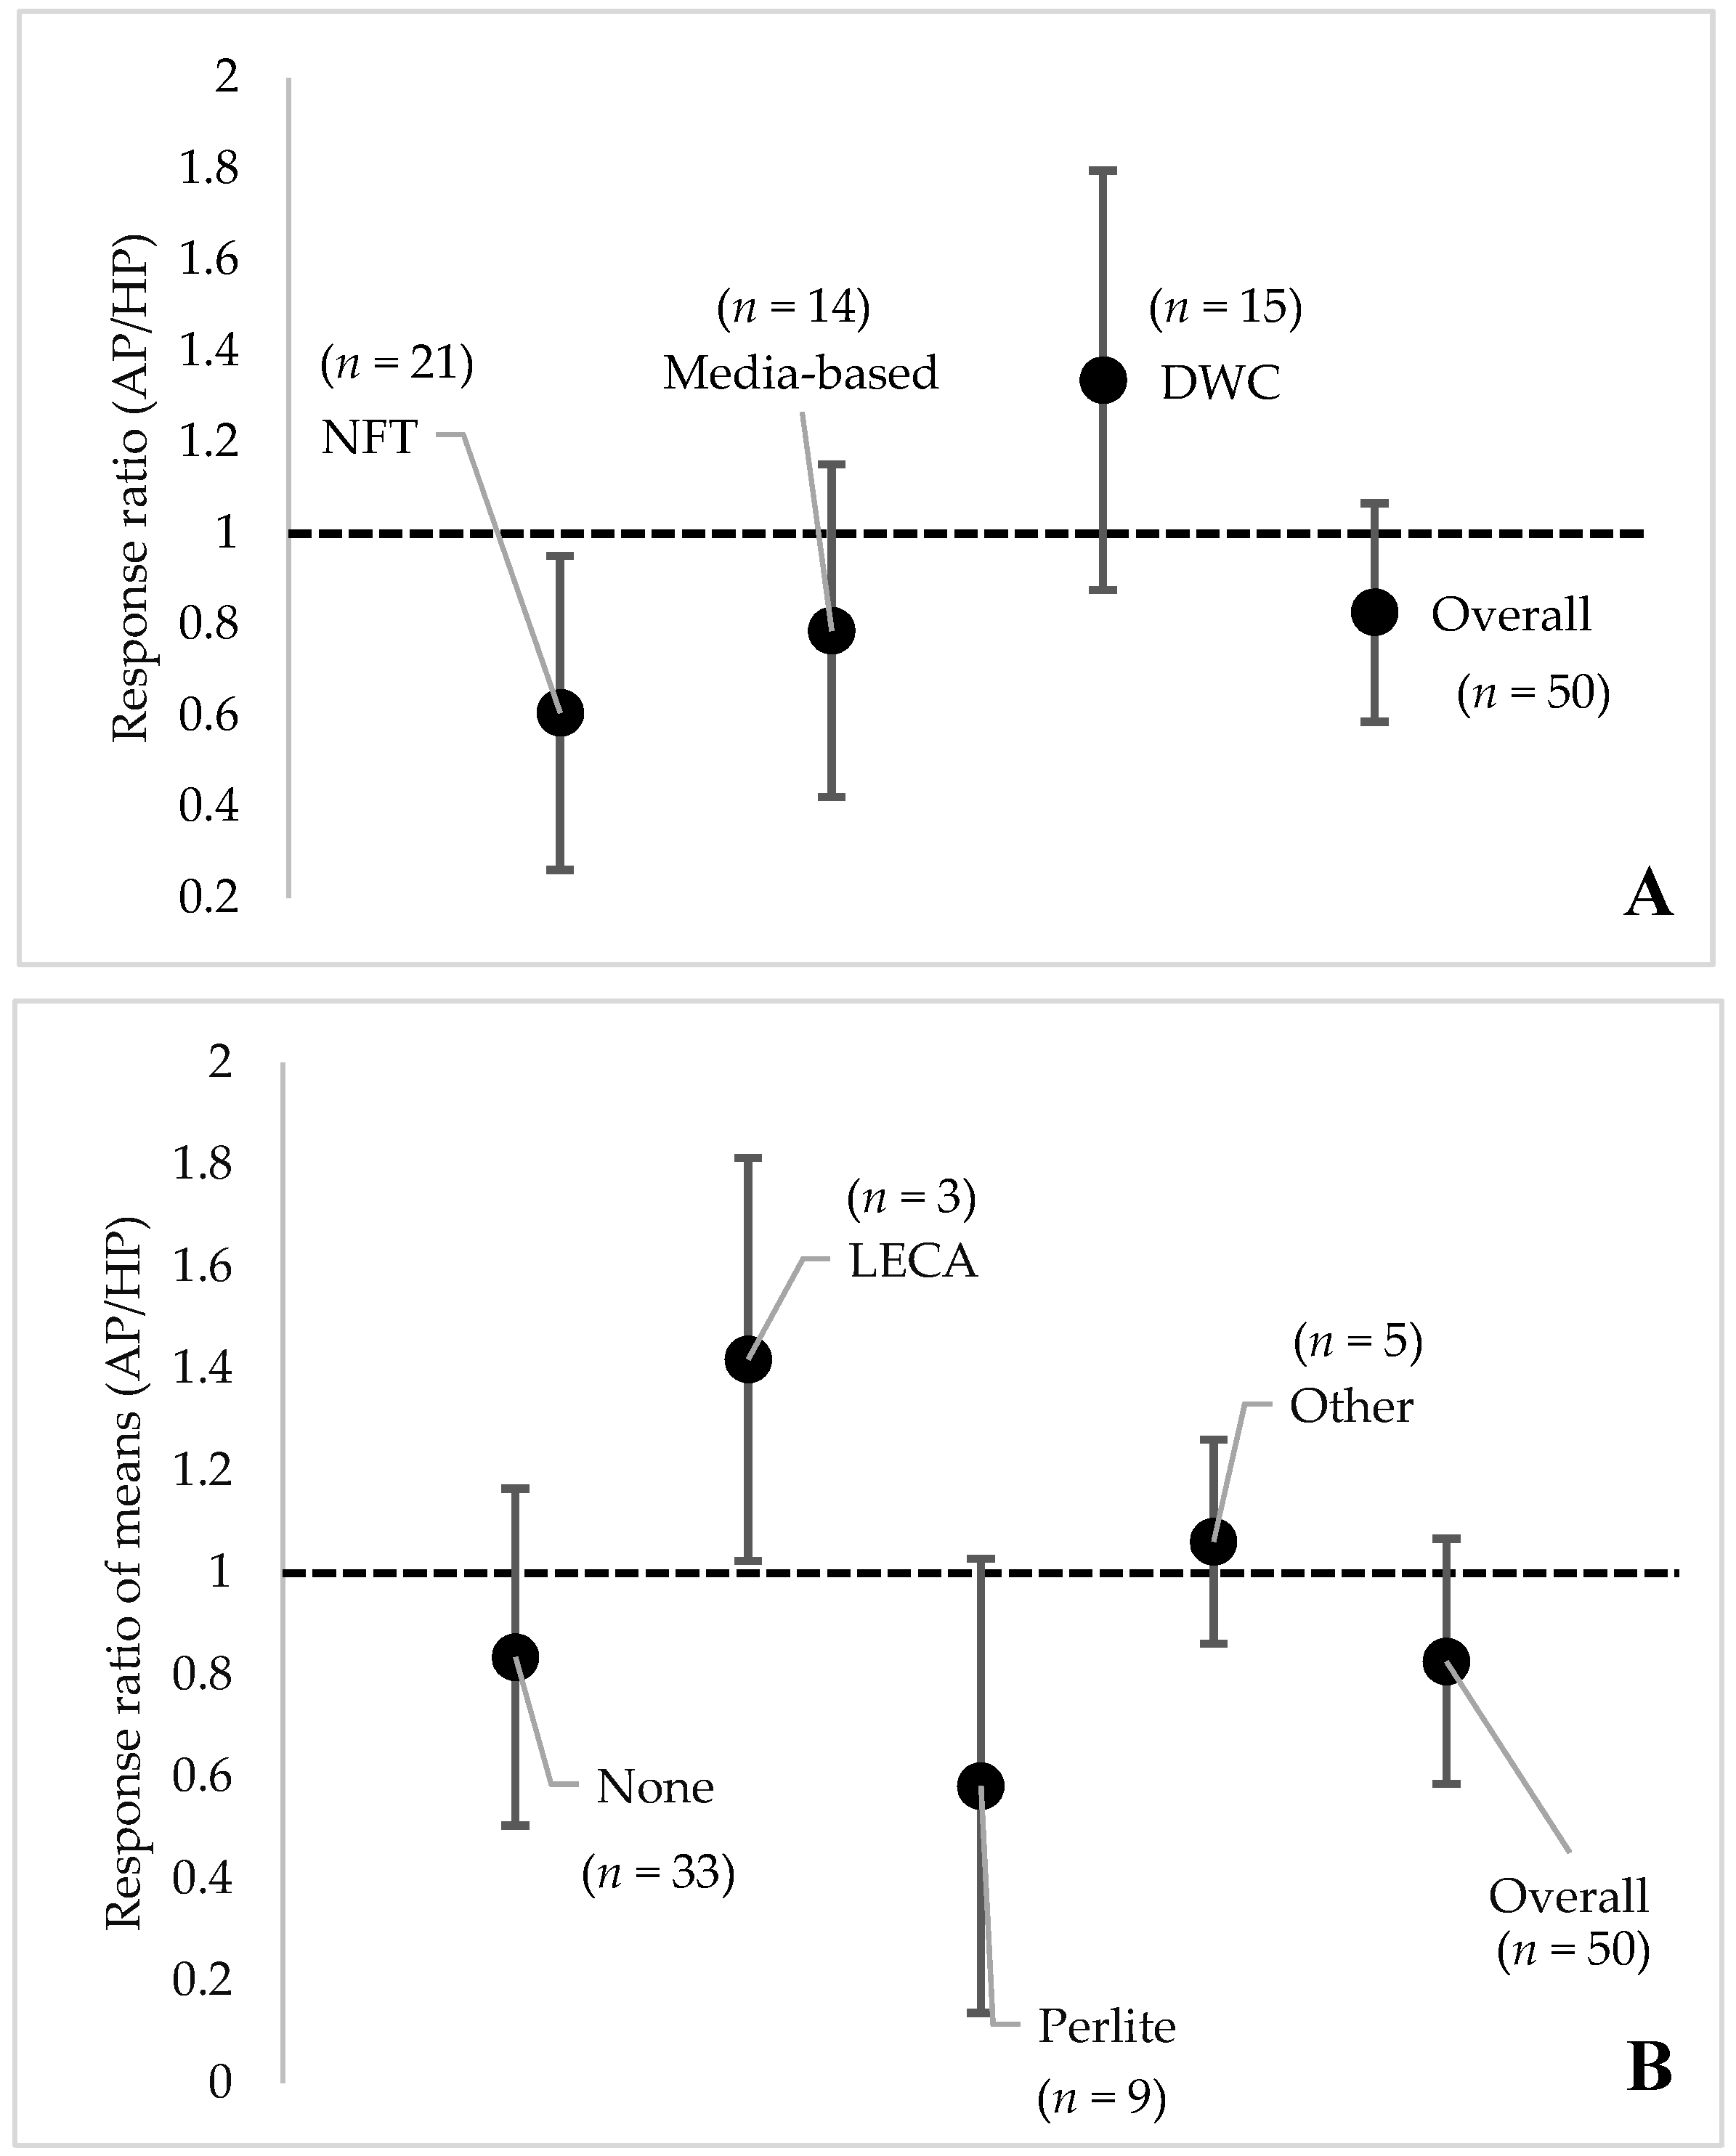
Hydroponics system type accounted for 11.25% of the heterogeneity in crop yield among studies. Also, the extent to which AP crop yields compares with cHP yield was influenced by grow media. However, grow media accounted for only 0.44% of the heterogeneity among studies. When pooled, all media-based AP performed poorly (Figure 5A). However, a comparison of media types showed that the organic media-based type performs better than other types of media (Figure 5B). The low performance of water-based systems (labeled as none in Figure 5B) can be attributed to the contribution from the nutrient film technique (Figure 5A). Although some studies under DWC fell below the null line (confidence interval extended beyond the null for DWC), most of the studies were beyond the null with an average positive effect size for DWC. This indicates that DWC systems generally resulted in better AP crop yield performance.
2. Crop Species Used
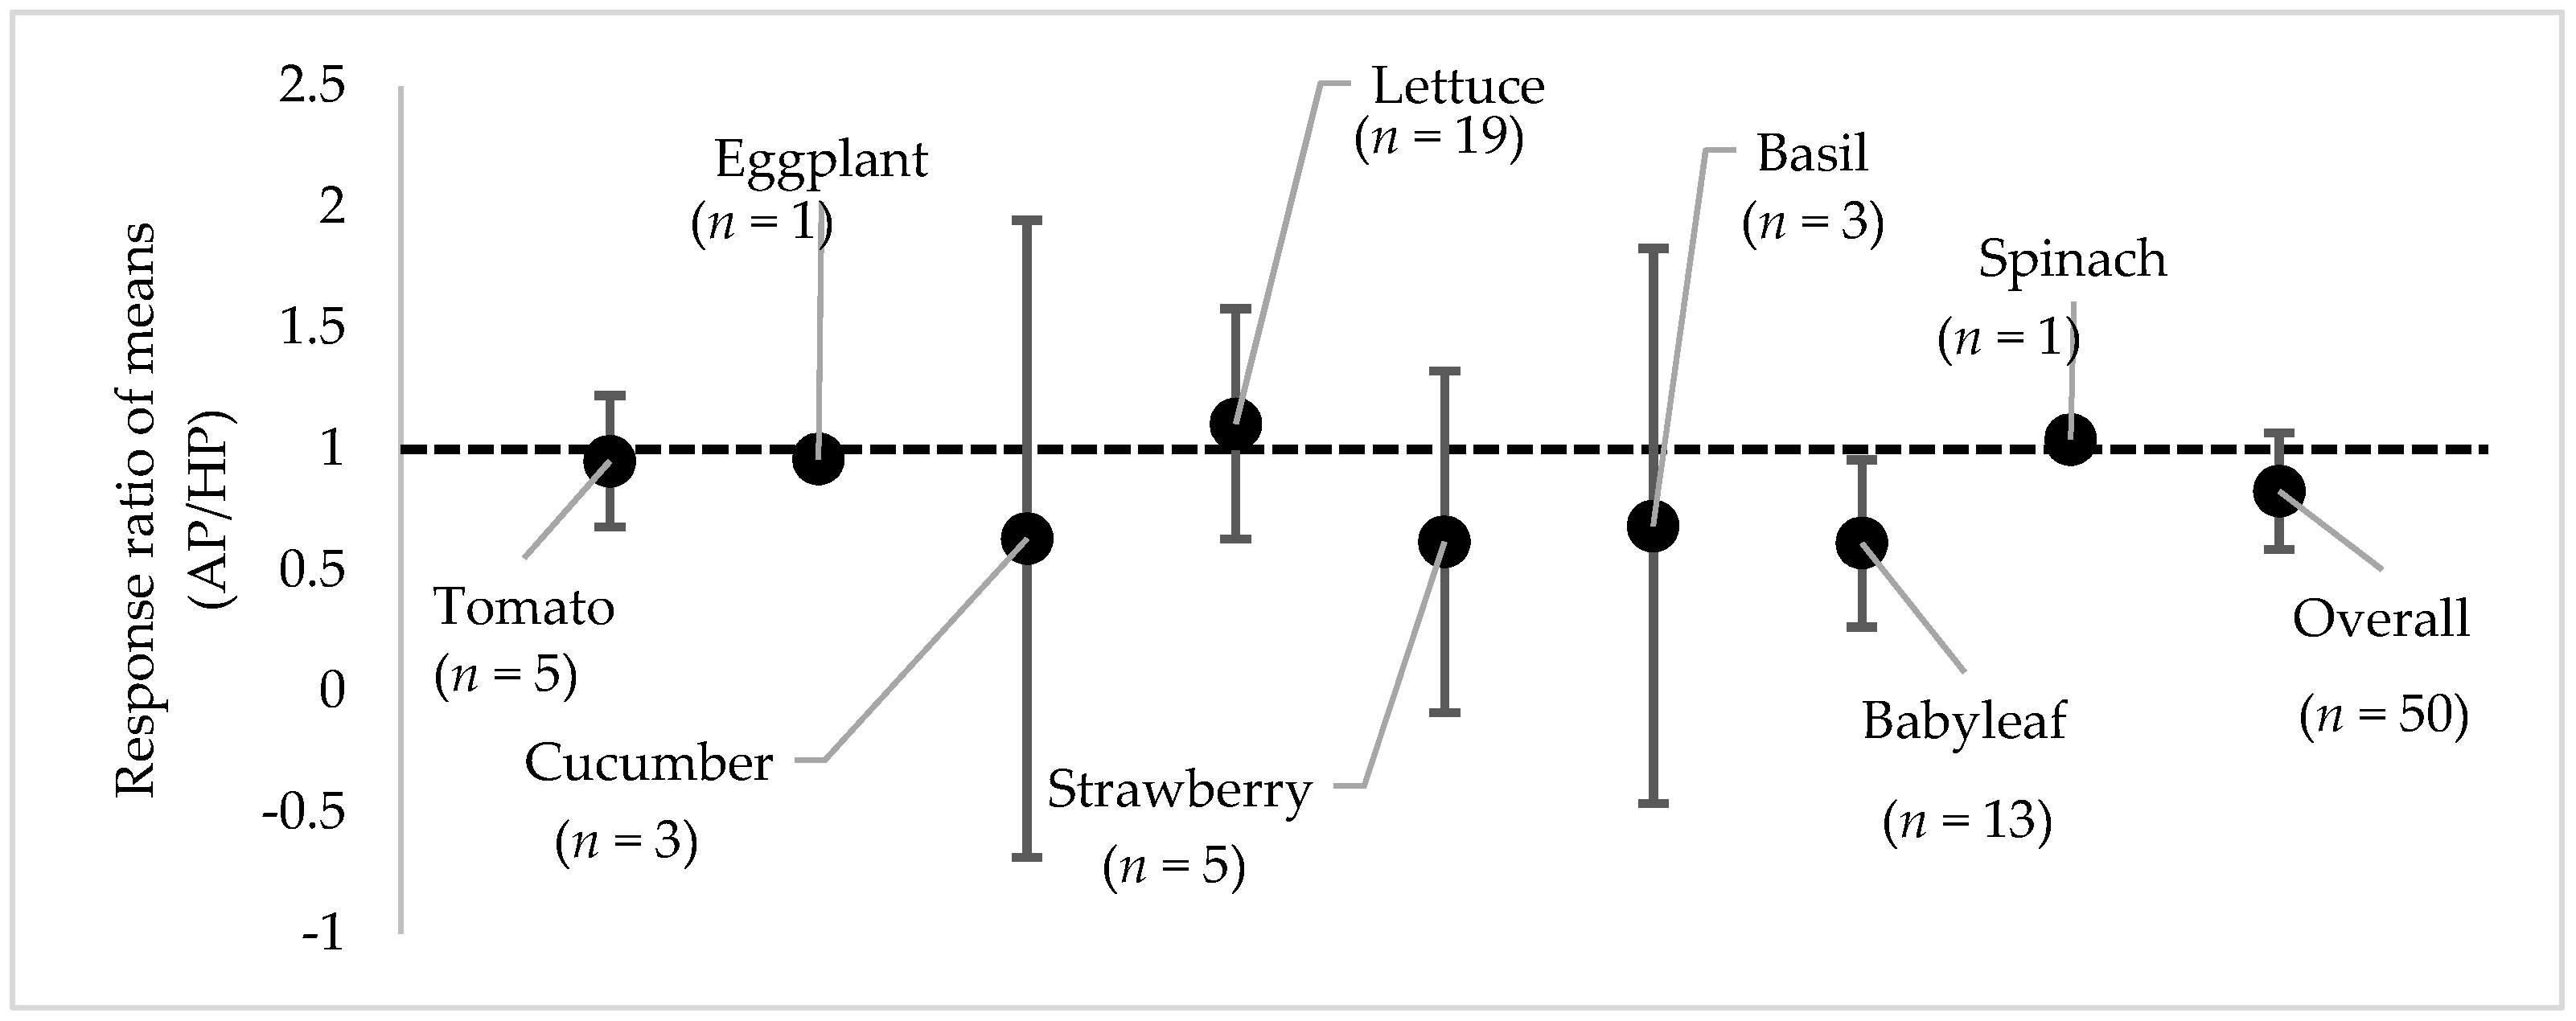
Generally, lettuce gave a better performance in AP systems than cHP systems compared to the other crops (Figure 6). Tomato (n = 5), eggplant (n = 1), and spinach (n = 1) showed no difference between AP and cHP systems (Figure 6). However, these results are inconclusive due to fewer effect size(s) per crop. The case of babyleaf, too, must be interpreted with caution, because results came from the same study. That is, performance due to babyleaf might be constrained by within study bias.
A. Aquaculture Component
1. Aquatic Organism
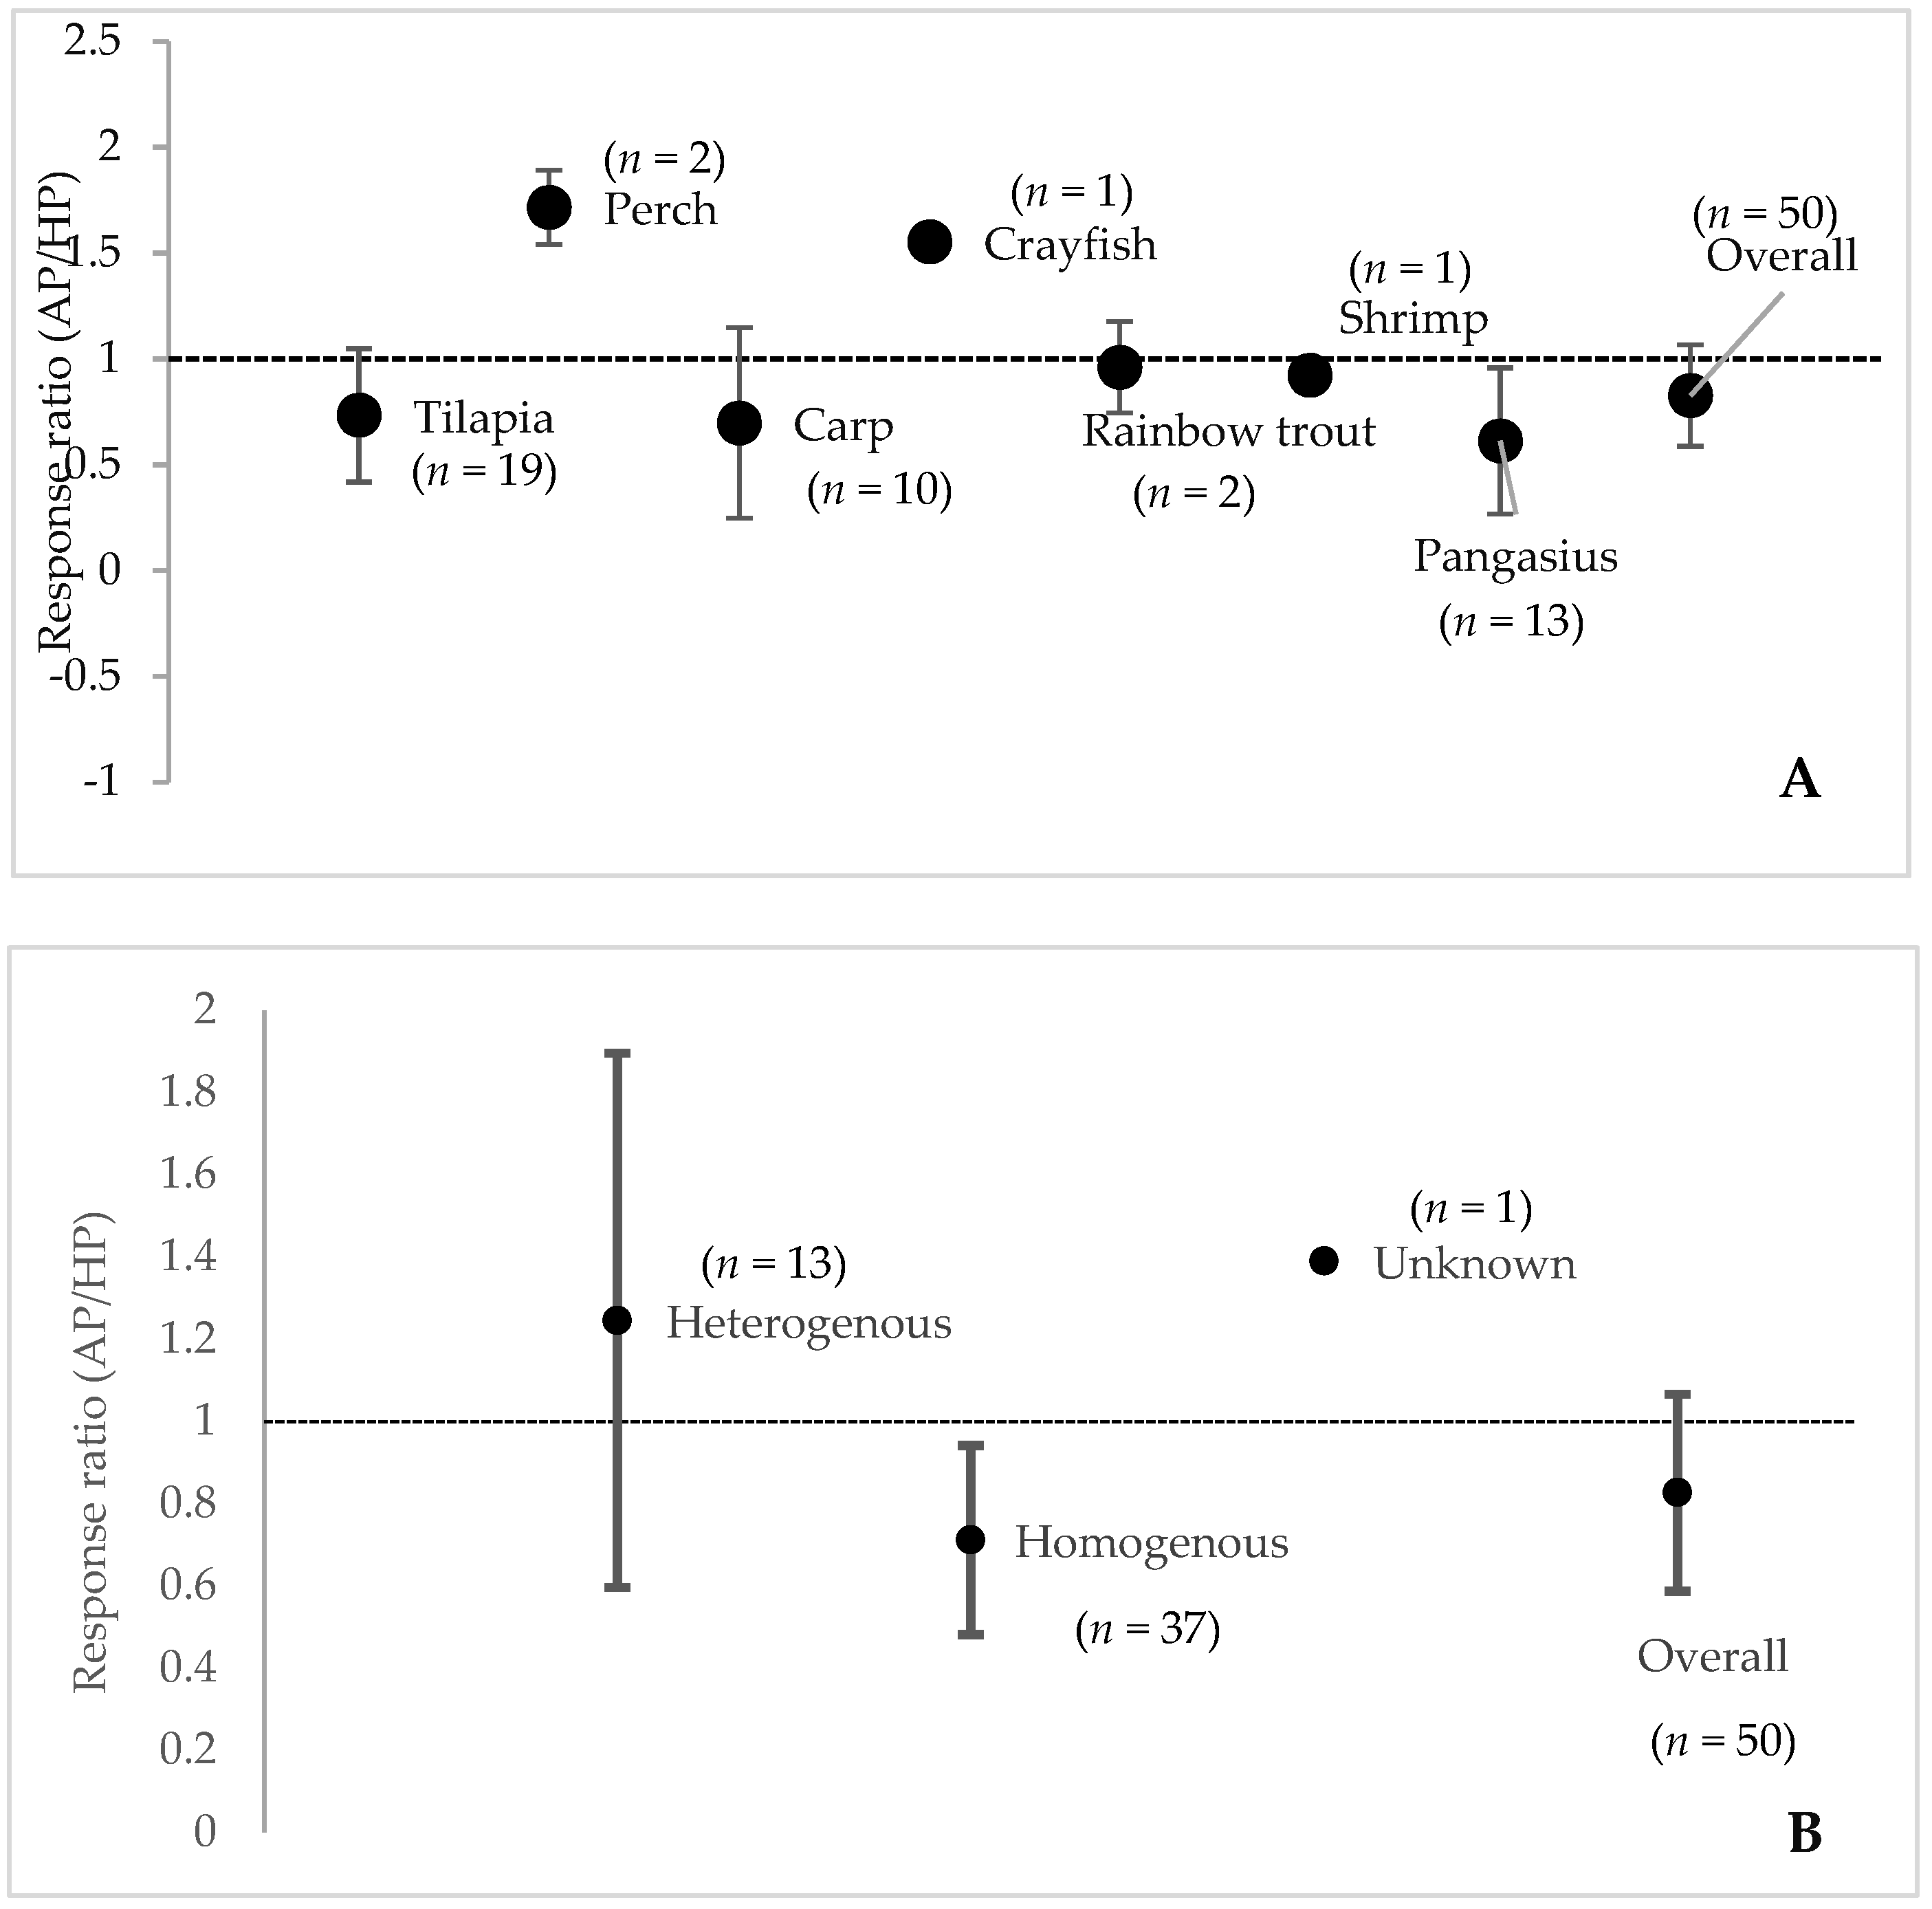
A test of differences between aquatic organisms showed no significant difference between AP and cHP crop yield. However, this comparison was subject to substantial between study heterogeneity (I2 > 80%). Aquatic organisms accounted for 43.9% of the heterogeneity in estimating the overall effect size. The results also show that effluent obtained from raising tilapia, carp, and Pangasius fish resulted in poorer relative crop yield between AP and cHP (Figure 7A). Here, again, caution should be taken when interpreting the results of Pangasius fish, because results came from the same study. Results from perch, crayfish, shrimp, and catfish are also inconclusive, due to low samples sizes for each taxa. Fish age composition influenced the crop yield performance between AP and cHP (Figure 7B). Generally, homogenous age composition resulted in lower relative crop yield between AP and cHP than heterogeneous age composition. This might be because most of the aquatic organisms, such as crayfish, shrimp, and catfish, which had higher effect sizes fell into the heterogeneous age category, thus skewing the results in favor of AP.
2. Type of Aquaponics System
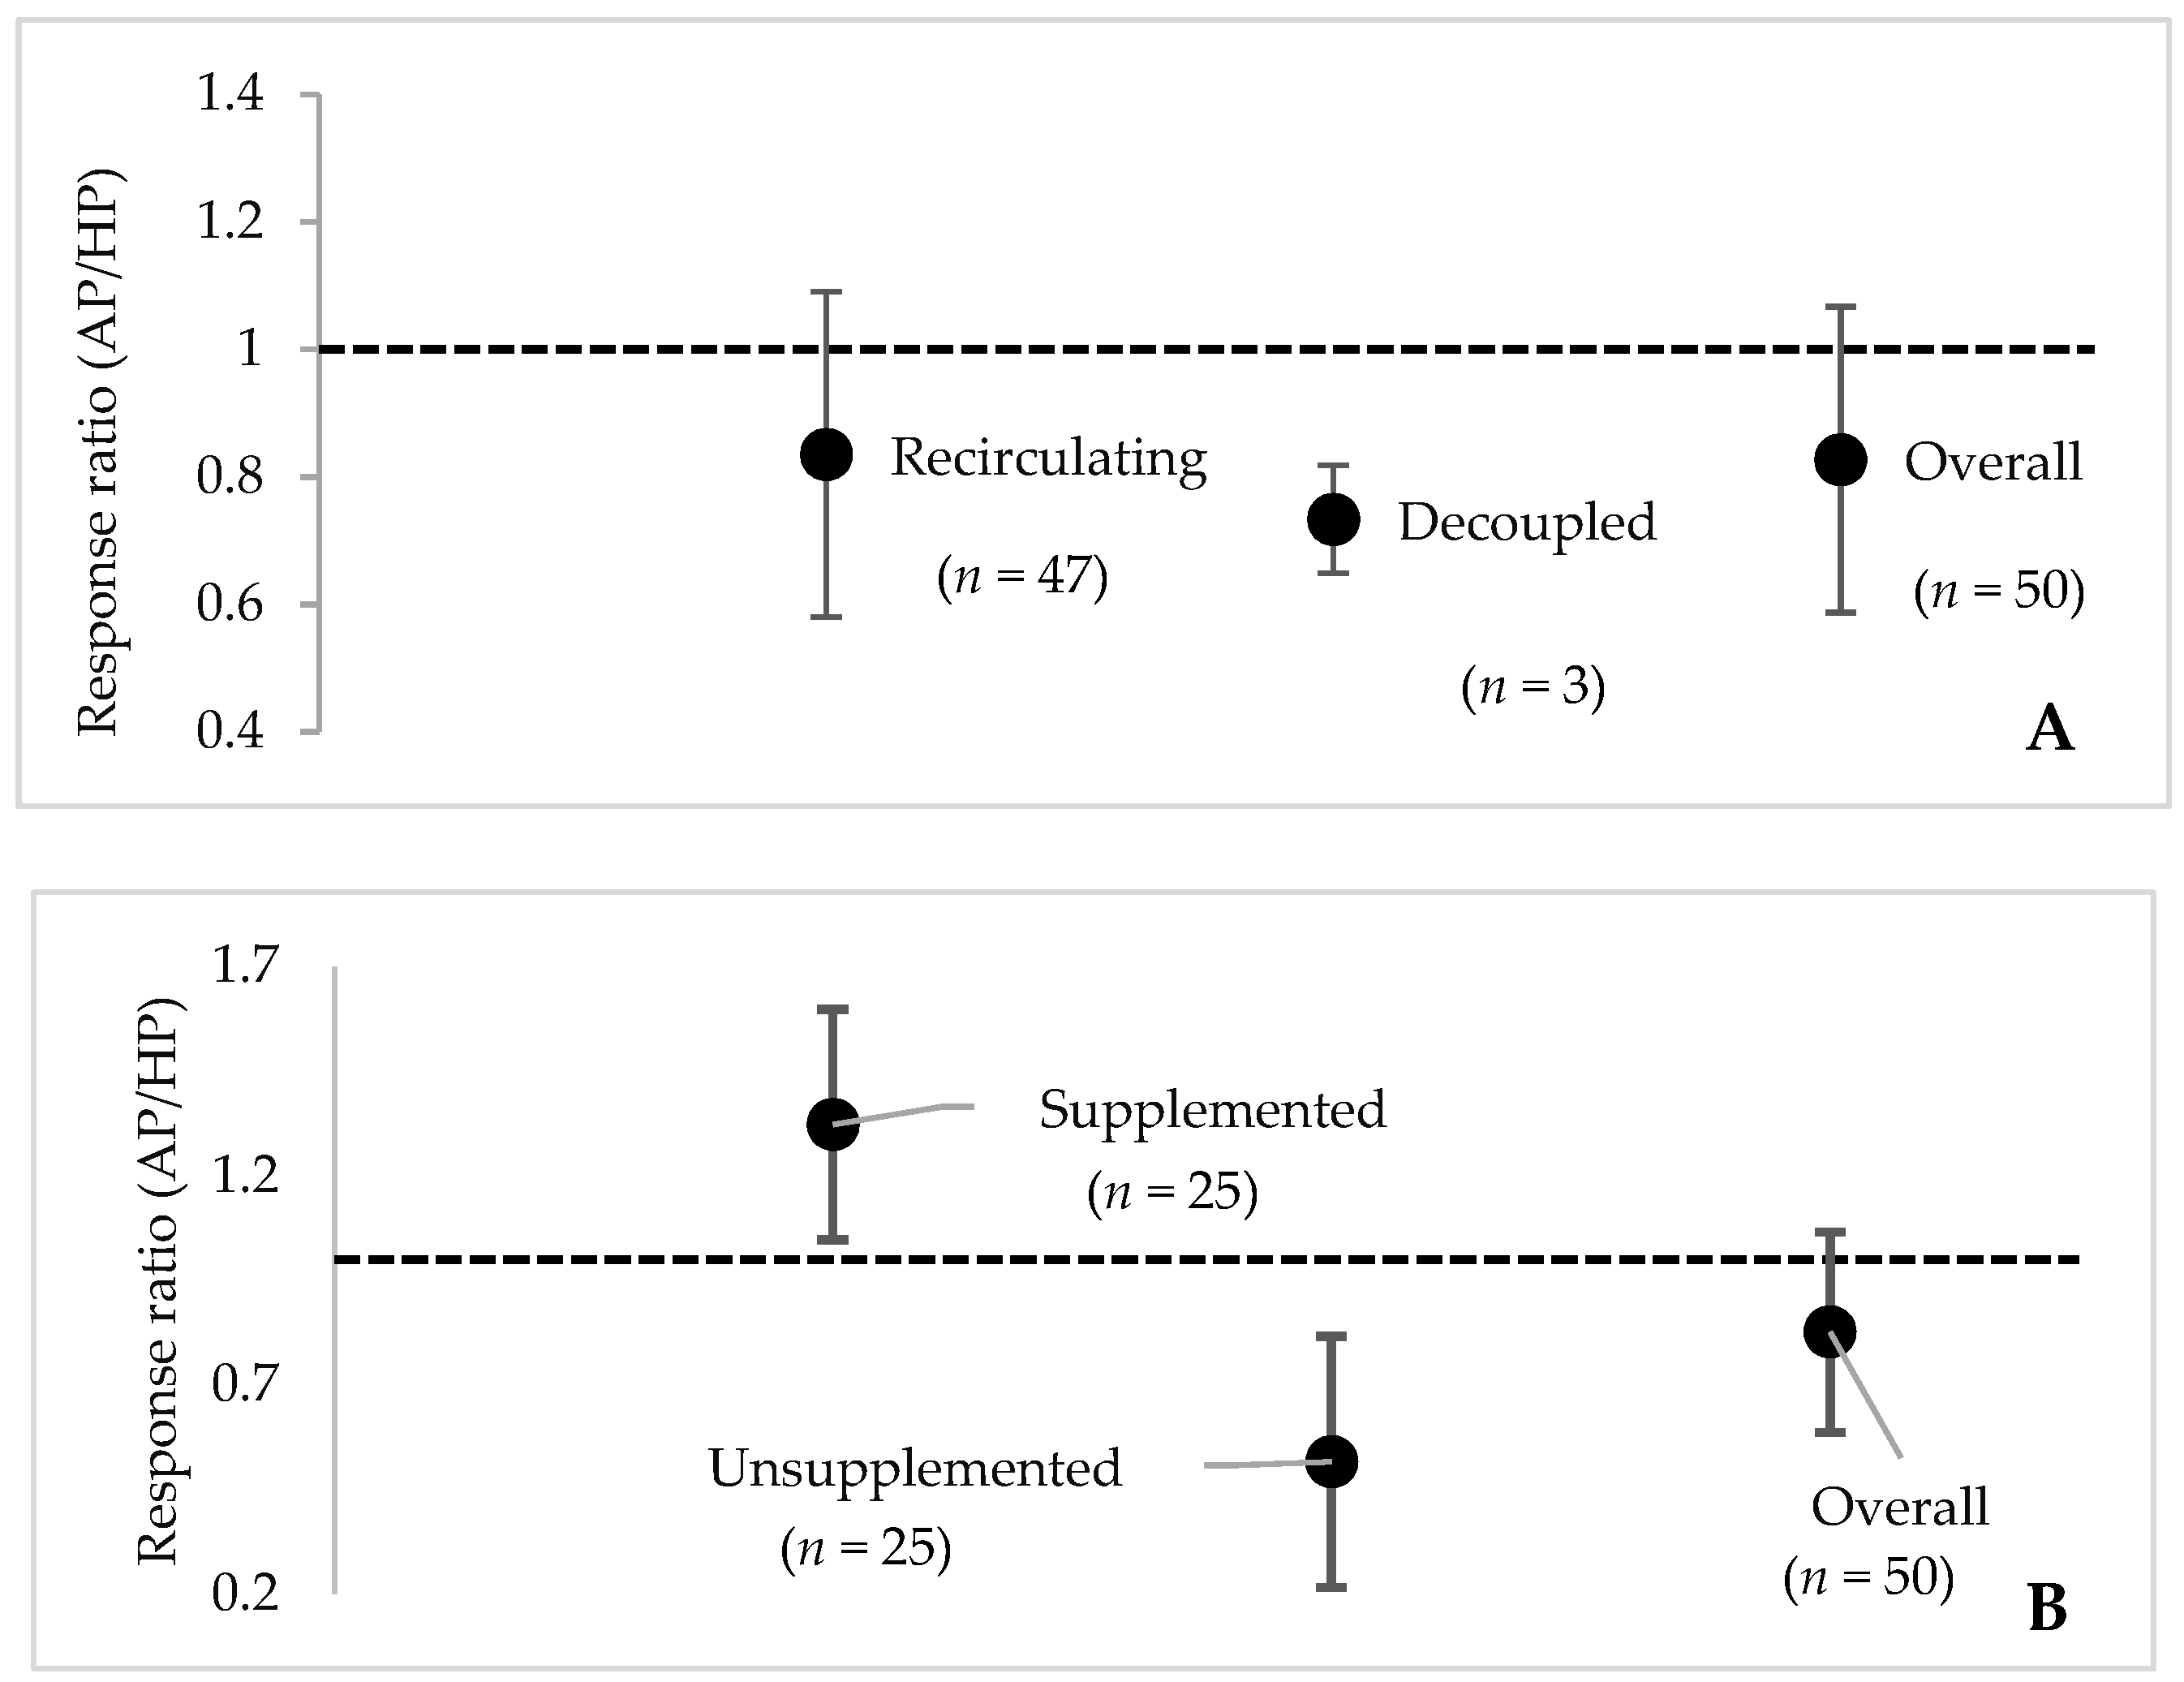
The results show lower relative crop yields between AP and cHP, irrespective of coupling (Figure 8A). Also, the decoupled system results came from one study and therefore should not be used as the sole basis to assess the performance of decoupled systems in general. This trend might change with more studies using the decoupled system. Generally, nutrient supplementation resulted in higher relative crop yield between AP and cHP (Figure 8B). However, studies that did not supplement achieved the opposite results. Nutrient supplementation accounted for 29.43% of the heterogeneity (results not shown).
3.5. Stocking Density and Feed Crude Protein Content
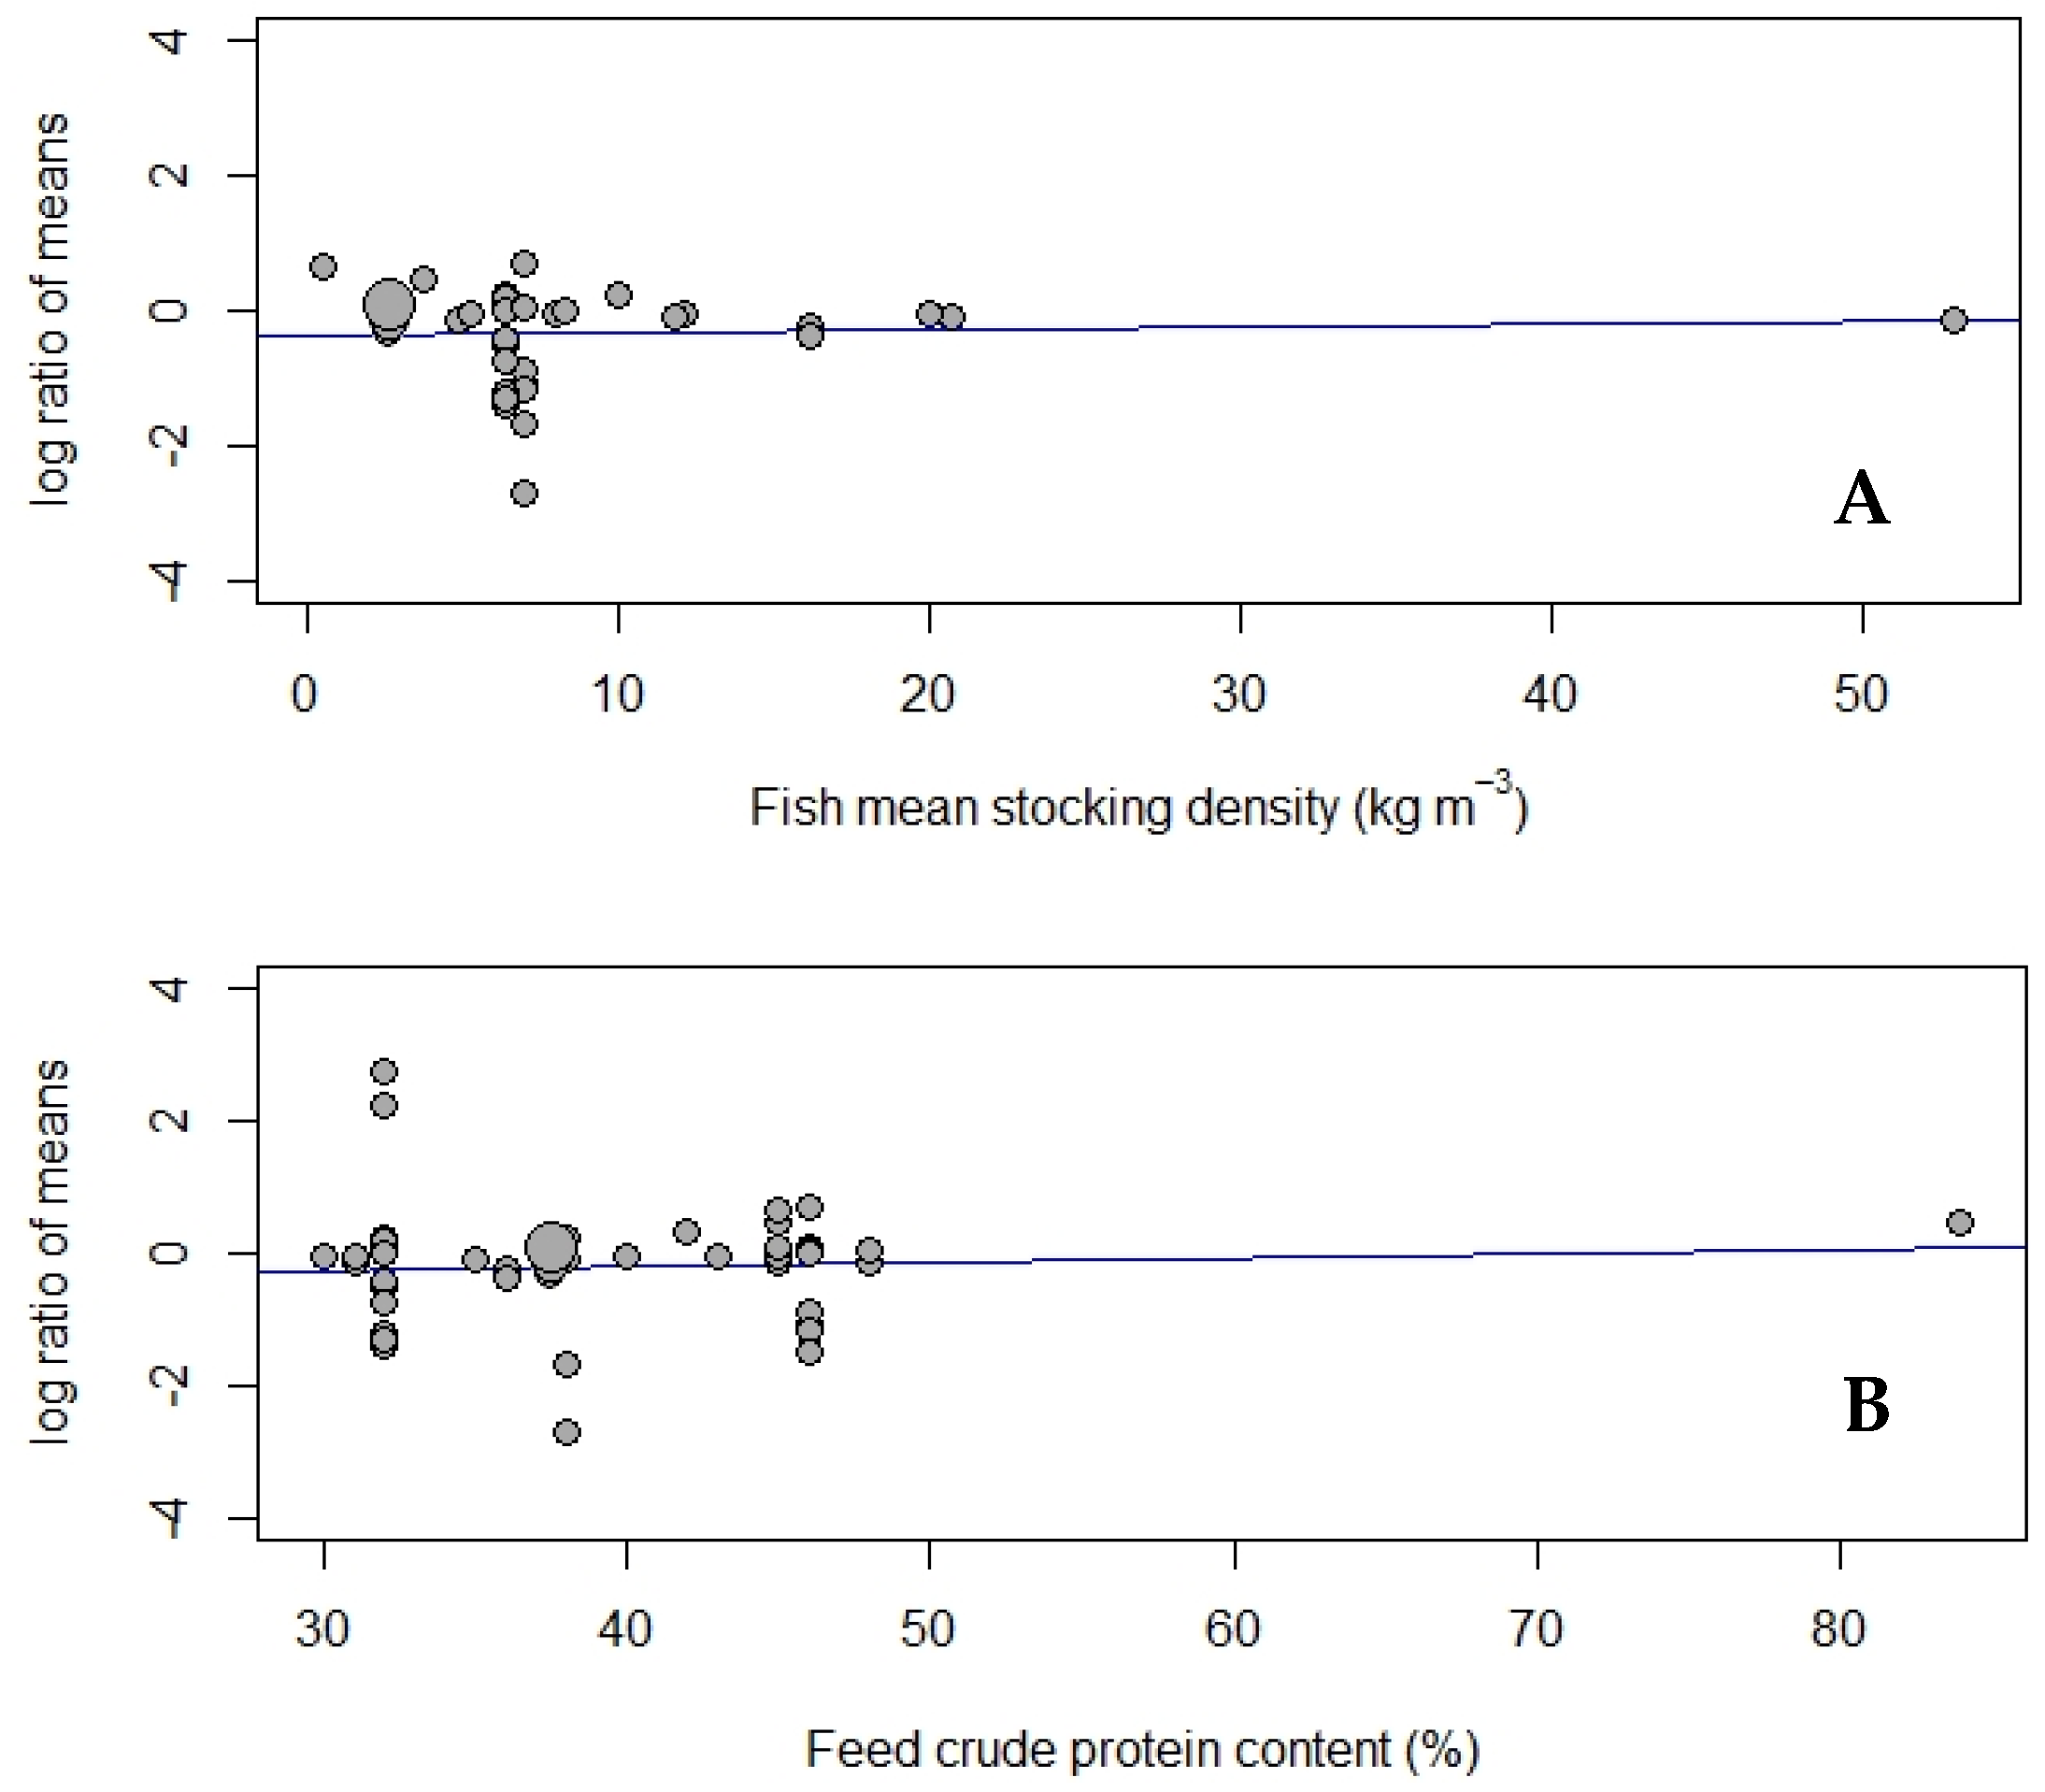
There was no significant relationship between mean stocking density or feed crude protein with effect size (Figure 9). There was an outlier with very high mean stocking density and crude protein. However, elimination of the outliers did not change the relationship (Supplementary Materials S§4). The results show that increasing fish mean stocking density or increasing protein content did not result in increased AP crop yield.
4. Discussion
4.1. Crop Yield Across Studies
Interest in aquaponics (AP) has grown over time. The interest to compare crop yields from AP with conventional hydroponics (cHP) increased from as low as one study in 2009 to as high as eight studies in 2018 (Figure 2). This might be due to a realization that aquaponics has potential to contribute to food sustainability [5,6,7,8,9]. Most of the comparisons in the studies considered were done where cHP served as a control. However, in cases of nutrient supplementation trials, the main purposes were to examine how comparable AP crop yield was to cHP. The results show that AP crop yields were generally lower than cHP systems, even with nutrient supplementation. This was worse in studies that did not supplement. This was expected, since fish effluent used in AP systems are usually low in crop nutrients, especially micronutrients, are non-existent [43]. However, the overall crop yield obtained from AP showed no statistically significant difference from cHP. As stated above, this comparability was due to supplementation making their AP similar to cHP system. Nutrient supplementation is beneficial, especially in the case of micronutrients, where systems such as deep-water culture or nutrient film technique are used. However, this might also derail the sustainability goal of AP [44]. Alternative ways of enhancing AP crop productivity without nutrient supplementation, such as anaerobic digestion of sludge that returns nutrients lost through solid waste [13], use of substrate-based systems which enhance microbial populations for improved nutrient uptake [45], and proper pH management [46,47,48], should be encouraged.
Although the meta-analysis indicates that AP crop yield is comparable to crop yields with cHP, there was substantial between-study heterogeneity in estimating the overall effect size. Therefore, a subgroup analysis and meta-regression were explored further to understand contributing factors to this heterogeneity [49]. Substantial between-study heterogeneity is characteristic of AP crop studies. This is because no two AP systems are identical. Small modifications lead to substantial differences. Therefore, pooled comparison is not quite feasible, although has been attempted in the current study. This attempt was to give a rough idea of the trend in how yields in AP compare with cHP.
In assessing the results of this meta-analysis, it was important to consider that publication bias could potentially detract from the outcome of the comparison. Although the fail-safe number of the analysis was estimated as being larger than the cutoff by Brown and Sutton [49], this estimate was confounded by a lack sampling variance from the various studies to conduct a weighted meta-analysis. We are also aware that there might be studies which, due to their non-significant p-values or other reasons, might be rejected by journal editors but that could not be included in this meta-analysis. [49]. Since meta-analysis depends on findings of all studies, publication bias could affect the interpretation of our results. However, we assessed the presence or absence of publication bias through funnel plot and fail-safe number. In our case, the funnel plot was based on the sample sizes, rather than the standard error, and showed that the sample size distribution relative to effect size was not symmetrical.
4.2. Subgroup Analysis
The productivity of plants in AP depends highly on HP system type and plant grow media. Lettuce plants showed better productivity in a raft technology (DWC) than media (LECA) bed technology [50]. This contrasted with another study, which found that HP system type had no significant influence on tomato productivity [51]. This contrast could be due to differences in species response to different grow media. The difference observed by Sirakov et al. [50] could also be due to the use of LECA, which has some cation exchange properties, making it similar to organic material. Cation exchange capacity improves nutrient uptake of these organic-based materials. In another study, a combination of coconut fiber and crushed stones resulted in higher AP lettuce yield [25]. Thus, the need to explore more on AP crop productivity using different HP system types. Also, the reports show that a combination of various ratios of organic and inorganic grow media could be beneficial to improving AP crop yield (Figure 5B; [14]). In terms of HP system type, however, DWC generally performed better than control. The interpretation of these results might change if nutrient supplementation is considered. Nevertheless, it can be assumed that since supplementation resulted in a positive impact on AP crop yield, this will positively influence the effect of grow media.
We found that different crop species obtained different effect sizes. This implies that relative crop yield between AP and cHP depended on the focal crop. This information is important in the choice of crops to grow in AP. Our analysis showed that growing lettuce (Lactuca sativa) produced similar or better yields in AP relative to cHP than other crops (Figure 6). Performance of lettuce could be because most of the studies that grew lettuce, grew them in a deep-water culture system and/or supplemented their nutrient AP nutrient source. The nutrient demand of crops, such as tomato (Solanum lycopersicon), cucumber (Cucumis sativus), and other fruity crops, is higher than most AP systems can supply, making their yield incomparable with yields obtained from cHP systems. This is because nutrient uptake is strongly influenced by crop species [27,52].
It was found that aquatic organisms influenced the relative crop yield between AP and cHP (Figure 6). This is because aquaculture effluent nutrient quality is dependent on the aquatic organism used. In a gravel-based ebb and flood coupled AP system, Knaus and Palm [53] showed that fish species influenced crop species choice and yield. However, a different study that assessed the influence of ‘Pacu’ fish and tilapia revealed no significant influence of the two fish species on crop yield of vegetable garnish [33]. Thus, no consensus on the conclusion of influence of aquatic organisms on AP crop performance has been reached. In this study, aquatic organism type accounted for 37% of the heterogeneity in the effect sizes obtained. This implied that aquatic organisms contributed substantially to the variation in effect size for AP crop yield and should be considered an important factor in AP studies. Different fish species do not have the same influence on different crop species [53]. The subgroup analysis revealed that tilapia and carp have similar influence on crop yield comparison between AP and cHP (Figure 7A). Other fish species have a potential for better AP crop yield than cHP system. However, there were too few studies to fully estimate their effect.
Currently, two types of coupling are known in AP; recirculating or single loop and decoupled or multiloop (see [54]). The current results showed that both coupling types resulted in lower AP crop yield relative to cHP (Figure 8A). However, the question of which coupling type gives better yield remains unanswered due to insufficient number of studies for decoupled AP. More studies that compare AP and cHP crop yields using decoupled systems would allow for a comprehensive conclusion on decoupled versus recirculating systems. However, although the type of coupling is important for adjustment of growth conditions [54,55], coupling type alone cannot lead to improved crop yields if the same growth conditions are achieved for both system types. That is, in a decoupled system, if growth conditions, such as pH and plant nutrients, are not adjusted, crop yield cannot be improved. This was the case of Pickens [56], who found lower cucumber yields in a decoupled AP system compared with cHP fertilizer. Generally, low AP crop yield is attributed to low nutrient contents of aquaculture effluent. Rightly so, studies that supplemented their effluent solution with one or more nutrients achieved similar or higher AP crop yield than the cHP system (Figure 3). Nutrient supplementation of at least chelated iron is required in AP for the growth of healthy plant biomass [40]. Other studies achieved similar results when they supplemented their aquaculture effluent with required plants nutrients [24,26]. Therefore, to achieve comparable or better AP crop yields with cHP, nutrient supplementation is an important consideration.
5. Conclusions
AP is a new field of farming, which has attracted keen research interest. Comparison of AP and cHP in terms of crop yield is a recent topic of interest, with studies dating not more than a decade in this meta-analysis. The meta-analysis showed that overall crop yield obtained from AP was not statistically significantly different from cHP. However, contribution of nutrient supplementation to this non-significant effect was high. More than half of between-study heterogeneity was explicable by aquatic/fish species used and nutrient supplementation. Nutrient supplementation resulted in similar or even higher AP crop yield than cHP. Important factors that accounted for crop yield differences between AP and cHP were aquatic/fish species, hydroponic system type, type of grow media, and crop species on aquaponics crop yield. Coupled and decoupled AP both had lower relative aquaponics crop yield. Generally, the study showed that to have a better or comparable AP with cHP crop yield, lettuce is a better choice, floating raft (DWC) should be used, and if media-based, then organic media would be better. The best aquatic organism would be tilapia, and need to supplement aquaculture effluent with at least iron.
6. Challenges of This Study and Recommendations
The main challenge of this meta-analysis was that most authors failed to report the variance around their means. This resulted in the choice of unweighted over weighted meta-analysis. Weighted meta-analysis would have been more robust than unweighted. Since unweighted meta-analysis assumes similar contributions from studies, the overall outcome is not a true reflection of variability among the studies. It is recommended that journal editors should strongly encourage the reporting of standard deviation, standard errors, or confidence intervals of means for these types of studies. This will enable an all-inclusive future meta-analysis. Also, lead authors should be transparent and kind enough to give out information about the studies when contacted.
The limited number of studies of most of the factors examined reduced the rigor of subgroup analysis. Therefore, there is the need for future studies to focus on comparison of decoupled systems output with conventional hydroponics to give credence for future subgroup analysis. Also, other aquatic/fish species should be explored to assess their potential to improve aquaponics crop yield over conventional hydroponics.
Supplementary Materials
The following are available online at https://0-www-mdpi-com.brum.beds.ac.uk/2071-1050/11/22/6511/s1.
Author Contributions
Conceptualization, literature search, retrieval, processing, analysis and first draft E.A.; review and editing, A.M., D.E.W., A.E.W.; funding acquisition, D.E.W., A.E.W.
Funding
This research received no external funding.
Acknowledgments
The authors wish to acknowledge Adelia Grabowsky for her inputs into initial drafts of the manuscript and, together with Claudine Jenda, for their guidance in fine-tuning literature search terms for this meta-analysis. The authors also thank Carlo Nicoletto for responding to an email sent to him requesting for details of his publication, and to the three anonymous reviewers for their inputs into an earlier version of the manuscript.
Conflicts of Interest
The authors declare no conflicts of interest.
References
- Rakocy, J. Hargreaves Integration of vegetable Hydroponics with fish culture: A review. In Proceedings of the Techniques for Modern Aquaculture; American Society of Agricultural Engineers, St. Joseph, MI, USA, 21–23 June 1993; pp. 112–136. [Google Scholar]
- Graber, A.; Junge, R. Aquaponic Systems: Nutrient recycling from fish wastewater by vegetable production. Desalination 2009, 246, 147–156. [Google Scholar] [CrossRef]
- Cohen, A.; Malone, S.; Morris, Z.; Weissburg, M.; Bras, B. Combined Fish and Lettuce Cultivation: An Aquaponics Life Cycle Assessment. Procedia CIRP 2018, 69, 551–556. [Google Scholar] [CrossRef]
- Nichols, M.A.; Savidov, N.A. Aquaponics: A nutrient and water efficient production system. Acta Hortic. 2012, 947, 129–132. [Google Scholar] [CrossRef]
- Belsare, S.S.; Singh, H.; Yadav, S.R.; Kunjir, S.N. Aquaponics: The food production system of the future. InfoFish Int. 2007, 4, 8–13. [Google Scholar]
- Price, C. A sustainable option for local food production. Fish Farmer 2009, 32, 32–34. [Google Scholar]
- Tyson, R.V.; Danyluk, M.D.; Simonne, E.H.; Treadwell, D.D. Aquaponics—Sustainable vegetable and fish co-production. Proc. Fla. State Hortic. Soc. 2012, 125, 381–385. [Google Scholar]
- Nehar, S. Aquaponics: A novel approach of sustainable means of food production. Sci. Cult. 2013, 79, 227–230. [Google Scholar]
- Kloas, W.; Gross, R.; Baganz, D.; Graupner, J.; Monsees, H.; Schmidt, U.; Staaks, G.; Suhl, J.; Tschirner, M.; Wittstock, B.; et al. A new concept for aquaponic systems to improve sustainability, increase productivity, and reduce environmental impacts. Aquac. Environ. Interact. 2015, 7, 179–192. [Google Scholar] [CrossRef]
- Blidariu, F.; Drasovean, A.; Grozea, A. Evaluation of phosphorus level in green lettuce conventional grown under natural conditions and aquaponic system. Bull. Univ. Agric. Sci. Vet. Med. Cluj-Napoca Anim. Sci. Biotechnol. 2013, 70, 128–135. [Google Scholar]
- Roosta, H.R.; Hamidpour, M. Mineral nutrient content of tomato plants in aquaponic and hydroponic systems: Effect of foliar application of some macro- and micro-nutrients. J. Plant Nutr. 2013, 36, 2070–2083. [Google Scholar] [CrossRef]
- Reyes-Flores, M.; Sandoval-Villa, M.; Rodriguez-Mendoza, N.; Trejo-Tellez, L.I.; Sanchez-Escudero, J.; Reta-Mendiola, J. Aquaponics nutrient concentration in effluent for production of Solanum lycopersicum L. Rev. Mex. Cienc. Agric. 2016, 7, 3529–3542. [Google Scholar]
- Goddek, S.; Joyce, A.; Gross, A.; Delaide, B.P.L.; Eding, E.H.; Verreth, J.; Keesman, K.J.; Keizer, L.C.P.; Reuter, M.; Morgenstern, R.; et al. Nutrient mineralization and organic matter reduction performance of RAS-based sludge in sequential UASB-EGSB reactors. Aquac. Eng. 2018, 83, 10–19. [Google Scholar] [CrossRef]
- Roosta, H.R.; Afsharipoor, S. Effects of different cultivation media on vegetative growth, ecophysiological traits and nutrients concentration in strawberry under hydroponic and aquaponic cultivation systems. Adv. Environ. Biol. 2012, 6, 543–555. [Google Scholar]
- Alcarraz, E.; Bustamante, A.; Wacyk, J.; Flores, M.; Tapia, M.L.; Escalona, V. Quality of lettuce (Lactuca sativa L.) grown in aquaponic and hydroponic systems. Acta Hortic. 2018, 1194, 31–38. [Google Scholar] [CrossRef]
- Anderson, T.S.; Villiers, D.; Timmons, M.B.; Martini, M.R.; Villiers, D.; Timmons, M.B. Growth and tissue elemental composition response of butterhead lettuce (Lactuca sativa, cv. Flandria) to hydroponic conditions at different pH and alkalinity. Horticulturae 2017, 3, 41. [Google Scholar] [CrossRef]
- Love, D.C.; Fry, J.P.; Li, X.; Hill, E.S.; Genello, L.; Semmens, K.; Thompson, R.E. Commercial aquaponics production and pro fi tability: Findings from an international survey. Aquaculture 2015, 435, 67–74. [Google Scholar] [CrossRef]
- Palm, H.W.; Bissa, K.; Knaus, U. Significant factors affecting the economic sustainability of closed aquaponic systems. Part II: Fish and plant growth. AACL Bioflux 2014, 7, 162–175. [Google Scholar]
- Palm, H.W.; Knaus, U.; Appelbaum, S.; Goddek, S.; Strauch, S.M.; Palm, H.W. Towards commercial aquaponics: A review of systems, designs, scales and nomenclature. Aquac. Int. 2018, 26, 813–842. [Google Scholar] [CrossRef]
- Boxman, S.E.; Qiong, Z.; Bailey, D.; Trotz, M.A. Life cycle assessment of a commercial-scale freshwater aquaponic system. Environ. Eng. Sci. 2017, 34, 299–311. [Google Scholar] [CrossRef]
- Zou, Y.; Hua, Z.; Zhanga, J.; Xieb, H.; Guimbaudc, C.; Fanga, Y.; Zou, Y.; Hu, Z.; Zhang, J.; Xie, H.; et al. Effects of pH on nitrogen transformations in media-based aquaponics. Bioresour. Technol. 2016, 210, 81–87. [Google Scholar] [CrossRef]
- Groenveld, T.; Kohn, Y.Y.; Gross, A.; Lazarovitch, N. Optimization of nitrogen use efficiency by means of fertigation management in an integrated aquaculture-agriculture system. J. Clean. Prod. 2019, 212, 401–408. [Google Scholar] [CrossRef]
- Liang, J.Y.; Chien, Y.H. Effects of feeding frequency and photoperiod on water quality and crop production in a tilapia-water spinach raft aquaponics system. Int. Biodeterior. Biodegrad. 2013, 85, 693–700. [Google Scholar] [CrossRef]
- Delaide, B.; Goddek, S.; Gott, J.; Soyeurt, H.; Jijakli, M.H. Lettuce (Lactuca sativa L. var. sucrine) growth performance in complemented aquaponic solution outperforms hydroponics. Water 2016, 8, 467. [Google Scholar] [CrossRef]
- Jordan, R.A.; Ribeiro, E.F.; Oliveira, F.C.; Geisenhoff, L.O.; Martins, E.A.S. Yield of lettuce grown in hydroponic and aquaponic systems using different substrates. Rev. Bras. Eng. Agric. Ambient. 2018, 22, 525–529. [Google Scholar] [CrossRef]
- Goddek, S.; Vermeulen, T. Comparison of Lactuca sativa growth performance in conventional and RAS-based hydroponic systems. Aquac. Int. 2018, 26, 1377–1386. [Google Scholar] [CrossRef] [PubMed]
- Buzby, K.M.; Waterland, N.L.; Semmens, K.J.; Lin, L.S. Evaluating aquaponic crops in a freshwater flow-through fish culture system. Aquaculture 2016, 460, 15. [Google Scholar] [CrossRef]
- Delaide, B.; Delhaye, G.; Dermience, M.; Gott, J.; Soyeurt, H.; Jijakli, M.H. Plant and fish production performance, nutrient mass balances, energy and water use of the PAFF Box, a small-scale aquaponic system. Aquac. Eng. 2017, 78, 130–139. [Google Scholar] [CrossRef]
- Wortman, S.E.; Douglass, M.S.; Kindhart, J.D. Cultivar, Growing Media, and Nutrient Source Influence Strawberry Yield in a Vertical, Hydroponic, High Tunnel System. HortTechnology 2016, 26, 466–473. [Google Scholar] [CrossRef]
- Savidov, N.A.; Hutchings, E.; Rakocy, J.E. Fish and plant production in a recirculating aquaponic system: A new approach to sustainable agriculture in Canada. Acta Hortic. 2007, 742, 209–222. [Google Scholar] [CrossRef]
- Enduta, A.; Jusoh, A.; Ali, N.; Wan Nik, W.B.; Endut, A.; Jusoh, A.; Ali, N.; Nik, W.B.W. Nutrient removal from aquaculture wastewater by vegetable production in aquaponics recirculation system. Desalin. Water Treat. 2011, 32, 422–430. [Google Scholar] [CrossRef]
- Knaus, U.; Palm, H.W. Effects of fish biology on ebb and flow aquaponical cultured herbs in northern Germany (Mecklenburg Western pomerania). Aquaculture 2017, 466, 51–63. [Google Scholar] [CrossRef]
- Pinho, S.M.; Lemos de Mello, G.; Fitzsimmons, K.M.; Emerenciano, M.G.C. Integrated production of fish (pacu Piaractus mesopotamicus and red tilapia Oreochromis sp.) with two varieties of garnish (scallion and parsley) in aquaponics system. Aquac. Int. 2018, 26, 99–112. [Google Scholar] [CrossRef]
- Shorten, A.; Shorten, B. What is meta-analysis? Evid. Based Nurs. 2013, 16, 3–4. Available online: https://0-ebn-bmj-com.brum.beds.ac.uk/content/16/1/3 (accessed on 9 August 2019). [CrossRef] [PubMed]
- Borenstein, M.; Hedges, L.V.; Higgins, J.P.T.; Rothstein, H.R. Introduction To Meta Aalysis; John Wiley & Sons, Ltd.: Chichester, UK, 2009; ISBN 9780470057247. [Google Scholar]
- Moher, D.; Liberati, A.; Tetzlaff, J.; Altman, D.G. Preferred Reporting Items for Systematic Reviews and Meta Analyses: The PRISMA Statement. 2009. Available online: https://journals.plos.org/plosmedicine/article?id=10.1371/journal.pmed.1000097 (accessed on 31 March 2019).
- Wortman, S.E. Crop physiological response to nutrient solution electrical conductivity and pH in an ebb-and-flow hydroponic system. Sci. Hortic. 2015, 194, 34–42. [Google Scholar] [CrossRef]
- Lajeunesse, M.J. On the meta-analysis of response ratios for studies with correlated and multi-group designs. Ecology 2011, 92, 2049–2055. [Google Scholar] [CrossRef]
- R Core Team (2018). R: A Language and Environment for Statistical Computing; R Foundation for Statistical Computing: Vienna, Austria; Available online: https://www.R-project.org/ (accessed on 2 June 2019).
- Buhmann, A.K.; Waller, U.; Wecker, B.; Papenbrock, J. Optimization of culturing conditions and selection of species for the use of halophytes as biofilter for nutrient-rich saline water. Agric. Water Manag. 2015, 149, 102–114. [Google Scholar] [CrossRef]
- Higgins, J.P.T.; Thompson, S.G. Quantifying heterogeneity in a meta-analysis. Stat. Med. 2002, 21, 1539–1558. [Google Scholar] [CrossRef]
- Rosenthal, R. The “file drawer problem” and tolerance for null results. Psychol. Bull. 1979, 86, 638–641. [Google Scholar] [CrossRef]
- Bittsánszky, A.; Uzinger, N.; Gyulai, G.; Mathis, A.; Junge, R.; Villarroel, M.; Kotzen, B.; Kőmíves, T. Nutrient supply of plants in aquaponic systems. Ecocycles 2016, 2, 17–20. [Google Scholar] [CrossRef] [Green Version]
- Goddek, S.; Delaide, B.; Mankasingh, U.; Ragnarsdottir, K.V.; Jijakli, H.; Thorarinsdottir, R. Challenges of sustainable and commercial aquaponics. Sustainability 2015, 7, 4199–4224. [Google Scholar] [CrossRef] [Green Version]
- Yi, Y.; Li, Z.; Song, C.; Kuipers, O.P. Exploring plant-microbe interactions of the rhizobacteria Bacillus subtilis and Bacillus mycoides by use of the CRISPR-Cas9 system. Environ. Microbiol. 2018, 20, 4245–4260. [Google Scholar] [CrossRef] [PubMed] [Green Version]
- Tyson, R.V.; Simonne, E.H.; Davis, M.; Lamb, E.M.; White, J.M.; Tyson, R.V.; Simonne, E.H.; Davis, M.; Lamb, E.M.; White, J.M. Effect of Nutrient Solution, Nitrate-Nitrogen Concentration, and pH on Nitrification Rate in Perlite Medium. J. Plant Nutr. 2007, 30, 901–913. [Google Scholar] [CrossRef]
- Tyson, R.V.; Simonne, E.H.; Treadwell, D.D.; Davis, M.; White, J.M. Effect of Water pH on Yield and Nutritional Status of Greenhouse Cucumber Grown in Recirculating Hydroponics. J. Plant Nutr. 2008, 31, 2018–2030. [Google Scholar] [CrossRef]
- Tyson, R.V.; Simonne, E.H.; Treadwell, D.D.; White, J.M.; Simonne, A. Reconciling pH for ammonia biofiltration and cucumber yield in a recirculating aquaponic system with perlite biofilters. HortScience 2008, 43, 719–724. [Google Scholar] [CrossRef]
- Bown, M.J.; Sutton, A.J. Quality control in systematic reviews and meta-analyses. Eur. J. Vasc. Endovasc. Surg. 2010, 40, 669–677. [Google Scholar] [CrossRef] [PubMed] [Green Version]
- Sirakov, I.; Velichkova, K.; Stoyanova, S.; Slavcheva-Sirakova, D.; Staykov, Y. Comparison between two production technologies and two types of substrates in an experimental aquaponic recirculation system. Sci. Pap. Ser. E-Land Reclam. Earth Obs. Surv. Environ. Eng. 2017, 6, 98–103. [Google Scholar]
- Schmautz, Z.; Loeu, F.; Liebisch, F.; Graber, A.; Mathis, A.; Bulc, T.G.; Junge, R.; Griessler Bulc, T.; Junge, R. Tomato productivity and quality in aquaponics: Comparison of three hydroponic methods. Water 2016, 8, 533. [Google Scholar] [CrossRef] [Green Version]
- Buzby, K.M.; Lin, L.S. Scaling aquaponic systems: Balancing plant uptake with fish output. Aquac. Eng. 2014, 63, 39–44. [Google Scholar] [CrossRef]
- Knaus, U.; Palm, H.W. Effects of the fish species choice on vegetables in aquaponics under spring-summer conditions in northern Germany (Mecklenburg Western Pomerania). Aquaculture 2017, 473, 62–73. [Google Scholar] [CrossRef]
- Goddek, S.; Espinal, C.A.; Delaide, B.; Jijakli, M.H.; Schmautz, Z.; Wuertz, S.; Keesman, K.J. Navigating towards decoupled aquaponic systems: A system dynamics design approach. Water 2016, 8, 303. [Google Scholar] [CrossRef]
- Goddek, S. Opportunities and Challenges of Multi-Loop Aquaponic Systems. Ph.D. Thesis, Wageningen University, Wageningen, The Netherland, 2017; ISBN 9789463431729. [Google Scholar]
- Pickens, J.M. Integrating Effluent from Recirculating Aquaculture Systems with Greenhouse Cucumber and Tomato Production. Ph.D. Thesis, Auburn University, Auburn, AL, USA, 2015. [Google Scholar]
Figure 1.
Bootstrapped histogram of overall effect sizes (middle line) and confidence intervals (dotted vertical lines). Number of bootstraps = 1000, number of effect sizes for resampling = 50. Overall effect size = −0.19(−0.43 − 0.067; 95% CI).
Figure 1.
Bootstrapped histogram of overall effect sizes (middle line) and confidence intervals (dotted vertical lines). Number of bootstraps = 1000, number of effect sizes for resampling = 50. Overall effect size = −0.19(−0.43 − 0.067; 95% CI).

Figure 2.
Effect size distribution over the period used in the meta-analysis; ‘n’ refers to number of effect sizes.
Figure 2.
Effect size distribution over the period used in the meta-analysis; ‘n’ refers to number of effect sizes.

Figure 3.
Funnel plot showing sample size distribution with respect to log response ratio.

Figure 4.
Effect of moderator on the response ratio (back transformed to linear scale). CI = confidence interval.
Figure 4.
Effect of moderator on the response ratio (back transformed to linear scale). CI = confidence interval.

Figure 5.
Effect of hydroponic system type (A) and grow media (B) on crop yield comparison between aquaponics (AP) and hydroponics (HP); ‘n’ refers to number of effect sizes. In (A), DWC = deep-water culture; NFT = nutrient film technique. In (B), LECA = light expanded clay aggregates. Full error bars are 95% confidence intervals.

Figure 6.
Differences in crop response to aquaponics (AP) and hydroponics (HP) nutrient sources. ‘n’ refers to number of effect sizes. Note that a study might have more than one effect size. Full error bars are 95% confidence intervals.
Figure 6.
Differences in crop response to aquaponics (AP) and hydroponics (HP) nutrient sources. ‘n’ refers to number of effect sizes. Note that a study might have more than one effect size. Full error bars are 95% confidence intervals.

Figure 7.
Effect of aquatic species, after removing catfish which as an outlier (A) and age distribution (B) on comparative response of aquaponics (AP) and hydroponics (HP) crop yield. Full error bars are 95% confidence intervals; ‘n’ refers to number of effect sizes.
Figure 7.
Effect of aquatic species, after removing catfish which as an outlier (A) and age distribution (B) on comparative response of aquaponics (AP) and hydroponics (HP) crop yield. Full error bars are 95% confidence intervals; ‘n’ refers to number of effect sizes.

Figure 8.
Effect of aquaponic coupling type (A) and nutrient supplementation (B) on crop yield comparison between aquaponics (AP) and hydroponics (HP). Full error bars are 95% CI; ‘n’ refers to number of effect sizes.
Figure 8.
Effect of aquaponic coupling type (A) and nutrient supplementation (B) on crop yield comparison between aquaponics (AP) and hydroponics (HP). Full error bars are 95% CI; ‘n’ refers to number of effect sizes.

Figure 9.
Meta-regression between (A) fish mean stocking density and (B) feed crude protein content (%) with effect size.
Figure 9.
Meta-regression between (A) fish mean stocking density and (B) feed crude protein content (%) with effect size.

© 2019 by the authors. Licensee MDPI, Basel, Switzerland. This article is an open access article distributed under the terms and conditions of the Creative Commons Attribution (CC BY) license (http://creativecommons.org/licenses/by/4.0/).
Share and Cite
MDPI and ACS Style
Ayipio, E.; Wells, D.E.; McQuilling, A.; Wilson, A.E. Comparisons between Aquaponic and Conventional Hydroponic Crop Yields: A Meta-Analysis. Sustainability 2019, 11, 6511. https://0-doi-org.brum.beds.ac.uk/10.3390/su11226511
AMA Style
Ayipio E, Wells DE, McQuilling A, Wilson AE. Comparisons between Aquaponic and Conventional Hydroponic Crop Yields: A Meta-Analysis. Sustainability. 2019; 11(22):6511. https://0-doi-org.brum.beds.ac.uk/10.3390/su11226511
Chicago/Turabian StyleAyipio, Emmanuel, Daniel E. Wells, Alyssa McQuilling, and Alan E. Wilson. 2019. "Comparisons between Aquaponic and Conventional Hydroponic Crop Yields: A Meta-Analysis" Sustainability 11, no. 22: 6511. https://0-doi-org.brum.beds.ac.uk/10.3390/su11226511
Note that from the first issue of 2016, this journal uses article numbers instead of page numbers. See further details here.