People’s Tendency Toward Norm-Interventions to Tackle Waste Disposal in Public Open Spaces in Phnom Penh, Cambodia

1
Department of Urban Engineering, The University of Tokyo, Tokyo 113-8656, Japan
2
Faculty of Hydrology and Water Resources, Institute of Technology of Cambodia, Phnom Penh 12156, Cambodia
*
Author to whom correspondence should be addressed.
Sustainability 2019, 11(23), 6603; https://0-doi-org.brum.beds.ac.uk/10.3390/su11236603
Submission received: 8 September 2019
/
Revised: 10 November 2019
/
Accepted: 18 November 2019
/
Published: 22 November 2019
(This article belongs to the Special Issue Innovation by Linking through Life Cycle Thinking: Practices and Challenges from EcoBalance)
Abstract
:Waste disposal at undesignated sites in public open spaces causes hygiene problems, city landscape deterioration, and urban flooding in many developing countries. We used different types of norms—subjective norms, perception about government pressure as one injunctive norm, and personal norms—as interventions to promote people’s intentions to avoid disposing of waste in public open spaces. Six different statements focusing on these three norms were designed, and the residents’ tendencies to follow each statement were investigated using 15 pair-wise comparisons in Phnom Penh, Cambodia. In addition, the likely effectiveness of each statement to encourage the residents’ intentions was asked of national and local government officials using the same pair-wise questions. The results showed that residents were most likely to follow an intervention focusing on personal norms, especially when touching on people’s responsibility, and this was also perceived to be the most effective by the government officials. Social pressure from the government, either in a strict way with punishments or in a soft way with recommendations, were the least preferred and thought to be ineffective by both the residents and government officials in avoiding waste disposal in public open spaces. The result suggests that future policy implication should be more focused on bottom-up approaches rather than top-down counterparts. Voluntary civic engagement is more vital in dealing with waste disposal in public open space than government interventions.

1. Introduction
Many cities have experienced extraordinary economic and population growth, but some countries have become polluted and have to cope with large amounts of waste, especially in developing countries where the waste management systems are generally not environmentally friendly. Currently, world cities generate about 1.3 billion tonnes of municipal solid waste per year. This is estimated to reach 2.2 billion tonnes in 2025, and the trend will be more than double for lower income countries in the next 20 years [1]. Because of this huge figure, many major cities are facing serious waste-related issues, especially littering and waste disposal in public. Phnom Penh, the capital city of Cambodia, has also faced a significant increase in waste generation [2]. The current waste collection system has been neither sufficient nor hygienic and improvements are urgently needed [3,4]. In Phnom Penh, residents often leave their bags of waste in front of their houses, even when collection trucks are not expected [2]. Some people even dispose of their waste in canals without thinking of the consequences, believing that it will flow away with storm water [4]. This causes hygiene problems, city landscape deterioration, and urban flooding [5].
In the past few decades, significant efforts and attention have been devoted to investigate the main determinants for a range of environmental issues. Some researchers have considered the situational factors (external factors) of certain behaviors related to waste [6,7,8]. For example, Xu et al. suggested that infrastructure improvement for segregation and facility provision could improve recycling [9]. Some researchers focused on the socio-psychological factors (internal factors) to explain people’s behavioral intentions regarding waste-related issues [10,11,12,13,14,15]. Strydom found subjective norms to be the most significant determinant in recycling for residents in Africa [16]. Some other researchers boldly took a step further by incorporating both situational and socio-psychological factors. Hornik [17] and Bar [18] both found that internal and external factors were influential in recycling and waste minimization behaviors.
Concurrently, various scholars tried to develop field interventions by applying behavior change techniques. These techniques include information provision and prompting, social modeling, commitment, feedbacks, incentives like rewards and disincentives like penalties, and promoting waste-related behaviors such as waste recycling, waste prevention, food waste reduction, and towel reuse [19,20,21,22]. Among such a wide array of field interventions, it is accepted that norm-intervention is one of the most effective ways to promote pro-environmental behavior. Farrow et al. suggested that social norms influence a wide range of behaviors, and the social norm utility could have implication for social outcomes [23]. The descriptive norm, which is one of the social norms and the perception of other people’s behaviors, has been used as a key factor in many studies [24,25,26,27]. Statements showing what other people are doing were used to encourage the target behavior via descriptive-norm stimulation. However, studies focusing on “personal norms” or “subjective norms” are limited. Grodzinska et al. conducted a campaign to promote waste recycling in Poland using a door-to-door home advisory approach. About 60 home advisors were carefully trained before the campaign. They visited as many households as possible throughout the city with educational materials, posters, and booklets. The campaign was to promote pro-environmental behavior. The results showed an increase in participating and recycling rate [28]. Goldstein et al. conducted two field experiments to examine the effectiveness of signs which requested hotel guests to reuse their towels. Two different signs targeting personal norms and descriptive norms were put on the washroom towel racks. The result showed that the sign targeting the personal norm resulted in a participation rate of 35% compared to 45% for the sign targeting the descriptive norm [27]. Tagkaloglou et al. focused on promoting pro-environmental goals. University students were asked to set their goals based on self-determination and self-efficacy and reported their progress regarding the goals after seven weeks. In the self-determined session, the participants were asked to select the reason why they committed to pursue their goals from the reasons targeting subjective norms, personal norms, and perception of importance. They were asked to report their progress and re-rate the determination that they had felt about their goals after seven weeks. The result indicated that self-determined motivation, both concurrently and prospectively, predicted goal progress [29].
There have been few studies specifically focused on the factors that lead to waste disposal and littering behavior. For instance, Cialdini et al. focused on various types of norms to explain littering behavior [26]. Al-Khatib et al. found that socio-demographic and religious convictions influenced littering habits [30]. Schultz et al. indicated that the availability of existing litter and trash receptacles could have a direct impact on waste littering behavior [31]. These studies only focused either on internal or external factors. Our previous study investigated the internal and external factors that could influence waste disposal behavior in public open spaces in Phnom Penh, Cambodia. The results indicated that the influence of internal factors was much larger than those of external factors on the intention to avoid waste disposal in public open spaces. Additionally, among these internal factors, it was found that personal norms (Pn) and subjective norms (Sb) and the perception of social pressure from the government (Sp_g) were the main determinants for the intention to avoid waste disposal in public open spaces [2]. Personal norm refers to the standard people hold for themselves whether they should perform or not perform a certain behavior. This norm was found to have significant influences on many settings of waste related behavior (e.g., Bortoleto et al., 2012 and Barr et al., 2001). Subjective norm refers to the perceived social pressure from significant others such as family members and close friends regarding if they should involve in a certain behavior or not. This finding also supported by well-known theories such as the Theory of Reasoned Action (TRA) and the Theory of Planned Behavior (TPB) and other empirical studies (e.g., Thogersen, 2016). Perception of social pressure from the government could refer to the intervention of the government on a certain issue whether by persuading people or force people to perform a certain behavior.
Hence, in this study, we established and investigated the possible interventions to encourage people’s behavioral intentions to avoid waste disposal in public open spaces based on our previous findings [2] and evaluated the effectiveness of these interventions.
2. Methods
2.1. Study Area
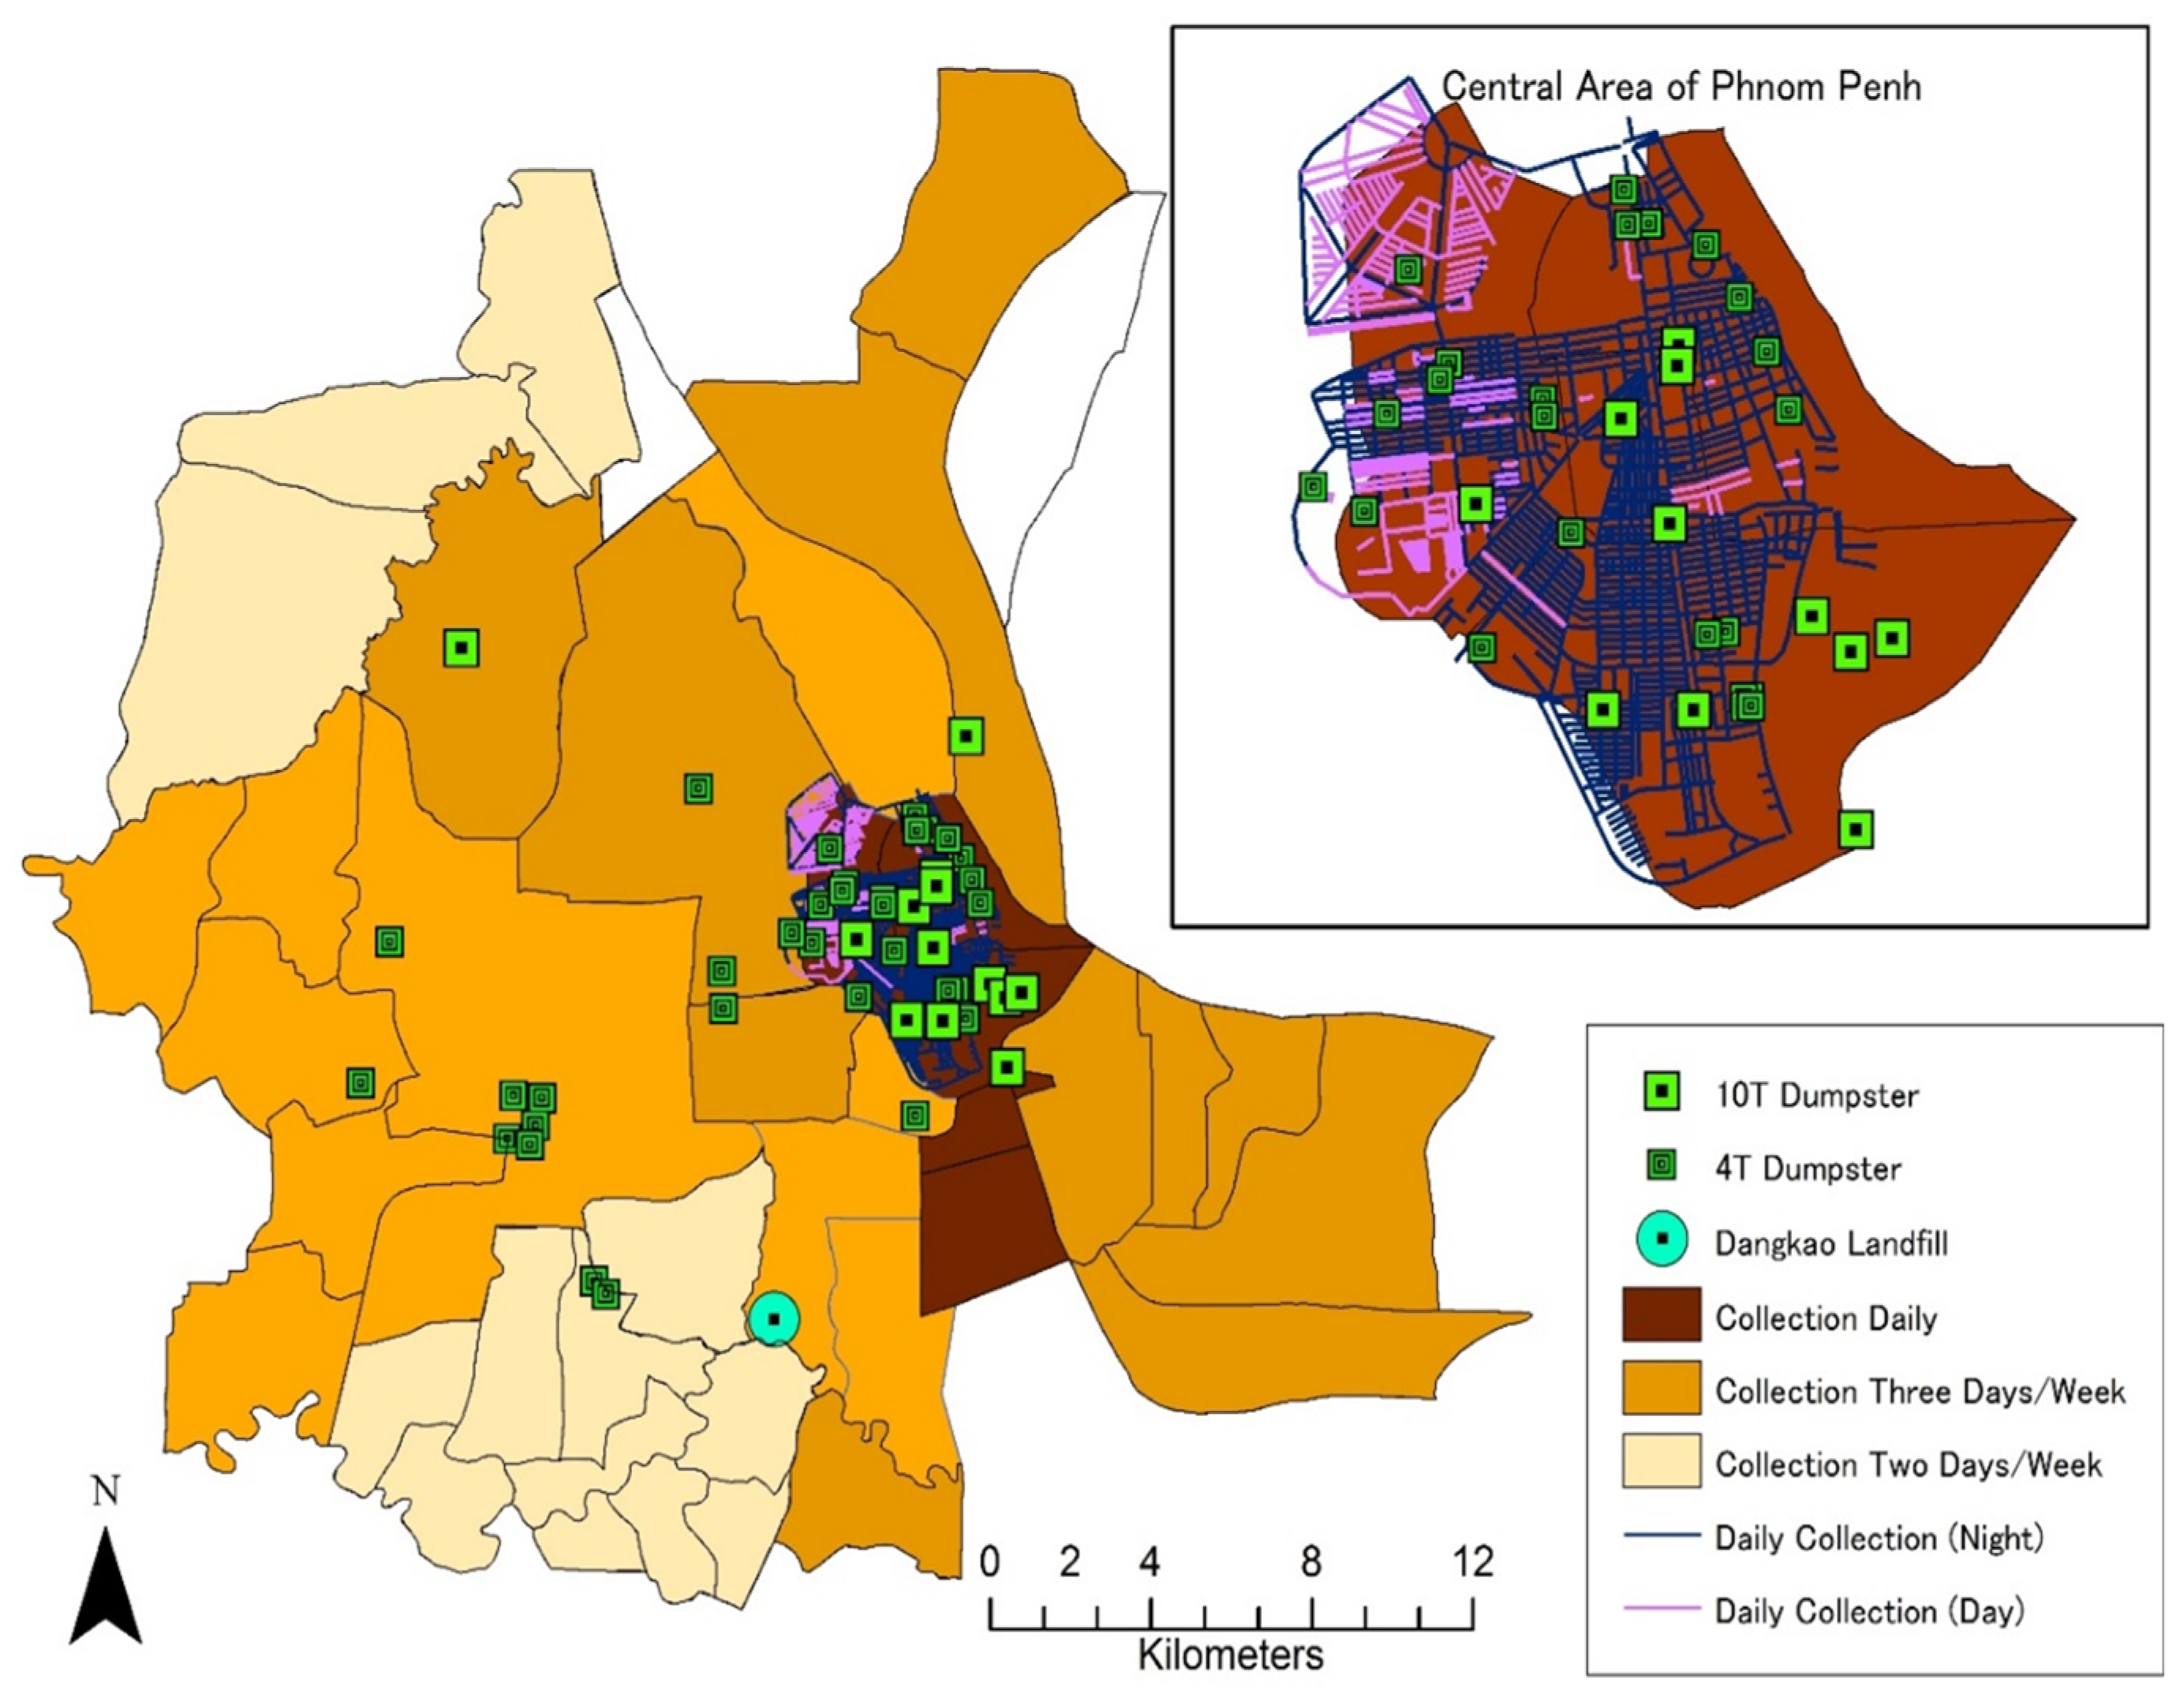
A questionnaire survey for the residents was conducted in local districts of the Phnom Penh municipality. By using data prepared in our previous study [2], four sites that differed in the waste collection frequency, provided by collector company [32], and population density, calculated by population [33] and area, were selected to conduct the questionnaire survey. Figure 1 shows the waste collection situation in Phnom Penh. Central areas receive waste collection regularly, while the suburban area waste collection frequency is not enough. Table 1 shows the selected four sites, labeled HH, LH, HL, and LL, which represent the difference in the waste collection frequency (H: high, L: low) followed by population density (H: high, L: low).
2.2. Design of Statements
It was found in our previous study that three types of norms could be the significant determinants for the people’s intentions to avoid waste disposal in public open spaces: subjective norms, social pressure from government, and personal norms [2]. Based on the results, two statements were prepared for each target norm, and six statements were used as shown in Table 2. Subjective norms are defined as the perception of expectation from close others, such as family members and friends. Therefore, two statements were prepared targeting the expectations of friends (No. 1) and expectations of family (No. 2). For social pressure from government, considering the strength of the pressure, strict pressure such as punishment (No. 3) and soft pressure such as recommendation (No. 4) were prepared. Personal norms are defined as a personal standard to judge good or bad. Therefore, one statement focusing on this principle was prepared (No. 6). Additionally, Schwartz’s altruistic behavior model shows that personal norms are activated by attribution of responsibility [34]. Based on this, a statement targeting responsibility was also prepared (No. 5).
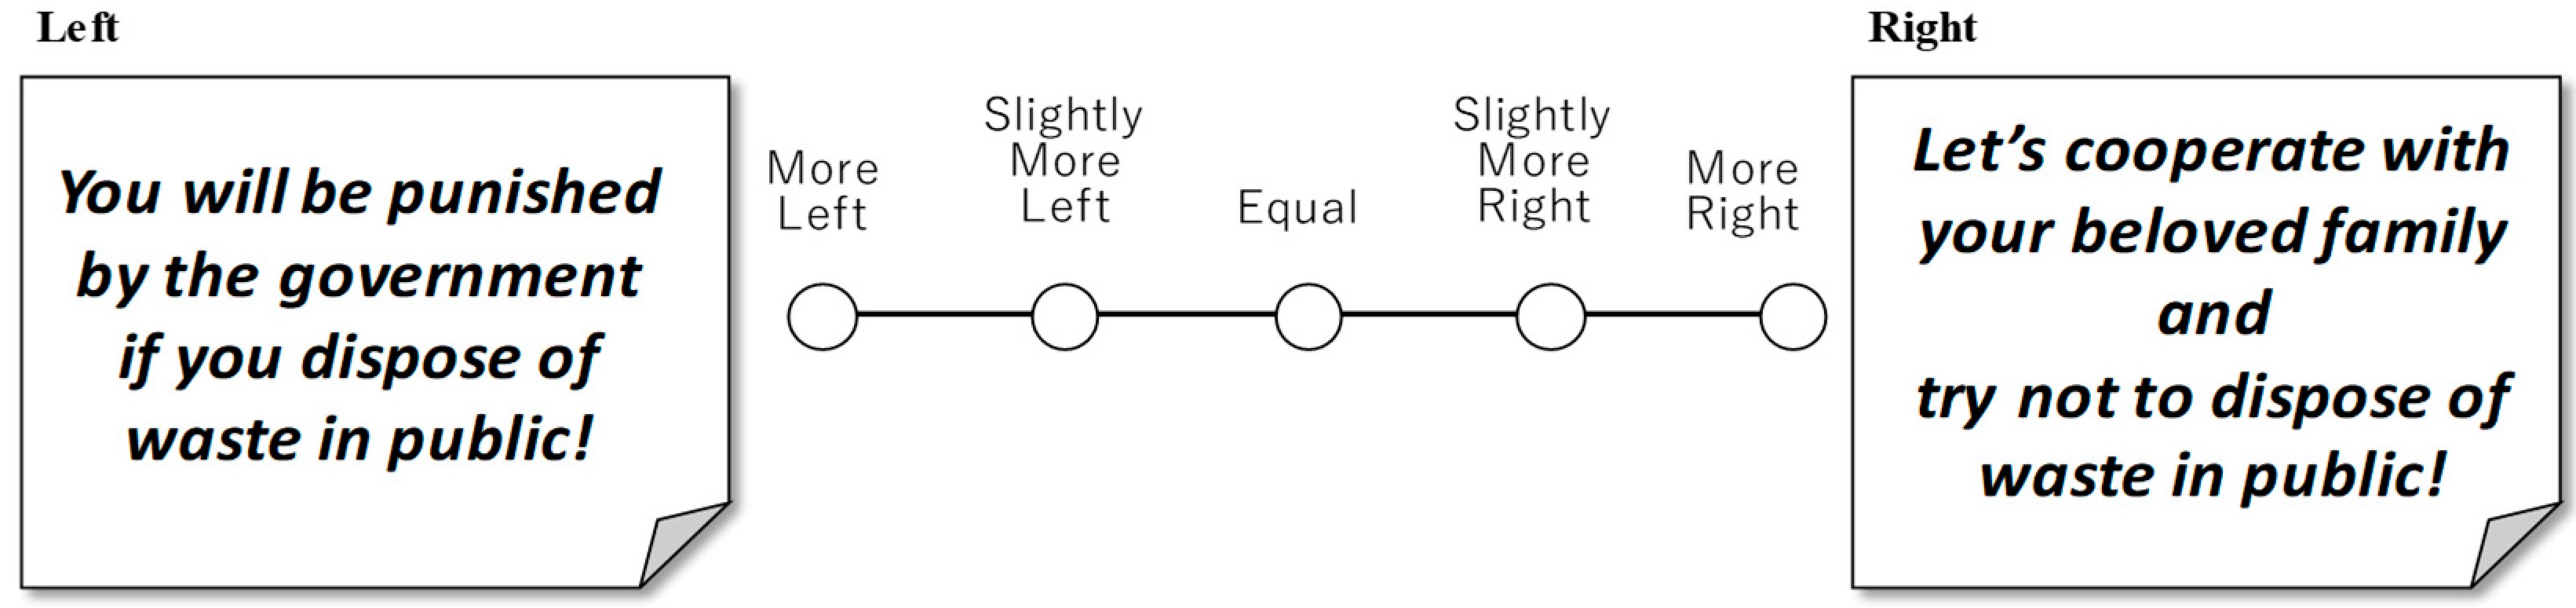
Pair-wise comparisons were prepared among these six statements. We compared two statements at a time. Consequently, we obtained 15 comparisons (6C2 = 15 comparisons). The six statements were shown in the questionnaire (Figure 2). A respondent was asked which statement they were more likely to follow when they encounter the statement in public areas, such as streets, parks, and markets. A five-point scale consisting of “more left”, “slightly more left”, “equal”, “slightly more right”, and “more right” (statement) was used, indicating between the two choices.
Please imagine that following statements are shown in a community board in your town. Then, please select the statement you are more likely to follow.
2.3. Questionnaire Design
Table 3 shows the questionnaire structure for the residents. The questionnaire consisted of three parts. The first part investigated socio-demographic information such as age, gender, address, family income, education level, family size, and household type. The second part consisted of questions about current waste collection services such as collection and disposal frequency, number of waste bags disposed, disposal location, satisfaction level with the current services, past experiences of waste disposal in public open spaces, reason for waste disposal (if any), and free opinions or requests concerning current waste collection services. The third part was to measure people’s tendency to follow the proposed norm-interventions using 15 pair-wise questions.
2.4. Questionnaire Survey
The respondents were selected by fixed intervals of blocks along the target street shown in Table 1. The total population of Phnom Penh is 1.6 million, and according to Yamane’s formula, 400 samples are needed for this population to obtain a 95% confidence level with significance at the level of 5% [35]. Thus, a sample size of 100 was used for each of the four sites, resulting in a total sample size of 400.
An interview survey was used in order to avoid misunderstanding and confusing questions. Moreover, the interviewers could be flexible in handling the survey process since some questions could be sensitive to some people. Ten Cambodian university students were employed to help conduct the interview survey. Prior to the main survey operation, two training sessions were conducted during 6–7 January 2019. In the first session, all questions were explained to ensure that the interviewers clearly understood all the questions. In the second session, random people were selected and used for interviewers to conduct mock surveys, and whether they could handle and obtain the answers smoothly was checked. After these training sessions, the main survey was conducted during 8–16 January 2019, resulting in a total of 402 samples.
In addition to residents, to gather opinions from the governmental side, the official, who is an expert and in charge of waste management from the Ministry of Environment (MoE) and officials from local government were interviewed using the same pair-wise questions. Table 4 shows the interview dates and interviewees. For the officials, the 15 pair-wise statements were also used, but the question was slightly modified to “if the statement is shown in a public space such as along the street, market, or park, which one do you think is more effective in encouraging people to avoid disposal of waste in public open spaces?”
2.5. Analytical Method
Saaty’s [36] comparison scale (e.g., 5, 3, 1, 1/3, and 1/5 for the five-point scale shown in Figure 2) and the calculation method known as the Analytic Hierarchy Process were used to analyze the pair-wise comparison results. The pair-wise matrix (X) was constructed as shown in Equation (1):
where XAB represents how much the respondent thinks item (“statement” in this case) A is more likely to be preferred than item B based on Saaty’s scale. The tendency to follow on each item k is calculated as an eigenvector (ωk) as shown in Equation (2):
where λ is an eigenvalue of matrix X. The eigenvector is calculated by numerical method, where and 0 < ωk < 1.
In this eigenvector method, the consistency of each respondent’s answers can be evaluated using a Consistency Index (CI) as shown in Equation (3). “Consistency” of comparison means if a respondent answers A > B and B > C, then they should answer A > C.
Here, N is the number of items (in this case, the number of statements: N = 6). A CI of zero means absolute consistency, and 1.0 means absolute inconsistency.
Theoretically, only the responds that fulfil the criterion of consistency index will be chosen to do further analysis. Saaty suggests that answers within CI ≤ 0.1 are acceptable [36]. However, in practice, CI > 0.1 has been accepted to deal with social survey data. Some previous studies used 0.2 instead of 0.1 as the CI criterion [37,38]. In this study, most respondents chose edge points (“more left” or “more right”) rather than intermediate points (“slightly more left” or “slightly more right”). Therefore, if the basic scale ranging 5 to 1/5 was applied, most of the answers had CI > 0.15. However, the overall results showed a clear tendency of preference order. Therefore, a narrower scale ranging from 3 to 1/3 was applied, in which respondents who select only the edge points following the order of the average result can fulfill the criterion CI < 0.15. Then, in this study, the scale of 3, 2, 1, 1/2 and 1/3, and CI criterion of 0.15, were applied.
3. Results
3.1. Sample Distribution
A total of 402 samples were collected from the four sites. With respect to gender, the proportion of females was higher (73.0%), possibly because the survey was conducted in daytime and during weekdays. In regard to age distribution, the respondents that were aged below 20 years accounted for 6.4%, and respondents in their 20s and 30s were 26.5% and 28.4%, respectively. The majority of respondents had finished high school (27.4%), 18.1% had obtained a bachelor’s degree, and < 1% had received a postgraduate degree. The characteristics of the respondents were similar to those of our previous survey [2].
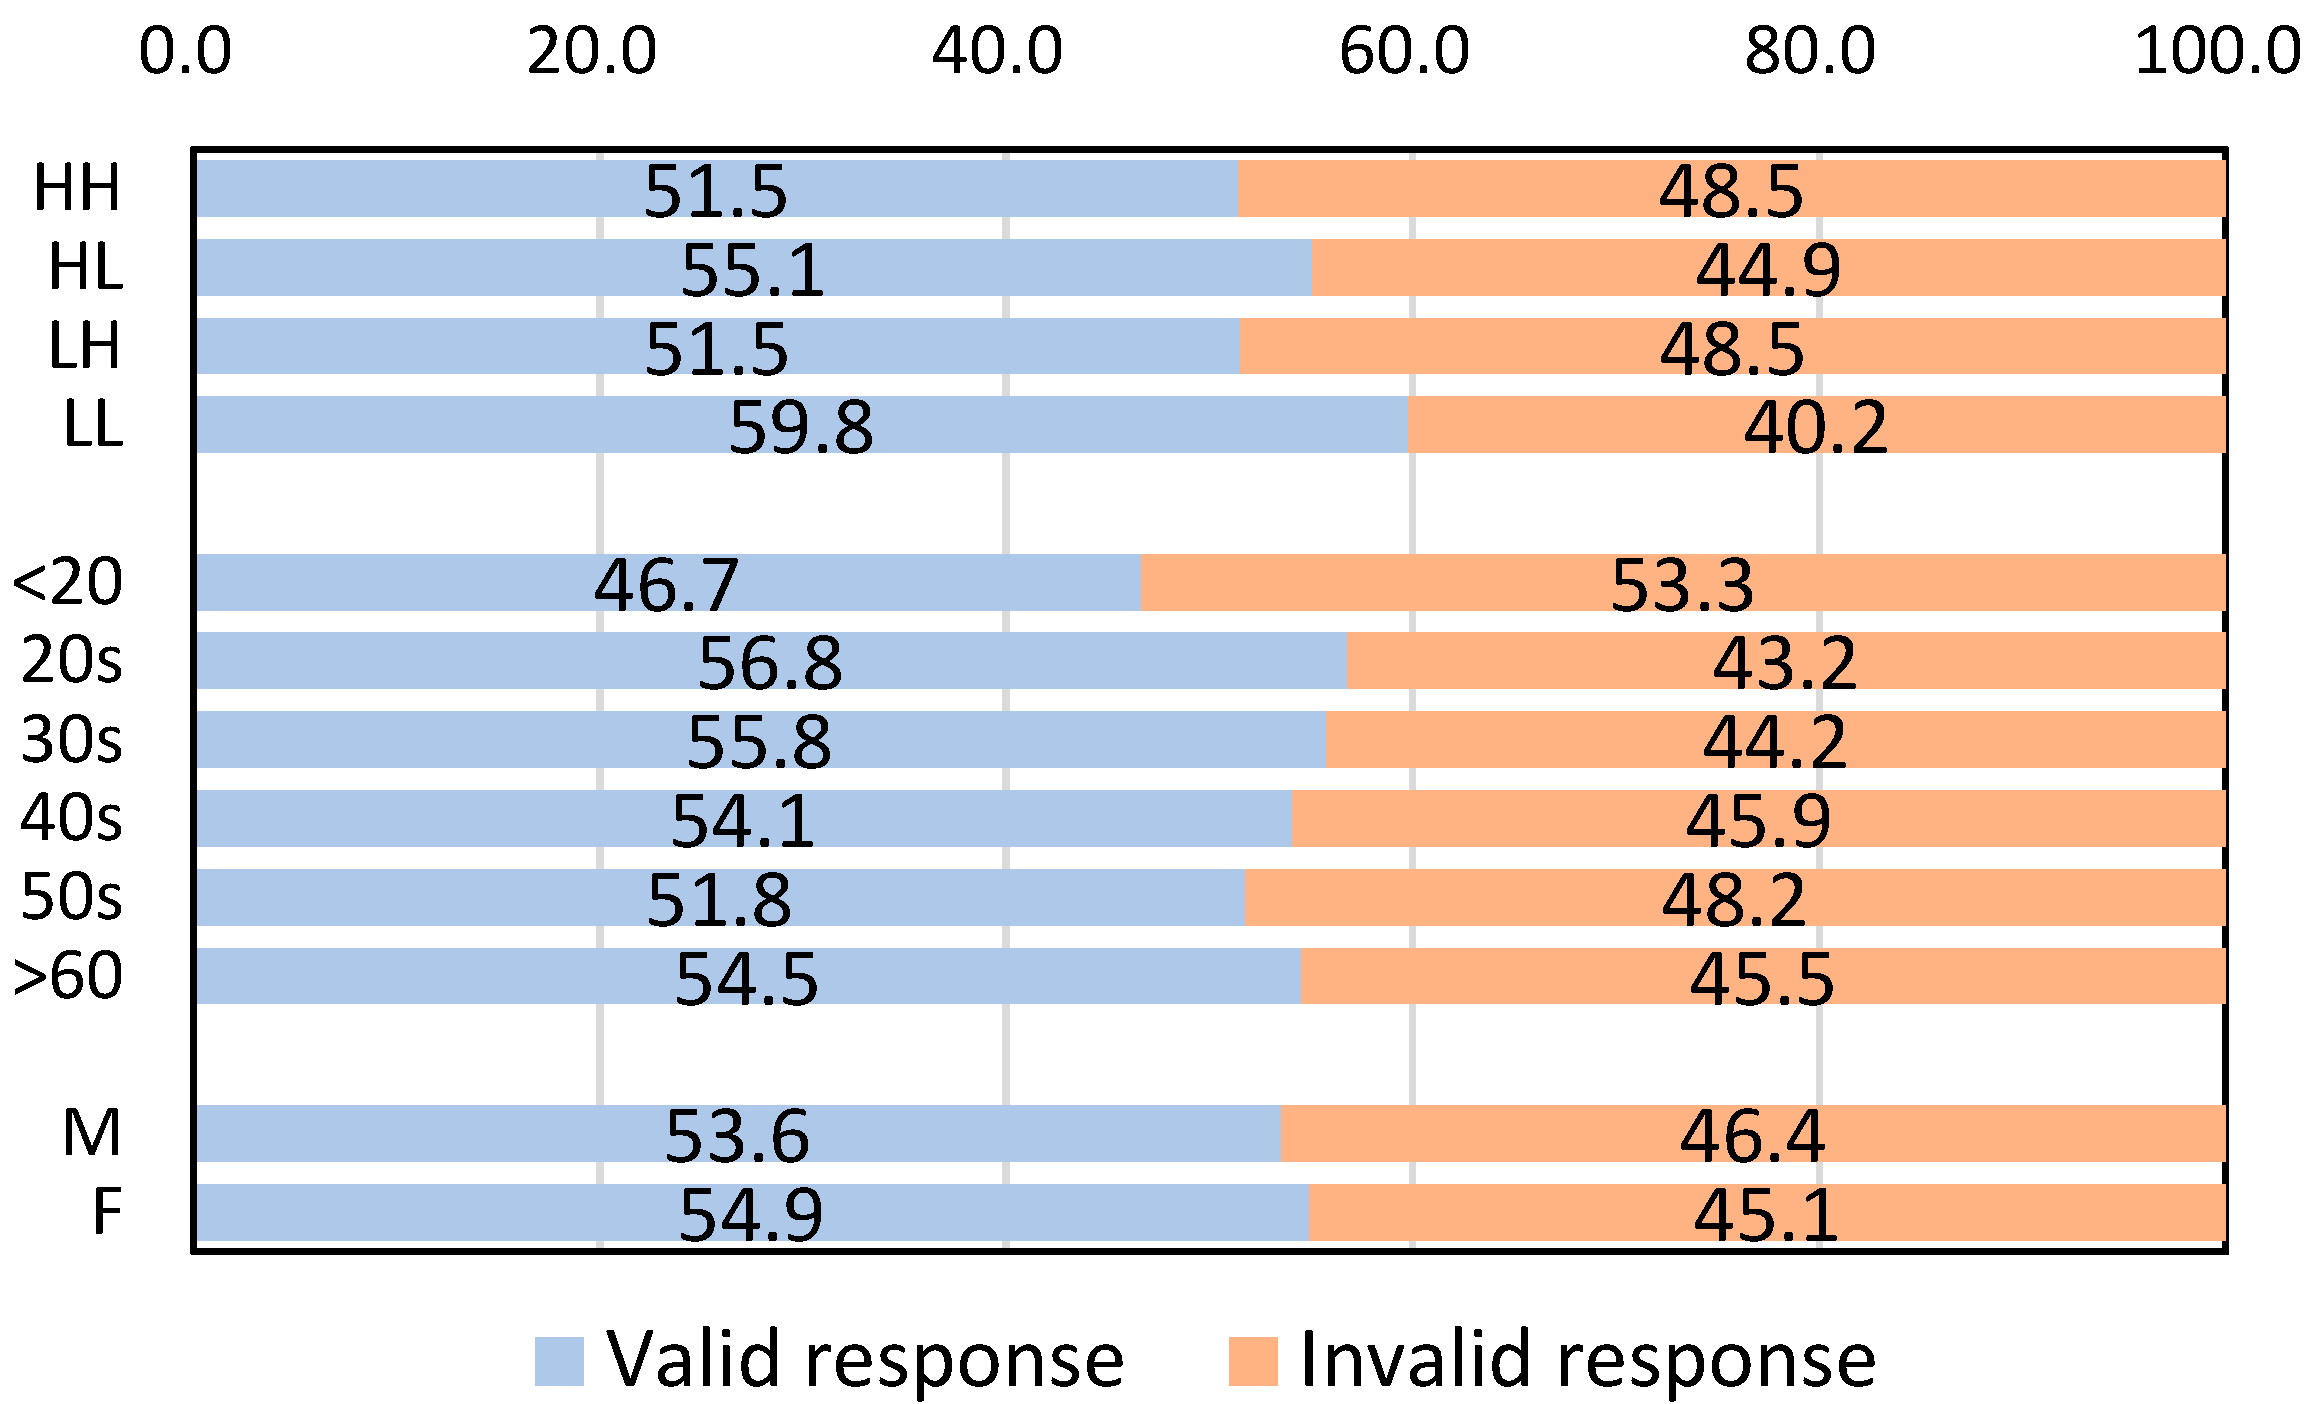
The CI was calculated for each respondent, and 221 out of 402 samples fulfilled the criterion of CI ≤ 0.15. Figure 3 shows the ratio of valid (CI ≤ 0.15) and invalid (CI > 0.15) samples in each socio-demographic group. All surveyed sites had > 50% of valid responses. The people in LL showed the highest valid response rate among all sites. With respect to age, teenagers showed the least valid responses, and people in their 20s and 30s showed the highest percentage of valid responses. No difference between males and females was observed in the results, and the total valid responses were around 55%. For further analysis, these valid samples (n = 221) were used. To gain the average results of the target group, the average point of each comparison question was calculated first, and the pair-wise matrix for each group was prepared, and then the eigenvector was calculated for each group as shown in Equations (1)–(3).
3.2. Score Weight of Each Statement
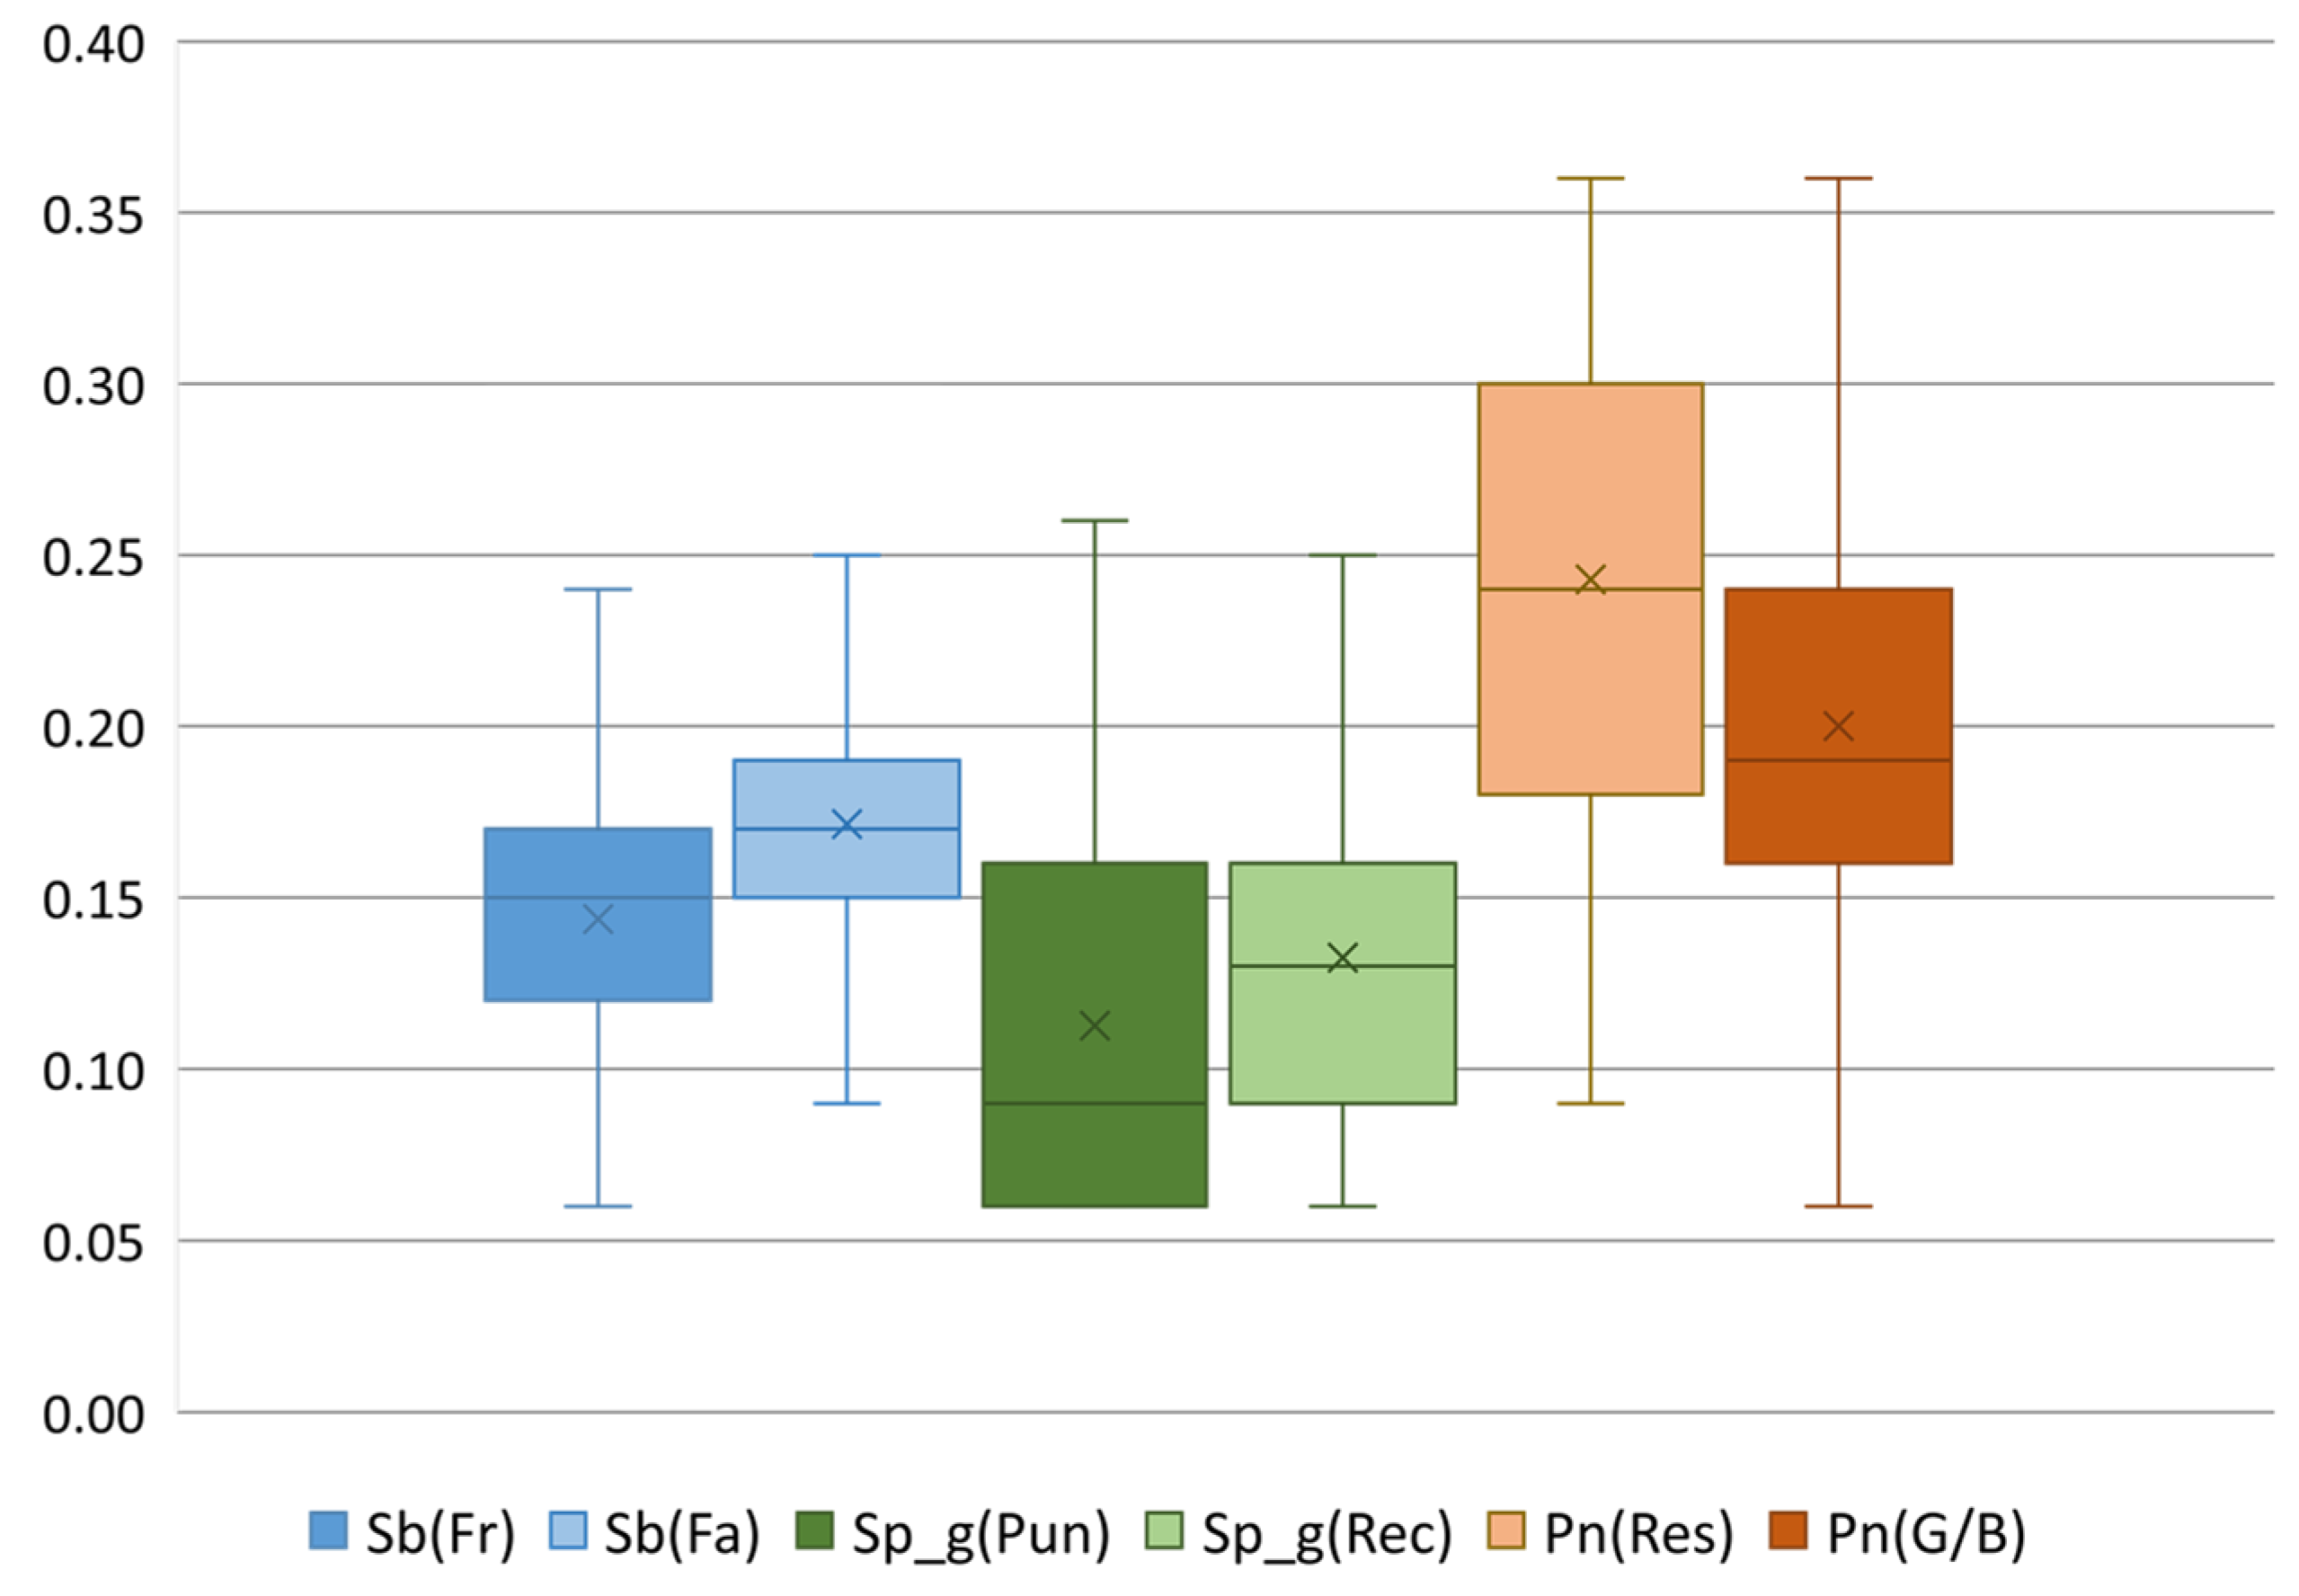
Figure 4 shows the average score weight of each statement of all valid respondents (n = 221). The Pn was the highest score among all interventions especially Pn focusing on responsibility (Pn(Res)). Figure 5 shows the score range of each statement. Pn(Res) shows the highest score range, comparing with the other statements, with quantile range of 0.18–0.30 and median 0.24. The Sp_g was the lowest among all, especially for pressure involving punishment (Sp_g(Pun)), in which the quantile range was 0.06–0.16 with the average 0.11 and median 0.09. The social pressure from family members (Sb(Fa)) was slightly higher than that from friends (Sb(Fr)). The quantile range of Sb(Fa) was 0.15–0.19 with median 0.17, and correspondingly for Sb(Fr) was only 0.12–0.17 and 0.15.
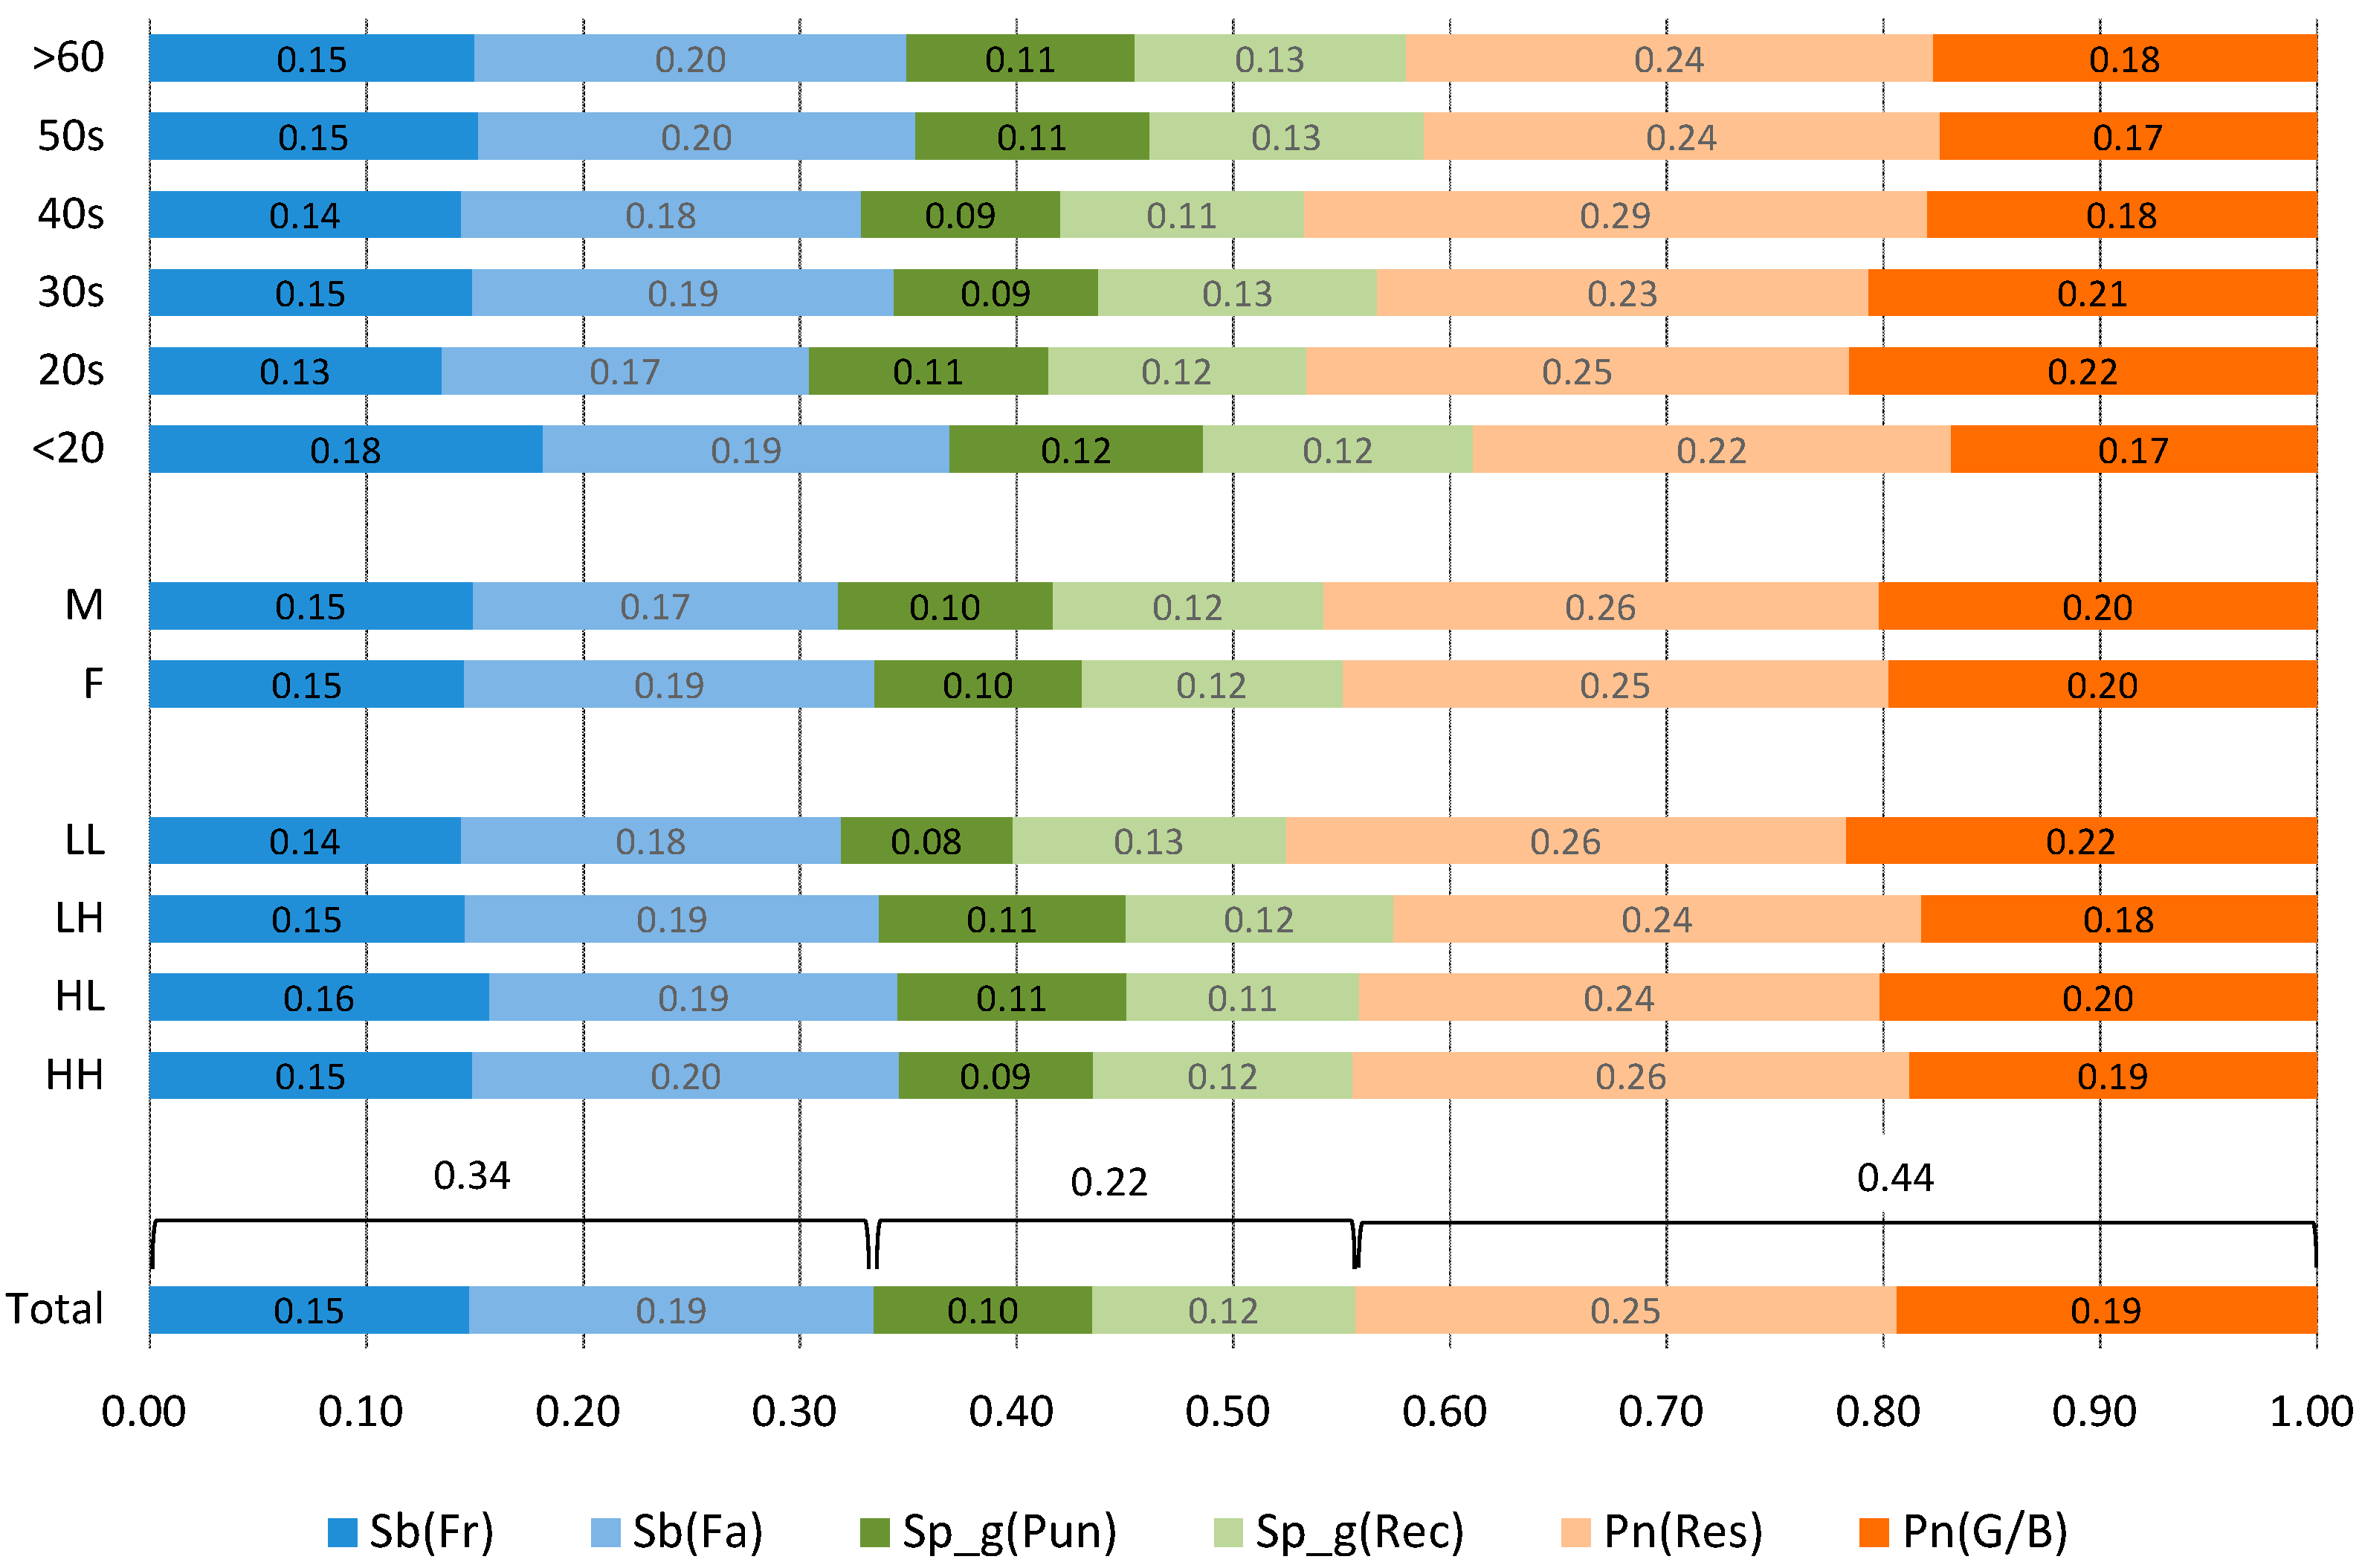
Figure 6 shows the score differences according to socio-demographic groups. The score from Pn interventions, especially Pn(Res), was the highest, while Sp_g was the lowest in all groups. With respect to age, teenagers showed a slightly higher tendency for collaboration with their peers, and people in their 40s showed the highest tendency for Pn(Res). In regard to gender and areas, the differences in the intervention tendencies to follow were small.
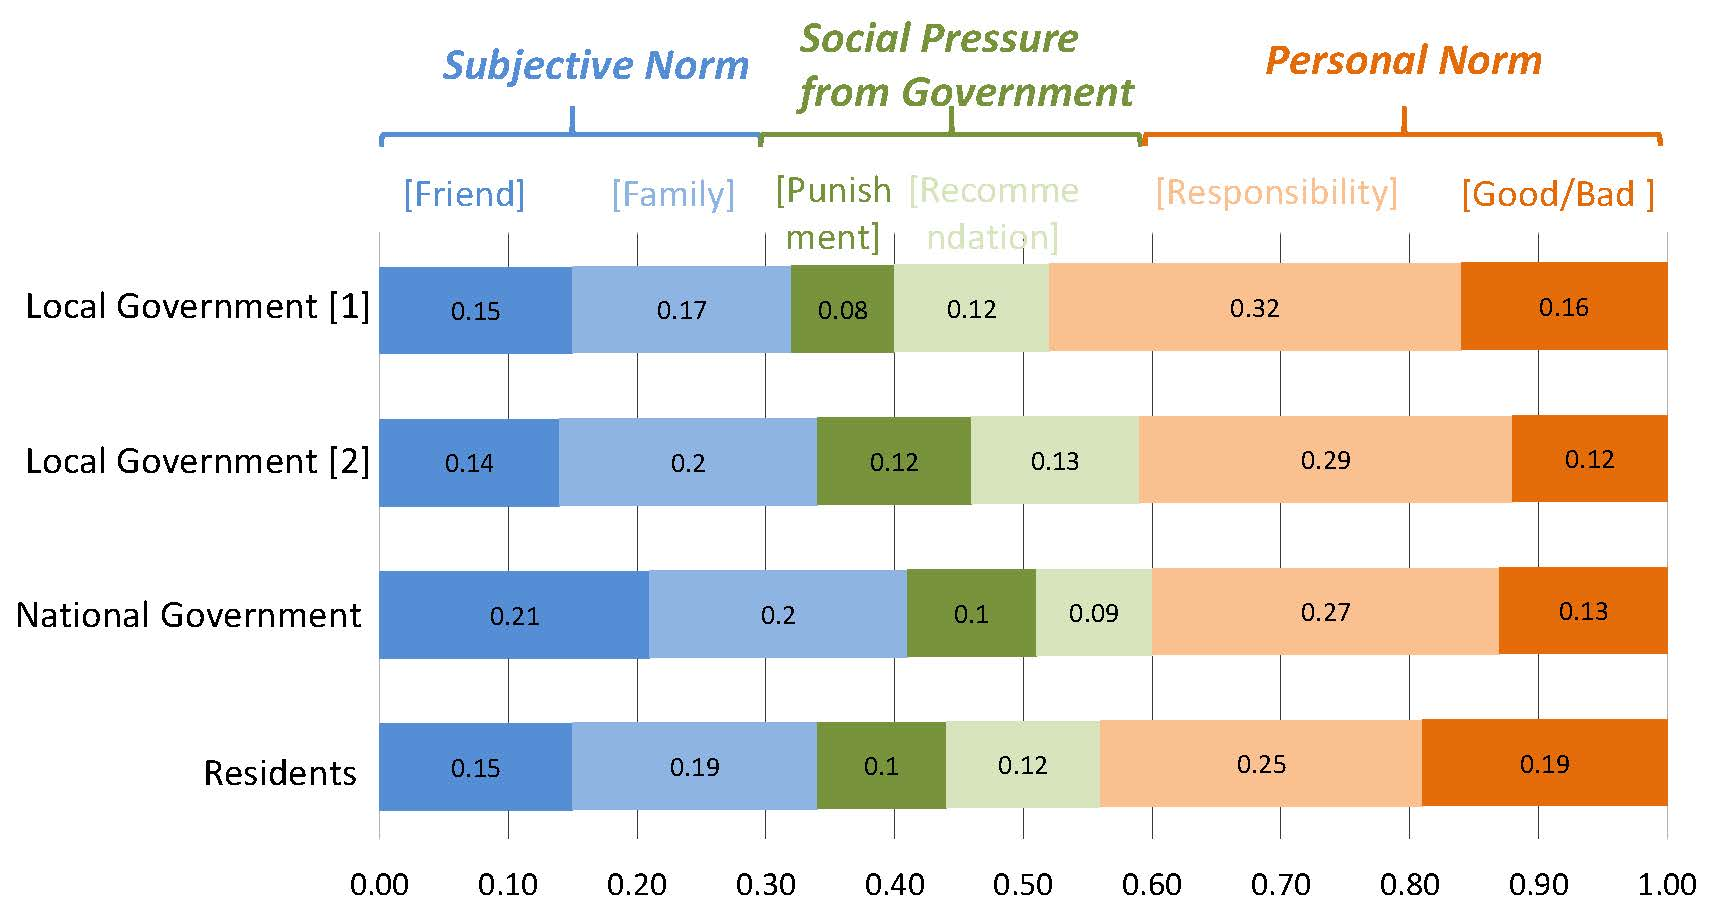
3.3. Opinion from the Central and Local Governments on Proposed Interventions
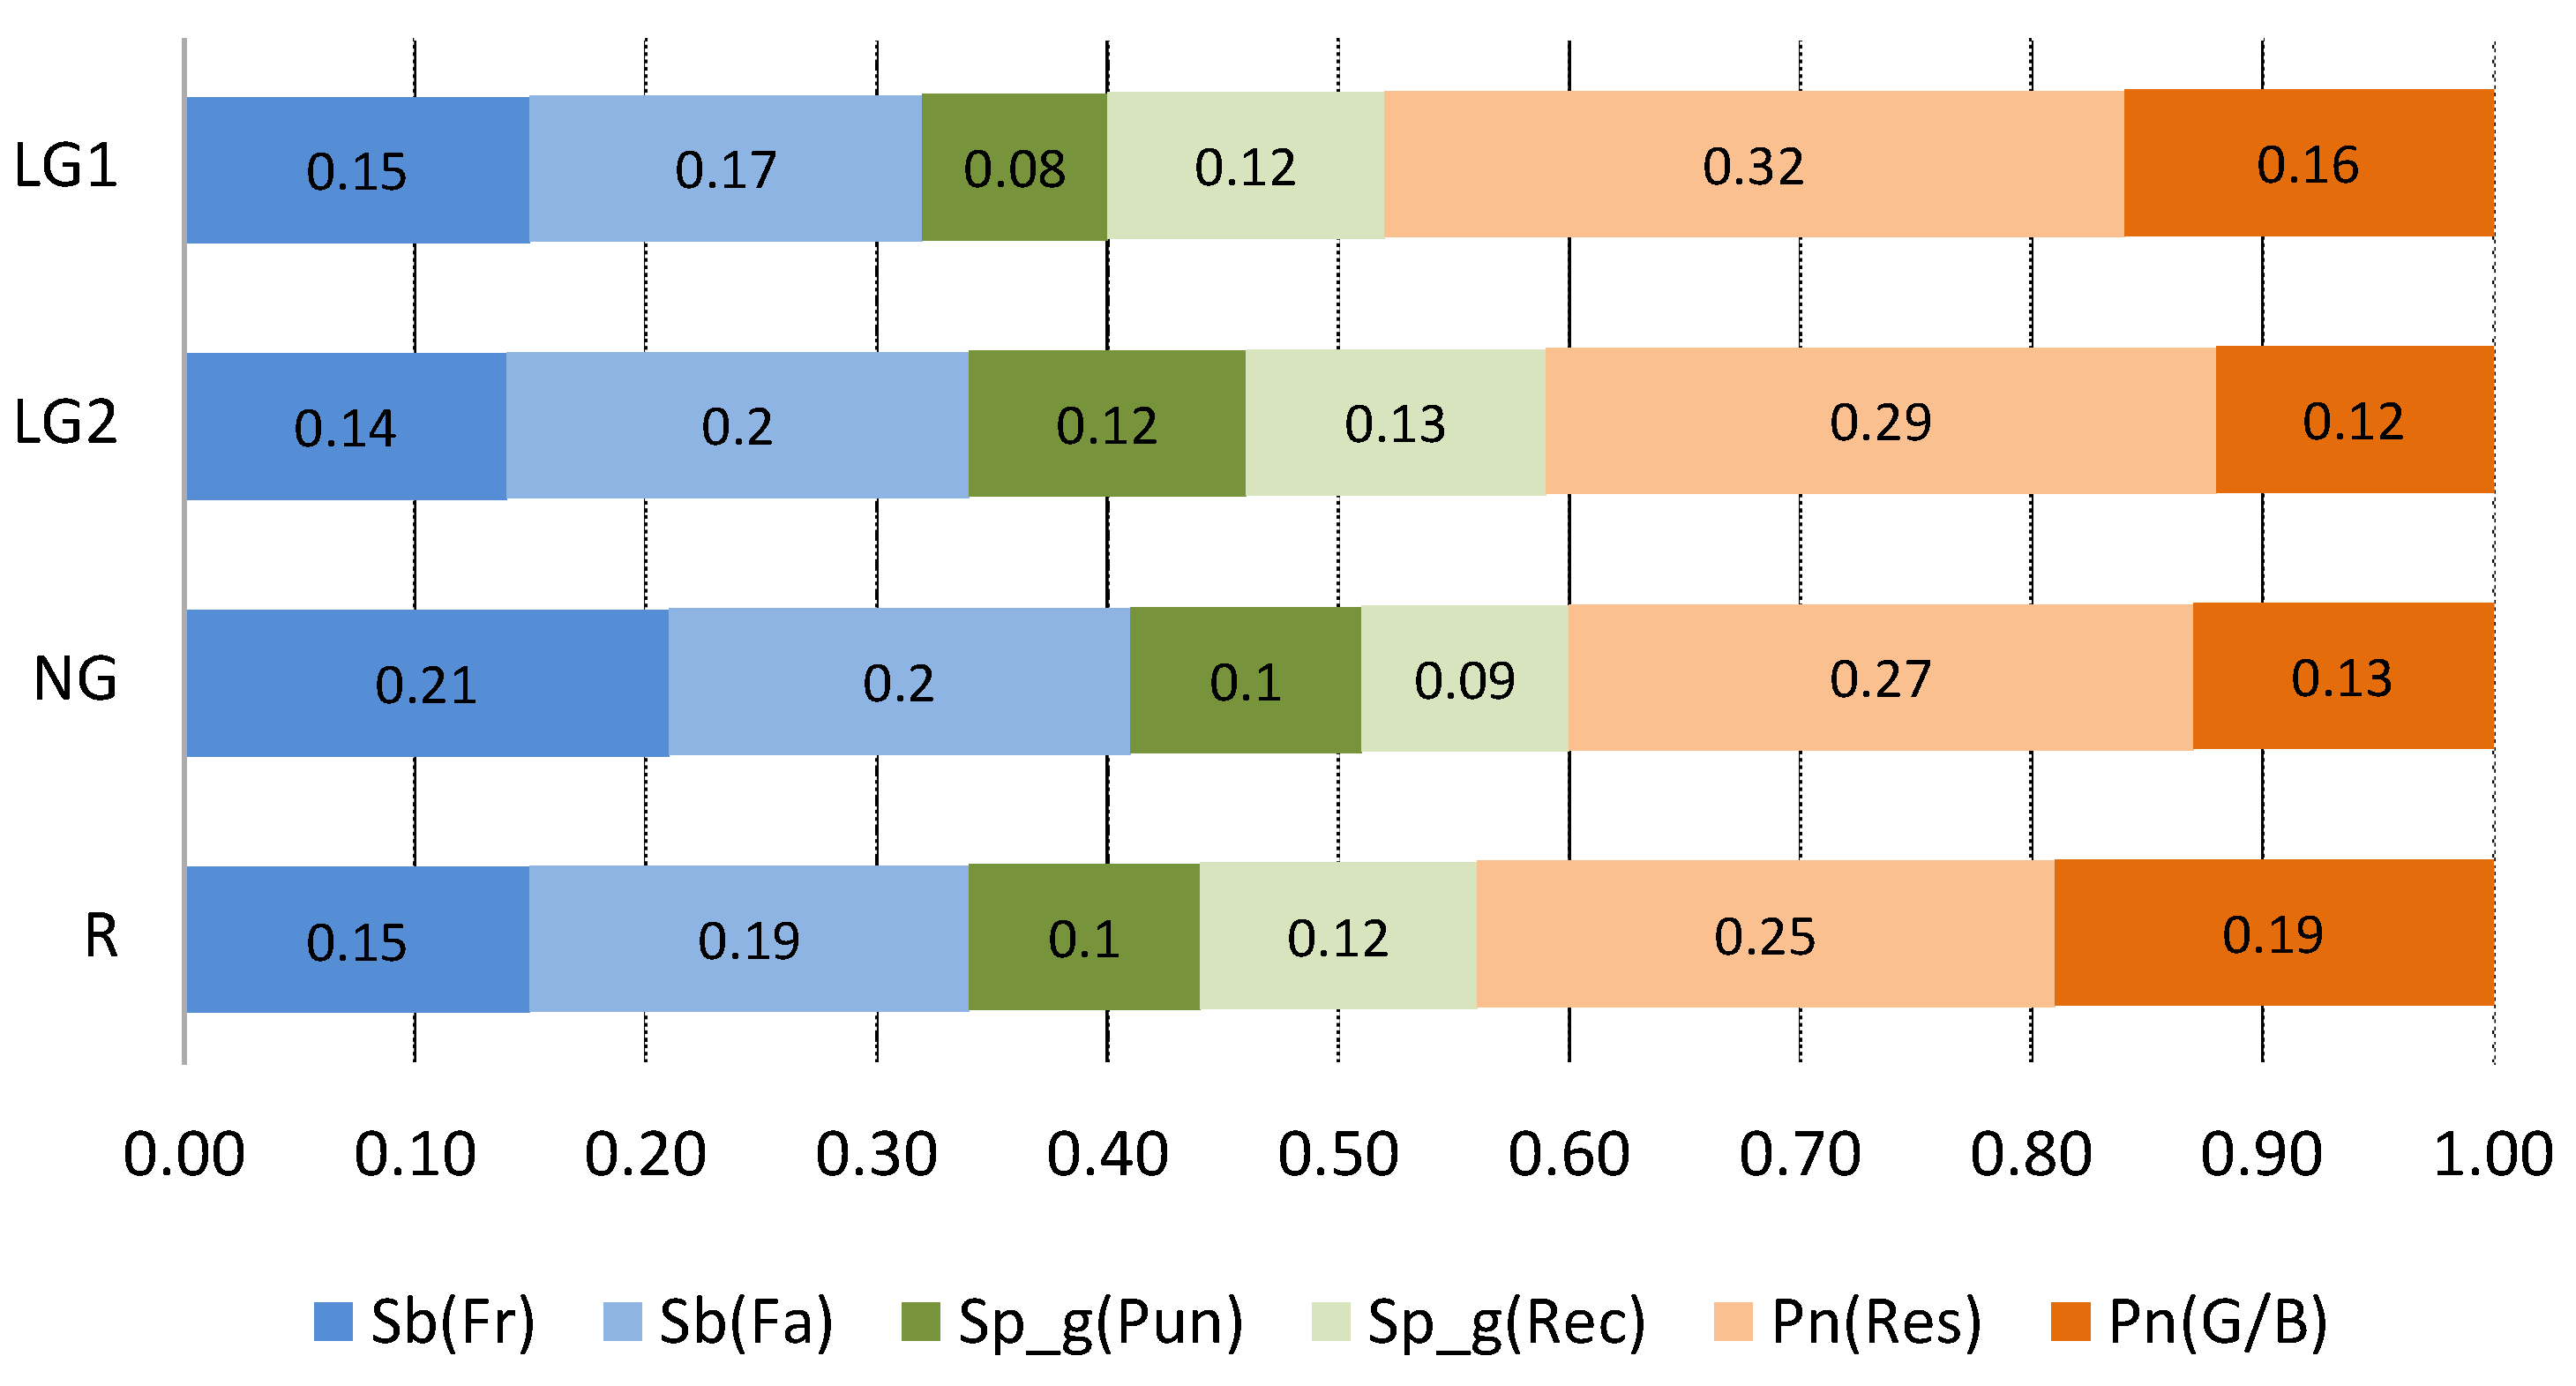
All officials showed valid consistency for their answers with CI ranging within 0.048–0.105. Figure 7 shows the score weight of the effectiveness of each statement perceived by the officials (LG1, LG2, and NG) compared with results from residents (R). The officials’ perspectives and residents’ tendency to follow coincided. Both perceived that the intervention focusing on “responsibility” was the most effective and was likely to be followed among all interventions. The Sb(Fa) and Sb(Fr) were the second and third most effective interventions in government officials’ opinions and were second and fourth most effective according residents. Unlike residents’ results, the officials gave lower scores on the Pn focusing on “good/bad” (Pn(G/B)) compared to Pn(Res). Residents and government officials both shared the same belief that Sp_g, either soft or strict, was ineffective and these were the least favored of all interventions. After asking officials for their opinions regarding the effectiveness of the interventions, the results of the residents’ tendency to follow was shown to them and their opinions were asked. The national official totally agreed with the residents’ tendency to follow, but suggested that the perceived “good/bad” of waste disposal related intervention would be ineffective, as shown by the lower score from this official concerning this statement.
4. Discussion
The results indicate that the bottom-up approach was likely more effective and more accepted by the public compared to a top-down approach. The personal norm was perceived as the most effective intervention that could encourage people to avoid disposing of waste in public open spaces. This suggested that the successful way to resolve the issue of waste disposal in public is to foster a sense of responsibility as well as a moral obligation to keep the surroundings clean. This is supported by several previous studies [39,40]. The information regarding the importance of sanitation and impacts of waste disposal in public should be consistently provided since it could awaken personal norms and stimulate an environmental attitude as well as raise awareness among people of loving the surrounding environment. The result coincides with some studies that focused on providing information to enhance people’s awareness and responsibility toward the environment, especially recycling behavior (e.g., Bowman et al. [41], Chase et al. [42], and Cotteril et al. [43]). Grodzinska et al. suggested that providing educational materials such as information leaflets and posters could foster environmental behavior in individuals and could increase waste recycling and participation rates [28]. In addition to information provision, feedback campaigns should be occasionally launched. The feedback campaigns could be in the form of personal or community commitments and goals to perform a certain behavior. Such campaigns can act as reminders to reinforce personal norms.
The subjective norm in this study seemed to be welcomed by many people and was thought to be effective by government officials. This indicated that individuals believed that opinions of surrounding people, such as family members and friends, have a positive pressure on them to perform or avoid certain behaviors. Maddox et al. supported the finding that educating children at school about waste recycling could not only activate personal norms via increasing students’ knowledge and understanding of waste recycling and waste reduction, but could also affect their parents and other household members through home-based educational activities. The study resulted in an 8.6% increase of recycling rate after implementing the project to make students into role models for family members [44]. Consequently, if the subjective norm could be incorporated with the personal norm, this could yield great results. Tagkalouglou et al. suggested that self-determined focusing on personal norms and subjective norms could predict progress toward promoting pro-environmental behavior [29].
The results of this study also indicated that social pressure from the government was the least favored among all interventions, and government officials also believed that this would be ineffective. This indicates that involvement from the government will not encourage people to avoid waste disposal in public. The results showed that strict interventions such as punishment were not welcomed by the majority of people in the community, and were considered ineffective by central and local government officials. This infers that if the government imposes strict regulations on waste dumping in public, people are less likely to cooperate. The strict regulation would not yield a fruitful result, but could backfire due to people’s resistance. The soft version of social pressure from the government, such as recommendations to perform or not perform certain behaviors, also seemed to be ineffective. As a result, any involvement by government should be carefully considered to avoid possible foreseen and unforeseen resistance from the public.
5. Conclusions
Interventions to avoid waste disposal in public open spaces were evaluated using six statements and focusing on three significant variables: personal norms, subjective norms, and social pressure from government. To evaluate the effectiveness of these interventions, 15 pair-wise questions were designed and put to the residents and government officials in Phnom Penh, Cambodia. The questionnaire survey for residents was conducted in four different areas that differed in waste collection frequency and population density in January 2019. The results showed that people were more likely to follow a statement that focused on personal norms particularly focusing on “responsibility” rather than social pressure from expectations of friends and family members and pressure from government. Social pressure from the government, either soft or strict, was the least favored of all interventions. The interviews of government officials were conducted in March 2019. The results showed that government-side perceptions of the effectiveness of the interventions were similar to those of the tendency to follow by residents. The highly accepted and perceived effective intervention focusing on people’s responsibility could be used as a future intervention. This indicates that the bottom-up approach interventions will be more effective than that of the interventions from top down approach in dealing with waste disposal public open spaces. The civic engagement should be encouraged by stimulating and enhancing the sense of obligation and the moral obligation of the citizens. Further studies to investigate the effectiveness of such an intervention by an actual trial of the statement, such as in a poster, are desirable.
Author Contributions
Conceptualization, P.S. and K.K.; methodology, P.S. and K.K.; formal analysis, P.S.; writing—original draft preparation, P.S.; review and editing, K.K.; supervision, K.K.; funding acquisition, K.K.
Funding
This research was partially supported by the Environment Research and Technology Development Fund (S-16) of the Environmental Restoration and Conservation Agency, Japan.
Acknowledgments
We appreciate the students who participated the survey as the interviewers.
Conflicts of Interest
The authors declare no conflict of interest.
References
- Hoornweg, D.; Bhada-Tata, P. What a Waste: A Global Review of Solid Waste Management; The World Bank: Washington, DC, USA, 2012. [Google Scholar]
- Srun, P.; Kurisu, K. Internal and External Influential Factors on Waste Disposal Behavior in Public Open Spaces in Phnom Penh, Cambodia. Sustainability 2019, 11, 1518. [Google Scholar] [CrossRef]
- Kum, V.; Sharp, A.; Harnpornchai, N. Improving the solid waste management in Phnom Penh city: A strategic approach. Waste Manag. 2005, 25, 101–109. [Google Scholar] [CrossRef] [PubMed]
- Seng, B.; Kaneko, H.; Hirayama, K.; Katayama-Hirayama, K. Municipal solid waste management in Phnom Penh, capital city of Cambodia. Waste Manag. Res. 2010, 29, 491–500. [Google Scholar] [CrossRef] [PubMed]
- Ojedokun, O. Attitude towards littering as a mediator of the relationship between personality attributes and responsible environmental behavior. Waste Manag. 2011, 31, 2601–2611. [Google Scholar] [CrossRef] [PubMed]
- Miliute-Plepiene, J.; Hage, O.; Plepys, A.; Reipas, A. What motivates households recycling behaviour in recycling schemes of different maturity? Lessons from Lithuania and Sweden. Resour. Conserv. Recycl. 2016, 113, 40–52. [Google Scholar] [CrossRef]
- Boadi, K.O.; Kuitunen, M. Municipal solid waste management in the Accra Metropolitan Area, Ghana. Environmentalist 2003, 23, 211–218. [Google Scholar] [CrossRef]
- Stoeva, K.; Alriksson, S. Influence of recycling programmes on waste separation behaviour. Waste Manag. 2017, 68, 732–741. [Google Scholar] [CrossRef]
- Xu, L.; Ling, M.; Lu, Y.; Shen, M. External influences on forming residents’ waste separation behaviour: Evidence from households in Hangzhou, China. Habitat Int. 2017, 63, 21–33. [Google Scholar] [CrossRef]
- Oskamp, S.; Harrington, M.J.; Edwards, T.C.; Sherwood, D.L.; Okuda, S.M.; Swanson, D.C. Factors influencing household recycling behavior. Environ. Behav. 1991, 23, 494–519. [Google Scholar] [CrossRef]
- Hopper, J.R.; Nielsen, J.M. Recycling as altruistic behavior: Normative and behavioral strategies to expand participation in a community recycling program. Environ. Behav. 1991, 23, 195–220. [Google Scholar] [CrossRef]
- Ewing, G. Altruistic, egoistic, and normative effects on curbside recycling. Environ. Behav. 2001, 33, 733–764. [Google Scholar] [CrossRef]
- Davies, J.; Foxall, G.R.; Pallister, J. Beyond the intention–behaviour mythology: An integrated model of recycling. Mark. Theory 2002, 2, 29–113. [Google Scholar] [CrossRef]
- Tabernero, C.; Hernández, B.; Cuadrado, E.; Luque, B.; Pereira, C.R. A multilevel perspective to explain recycling behaviour in communities. J. Environ. Manag. 2015, 159, 192–201. [Google Scholar] [CrossRef] [PubMed]
- Botetzagias, I.; Dima, A.F.; Malesios, C. Extending the theory of planned behavior in the context of recycling: The role of moral norms and of demographic predictors. Resour. Conserv. Recycl. 2015, 95, 58–67. [Google Scholar] [CrossRef]
- Strydom, W. Applying the theory of planned behavior to recycling behavior in South Africa. Recycling 2018, 3, 43. [Google Scholar] [CrossRef]
- Hornik, J.; Cherian, J.; Madansky, M.; Narayana, C. Determinants of recycling behavior: A synthesis of research results. J. Socio Econ. 1995, 24, 105–127. [Google Scholar] [CrossRef]
- Barr, S. Strategies for sustainability: Citizens and responsible environmental behaviour. Area 2003, 35, 227–240. [Google Scholar] [CrossRef]
- Bernstad, A. Household food waste separation behavior and the importance of convenience. Waste Manag. 2014, 34, 1317–1323. [Google Scholar] [CrossRef]
- Whitehair, K.J.; Shanklin, C.W.; Brannon, L.A. Written messages improve edible food waste behaviors in a university dining facility. J. Acad. Nutr. Diet. 2013, 113, 63–69. [Google Scholar] [CrossRef]
- Kallbekken, S.; Sælen, H. ‘Nudging’ hotel guests to reduce food waste as a win–win environmental measure. Econ. Lett. 2013, 119, 325–327. [Google Scholar] [CrossRef]
- Moreland, J.; Melsop, S. Design Interventions to Encourage Pro-Environmental Behavior. Available online: http://www.plea2014.in/wp-content/uploads/2014/12/Paper_6E_2672_PR.pdf (accessed on 18 June 2019).
- Farrow, K.; Grolleau, G.; Ibanez, L. Social norms and pro-environmental behavior: A review of the evidence. Ecol. Econ. 2017, 140, 1–13. [Google Scholar] [CrossRef]
- Stöckli, S.; Niklaus, E.; Dorn, M. Call for testing interventions to prevent consumer food waste. Resour. Conserv. Recycl. 2018, 136, 445–462. [Google Scholar] [CrossRef]
- Haines, M.P.; Rice, R. Misperceiving the college drinking norm and related problems: A nationwide study of exposure to prevention information, perceived norms and student alcohol misuse. J. Stud. Alcohol 2005, 66, 470–478. [Google Scholar]
- Cialdini, R.B.; Reno, R.R.; Kallgren, C.A. A focus theory of normative conduct: Recycling the concept of norms to reduce littering in public places. J. Personal. Soc. Psychol. 1990, 58, 1015–1026. [Google Scholar] [CrossRef]
- Goldstein, N.J.; Cialdini, R.B.; Griskevicius, V. A room with a viewpoint: Using social norms to motivate environmental conservation in hotels. J. Consum. Res. 2008, 35, 472–482. [Google Scholar] [CrossRef]
- Grodzińska-Jurczak, M.; Tomal, P.; Tarabuła-Fiertak, M.; Nieszporek, K.; Read, A.D. Effects of an educational campaign on public environmental attitudes and behaviour in Poland. Resour. Conserv. Recycl. 2006, 46, 182–197. [Google Scholar] [CrossRef]
- Tagkaloglou, S.; Kasser, T. Increasing collaborative, pro-environmental activism: The roles of Motivational Interviewing, self-determined motivation, and self-efficacy. J. Environ. Psychol. 2018, 58, 86–92. [Google Scholar] [CrossRef]
- Al-Khatib, I.A.; Arafat, H.A.; Daoud, R.; Shwahneh, H. Enhanced solid waste management by understanding the effects of gender, income, marital status, and religious convictions on attitudes and practices related to street littering in Nablus—Palestinian territory. Waste Manag. 2009, 29, 449–455. [Google Scholar] [CrossRef]
- Schultz, P.W.; Bator, R.J.; Large, L.B.; Bruni, C.M.; Tabanico, J.J. Littering in context: Personal and environmental predictors of littering behavior. Environ. Behav. 2013, 45, 35–59. [Google Scholar] [CrossRef]
- Cintri. Waste Collection Reports for Khan Dongkor, Khan Prampir Meakkakra, Khan Chbar Amporv, Khan Chhroy Chongva, Khan Chomkar Mom, Khan Duon Penh, Khan Mean Chey, Khan Pousenchey, Khan Prek Pnov, Khan Reussey Keo District, Khan Sensok, and Khan Tuol Kork. 2016. Available online: http://www.cintri.com.kh/view.aspx?LID=KH&mID=H11 (accessed on 10 March 2019). (In Khmer).
- National Institute of Statistics of Cambodia (NIS). General Population Census of Cambodia 2008; National Institute of Statistics, Ministry of Planning: Phnom Penh, Cambodia, 2009. [Google Scholar]
- Schwartz, S.H. Normative influences on altruism. In Advances in Experimental Social Psychology; Berkowitz, L., Ed.; Academic Press: New York, NY, USA, 1977; pp. 221–279. [Google Scholar]
- Yamane, T. Statistics: An Introductory Analysis, 2nd ed.; Harper and Row: New York, NY, USA, 1967. [Google Scholar]
- Saaty, T.L. Fundamentals of Decision Making and Priority Theory, with The Analytic Hierarchy Process; RWS Publications: Pittsburgh, PA, USA, 1994; Volume 6, pp. 69–92. [Google Scholar]
- Dodd, F.J.; Donegan, H.A.; McMaster, T.B.M. Inverse Inconsistency in Analytic Hierarchies. Eur. J. Oper. Res. 1995, 80, 86–93. [Google Scholar] [CrossRef]
- Tung, S.L.; Tang, S.L. A Comparison of the Saaty’s AHP and Modified AHP for Right and Left Eigenvector Inconsistency. Eur. J. Oper. Res. 1998, 106, 123–128. [Google Scholar] [CrossRef]
- Bortoleto, A.P.; Kurisu, K.H.; Hanaki, K. Model development for household waste prevention behaviour. Waste Manag. 2012, 32, 2195–2207. [Google Scholar] [CrossRef] [PubMed]
- Bamberg, S.; Mӧser, G. Twenty years after Hines, Hungerford, and Tomera: A new meta-analysis of psycho-social determinants of pro-environmental behavior. J. Environ. Psychol. 2007, 27, 14–25. [Google Scholar] [CrossRef]
- Bowman, N.; Goodwin, J.; Jones, P.; Weaver, N. Sustaining recycling: Identification and application of limiting factors in kerbside recycling areas. Int. J. Sustain. Dev. World Ecol. 1998, 5, 263–276. [Google Scholar] [CrossRef]
- Chase, N.; Dominick, G.; Trepal, A.; Bailey, L.; Friedman, D. “This Is Public Health: Recycling Counts!” description of a pilot health communications campaign. Int. J. Environ. Res. Public Health 2009, 6, 2980–2991. [Google Scholar] [CrossRef] [Green Version]
- Cotterill, S.; John, P.; Liu, H.; Nomura, H. Mobilizing citizen effort to enhance environmental outcomes: A randomized controlled trial of a door-to-door recycling campaign. J. Environ. Manag. 2009, 91, 403–410. [Google Scholar] [CrossRef]
- Maddox, P.; Doran, C.; Williams, I.D.; Kus, M. The role of intergenerational influence in waste education programmes: The THAW project. Waste Manag. 2011, 31, 2590–2600. [Google Scholar] [CrossRef]
Figure 1.
Waste collection service data map of Phnom Penh.

Figure 2.
Example of pair-wise comparison of statements.

Figure 3.
Percentage of valid and invalid samples in each socio-demographic group. HH, HL, LH, LL: Surveyed region shown in Table 1, < 20 to > 60: Age, M: Male, and F: Female. Valid response: CI ≤ 0.15, Invalid response: CI > 0.15.
Figure 3.
Percentage of valid and invalid samples in each socio-demographic group. HH, HL, LH, LL: Surveyed region shown in Table 1, < 20 to > 60: Age, M: Male, and F: Female. Valid response: CI ≤ 0.15, Invalid response: CI > 0.15.

Figure 4.
Average weight score of the valid respondents. Error bars represent the standard error values.
Figure 4.
Average weight score of the valid respondents. Error bars represent the standard error values.

Figure 5.
Average weight score range of the valid respondents. The bars represent the maximum and minimum scores. The boxes represent the quantile dividing the distribution into equal proportion of the data. The cross signs (X) are the average. The line inside the box is the median of the data. The description of legend follows the abbreviations shown in Table 2.

Figure 6.
Average score weight of intervention targeting socio-demographic group. HH, HL, LH, LL: Surveyed region shown in Table 1, < 20 to > 60: Age, M: Male, and F: Female. The description of legend follows the abbreviations shown in Table 2.

Figure 7.
Perceived effectiveness of each statement by government officials. R: residents, NG: official from national government, LG: official from local government. The description of legend follows the abbreviations shown in Table 2.
Figure 7.
Perceived effectiveness of each statement by government officials. R: residents, NG: official from national government, LG: official from local government. The description of legend follows the abbreviations shown in Table 2.


Table 1.
Survey sites.
| Commune | Collection Frequency (times/week) | Population Density (persons/km2) | Streets Surveyed | |||
|---|---|---|---|---|---|---|
| HH | Phsar Dermkor | High | 7 | High | 31,065 | St. 223, 230, 234, 231, 239 |
| LH | Toek Thlar | Low | 3 | High | 9186 | St. 1019, 2004, 598 |
| HL | Tonle Basak | High | 7 | Low | 6499 | St. 21, 73, 93, 442, 462 |
| LL | Dangkao | Low | 3 | Low | 1141 | St. 217, 1,5,9,11 st. prey sa |
Table 2.
Prepared statements.
| No. | Abbrev. | Target Factor | Targeting Points | Statements |
|---|---|---|---|---|
| (1) | Sb (fr) | Subjective norms (Sb) | Friends’ expectations | “Let’s cooperate with your friends and try not to dispose of waste in public!” |
| (2) | Sb (fm) | Family’s expectations | “Let’s cooperate with your beloved family and try not to dispose of waste in public!” | |
| (3) | Sp_g (pun) | Social pressure from the government (Sp_g) | Strict pressure | “You will be punished by the government if you dispose of waste in public!” |
| (4) | Sp_g (rec) | Soft pressure | “Government recommends you not to dispose of waste in public!” | |
| (5) | Pn (res) | Personal norms (Pn) | Responsibility | “This is your responsibility not to dispose of waste in public!” |
| (6) | Pn (G/B) | Good or bad | “Disposing of waste in public is bad thing, so do not dispose of waste in public!” |
Table 3.
Questionnaire structure.
| Category | Questions | Contents | Answer Type | |
|---|---|---|---|---|
| I | Socio-demographics | I_1 | Age | Written |
| I_2 | Gender | SA * from 2 items | ||
| I_3 | Address (district) | Written | ||
| I_4 | Family income | SA from 4 items | ||
| I_7 | Education level | SA from 5 items | ||
| I_8 | Family sizes | Written | ||
| I_9 | House type | SA from 6 items | ||
| II | About current waste collection services | II_4, 9 | Collection and disposal frequency | SA from 5 items |
| II_6 | Usual number of waste bags disposed | SA from 4 items | ||
| II_7, 10 | Disposal location | SA from 8 (6) items | ||
| II_11 | Satisfaction with current services | 6-point scale | ||
| II_12 | Past experiences of disposing wastes in public open spaces | 5-point scale | ||
| II_13 | Reason for II_12 | SA from 5 items | ||
| II_15 | Free opinions on current waste collection services | Open question | ||
| III | Statement comparison | III_1–15 | 15 pair-wise comparisons among six statements | 5-point scale |
* SA: single answer.
Table 4.
Interviews of officials of national and local government.
| Category | No. | Date | Position |
|---|---|---|---|
| Local government | LG1 | 14 March 2019 | Chief Officer of Environment in Prampi Makkara district |
| LG2 | 19 March 2019 | Chief Officer of Environment in Tuol Kork district | |
| National government | NG | 20 March 2019 | Deputy Director of Waste Management Department of the MoE |
© 2019 by the authors. Licensee MDPI, Basel, Switzerland. This article is an open access article distributed under the terms and conditions of the Creative Commons Attribution (CC BY) license (http://creativecommons.org/licenses/by/4.0/).
Share and Cite
MDPI and ACS Style
Srun, P.; Kurisu, K. People’s Tendency Toward Norm-Interventions to Tackle Waste Disposal in Public Open Spaces in Phnom Penh, Cambodia. Sustainability 2019, 11, 6603. https://0-doi-org.brum.beds.ac.uk/10.3390/su11236603
AMA Style
Srun P, Kurisu K. People’s Tendency Toward Norm-Interventions to Tackle Waste Disposal in Public Open Spaces in Phnom Penh, Cambodia. Sustainability. 2019; 11(23):6603. https://0-doi-org.brum.beds.ac.uk/10.3390/su11236603
Chicago/Turabian StyleSrun, Pagnarith, and Kiyo Kurisu. 2019. "People’s Tendency Toward Norm-Interventions to Tackle Waste Disposal in Public Open Spaces in Phnom Penh, Cambodia" Sustainability 11, no. 23: 6603. https://0-doi-org.brum.beds.ac.uk/10.3390/su11236603
Note that from the first issue of 2016, this journal uses article numbers instead of page numbers. See further details here.