Analytical and Experimental Investigation of the Critical Length in Casing–Liner Overlap


1
Mewbourne School of Petroleum and Geological Engineering, The University of Oklahoma, Norman, OK 73019, USA
2
College of Petroleum Engineering and Geosciences, King Fahd University of Petroleum and Minerals, Dhahran 31261, Saudi Arabia
3
Department of Petroleum Engineering, University of Louisiana at Lafayette, Lafayette, LA 70504, USA
*
Author to whom correspondence should be addressed.
Sustainability 2019, 11(23), 6861; https://0-doi-org.brum.beds.ac.uk/10.3390/su11236861
Submission received: 9 October 2019
/
Revised: 26 November 2019
/
Accepted: 27 November 2019
/
Published: 2 December 2019
(This article belongs to the Special Issue Drilling Technologies and Process Safety)
Abstract
:Offshore drilling operations exhibit various difficulties attributed to shallow flows worldwide. One of the most common practices for drilling offshore wells is to use liners and liner hangers rather than using full casing strings. This reduces the cost of drilling operation. Liners and liner hangers are required to pass certain standards prior to their deployment in the field. This ensures their ability to withstand harsh downhole conditions and maintain the integrity of the well. A liner hanger contains an integrated seal assembly that acts as a barrier to prevent fluid migration. The cement that is placed within the casing–liner overlap is also considered a barrier, and it is critical that it maintains the integrity of the well by mitigating fluid migration to other formations and to the surface. The failure of this dual barrier (cement and seal assembly) system to seal the annular space can result in serious problems that might jeopardize a well’s integrity. Typically, in field applications, the length of a casing–liner overlap is chosen arbitrarily. In some cases, shorter overlaps (50 to 200 ft) are chosen because of the lower cost and easy identification of leaks during pressure tests. However, some loss of well control incidents (particularly the incident that motivated this study) have been linked to fluid leakages along the casing–liner overlap. This paper investigates the critical length of the casing–liner overlap by modeling gas leakage through the cement placed within the overlap using analytical and experimental approaches. Leakage scenarios were developed to mimic gas migration within the cement in the casing–liner overlap. The results showed that the longer the casing–liner overlap, the higher the leakage time. The results also showed that the current casing pressure test duration of 30 min may not be adequate to verify the integrity of the cement within the overlap. Based on the results and analyses, it is recommended to increase the pressure test duration to 90 min. In addition, the results suggest that the length of the casing–liner overlap should not be less than 300 ft to maintain the integrity of the well in the case of gas influx. Further details are highlighted in the results section. In practice, the current rationale behind the selection of a casing–liner overlap length is not sustainable. Thus, the major advantage of this study is that with field data, it provides both scientific and research-based evidence that can be used to inform the decision behind the selection of the casing–liner overlap length, especially in gas migration-prone zones.
1. Introduction
Wellbore integrity is of critical importance to several operations in the oil and gas industry, including drilling, production, plug and abandonment (P&A), and CO2 (carbon dioxide) sequestration [1,2,3,4,5,6]. The use of at least two independent barriers are recommended to ensure containment of underground fluids by preventing escaped fluids to surface or fluid movement between two formations, and hence the barriers guarantee the safety of the well’s personnel and workplace [7]. The primary well barrier is the first body that prevents fluid flow from a source. The fluid column is considered as a primary well barrier, for example, mud is the primary barrier during drilling operations. The secondary well barrier is the second body that prevents the unintentional flow if the primary barrier fails. Secondary well barriers include cement, casing, wellhead, and blow-out preventer (BOP), etc. Failure of the well barriers to contain and prevent fluid flow not only can result in a loss of well integrity but might also lead to disasters, such as loss of well control, fresh water contamination, gas leakage to atmosphere, and a blowout.
One of the issues that can endanger the well integrity is shallow flow. Shallow flow of water, gas, and fines occurs due to high pore pressure caused by the rapid deposition of undercompacted and overpressurized sands [8]. This shallow flow might be encountered in the early stages of drilling a well; even prior to the installment the blowout preventer [9]. Of all types of well control problems, shallow gas blowouts have been considered as the main cause of the loss of offshore drilling rigs. It has been reported that one third of the blowouts are attributed to shallow influxes [10,11]. Shallow flows also affect the well construction design in one way or another. Casing and cementing the shallow portion of deep wells, especially those located in the Gulf of Mexico, possess some challenges due to the shallow gas flow. Gas can migrate and propagate through the cement sheath either during the cement transition from a liquid phase to a solid phase (primary gas migration) or/and after the cement has hardened (secondary gas migration).
One of the most common practices in offshore deep wells is to use liner strings rather than using full casing strings to reduce the cost of drilling operation. The liner is hung to the last casing using a liner hanger and cemented in place. The liner hanger has a sealing element (elastomer) attached to it to seal the annulus to mitigate fluid migration into the wellbore and to the surface [12]. The cement placed within the casing–liner overlap plays a significant role in maintaining well integrity. Cement sheath is usually the first line of defense against formation fluid influx; followed by either elastomer or metallic seal assembly in the hanger or wellhead. Various concerns regarding the reliability and qualification of elastomer and metallic seals exist. Patel et al. [13,14,15] further emphasized the criticality of having good quality cement as a barrier. The sealing assemblies and the annular cement are considered as two independent barriers to prevent annular gas migration.
The cement sheath should possess an ultra-low permeability to mitigate and prevent gas migration to other formations and to the surface. To achieve this, several additives can be mixed with the Portland cement to formulate a gas-tight slurry [16,17,18,19]. Also, the use of geopolymers as a replacement of Portland cement can enhance the cement integrity [20,21,22]. The industry is exploring nanotechnology to improve the cement sealability and material properties. For example, nanosilica additives have been identified to provide various benefits, such as early strength development, final compressive strength, fluid loss characteristics, and acceleration of hydration [23,24,25]. Expanding cement has also emerged as a promising solution to improve cement bonding by compensating volume shrinkage and micro-annulus formation after the cement has set. Expanding cement has also been shown to improve mechanical integrity of the cement sheath by minimizing the risk of structural failure [26]. Not only can the additives enhance the integrity of the cement sheath but also the quality of water used to prepare the cement slurry [27]. To attain long-term well integrity, excellent bonding between the cement casing and cement formation must be achieved [28]. Patel and Salehi [29] presented a useful technique of developing a sensitivity response curve for the identification of critical parameters influencing the cement sheath integrity and assessing long-term fitness for service. Study’s modelling results indicate the high influence of Young’s modulus, Poisson’s ratio, and wellbore pressure load on mechanical stresses (radial, hoop, and shear stress) in cement.
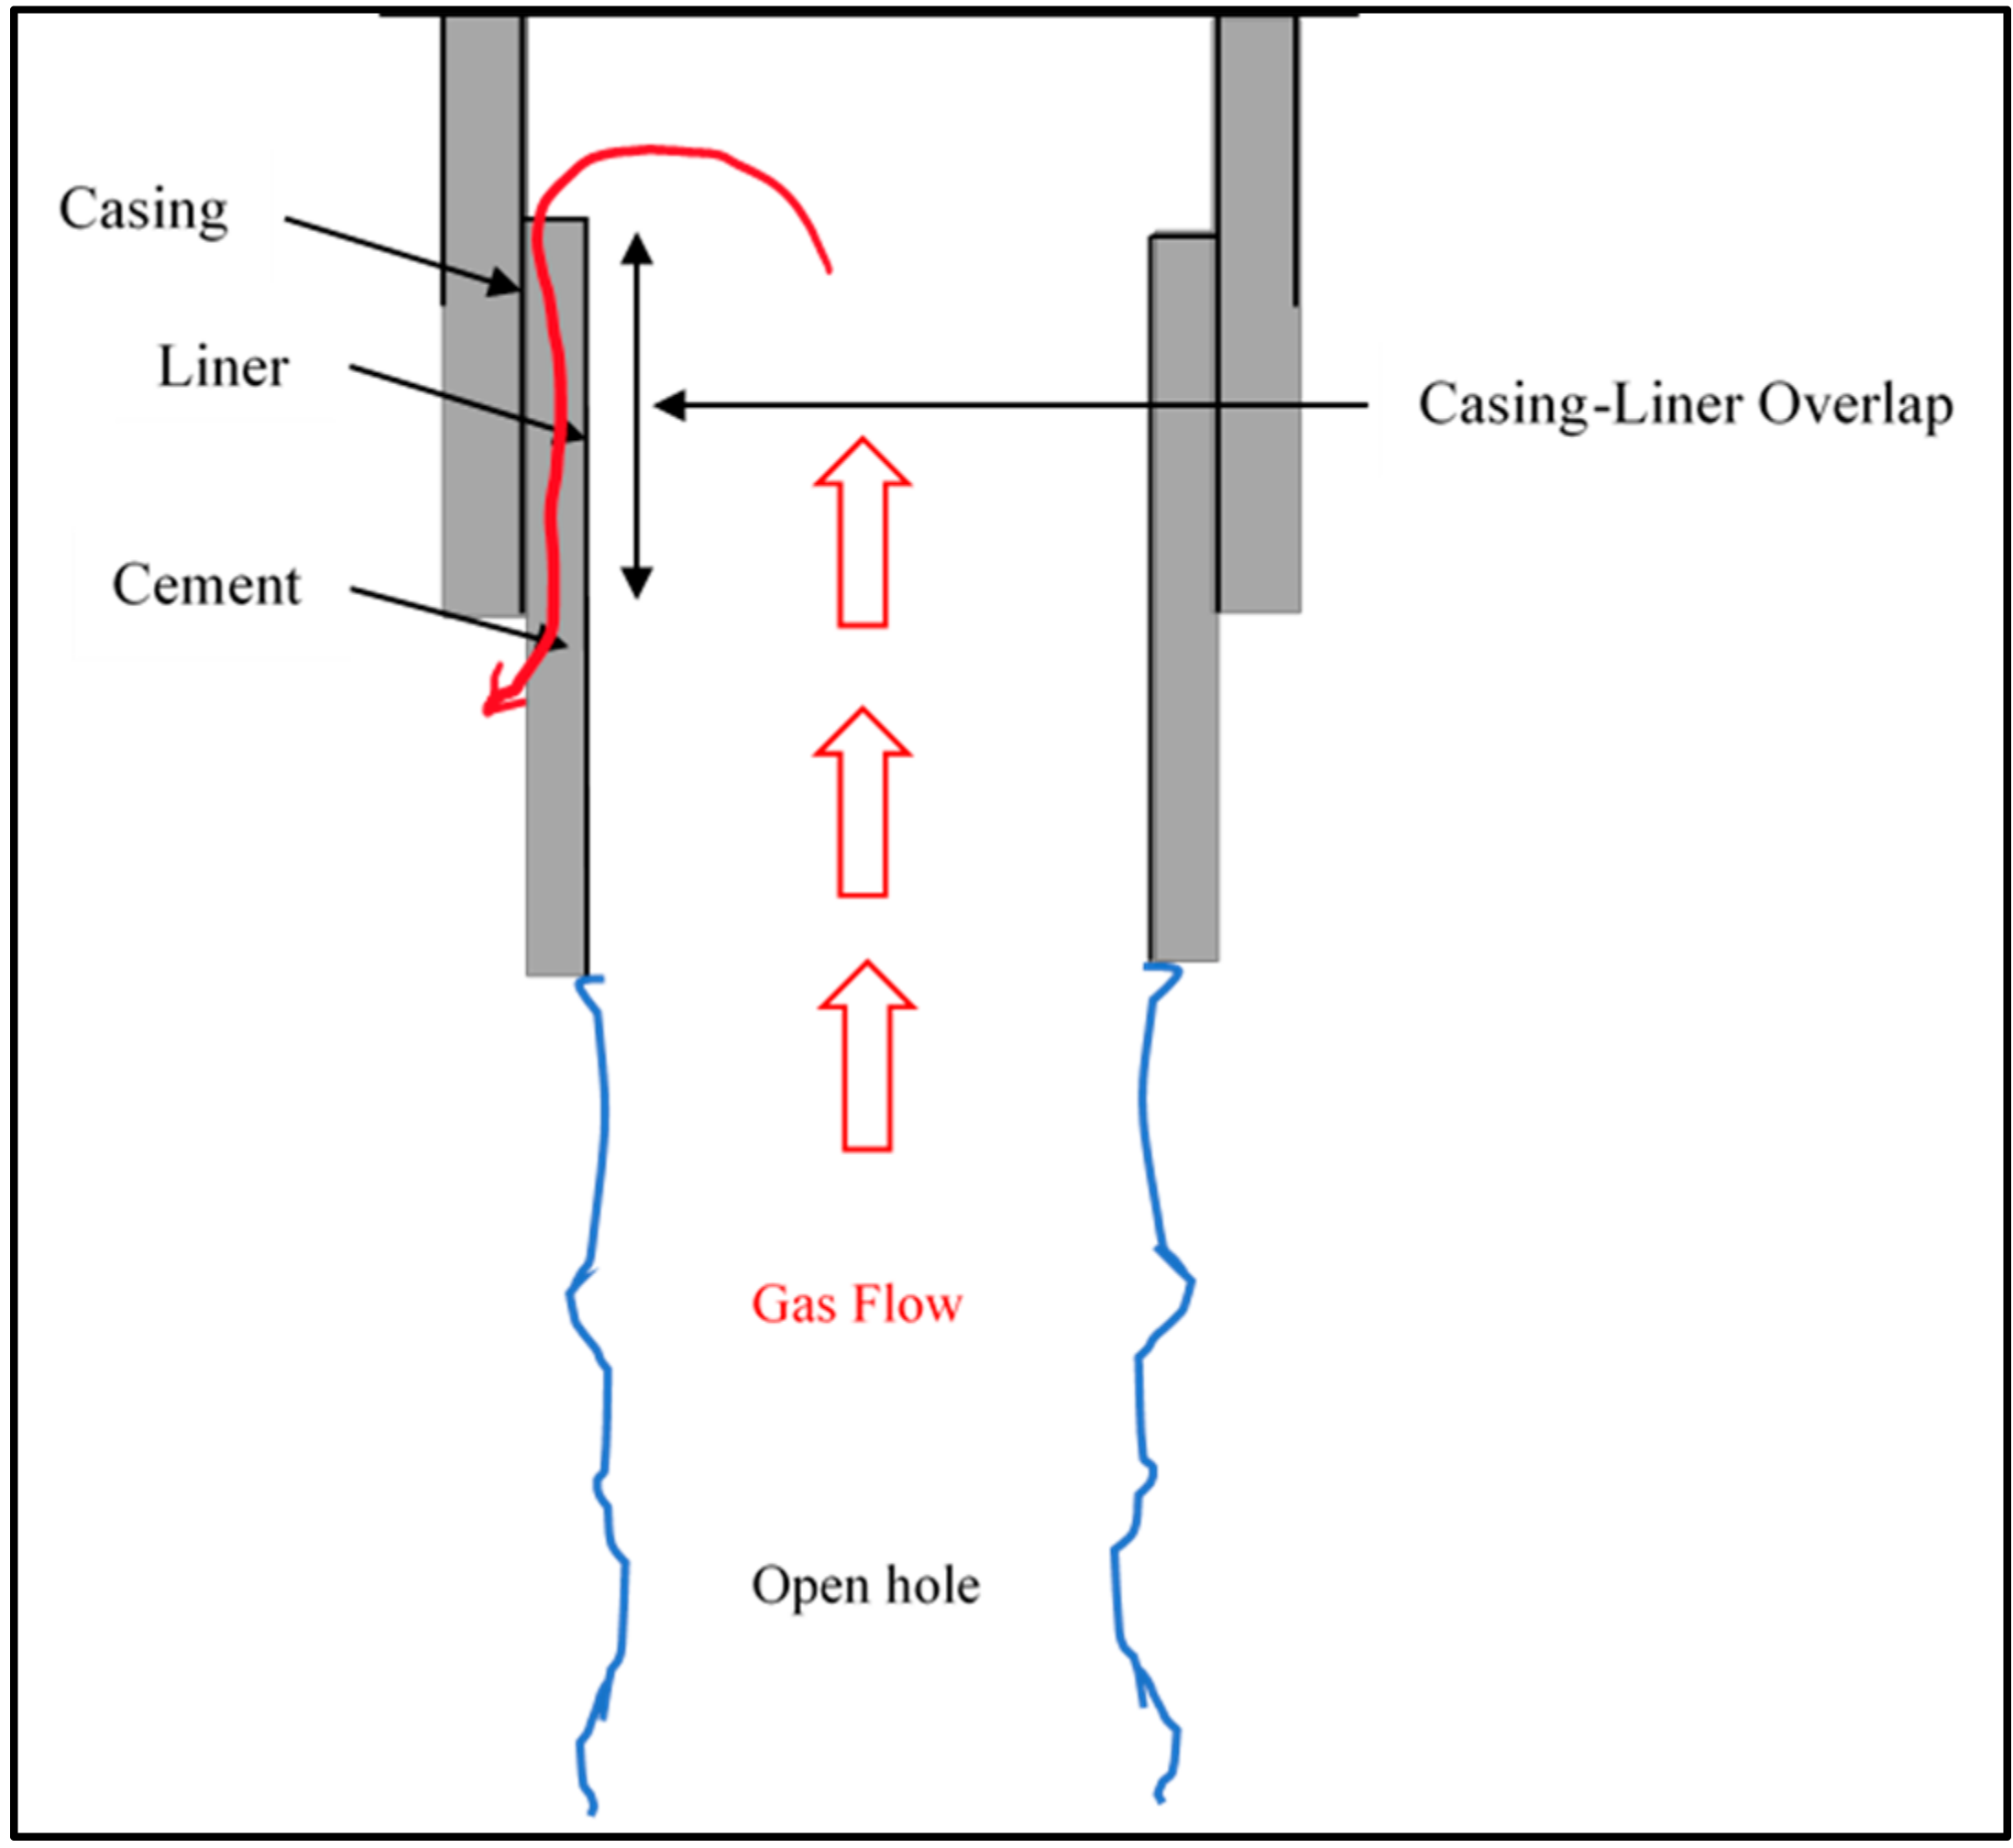
The rationale for selecting the length of the casing–liner overlap is stated in the abstract. Many researchers have studied and modeled gas flow through cement. However, there are no studies regarding the casing–liner overlap length with cement in the overlap. This paper investigates the critical length of the casing–liner overlap based on different parameters, such as wellbore permeability and differential pressure exerted on the annular cement placed within the casing–liner overlap (Figure 1). In this paper, a review of the literature was done to cover the experimental investigation and modeling of gas migration. The paper also discusses the way of developing leakage scenarios, followed by experimental methodology. After that, it discusses the results of experiments and leakage scenarios. Finally, it summarizes the conclusions and recommendations that are drawn from this study.
2. Literature Review
Cement integrity is of critical importance in maintaining the integrity of wells. Cement is considered as a porous media that has ultra-low to low permeability. This might allow fluids, especially gas, to flow through the cement. Many researchers modeled gas flow through cement, focusing on gas migration through a cemented annulus and cement plugs. Modeling of annular gas flow in a cemented annulus is one way of providing a better understanding of gas migration mechanisms. Some researchers focused on numerical and analytical modeling of the pressure buildup associated with sustained casing pressure (SCP) while others tried to model gas leakage in CO2 sequestration.
Rocha-Valdez et al. [30] defined SCP as “any measurable casing pressure that rebuilds after being bled down which can be attributed to cause(s) other than artificially applied pressures or temperature fluctuations in the well”. SCP occurs due to poor cementing that triggers gas flow from a gas-bearing zone through the cemented annulus; consequently, poor cementing can result in a loss of well integrity [31,32]. Nishakawa [33] modeled the gas flow through a cemented annulus to the surface. The author considered the cement as a porous media, with gas flowing vertically through the cement column. The effects of gas specific gravity, cement porosity, and temperature on SCP were considered. The results showed that a decrease in cement porosity, gas specific gravity, and temperature enhanced SCP. The applicability of this model is limited since it was not implemented on field data.
Xu and Wojtanowicz [34] developed a mathematical model for testing SCP. The aim of the mathematical model was to detect the flow mechanism during gas leakage and to identify the main parameters associated with gas leakage; hence it can be utilized in selecting corrective actions. This study showed that the pattern of SCP buildup is controlled by several parameters, such as the cement, mud, and gas invasion zone. The authors concluded that cement permeability and mud compressibility have a strong impact at the early stages of SCP. In this study, it was concluded that the gas formation pressure affects the late stages of SCP, where the maximum value of the stabilized SCP depends on the gas pressure. Their mathematical model was implemented to match the field data of two wells and their results were within an acceptable estimate of the actual results. Xu and Wojtanowicz [35] expanded their SCP model by considering gas migration in a mud column, which affects the early SCP build-up and pressure bleed-down.
Huerta et al. [36] simplified the previous model and used it to quantify the potential of CO2 well leakage. The authors were able to match the model with field data, which led to the attainment of important information, such as the leakage depth and effective cement permeability. The effective cement permeability was transformed to geometries of leakage pathways, such as microannulus and gas channels. This model was also used by Tao et al. [37]. The authors modified the SCP model to adapt to the CO2 leakage model. Matching the field pressure data with the model allowed the authors to determine the cement effective permeability and the gas leakage depth.
Salehi [38] studied near wellbore leakage pathways in shale gas wells using experimental and modeling approaches. The author developed a 3D finite element model specifically for cement leakage modeling and a wellbore using a multistage approach. The author included all the steps involved in the well’s cycle to investigate previous deformation that occurred by excessive loads during drilling or stimulation. The model and approach were applied to a well in the Haynesville shale play.
Rocha-Valadez et al. [30] developed an analytical solution for an SCP numerical model developed by Xu [31]. They assumed a constant gas inflow pressure and the gas flowing from the top of the cement would move immediately to the gas cap. Matching the field data with the model resulted in a cement permeability value that was close to the one obtained from the numerical model.
Aas et al. [39] conducted a series of full-scale experiments to examine the cement sealability using conventional and expandable cements. The authors evaluated the sealability of the cement by pressurizing the set cement with water. The authors then reported that the microannuli generated were relatively small and they did not provide large flow rates. The authors developed a leakage model based on the experiments. This model considers the flow through the created microannuli (Equation (1)):
where Q is the flow rate in m3/s, Rc is the casing radius in m, ΔP is the pressure difference across the cement in Pa, µ is the viscosity of fluid in Pa s, L is the length of the cement column in meters, and ẟR is the microannulus gap in meters.
Ford et al. [40] developed a leakage calculator using three models to estimate the leakage from the cement plugs. The authors considered three leakage pathways and they are: (i) Leakage within the set-cement; (ii) leakage through cracks and fractures; and (iii) leakage through microannuli. Each pathway was treated separately. Darcy’s equation [41] was used to calculate the leakage rate through the set cement (Equation (2)). The leakage rate from the cracks was calculated based on a model (Equation (3)) that was developed by Sarkar et al. [42] while the flowrate that occurs through the microannuli was computed through the model (Equation (1)) developed by Aas et al. [39]:
where k is the cement permeability in m2, A is the cross-sectional area of the cement plug in m2, ρ is the fluid density in kg/ m3, and θ is the inclination of the well corresponding to the cement plug:
where h is the fracture aperture in m, α is the fracture orientation, and W is the fracture width in m.
Stormont et al. [43] developed a wellbore model to mimic gas invasion into a cemented annulus. They intentionally created a microannulus in a cement specimen to investigate the effect of confining, casing, and pore pressures. They concluded that a microannulus actlike a fracture with respect to deformation under stress. In addition, the authors presented an analytical gas leakage model and assumed that gas only flows through the microannulus. They modeled the flow using the Navier–Stokes equation coupled with the cubic law since the microannuli are fracture-like (Equation (4)):
where ∇P is the pressure gradient in Pa/m, h is the hydraulic aperture in m, and ω is the length of the hydraulic aperture in m, which is approximated by the circumference of the casing. The power of this model is that it considers the gas flow within the mathematical law, unlike the aforementioned models.
3. Development of Leakage Scenarios
The model used in this study is the one developed by Stormont et al. [43]. This model was based on the microannulus generated between the casing and cement and it depends on the hydraulic aperture. Isothermal and fully developed flow of gas is assumed to use this equation. The hydraulic aperture can be calculated using the permeability assumed as follows [44]:
where ω is the hydraulic length of the aperture (2πRi), and h is the hydraulic aperture and it can be expressed as (Rm − Ri), where Rm is the microannulus radius and Ri is the radius of the inner casing.
Then, the gas flow rate is calculated based on the following equation:
where M is the gas molecular weight in kg/mole, Pu is the upstream pressure in Pa, Pd is the downstream pressure in Pa, z is the compressibility factor, R is the universal gas constant in m3 Pa/mole K, and T is the temperature in °K. This equation resulted from expanding the pressure gradient term of Equation (4). To simplify the use of this equation and to develop the leakage scenarios, select assumptions were applied. This equation assumes steady state isothermal gas flow and the gas flows through completely gas-filled microannulus.
The four permeability values were subbed in Equation (5) to solve for the hydraulic aperture. Then, the hydraulic aperture values were used in Equation (6) to calculate the gas flow rate. Next, the gas flow rate was used to obtain the leakage time using the following equation:
where t is the leakage time in seconds and Am is the flow area in m2. The leakage time is the time it takes the gas to travel from the top to the bottom of the cemented annulus. The leakage time was considered to be the primary variable for determining the optimum length of the casing–liner overlap. According to API Bulletin E3 [45], the casing–liner overlap length can vary from 50 to 500 ft (15.24 to 152.4 m). Therefore, the overlap lengths in the scenarios were varied from 50 to 500 ft with a 50-ft increment.
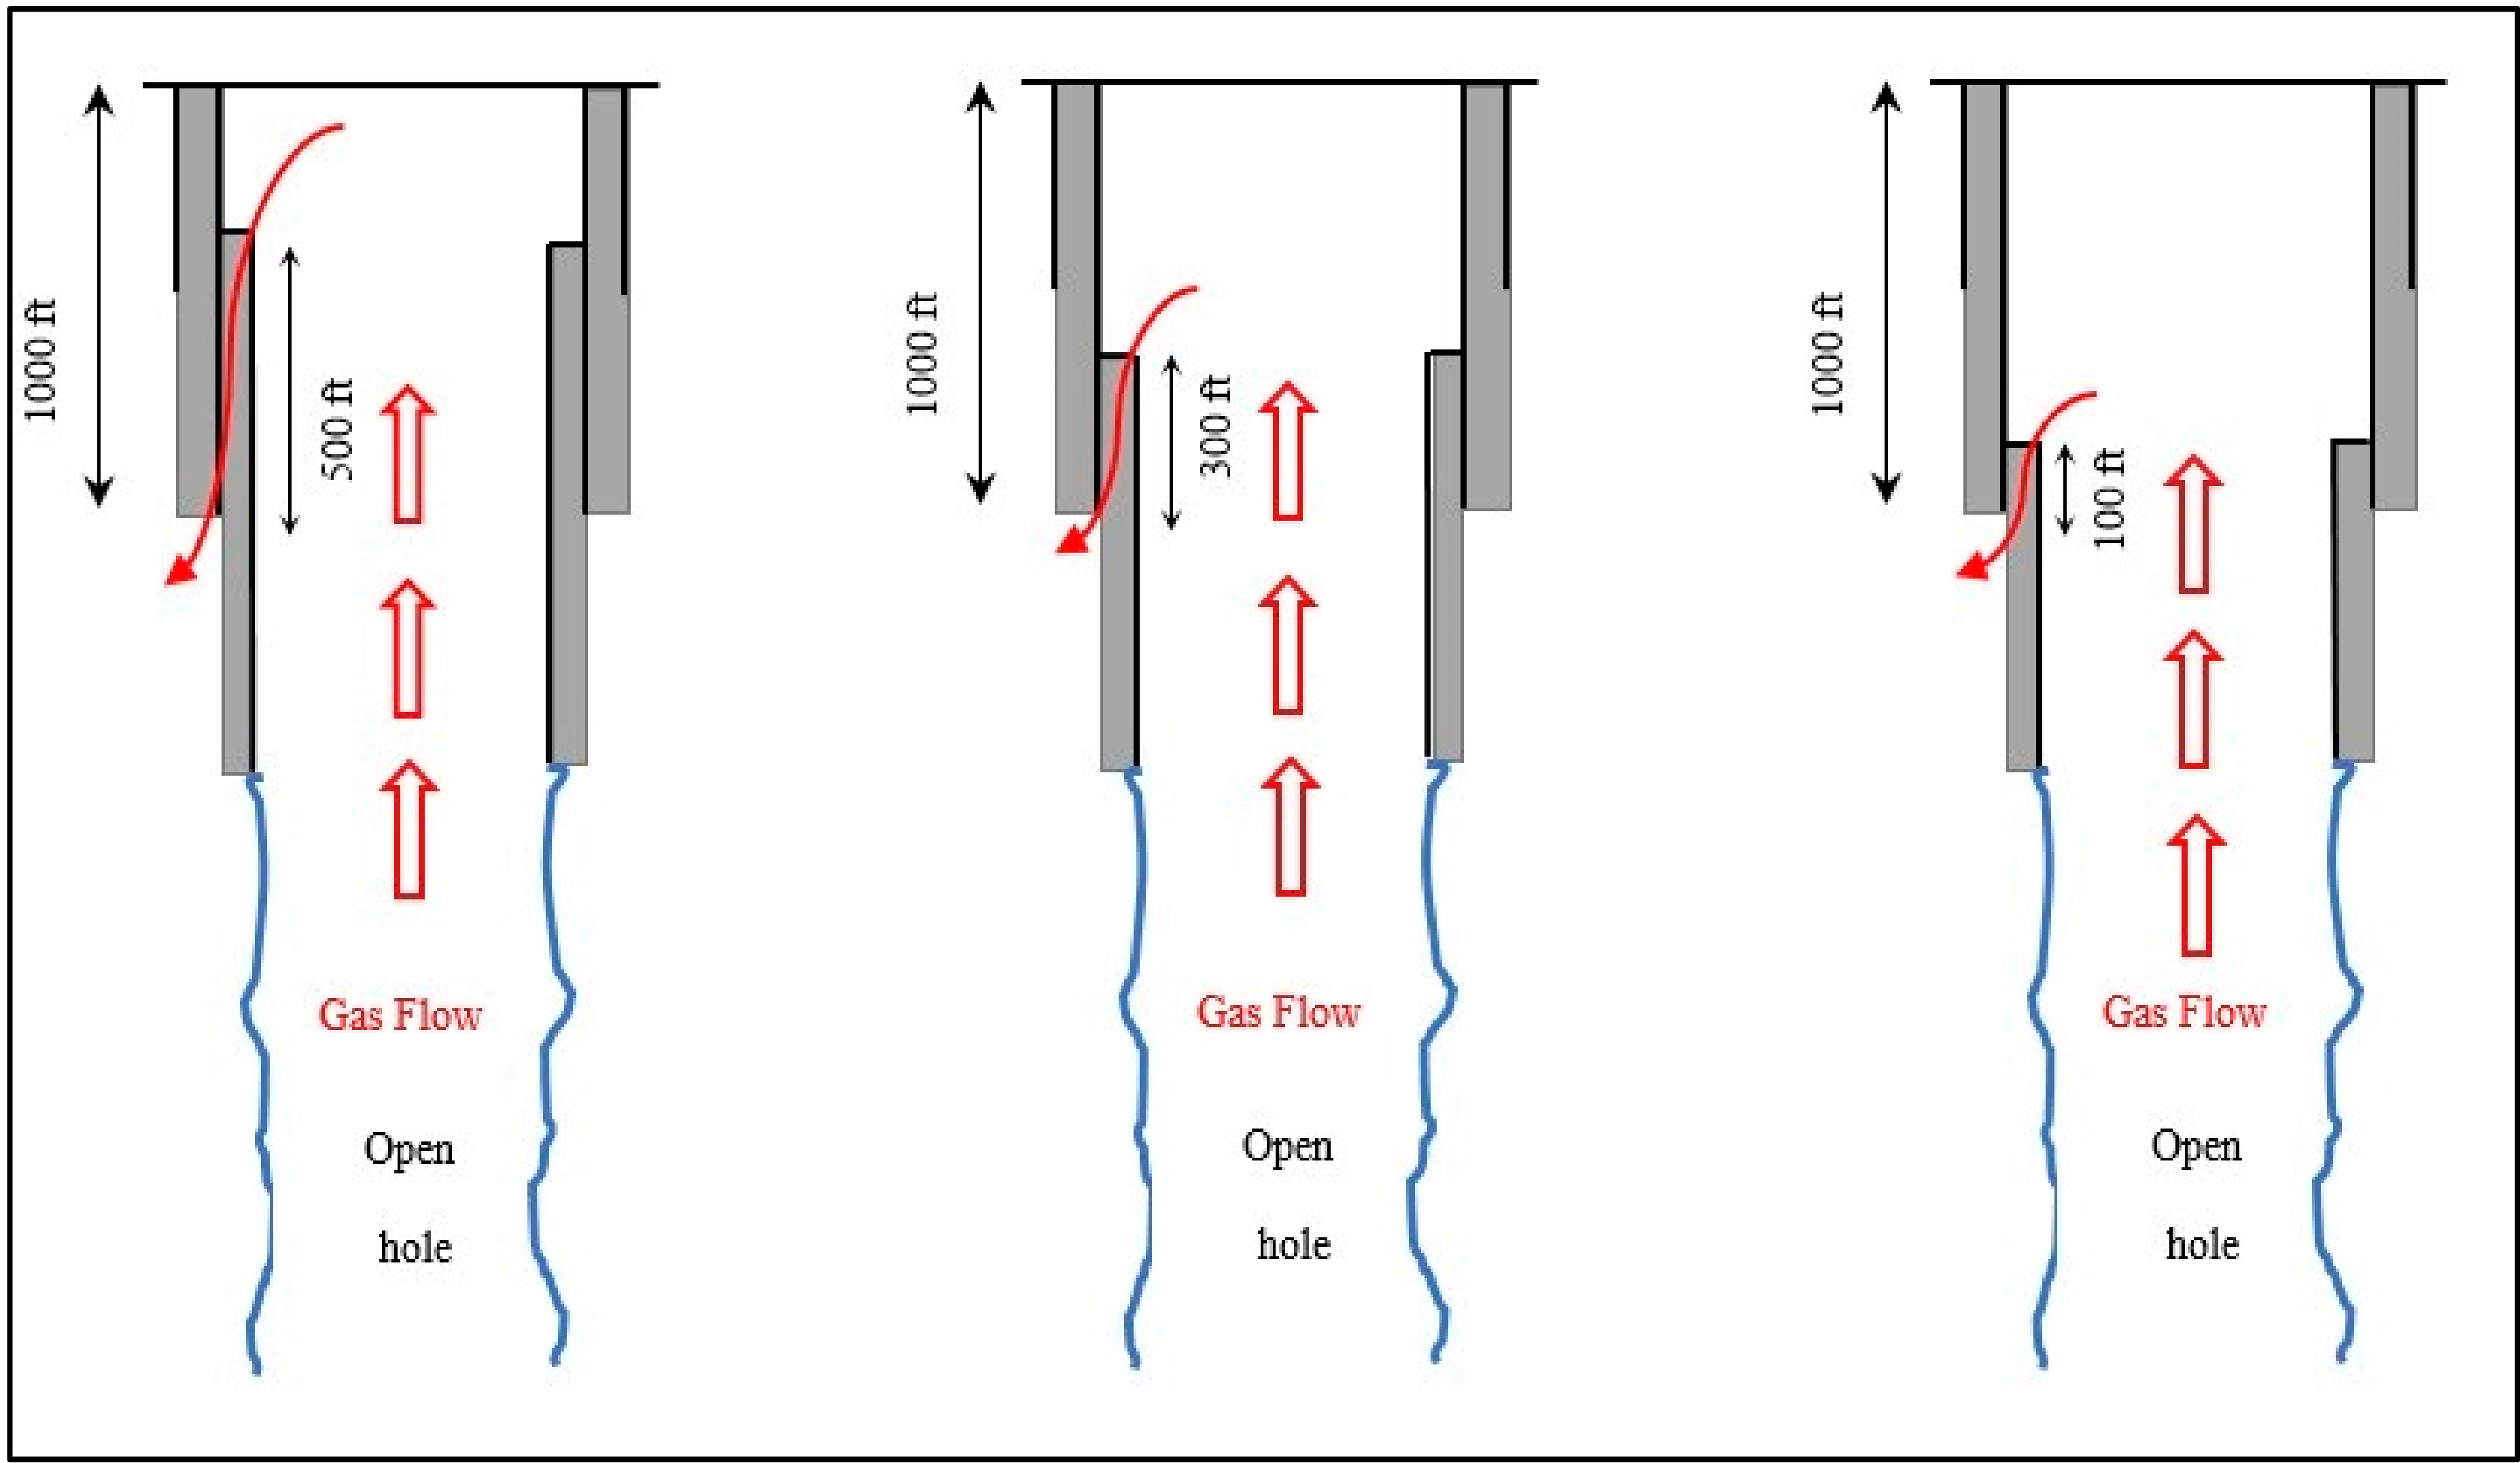
Four leakage scenarios were developed to simulate gas leakage through the cement placed within the casing–liner overlap. The difference between these scenarios is the differential pressure exerted across the cement behind the casing–liner overlap. The differential pressure was varied from 250 to 1500 psi. In each scenario, four permeability values were used to assess the risk associated with each value. In addition, the casing–liner overlap was varied to investigate how the overlap length is going to help ensure good well integrity. The objective of developing these scenarios was to investigate the optimum length of the casing–liner overlap. Figure 2 shows gas leakage through different lengths of the casing–liner overlap. Select assumptions applied to the leakage scenarios are as follows:
- The last casing shoe was set at 1000 ft (304.8 m).
- Casing diameter was 22 inches (0.56 m).
- Liner hanger diameter was 18 inches (0.46 m).
- Temperature was 100 °F (37.7 °C).
- Four permeability values of 0.01, 0.1, 0.3, and 0.5 mD.
- Faulty elastomers in the liner hanger.
4. Experimental Methodology
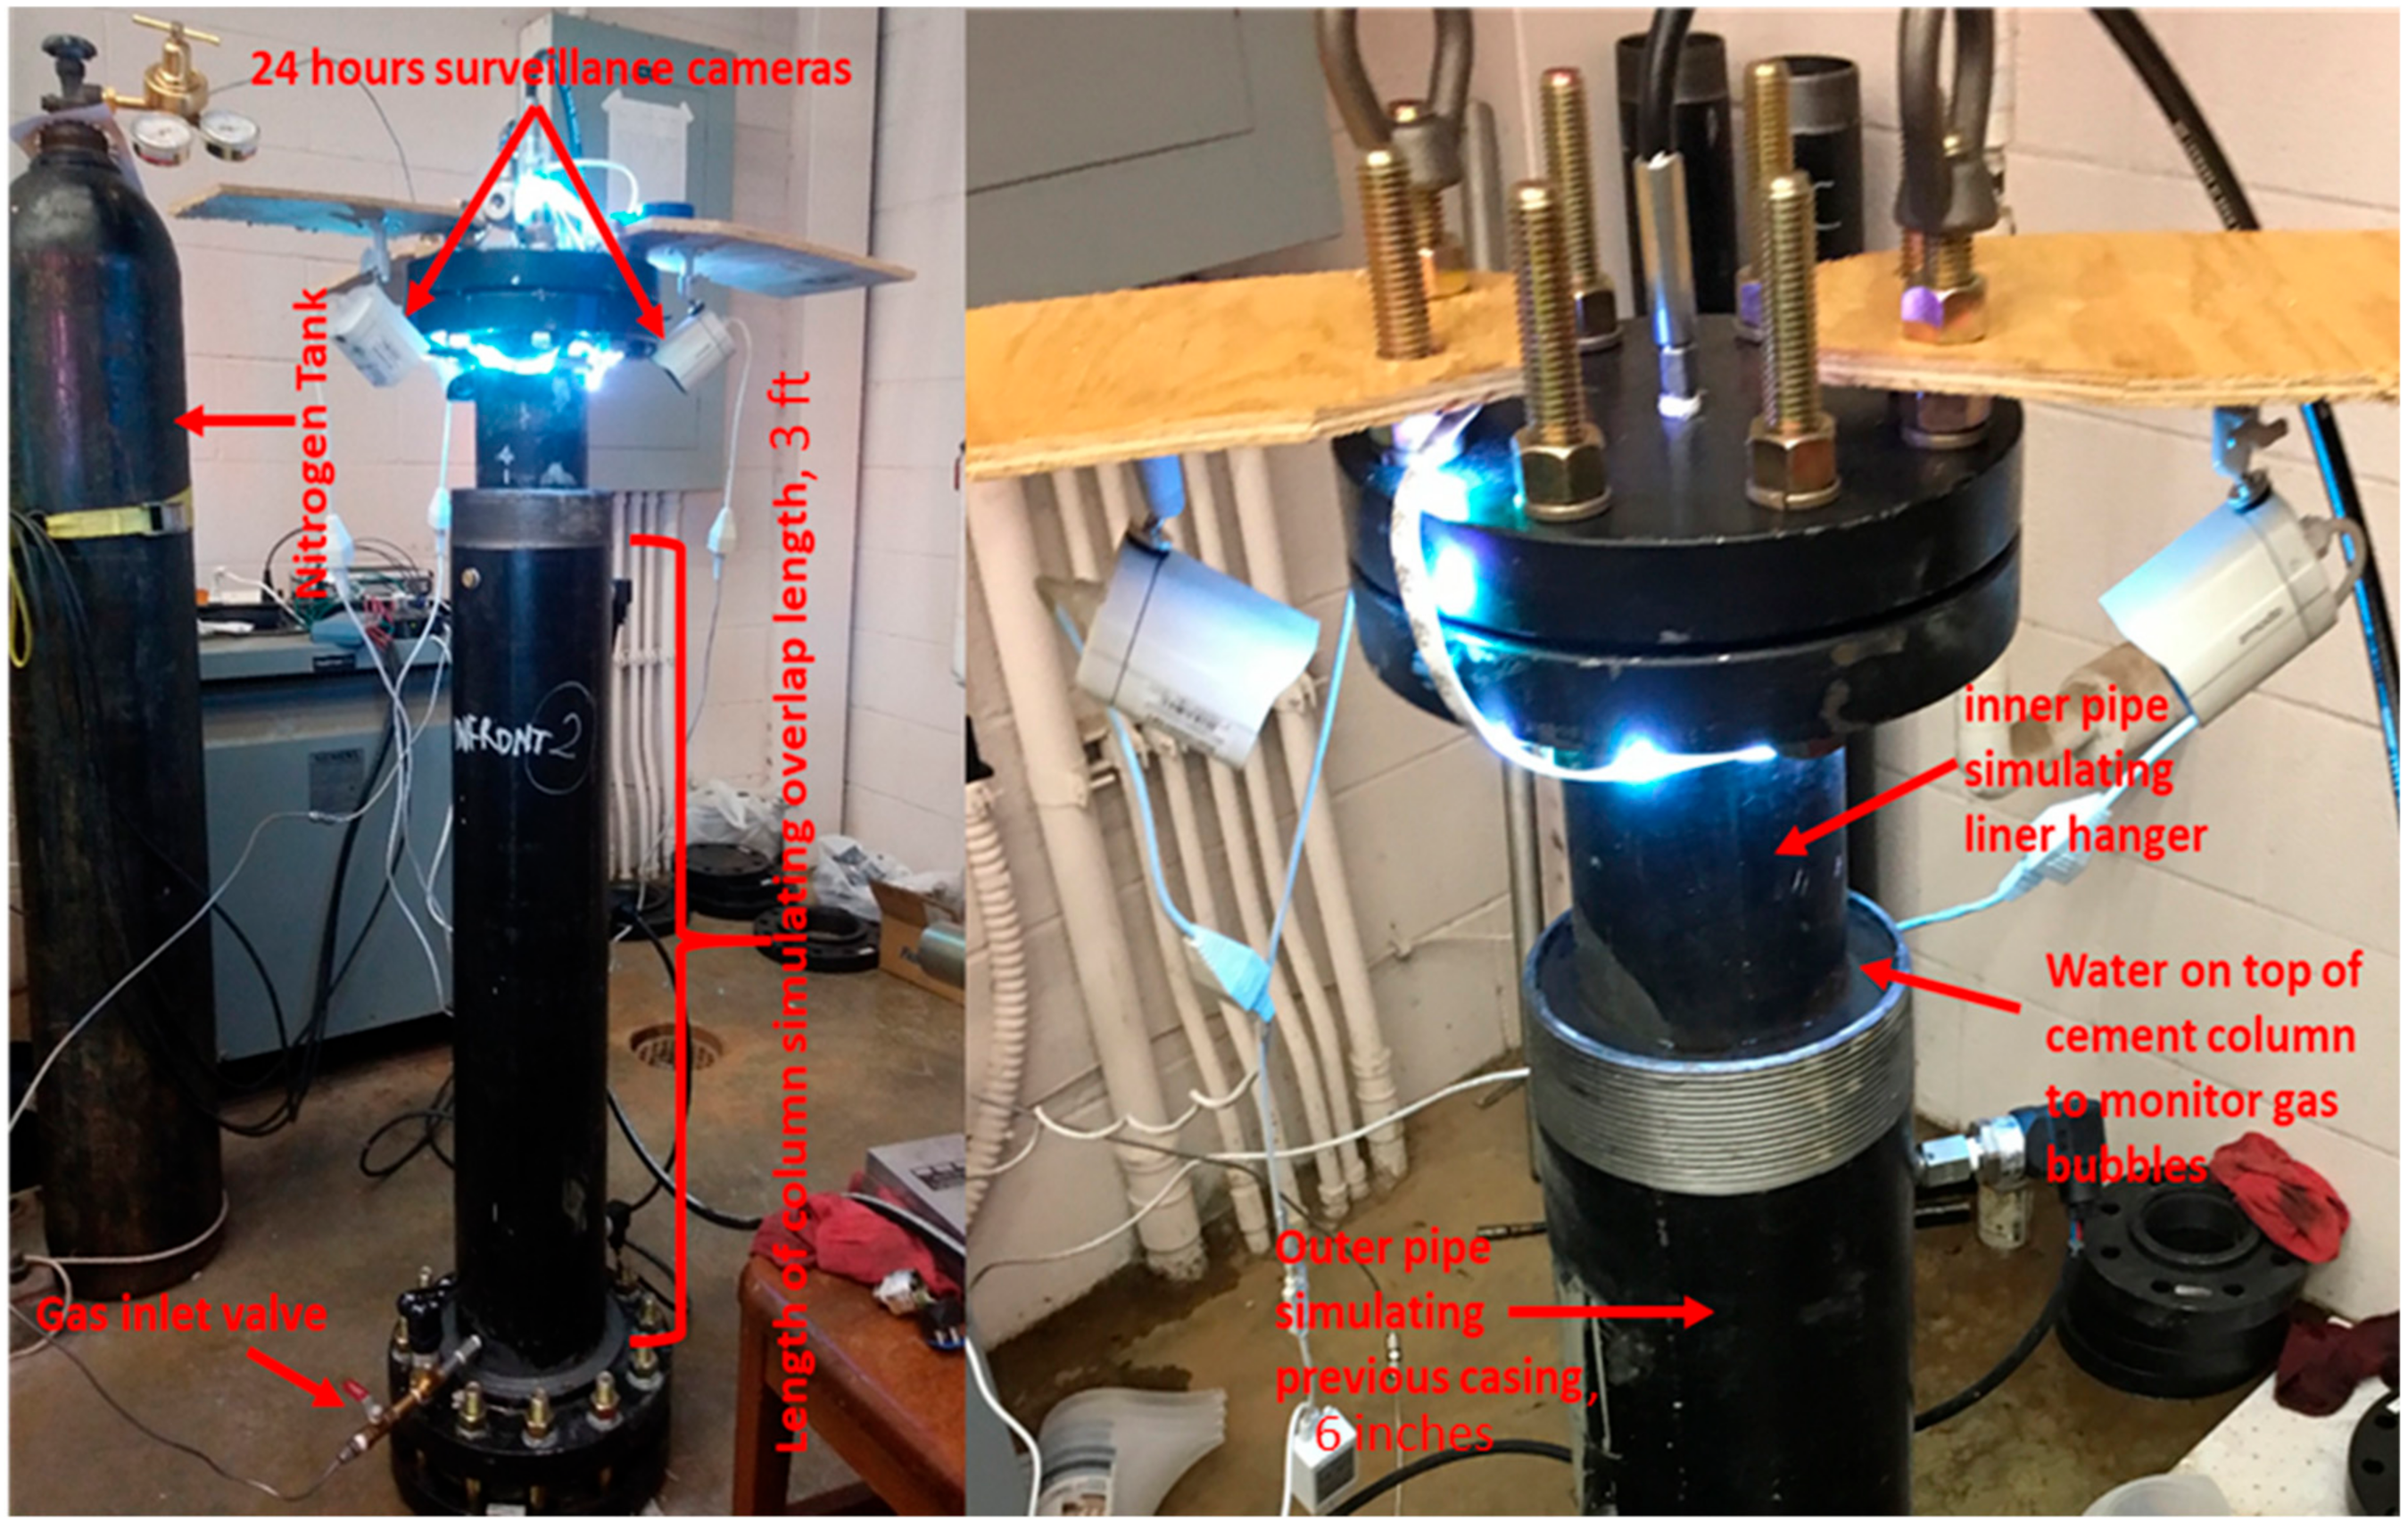
An experimental investigation of annular gas migration in a cement column was conducted to calibrate the gas leakage model. A wellbore model was designed and fabricated to mimic the gas migration in annular cement. The setup was made of two concentric pipes to replicate the artificial annulus. Flanges, flange caps, high strength bolts, and gaskets were used to create an artificial wellbore. The top of the artificial annulus was open to the atmosphere to expose the cement sheath to atmospheric pressure. The setup had four ports: Three ports were to monitor the pressure in the cement column while the last port, which is at the very bottom of the setup, was to inject nitrogen (N2) gas to the cement column. The pressure transmitters mounted on the setup were connected to a data acquisition system (DAQ) to save the pressure data in a computer. Video cameras were mounted on top of the setup and focused at the top of the artificial annulus to detect the gas bubbles coming out of the cement sheath. A network video recorder (NVR) was connected to the video cameras to save all the recordings.
Since shallow formations typically have low pressure and temperature, the experiments were conducted at ambient temperature and atmospheric pressure. Figure 3 shows the actual wellbore model used to perform the experiments in this study. Class H is commonly used for cementing oil and gas wells in the Gulf of Mexico and the North Sea. This influenced the selection of Class H cement to conduct the experiment. In total, a 38% water requirement by weight of Class H cement was used. The cement specimen was mixed and prepared according to API RP 10 A [46].
The experiment comprised of three cycles, and each cycle had three tests. The term “cycle” is used to describe two to three consecutive tests, while the term “test” is used to describe the flow of N2 in the artificial annulus. Once the cement slurry was mixed according to the API procedure, it was then poured into the artificial annulus. Then, prior to the proposed WOC time, the video cameras and pressure transmitters were connected. Finally, N2 was injected at a stabilized pressure of 60 psig to assess the sealability of the cement sheath. During the injection period, the surface of the cement sheath was monitored to detect any gas bubbles coming out. The time, where the first gas bubble was detected, was noted and considered as the leakage time. The leakage time can be defined as the time it takes for the nitrogen gas to travel from the bottom of the setup through the cement and reach the top of the cement. In other words, the time it takes for the first bubble to appear at the top of the cement bearing in mind the time at which the nitrogen gas was injected.
5. Results and Discussion
5.1. Experimental Results
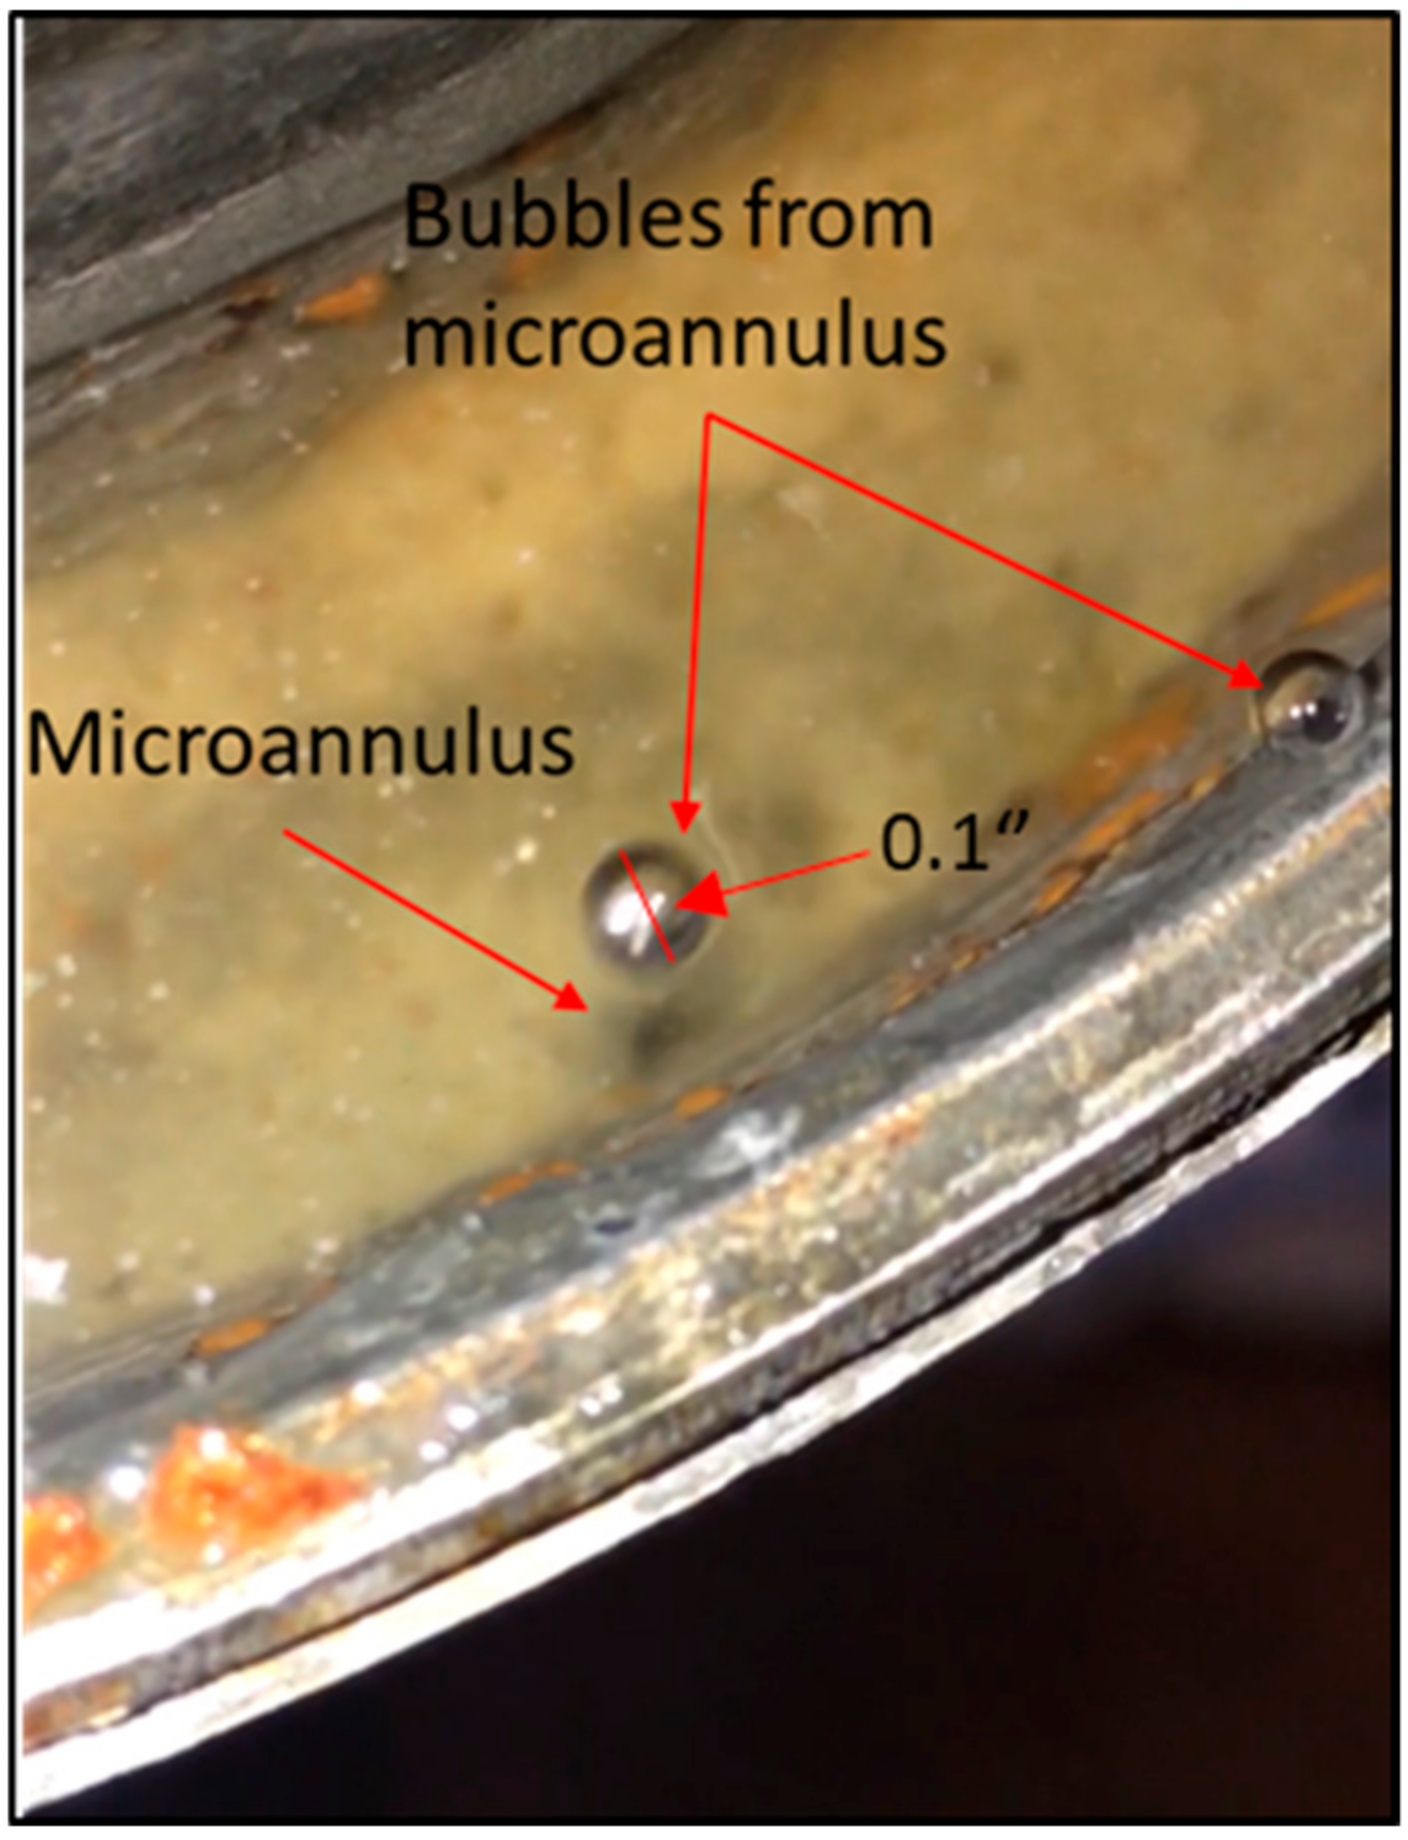
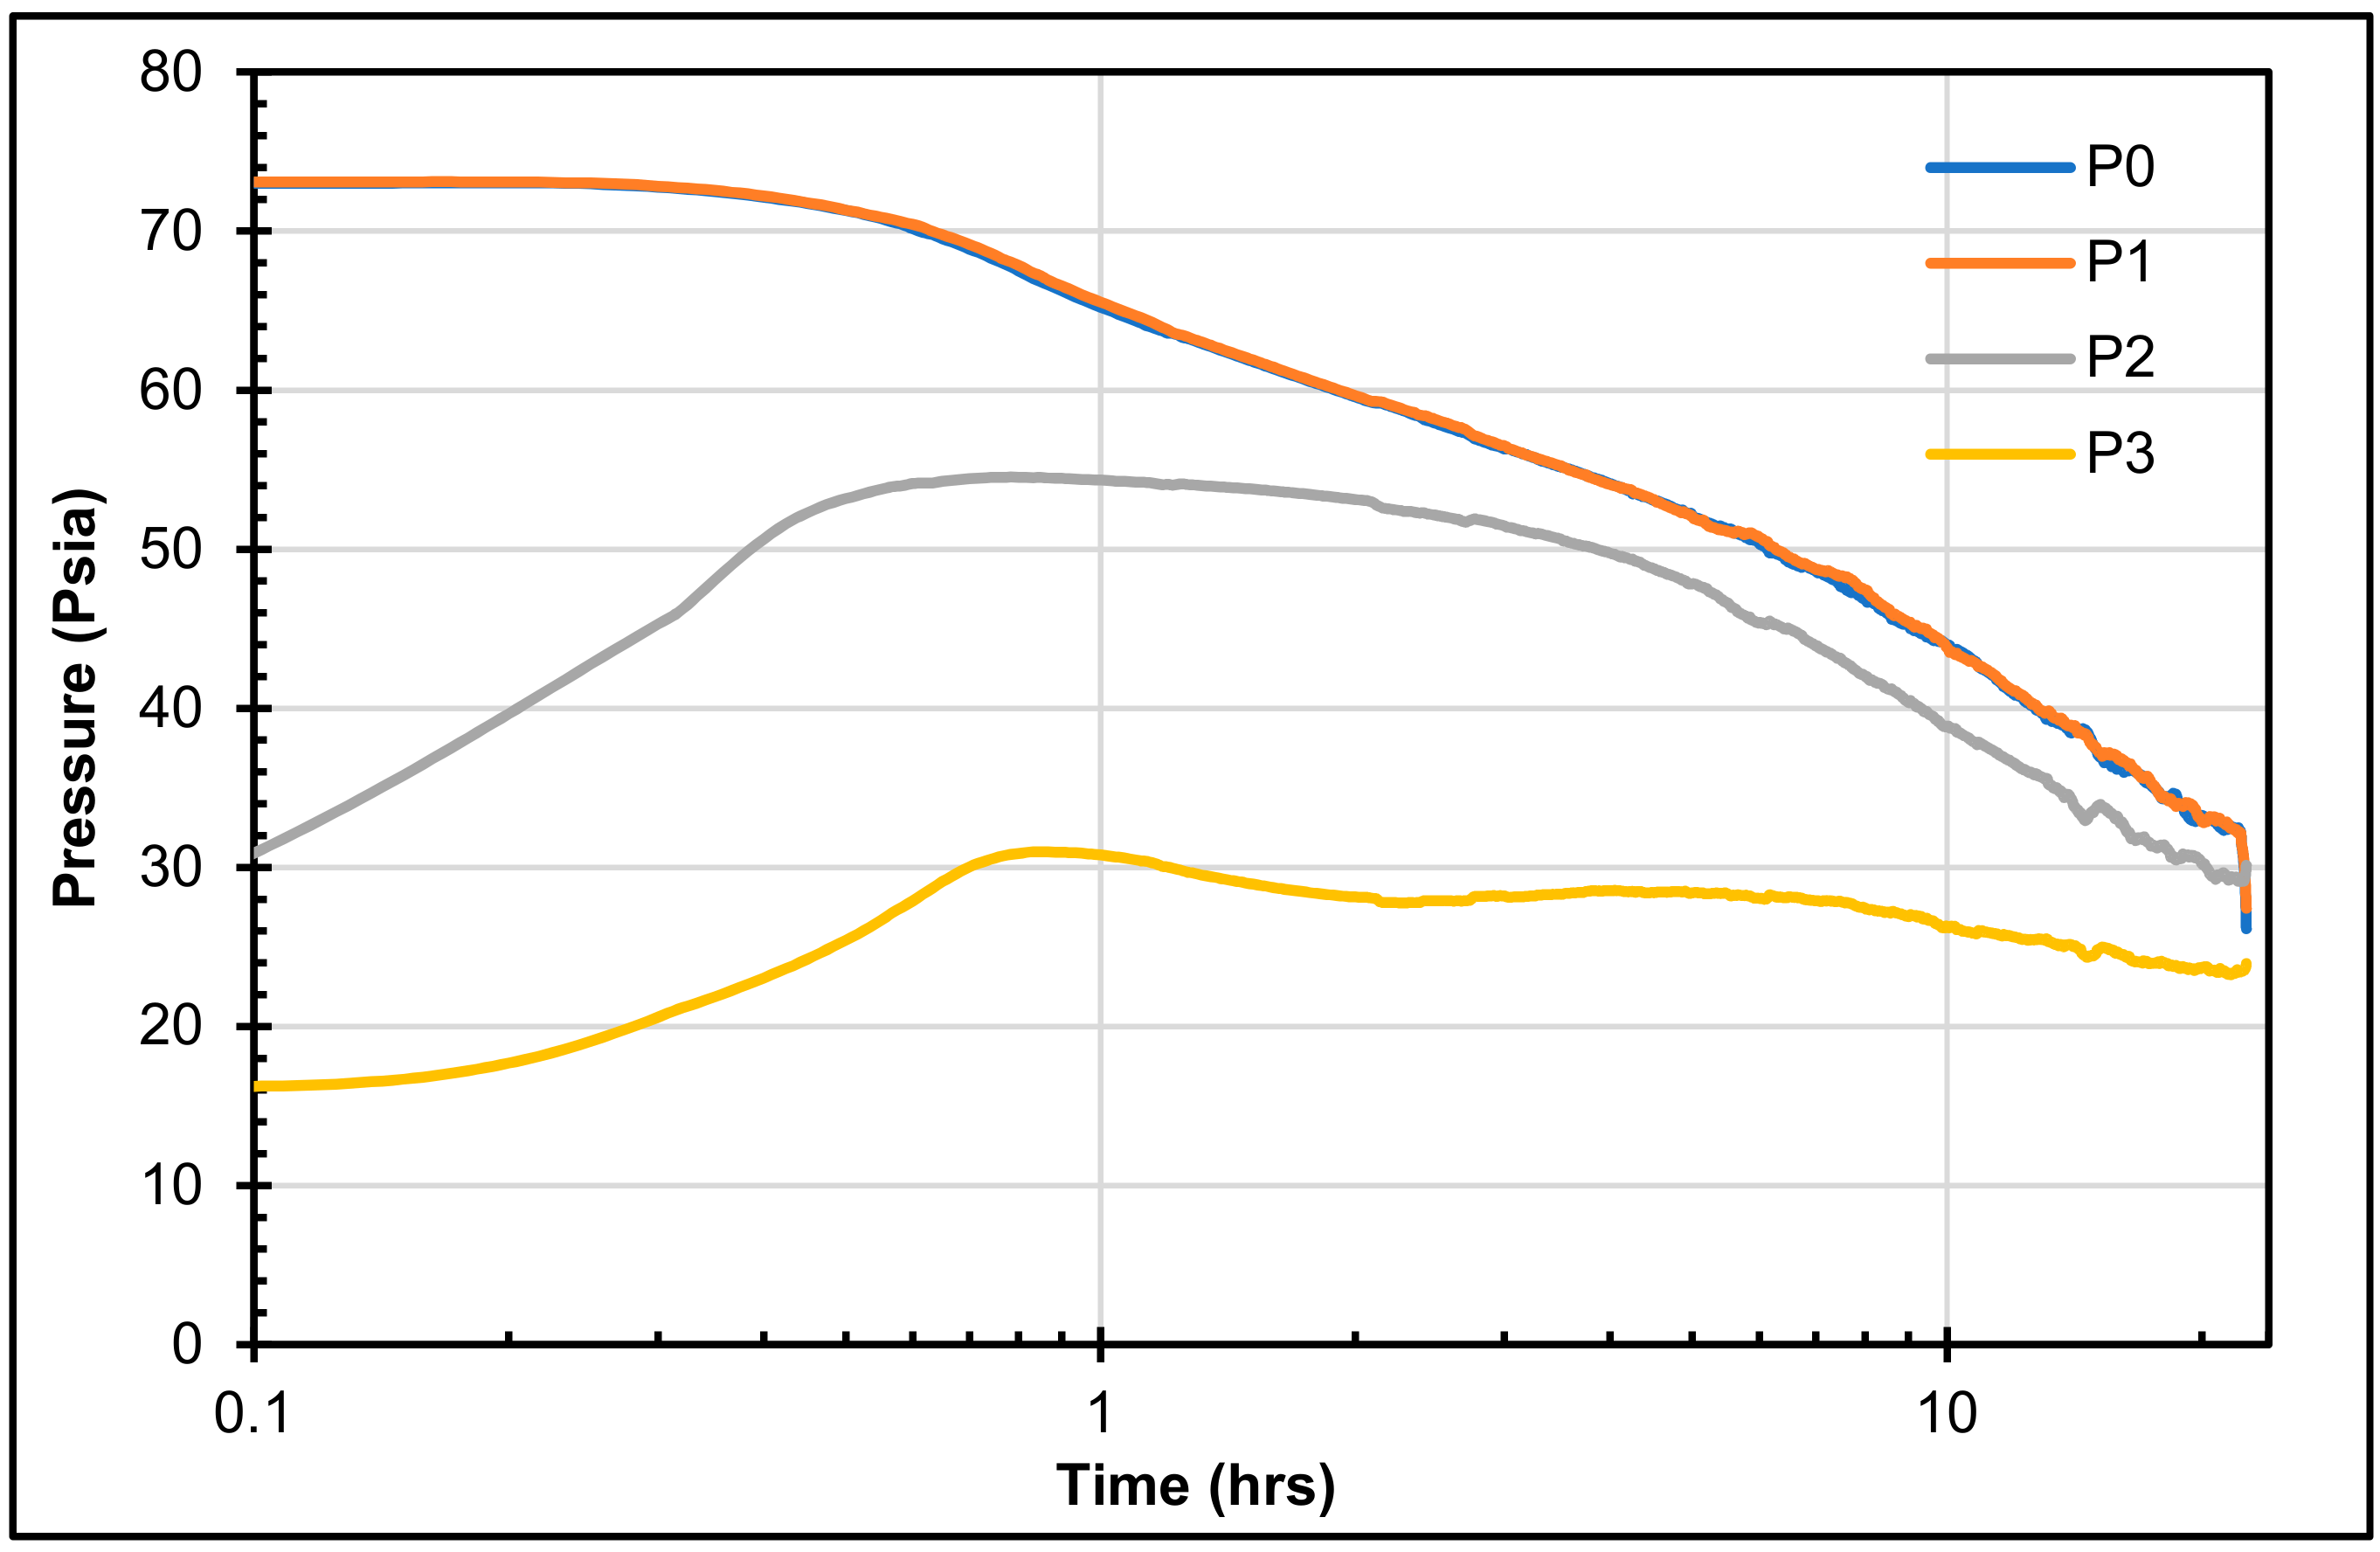
Neat Class H cement was used to prepare the cement slurry used in the experiment. This slurry had a 38% water/cement (W/C) ratio. The first test in the first cycle was conducted after 24 h of WOC time. The first bubble of gas was detected after 11 min after the commencement of the test. The leakage time of the second test in the first cycle, when the cement age was 2 days, decreased to 5 min. However, in the second cycle of the first test, where the cement age was 11 days, the first bubble was recorded 11 min after the beginning of the test, and then declined afterwards in the second and third tests within the second cycle. This behavior was observed in the third cycle, too. The increase of leakage time between the last test in a cycle and the first test in the succeeding cycle can be associated to the fallow period between the conducted cycles. This increase of leakage time can also be ascribed to the vanishing of some bubbling positions. The disappearance of the bubbling position is also known by the self-healing phenomenon, and it has been documented and discussed in the literature [47,48,49]. The authors believed that this phenomenon occurs due to the mobilization and precipitation of minerals along the pathways within the cement sheath. Figure 4 shows a microannulus bubbling from the cement sheath. The bubbles observed on the annulus surface were not intense.
The pressure transmitters mounted on the wellbore model were used to collect pressure data. The collected pressure data from the tests were used to calculate the wellbore permeability. Figure 5 shows the decline pressure curves collected throughout a conducted test for all the pressure transmitters used in the setup. In Figure 4, P0 represents the gas injection pressure while P1 is the pressure reading for the pressure transmitter installed at the very bottom of the setup. P2 and P3 are the pressure readings for the pressure transmitters installed at the middle and the top of the setup, respectively. The pressure data and leakage time were used to calibrate the gas leakage model.
5.2. Leakage Scenarios
In the following leakage scenarios, the results portray the influence of the differential pressure, cement system permeability, and length of the casing–liner overlap on the leakage time. Al Ramadan et al. [50] conducted an experimental investigation on the sealability of annular cement, and the authors found that the cement permeability can vary between 0.001 and 0.5 mD. This influenced the selection of the permeability values used to develop the leakage scenarios. Four permeability values of 0.01, 0.1, 0.3, and 0.5 mD were assumed. Four differential pressures exerted across the cement placed within the casing–liner overlap were examined, which were 250, 500, 1000, and 1500 psi (1.72, 3.44, 6.88, and 10.34 Mpa). The length of the casing–liner overlap was varied from 50 to 500 ft with a 50-ft increment in all the scenarios to investigate the optimum length casing–liner overlap.
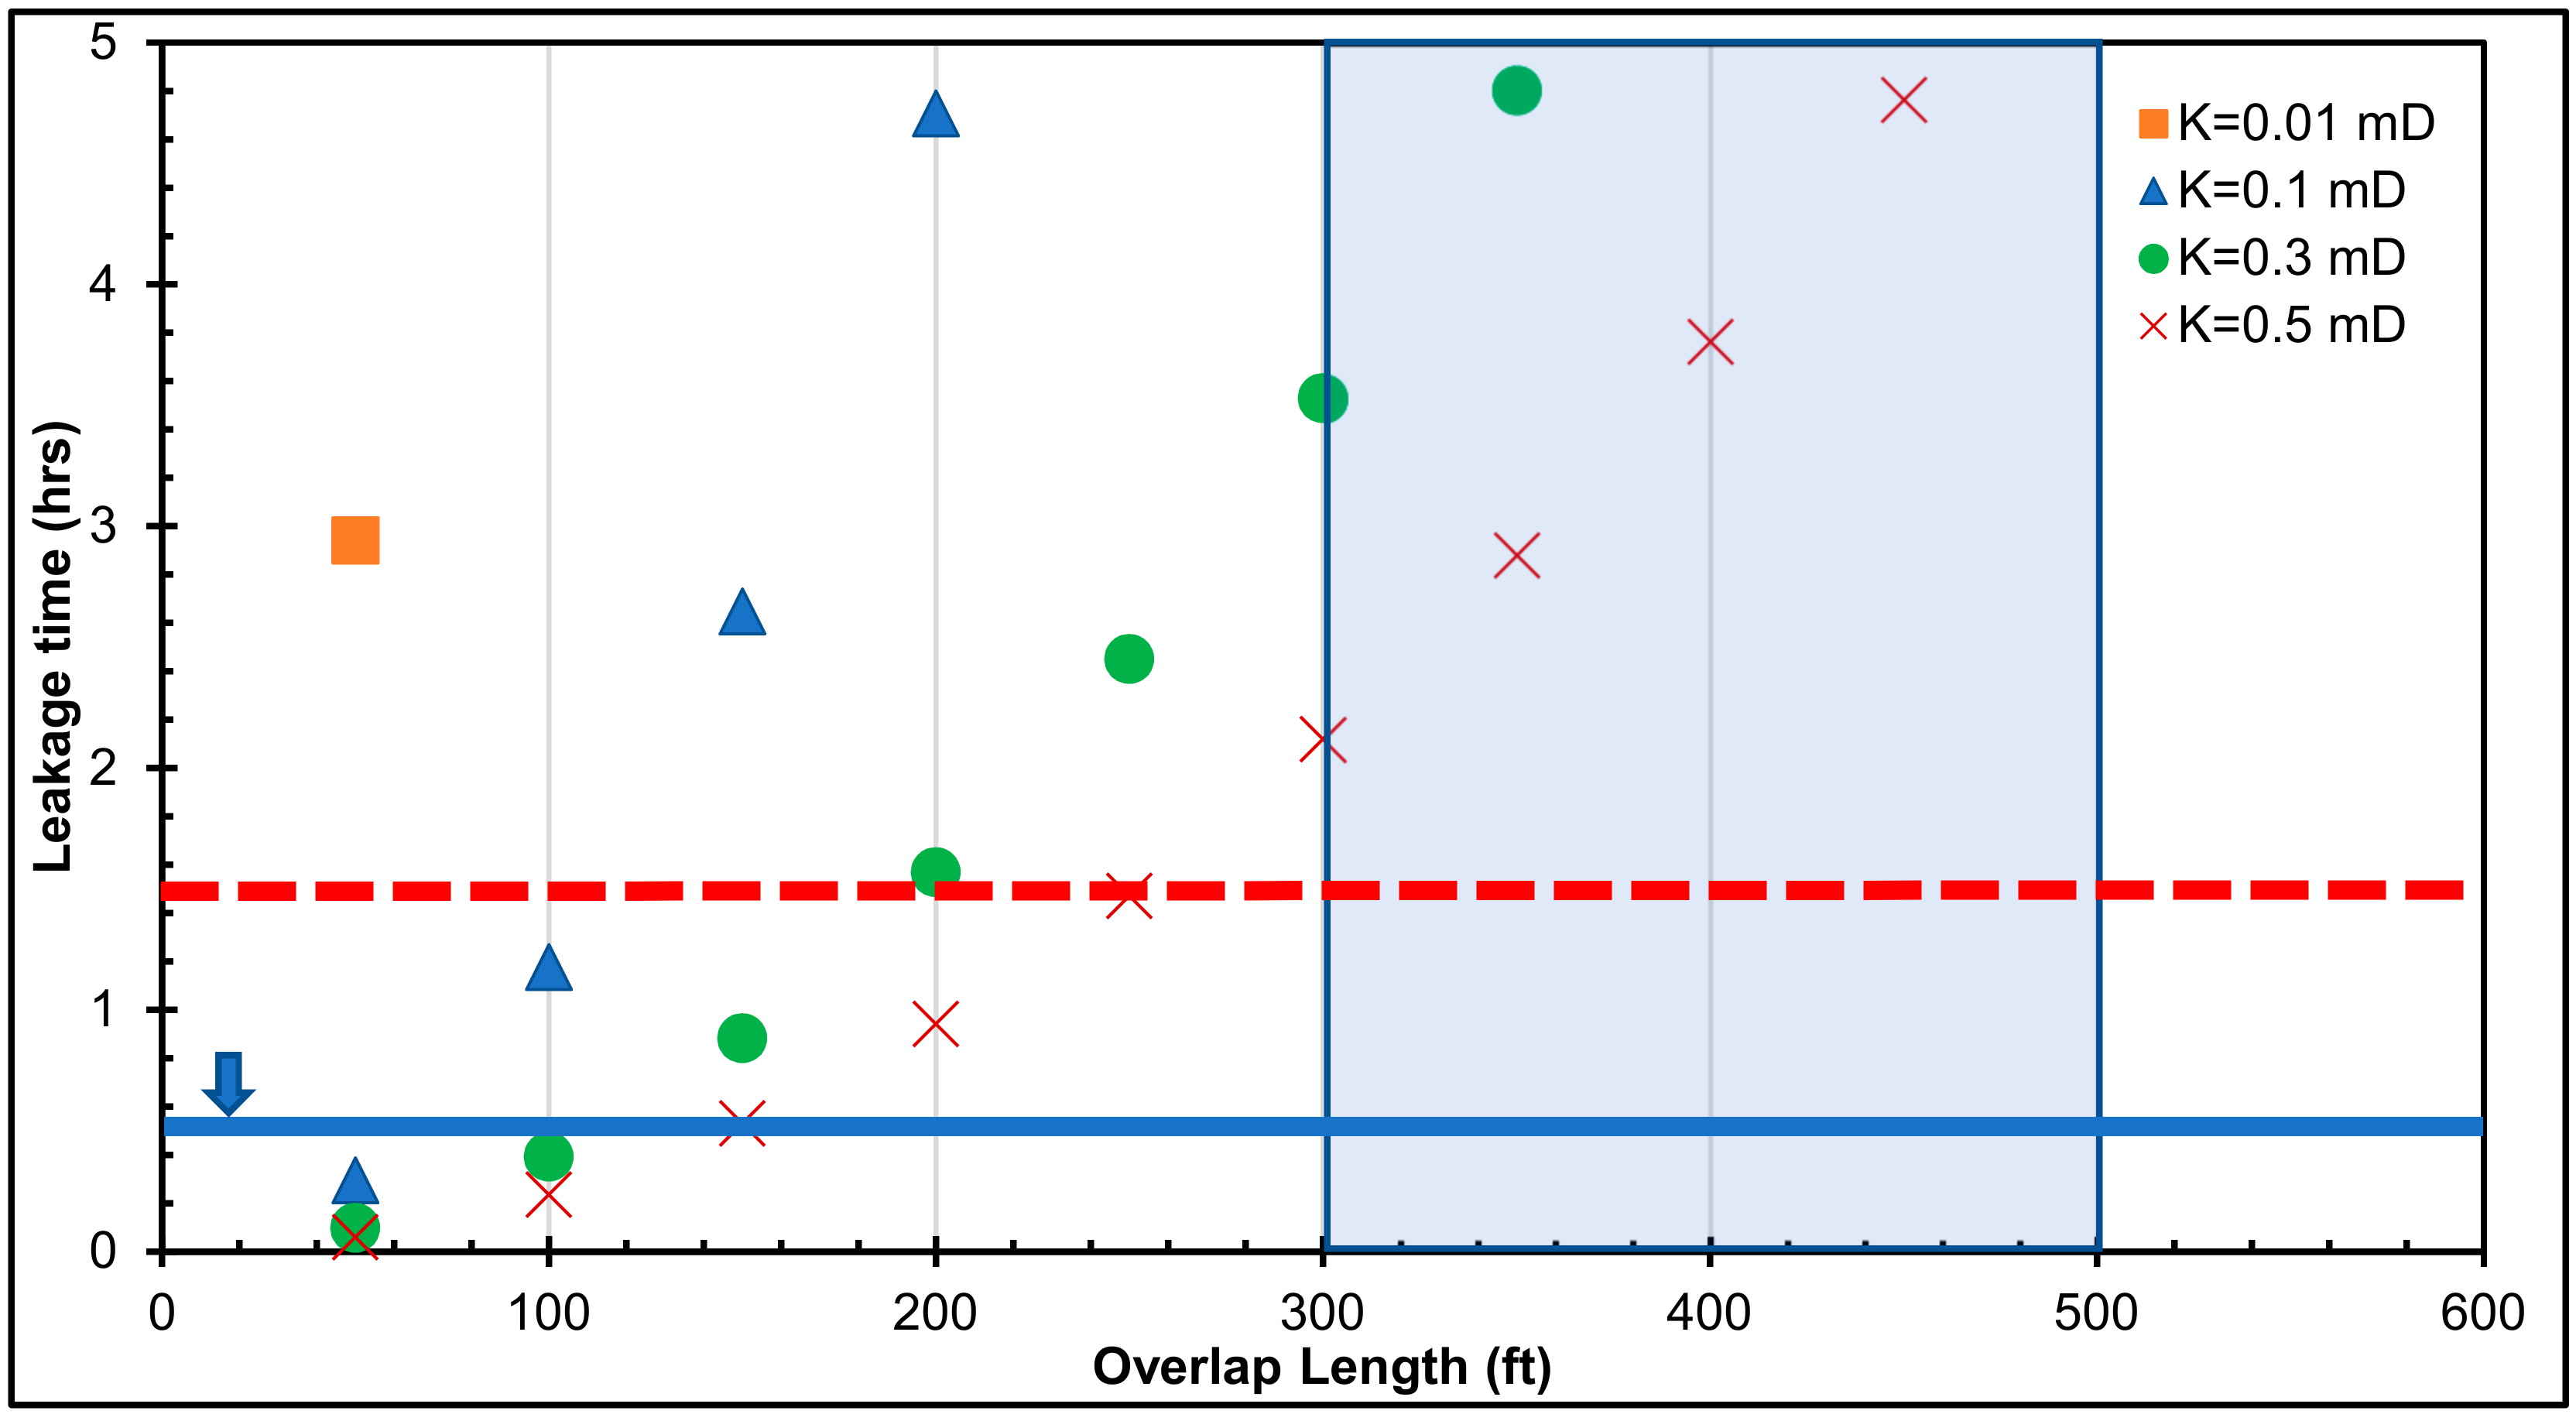
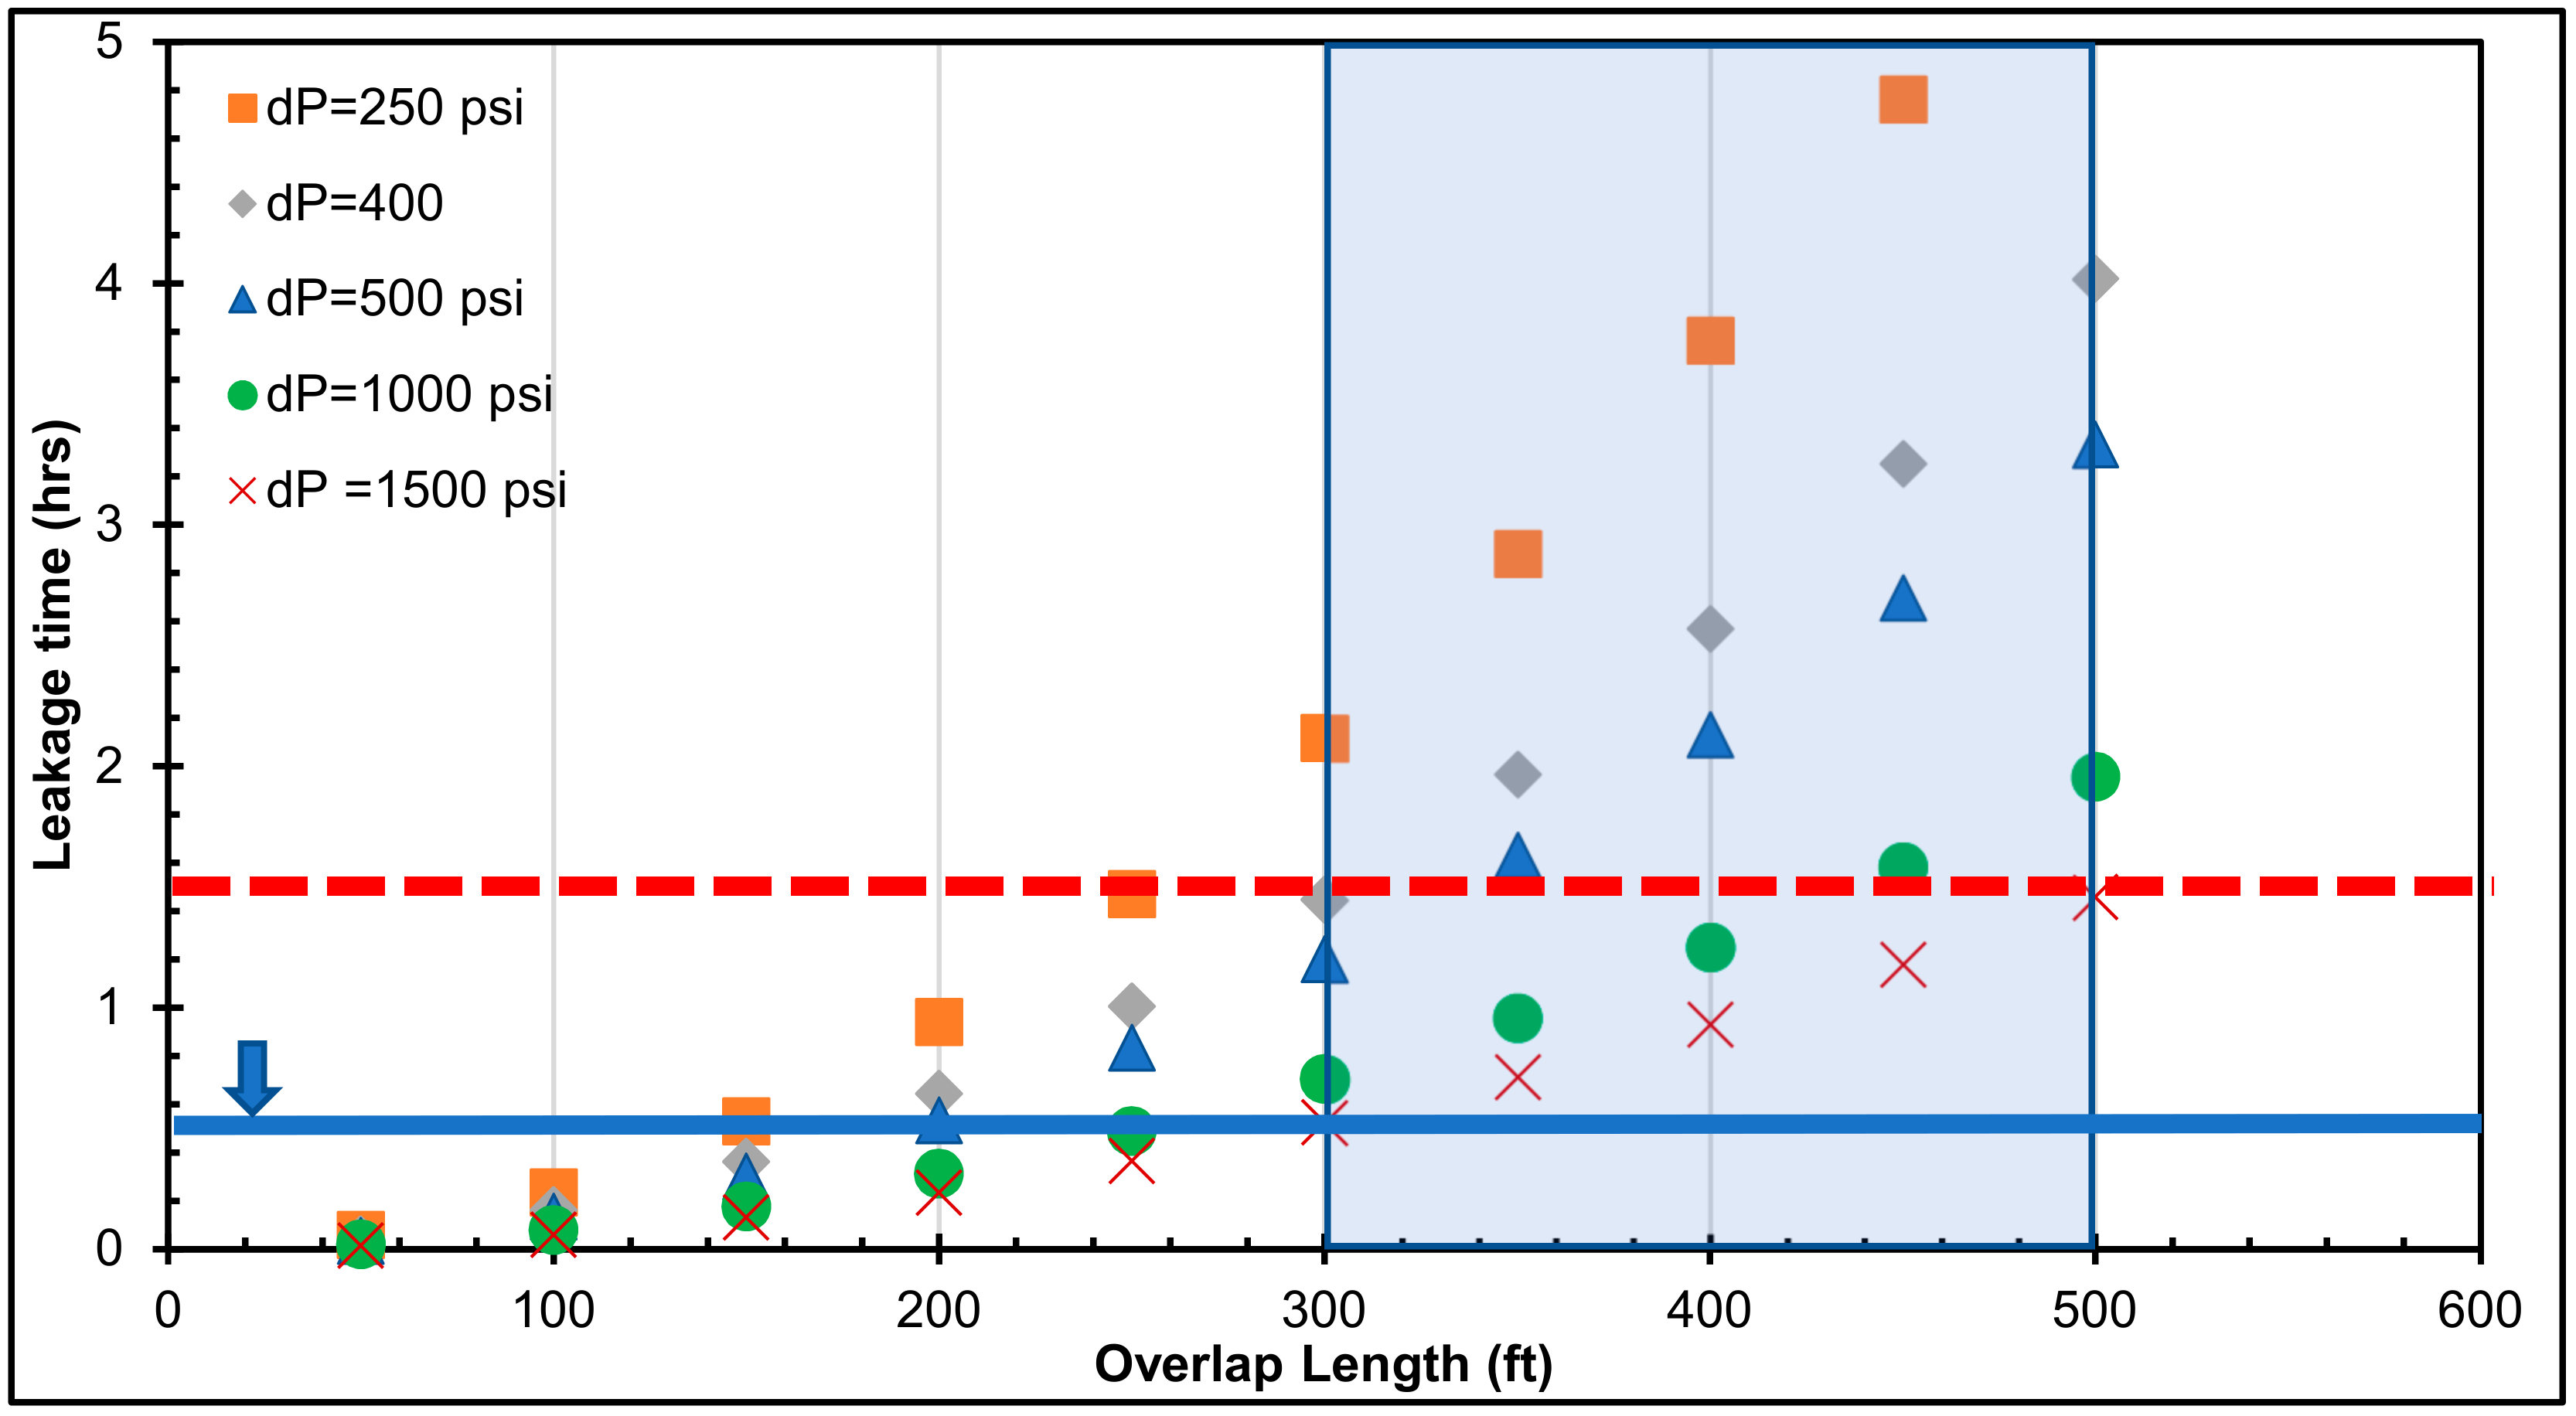
In the first leakage scenario, a differential pressure of 250 psi exerted on the cement within the casing–liner overlap was assumed. Figure 6 shows the leakage time versus the casing–liner overlap length when a differential pressure of 250 psi was exerted across the cement placed within the overlap. For a 50-ft casing–liner overlap, the leakage time was approximately 3 h for a permeability of 0.01 mD; however, the leakage time for the rest of permeability values was below 30 min. A general trend that was observed is that as the length of casing–liner overlap increases, the leakage time increases. For 0.3 mD, the gas takes almost 25 min to leak to the bottom of the overlap when the overlap length is 100 ft, while it takes 95 min for a 200-ft overlap length.
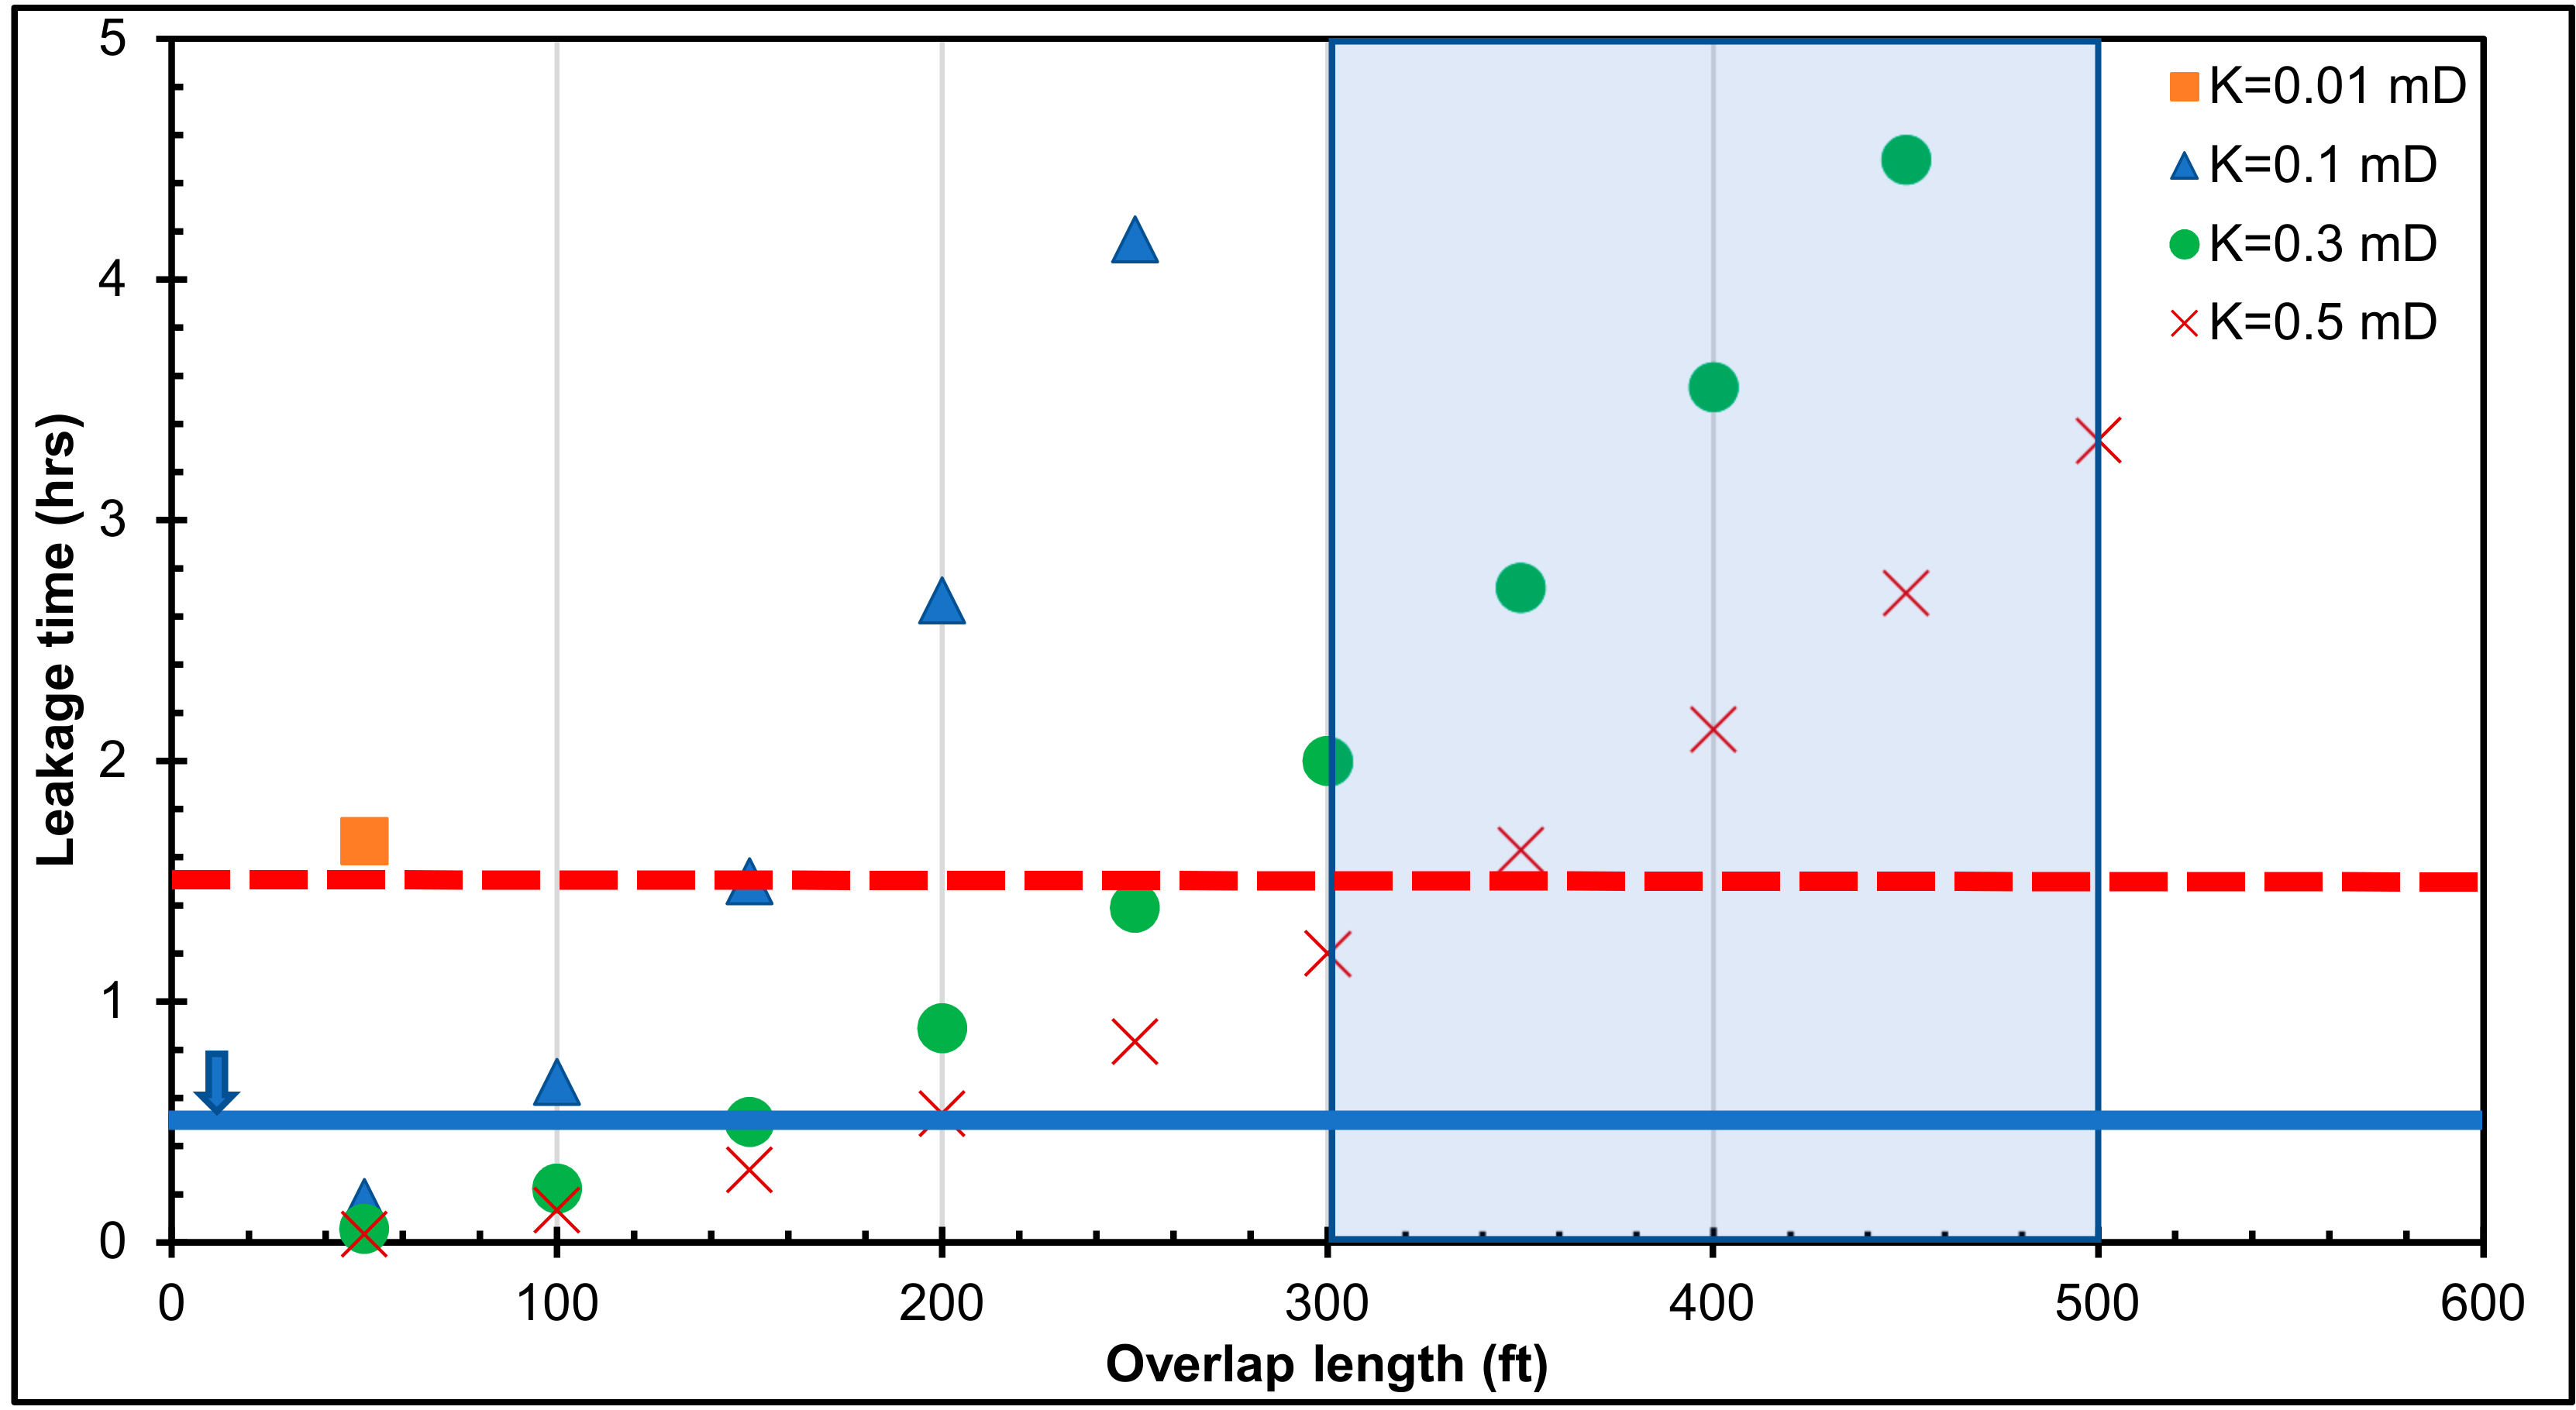
The second leakage scenario was developed with a differential pressure of 500 psi across the cement column behind the casing–liner overlap. Figure 7 illustrates how the leakage time varies with the overlap length when a 500-psi differential pressure across the cement column is assumed. For a 50-ft overlap, the leakage time was approximately 1.5 h (with a permeability of 0.01 mD), while it was less than 30 min for the rest of the permeability values. The leakage time increases as the casing–liner overlap increases. For a permeability of 0.3 mD, the leakage time is 15 min when the overlap is 100 ft, while it is 55 min for 200 ft of overlap. It can be observed that as the differential pressure across the cement (within the overlap) increases, the leakage time decreases nonlinearly. The leakage scenarios depict that a longer casing–liner overlap can affect the gas propagation time to the bottom of the overlap into the nearest formation or aquifer.
The third and fourth leakage scenarios assumed the respective differential pressures of 1000 and 1500 psi across the cement column behind the casing–liner overlap. Figure 8 and Figure 9 show the leakage time versus the overlap length for 1000- and 1500-psi differential pressures, respectively. It can be observed that the 50-ft overlap has the lowest leakage time especially for permeability values ranging from 0.1 to 0.5 mD. In fact, a longer leakage time can be beneficial for the drilling operators to deal with a kick once it is detected. Also, it helps in preventing freshwater formations from being contaminated by any kick encountered.
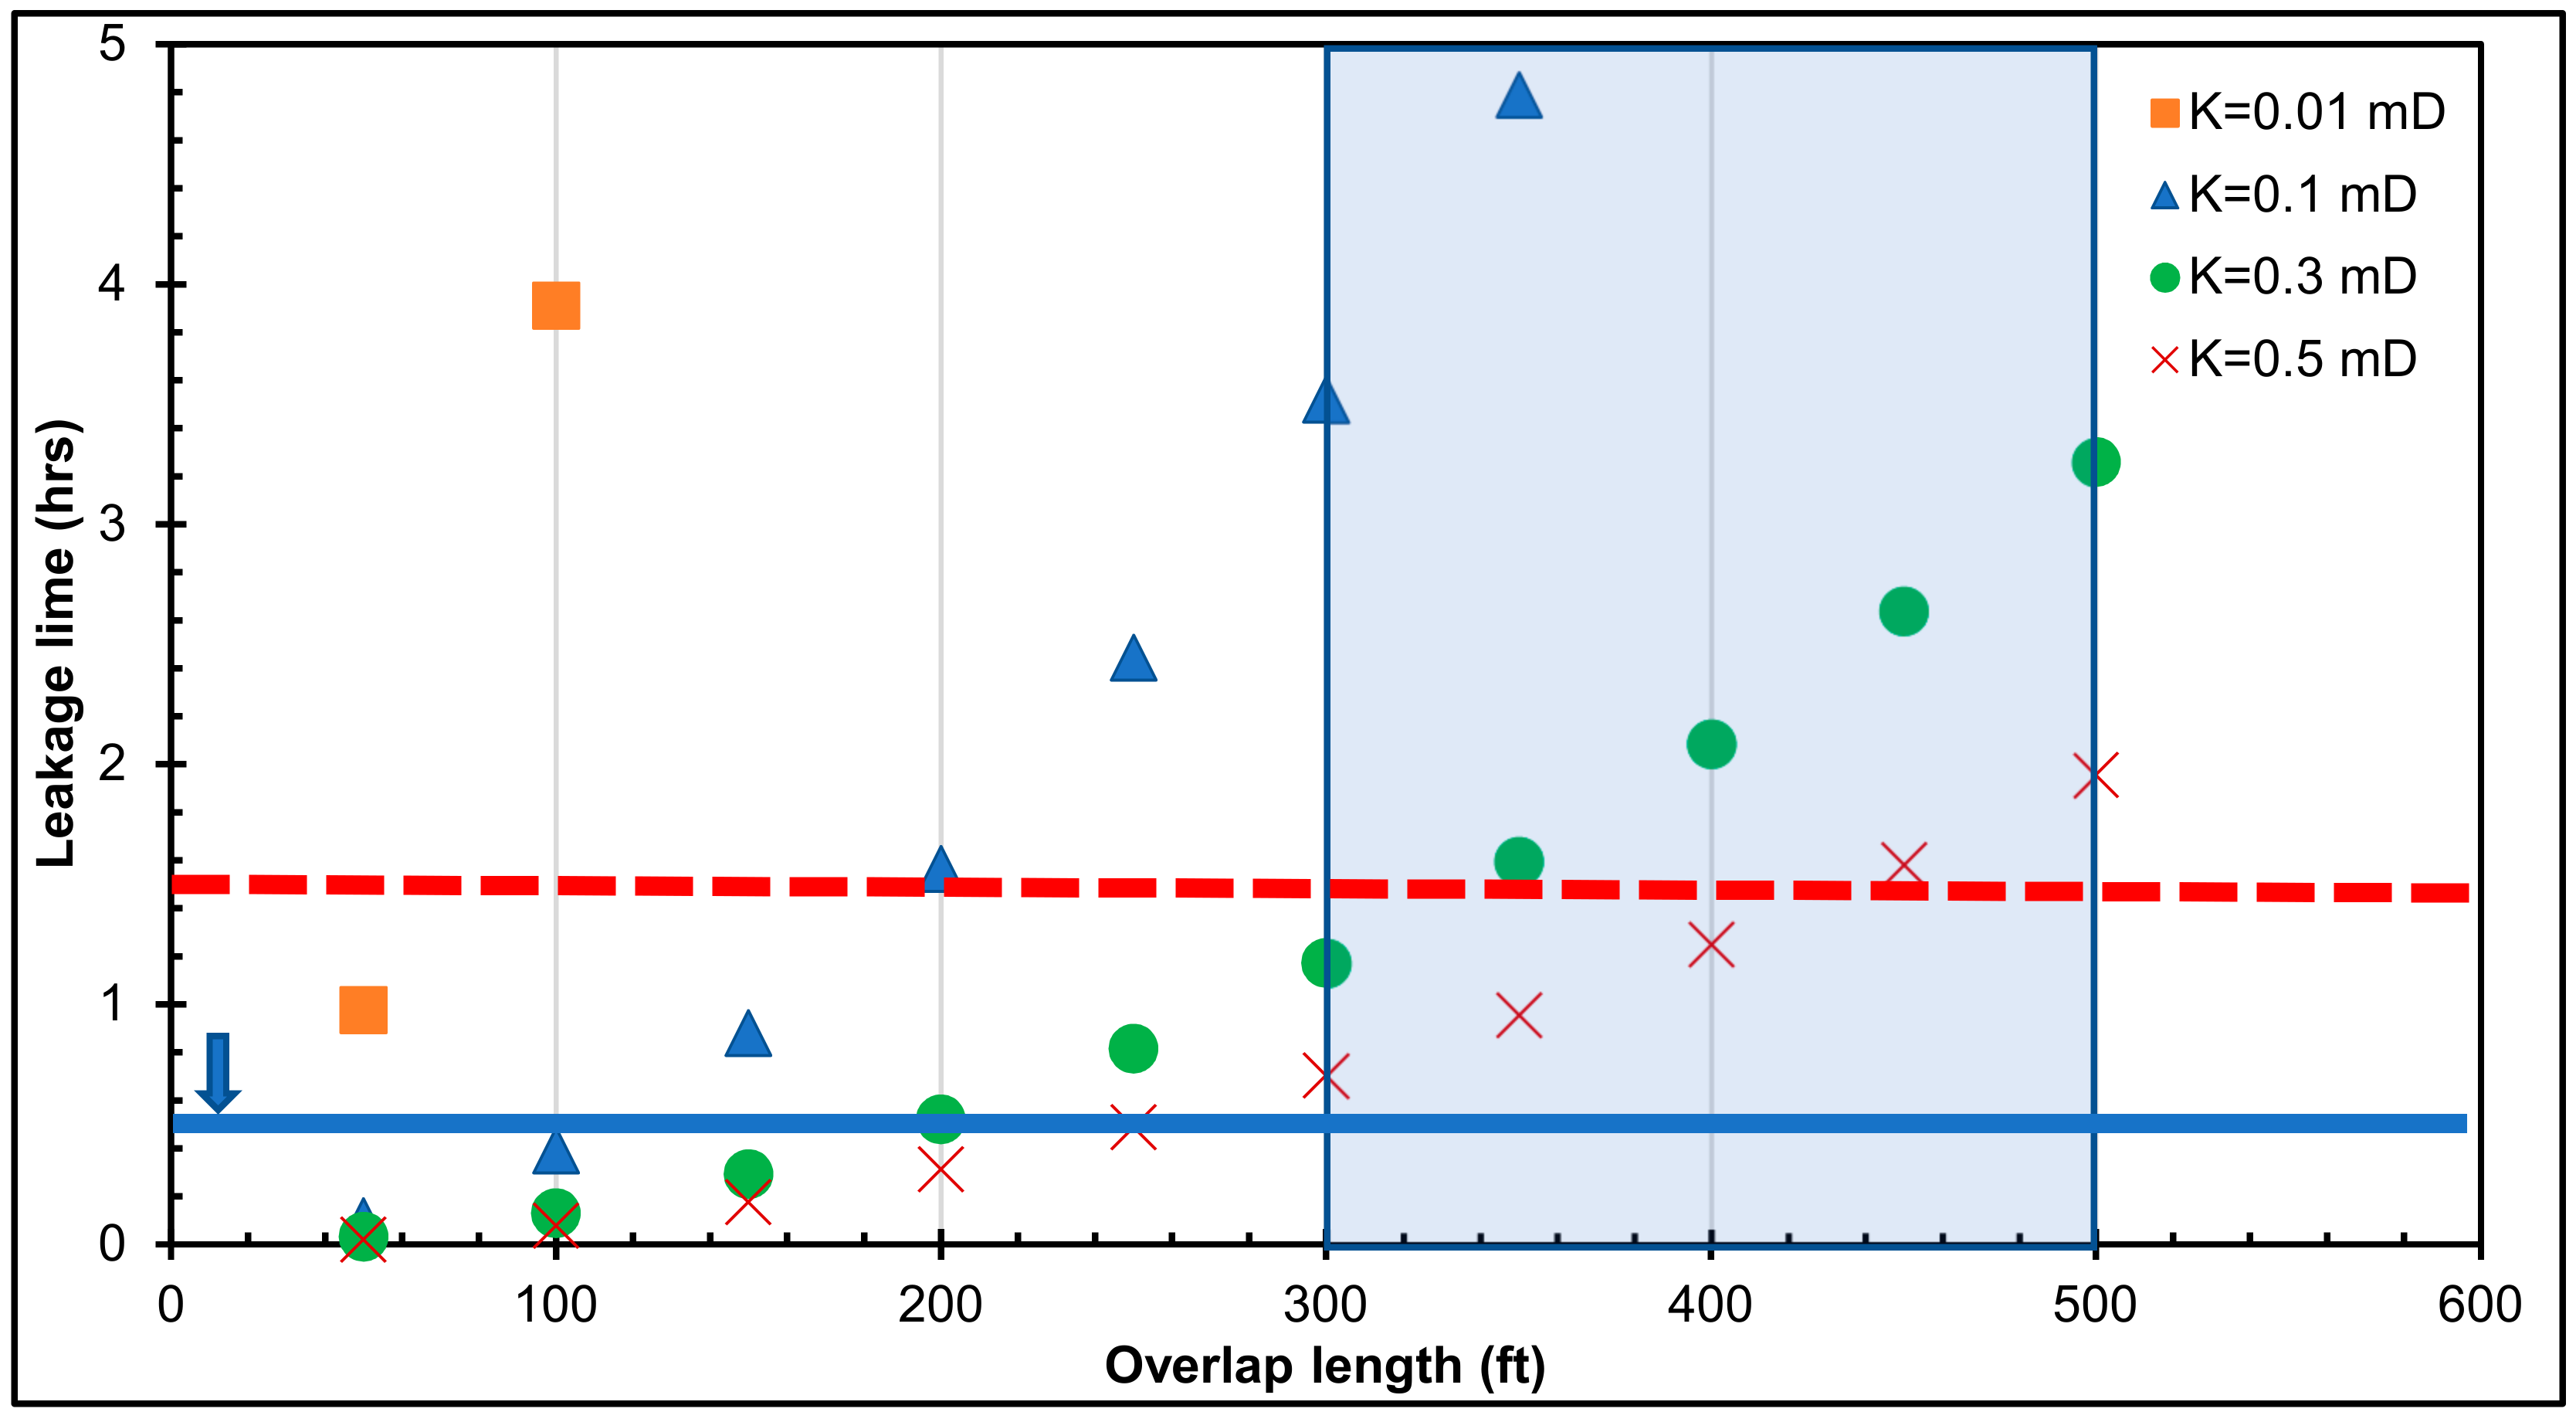
Figure 10 shows how the leakage time varies with the overlap length for various differential pressures at the 0.5-mD permeability. It can be observed that as the differential pressure across the overlap increases, the leakage time decreases. For the 150-ft overlap and 250-psi differential, the leakage time is 30 min, while for 1000 psi it is 10 min. However, as the overlap length increases, the difference in leakage time increases as well. For the 300-ft overlap and 250-psi differential, the leakage time is approximately 2 h and 7 min, while for the 1000-psi differential it is 42 min. It is obvious that as the differential pressure across the cement within the overlap increases, the leakage time decreases. In addition, it can be observed that shorter casing–liner overlaps (50 to 200 ft) have leakage times less than one hour.
An incident occurred in the Main Pass Block 295 (MP295) in the Gulf of Mexico (GOM) in February 2013, where a loss of well control was experienced. The main cause for this incident was found to be due to gas migration through the sub mudline casing hanger seal and cement sheath into a shallow sand formation. This incident is documented in QC-FIT report#2014-02 [51]. The sub mudline casing hanger was designed in accordance to the first edition of API Spec 17D standard [52], which only requires hydrostatic testing with water. However, the current (second) edition of API Spec 17D was revised in 2011, and it requires gas qualification testing of the equipment, addresses the design methodology, as well as verification and validation of wellhead production hangers, sub mudline casing hangers, and seals.
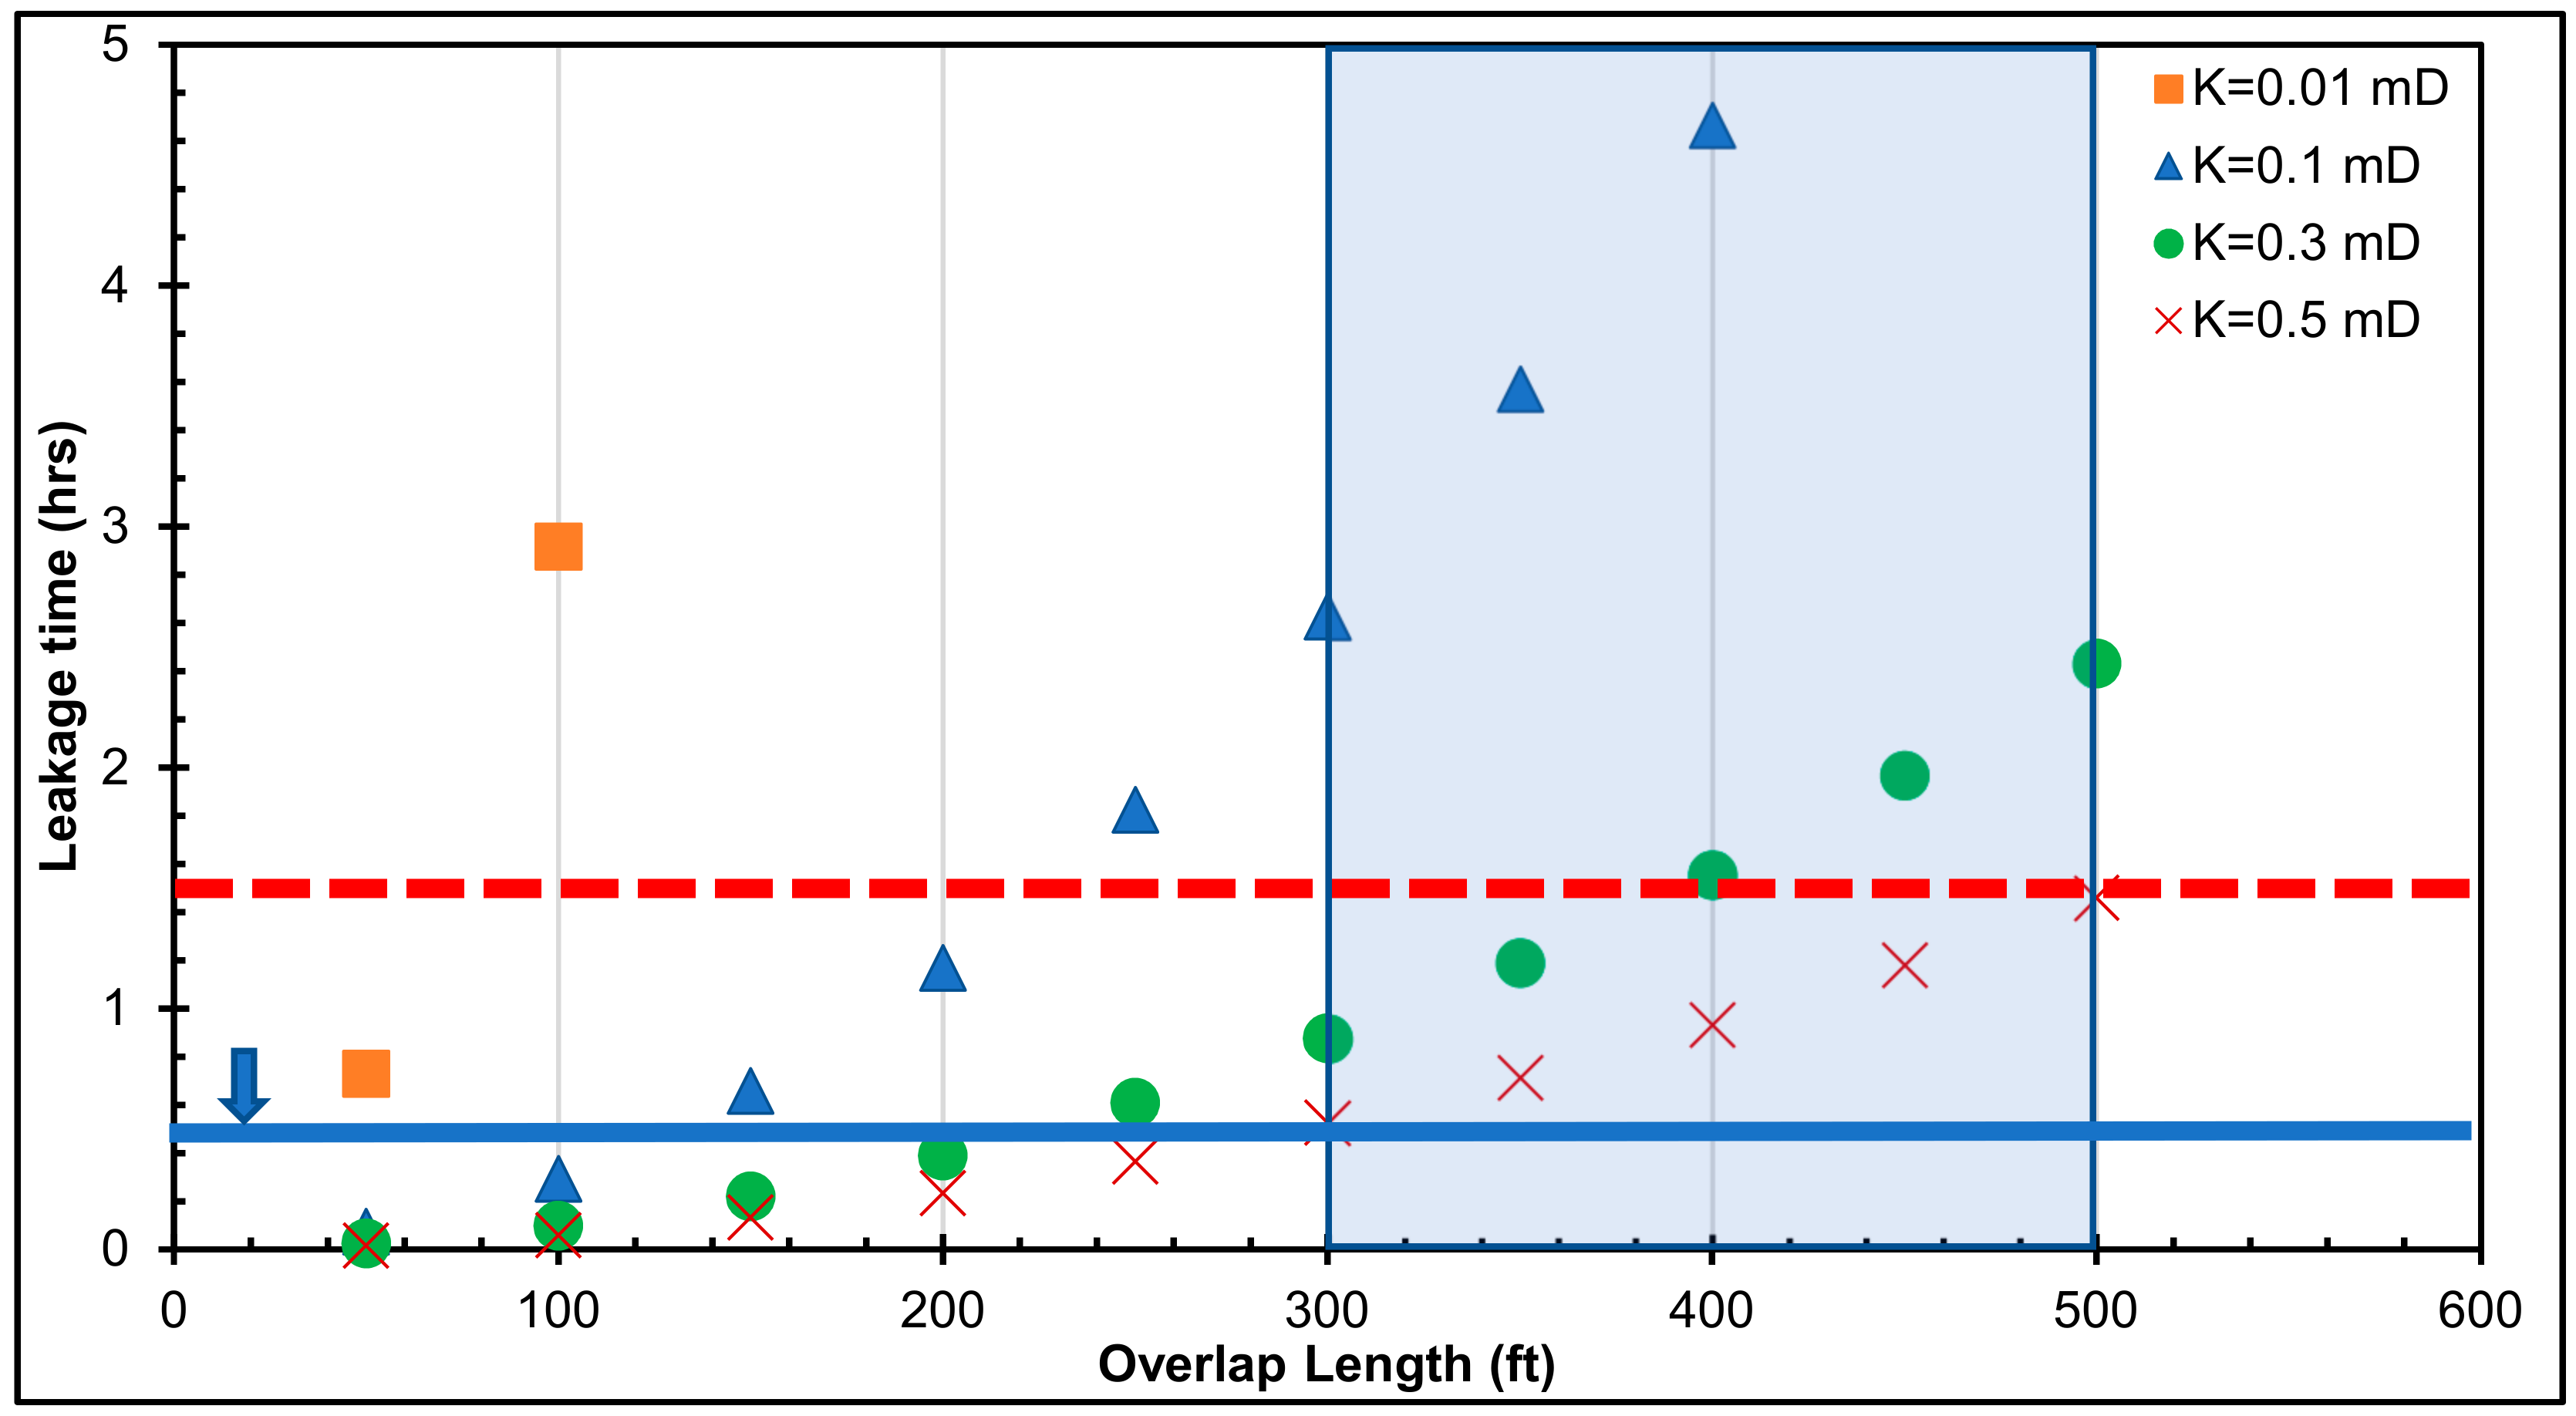
Referring to the incident reported in the QC-FIT report, the last casing shoe was set at 1000 ft while the liner hanger was set at 700 ft, creating a 300-ft casing–liner overlap. According to 30 CFR 250.423 (a) regulation [53], the duration for the pressure test of conductor and casing/liner strings is recommended to be 30 min. The pressure test was conducted at 900 psi for 30 min without any leak indication. Assuming the formation pressure at the casing to be 500 psi, this will create a 400-psi differential pressure on the cement column behind the casing–liner overlap. Assuming a faulty barrier system (cement with 0.5-mD permeability and faulty elastomer). A leakage scenario was developed for this case and it is shown in Figure 10. The blue horizontal line depicts the current test duration, which is 30 min. It can be observed that the leakage time, based on the assumptions made, will be 87 min. This implies that a 30-min pressure test may not have been sufficient to reveal any significant leak for a 300-ft overlap. Therefore, the dashed-red horizontal line (which represents 90 min) is the proposed pressure test duration for a cement column length ≥300 ft in the casing–liner overlap.
6. Summary, Conclusions, and Recommendations
This study investigated the critical length of the casing–liner overlap by modeling gas leakage within the cement placed in the overlap. Several leakage scenarios were developed to serve the objective of this paper. The following conclusions and recommendations are drawn from this study:
6.1. Conclusions
- A simple but effective methodology was proposed to estimate the leak time through a casing–liner overlap.
- The developed leakage scenarios showed that the leakage time increases as the length of the casing–liner overlap increases.
- The cement sheath sealability plays a critical role in maintaining the well integrity. The results showed that as the cement permeability increases, the leakage time decreases.
- The leakage scenario results revealed that 62% of the total leakage time falls under the casing–liner overlap range between 50 and 250 ft. This overlap range may not permit a longer duration for the detection and control of gas influx, when the cement sheath is faulty.
- The leakage scenario results suggest that only 35% of the leakage times are between 1 and 30 min. The current casing pressure test duration of 30 min may not be enough to verify the integrity of the cement sheath in the liner hanger overlap.
6.2. Recommendations
- It is recommended that the pressure test duration is increased beyond 30 min, depending on the cement column length in the casing–liner overlap. As shown from Figure 6, Figure 7, Figure 8, Figure 9 and Figure 10, the dashed-red horizontal line (which represents 90 min) is the proposed pressure test duration for a cement column length ≥300 ft in the casing–liner overlap.
- It is recommended that the cement column in the casing–liner overlap is not less than 300 ft. The leakage times for all the differential pressure values in Figure 10 are less than 1 h for a 50-ft to 200-ft overlap. Shorter overlaps (50 to 200 ft) can be beneficial because pressure tests may quickly identify leaks if the cement and elastomer in the liner hanger are faulty. Cost may also be a contributing factor for the use of shorter overlaps. However, the leakage scenarios suggest that shorter overlaps have shorter leakage times, which implies a shorter time for gas migration through a faulty cement and elastomer in the overlap. To err on the side of caution, particularly in gas zones, the light-blue shaded area in Figure 10. represents the proposed cement column length in the casing–liner overlap (300 to 500 ft). This proposed range shows longer leakage times for a gas kick to migrate to the end of the overlap. In practice, the increase in leakage time can translate to a longer duration required for the detection and control of gas influx and migration.
- The experiments performed in this study were not at high temperatures. It is recommended that future experimental setups should consider the high temperature effect.
- The analytical method did not account for the cement’s mechanical properties. It is recommended that numerical methods are applied to compensate for the limitations of the analytical method.
Author Contributions
Conceptualization, M.A.R., S.S. and C.T.; methodology, M.A.R., S.S. and C.T.; formal analysis, M.A.R. and C.E.; investigation, M.A.R. and C.E.; writing—original draft preparation, M.A.R.; writing—review and editing, S.S., C.T. and C.E.; supervision, S.S. and C.T.
Funding
This research was funded by the Bureau of Safety and Environmental Enforcement (BSEE), Project number E17PC00005.
Acknowledgments
The authors would like to thank George Kwatia and Jeff McCaskill at The University of Oklahoma for his help and support in performing the experiments.
Conflicts of Interest
The authors declare no conflict of interest.
Nomenclature
| °F | Degree Fahrenheit |
| °K | Degree Kelvin |
| ∇P | Pressure gradient in Pa/m |
| 3D | Three dimensional |
| µ | Viscosity of fluid in Pa s |
| A | Cross sectional area of the cement plug in m2 |
| Am | Flow area in m2 |
| BOP | Blow-out preventer |
| BSEE | The Bureau of Safety and Environmental Enforcement |
| CO2 | Carbon dioxide |
| DAQ | Data acquisition system |
| ẟR | Microannulus gap in m |
| ft | Foot |
| GOM | Gulf of Mexico |
| h | Fracture aperture in m (Equation (3)) |
| h | Hydraulic aperture in m (Equation (4)) |
| H2S | Hydrogen sulfide |
| k | Cement permeability in m2 |
| K | Kalvin |
| Kg | Kilogram |
| L | Length of the cement column in m |
| M | Gas molecular weight in kg/mole |
| m | Meters |
| m2 | Square meter |
| m3 | Cubic meter |
| mD | milli-Darcy |
| N2 | Nitrogen gas |
| NVR | Network video recorder |
| θ | Inclination of well corresponding the cement plug in (°) |
| P&A | Plug and abandonment |
| Pa | Pascals |
| Pd | Downstream pressure in Pa |
| Pu | Upstream pressure in Pa |
| psi | Pound per square inch |
| psia | Pound per square inch absolute |
| psig | Pound per square inch gauge |
| Q | Flow rate in m3/sec |
| R | Universal gas constant in m3 Pa/mole K |
| Rc | Outer casing radius in m |
| Ri | Inner casing radius in m |
| Rm | Microannulus radius in m |
| SCP | Sustained casing pressure |
| s | Seconds |
| t | Leakage time in s |
| T | Temperature in Kelvin |
| W | Fracture width in m |
| W/C | Water to cement ratio |
| WOC | Wait on cement |
| z | Gas compressibility factor |
| α | Fracture orientation in (°) |
| ΔP | Pressure difference across the cement in Pa |
| ρ | Fluid density in kg/m3 |
| ω | Length of hydraulic aperture in m |
References
- Davies, R.J.; Almond, S.; Ward, R.S.; Jackson, R.B.; Adams, C.; Worrall, F.; Herringshaw, L.G.; Gluyas, J.G.; Whitehead, M.A. Oil and gas wells and their integrity: Implications for shale and unconventional resource exploitation. Mar. Pet. Geol. 2014, 56, 239–254. [Google Scholar] [CrossRef]
- Nygaard, R.; Salehi, S.; Weideman, B.; Lavoie, R.G. Effect of Dynamic Loading on Wellbore Leakage for the Wabamun Area CO2-Sequestration Project. J. Can. Pet. Technol. 2014, 53, 69–82. [Google Scholar] [CrossRef]
- Kiran, R.; Teodoriu, C.; Dadmohammadi, Y.; Nygaard, R.; Wood, D.; Mokhtari, M.; Salehi, S. Identification and evaluation of well integrity and causes of failure of well integrity barriers (A review). J. Nat. Gas Sci. Eng. 2017, 45, 511–526. [Google Scholar] [CrossRef]
- Al Ramadan, M.; Salehi, S.; Teodoriu, C. Robust Leakage Modeling for Plug & Abandonment Applications. In Proceedings of the ASME 38th International Conference on Ocean, Offshore and Arctic Engineering, Glasgow, UK, 9–14 June 2019. [Google Scholar]
- Ahmed, S.; Salehi, S.; Ezeakacha, C.; Teodoriu, C. Experimental investigation of elastomers in downhole seal elements: Implications for safety. Polym. Test. 2019, 76, 350–364. [Google Scholar] [CrossRef]
- Phi, T.; Elgaddafi, R.; Al Ramadan, M.; Ahmed, R.; Teodoriu, C. Well Integrity Issues: Extreme High-Pressure High-Temperature Wells and Geothermal Wells a Review. In Proceedings of the SPE Thermal Well Integrity and Design Symposium, Banff, AB, Canada, 19–21 November 2019. [Google Scholar]
- NORSOK. Standard D-010: Well Integrity in Drilling and Well Operations; NORSOK: Lysaker, Norway, 2014. [Google Scholar]
- Bogaerts, M.; De Bruijn, G.G.; Khalilova, P.R.; Moretti, F.; Voon, E. Identifying and Mitigating the Risks of Shallow Flow in Deepwater Cementing Operations. In Proceedings of the SPE Deepwater Drilling and Completions Conference, Galveston, TX, USA, 20–21 June 2012. [Google Scholar]
- Murray, S.J.; Williamson, M.D.; Gilham, S.; Thorogood, J.L. Well Design for Shallow Gas. In Proceedings of the SPE/IADC Drilling Conference, Amsterdam, The Netherlands, 28 February–2 March 1995. [Google Scholar]
- Adams, N.J.; Kuhlman, L.G. Case History Analyses of Shallow Gas Blowouts. In Proceedings of the SPE/IADC Drilling Conference, Houston, TX, USA, 27 February–2 March 1990. [Google Scholar]
- Prince, P.K. Current Drilling Practice And The Occurrence Of Shallow Gas. In Proceedings of the International Conference on Safety in Offshore Engineering, London, UK, 25–16 April 1990. [Google Scholar]
- Ahmed, S.; Salehi, S.; Ezeakacha, C.P.; Teodoriu, C. Evaluation of liner hanger seal assembly and cement sheath as a dual barrier system: Implications for industry standards. J. Pet. Sci. Eng. 2019, 178, 1092–1103. [Google Scholar] [CrossRef]
- Patel, H.; Hariharan, H.; Bailey, G.; Jung, G. Advanced Computer Modelling for Metal-to-Metal Seal in API Flanges. In Proceedings of the SPE Annual Technical Conference and Exhibition, Dallas, TX, USA, 24 September 2018; p. 21. [Google Scholar]
- Patel, H.; Salehi, S.; Ahmed, R.; Teodoriu, C. Review of elastomer seal assemblies in oil & gas wells: Performance evaluation, failure mechanisms, and gaps in industry standards. J. Pet. Sci. Eng. 2019, 179, 1046–1062. [Google Scholar] [CrossRef]
- Patel, H.; Salehi, S.; Teodoriu, C.; Ahmed, R. Performance evaluation and parametric study of elastomer seal in conventional hanger assembly. J. Pet. Sci. Eng. 2019, 175, 246–254. [Google Scholar] [CrossRef]
- Ahmed, S.; Ezeakacha, C.P.; Salehi, S. Improvement in Cement Sealing Properties and Integrity Using Conductive Carbon Nano Materials: From Strength to Thickening Time. In Proceedings of the SPE Annual Technical Conference and Exhibition, Dallas, TX, USA, 24–26 September 2018. [Google Scholar]
- Al-Yami, A.S.; Nasr-El-Din, H.A.; Al-Humaidi, A.S. An Innovative Cement Formula To Prevent Gas-Migration Problems in HT/HP Wells. In Proceedings of the SPE International Symposium on Oilfield Chemistry, The Woodlands, TX, USA, 20–22 April 2009. [Google Scholar]
- Grinrod, M.; Vassoy, B.; Dingsoyr, E.O. Development and Use of a Gas-Tight Cement. In Proceedings of the SPE/IADC Drilling Conference, Dallas, TX, USA, 28 February–2 March 1988. [Google Scholar]
- Kwatia, G.; Al Ramadan, M.; Salehi, S.; Teodoriu, C. Enhanced Cement Composition for Preventing Annular Gas Migration. In Proceedings of the ASME 38th International Conference on Ocean, Offshore and Arctic Engineering, Glasgow, UK, 9–14 June 2019. [Google Scholar]
- Khalifeh, M.; Saasen, A.; Hodne, H.; Godøy, R.; Vrålstad, T. Geopolymers as an alternative for oil well cementing applications: A review of advantages and concerns. J. Energy Resour. Technol. 2018, 140, 092801. [Google Scholar] [CrossRef]
- Salehi, S.; Khattak, M.J.; Ali, N.; Ezeakacha, C.; Saleh, F.K. Study and Use of Geopolymer Mixtures for Oil and Gas Well Cementing Applications. J. Energy Resour. Technol. 2017, 140, 012908. [Google Scholar] [CrossRef]
- Salehi, S.; Khattak, M.J.; Rizvi, H.; Karbalaei, S.F.; Kiran, R. Sensitivity analysis of fly ash geopolymer cement slurries: Implications for oil and gas wells cementing applications. J. Nat. Gas Sci. Eng. 2017, 37, 116–125. [Google Scholar] [CrossRef]
- Fakoya, M.; Patel, H.; Shah, S. Nanotechnology: Innovative applications in the oil and gas industry. Int. J. Glob. Adv. Mater. Nanotechnol. 2018, 1, 16–30. [Google Scholar]
- Kimanzi, R.; Patel, H.; Khalifeh, M.; Salehi, S.; Teodoriu, C. Potentials of nano-designed plugs: Implications for short and long term well integrity. In Proceedings of the 38th International Conference on Ocean, Offshore & Artic Engineering, Glasgow, UK, 9–14 June 2019. [Google Scholar]
- Patel, H. Effect of Nanoparticles and Solvent Based Emulsion on Heavy Oil Viscosity; University of Oklahoma: Norman, OK, 2016. [Google Scholar]
- Patel, H.; Salehi, S.; Teodoriu, C. Assessing Mechanical Integrity of Expanding Cement. In Proceedings of the SPE Oklahoma City Oil and Gas Symposium, Oklahoma City, OK, USA, 9–10 April 2019. [Google Scholar]
- Saleh, F.K.; Rivera, R.; Salehi, S.; Teodoriu, C.; Ghalambor, A. How Does Mixing Water Quality Affect Cement Properties. In Proceedings of the SPE International Conference and Exhibition on Formation Damage Control, Lafayette, LA, USA, 7–9 February 2018. [Google Scholar]
- Nath, F.; Kimanzi, R.J.; Mokhtari, M.; Salehi, S. A novel method to investigate cement-casing bonding using digital image correlation. J. Pet. Sci. Eng. 2018, 166, 482–489. [Google Scholar] [CrossRef]
- Patel, H.; Salehi, S. Development of an Advanced Finite Element Model and Parametric Study to Evaluate Cement Sheath Barrier. J. Energy Resour. Technol. 2019, 141, 092902. [Google Scholar] [CrossRef]
- Rocha-Valadez, T.; Hasan, A.R.; Mannan, S.; Kabir, C.S. Assessing Wellbore Integrity in Sustained-Casing-Pressure Annulus. SPE Drill. Completion 2014, 29, 131–138. [Google Scholar] [CrossRef]
- Xu, R. Analysis of Diagnostic Testing of Sustained Casing Pressure in Wells. Ph.D.Thesis, Louisiana State University, Baton Rouge, LA, USA, 2002. [Google Scholar]
- Xu, R.; Wojtanowicz, A.K. Pressure buildup test analysis in wells with sustained casing pressure. J. Nat. Gas Sci. Eng. 2017, 38, 608–620. [Google Scholar] [CrossRef]
- Nishikawa, S. Mechanism of Gas Migration after Cement Placement and Control of Sustained Casing Pressure. Master’s Thesis, Louisiana State University, Baton Rouge, LA, USA, May 1999. [Google Scholar]
- Xu, R.; Wojtanowicz, A.K. Diagnosis of Sustained Casing Pressure from Bleed-off/Buildup Testing Patterns. In Proceedings of the SPE Production and Operations Symposium, Oklahoma City, OK, USA, 24–27 March 2001. [Google Scholar]
- Xu, R.; Wojtanowicz, A.K. Diagnostic Testing of Wells With Sustained Casing Pressure-An Analytical Approach. In Proceedings of the Canadian International Petroleum Conference, Calgary, AB, Canada, 10–12 June 2003. [Google Scholar]
- Huerta, N.J.; Checkai, D.; Bryant, S.L. Utilizing Sustained Casing Pressure Analog to Provide Parameters to Study CO2 Leakage Rates Along a Wellbore. In Proceedings of the SPE International Conference on CO2 Capture Storage, and Utilization, San Diego, CA, USA, 2–4 November 2009. [Google Scholar]
- Tao, Q.; Checkai, D.; Bryant, S.L. Permeability Estimation for Large-Scale Potential CO2 Leakage Paths in Wells Using a Sustained-Casing-Pressure Model. In Proceedings of the SPE International Conference on CO2 Capture Storage, and Utilization, New Orleans, LA, USA, 10–12 November 2010. [Google Scholar]
- Salehi, S. Modeling Near Wellbore Leakage Pathways in Shale Gas Wells: Investigating Short and Long Terms Wellbore Integrity. In Proceedings of the US EPA Technical Workshop on Well Construction/Operation and Subsurface Modelling, Research Triangle Park, NC, USA, 16–17 April 2013. [Google Scholar]
- Aas, B.; Sørbø, J.; Stokka, S.; Saasen, A.; Statoil, R.G.; Lunde, Ø.; Phillips, C.; Vrålstad, T. Cement Placement with Tubing Left in Hole during Plug and Abandonment Operations. In Proceedings of the IADC/SPE Drilling Conference and Exhibition, Fort Worth, TX, USA, 1–3 March 2016. [Google Scholar]
- Ford, E.P.; Moeinikia, F.; Lohne, H.P.; Arild, Ø.; Majoumerd, M.M.; Fjelde, K.K. Leakage Calculator for Plugged and Abandoned Wells. In Proceedings of the SPE Bergen One Day Seminar, Bergen, Norway, 5 April 2017. [Google Scholar]
- Godoy, R.; Fontan, M.; Capra, B.; Kvalsund, R.; Poupard, O. Well Integrity Support by Extended Cement Evaluation—Numerical Modeling of Primary Cement Jobs. In Proceedings of the Abu Dhabi International Petroleum Exhibition and Conference, Abu Dhabi, UAE, 9–12 November 2015. [Google Scholar]
- Sarkar, S.; Toksoz, M.N.; Burns, D.R. Fluid Flow Modeling in Fractures; Massachusetts Institute of Technology, Earth Resources Laboratory: Cambridge, MA, USA, 2004. [Google Scholar]
- Stormont, J.C.; Fernandez, S.G.; Taha, M.R.; Matteo, E.N. Gas flow through cement-casing microannuli under varying stress conditions. Geomech. Energy Environ. 2018, 13, 1–13. [Google Scholar] [CrossRef]
- Witherspoon, P.A.; Wang, J.S.Y.; Iwai, K.; Gale, J.E. Validity of Cubic Law for fluid flow in a deformable rock fracture. Water Resour. Res. 1980, 16, 1016–1024. [Google Scholar] [CrossRef]
- API. API BULLETIN E3: Environmental Guidance Document: Well Abandonment and Inactive Well Practices for U.S. Exploration and Production Operations, 1st ed.; API: Washington, DC, USA, 1993. [Google Scholar]
- API. API RP 10A: Specification for Cements and Materials for Well Cementing, 24th ed.; API: Washington, DC, USA, 2010. [Google Scholar]
- Carey, J.W. Geochemistry of wellbore integrity in CO2 sequestration: Portland cement-steel-brine-CO2 interactions. Rev. Mineral. Geochem. 2013, 77, 505–539. [Google Scholar] [CrossRef]
- Carroll, S.; Carey, J.W.; Dzombak, D.; Huerta, N.J.; Li, L.; Richard, T.; Um, W.; Walsh, S.D.C.; Zhang, L. Review: Role of chemistry, mechanics, and transport on well integrity in CO2 storage environments. Int. J. Greenh. Gas Control 2016, 49, 149–160. [Google Scholar] [CrossRef]
- Huerta, N.J.; Hesse, M.A.; Bryant, S.L.; Strazisar, B.R.; Lopano, C.L. Experimental Evidence for Self-Limiting Reactive Flow through a Fractured Cement Core: Implications for Time-Dependent Wellbore Leakage. Environ. Sci. Technol. 2013, 47, 269–275. [Google Scholar] [CrossRef]
- Al Ramadan, M.; Salehi, S.; Kwatia, G.; Ezeakacha, C.; Teodoriu, C. Experimental investigation of well integrity: Annular gas migration in cement column. J. Pet. Sci. Eng. 2019, 179, 126–135. [Google Scholar] [CrossRef]
- BSEE. QC-FIT Evaluation of Seal Assembly & Cement Failures Interim Summary of Findings; Internal QC-FIT Report #2014-02; Bureau of Safety and Environmental Enforcement: Washington, WA, USA, 2014.
- API. API SPEC 17 D: Specification for Design and Operation of Subsea Production Systems-Subsea Wellhead and Tree Equipment, 2nd ed.; API: Washington, DC, USA, 2011. [Google Scholar]
- CFR-250.425. What are the Requirements for Pressure Testing Liners. In A Special Edition of the Federal Register; Office of the Federal Register National Achieves and Records Administration: Dallas, TX, USA, 2004. [Google Scholar]
Figure 1.
Schematic of gas migration through the liner hanger and cement within the casing–liner overlap.
Figure 1.
Schematic of gas migration through the liner hanger and cement within the casing–liner overlap.

Figure 2.
Gas leakage through different lengths of the casing–liner overlap.

Figure 3.
Experimental setup used to simulate the liner hanger–casing overlap.

Figure 4.
Gas bubbles from the cemented annulus at the interface between the cement and pipe indicating a possible microannulus.
Figure 4.
Gas bubbles from the cemented annulus at the interface between the cement and pipe indicating a possible microannulus.

Figure 5.
Decline pressure curves collected throughout a conducted test.

Figure 6.
Leakage time versus casing–liner overlap length for 250-psi pressure differential across the cement.
Figure 6.
Leakage time versus casing–liner overlap length for 250-psi pressure differential across the cement.

Figure 7.
Leakage time versus casing–liner overlap length for a 500-psi pressure differential across the cement.
Figure 7.
Leakage time versus casing–liner overlap length for a 500-psi pressure differential across the cement.

Figure 8.
Leakage time versus casing–liner overlap length for a 1000-psi pressure differential across the cement.
Figure 8.
Leakage time versus casing–liner overlap length for a 1000-psi pressure differential across the cement.

Figure 9.
Leakage time versus casing–liner overlap length for a 1500-psi pressure differential across the cement.
Figure 9.
Leakage time versus casing–liner overlap length for a 1500-psi pressure differential across the cement.

Figure 10.
Leakage time versus casing–liner overlap length for a 0.5-mD cement permeability for several differential pressures.
Figure 10.
Leakage time versus casing–liner overlap length for a 0.5-mD cement permeability for several differential pressures.

© 2019 by the authors. Licensee MDPI, Basel, Switzerland. This article is an open access article distributed under the terms and conditions of the Creative Commons Attribution (CC BY) license (http://creativecommons.org/licenses/by/4.0/).
Share and Cite
MDPI and ACS Style
Al Ramadan, M.; Salehi, S.; Ezeakacha, C.; Teodoriu, C. Analytical and Experimental Investigation of the Critical Length in Casing–Liner Overlap. Sustainability 2019, 11, 6861. https://0-doi-org.brum.beds.ac.uk/10.3390/su11236861
AMA Style
Al Ramadan M, Salehi S, Ezeakacha C, Teodoriu C. Analytical and Experimental Investigation of the Critical Length in Casing–Liner Overlap. Sustainability. 2019; 11(23):6861. https://0-doi-org.brum.beds.ac.uk/10.3390/su11236861
Chicago/Turabian StyleAl Ramadan, Mustafa, Saeed Salehi, Chinedum Ezeakacha, and Catalin Teodoriu. 2019. "Analytical and Experimental Investigation of the Critical Length in Casing–Liner Overlap" Sustainability 11, no. 23: 6861. https://0-doi-org.brum.beds.ac.uk/10.3390/su11236861
Note that from the first issue of 2016, this journal uses article numbers instead of page numbers. See further details here.