Article

Effects of Climate and Land-Cover Changes on Soil Erosion in Brazilian Pantanal

by
Carina B. Colman
1,
Paulo Tarso S. Oliveira
1,2,*,
André Almagro
1,
Britaldo S. Soares-Filho
3 and
Dulce B. B. Rodrigues
1
1
Federal University of Mato Grosso do Sul, Campo Grande, Mato Grosso do Sul 79070-900, Brazil
2
Master’s Water Resources and Environmental Sanitation, Federal University of Mato Grosso do Sul, Campo Grande, MS 79070-900, Brazil
3
Center for Remote Sensing, Federal University of Minas Gerais, Belo Horizonte, Minas Gerais 31270-901, Brazil
*
Author to whom correspondence should be addressed.
Sustainability 2019, 11(24), 7053; https://0-doi-org.brum.beds.ac.uk/10.3390/su11247053
Submission received: 1 November 2019 / Revised: 2 December 2019 / Accepted: 6 December 2019 / Published: 10 December 2019
(This article belongs to the Section Environmental Sustainability and Applications)

Abstract

:
The Pantanal biome integrates the lowlands of the Upper Paraguay Basin (UPB), which is hydrologically connected to the biomes of the Cerrado and Amazon (the highlands of the UPB). The effects of recent land-cover and land-use (LCLU) changes in the highlands, combined with climate change, are still poorly understood in this region. Here, we investigate the effects of soil erosion in the Brazilian Pantanal under climate and LCLU changes by combining different scenarios of projected rainfall erosivity and land-cover management. We compute the average annual soil erosion for the baseline (2012) and projected scenarios for 2020, 2035, and 2050. For the worst scenario, we noted an increase in soil loss of up to 100% from 2012 to 2050, associated with cropland expansion in some parts of the highlands. Furthermore, for the same period, our results indicated an increase of 20 to 40% in soil loss in parts of the Pantanal biome, which was associated with farmland increase (mainly for livestock) in the lowlands. Therefore, to ensure water, food, energy, and ecosystem service security over the next decades in the whole UPB, robust and comprehensive planning measures need to be developed, especially for the most impacted areas found in our study.

1. Introduction

The Pantanal biome (lowlands) is one of the largest wetlands in the world [1]; however, this biome has been affected by intense land-cover and land-use (LCLU) changes that have taken place mainly in the highlands (Amazon and Cerrado biomes) of the Upper Paraguay Basin (UPB). This is happening because there is an interconnection between the highlands and lowlands in the UPB. For instance, during the rainy season, the Pantanal serves as a large reservoir that stores water from the surrounding plateaus, and subsequently, slowly delivers it to the lower sections of the Paraguay River. Therefore, water erosion processes are dependent on hydrological and climatic conditions, and can affect local ecology and the socioeconomic relationships of the basin [2].
The Cerrado biome (highlands) distributes fresh water to the largest basins in Brazil and South America, including São Francisco, Tocantins, Paraná, and Paraguay [3]. In this context, the Cerrado is the major producer of water and sediment, which are transported towards the Pantanal. However, human activities (e.g., agriculture intensification, industries, and hydropower plants) have accelerated the erosive processes, mainly through the removal of vegetation cover, soil exposure, and the transport of organic matter and fine particles such as silt and clay. LCLU without planning in the highlands might indicate the onset of decreases in water-food-energy security in the UPB as a probable response to soil erosion increases in the Cerrado and Amazon biomes. Certainly, such changes have significant consequences for the Pantanal, mainly because of sediment delivery and the loss of the soil fertile layer.
Soil erosion can also be affected by climate changes [4]. Changes in temperature and precipitation patterns impact plant biomass production, infiltration rates, soil moisture, land use, and crop management [5]. Therefore, one of the greatest challenges for Brazil is to reconcile environmental conservation with food-energy production and to simultaneously maintain ecosystem services, even under a changing climate [6]. However, to the best of our knowledge, no investigation has been carried out about the effects of climate and LCLU changes on soil erosion across the UPB. Some studies have generally evaluated rainfall seasonality and its effects on the Pantanal [2,7,8]. Another study analyzed the effects of highland land-use over the Brazilian Pantanal, and concluded that such land use already posed a real threat due to the advancement of agroecosystems in the highlands resulting in higher inputs of water, sediment, and nutrients to the Pantanal lowlands [9].
The objective of this study is to investigate the effects of soil erosion across the UPB under climate and LCLU changes. To compute the average annual soil erosion, we used the Revised Universal Soil Loss Equation (RUSLE). RUSLE is the revised version of the Universal Soil Loss Equation (USLE) [10], and is the most widely-used soil erosion model in the world [11]. This model is composed of six factors that make it possible to estimate the average annual soil loss: rainfall erosivity factor (R); soil erodibility factor (K); slope length factor (L); slope steepness factor (S); land cover and management factor (C); and conservation practices factor (P). Although there are some physical-based soil erosion models, such as the Water Erosion Prediction Model (WEPP) [12], the Limburg Soil Erosion Model (LISEM) [13], and the European Soil Erosion Model (EUROSEM) [14], the RUSLE has been considered a useful and efficient, simple tool because it can represent the spatial distribution of soil loss in large areas with the use of data that can be obtained by remote sensing [11,15]. We used an R-factor obtained from precipitation data from the Eta regional climate model (Eta/HadGEM2-ES and Eta/MIROC5, RCP 4.5 and 8.5) and LCLU maps (reference and low carbon scenarios) from the OTIMIZAGRO model to estimate the C-factor. We computed soil erosion for the baseline (2012) and projected scenarios for 2020, 2035, and 2050. Then, we evaluated the areas that would be most impacted by erosion under climate and LCLU projections.

2. Materials and Methods
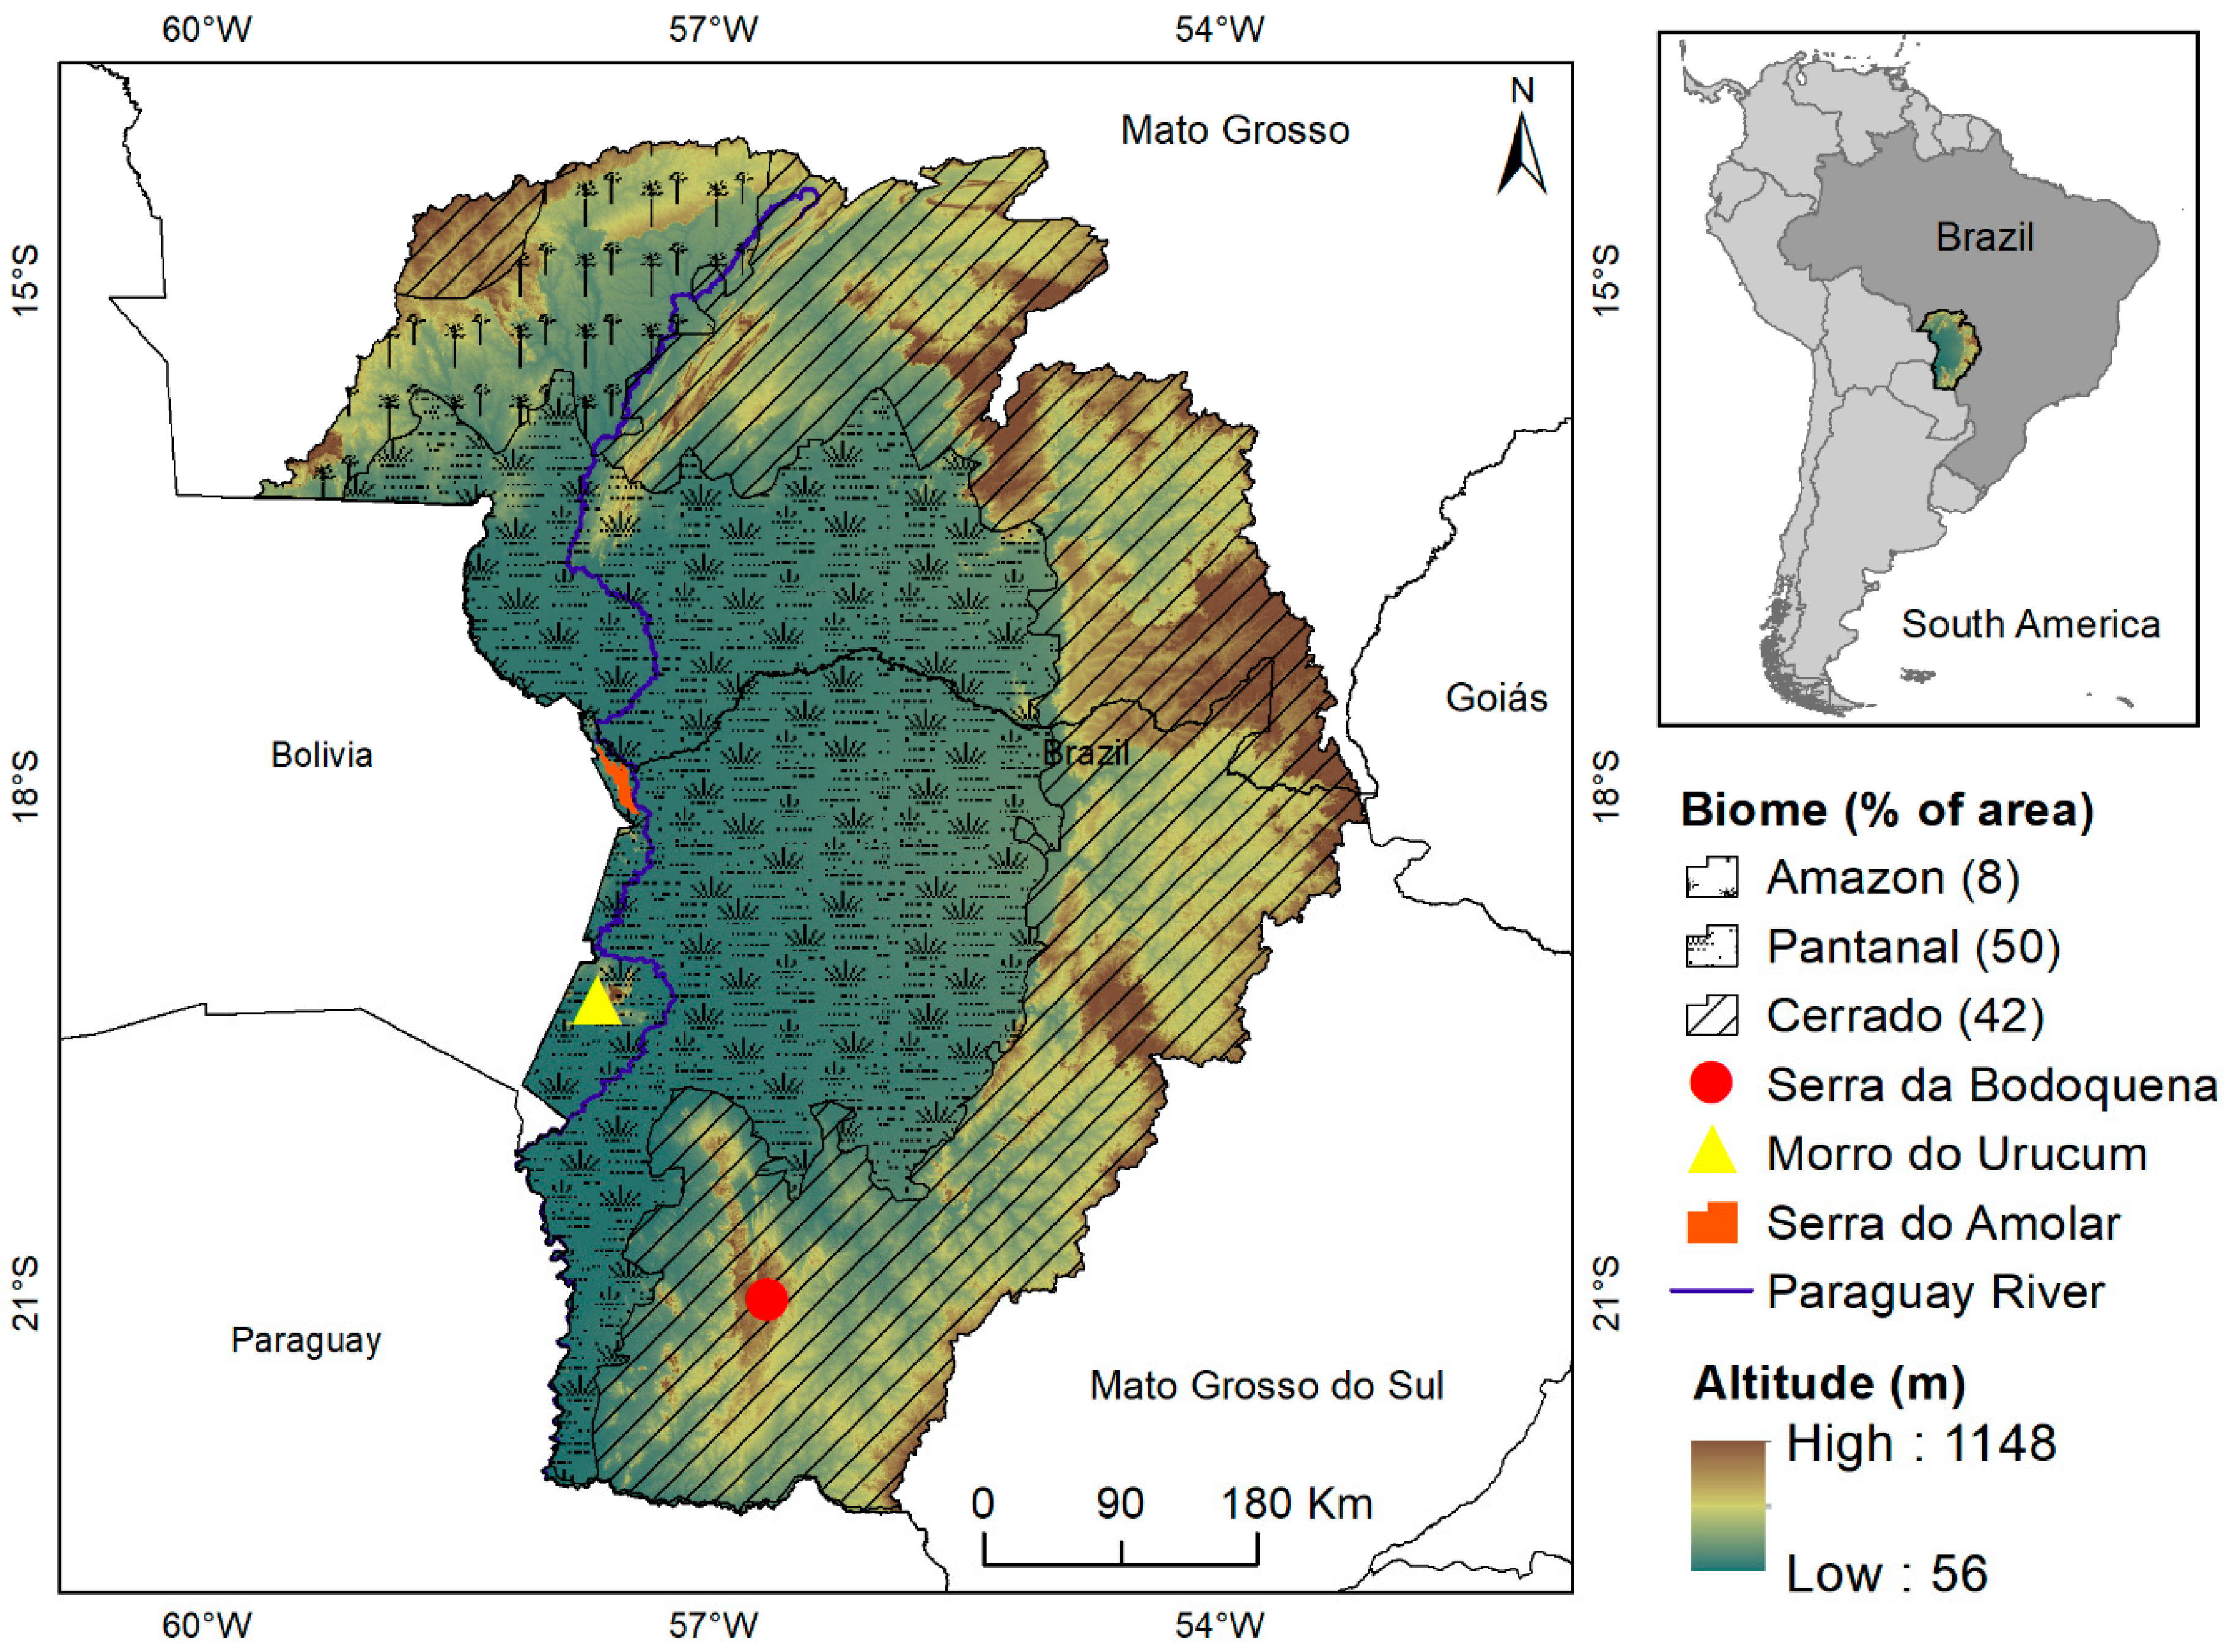
2.1. Study Area

The study area is the Upper Paraguay Basin (UPB), a tributary basin of the Paraguay river basin. The UPB lies within the states of Mato Grosso and Mato Grosso do Sul, covering a total area of 362,380 km2 (Figure 1). The UPB has two main relief types, i.e., highlands above 200 m altitude, reaching ~1100 m, located in the Cerrado (50% of total area) and Amazon (8%) biomes, and lowlands, with elevation ranges from sea level to up to 200 m, located in the Pantanal biome (42%). The predominant climate in the UPB according to the Köppen climate classification system is Aw, i.e., a Savanna Climate, with average temperatures ranging from 22.5 to 26.5 °C [16]. The average annual precipitation ranges from 800 mm to 2000 mm, with well-defined rainy (October to March) and dry (April to September) seasons. The lower values of average annual precipitation (below 800 through 1200 mm) occur in the region of the lowlands (Pantanal). The highest average annual precipitation (> 1200 mm) is in the northwest, in the border of the Cerrado and the Amazon Forest biomes.
The Brazilian Savanna (Cerrado) is the second-largest biome in South America (covering 22% of the total area of Brazil), and is also one of 25 global biodiversity hotspots [17]. This biome plays an important role in water-food-energy supply in Brazil [3,18]; however, undisturbed areas of the Cerrado have been replaced by farmland over recent decades [19,20]. On the other hand, the Amazon biome is the largest Brazilian biome, and although it is included in only a small portion of the UPB, it is an important region in Brazil. While this biome is well preserved and has a seen reductions in deforestation due to increased forest governance, it still has millions of native forests that could be legally deforested, undesignated land that can be exploited, as well as areas that are subject to continued illegal deforestation where many owners have not restored them [21,22].

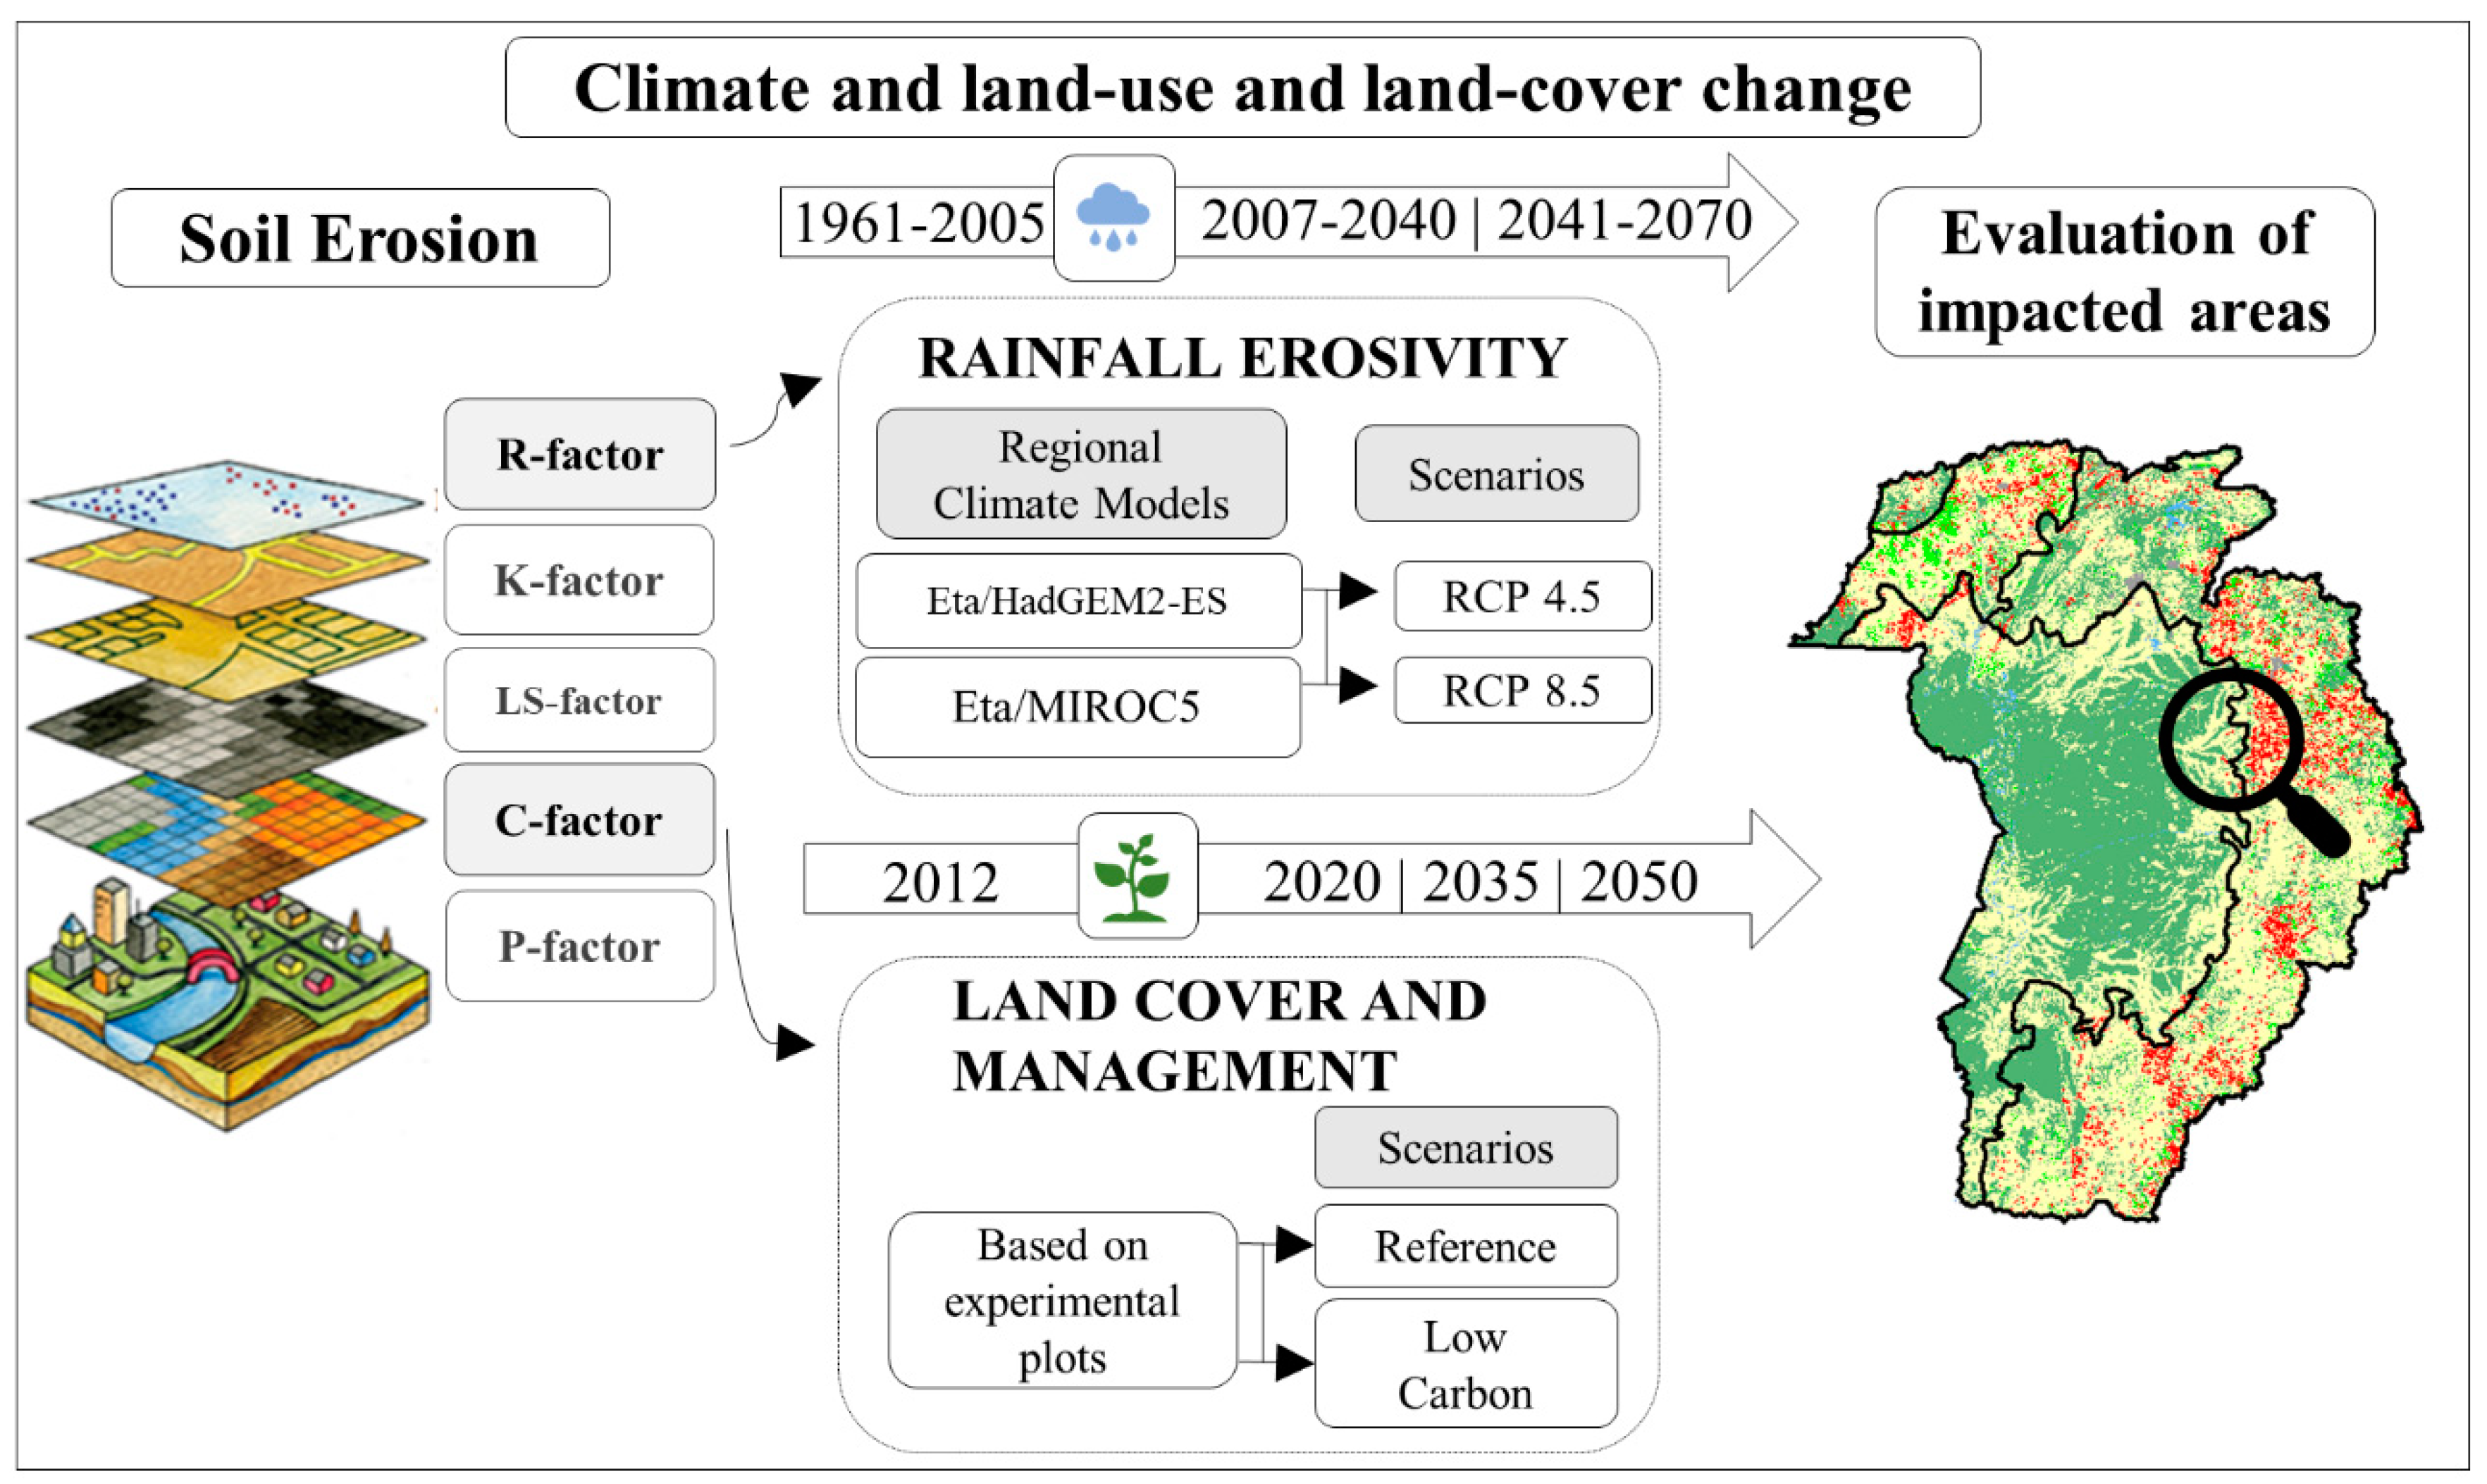
2.2. Study Delineation

The USLE and the Revised USLE (RUSLE) are the most widely-applied soil erosion prediction models for a variety of purposes [23]. We chose the RUSLE model due to the flexibility of adapting it to nearly every kind of condition and region around the world [24], as well as the possibility of obtaining factors from remote sensing [25,26,27].
Figure 2 shows the study delineation. First, we used rainfall erosivity (R-factor) estimated from precipitation data from the Eta regional climate model, nested in two Global Climate Models (GCM) forced by two Representative Concentration Pathways (RCPs) (Eta/HadGEM2-ES and Eta/MIROC5, RCP 4.5 and 8.5) [28], as well as land-use and land-cover change (LCLU) projections (reference and low carbon scenarios) from the OTIMIZAGRO model [6] to estimate land cover and management factors (C-factor) (Section 2.2.1). The study was carried out using a control period of soil loss that we call “baseline” (for R-factor: 1961–2005; for C-factor: 2012), and a simulation of future scenarios of soil loss (for R-factor: 2007-2070; for C-factor: 2020, 2035 and 2050) that we refer to as projected scenarios (Figure 2). The other four RUSLE factors (K, L, S, and P) were generated and kept constant in all the soil loss scenarios (Section 2.2.2). Finally, we evaluated the areas which were likely to be most impacted by soil erosion in the UPB (Section 2.2.3).

2.2.1. Computing the R- and C-Factors

We used rainfall erosivity (R-factor) values obtained from a reliable study by Almagro et al. [28], carried out using high-resolution data available for Brazil. The authors computed the R-factor using bias-corrected rainfall data for 1961–2005 and projected the periods of 2007–2040, 2041–2070, and 2071–2099 across Brazil. The data come from downscaled data based on the Hadley Center Global Environment Model, version 2 (Eta/HadGEM2-ES) and the Model for Interdisciplinary Research on Climate, version 5 (Eta/MIROC5), forced by Representative Concentration Pathways 4.5 and 8.5. The RCP 4.5 is a medium-low stabilization scenario of the concentration of CO2, while RCP 8.5 is the scenario with the highest greenhouse gas emissions. They validated their findings from observed local R-factor values, obtaining suitable performance values of R2, RMSE, NSE of 0.85, 1,999 MJ mm ha−1 h−1 yr−1, 0.66, respectively for Eta/HadGEM2-ES and 0.99, 2,075 MJ mm ha−1 h−1 yr−1, 0.63, respectively for Eta/MIROC5 [28].
We estimated C-factor values based on experimental plots [29] and then attributed these values to the land-cover and land-use (LCLU) classes developed by Soares-Filho et al. [6,30] (see Figure 3c). The projections of LCLU changes are based on the contribution of agriculture, forestry, and other land use (AFOLU) activities to Greenhouse Gas Emissions (GHG). In these projections, two scenarios are considered. The first is called the reference (REF) scenario and is characterized by the development of AFOLU activities without significant changes in their trajectory. The second, the low carbon (LC) scenario, includes technically possible mitigation measures to be implemented, and considers the transition towards lower carbon intensity practices for the activities.

2.2.2. Computing Four Other RUSLE Factors

We obtained K-factor values from local studies conducted in different Brazilian soil types and attributed these values to the soil class map developed for the UPB [31], classified according to the World Reference Base (WRB), the international standard for soil classification, endorsed by the International Union of Soil Sciences [32] (see Table 1).
Figure 3a shows the soil types (K-factor values for each soil are presented in Table 1) found in the UPB, where we noted that the highest values are in Podzols and Arenosols, respectively. These soils have many particles (sand and silt) that are easily detached and carried away. The erodibility of Acrisols is 0.0466 t h MJ−1 mm−1, corresponding to 16% of the total area, located mainly in the highlands and on the border between the biomes (Cerrado-Pantanal). In general, well-drained soils with high clay contents and which are rich in nutrients (e.g. Acrisols, Ferralsols, Nitisols) have lower erodibility values and are the most attractive areas for croplands [38].
We computed the LS-factor using a Digital Elevation Model (DEM) with 90 m spatial resolution based on a vegetation correction of the Shuttle Radar Topography Mission (SRTM) [39], so-called Bare-Earth SRTM developed from O’ Loughlin et al. [40]. The LS-factor is computed for each pixel of the DEM, where the L-factor is expressed as Desmet and Govers [41]:
L i j i n = [ ( A i j i n + D 2 ) m + 1   A i j i n m + 1 ] ( D m + 2 ) × ( x i j m ) × ( 22.13 m )
where L i j i n   =   slope length for grid cell ( i , j ),   A i j i n   = contributing area at the inlet of the grid cell with coordinates ( i , j ) (m2),   D   = grid cell size (m),   m   = length exponent of the USLE L-factor,   x i j   = ( sin α i , j +   cos α i , j ), α i , j = aspect direction for the grid cell with coordinates ( i , j ). In the RUSLE, (m) varies according to the ratio of the rill and inter-rill erosion (β).
m = β / ( 1 + β )
where β varies according to the slope gradient [42]. The β value is obtained by:
β = ( sin θ 0.0896 ) / [ 3 ( sin θ ) 0.8 + 0.56 ]
The slope steepness (S) was calculated following McCool et al. [43].
S = 10.8 sin θ + 0.03   ( S   <   9 % )
S = 16.8 sin θ 0.50   ( S     9 % )
where θ is the slope in degrees.
The mean LS-factor of 1.67± 4.6 is in agreement with that reported by Galdino [44], who found a mean value of 1.27 ± 3.10 for the UPB. This slight difference may have occurred because we used an improved DEM where the vegetation effect in the SRTM data had been removed [40]. We noted that the lowest LS-factors are located in the Pantanal and the highest in the borders of the UPB, mainly in the Cerrado, which presents the highest elevation (> 500 m) (Figure 3b). There are also high LS-factor values in some plateau areas, such as in “Serra da Bodoquena”, “Morro do Urucum”, and “Serra do Amolar” (Mato Grosso do Sul State). LS-factor values lower than 1 were found in 55% of the UPB, mainly in areas located in the Pantanal.
Figure 3c shows the distribution of the C-factor in the studied basin according to the land covers: water (0); savanna and forest (0.013); pasture (0.02); planted forest (0.03); urban area (0.03); agriculture (0.14); and regeneration (0.02). The highest C-factor values are predominantly in the eastern UPB, where there is a predominance of agriculture in the Cerrado and Amazon biomes. Finally, we assigned a value of 1 to the P-factor considering the non-existence of conservation practices in the study area.

2.2.3. Soil Erosion Simulations

To estimate the average annual soil loss in the UPB, we used the Revised Universal Soil Loss Equation (RUSLE) [45] implemented in the GISus-M [46] on the 250 × 250 m grid cell basis. All six RUSLE factors were computed considering the local/regional characteristics (Equation (1)):
A   =   R ×   K   ×   L S × C ×   P
where A : average annual soil loss (t ha−1 yr−1), R : rainfall erosivity factor (MJ mm ha−1 h−1 yr−1), K : soil erodibility factor (t h MJ−1 mm−1) , L S : topographic factor (dimensionless), C : land cover and management factor (dimensionless), and P : conservation practice factor (dimensionless).
To simulate scenarios of average annual soil loss, we varied the R and C factors of the RUSLE. In total, 24 soil loss projections were generated, combining baseline scenarios with each other and R-factors projected (RCP 8.5 and RCP 4.5; periods 2012–2050) with C-factors projected (REF and LC; periods 2020, 2035, and 2050) by the other RUSLE factors (Table 2). In this paper, we focus our discussion on the three best and worst combination scenarios for soil erosion.
To understand the effects of the R- and C-factor changes in the soil erosion between periods baseline and projected, we compute the percent change of the soil erosion caused by each projected period (Equation (6)).
Δ V A i = R i + 1   × K × L S ×   C i + 1 × P     R i   × K × L S ×   C i × P R i   × K × L S ×   C i × P
where Δ V A i is the percent change of the soil erosion for each projected period; R i and C i are the R-factor and C-factor, respectively; and i refers to the years projected: 2020, 2035, and 2050.

3. Results and Discussion
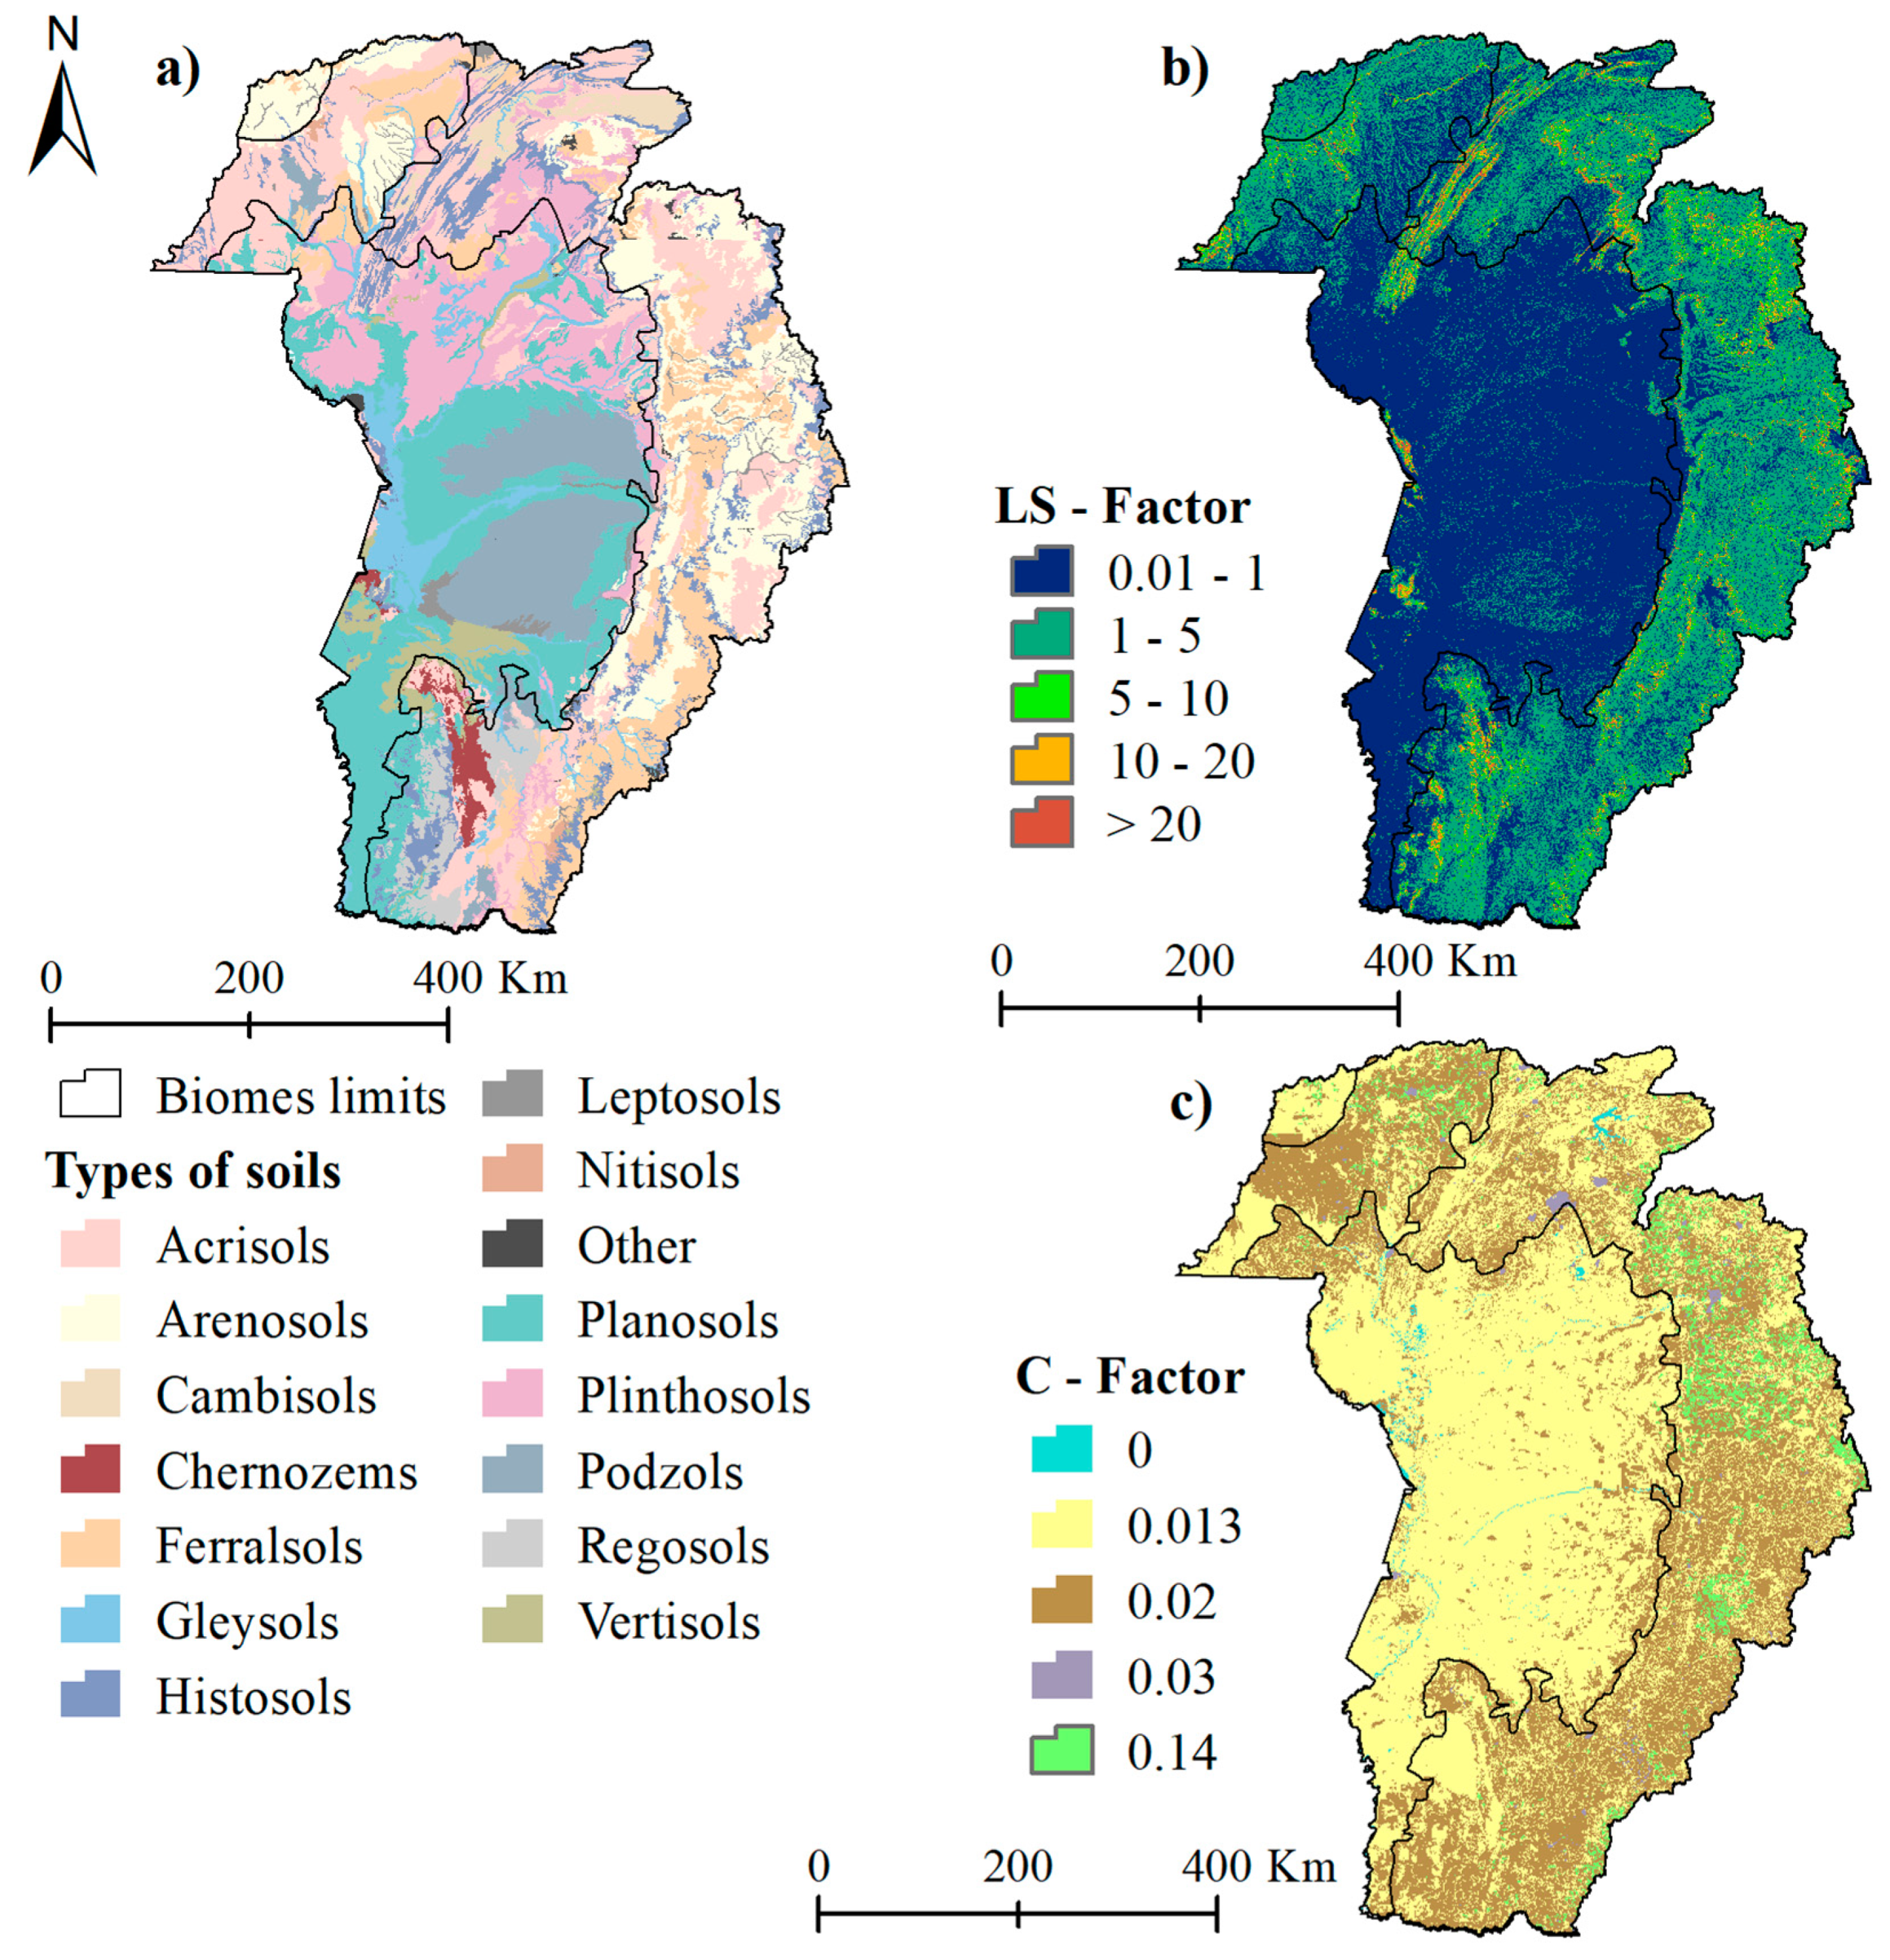
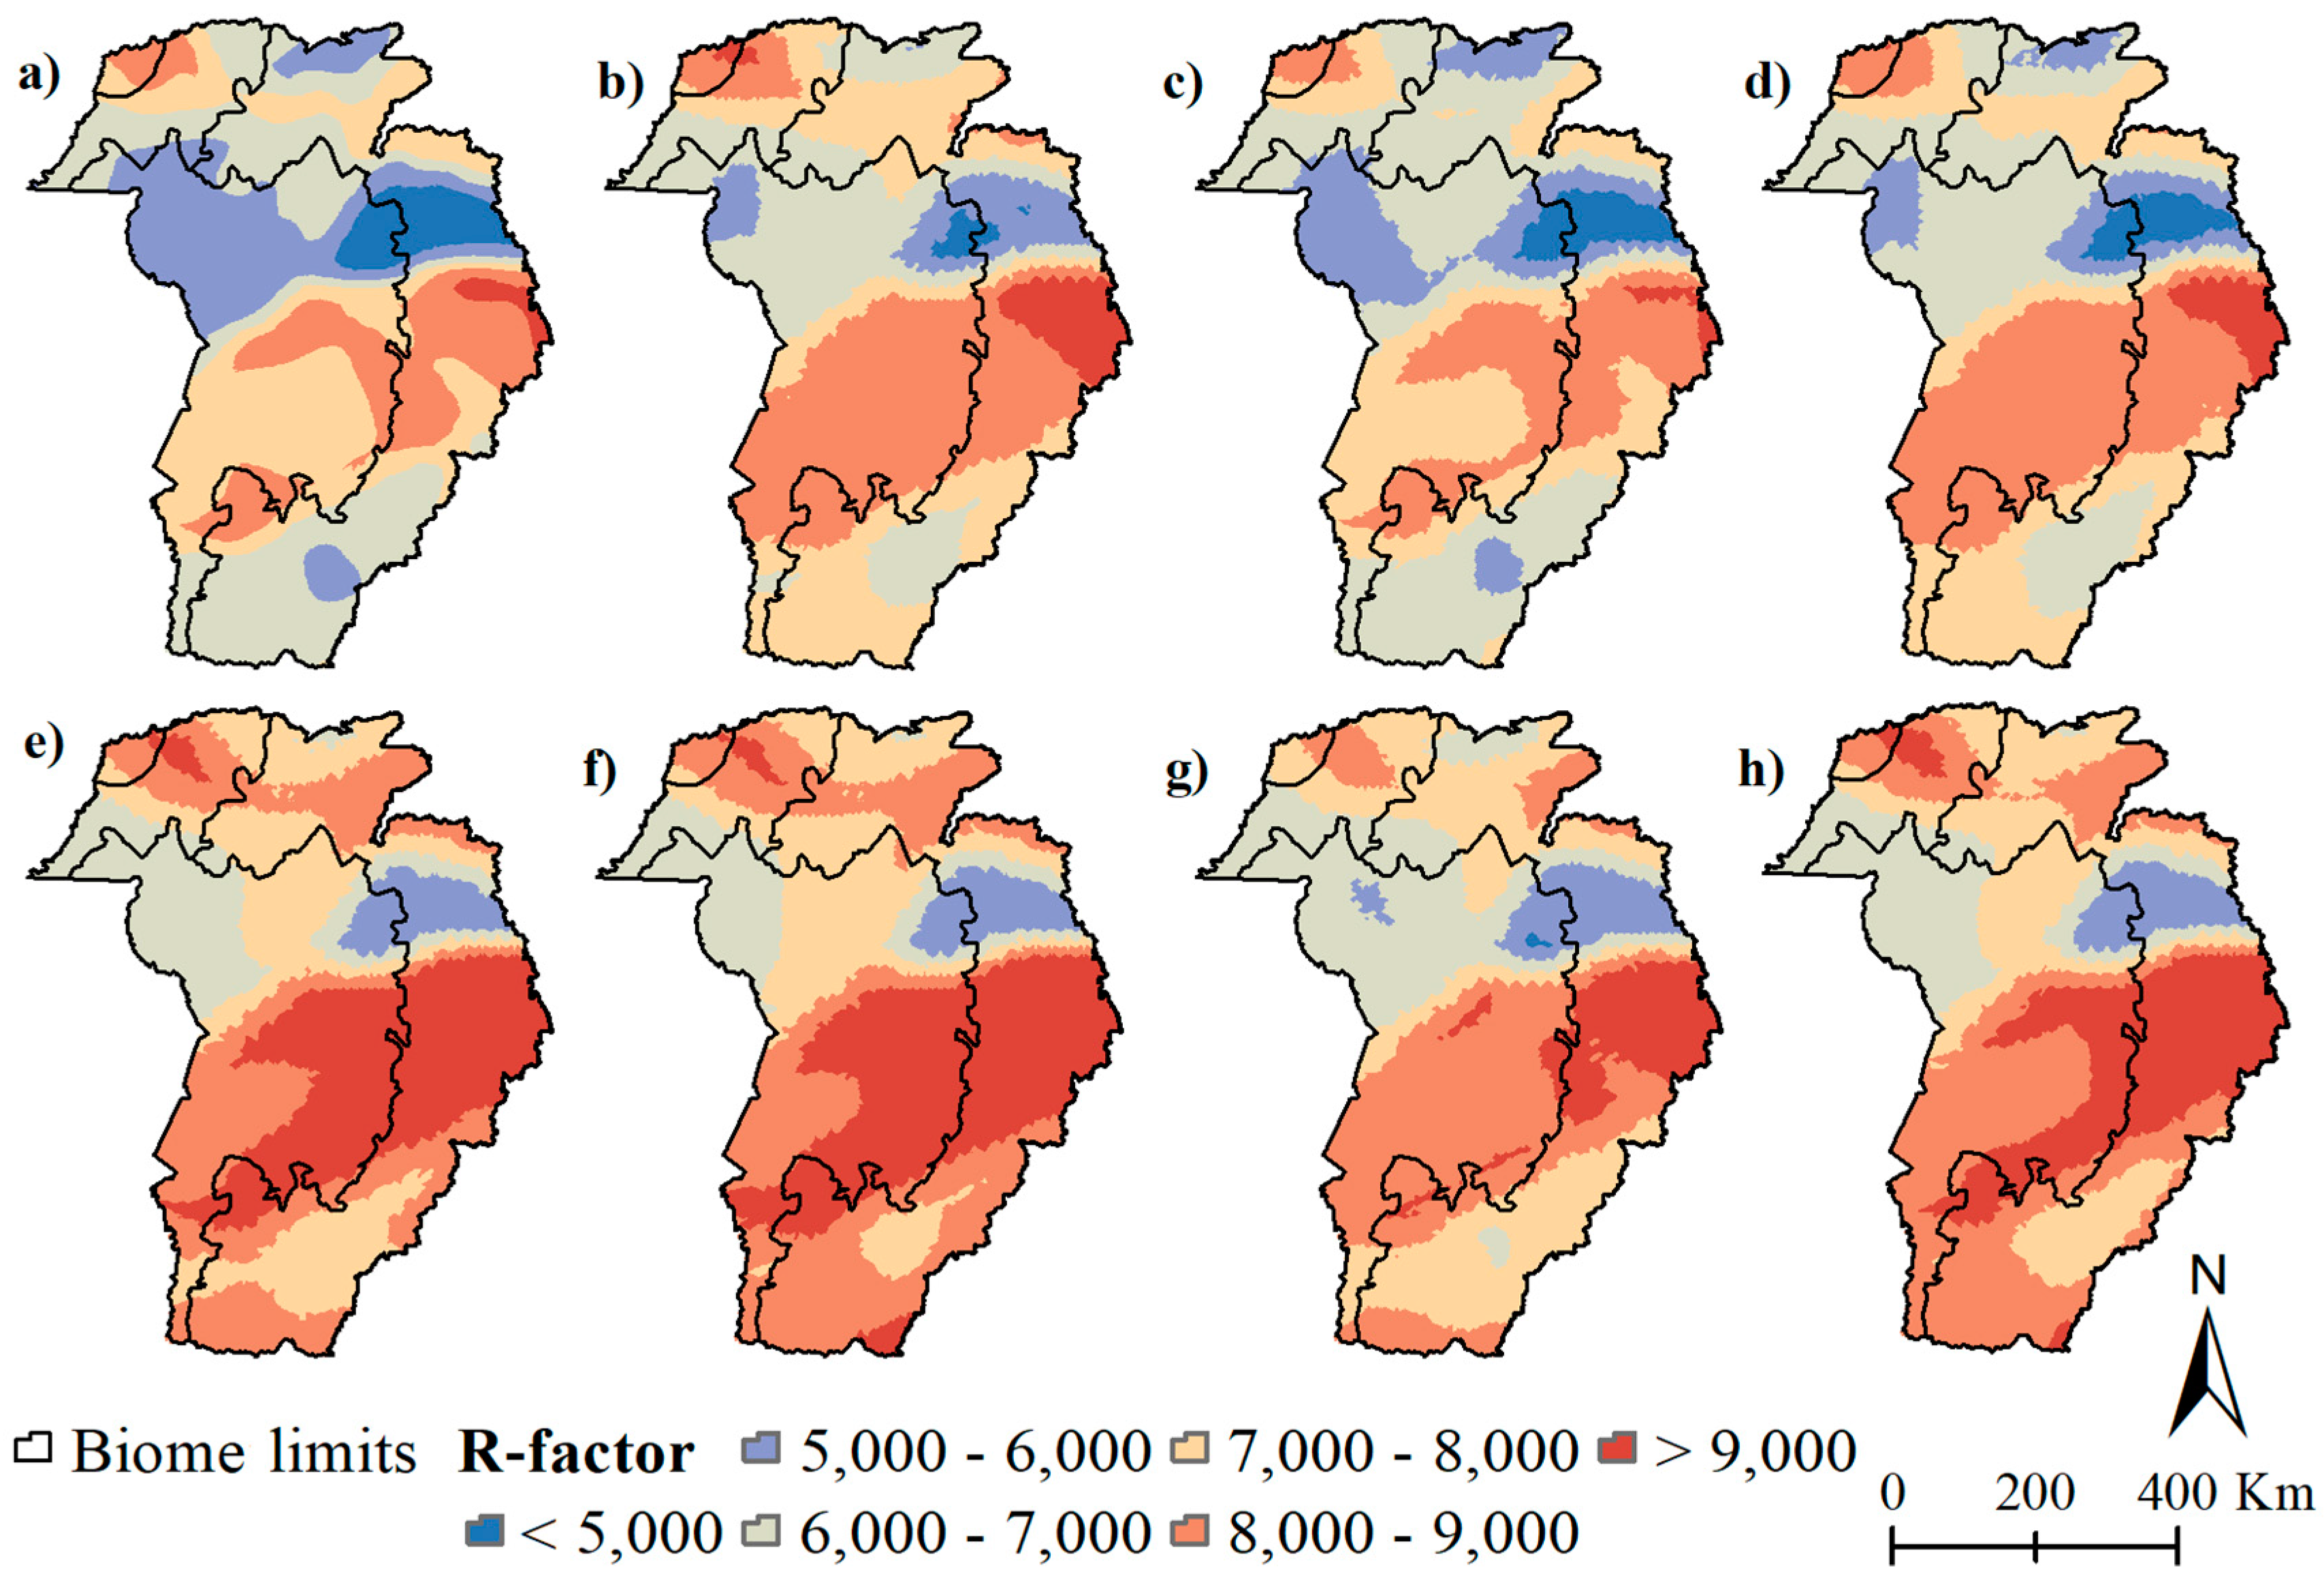
3.1. RUSLE Factors

Table 3 shows the rainfall erosivity (R-factor) for the baseline and projection periods in the Upper Paraguay Basin (UPB). Our findings corroborate the range of R-factor values reported by previous studies in the Central-West region of Brazil [28,47]. We noted the highest R-factor values in the eastern and central part (highlands), while the lowest values are in the western part (lowlands) of the UPB (Figure 4). We found that the Eta/HadGEM2-ES model presents lower values than the Eta/MIROC5 for both RCPs 4.5 and 8.5 scenarios.
The highest values of erosivity were found in the central and southeastern parts of the UPB, specifically, in the regions of the Pantanal and Cerrado (Figure 4). The highest R-factor values (~8,000 MJ mm ha−1 h−1 yr−1) were highlighted in red in all the projections. The lowest values were attained for Eta/HadGEM2-ES in the north of the basin (see Figure 4a). We noted an average decrease in the R-factor across the UPB comparing the baseline and projected periods. This was due to the fact that the used regional climate model projections generated a decrease in rainfall, and consequently, in the R-factor (see Almagro et al. [28]). However, it is important to note that there are R-factor estimates within the UPB with higher values than those found in most parts of the world [48]. High soil erosion values are associated with the high intensity, duration, and frequency of precipitation found in this region [49].
Figure 5 shows land-cover and land-use changes in the UPB for the baseline (2012) and projections based on reference (b, c, and d) and low carbon (e, f, and g) scenarios for 2020, 2035, and 2050.

3.2. Average Annual Soil Loss Estimation

We estimated the average annual soil loss from the RUSLE model on 250x250 m grid cell basis for the UPB. The average soil loss baseline obtained from the reference scenario (REF) combined with the Eta/HadGEM2-ES and Eta/MIROC5 baseline models were 18.52 ± 61 t ha−1 yr−1 and 19.42 ± 39 t ha−1 yr−1, respectively. In a global study, Sartori et al. [50] reported that the highest productivity losses occurred in areas with average annual soil losses greater than 11 t ha−1 yr−1. Therefore, our results indicate that there is a high level of soil erosion in the UPB that led to losses in agricultural productivity and ecosystem services in this region.
Projections of 2020, 2035, and 2050 show the lowest average soil loss derived from the Eta/HadGEM2-ES model combined with the low carbon (LC) scenario of LCLU, while the greatest average soil loss estimates are the combination between the Eta/MIROC5 model and reference (REF) scenario of LCLU (Table 4). We noted that the low carbon scenario, considered to be a more optimistic scenario, is associated with the best scenarios (Table 4a), i.e. low average soil loss, while the reference scenario was associated with the worst scenarios (Table 4b).
We found the best scenario for 2050 using the RCP 8.5, that should present the worst scenario, mainly because this is the most pessimistic climate-change scenario, with an average warming at the end of the 21st century of approximately 4 °C. However, the RCP 8.5 scenario from both Eta/HadGEM2- ES and Eta/MIROC5 showed a significant decrease in rainfall for the studied region, and consequently, a reduction in rainfall erosivity, as discussed in Almagro et al. [28]. Therefore, we noted the highest values of rainfall erosivity and soil loss by using the RCP 4.5 in the UPB.
Marengo et al. [2] reported that the average annual temperature in the Pantanal may rise by 2–3 °C in 2040. Although there are uncertainties in the projections, the models indicate that this increase in temperature may cause a reduction in rainfall in this region, especially during the winter [2]. The reduction in rainfall amounts can also occur due to deforestation in the Amazon. Reduced moisture fluxes on the Amazon surface have the potential to decrease moisture transfer to the southeast and south of Brazil, and to areas such as the Pantanal and the Chaco, Bolivia, Paraguay, and Argentina [51]. A recent study by Bergier et al. [7] reinforces the importance of the Amazon rainforest in redistributing water in South America. They explain that deforestation can delay the rainfall in southern Amazonia, causing implications in the tropospheric transfer of moisture, which can critically affect the water security of the Pantanal wetland [8].
Our results indicate an increase in the average annual soil loss over time in the UPB (2020 to 2050). This happens mainly because the LCLU projections suggest an agriculture expansion in the highlands and bovine livestock intensification (using native and cultivated pasture) in the lowlands. These findings corroborate previous studies that have shown the effects of the expansion of agriculture on hydrological trade-offs [3,52,53] and soil erosion in the Brazilian Cerrado [29]. In the Pantanal, previous investigations have discussed government incentives for bovine livestock intensification [54,55]; however, for the first time, we have shown the consequences of this intensification on soil erosion across the UPB.

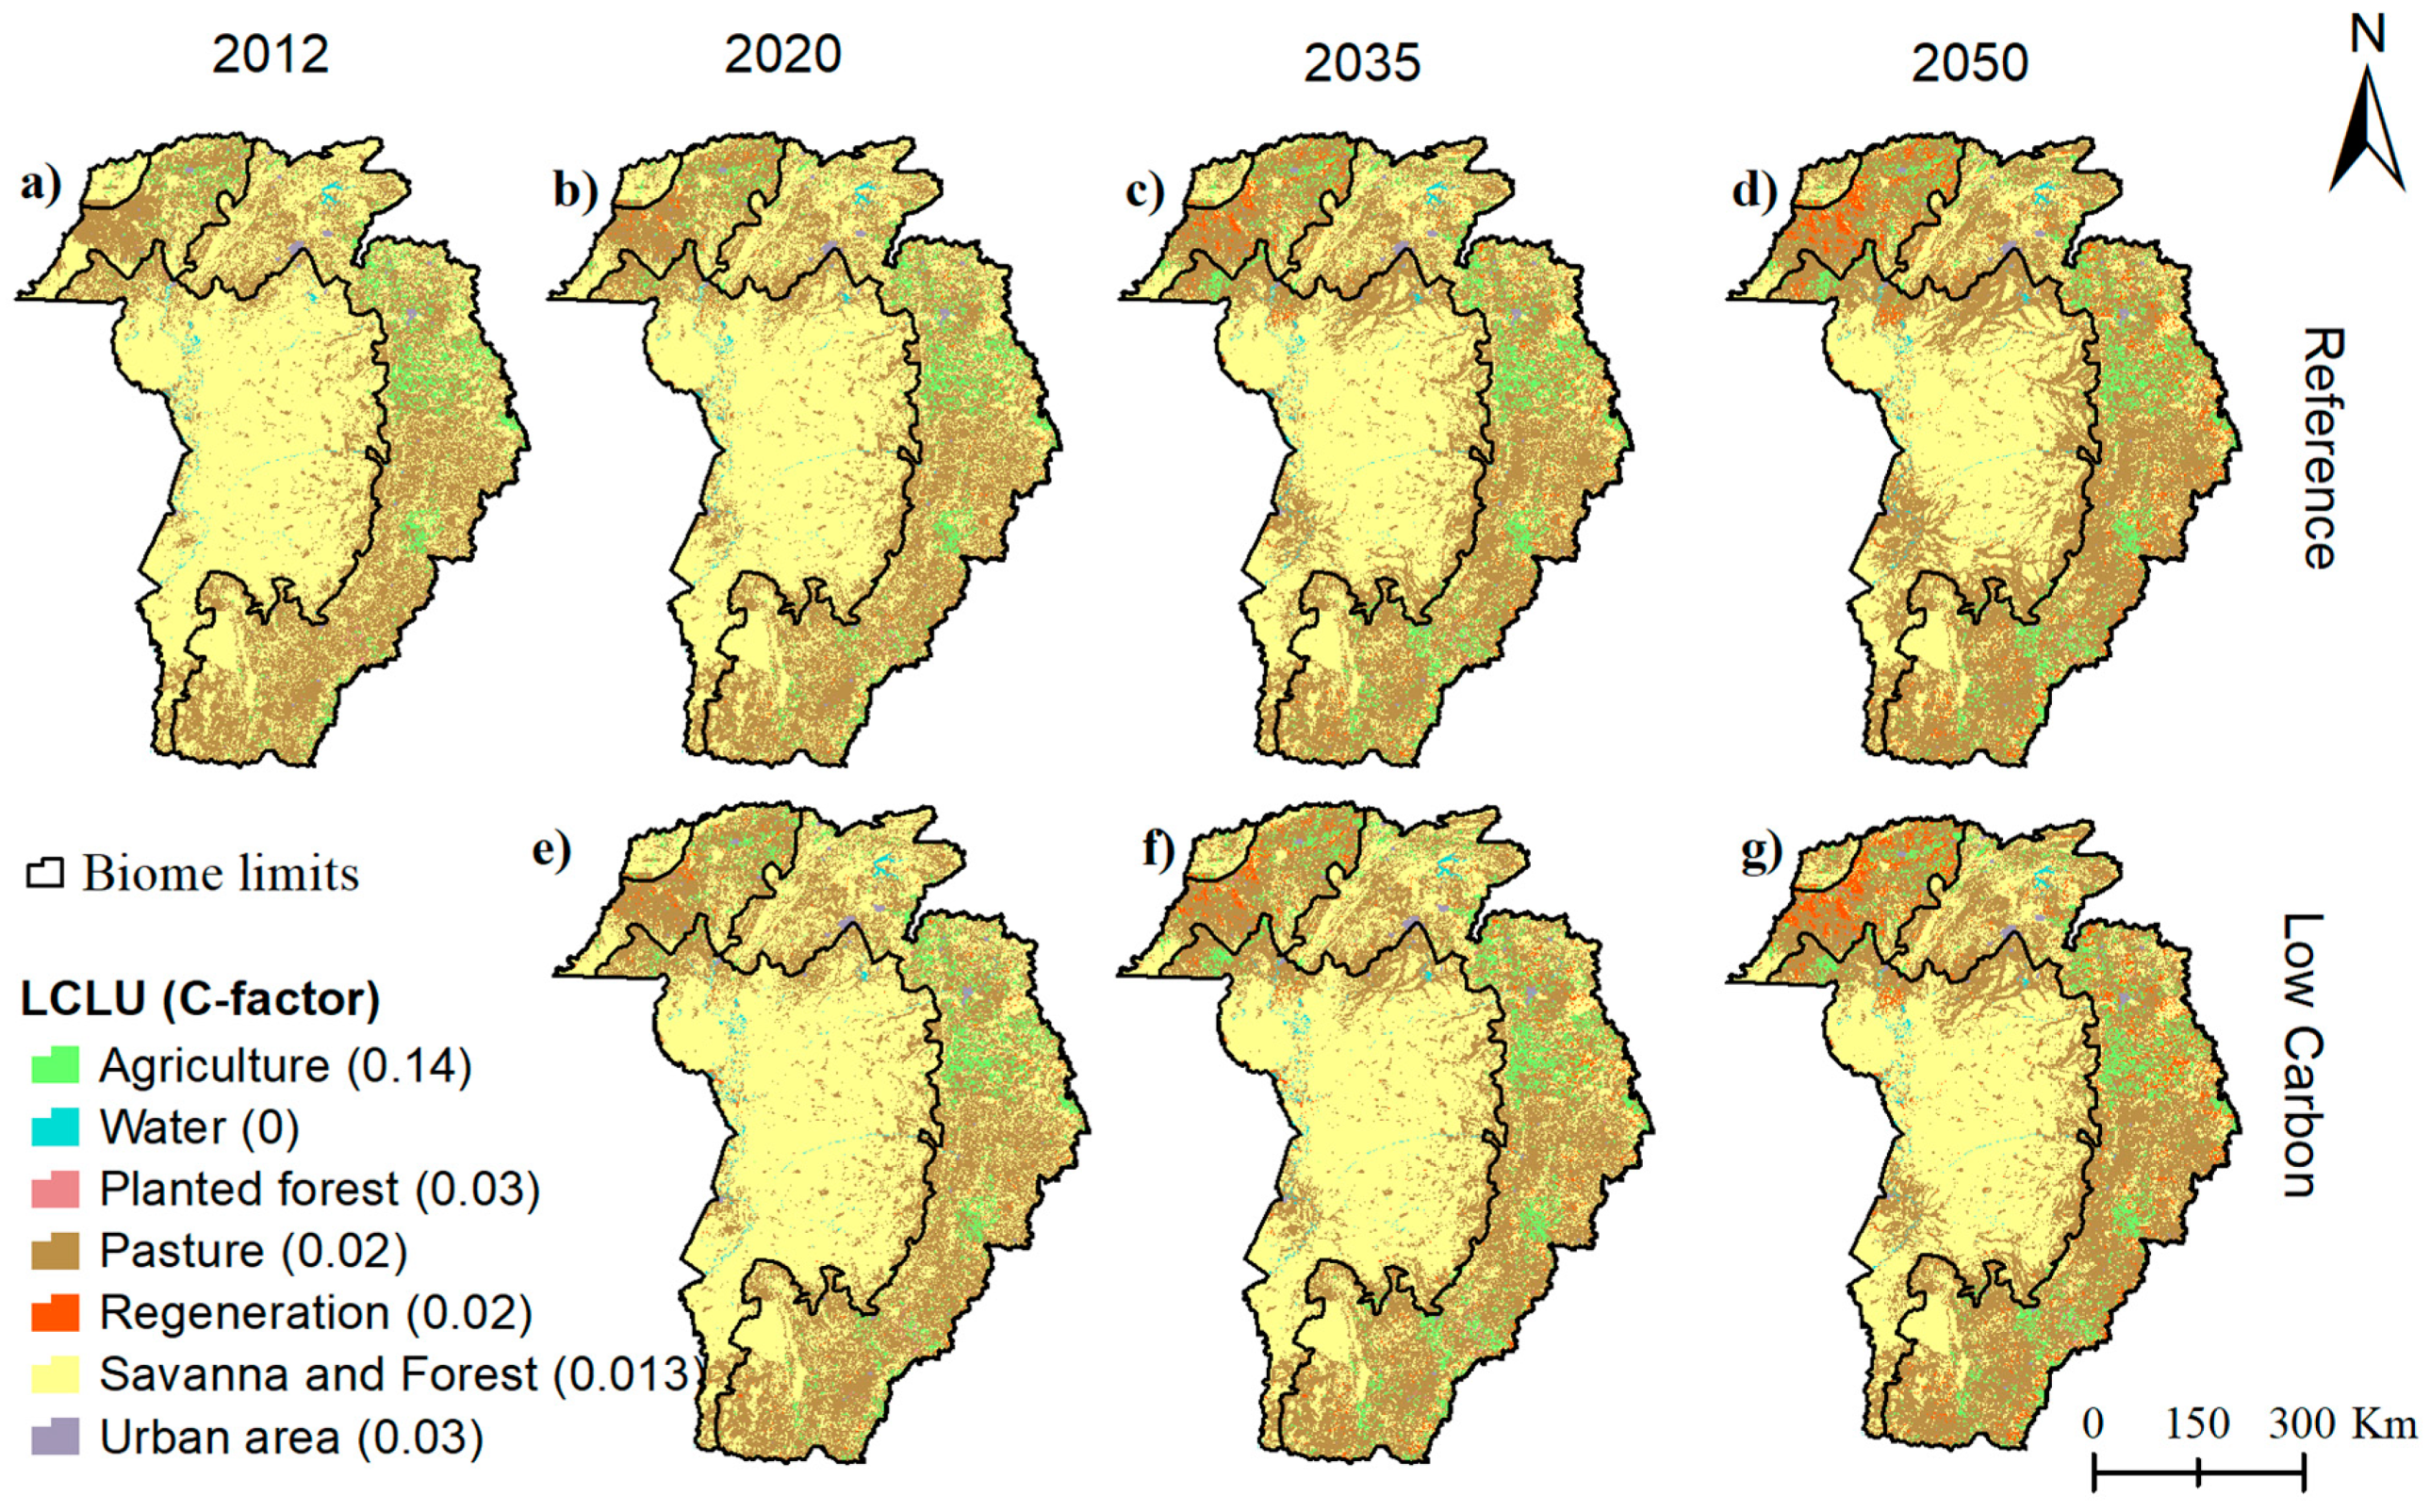
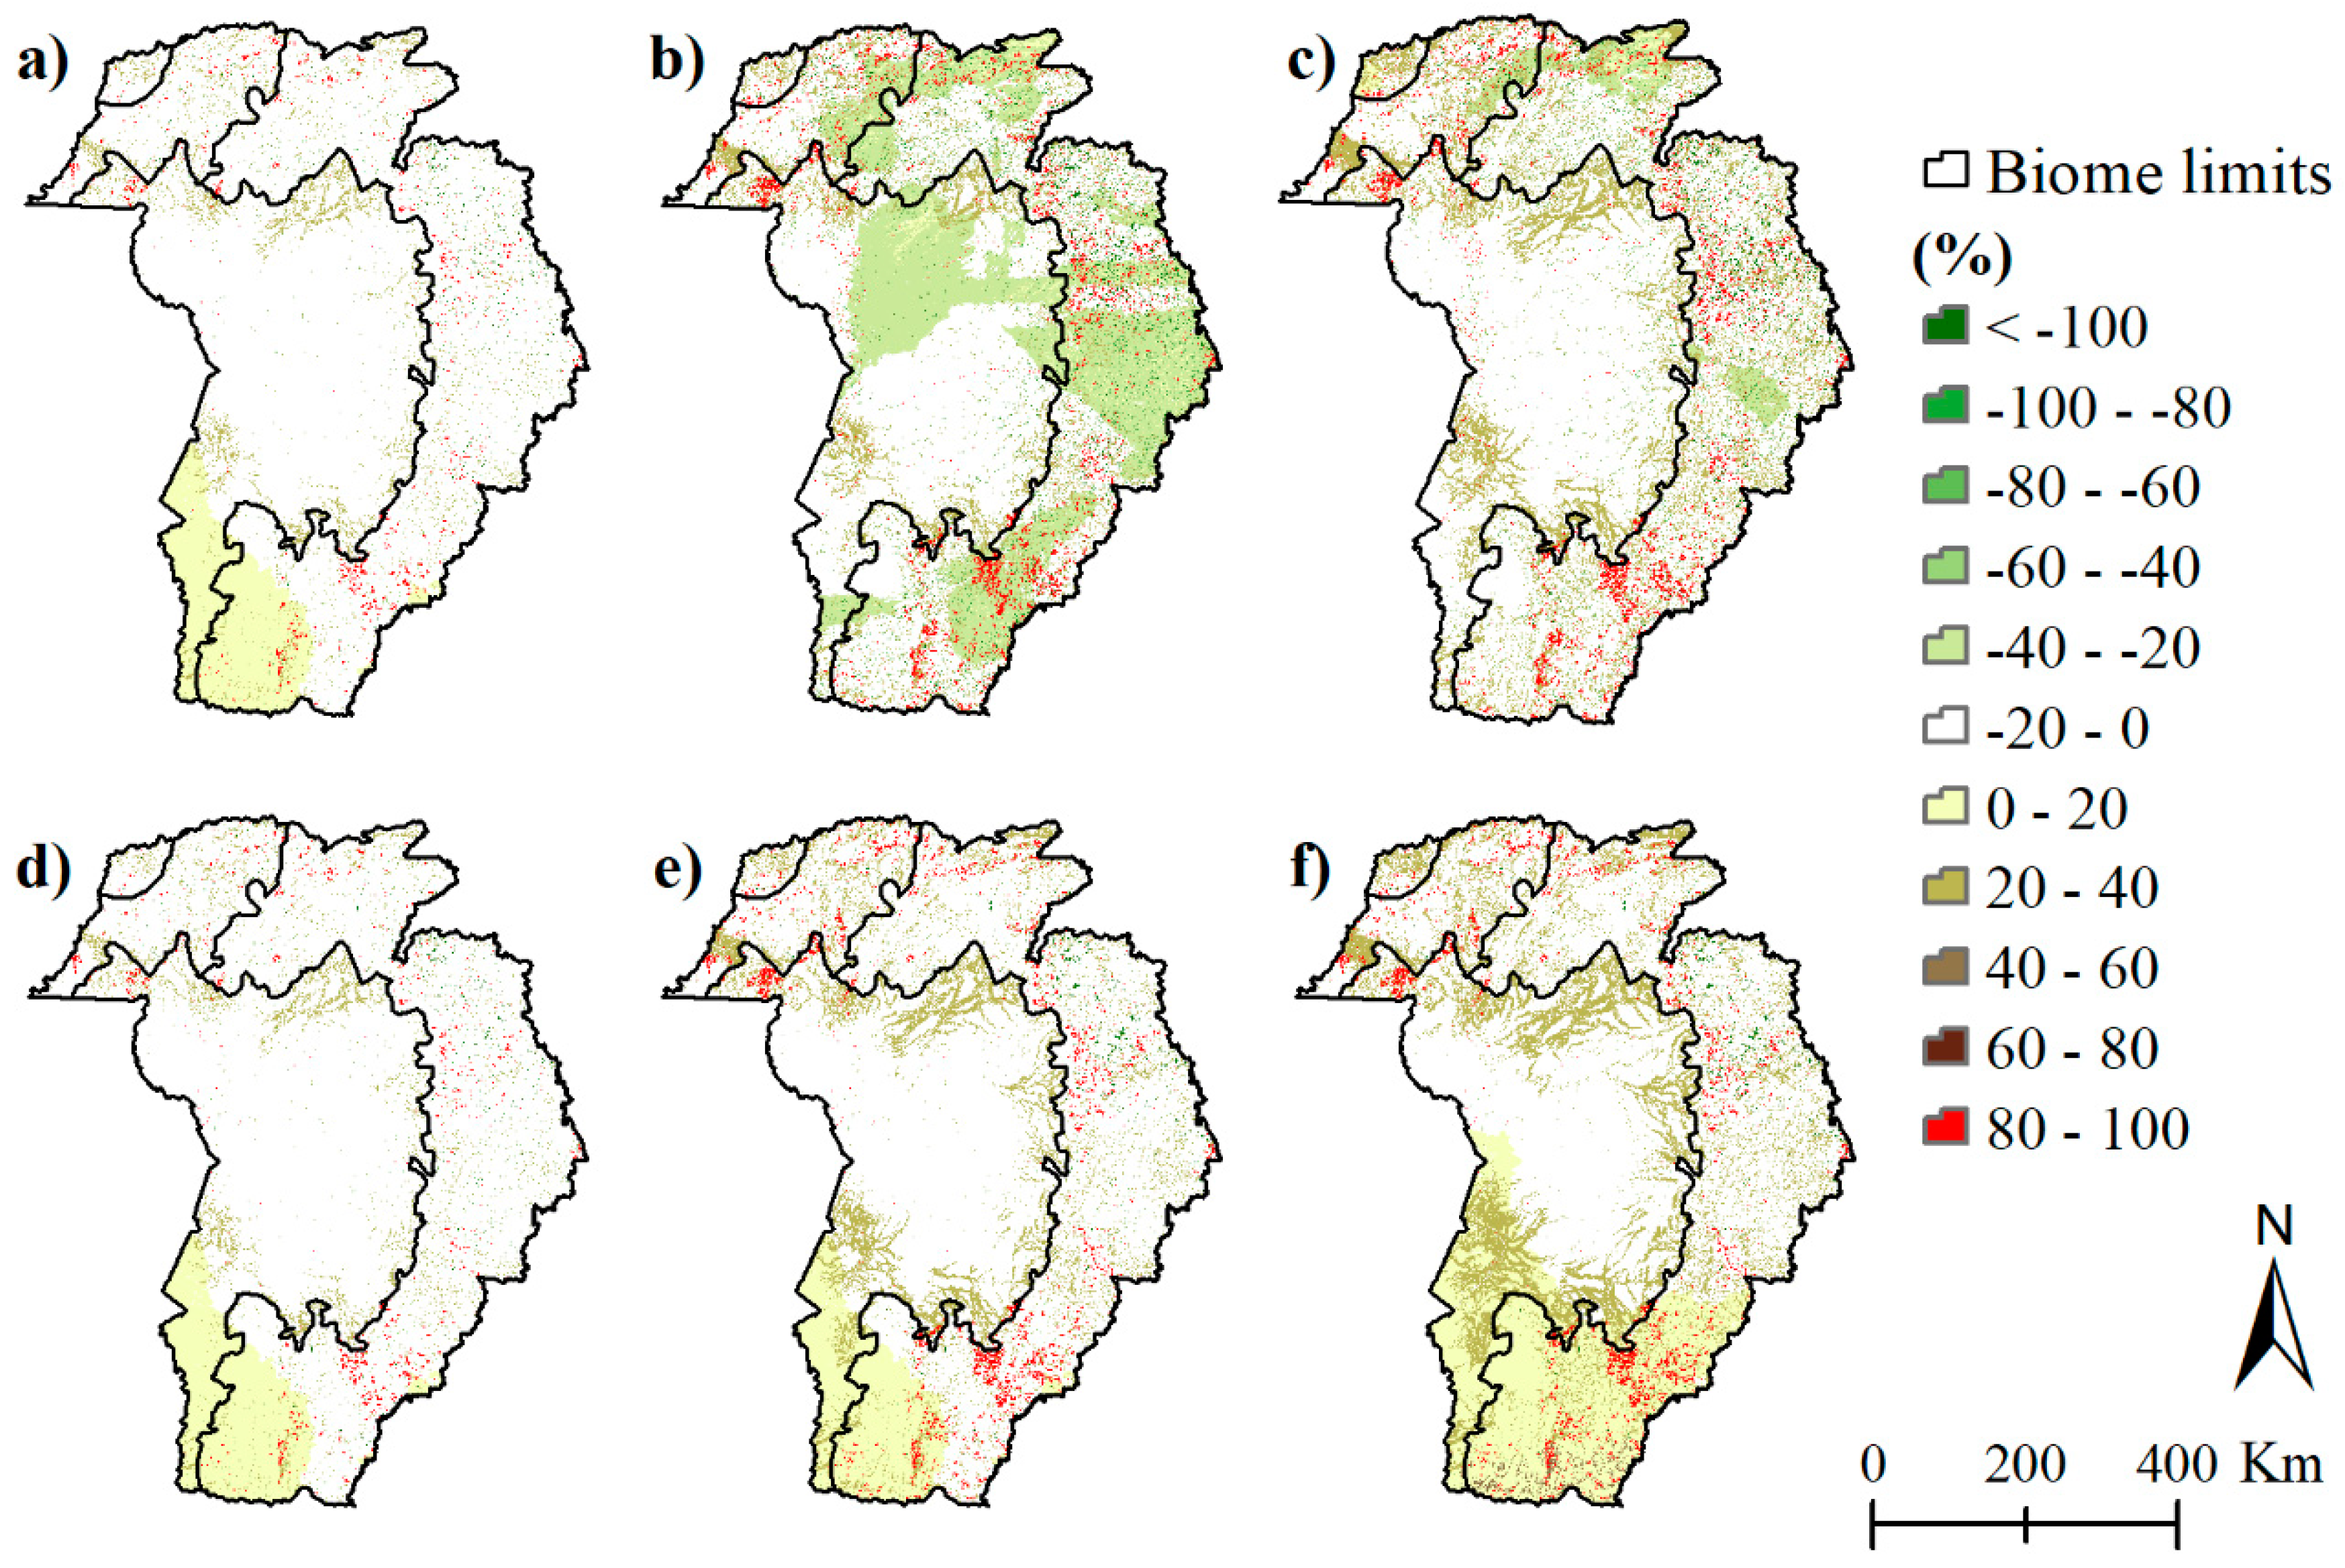
3.3. Impacts of Climate Change and Land-Cover and Land-Use Change (LCLU)

Figure 6 shows the relative variation of the average soil loss projected for 2020, 2035, and 2050, related to the baseline for the best and worst scenarios. For all cases, the greatest variations of soil loss (80 to 100%) are concentrated in the Cerrado and Amazon biomes (highlands). We found that this variation occurs mainly in areas of agriculture expansions. In the Pantanal biome, in general, the variation is up to 40% in all periods, despite the fact that there are some areas near the Amazon with a variation of 80 to 100%. However, this variation intensifies from 2035 to 2050 (see Figure 6e,f). On the other hand, there are negative variations concerning the baseline, indicating a possible reduction of soil erosion. Figure 6b shows a variation of −40 to −20% in the north of Pantanal and parts of the Cerrado, associated with the decreasing values in rainfall erosivity.
Despite finding the greatest soil erosion increase in the highlands, it is important to note that the on-site soil erosion effects that have occurred in the Cerrado and Amazon also have off-site effects on the dynamics of the Pantanal. Merten and Minella [49] evaluated different scenarios on soil and water conservation in Brazil, and concluded that the worst scenario would be the conversion of the Cerrado and the Amazon to agricultural land. This scenario could increase the total soil erosion in Brazil (currently about 800 million metric tons a year) by as much as 20%. Therefore, the soil erosion, and consequently, sediment yield increase in the Cerrado rivers, tend to lead to serious sedimentation problems in the Pantanal, generating socio-economic and environmental issues.
In the southern region of the UPB, there is a predominance of pasture lands, and the projections of LCLU have indicated an increase of forest being cleared for cattle grazing in forthcoming years in this region. In addition, we also noted an increase in soil loss in this region in the Municipalities of Bodoquena, Bonito, Jardim, and Porto Murtinho. These places include the National Park of Serra da Bodoquena, an important tourist center due to its hydrological and geological characteristics which are responsible for crystalline rivers, waterfalls, natural dams, and caves. However, it has become an attractive area for the mining industry, intensifying erosive processes and changing the quality of the local watercourses [56].
Another important variation of soil loss observed over the years of 2020, 2035, and 2050 is in the municipality of Corumbá, located in the central area of the Pantanal. The impacts of climate change and increasing numbers of people in urban areas place pressures on ecosystems, such as the loss and degradation of natural areas, soil sealing, and the densification of built-up areas, which present additional challenges for ecosystem exploration, the provision of ecosystem services, and human performance in all cities.
Among natural areas converted for anthropic use in 2014, 99% were converted to pasture; 0.6% to agriculture, and 0.4% to mining [57]. There are many mining activities in Corumbá that contribute to the country’s economy, e.g., the third largest iron ore mine in Brazil located near "Morro do Urucum", an important rock formation in the region [51]. However, these activities promote an increase in soil erosion and risks with sediments in dams. Mining dams reserve water containing environmentally-harmful mineral residues; when poorly managed, the rupture of a dam can have serious environmental impacts, such as what happened in Mariana and Brumadinho, Minas Gerais [52].
Our results indicated that the LCLU projections may have a greater influence on soil erosion than climate change in the UPB. These findings are in agreement with those of Anache et al. [58], which showed that LCLU influences soil loss rates in a significant way in tropical soils, but that soil erosion responses to climate change were not significant. Moreover, Simonneaux et al. [59] studied the effects of land use and climate change on soil erosion in a semi-arid basin, and showed that climate change alone increased sediment yield by 4.7 to 10.1%, and that land use changes could potentially induce much larger changes in erosion, i.e., up to 250%. Therefore, improving and intensifying the use of UPB soil and water conservation practices, and planning the use and occupation in an orderly manner, paying attention to the most sensitive areas found in this study, can minimize the effects on UPB soil erosion.
One way to ensure the sustainability of the food production system and to maintain ecosystem services in the Pantanal biome is linked to effective soil management, which requires a reduction in soil erosion rates [60,61]. Some examples of techniques to prevent or reduce soil erosion are no-tillage, contour farming, terraces, slope afforestation, crop residues, cover crops, and grass margins [17,55]. In addition, in Brazil, The New Forest Code is a potential tool for reducing deforestation. Although it is not effectively applied, it facilitates enforcement and gives landowners a pathway through which to restore or compensate for their “forest deficits” [9]. Furthermore, instruments such as payments for environmental services and economic-ecological zoning might control soil loss and increase water availability, as shown in Sone et al. [60].

4. Conclusions

In this paper, we computed soil erosion considering a baseline and projected scenarios of climate change and Land-Cover and Land-Use Change (LCLU) across the Upper Paraguay River Basin (UPB). The average soil loss for the baseline was of 18.52 ± 61 t ha−1 yr−1 and 19.42 ± 39 t ha−1 yr−1 for the Eta/HadGEM2-ES and Eta/MIROC5 models, respectively. Scenarios generated from the Eta/MIROC5 model (RCP 4.5 and 8.5), combined with LCLU model reference scenarios, show the highest average soil loss, and values increase over the time, while the combination of Eta/HadGEM-ES and low carbon presented lower average soil loss in the UPB.
The major projected increase in soil erosion for all the scenarios assessed is concentrated in highlands (Cerrado and Amazon biomes) of the UPB, mainly in regions with cropland increases (mainly soybean and maize). In these regions, for the worst scenario (a combination of Eta/MIROC5 -RCP 4.5 and a reference LCLU), the relative variation of the average soil erosion reaches up to 100% from 2012 to 2050. We also observed that the advance of pasture within the Pantanal biome will be intensified over the years, with a variation of 20 to 40% in soil loss.
It is necessary to maintain adequate land use management in the UPB so that future soil loss rates remain lower than the baseline estimates; this is a process that involves both farmers and decision makers. Soil and water conservation practices aimed at reducing deforestation, agroforestry, tillage management, and plant and water management are mitigation options. The presence of biomes with very different characteristics within the basin shows that the conservation of the UPB is fundamental to maintaining not only the ecosystem services provided by the Pantanal wetlands, but also the agricultural development of the Cerrado, and consequently, of the country.

Author Contributions

C.B.C. and P.T.S.O. designed the study, carried out data acquisition and analysis, elaborated on the results and wrote the major part of the manuscript. A.A. also performed data analysis and discussed the results. B.S.S.-F. and D.B.B.R. contributed to the writing. All authors reviewed the manuscript.

Funding

This study was supported by grants from the Ministry of Science, Technology, Innovation and Communication–MCTIC and National Council for Scientific and Technological Development–CNPq (grants 441289/2017-7 and 306830/2017-5).

Acknowledgments

We would like to thank the Coordenação de Aperfeiçoamento de Pessoal de Nível Superior-Brasil (CAPES)-Finance Code 001 and CAPES Print, and the Ministry of Science, Technology, Innovation and Communication–MCTIC and National Council for Scientific and Technological Development–CNPq for grants.

Conflicts of Interest

The authors declare no conflict of interest.

References

  1. Alho, C. The World’s Largest Wetlands: Ecology and Conservation; Cambridge University Press: Cambridge, UK, 2005; Available online: /core/books/worlds-largest-wetlands/3AB91B8482FF77B4A82DB83A8EFFB34E (accessed on 26 March 2018).
  2. Marengo, J.A.; Oliveira, G.S.; Alves, L.M. Climate Change Scenarios in the Pantanal. Dyn. Pantanal Wetl. S. Am. 2015, 37, 227–238. [Google Scholar] [CrossRef]
  3. Oliveira, P.T.S.; Nearing, M.A.; Moran, M.S.; Goodrich, D.C.; Wendland, E.; Gupta, H.V. Trends in water balance components across the Brazilian Cerrado. Water Resour. Res. 2014, 50, 7100–7114. [Google Scholar] [CrossRef] [Green Version]
  4. Nearing, M.A.; Pruski, F.F.; O’Neal, M.R. Expected climate change impacts on soil erosion rates: A review. J. Soil Water Conserv. 2004, 59, 43–50. [Google Scholar]
  5. Li, Z.; Fang, H. Impacts of climate change on water erosion: A review. Earth Sci. Rev. 2016, 163, 94–117. [Google Scholar] [CrossRef]
  6. Soares-Filho, B.S.; Campos, A.; Koberle, A.C.; Ribeiro, A.; Alvim, F.; Davis, J.L.; Rajão, R.; Maia, S.; Costa, W.L.S. Opções de Mitigação de Emissões de Gases de Efeito Estufa em Setores-Chave do Brasil. Agricultura, Florestas e Outros Usos do Solo (AFOLU); Ministério da Ciência, Tecnologia, Inovações e Comunicações: Brasília, Brazil, 2018.
  7. Bergier, I.; Assine, M.L.; McGlue, M.M.; Alho, C.J.R.; Silva, A.; Guerreiro, R.L.; Carvalho, J.C. Amazon rainforest modulation of water security in the Pantanal wetland. Sci. Total Environ. 2018, 619–620, 1116–1125. [Google Scholar] [CrossRef]
  8. Marengo, J.A. Mudanças Climáticas Globais e Seus Efeitos Sobre a Biodiversidade Caracterização do Clima Atual e Definição das Alterações Climáticas Para o Território Brasileiro ao Longo do Século XXI.; Ministério do Meio Ambiente-Secretaria de Biodiversidade e Florestas: Brasília, Brazil, 2007; ISBN 978-85-7738-038-1.
  9. Bergier, I. Effects of highland land-use over lowlands of the Brazilian Pantanal. Sci. Total Environ. 2013, 463–464, 1060–1066. [Google Scholar] [CrossRef]
  10. Wischmeier, W.S.; Smith, D.D. Predicting Rainfall Erosion Losses: A Guide to Conservation Planning; Agriculture Handbook: Washington, WA, USA, 1978. [Google Scholar]
  11. Batista, P.V.G.; Davies, J.; Silva, M.L.N.; Quinton, J.N. On the evaluation of soil erosion models: Are we doing enough? Earth Sci. Rev. 2019, 197, 102898. [Google Scholar] [CrossRef]
  12. Laflen, J.M.; Elliot, W.J.; Flanagan, D.C.; Meyer, C.R.; Nearing, M.A. WEPP-Predicting Water Erosion Using a Process-Based Model. J. Soil Water Conserv. 1997, 52, 96–102. [Google Scholar]
  13. De Roo, A.P.J.; Wesseling, C.G.; Ritsema, C.J. Lisem: A Single-Event Physically Based Hydrological and Soil Erosion Model for Drainage Basins. I: Theory, Input and Output. Hydrol. Process. 1996, 10, 1107–1117. [Google Scholar] [CrossRef]
  14. Morgan, R.P.C.; Quinton, J.N.; Smith, R.E.; Govers, G.; Poesen, J.W.A.; Auerswald, K.; Chisci, G.; Torri, D.; Styczen, M.E. The European Soil Erosion Model (EUROSEM): A dynamic approach for predicting sediment transport from fields and small catchments. Earth Surf. Process. Landf. J. Br. Geomorphol. Group 1998, 23, 527–544. Available online: https://0-onlinelibrary-wiley-com.brum.beds.ac.uk/doi/abs/10.1002/%28SICI%291096-9837%28199806%2923%3A6%3C527%3A%3AAID-ESP868%3E3.0.CO%3B2-5 (accessed on 29 November 2019). [CrossRef]
  15. Almagro, A.; Thomé, T.C.; Colman, C.B.; Pereira, R.B.; Marcato Junior, J.; Rodrigues, D.B.B.; Oliveira, P.T.S. Improving cover and management factor (C-factor) estimation using remote sensing approaches for tropical regions. Int. Soil Water Conserv. Res. 2019, 7, 325–334. [Google Scholar] [CrossRef]
  16. Peel, M.C.; Finlayson, B.L.; Mcmahon, T.A. Updated world map of the Köppen-Geiger climate classification. Hydrol. Earth Syst. Sci. Discuss. 2007, 11, 1633–1644. [Google Scholar] [CrossRef] [Green Version]
  17. Myers, N.; Mittermeier, R.A.; Mittermeier, C.G.; da Fonseca, G.A.B.; Kent, J. Biodiversity hotspots for conservation priorities. Nature 2000, 403, 853–858. [Google Scholar] [CrossRef] [PubMed]
  18. Oliveira, P.T.S.; Nearing, M.A.; Scott, R.L.; Rosolem, R.; da Rocha, H.R. The water balance components of undisturbed tropical woodlands in the Brazilian cerrado. Hydrol. Earth Syst. Sci. 2015, 19, 2899–2910. [Google Scholar] [CrossRef] [Green Version]
  19. Lapola, D.M.; Martinelli, L.A.; Peres, C.A.; Ometto, J.P.H.B.; Ferreira, M.E.; Nobre, C.A.; Aguiar, A.P.D.; Bustamante, M.M.C.; Cardoso, M.F.; Costa, M.H.; et al. Pervasive transition of the Brazilian land-use system. Nat. Clim. Chang. 2014, 4, 27–35. [Google Scholar] [CrossRef] [Green Version]
  20. Strassburg, B.B.N.; Brooks, T.; Feltran-Barbieri, R.; Iribarrem, A.; Crouzeilles, R.; Loyola, R.; Latawiec, A.E.; Oliveira Filho, F.J.B.; de M. Scaramuzza, C.A.; Scarano, F.R.; et al. Moment of truth for the Cerrado hotspot. Nat. Ecol. Evol. 2017, 1, 99. [Google Scholar] [CrossRef]
  21. Azevedo, A.A.; Rajão, R.; Costa, M.A.; Stabile, M.C.C.; Macedo, M.N.; dos Reis, T.N.P.; Alencar, A.; Soares-Filho, B.S.; Pacheco, R. Limits of Brazil’s Forest Code as a means to end illegal deforestation. Proc. Natl. Acad. Sci. USA 2017, 114, 7653–7658. [Google Scholar] [CrossRef] [Green Version]
  22. Rajão, R.; Soares-Filho, B. Policies undermine Brazil’s GHG goals. Science 2015, 350, 519. [Google Scholar] [CrossRef]
  23. Panagos, P.; Imeson, A.; Meusburger, K.; Borrelli, P.; Poesen, J.; Alewell, C. Soil Conservation in Europe: Wish or Reality?: Soil Conservation in Europe: Wish or Reality? Land Degrad. Dev. 2016, 27, 1547–1551. [Google Scholar] [CrossRef] [Green Version]
  24. Alewell, C.; Borrelli, P.; Meusburger, K.; Panagos, P. Using the USLE: Chances, challenges and limitations of soil erosion modelling. Int. Soil Water Conserv. Res. 2019, 7, 203–225. [Google Scholar] [CrossRef]
  25. Durigon, V.L.; Carvalho, D.F.; Antunes, M.A.H.; Oliveira, P.T.S.; Fernandes, M.M. NDVI time series for monitoring RUSLE cover management factor in a tropical watershed. Int. J. Remote Sens. 2014, 35, 441–453. [Google Scholar] [CrossRef]
  26. de Oliveira, P.T.S.; Rodrigues, D.B.B.; Sobrinho, T.A.; Panachuki, E. Estimating of the USLE topographic factor using three algorithms. Ambiente Agua Interdiscip. J. Appl. Sci. 2010, 5, 217–225. [Google Scholar]
  27. Panagos, P.; Borrelli, P.; Poesen, J. Soil loss due to crop harvesting in the European Union: A first estimation of an underrated geomorphic process. Sci. Total Environ. 2019, 664, 487–498. [Google Scholar] [CrossRef] [PubMed]
  28. Almagro, A.; Oliveira, P.T.S.; Nearing, M.A.; Hagemann, S. Projected climate change impacts in rainfall erosivity over Brazil. Sci. Rep. 2017, 7, 8130. [Google Scholar] [CrossRef] [Green Version]
  29. Oliveira, P.T.S.; Nearing, M.A.; Wendland, E. Orders of magnitude increase in soil erosion associated with land use change from native to cultivated vegetation in a Brazilian savannah environment. Earth Surf. Process. Landf. 2015, 40, 1524–1532. [Google Scholar] [CrossRef]
  30. Soares-Filho, B.; Rajão, R.; Merry, F.; Rodrigues, H.; Davis, J.; Lima, L.; Macedo, M.; Coe, M.; Carneiro, A.; Santiago, L. Brazil’s Market for Trading Forest Certificates. PLoS ONE 2016, 11, e0152311. [Google Scholar] [CrossRef]
  31. MMA, C. Geoprocessamento; Ministério do Meio Ambiente: Brasilia, Barzil, 2018. Available online: http://www.mma.gov.br/governanca-ambiental/geoprocessamento (accessed on 6 November 2018).
  32. FAO. World Reference Base for Soil Resources 2014: International Soil Classification System for Naming Soils and Creating Legends for Soil Maps; FAO: Rome, Italy, 2014; ISBN 978-92-5-108369-7. [Google Scholar]
  33. Mannigel, A.R.; E Carvalho, M.D.P.; Moreti, D.; Medeiros, L.D.R. Fator erodibilidade e tolerância de perda dos solos do Estado de São Paulo. Acta Scientiarum. Agron. 2008, 24, 1335. [Google Scholar] [CrossRef]
  34. da Silva, A.M.; Alcarde, C.; Hitomi, C. Natural Potential for Erosion for Brazilian Territory. In Soil Erosion Studies; Godone, D., Ed.; InTech: Rijeka, Croatia, 2011; ISBN 978-953-307-710-9. [Google Scholar]
  35. Pasquatto, M.C. Influência Do Uso e Ocupação Do Solo na Qualidade da Água e No Processo Erosivo Da Bacia de Captação Do Rio Barro Preto, Coronel Vivida (PR). Master’s Thesis, Universidade Tecnológica Federal do Paraná, Apucarana, Brazil, 2016. [Google Scholar]
  36. Ruthes, J.M.; Tomazoni, J.C.; Guimarães, E.; Gomes, T.C. Propriedades do Solo da Bacia Hidrográfica do Rio Catorze que Intensificam a Erosão Laminar. Revista Brasileira de Geografia Física 2012, 10. [Google Scholar] [CrossRef] [Green Version]
  37. Martins, S.G.; Silva, M.L.N.; Avanzi, J.C.; Curi, N.; Fonseca, S. Cover-management factor and soil and water losses from eucalyptus cultivation and Atlantic Forest at the Coastal Plain in the Espírito Santo State, Brazil. Sci. For. 2010, 38, 517–526. [Google Scholar]
  38. Anache, J.A.A.; Bacchi, C.G.V.; Panachuki, E.; Sobrinho, T.A. Assessment of Methods for Predicting Soil Erodibility in Soil Loss Modeling. Geociências (São Paulo) 2016, 34, 32–40. [Google Scholar]
  39. Farr, T.G.; Rosen, P.A.; Caro, E.; Crippen, R.; Duren, R.; Hensley, S.; Kobrick, M.; Paller, M.; Rodriguez, E.; Roth, L.; et al. The Shuttle Radar Topography Mission. Rev. Geophys. 2007, 45. [Google Scholar] [CrossRef] [Green Version]
  40. O’Loughlin, F.E.; Paiva, R.C.D.; Durand, M.; Alsdorf, D.E.; Bates, P.D. A multi-sensor approach towards a global vegetation corrected SRTM DEM product. Remote Sens. Environ. 2016, 182, 49–59. [Google Scholar] [CrossRef] [Green Version]
  41. Desmet, P.J.J.; Govers, G. A GIS procedure for automatically calculating the USLE LS factor on topographically complex landscape units. J. Soil Water Conserv. 1996, 51, 427–433. [Google Scholar]
  42. McCool, D.K.; Foster, G.R.; Mutchler, C.K.; Meyer, L.D. Revised slope length factor for the Universal Soil Loss Equation. Trans. ASAE 1989, 32, 1571–1576. [Google Scholar] [CrossRef]
  43. McCool, D.K.; Brown, L.C.; Foster, G.R. Revised slope steepness factor for the Universal Soil Loss Equation. Trans. ASAE 1987, 30, 1387–1396. [Google Scholar] [CrossRef]
  44. Galdino, S. Distribuição Espacial do Fator Topográfico da Rusle na Bacia do Alto Paraguai.—Portal Embrapa. Available online: https://www.embrapa.br/territorial/busca-de-publicacoes/-/publicacao/1035988/distribuicao-espacial-do-fator-topografico-da-rusle-na-bacia-do-alto-paraguai (accessed on 16 March 2018).
  45. Renard, K.; Foster, G.R.; Weesies, G.A.; McCool, D.K.; Yoder, D.C. Predicting Soil Erosion by Water: A Guide to Conservation Planning with the Revised Universal Soil Loss Equation (RUSLE); United States Department of Agriculture: Washington, DC, USA, 1997. [Google Scholar]
  46. Oliveira, J.A.; Dominguez, J.M.L.; Nearing, M.A.; Oliveira, P.T.S. A GIS-Based Procedure for Automatically Calculating Soil Loss from the UniversalSoil Loss Equation: GISus-M. Appl. Eng. Agric. 2015, 31, 907–917. [Google Scholar]
  47. Oliveira, P.T.S.; Wendland, E.; Nearing, M.A. Rainfall erosivity in Brazil: A review. Catena 2013, 100, 139–147. [Google Scholar] [CrossRef]
  48. Oliveira, P.T.; Rodrigues, D.B.; Sobrinho, T.A.; de Carvalho, D.F.; Panachuki, E. Spatial variability of the rainfall erosive potential in the state of Mato Grosso do Sul, Brazil. Engenharia Agrícola 2012, 32, 69–79. [Google Scholar] [CrossRef] [Green Version]
  49. Sartori, M.; Philippidis, G.; Ferrari, E.; Borrelli, P.; Lugato, E.; Montanarella, L.; Panagos, P. A linkage between the biophysical and the economic: Assessing the global market impacts of soil erosion. Land Use Policy 2019, 86, 299–312. [Google Scholar] [CrossRef]
  50. Nobre, A.D. O Futuro Climático da Amazônia:Relatório de Avaliação Científica; Articulação Regional Amazônica: Sao Paulo, Brazil, 2014; p. 12. [Google Scholar]
  51. Spera, S.A.; Galford, G.L.; Coe, M.T.; Macedo, M.N.; Mustard, J.F. Land-use change affects water recycling in Brazil’s last agricultural frontier. Glob. Chang. Biol. 2016, 22, 3405–3413. [Google Scholar] [CrossRef]
  52. Anache, J.A.A.; Wendland, E.; Rosalem, L.M.P.; Youlton, C.; Oliveira, P.T.S. Hydrological trade-offs due to different land covers and land uses in the Brazilian Cerrado. Hydrol. Earth Syst. Sci. 2019, 23, 1263–1279. [Google Scholar] [CrossRef] [Green Version]
  53. Seidl, A.F.; de Silva, J.D.S.V.; Moraes, A.S. Cattle ranching and deforestation in the Brazilian Pantanal. Ecol. Econ. 2001, 36, 413–425. [Google Scholar] [CrossRef]
  54. Junk, W.J.; Nunes da Cunha, C. Pasture clearing from invasive woody plants in the Pantanal: A tool for sustainable management or environmental destruction? Wetl. Ecol. Manag. 2012, 20, 111–122. [Google Scholar] [CrossRef]
  55. ANA, S. Produto Parcial PP-02—Diagnóstico Consolidado da Região Hidrográfica do Rio Paraguai; Agência Nacional de Águas: Brasília, Brazil, 2017.
  56. ANA Plano de Recursos Hídricos da Região Hidrográfica do Rio Paraguai—PRH Paraguai. Available online: http://www3.ana.gov.br/portal/ANA/todos-os-documentos-do-portal/documentos-spr/prh-paraguai (accessed on 6 November 2018).
  57. Anache, J.A.A.; Flanagan, D.C.; Srivastava, A.; Wendland, E.C. Land use and climate change impacts on runoff and soil erosion at the hillslope scale in the Brazilian Cerrado. Sci. Total Environ. 2018, 622–623, 140–151. [Google Scholar] [CrossRef] [PubMed]
  58. Simonneaux, V.; Cheggour, A.; Deschamps, C.; Mouillot, F.; Cerdan, O.; Le Bissonnais, Y. Land use and climate change effects on soil erosion in a semi-arid mountainous watershed (High Atlas, Morocco). J. Arid Environ. 2015, 122, 64–75. [Google Scholar] [CrossRef] [Green Version]
  59. Poesen, J. Soil erosion in the Anthropocene: Research needs: Soil erosion in the Anthropocene. Earth Surf. Process. Landf. 2018, 43, 64–84. [Google Scholar] [CrossRef]
  60. Sone, J.S.; Gesualdo, G.C.; Zamboni, P.A.P.; Vieira, N.O.M.; Mattos, T.S.; Carvalho, G.A.; Rodrigues, D.B.B.; Alves Sobrinho, T.; Oliveira, P.T.S. Water provisioning improvement through payment for ecosystem services. Sci. Total Environ. 2019, 655, 1197–1206. [Google Scholar] [CrossRef]
  61. Sone, J.S.; Oliveira, P.T.S.; Zamboni, P.A.P.; Vieira, N.O.M.; Carvalho, G.A.; Macedo, M.C.M.; Araujo, A.R.; Montagner, D.B.; Sobrinho, A. Effects of long-term crop-livestock-forestry systems on soil erosion and water infiltration in a Brazilian Cerrado site. Sustainability 2019, 11, 5339. [Google Scholar] [CrossRef] [Green Version]
Figure 1. Location of the study area, highlighting the Amazon, Pantanal, and Cerrado biomes within the Upper Paraguay Basin.
Sustainability 11 07053 g001
Figure 2. Study delineation. Different scenarios of R- and C-factors were combined for the evaluation of potentially impacted areas trough the 21st century. R-factor represents rainfall erosivity and was generated from downscaled data from two GCM (HadGEM2-ES and MIROC5) forced by two emission scenarios (RCP 4.5 and RCP 8.5). C-factor indicates the land cover and management and we adopted two different scenarios: reference and low carbon emissions.
Sustainability 11 07053 g002
Figure 3. Spatial distribution of (a) soil types, (b) topographic factor (LS-factor) (dimensionless), and (c) land use and management factor (C-factor) (dimensionless) of the UPB.
Sustainability 11 07053 g003
Figure 4. Projected rainfall erosivity (R-factor in MJ mm ha−1 h−1 yr−1) for the UPB from (a) Eta/HadGEM2-ES RCP 4.5 (2012–2040); (b) Eta/HadGEM2-ES RCP 4.5 (2041–2050); (c) Eta/HadGEM2-ES RCP 8.5 (2012–2040); (d) Eta/HadGEM2-ES RCP 8.5 (2041–2050); (e) Eta/MIROC5 RCP 4.5 (2012–2040); (f) Eta/MIROC5 RCP 4.5 (2041–2050); (g) Eta/MIROC5 RCP 8.5 (2012–2040); and (h) Eta/MIROC5 RCP 8.5 (2041–2050).
Sustainability 11 07053 g004
Figure 5. Land use and management factor simulations for (a) baseline; Reference scenario in (b) 2020, (c) 2035, and (d) 2050; Low Carbon scenario in (e) 2020, (f) 2035, and (g) 2050.
Sustainability 11 07053 g005
Figure 6. Spatial distribution of relative variation of the average soil erosion in the best-scenarios (Eta/HadGEM2-ES x Low Carbon) for (a) 2020, (b) 2035, and (c) 2050, and the worst scenarios (Eta/MIROC5 x Reference) for (d) 2020, (e) 2035, and (f) 2050, representing short-, medium-, and long-term periods, respectively.
Sustainability 11 07053 g006
Table 1. Soil erodibility values for the soils found in the UPB.
World Reference Base for Soil ClassificationK-Factor
(t h MJ−1 mm−1)
Source
Acrisols0.0228–0.0466[33]
Cambisols0.0254–0.0441[33]
Chernozems0.0309 [34]
Podzols0.3267 [33]
Gleysols0.0044 [33]
Ferralsols0.0061–0.0263[33]
Leptosols0.0196 [35]
Arenosols0.1448 [33]
Regosols0.1238 [36]
Nitisols0.0081–0.0355[33]
Histosols0.0317 [33]
Planosols0.0317 [33]
Plinthosols0.017 [37]
Vertisols0.04 [34]
Table 2. Combination of different R- and C-factors to estimate soil erosion under climate and land use changes. Eta/HadGEM2-ES and Eta/MIROC5 are the Regional Climate Models (RCM) and RCP 4.5 and RCP 8.5 are the two Representative Concentration Pathways (RCP) scenarios.
SOIL LOSS SIMULATION BASELINE
Eta/HadGEM2-ES
x
Reference
Eta/MIROC5
x
Reference
R-factor: 1961–2005
C-factor: 2012
R-factor: 1961–2005
C-factor: 2012
SOIL LOSS PROJECTED SCENARIOS
Eta/HadGEM2-ES
(RCP 4.5)
x
Reference
Eta/MIROC5
(RCP 4.5)
x
Reference
R-factor: 2007–2040
C-factor: 2020
R-factor: 2007–2040
C-factor: 2020
R-factor: 2007–2040
C-factor: 2035
R-factor: 2007–2040
C-factor: 2035
R-factor: 2041–2070
C-factor: 2050
R-factor: 2041–2070
C-factor: 2050
Eta/HadGEM2-ES
(RCP 8.5)
x
Reference
Eta/MIROC5
(RCP 8.5)
x
Reference
R-factor: 2007–2040
C-factor: 2020
R-factor: 2007–2040
C-factor: 2020
R-factor: 2007–2040
C-factor: 2035
R-factor: 2007–2040
C-factor: 2035
R-factor: 2041–2070
C-factor: 2050
R-factor: 2041–2070
C-factor: 2050
Eta/HadGEM2-ES
(RCP 4.5)
x
Low Carbon
Eta/MIROC5
(RCP 4.5)
x
Low Carbon
R-factor: 2007–2040
C-factor: 2020
R-factor: 2007–2040
C-factor: 2020
R-factor: 2007–2040
C-factor: 2035
R-factor: 2007–2040
C-factor: 2035
R-factor: 2041–2070
C-factor: 2050
R-factor: 2041–2070
C-factor: 2050
Eta/HadGEM2-ES
(RCP 8.5)
x
Low Carbon
Eta/MIROC5
(RCP 8.5)
x
Low Carbon
R-factor: 2007–2040
C-factor: 2020
R-factor: 2007–2040
C-factor: 2020
R-factor: 2007–2040
C-factor: 2035
R-factor: 2007–2040
C-factor: 2035
R-factor: 2041–2070
C-factor: 2050
R-factor: 2041–2070
C-factor: 2050
Table 3. The lowest and highest average of R-factor for the UPB basin.
ScenariosBaselineProjected (MJ mm ha−1 h−1 yr−1)
Eta/HadGEM2-ES1961–2005LowestHighest
RCP 4.5 (2007–2040)RCP 4.5 (2041–2070)
8116 ± 12296906 ± 10667453 ± 1078
Eta/MIROC51961–2005LowestHighest
RCP 8.5 (2007–2040)RCP 4.5 (2041–2070)
8470 ± 11297622 ± 11348279 ± 1268
Table 4. Soil loss estimates (t ha−1 yr−1) in the best scenarios (a) and the worst scenarios (b) for short-, medium-, and long-term periods.
Scenarios202020352050
a) Eta/HadGEM2-ES
x
Low Carbon
RCP 4.5 (2007–2040)RCP 4.5 (2007–2040)RCP 8.5 (2041–2070)
16.02 ± 54.0216.86 ± 56.4318.25 ± 60.58
b) Eta/MIROC5
x
Reference
RCP 4.5 (2007–2040)RCP 4.5 (2007–2040)RCP 4.5 (2041–2070)
18.83 ± 61.7319.89 ± 65.6320.81 ± 67.87

