Changing Characteristics of Chlorophyll a in the Context of Internal and External Factors: A Case Study of Dianchi Lake in China


Abstract
:
1. Introduction
2. Data and Methods
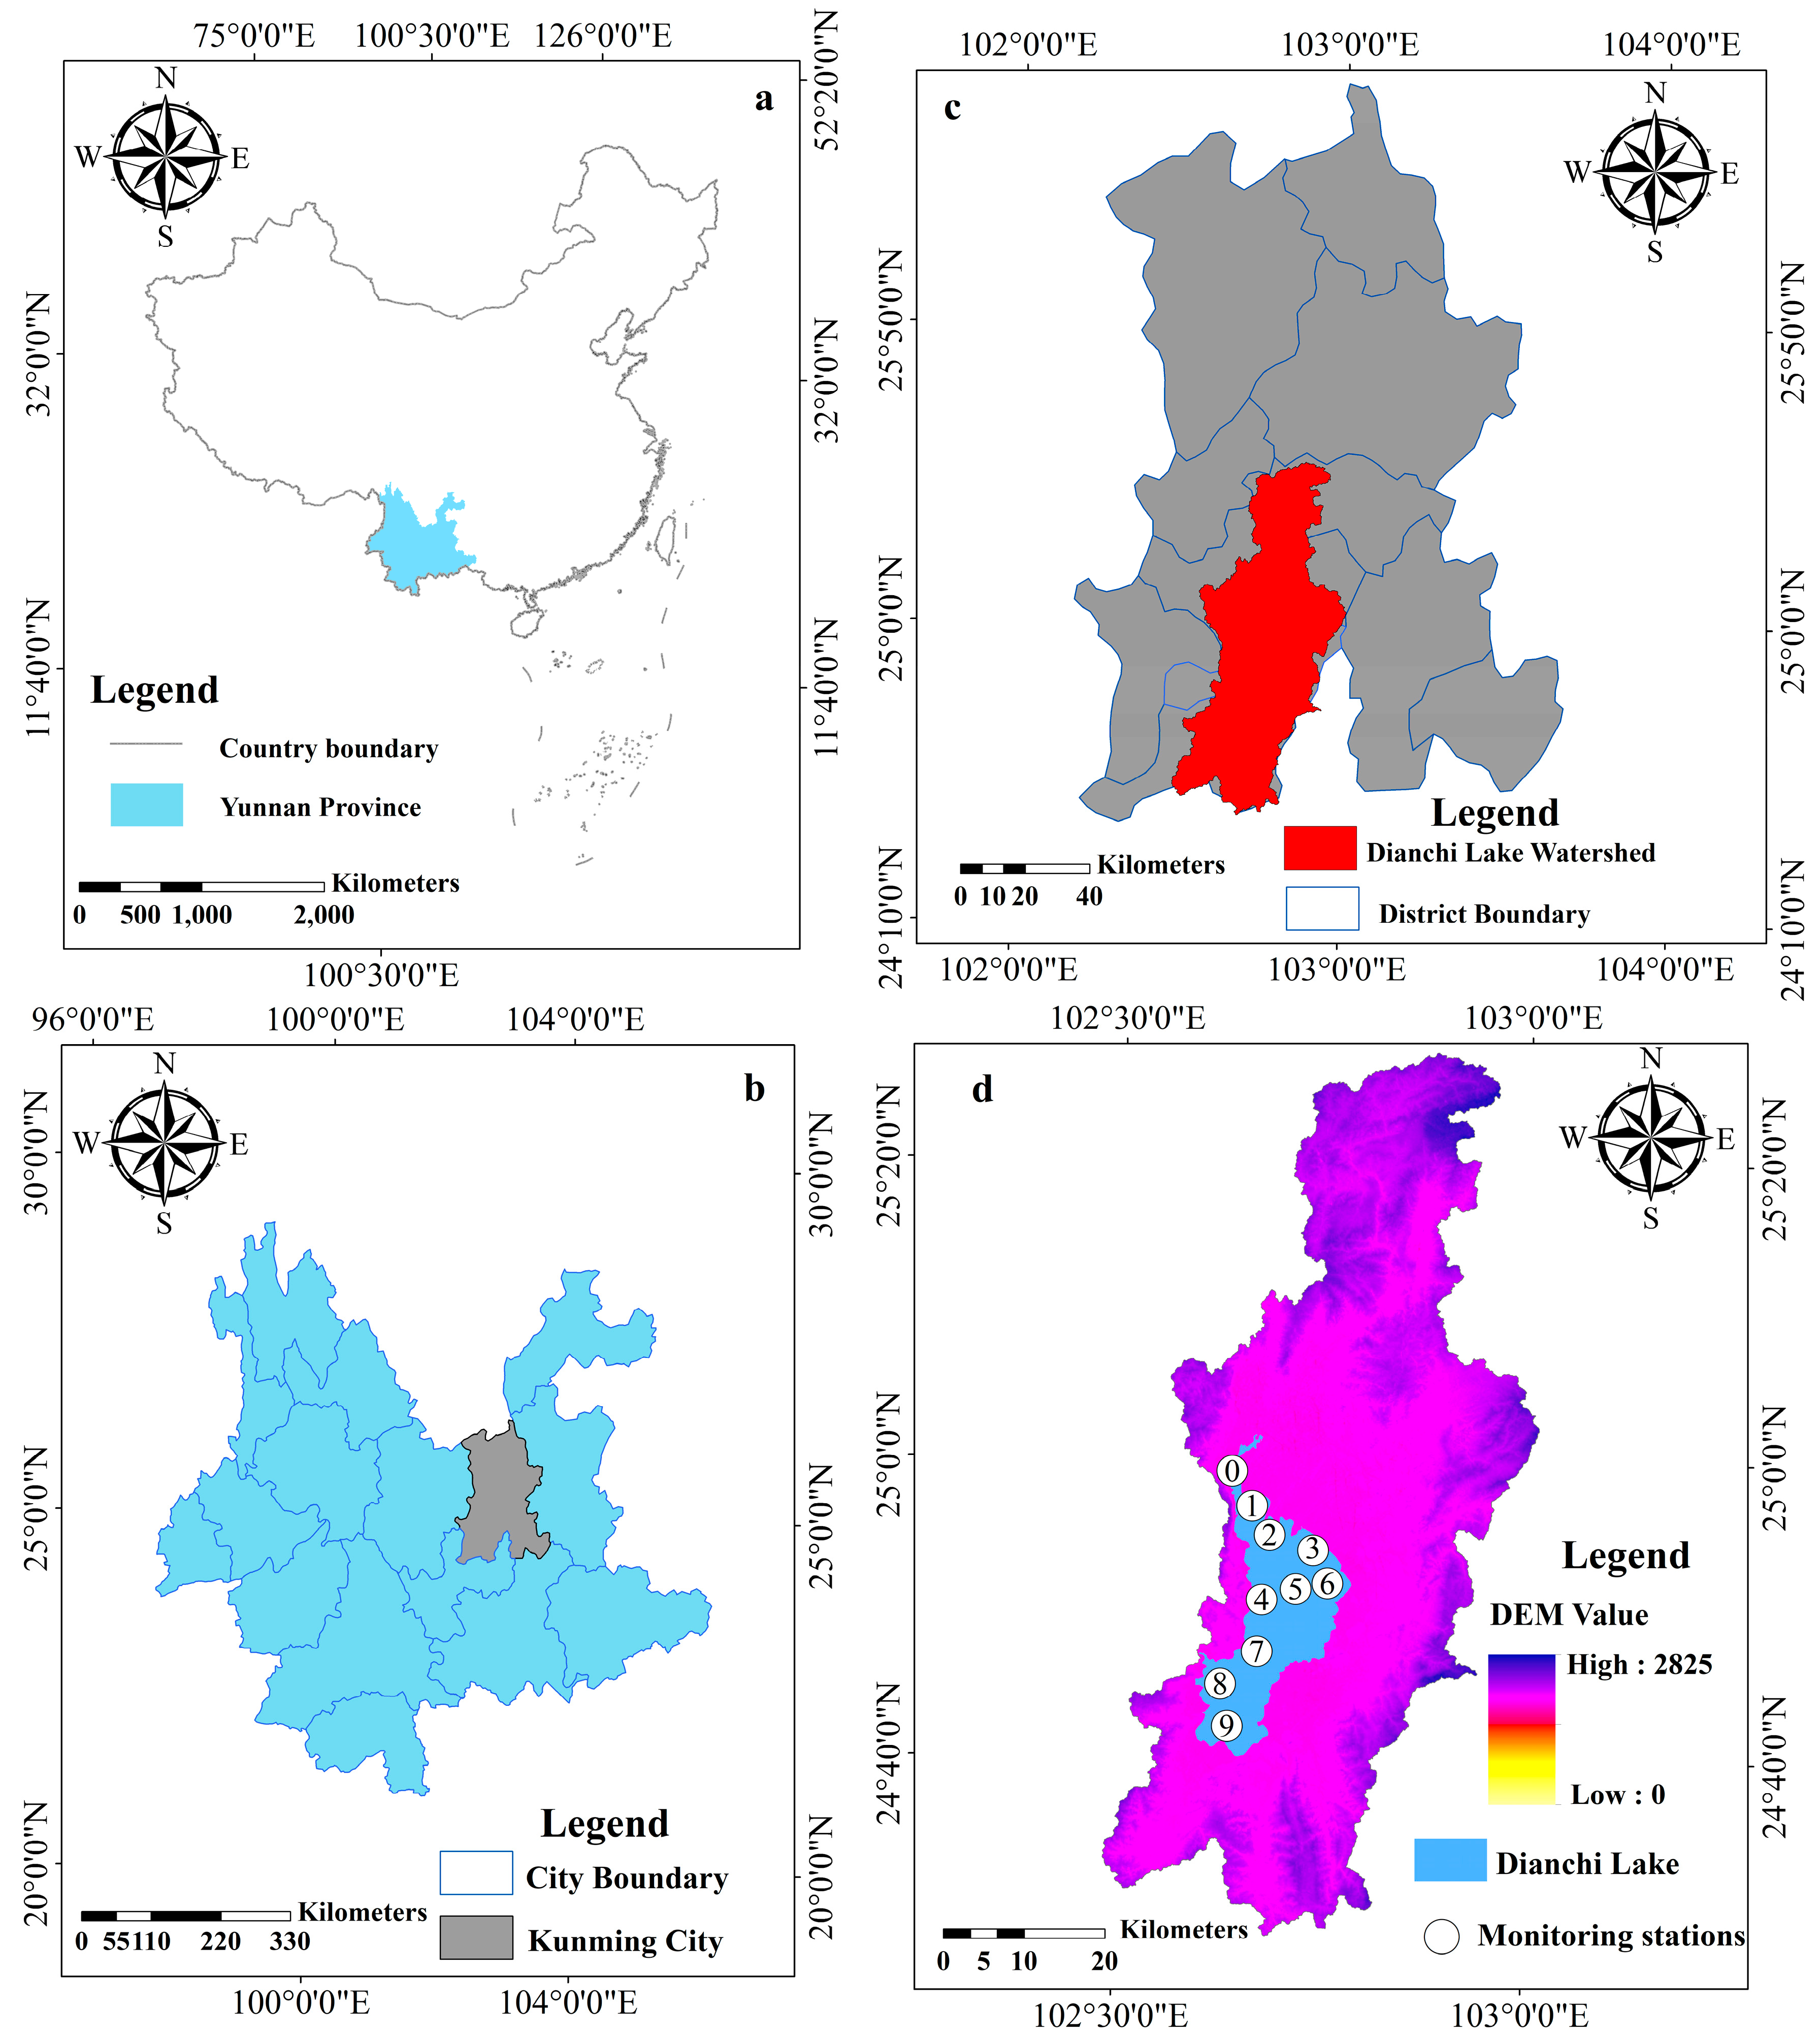
2.1. Study Area
2.2. Methods
2.2.1. Regression Analysis
2.2.2. Spatial Interpolation Method
2.2.3. Comprehensive Nutrition State Index
2.2.4. Lake Quality Level
2.3. Historical Water Quality Data and Urbanization Data
3. Results and Discussion
3.1. Temporal and Spatial Variation of Dianchi Lake Water Quality
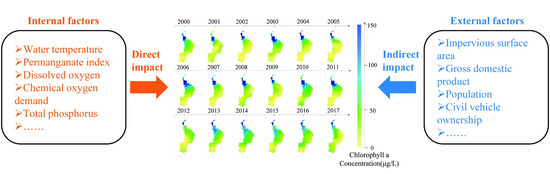
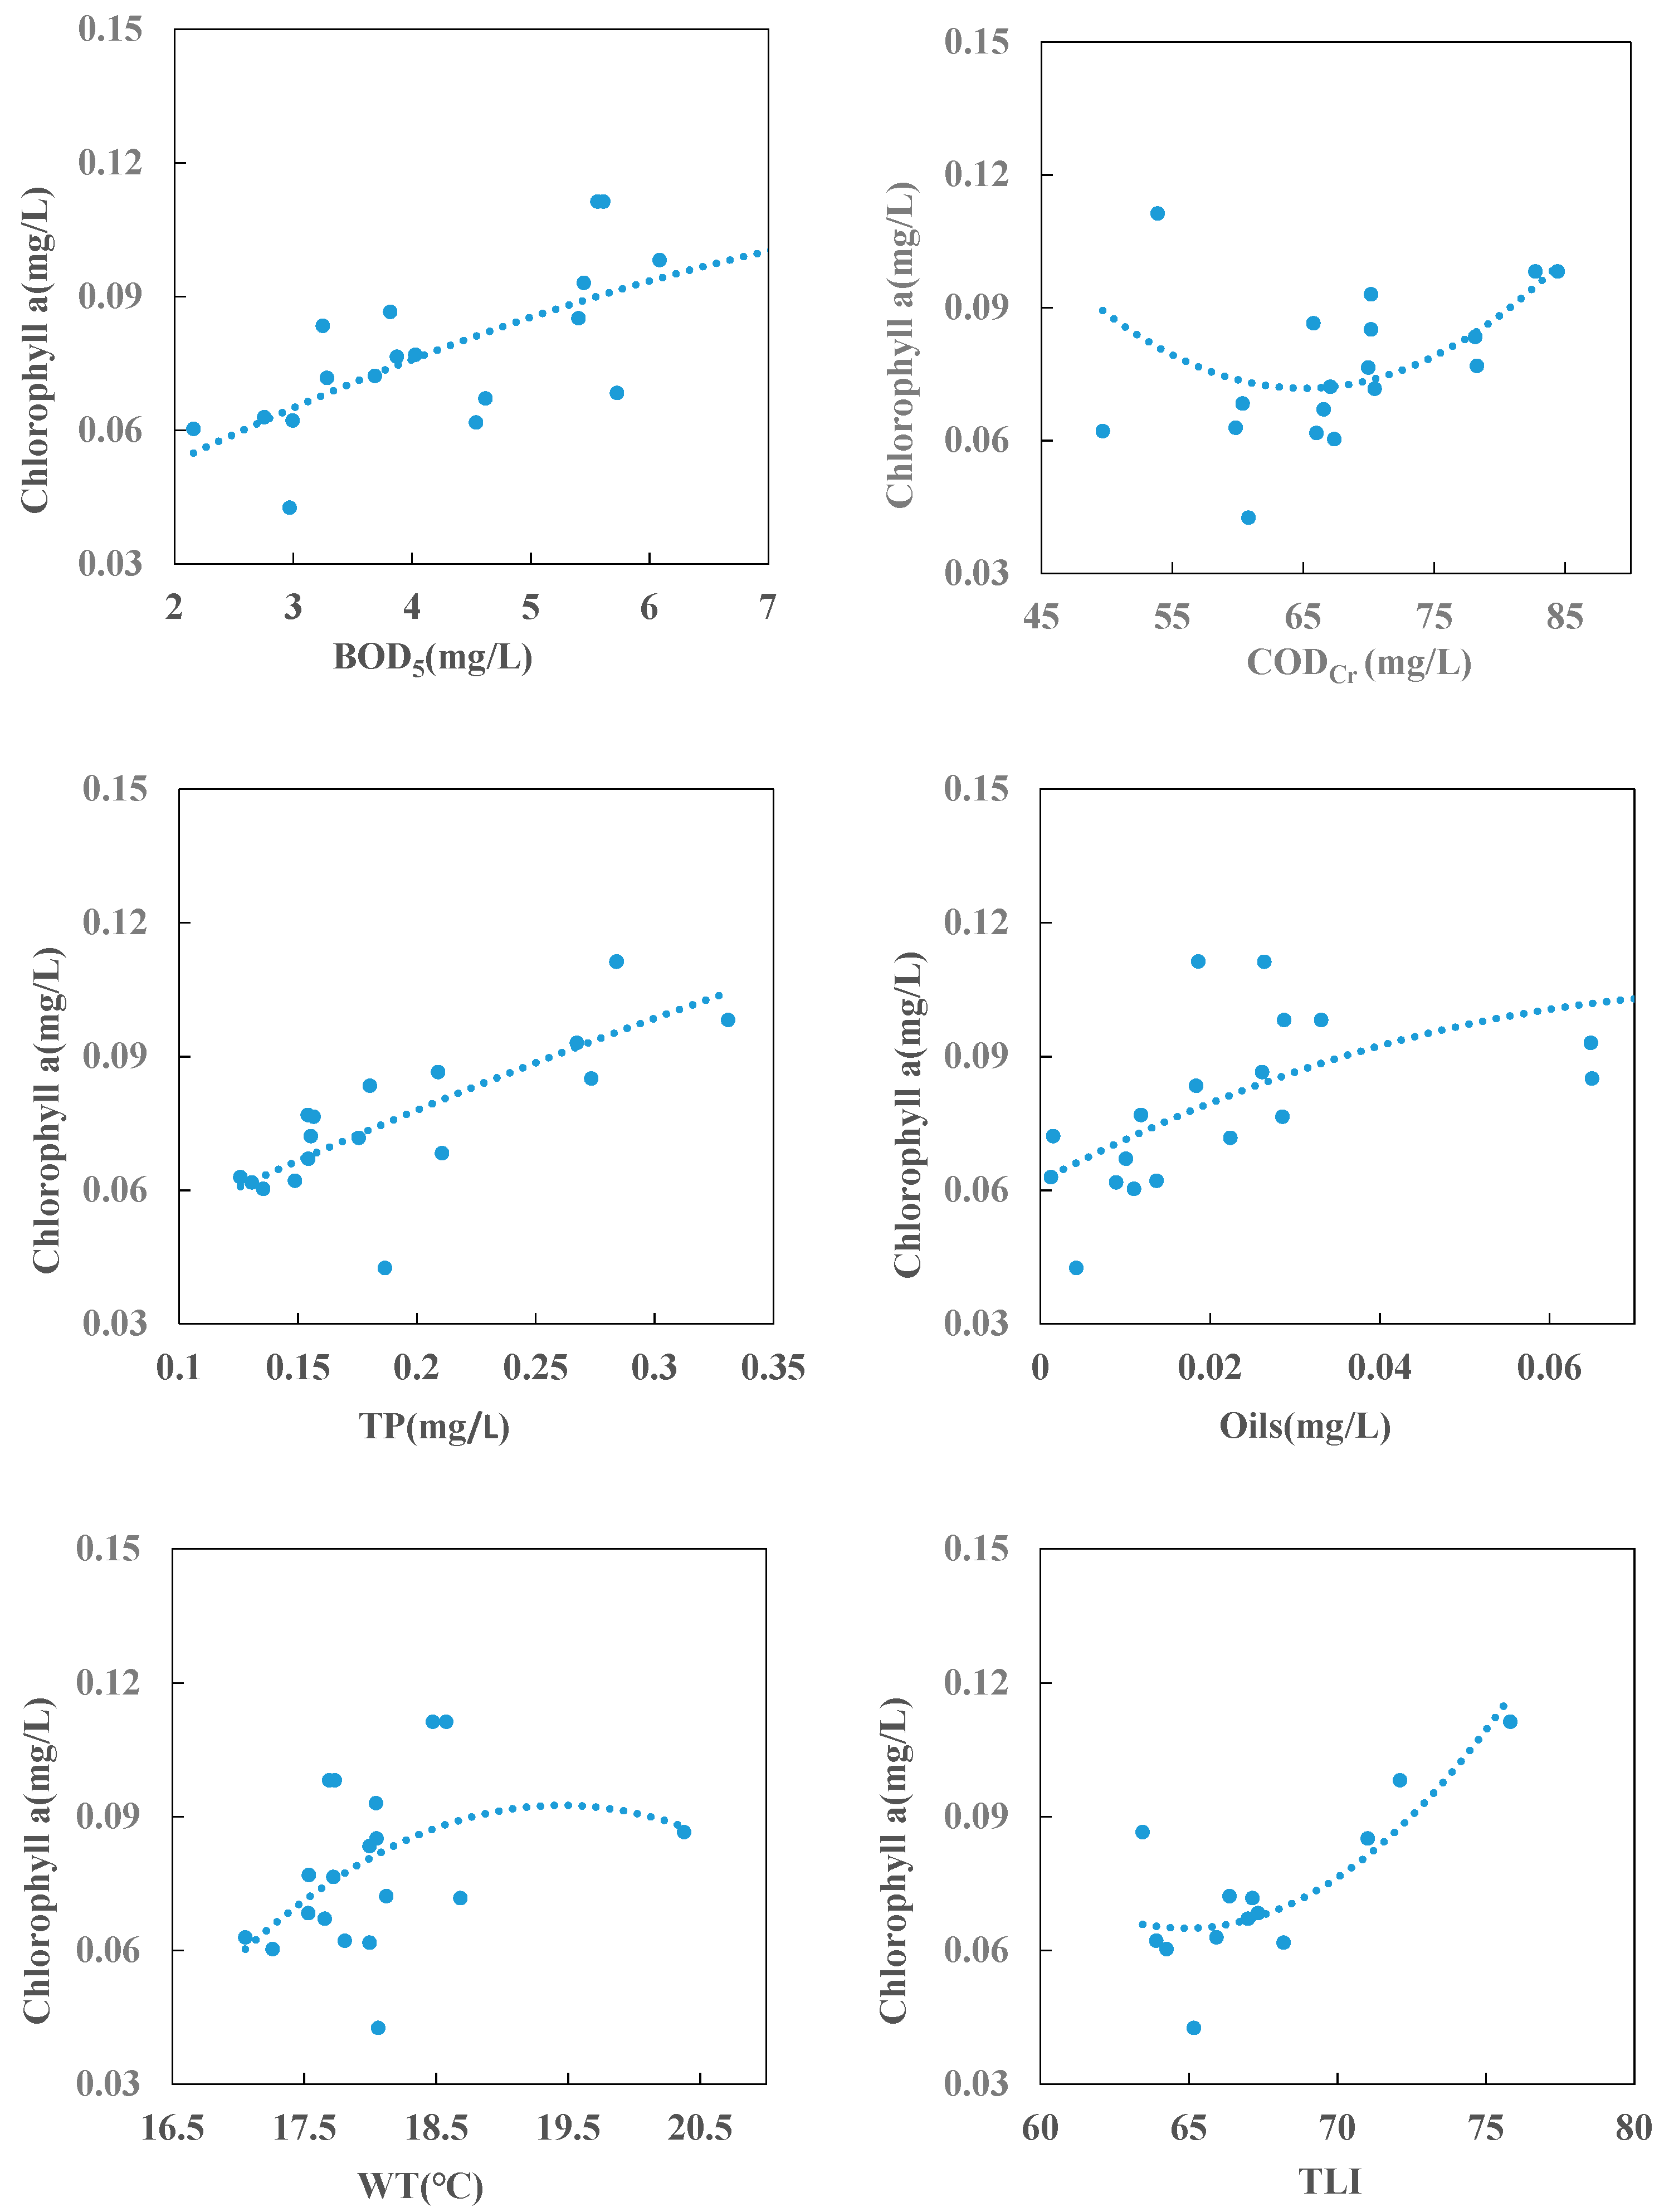
3.2. Internal Factors for Chlorophyll a (Chla) Concentration
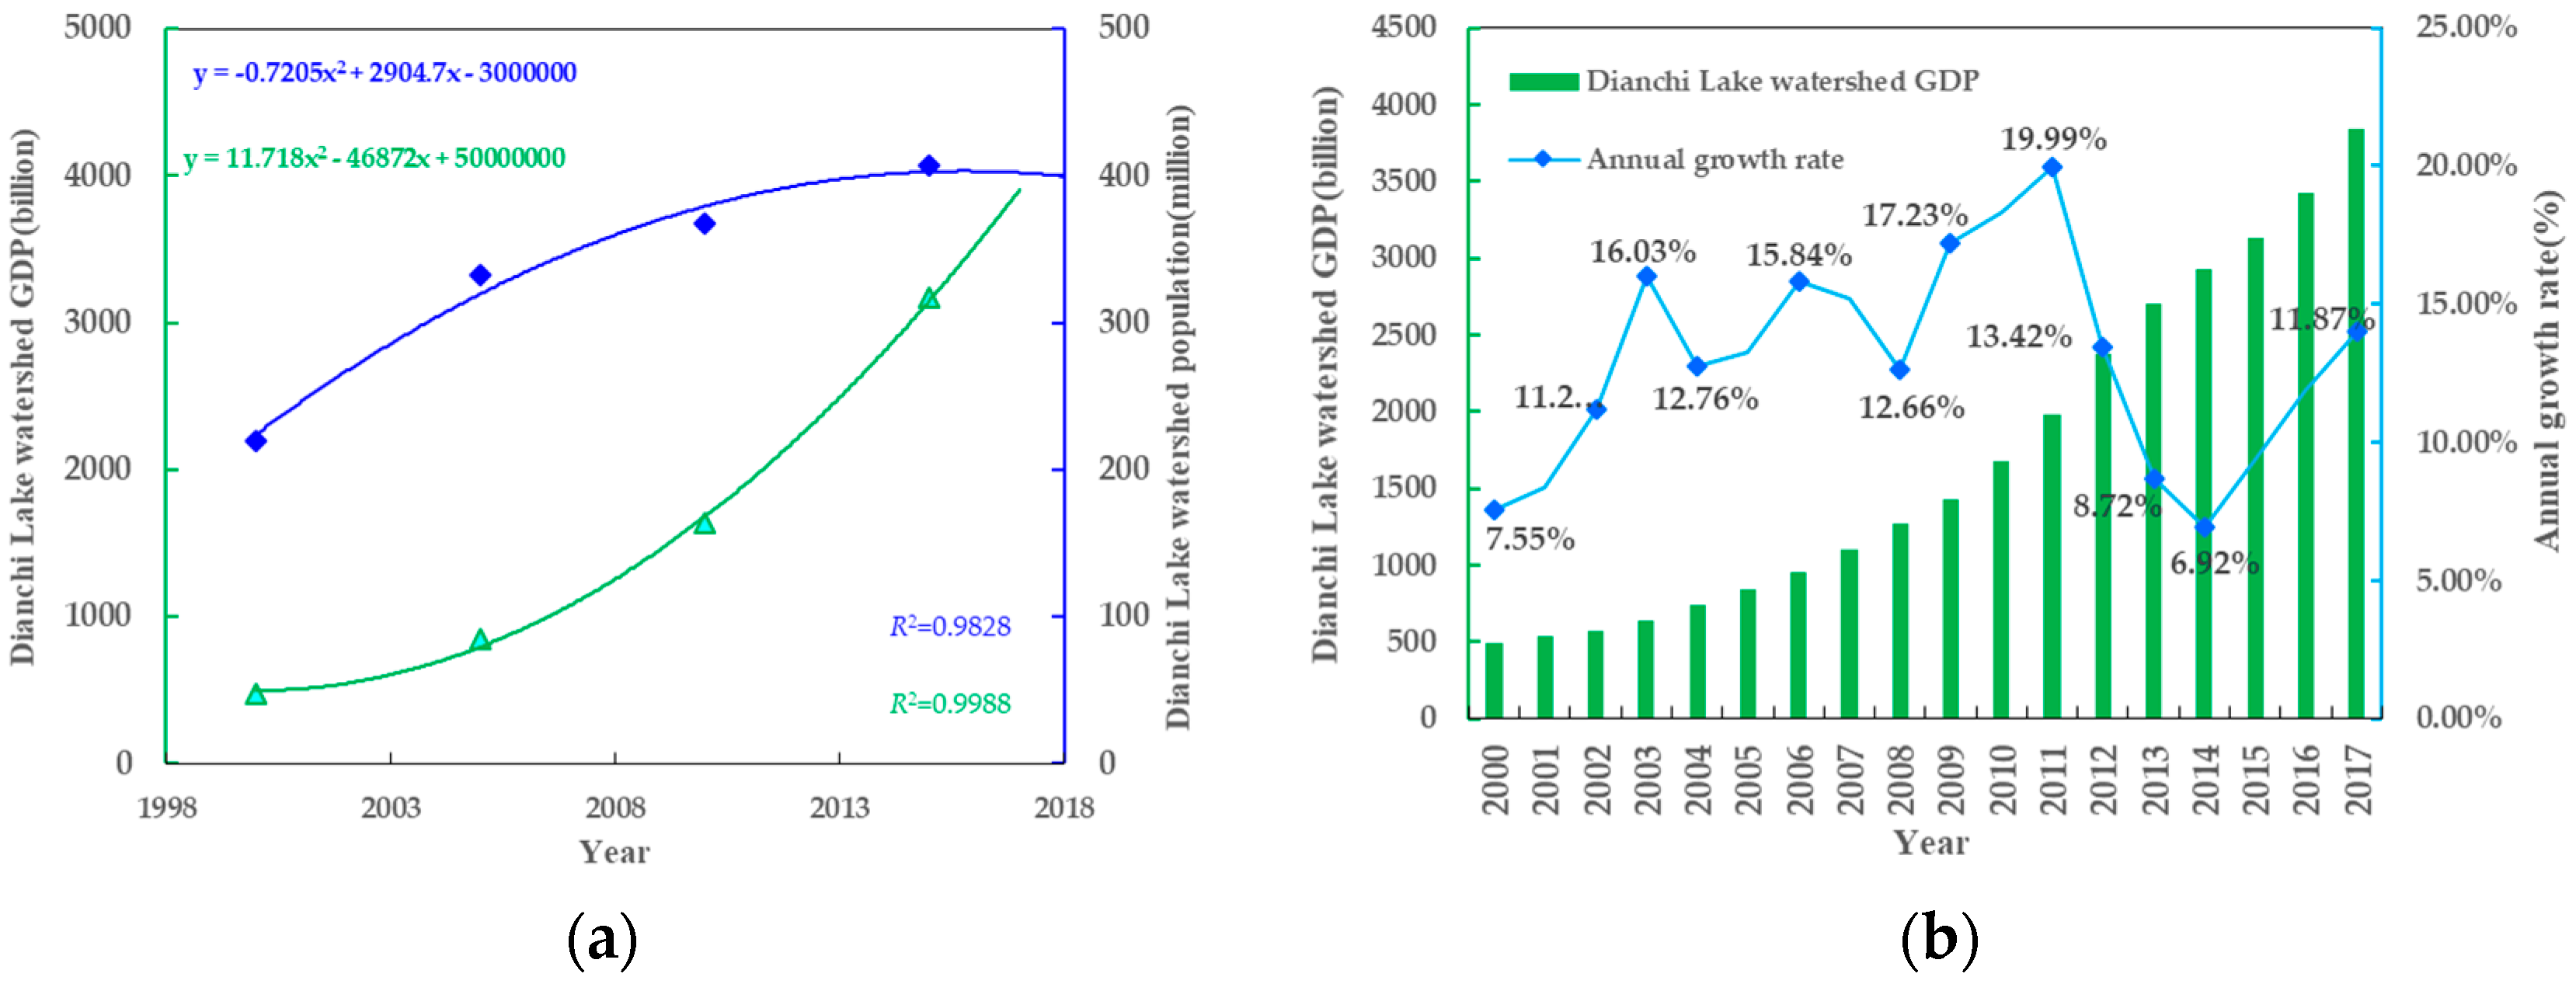
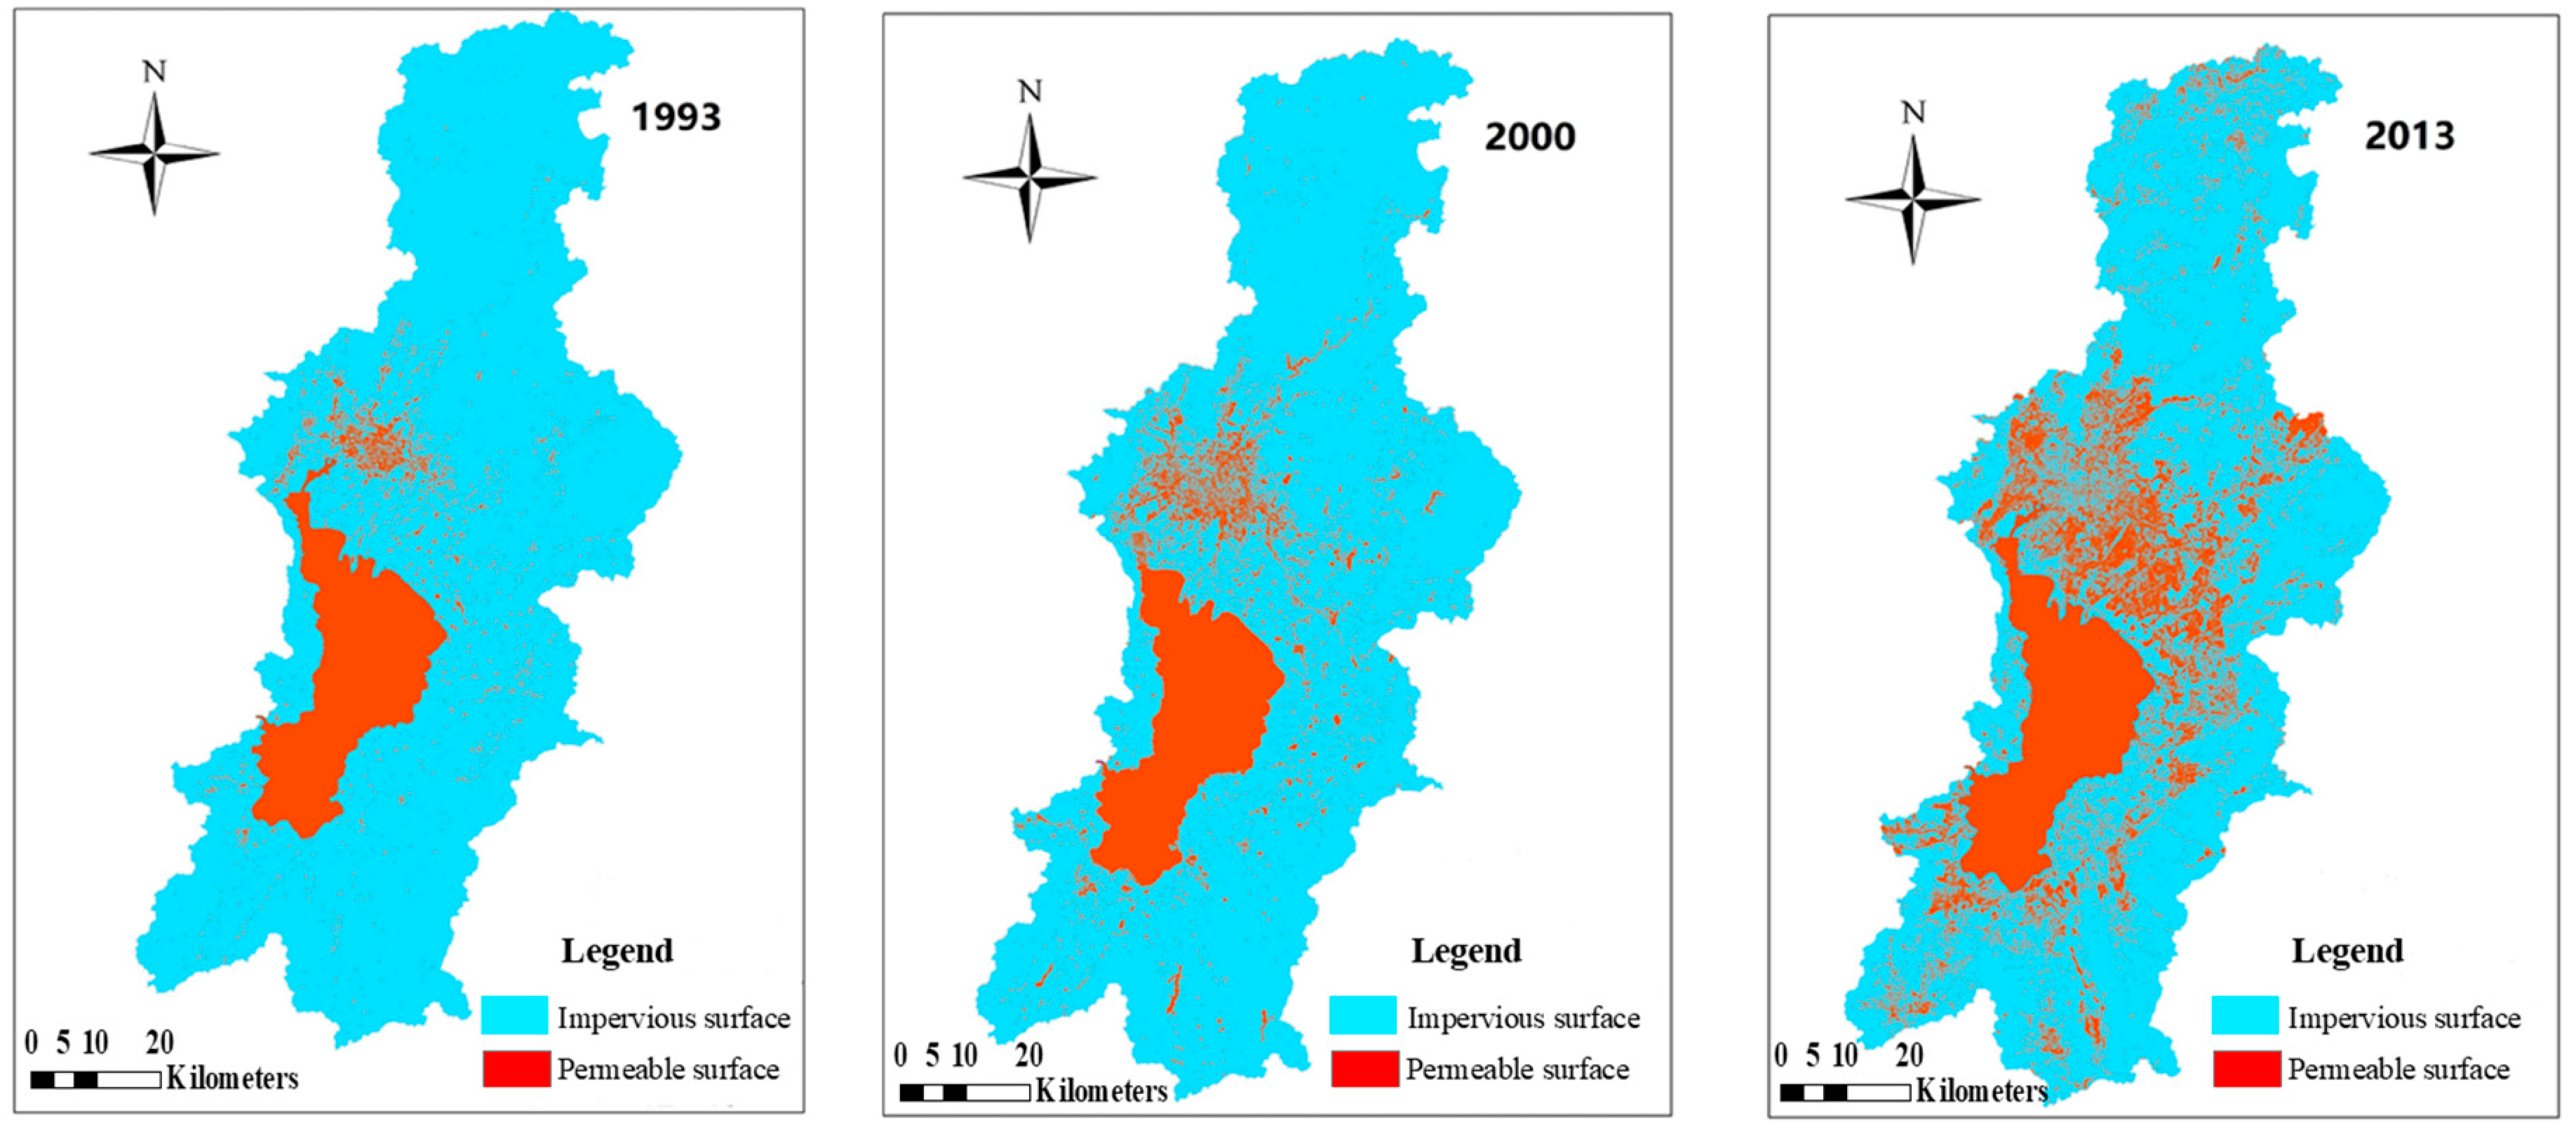
3.3. External Factors Changing Characteristics
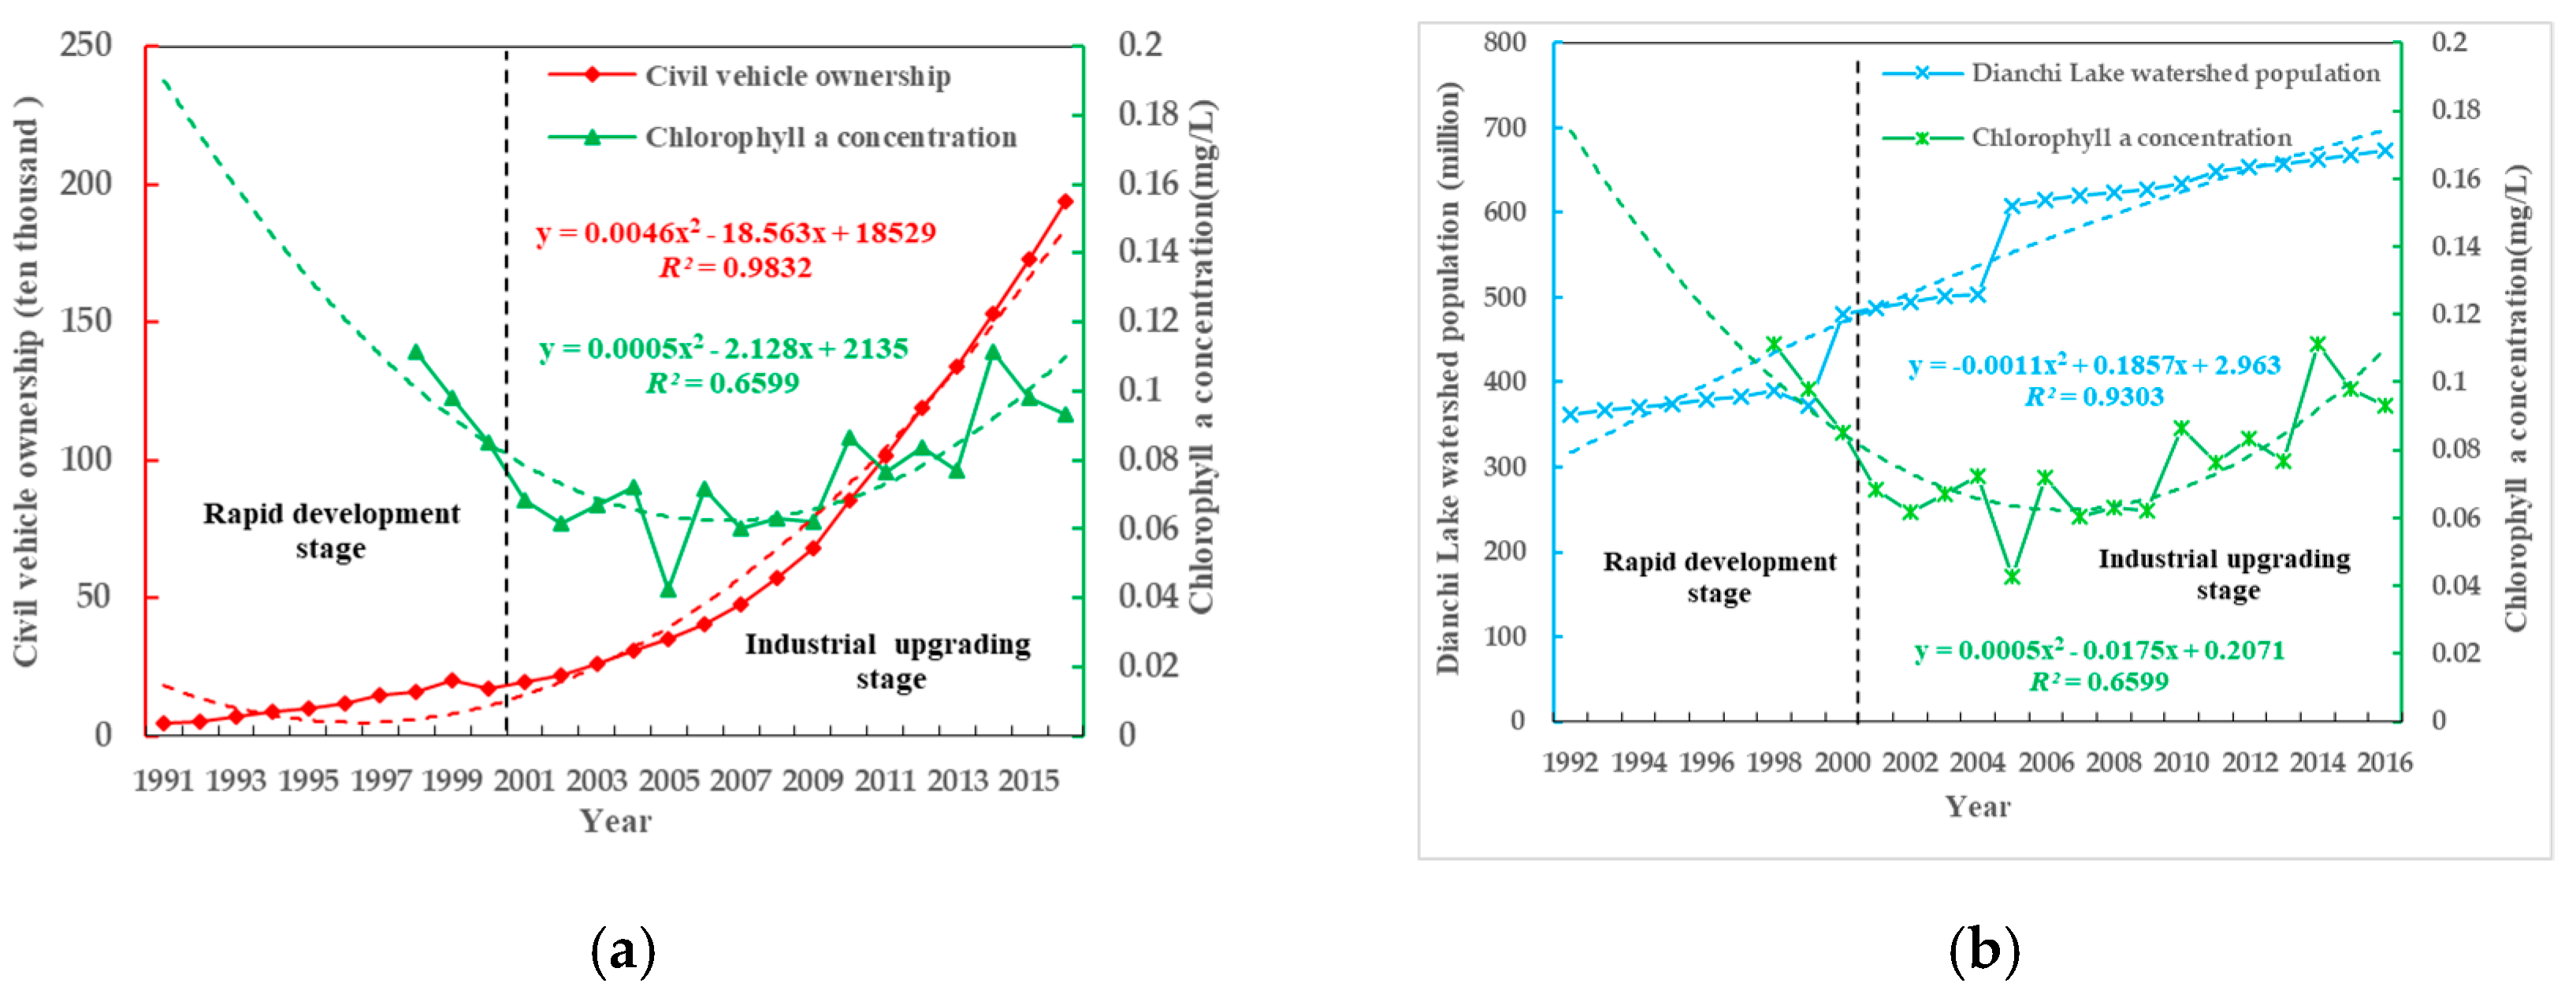
3.4. External Factors Impact on Chla Concentration
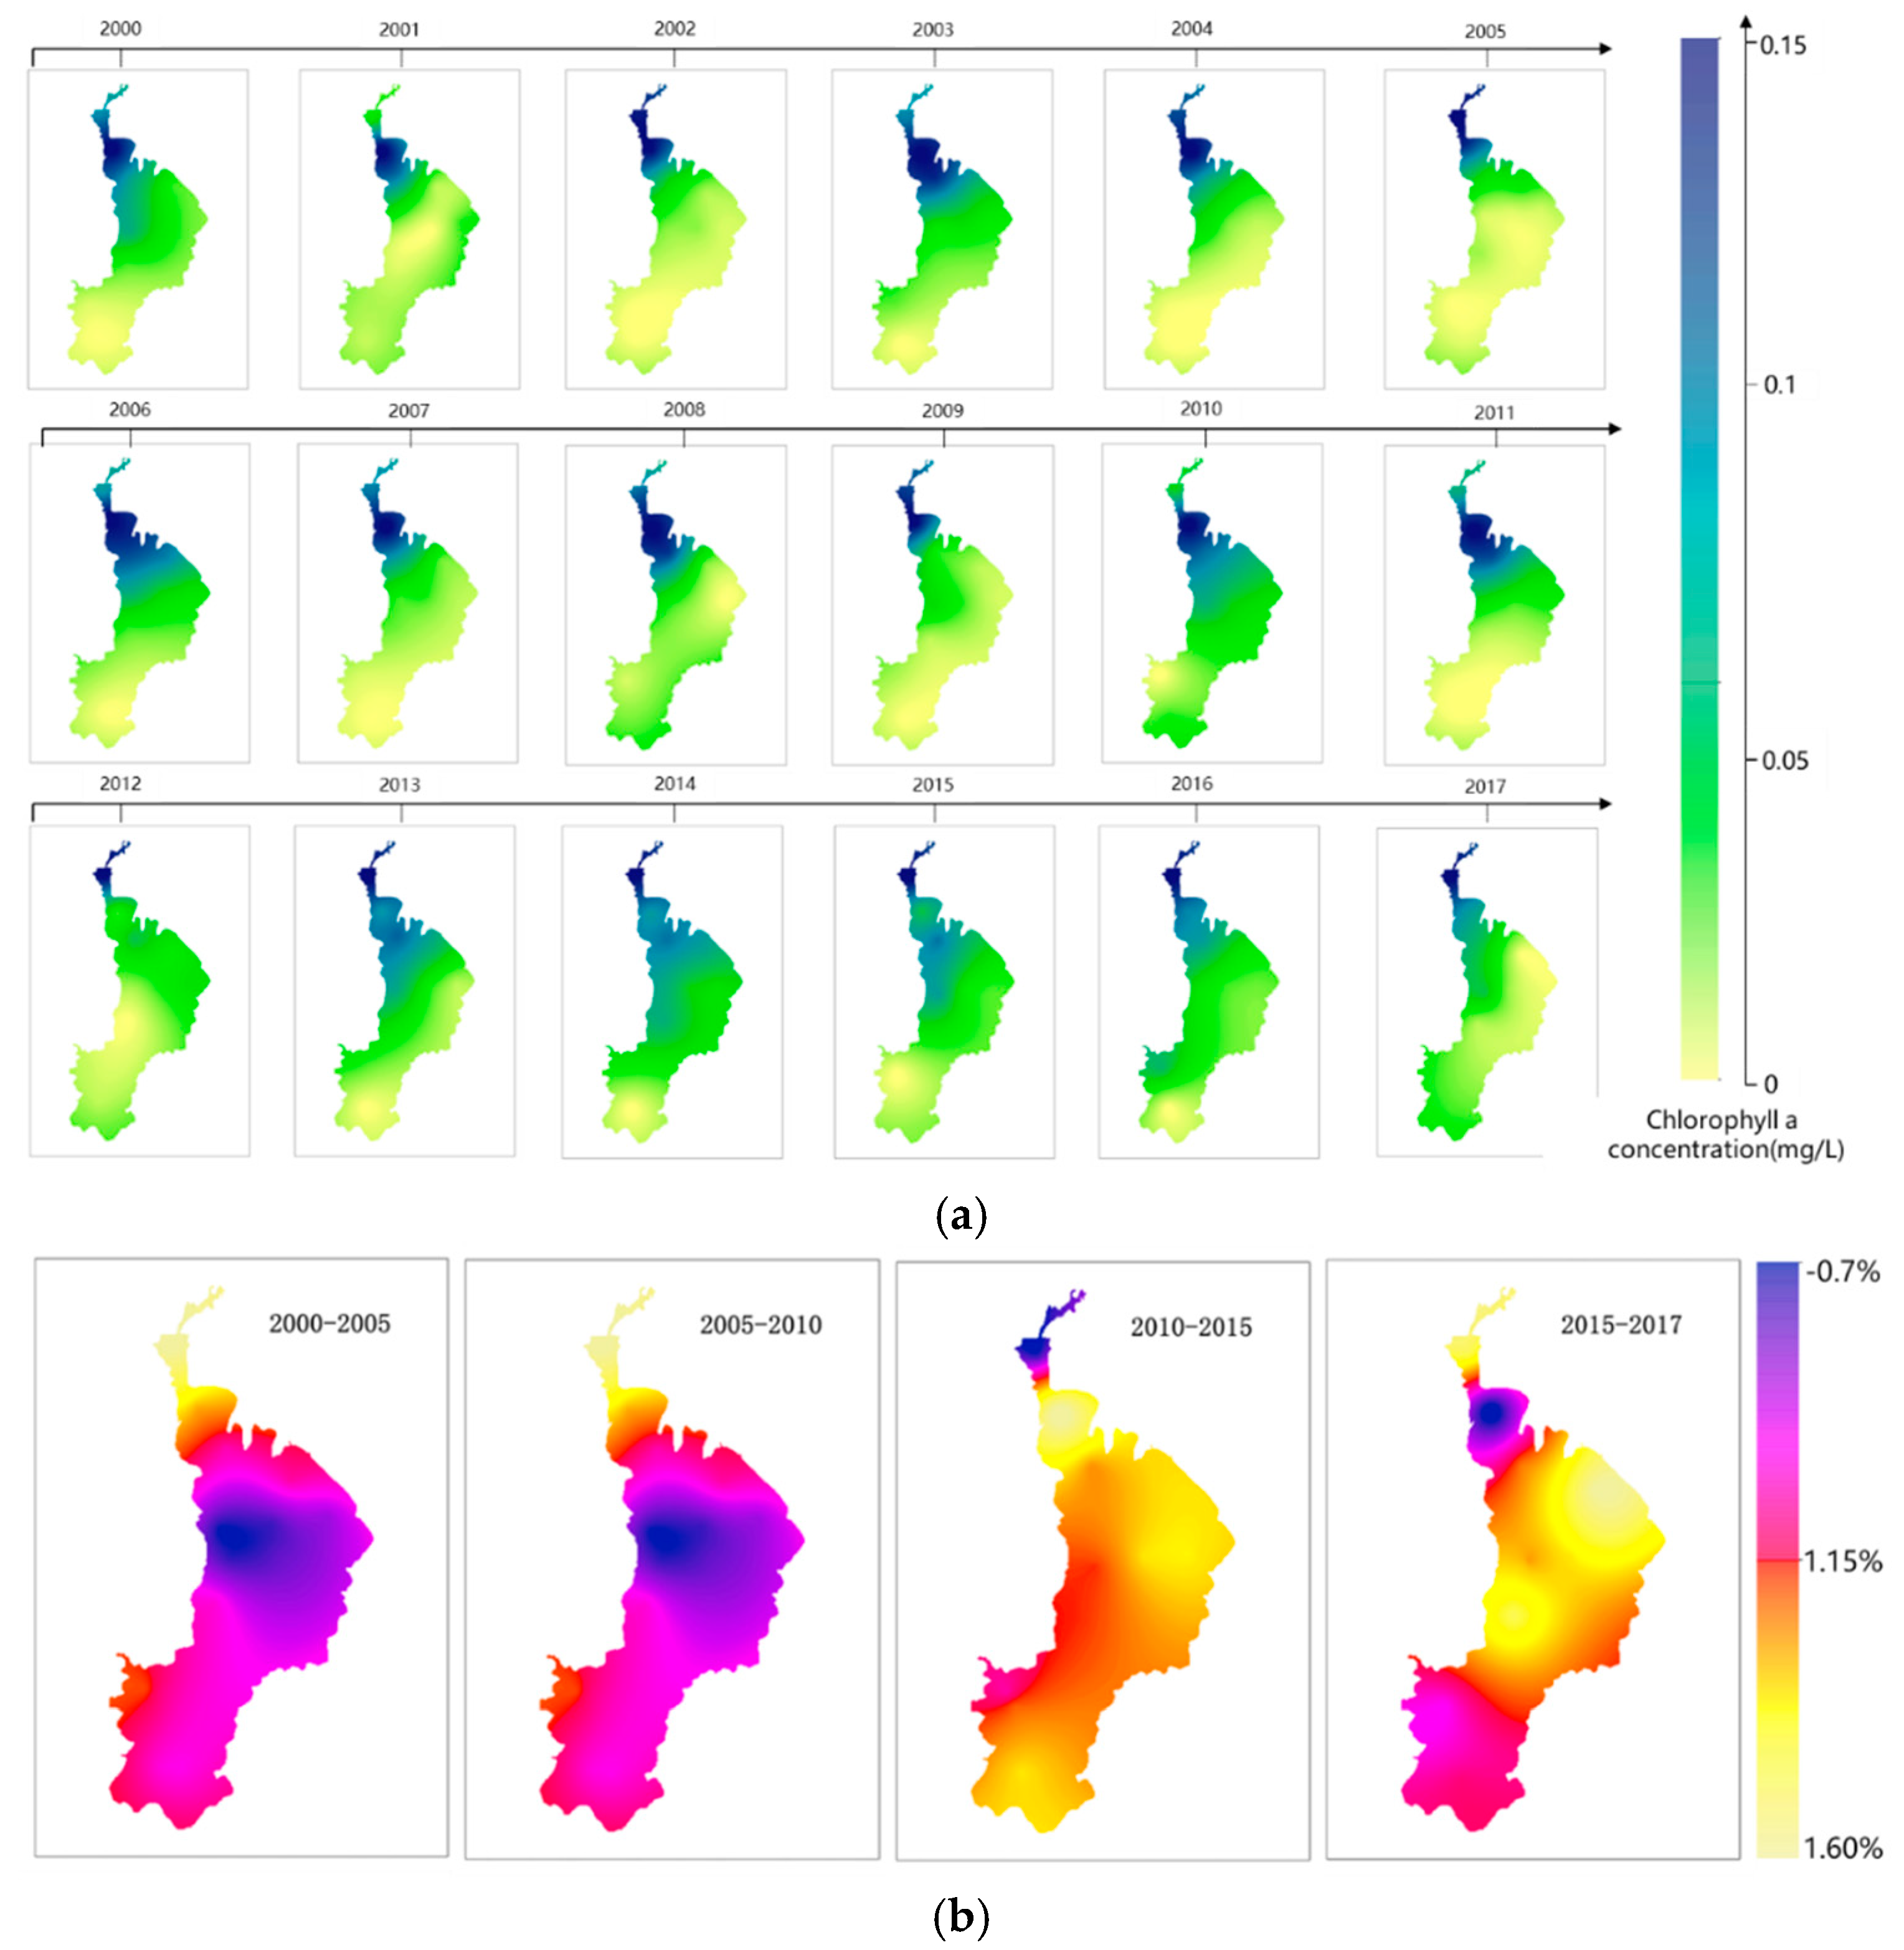
3.5. Spatiotemporal Changing Characteristics of Chla
3.6. Limitations and Implications
4. Conclusions
Supplementary Materials
Author Contributions
Funding
Conflicts of Interest
Data Availability Statement
References
- Forman, R.T.; Wu, J. Where to put the next billion people. Nature 2016, 537, 608–611. [Google Scholar] [CrossRef]
- Liu, X.; Ma, L.; Li, X.; Ai, B.; Li, S.; He, Z. Simulating urban growth by integrating landscape expansion index (LEI) and cellular automata. Int. J. Geogr. Inf. Sci. 2014, 28, 148–163. [Google Scholar] [CrossRef]
- Yang, K.; Yu, Z.; Luo, Y.; Zhou, X.; Shang, C. Spatial-temporal variation of lake surface water temperature and its driving factors in Yunnan-Guizhou Plateau. Water Resour. Res. 2019, 55, 4688–4703. [Google Scholar] [CrossRef]
- Luo, Y.; Zhang, Y.; Yang, K.; Yu, Z.; Zhu, Y. Spatiotemporal Variations in Dianchi Lake’s Surface Water Temperature from 2001 to 2017 Under the Influence of Climate Warming. IEEE ACCESS 2019, 7, 115378–115387. [Google Scholar] [CrossRef]
- Baojie, H.; Jin, Z. Constructing community gardens? residents’ attitude and behaviour towards edible landscapes in emerging urban communities of china. Urban For. Urban Green. 2018, 34, 154–165. [Google Scholar]
- Wang, J.; Fu, Z.; Qiao, H.; Liu, F. Assessment of eutrophication and water quality in the estuarine area of Lake Wuli, Lake Taihu, China. Sci. Total Environ. 2019, 650, 1392–1402. [Google Scholar] [CrossRef] [PubMed]
- Dugan, H.A.; Summers, J.C.; Skaff, N.K.; Krivak-Tetley, F.E.; Doubek, J.P.; Burke, S.M.; Kleeberg, A. Long-term chloride concentrations in North American and European freshwater lakes. Sci. Data 2017, 4, 170101. [Google Scholar] [CrossRef] [PubMed]
- Rabalais, N.N.; Turner, R.E.; Diaz, R.J.; Justic, D. Global change and eutrophication of coastal waters. ICES J. Mar. Sci. 2009, 66, 1528–1537. [Google Scholar] [CrossRef]
- Søndergaard, M.; Larsen, S.E.; Jørgensen, T.B.; Jeppesen, E. Using chlorophyll a and cyanobacteria in the ecological classification of lakes. Ecol. Indic. 2011, 11, 1403–1412. [Google Scholar] [CrossRef]
- Boyer, J.N.; Kelble, C.R.; Ortner, P.B.; Rudnick, D.T. Phytoplankton bloom status: Chlorophyll a biomass as an indicator of water quality condition in the southern estuaries of Florida, USA. Ecol. Indic. 2009, 9, S56–S67. [Google Scholar] [CrossRef]
- Mignot, A.; Claustre, H.; Uitz, J.; Poteau, A.; D’Ortenzio, F.; Xing, X. Understanding the seasonal dynamics of phytoplankton biomass and the deep chlorophyll maximum in oligotrophic environments: A bio-argo float investigation. Glob. Biogeochem. Cycles 2014, 28, 856–876. [Google Scholar] [CrossRef]
- Maier, H.R.; Dandy, G.C. Neural networks for the prediction and forecasting of water resources variables: A review of modelling issues and applications. Environ. Model. Softw. 2000, 15, 101–124. [Google Scholar] [CrossRef]
- Gori, M.; Tesi, A. On the problem of local minima in backpropagation. IEEE Trans. Pattern Anal. Mach. Intell. 1992, 1, 76–86. [Google Scholar] [CrossRef] [Green Version]
- Yang, K.; Yu, Z.; Luo, Y.; Yang, Y.; Zhao, L.; Zhou, X. Spatial and temporal variations in the relationship between lake water surface temperatures and water quality—A case study of dianchi lake. Sci. Total Environ. 2018, 624, 859–871. [Google Scholar] [CrossRef] [PubMed]
- Park, Y.; Cho, K.H.; Park, J.; Cha, S.M.; Kim, J.H. Development of early-warning protocol for predicting chlorophyll-a concentration using machine learning models in freshwater and estuarine reservoirs, korea. Sci. Total Environ. 2015, 502, 31–41. [Google Scholar] [CrossRef] [PubMed]
- Luo, Y.; Yang, K.; Yu, Z.; Chen, J.; Xu, Y.; Zhou, X.; Yang, Y. Dynamic monitoring and prediction of dianchi lake cyanobacteria outbreaks in the context of rapid urbanization. Environ. Sci. Pollut. Res. 2017, 24, 5335–5348. [Google Scholar] [CrossRef]
- Bostanmaneshrad, F.; Partani, S.; Noori, R.; Nachtnebel, H.P.; Berndtsson, R.; Adamowski, J.F. Relationship between water quality and macro-scale parameters (land use, erosion, geology, and population density) in the Siminehrood River Watershed. Sci. Total Environ. 2018, 639, 1588–1600. [Google Scholar] [CrossRef]
- Zaharescu, D.G.; Burghelea, C.I.; Hooda, P.S.; Lester, R.N.; Palanca-Soler, A. Small lakes in big landscape: Multi-scale drivers of littoral ecosystem in alpine lakes. Sci. Total Environ. 2016, 551, 496–505. [Google Scholar] [CrossRef] [Green Version]
- Dörnhöfer, K.; Oppelt, N. Remote sensing for lake research and monitoring–Recent advances. Ecol. Indic. 2016, 64, 105–122. [Google Scholar] [CrossRef]
- Pulliainen, J.; Kallio, K.; Eloheimo, K.; Koponen, S.; Hallikainen, M. A semi-operative approach to lake water quality retrieval from remote sensing data. Sci. Total Environ. 2001, 268, 79–93. [Google Scholar] [CrossRef]
- Wang, Z.H.; Bou-Zeid, E.; Smith, J.A. A coupled energy transparencyport and hydrological model for urban canopies evaluated using a wireless sensor network. Q. J. R. Meteorol. Soc. 2013, 139, 1643–1657. [Google Scholar] [CrossRef]
- Mou, W.; Tan, L.; Xiong, N. Data prediction, compression, and recovery in clustered wireless sensor networks for environmental monitoring applications. Inf. Sci. 2016, 329, 800–818. [Google Scholar]
- Lavigne, H.; D’Ortenzio, F.; Claustre, H.; Gacic, M. On the vertical distribution of the Chla concentration in the mediterranean sea: A watershed scale and seasonal approach. Biogeosci. Discuss. 2015, 12, 4139–4181. [Google Scholar] [CrossRef] [Green Version]
- Chen, M.; Ding, S.; Chen, X.; Sun, Q.; Fan, X.; Lin, J.; Zhang, C. Mechanisms driving phosphorus release during algal blooms on hourly changes in iron and phosphorus concentrations in sediments. Water Res. 2018, 133, 153–164. [Google Scholar] [CrossRef] [PubMed]
- Davis, C.C. Evidence for the eutrophication of Lake Erie from phytoplankton records. Limnol. Oceanogr. 1964, 9, 275–283. [Google Scholar] [CrossRef]
- Schelske, C.L.; Stoermer, E.F. Phosphorus, Silica, and Eutrophication of Lake Michigan; No. COO-2003-5; Michigan University, Ann Arbor. Great Lakes Research Division: Ann Arboe, MI, USA, 1970. [Google Scholar]
- Zhang, Y.; Liu, X.; Qin, B.; Shi, K.; Deng, J.; Zhou, Y. Aquatic vegetation in response to increased eutrophication and degraded light climate in Eastern Lake Taihu: Implications for lake ecological restoration. Sci. Rep. 2016, 6, 23867. [Google Scholar] [CrossRef]
- Zheng, Z.; Li, Y.; Guo, Y.; Xu, Y.; Liu, G.; Du, C. Landsat- long-term monitoring of total suspended matter concentration pattern change in the wet season for Dongting Lake, China. Remote. Sens. 2015, 7, 13975–13999. [Google Scholar] [CrossRef] [Green Version]
- Şener, Ş.; Şener, E.; Davraz, A. Evaluation of water quality using water quality index (WQI) method and GIS in Aksu River (SW-Turkey). Sci. Total Environ. 2017, 584, 131–144. [Google Scholar] [CrossRef]
- Zhang, Y.; Wu, Z.; Liu, M.; He, J.; Shi, K.; Zhou, Y.; Liu, X. Dissolved oxygen stratification and response to thermal structure and long-term climate change in a large and deep subtropical reservoir (Lake Qiandaohu, China). Water Res. 2015, 75, 249–258. [Google Scholar] [CrossRef]
- Niu, B.; Wang, H.; Loáiciga, H.A.; Hong, S.; Shao, W. Temporal variations of groundwater quality in the Western Jianghan Plain, China. Sci. Total Environ. 2017, 578, 542–550. [Google Scholar] [CrossRef]
- Dillon, P.J.; Rigler, F.H. A test of a simple nutrient budget model predicting the phosphorus concentration in lake water. J. Fish. Board Can. 1974, 31, 1771–1778. [Google Scholar] [CrossRef]
- Carlson, R.E. A trophic state index for lakes 1. Limnol. Oceanogr. 1977, 22, 361–369. [Google Scholar] [CrossRef] [Green Version]
- Jin, X.; Jing, Y.; Liu, W.; Guo, H.; Qian, B. Engineering techniques for polluted sediment dredging of lakes: Caohai of Lake Dianchi. Res. Environ. Sci./Huanjing Kexue Yanjiu 1999, 12, 9–12. [Google Scholar]
- Chen, X.; Gu, S.; Pu, C.; Xie, B.; Zhou, Y.; Ma, W. Study on the implementation plan of the Niulanjiang-Dianchi hydration project into the lake. China Rural. Water Hydropower 2012, 24–26. [Google Scholar]
- Gao, W.; Howarth, R.W.; Swaney, D.P.; Hong, B.; Guo, H.C. Enhanced n input to lake dianchi watershed from 1980 to 2010: Drivers and consequences. Sci. Total Environ. 2015, 505, 376–384. [Google Scholar] [CrossRef] [PubMed]
- Gupta, R.; Somanathan, E.; Dey, S. Global warming and local air pollution have reduced wheat yields in india. Clim. Chang. 2017, 140, 593–604. [Google Scholar] [CrossRef]
- Cloete, N.A.; Malekian, R.; Nair, L. Design of smart sensors for real-time water quality monitoring. IEEE Access 2017, 4, 3975–3990. [Google Scholar] [CrossRef]
- Cramer, W.; Guiot, J.; Fader, M.; Garrabou, J.; Gattuso, J.P.; Iglesias, A.; Lange, M.A.; Lionello, P.; Llasat, M.C.; Paz, S.; et al. Climate change and interconnected risks to sustainable development in the Mediterranean. Nature Climate Change, 1. Available online: https://www.nature.com/articles/s41558-018-0299-2 (accessed on 15 December 2019).
- Zhou, X.; Tong, W.; Li, D. Modeling Housing Rent in the Atlanta Metropolitan Area Using Textual Information and Deep Learning. ISPRS Int. J. Geo-Inf. 2019, 8, 349. [Google Scholar] [CrossRef] [Green Version]
- China Environmental Status Bulletin 2002. Available online: http://www.mee.gov.cn/ (accessed on 3 March 2003).
- China National Environmental Monitoring Centre. Lake (Reservoir) Eutrophication Evaluation Method and Classification Technical Provisions, 2001; China National Environmental Monitoring Centre: Beijing, China, 2002. [Google Scholar]
- State Environmental Protection Administration (SEPA). GB3838-2002. Environmental Quality Standard for Surface Water; Standards Press: Beijing, China, 2002; pp. 1–8. (In Chinese) [Google Scholar]
- National Bureau of Statistics. China Statistical Yearbook; China Statistics Press: Beijing, China, 1988–2018. [Google Scholar]
- Yunnan Statistical Press. Yunnan Statistical Yearbook 2000; Yunnan Statistical Press: Kunming, China, 2017. (In Chinese) [Google Scholar]
- Wang, S.; Jin, X.; Zhao, H.; Wu, F. Phosphorus release characteristics of different trophic lake sediments under simulative disturbing conditions. J. Hazard. Mater. 2009, 161, 1551–1559. [Google Scholar] [CrossRef]
- Yang, K.; Pan, M.; Luo, Y.; Chen, K.; Zhao, Y.; Zhou, X. A time-series analysis of urbanization-induced impervious surface area extent in the Dianchi Lake watershed from 1988–2017. Int. J. Remote Sens. 2019, 40, 573–592. [Google Scholar] [CrossRef]
- Yang, X.; Liu, Q.; Fu, G.; He, Y.; Luo, X.; Zheng, Z. Spatiotemporal patterns and source attribution of nitrogen load in a river watershed with complex pollution sources. Water Res. 2016, 94, 187–199. [Google Scholar] [CrossRef] [PubMed] [Green Version]
- National Bureau of Statistics. China Statistics Press, Beijing. 1996. Available online: http://www.stats.gov.cn/ (accessed on 17 April 1997).
- National Development and Reform Commission. National Development and Reform Commission Peoples Republic of China. 2007. Available online: http://www.ndrc.gov.cn/ (accessed on 28 July 2007).
- Banadda, E.N.; Kansiime, F.; Kigobe, M.; Kizza, M.; Nhapi, I. Landuse- nonpoint source pollution: A threat to water quality in Murchison Bay. Uganda. Water Policy 2009, 11 (Suppl. 1), 94–105. [Google Scholar] [CrossRef]
- Van Bohemen, H.D.; Van de Laak, W.J. The influence of road infrastructure and traffic on soil, water, and air quality. Environ. Manag. 2003, 31, 50–68. [Google Scholar] [CrossRef] [PubMed]
- Kim, H.; Jeong, H.; Jeon, J.; Bae, S. The impact of impervious surface on water quality and its threshold in Korea. Water 2016, 8, 111. [Google Scholar] [CrossRef] [Green Version]
- Sun, W.; Xia, C.; Xu, M.; Guo, J.; Sun, G. Application of modified water quality indices as indicators to assess the spatial and temporal trends of water quality in the Dongjiang River. Ecol. Indic. 2016, 66, 306–312. [Google Scholar] [CrossRef]
- Romero, E.; Le Gendre, R.; Garnier, J.; Billen, G.; Fisson, C.; Silvestre, M.; Riou, P. Long-term water quality in the lower Seine: Lessons learned over 4 decades of monitoring. Environ. Sci. Policy 2016, 58, 141–154. [Google Scholar] [CrossRef] [Green Version]


| Parameter | Chla | TP | TN | SD | CODMn |
|---|---|---|---|---|---|
| 1 | 0.84 | 0.82 | −0.83 | 0.83 | |
| 1 | 0.7056 | 0.6724 | 0.6889 | 0.6889 |
| Water Quality Classification | Scope of Application |
|---|---|
| class I | Mainly applicable to source water, national nature reserve |
| class II | Mainly applicable to centralized drinking water, surface water source, first-class protection area, etc. |
| class III | It is mainly applicable to the secondary protection zone, fishery water area and swimming area of centralized drinking water surface water source. |
| class IV | It is mainly suitable for general industrial water use areas and recreational water areas where the human body is not in direct contact. |
| class V | Mainly applicable to agricultural water areas and general landscape requirements |
| WQI | FE | R2 | P | EV (mg/L) | WQS (mg/L) | Mean(mg/L) | Threshold (mg/L) | |
|---|---|---|---|---|---|---|---|---|
| Class III | Class V | |||||||
| pH | y = −0.0294x2 + 0.5299x − 2.3019 | 0.08 | 0.04 | 8.86 | 6~9 | 8.89 | 0.086 | |
| DO | y = −0.0015x2 + 0.0315x − 0.0714 | 0.08 | 0.02 | 7.05 | 5 | 2 | 7.20 | 0.094 |
| CODMn | y = 0.0008x2 − 0.0116x + 0.1173 | 0.10 | 0.09 | 9.70 | 6 | 15 | 9.81 | 0.075 |
| CODCr | y = 7E-05x2 − 0.0096x + 0.3857 | 0.22 | 0.46 | 65.17 | 20 | 40 | 65.61 | 0.057 |
| BOD5 | y = −0.0007x2 + 0.0156x + 0.0245 | 0.50 | 0.76 | 2.98 | 4 | 10 | 3.26 | 0.062 |
| NH3-N | y = 0.9721x2 − 0.5243x + 0.145 | 0.08 | 0.09 | 0.25 | 1 | 2 | 0.28 | 0.074 |
| TP | y = −0.1397x2 + 0.2756x + 0.0284 | 0.64 | 0.03 | 0.35 | 0.2 | 0.4 | 0.16 | 0.107 |
| TN | y = 0.0114x2 − 0.0673x + 0.1693 | 0.52 | 0.07 | 2.25 | 1 | 2 | 2.37 | 0.069 |
| Oils | y = −5.8041x2 + 0.9907x + 0.062 | 0.16 | 0.388 | 0.01 | 0.05 | 1 | 0.01 | 0.019 |
| Transparency | y = −0.1583x2 + 0.1096x + 0.0641 | 0.10 | 0.11 | 0.50 | - | - | 0.43 | 0.045 |
| TIL | y = 0.0004x2 − 0.0564x + 1.8954 | 0.68 | 0.03 | 31.67 | - | - | 33.49 | 0.092 |
© 2019 by the authors. Licensee MDPI, Basel, Switzerland. This article is an open access article distributed under the terms and conditions of the Creative Commons Attribution (CC BY) license (http://creativecommons.org/licenses/by/4.0/).
Share and Cite
Hou, P.; Luo, Y.; Yang, K.; Shang, C.; Zhou, X. Changing Characteristics of Chlorophyll a in the Context of Internal and External Factors: A Case Study of Dianchi Lake in China. Sustainability 2019, 11, 7242. https://0-doi-org.brum.beds.ac.uk/10.3390/su11247242
Hou P, Luo Y, Yang K, Shang C, Zhou X. Changing Characteristics of Chlorophyll a in the Context of Internal and External Factors: A Case Study of Dianchi Lake in China. Sustainability. 2019; 11(24):7242. https://0-doi-org.brum.beds.ac.uk/10.3390/su11247242
Chicago/Turabian StyleHou, Pengfei, Yi Luo, Kun Yang, Chunxue Shang, and Xiaolu Zhou. 2019. "Changing Characteristics of Chlorophyll a in the Context of Internal and External Factors: A Case Study of Dianchi Lake in China" Sustainability 11, no. 24: 7242. https://0-doi-org.brum.beds.ac.uk/10.3390/su11247242