Article

The Relationship between NDVI and Climate Factors at Different Monthly Time Scales: A Case Study of Grasslands in Inner Mongolia, China (1982–2015)

1
College of Earth Science, Chengdu University of Technology, Chengdu 610059, China
2
State Key Laboratory of Severe Weather, Chinese Academy of Meteorological Sciences, Beijing 100081, China
3
Collaborative Innovation Centre on Forecast and Evaluation of Meteorological Disasters, Nanjing University of Information Science & Technology, Nanjing 210044, China
4
State Key Laboratory of Desert and Oasis Ecology, Xinjiang Institute of Ecology and Geography, Chinese Academy of Sciences, Urumqi 830011, China
5
Shandong General Station of Agricultural Technology Extension, Jinan 250013, China
6
Faculty of Environment, University of Science, Vietnam National University Ho Chi Minh City, Ho Chi Minh City 700000, Vietnam
*
Authors to whom correspondence should be addressed.
Sustainability 2019, 11(24), 7243; https://0-doi-org.brum.beds.ac.uk/10.3390/su11247243
Submission received: 22 November 2019 / Revised: 13 December 2019 / Accepted: 13 December 2019 / Published: 17 December 2019
(This article belongs to the Section Environmental Sustainability and Applications)

Abstract

:
There are currently only two methods (the within-growing season method and the inter-growing season method) used to analyse the normalized difference vegetation index (NDVI)–climate relationship at the monthly time scale. What are the differences between the two methods, and why do they exist? Which method is more suitable for the analysis of the relationship between them? In this study, after obtaining NDVI values (GIMMS NDVI3g) near meteorological stations and meteorological data of Inner Mongolian grasslands from 1982 to 2015, we analysed temporal changes in NDVI and climate factors, and explored the difference in Pearson correlation coefficients (R) between them via the above two analysis methods and analysed the change in R between them at multiple time scales. The research results indicated that: (1) NDVI was affected by temperature and precipitation in the area, showing periodic changes, (2) NDVI had a high value of R with climate factors in the within-growing season, while the significant correlation between them was different in different months in the inter-growing season, (3) with the increase in time series, the value of R between NDVI and climate factors showed a trend of increase in the within-growing season, while the value of R between NDVI and precipitation decreased, but then tended toward stability in the inter-growing season, and (4) when exploring the NDVI–climate relationship, we should first analyse the types of climate in the region to avoid the impacts of rain and heat occurring during the same period, and the inter-growing season method is more suitable for the analysis of the relationship between them.

1. Introduction

Vegetation connects the water, the soil, the atmosphere and other natural substances, and plays a vital role in the terrestrial circulation of matter and energy [1,2,3,4]. Climate is the primary factor of vegetation change, especially temperature and precipitation, which have important influences on vegetation growth, distribution and carbon budget functions [5,6,7]. Nowadays, the changes of global climate and environment are obvious, and the phenomenon of climate anomalies has become prominent [8,9,10,11,12]. Climate change will inevitably cause variation in vegetation growth and affect vegetation dynamics and functions [3,13,14]. Therefore, to understand the evolution of vegetation and predict its change characteristics under future climate changes, it is very valuable to study the normalized difference vegetation index (NDVI)–climate relationship in-depth and reveal its internal relations.
The vegetation index is usually used to indicate vegetation growth and ecosystem change [1]. The development of remote sensing technology makes it more efficient and convenient for us to obtain the characteristics of vegetation change [15]. Not only is NDVI simple and easy to obtain, but it also reflects the status of surface vegetation to a large extent and is widely used at present [16,17,18,19]. The existing NDVI time series data sets mainly include the SPOT (Systeme Probatoire d’ Observation de la Terre)/Vegetation NDVI, MODIS (Moderate–resolution Imaging Spectroradiometer) NDVI, and GIMMS (Global Inventory Monitoring and Modeling Studies) NDVI data sets, as well as others. These data sets have been commonly used to analyse the vegetation responses to climate on global and regional scales [20,21,22,23].
The NDVI–climate relationship at different scales has been well documented. At the global scale, NDVI is greatly affected by temperature, and the increase of vegetation activities in the Northern Hemisphere is mainly caused by a temperature increase [24,25,26,27]. Further, precipitation has a great influence on NDVI at the regional scale, especially in arid and semi-arid areas [28,29]. However, some areas are affected differently by climate factors at different times. In East Asia, the increase in vegetation cover before 1997 was mainly affected by the increase in temperature, while the change in precipitation after 1997 was the main factor for the decrease in vegetation cover [30]. The inter-annual variation of vegetation in Inner Mongolia is greatly affected by precipitation, while vegetation growth is affected by temperature and precipitation at the monthly time scale [31,32]. Due to the complex relationship between vegetation and climate, and the differences in spatiotemporal scale and vegetation type, analytical results may vary.
The choice of a time scale is very important when analysing the NDVI–climate relationship. According to the literature, there are many studies on the relationship between them at annual or seasonal time scales [18,33,34]. However, vegetation has a cumulative effect on climate change [19,35,36,37], and at the annual or seasonal time scales, the influence of hydrothermal factors on vegetation is not clear enough, which cannot truly reflect the relationship between them [38,39]. At the monthly time scale, hydrothermal conditions have a more obvious effect on vegetation growth than other conditions [39], and the lag relation between them is also more obvious. Therefore, it may be more reasonable to explore the NDVI–climate relationship at the monthly time scale. At present, there are two different methods performed at the monthly time scale that explore the NDVI–climate relationship: one method calculates the correlation coefficients between them in all months in multiple growing seasons, and we call this method the within-growing season method [13,40,41,42,43,44,45], while the other method calculates the correlation coefficients between them in the same month in multiple growing seasons, and we call this method the inter-growing season method [10,17,46]. However, what are the differences between the two methods, and why do they exist? Which method is more suitable for the analysis of the relationship between them? This requires further analysis [47].
In view of the above problems, we took the Inner Mongolian grasslands as a case study and obtained the NDVI values (GIMMS NDVI3g) near the meteorological stations and meteorological data of the Inner Mongolian grasslands from 1982 to 2015, and the value of R between NDVI and climate factors was analysed at different time scales. The main aims are: (1) to understand the temporal changes in NDVI and climate factors and analyse the relationships between them, (2) to explore the NDVI–climate relationship by R and compare the differences in R between them at different monthly time scales, and (3) to analyse the change in R between NDVI and climate factors at multiple time scales and determine which method is more suitable for the analysis of the relationship between them. This study is expected to accurately explain the difference between NDVI and climate factors at different monthly time scales, and to provide a reasonable analysis method for revealing the NDVI–climate relationship in the future.

2. Materials and Methods
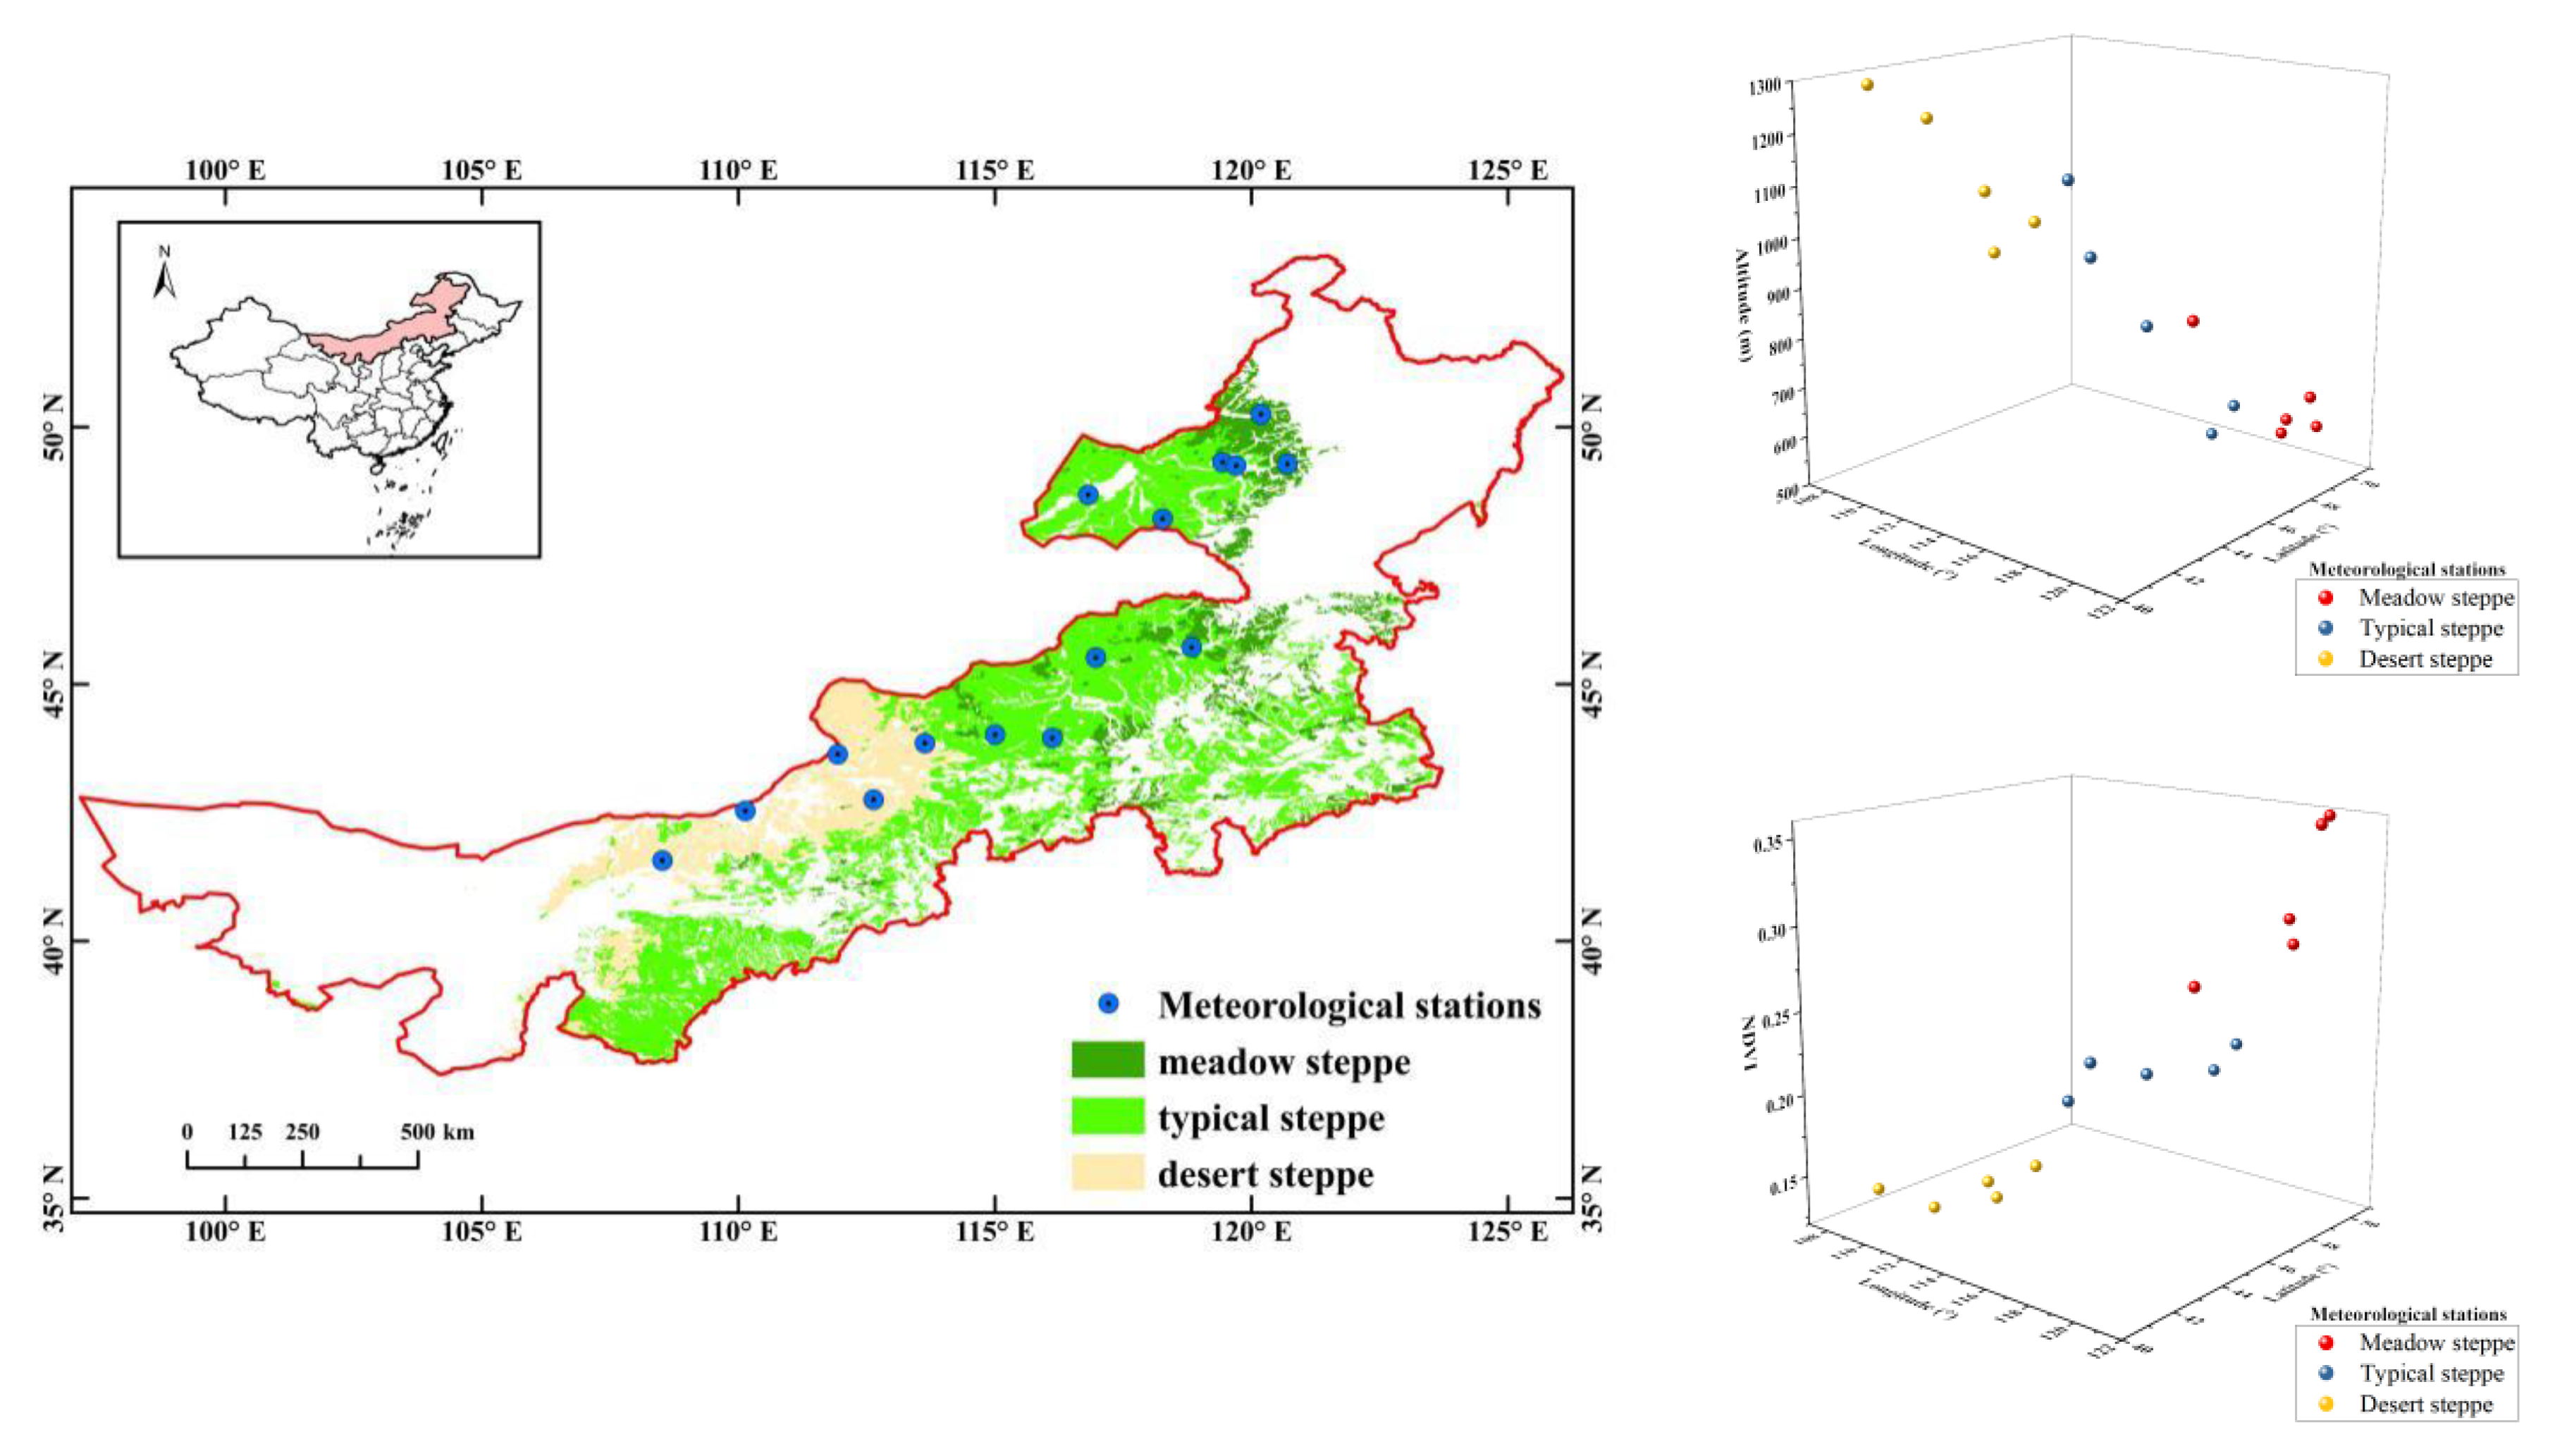
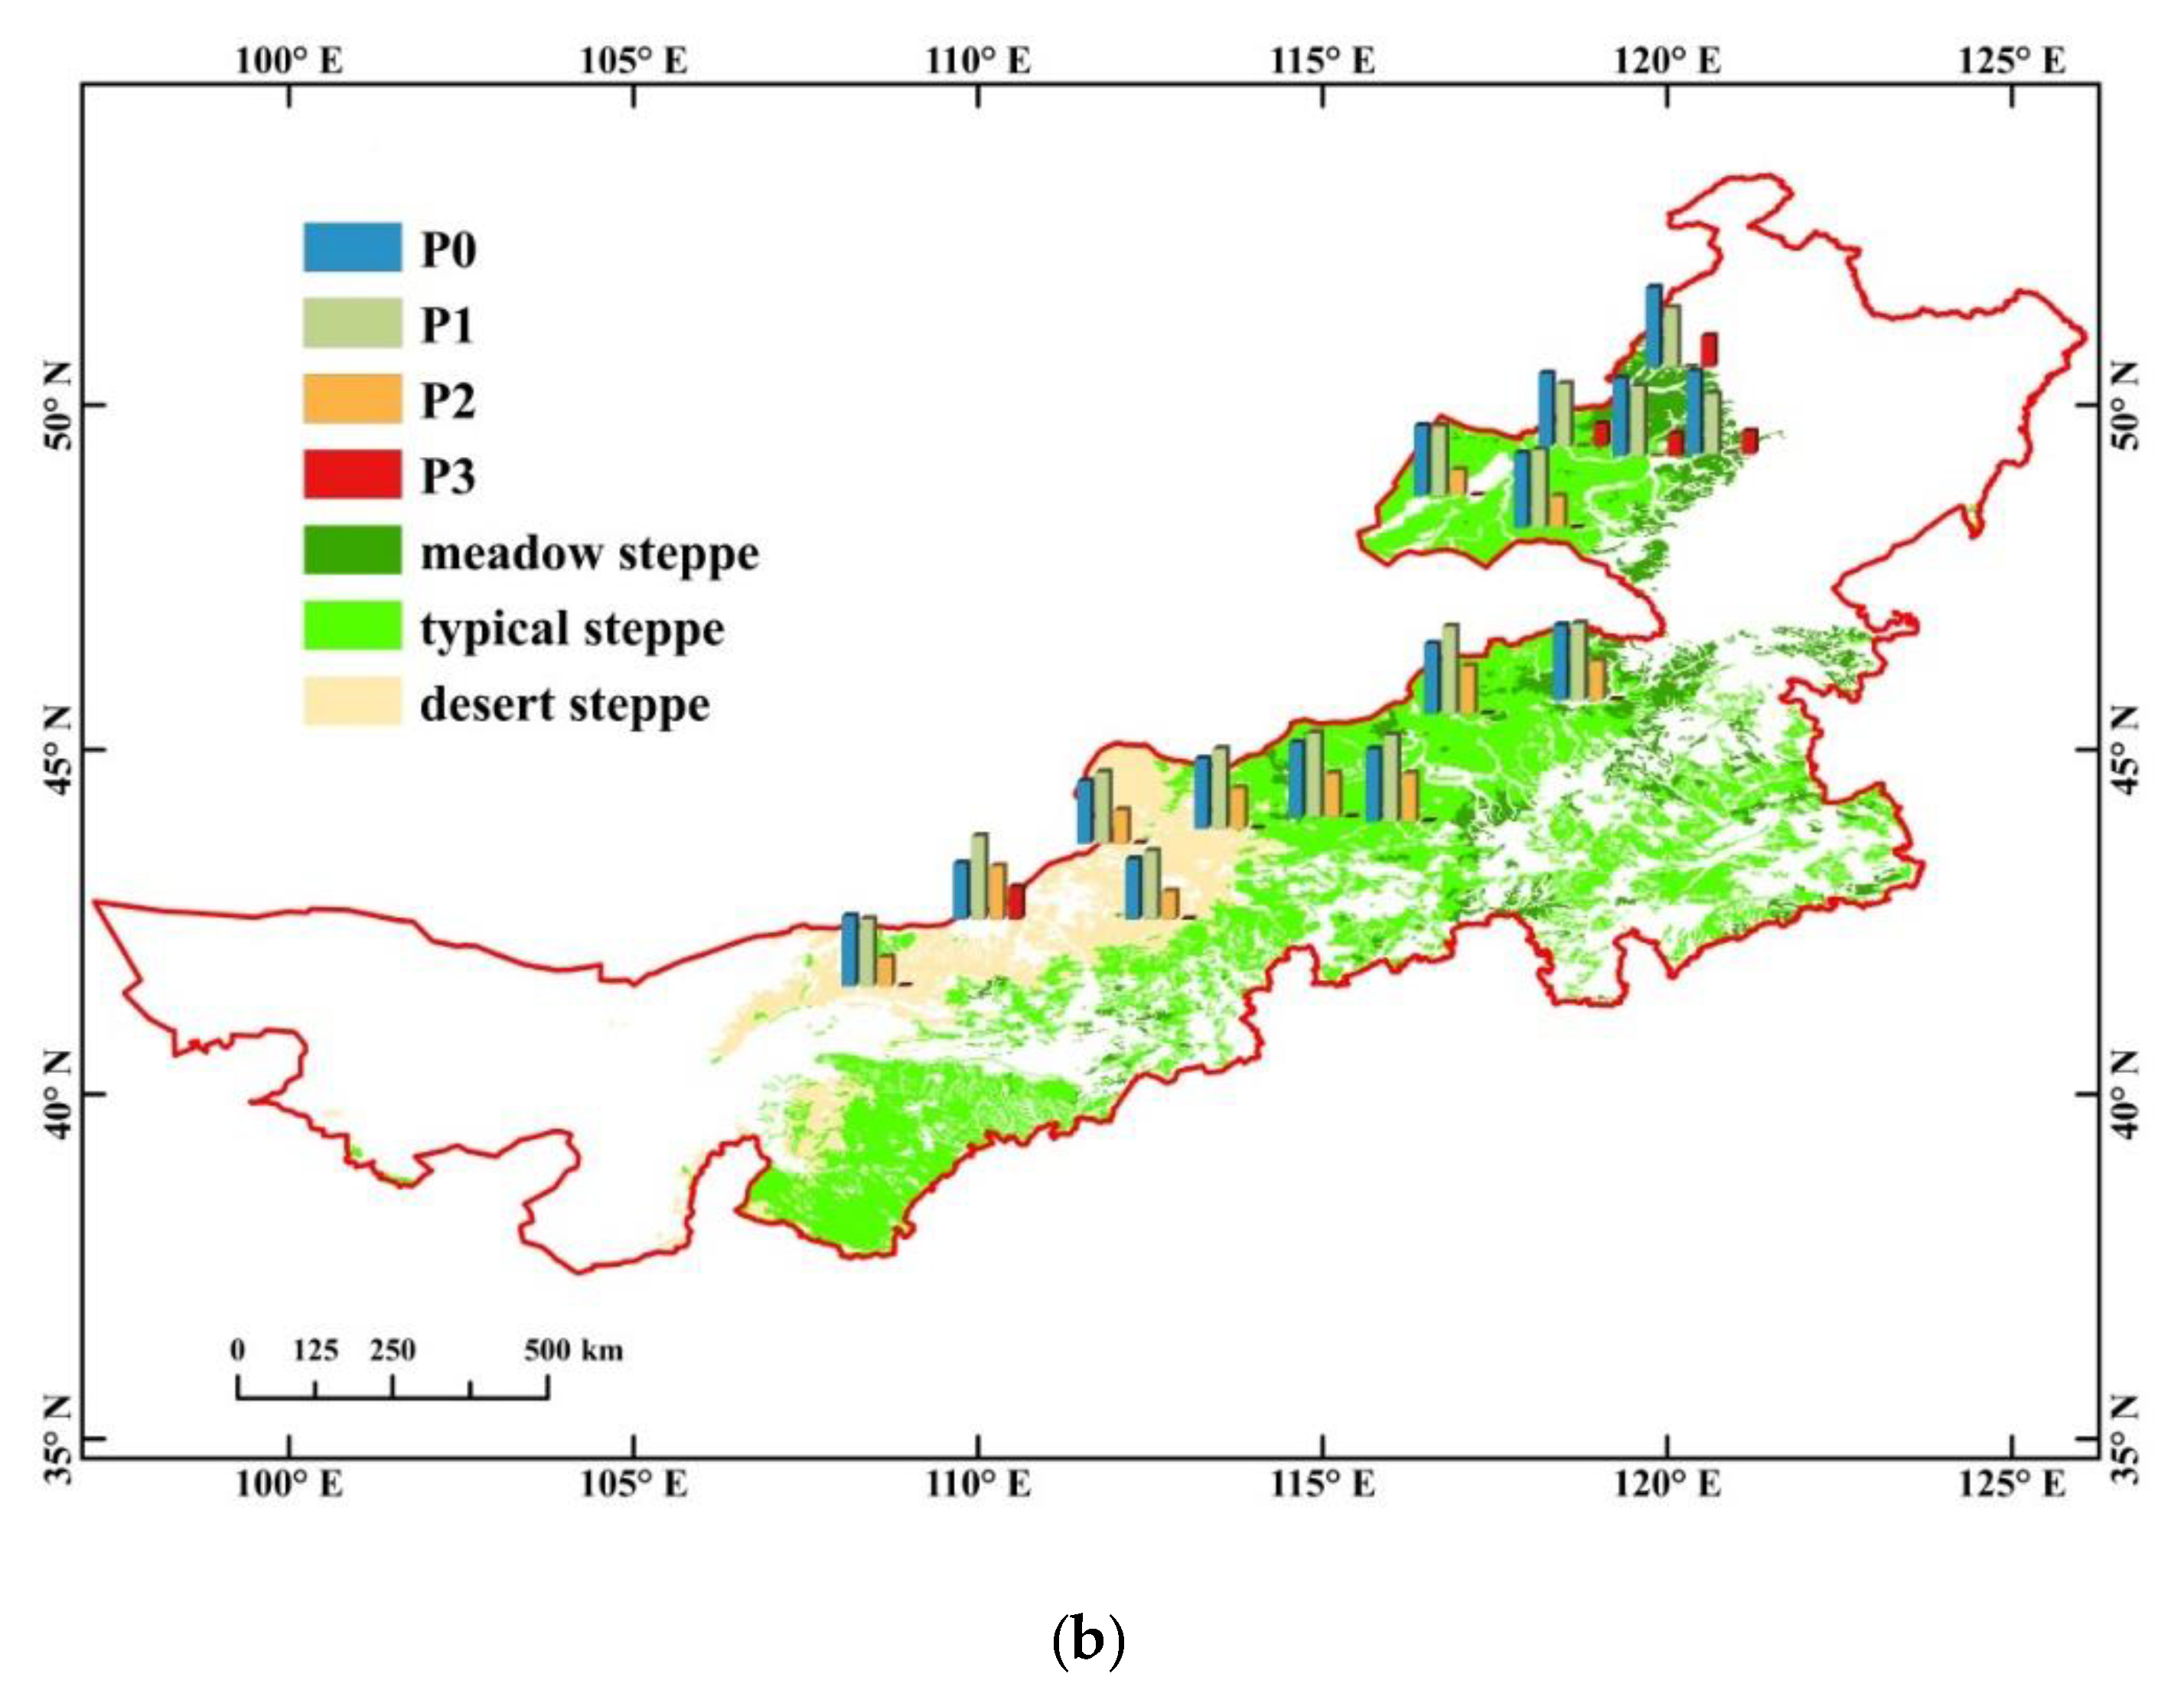
2.1. Study Area

Inner Mongolia (37°24′–53°23′ N, 97°12′–126°04′ E) is located along the northern border of China, extending diagonally from northeast to southwest with a narrow and long shape [34] (Figure 1). The grassland in Inner Mongolia has a main area of 86.667 million hectares, of which 68.18 million hectares are effective natural pastures, accounting for 27% of the total grassland area in China. It is the largest grassland and natural pasture region in China.
The climate of Inner Mongolia is dominated by continental monsoon climate. The annual average temperature is between −3.7 and 11.2 °C, and the average temperature of the whole region is 6.2 °C. And the annual precipitation is between 150 and 400 mm and gradually decreases from east to west, with most precipitation occurring in June to August [10]. From East to West, the climate shows a zonal distribution. Accordingly, the grassland types of Inner Mongolia are divided into a meadow steppe to the west of the Daxinganling Mountains in eastern Inner Mongolia, a typical steppe in central Inner Mongolia, and a desert steppe in central and western Inner Mongolia [44,48] (Figure 1).

2.2. Data Sources

The GIMMS NDVI3g data were used in the study. GIMMS NDVI3g data are global vegetation index change data provided by the GIMMS group of NASA (https://ecocast.arc.nasa.gov/data/pub/gimms/3g.v1/) [18]. And the dataset has been preprocessed by radiometric correction, geometric correction and image enhancement. GIMMS NDVI3g data have been commonly used in the study of regional and global vegetation change because of the long time series and wide coverage [26,49,50]. In this study, we obtained GIMMS NDVI data from January 1982 to December 2015. To minimise the influence of clouds, atmosphere, and monthly phenology, the MVC (maximum value composite) method was adopted to synthesize the monthly scale data [4,51].
In studies of the NDVI–climate relationship, to maintain consistency with NDVI space, most studies use the spatial interpolation method to carry out the spatial interpolation of climate factors [10,16,17,52]. However, due to the large error of the interpolation itself, if the interpolation results are used for correlation analysis, the error may be further increased [53]. Thus, we selected representative meteorological stations for meadow steppes, typical steppes, and desert steppes for this study (Figure 1). Among them, the meteorological stations in the meadow steppe include the Erguna, Yakeshi, Chenbarhu banner, Hailar and Ulagai stations; the meteorological stations in the typical steppe area include the Xin Barag left banner, East Ujumchin, Xilinhot, Xin Barag right banner, and Abaga banner stations. The meteorological stations in the desert steppe area include the Sonid left banner, Sonid right banner, Erenhot, Mandula, and Urad middle banner stations. To be consistent with the time range of the NDVI data, we also obtained the monthly average climate data (temperature and precipitation) of 15 representative meteorological stations from January 1982 to December 2015, which were derived from the monthly surface climate data set of the China Meteorological Data Sharing Service Platform (http://data.cma.cn/).
In this study, the administrative region, land use and land cover data for China in 2015 and vegetation type data (1:1,000,000) were all derived from the Resource and Environment Science Data Center of the Chinese Academy of Sciences (http://www.resdc.cn).

2.3. Methods

2.3.1. Calculation of the NDVI Data at the Meteorological Stations

Generally, a radius of 10 km around the meteorological station is effective when the data are measured at stations [42,54]. In this study, in view of the spatial resolution of the NDVI data and the impact of agriculture or construction around meteorological stations, the NDVI value at 15 meteorological stations is calculated by the mean value of the 3 × 3 pixel centred over the meteorological station [54]. Finally, we obtain NDVI data from 15 representative meteorological stations from January 1982 to December 2015.

2.3.2. Correlation Analysis between NDVI and Climate Factors

In the study, R values were calculated to explore the NDVI–climate relationship. The R model is as follows [34]:
R x y = i = 1 n [ ( x i x ¯ ) ( y i y ¯ ) ] i = 1 n ( x i x ¯ ) 2 i = 1 n ( y i y ¯ ) 2 ,
where R x y is the Pearson correlation coefficients between variable x and variable y , with a value between −1 and 1, n is the sample size, x i is the value of NDVI in the i th month, and y i is the mean monthly climate factors in the i th month, where x ¯ and y ¯ are the means of the two variables, respectively. In addition, we also test the significance of the correlation coefficients.
In this study, we analysed the NDVI–climate relationship at two different monthly time scales. In the within-growing season, we took the NDVI monthly series (April to October) from 1982 to 2015 as a group of variables (238 samples) and the climate factor monthly series (April to October) as another group of variables (238 samples) and calculated the value of R between NDVI and climate factors. In the inter-growing season, we took the value of NDVI in April from 1982 to 2015 as one group of variables (34 samples) and the climate factors in April from 1982 to April 2015 as another group of variables (34 samples) and calculated the value of R between NDVI and climate factors in April. Similarly, the value of R between NDVI and climatic factors in May to October were also calculated. The above two methods were used to calculate the value of R in this study.

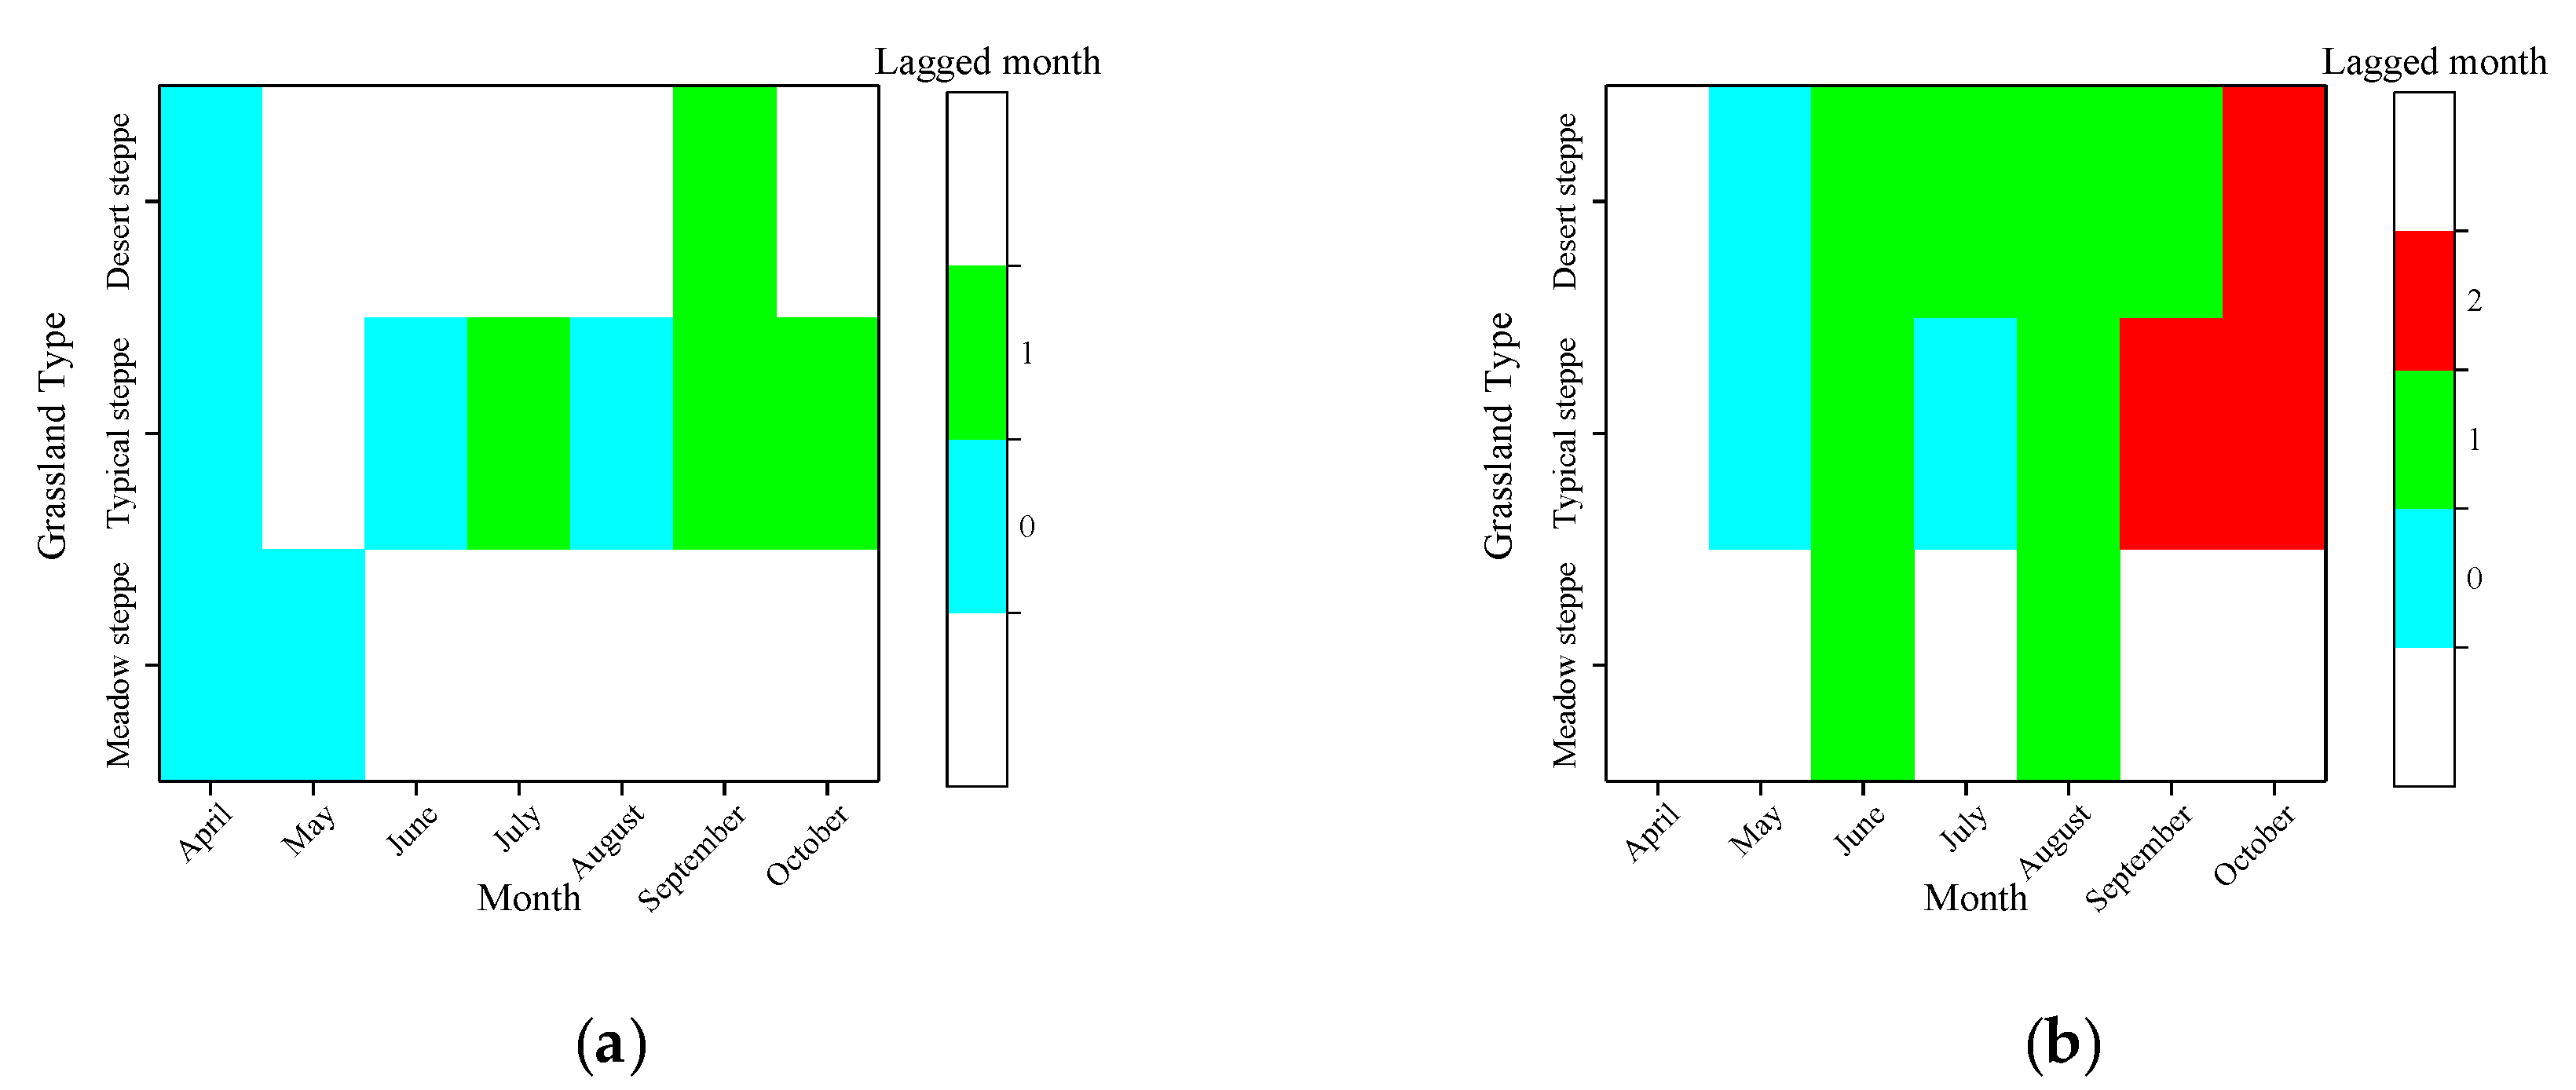
2.3.3. Lag Analysis between NDVI and Climate Factors

Vegetation is sensitive to climate change, but under a specific environment, vegetation may also have some adaptability to climate change; that is, the NDVI–climate relationship may have a lag effect [35]. Lag correlation coefficients are used to analyse the lag period of NDVI response to climate change. The expression is as follows [55]:
R = max { R 0 , R 1 , R 2 , , R n 1 , R n } ,
where R is the lag correlation coefficients, and n is the number of samples. R 0 , R 1 , R 2 , …, R n are the lag coefficients of NDVI and the current month, NDVI and the previous month, NDVI and the previous 2 months, …, NDVI and the previous n months, respectively. If R = R n , the lag period of NDVI response to climate change is n months.
In this study, we calculated the value of R between NDVI and current month climatic factors, NDVI and previous 1–3 month climatic factors, respectively, and so on.

3. Results

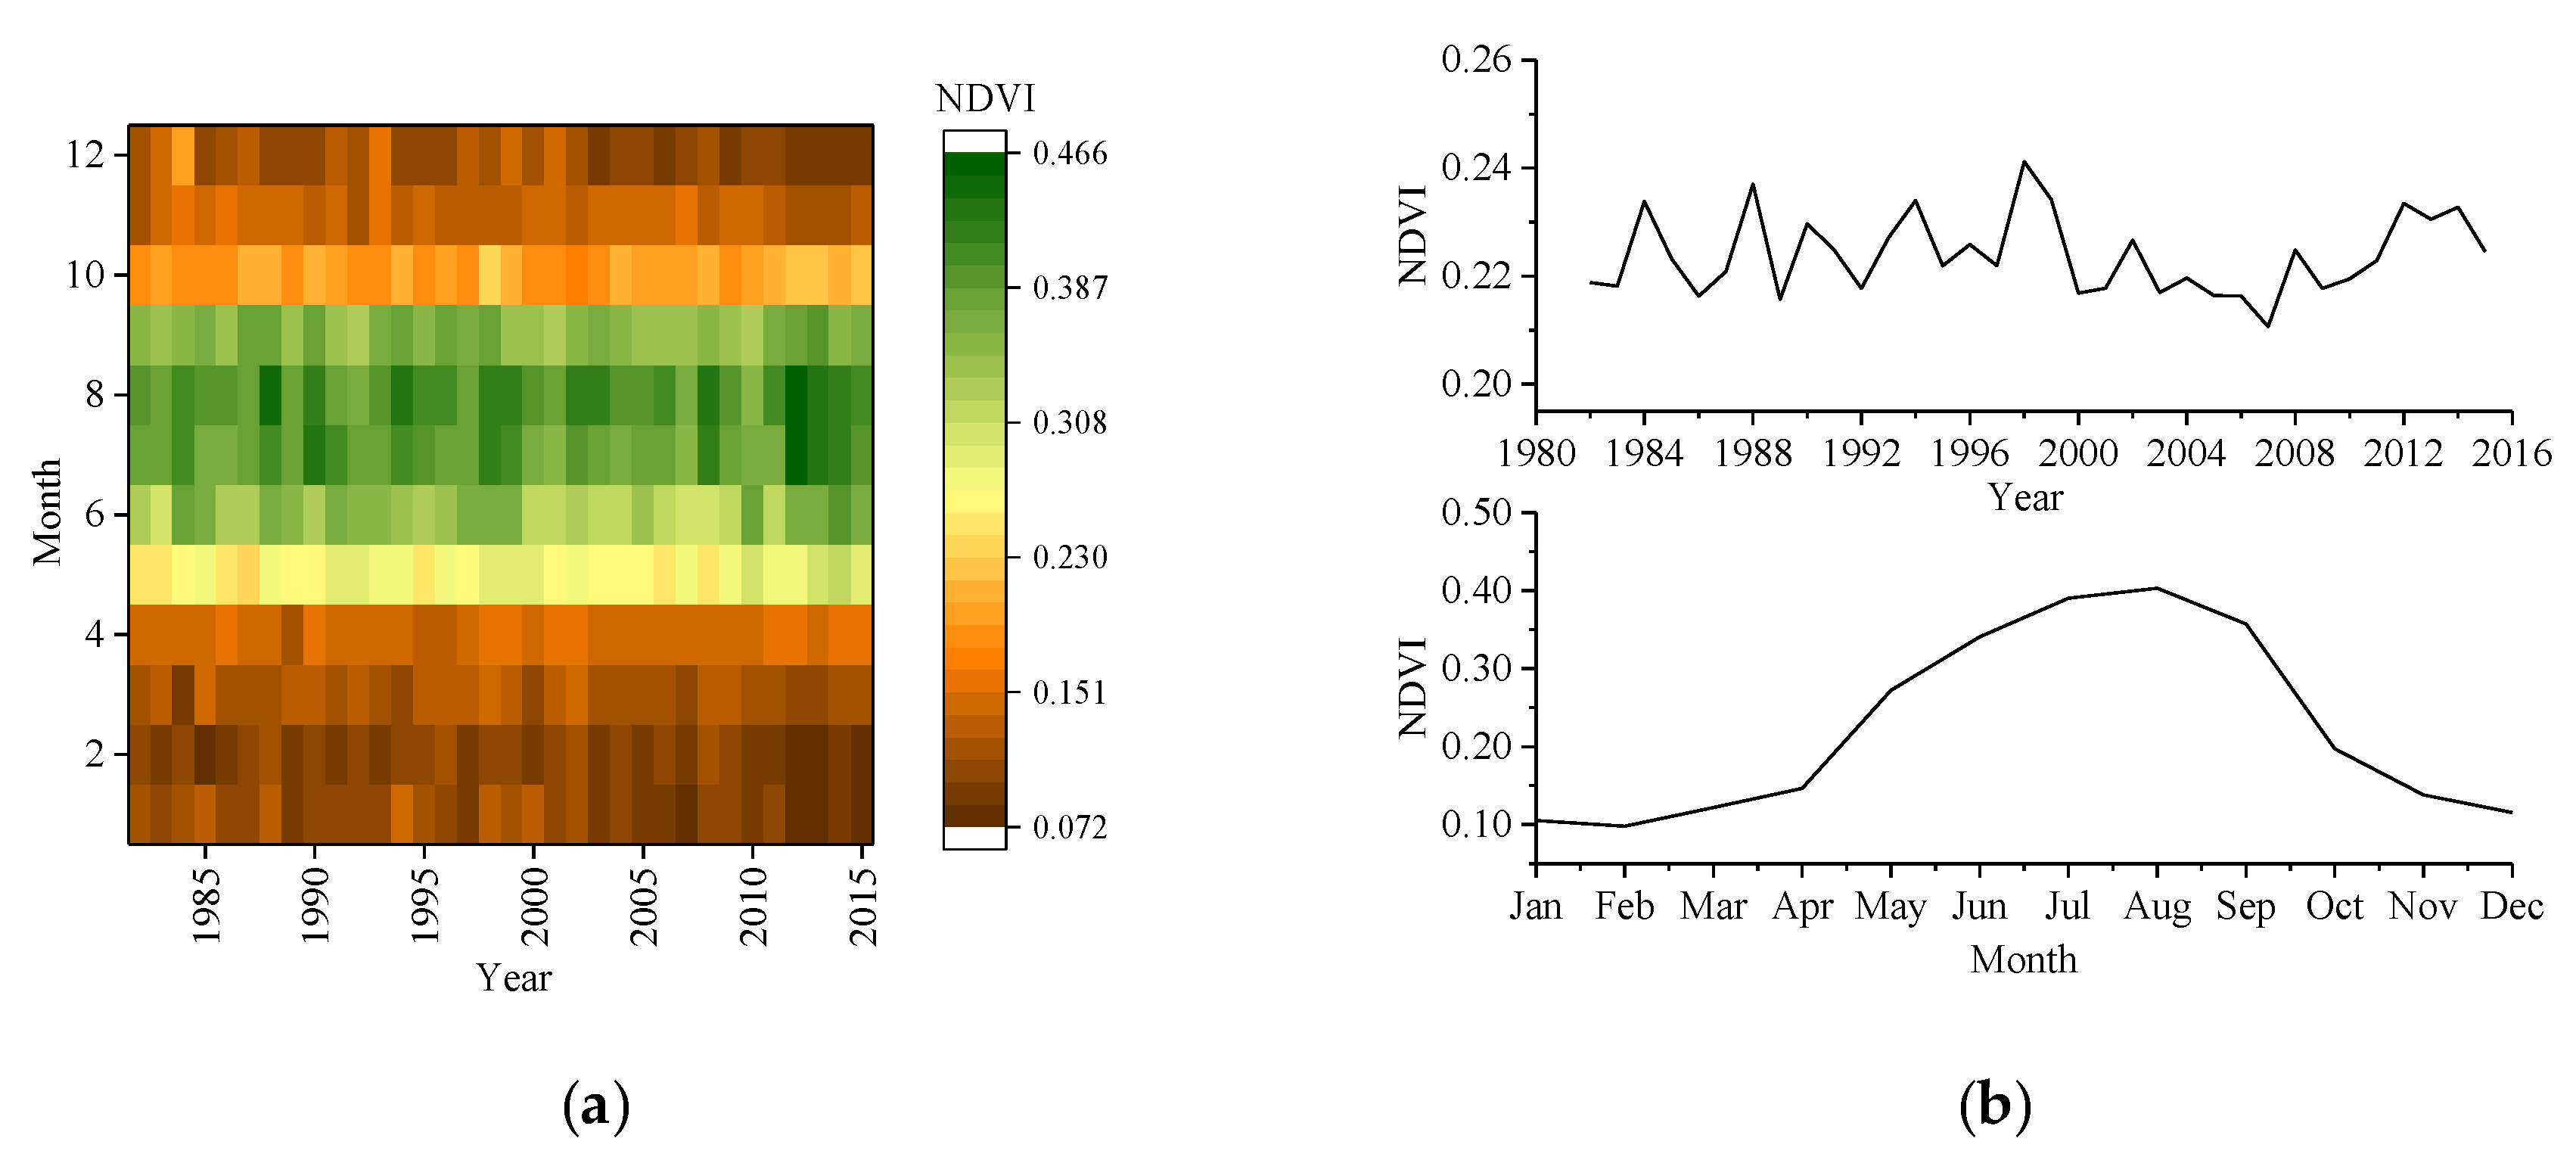
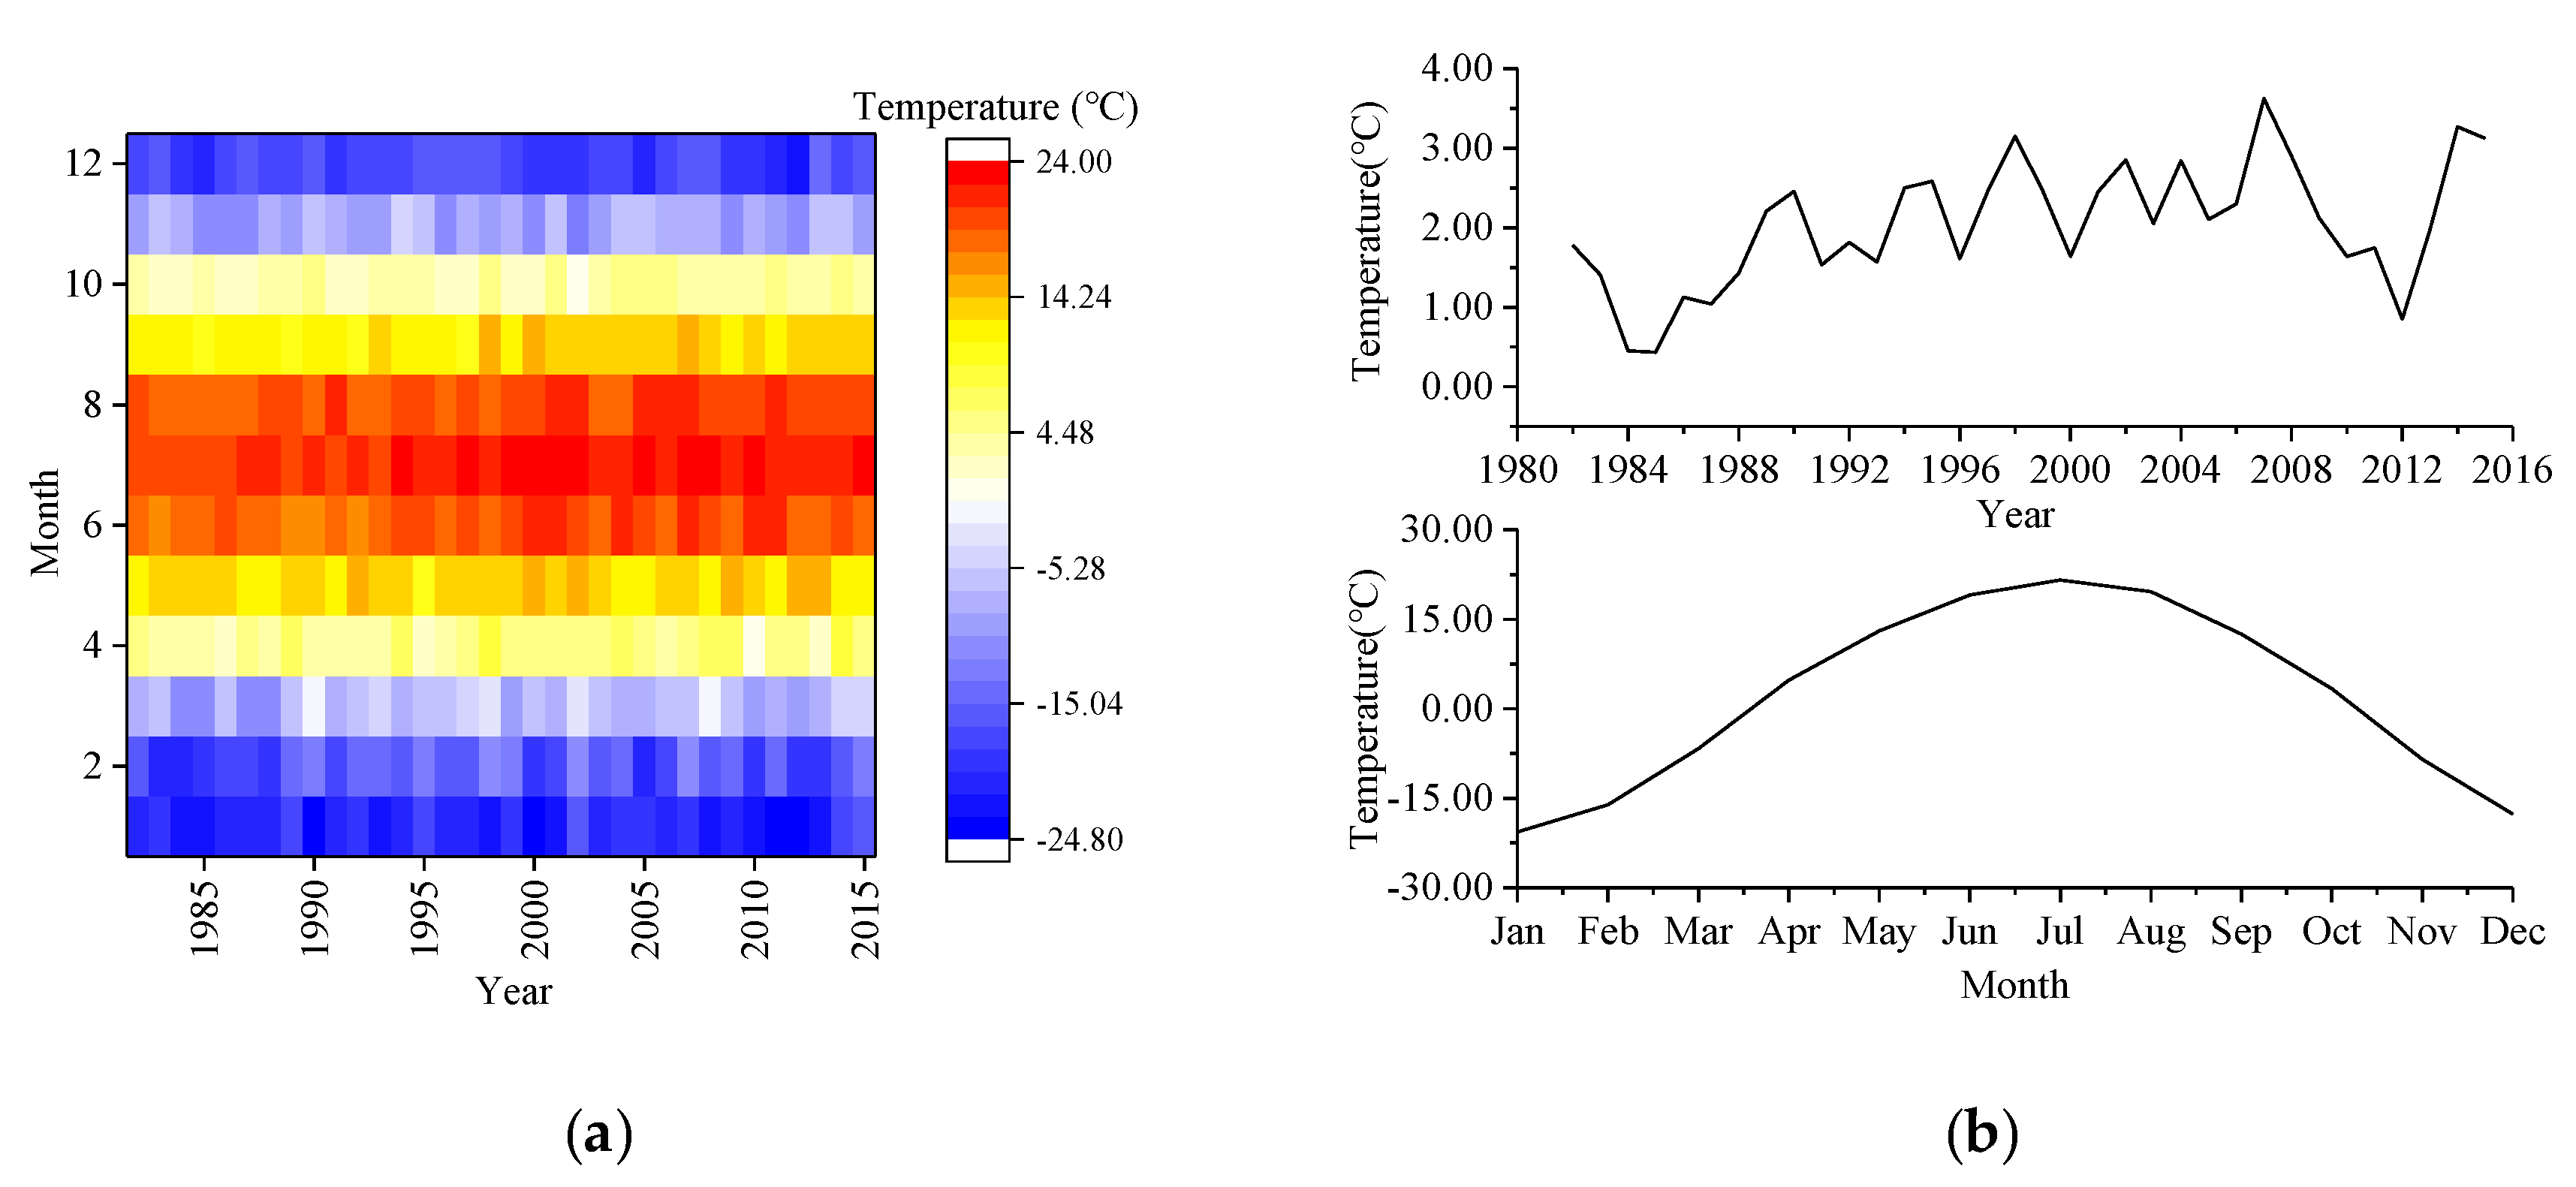
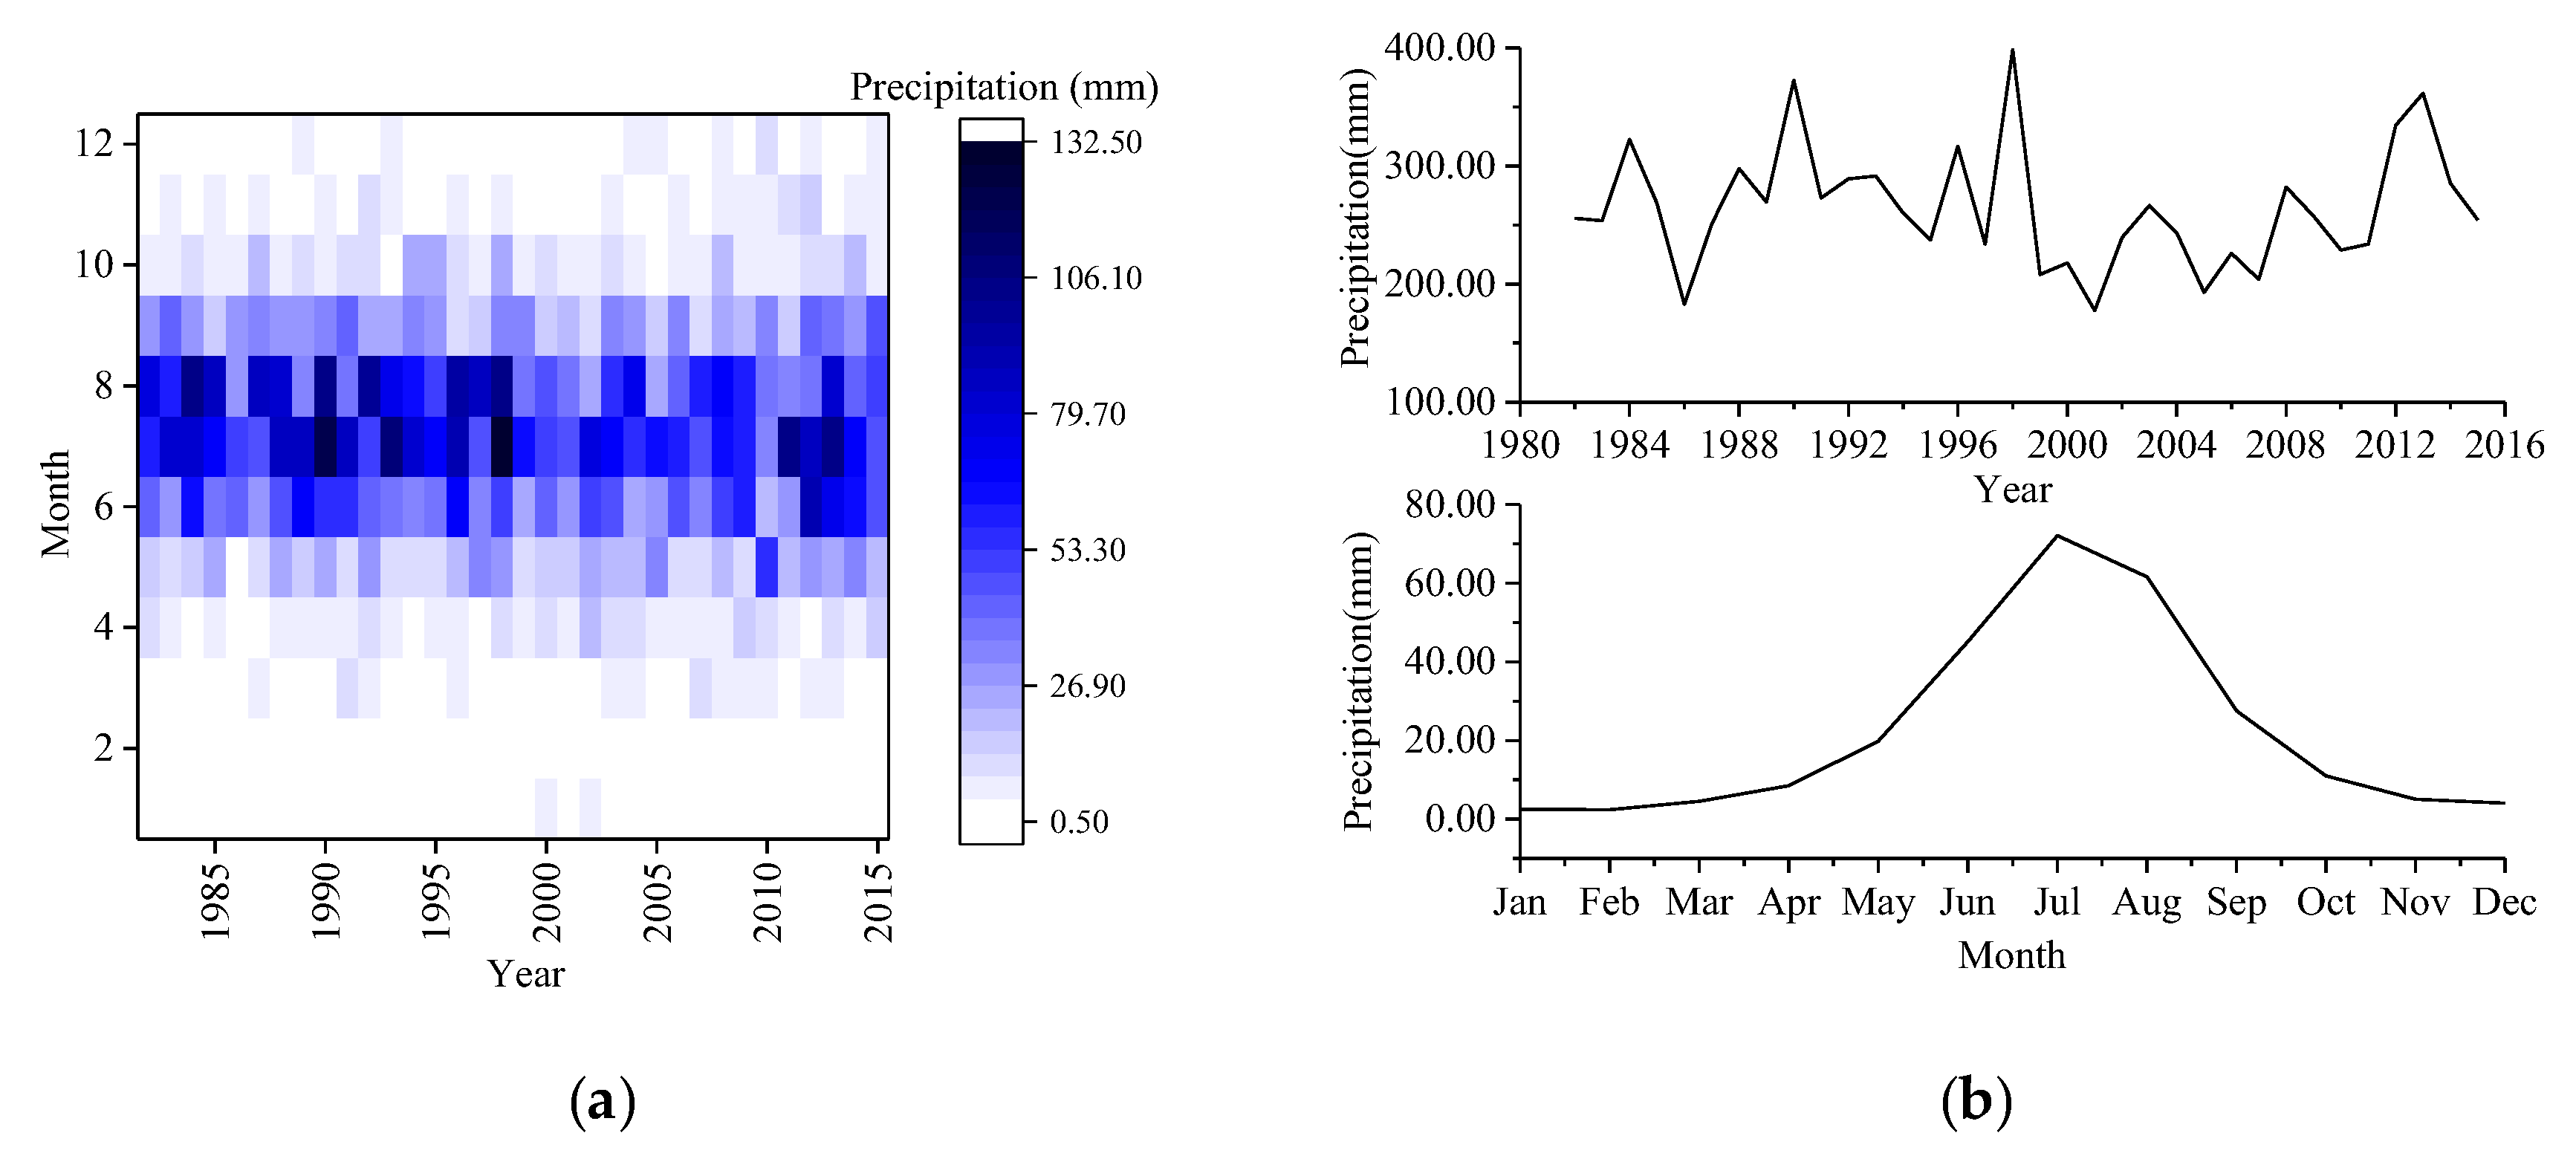
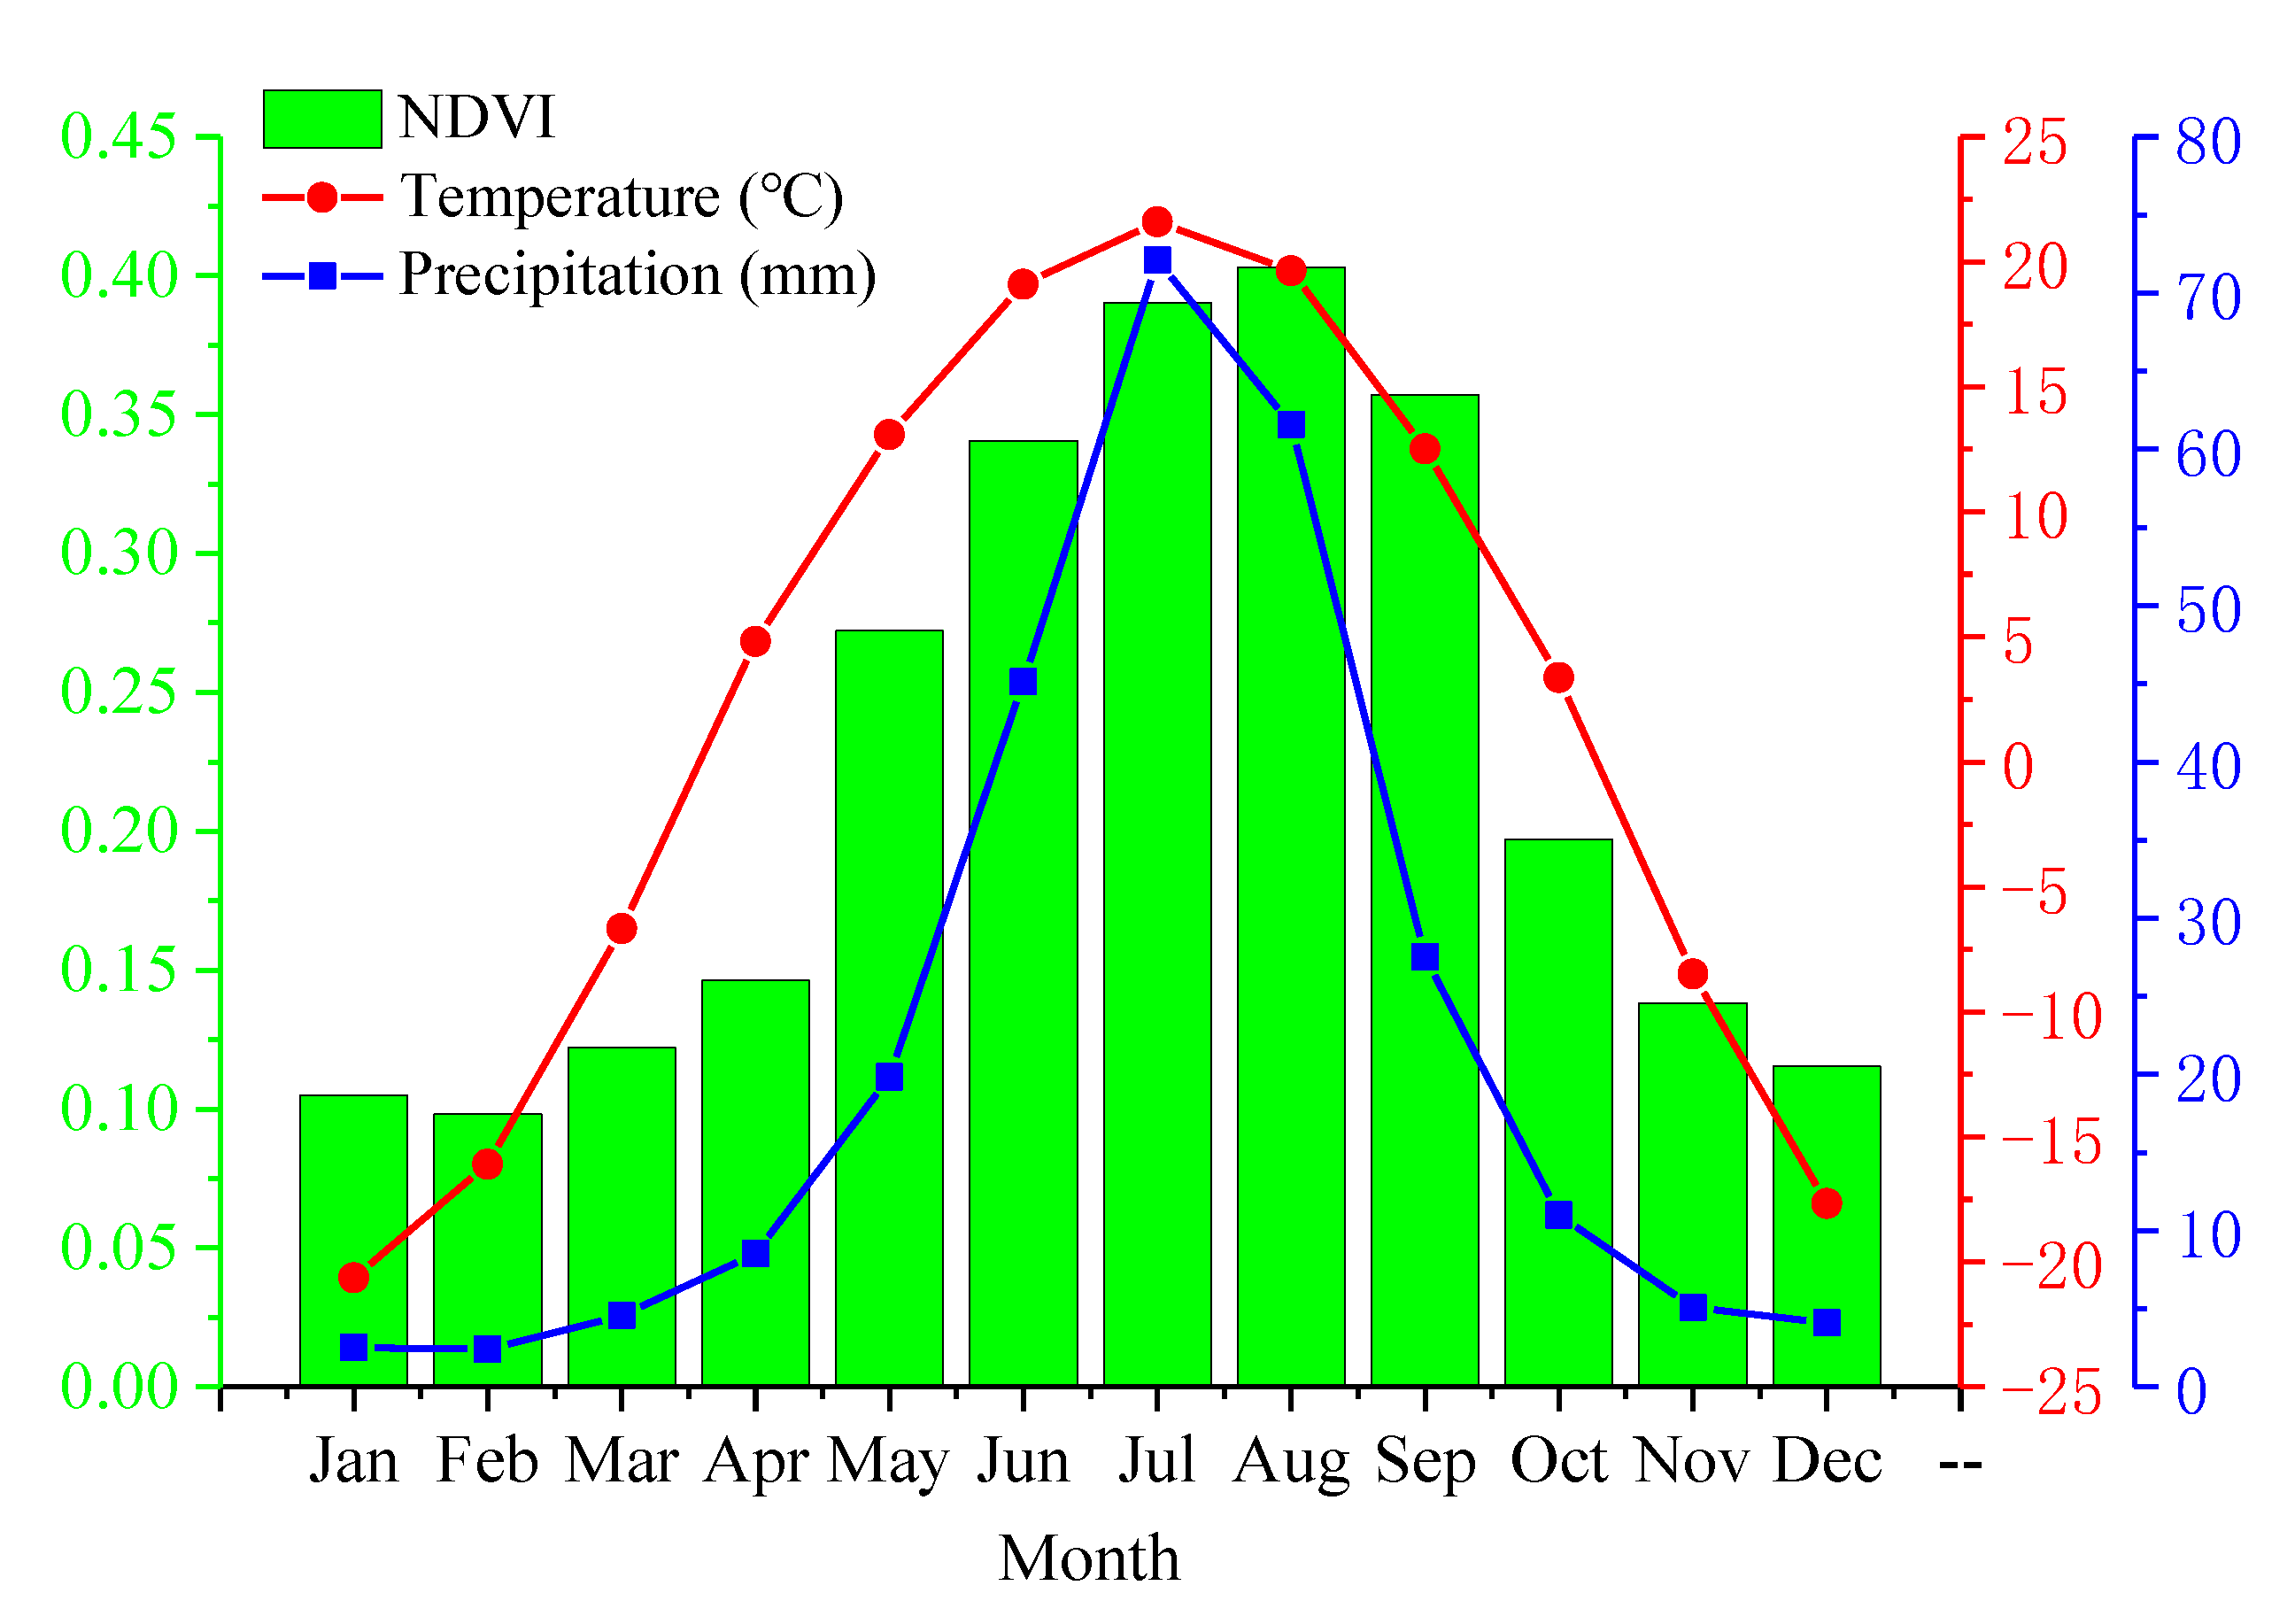
3.1. Temporal Changes in NDVI and Climate Factors

We analysed the temporal changes in NDVI and climate factors (temperature and precipitation) in the grassland region from January 1982 to December 2015. Here, NDVI and climate factors of the grassland were obtained by averaging NDVI and climate factors data of 15 representative meteorological stations.
The mean value of NDVI in the grassland showed obvious characteristics from 1982 to 2015 (Figure 2). The range of change in NDVI in the area was small and maintained a stable fluctuation. The multi-year average value of NDVI was 0.224, with the lowest value of 0.210 in 2007, and the highest value of 0.241 in 1998 (Figure 2b). NDVI changed alternately every year, with the highest values appearing from June to September, and the lowest values appearing from December to February (Figure 2a). In August, the monthly average value of NDVI reached 0.403, and grassland growth was generally good, while in February, the monthly average value of NDVI reached 0.098, and grassland growth was not good (Figure 2b). The value of NDVI in the area was relatively high from April to October, which is usually used as the grassland growing season.
There was a significant change in the average temperature from 1982 to 2015 in the area (Figure 3). Over 34 years, the annual average temperature fluctuated and increased, with an increase rate of 0.0401/a. The multi-year average temperature was 2.04 °C, the lowest value was 0.43 °C in 1985, and the highest value was 3.63 °C in 2007 (Figure 3b). Every year, a high temperature value appeared in June to August, and a low temperature value appeared in December to February (Figure 3a). For many years, the highest monthly average temperature was 21.60 °C in July, and the lowest value was −20.64 °C in January (Figure 3b).
There was also a significant change in the precipitation from 1982 to 2015 in the area (Figure 4). Over 34 years, annual precipitation showed a slight downward trend with a change rate of −0.335/a. The multi-year average value of precipitation was 255.99 mm, the highest value was 398.65 mm in 1998, and the lowest value was 177.58 mm in 2001 (Figure 4b). Every year, high precipitation appeared in June, July, and August, and precipitation in other months was relatively low (Figure 4a). For many years, precipitation was the most concentrated in July, with an average annual precipitation amount of 72.1 mm (Figure 4b).
Based on the above results, the temperature and precipitation in the area showed obvious periodic changes, and related to these periodic changes in rain and temperature, NDVI also showed periodic changes but with an obvious lag (Figure 5).

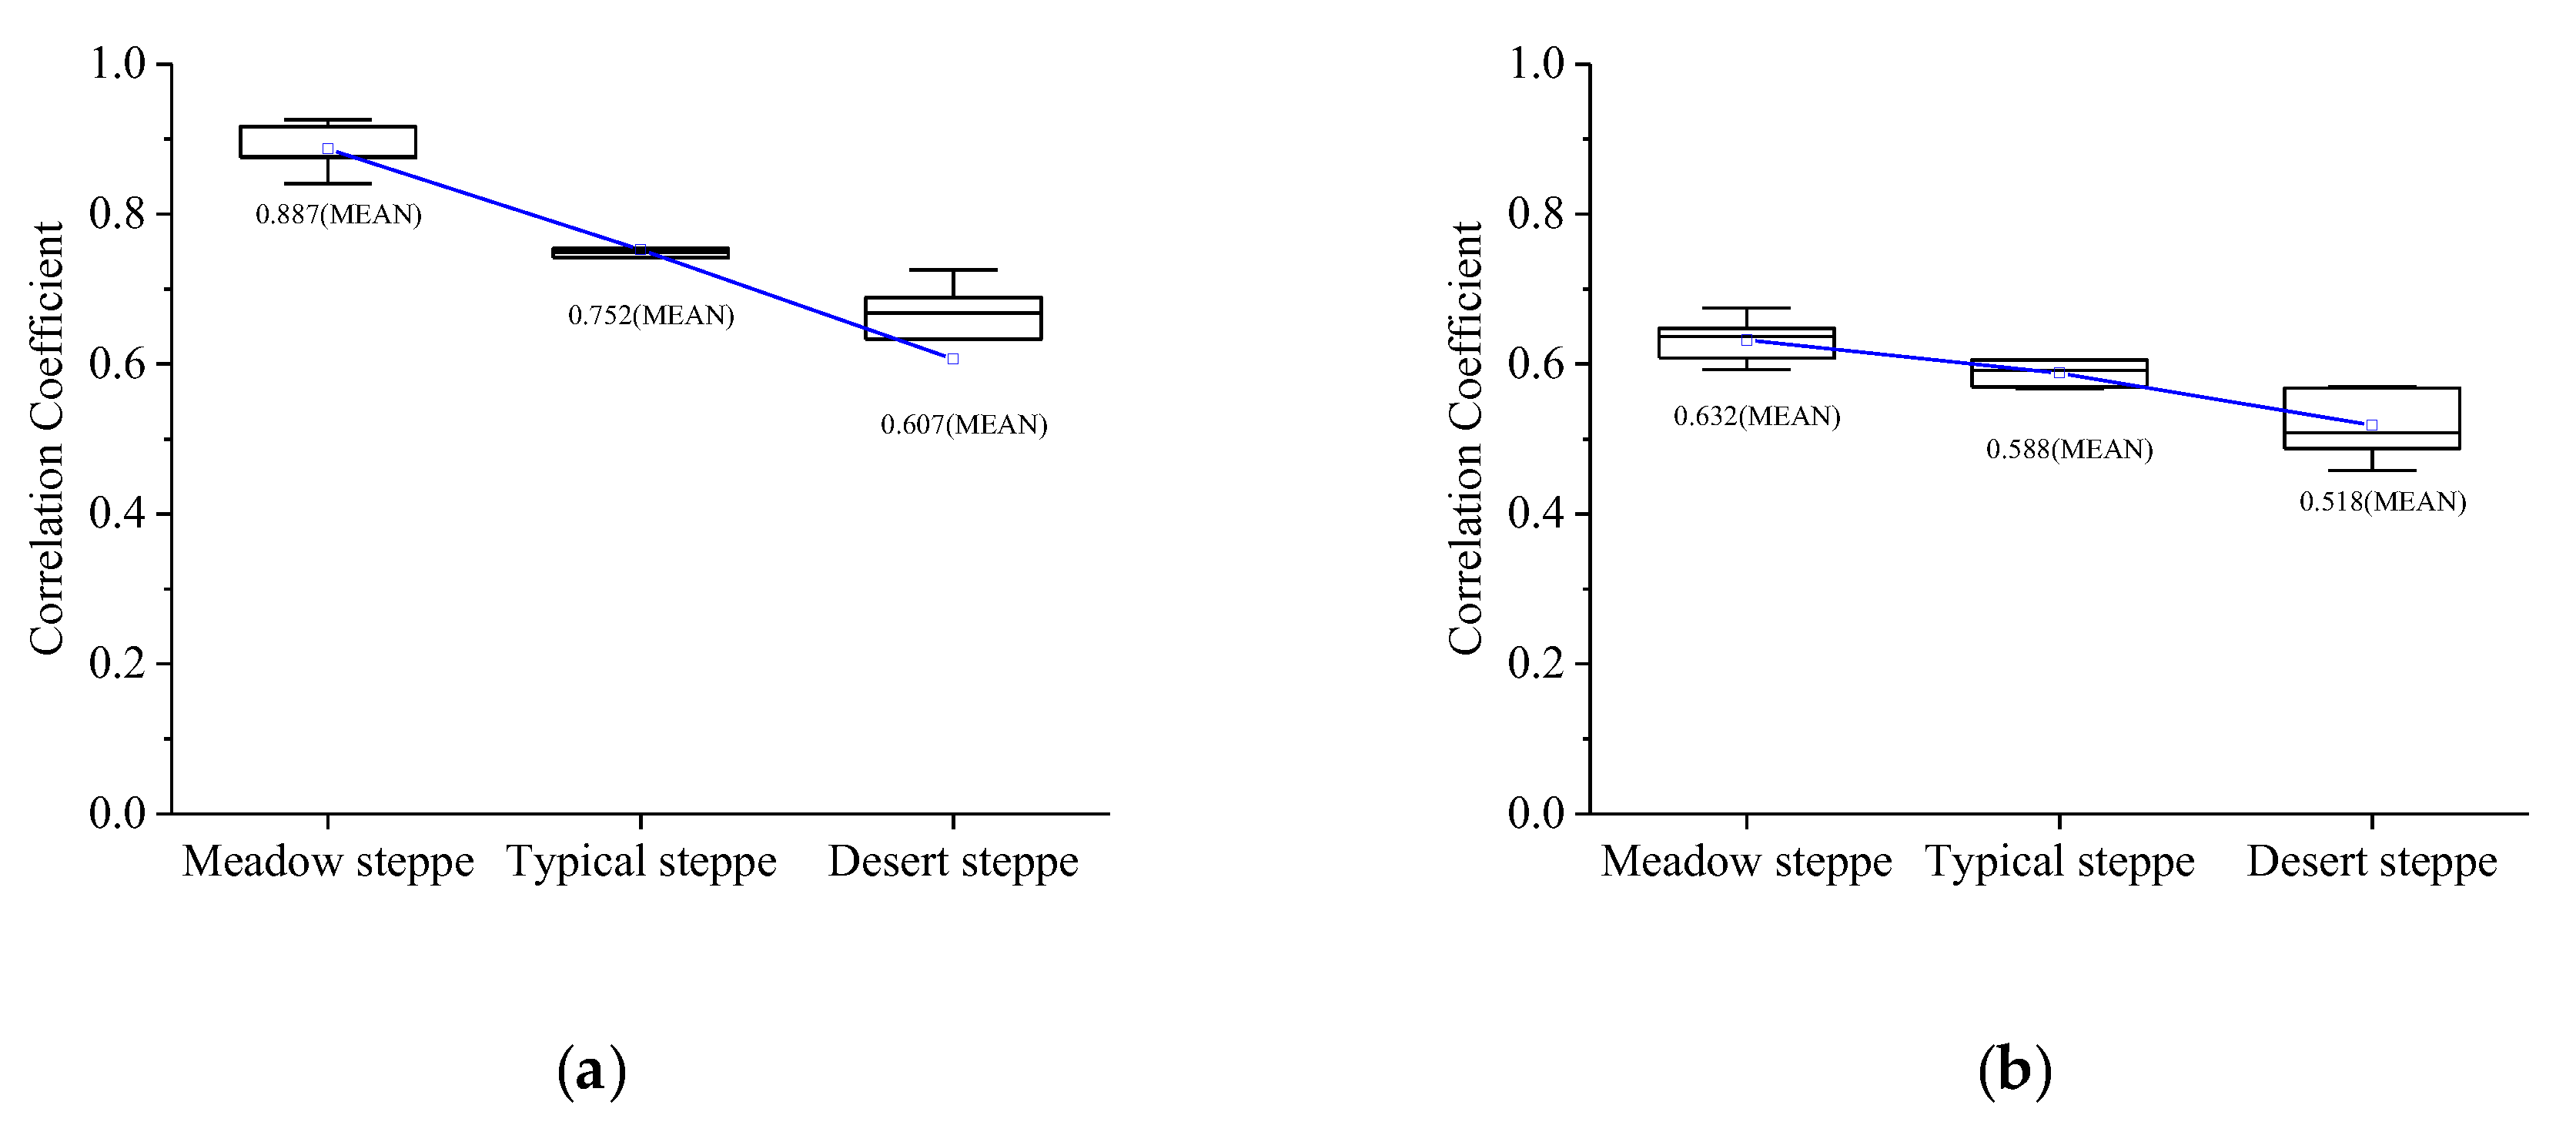
3.2. Correlation between NDVI and Climate Factors

Considering that the NDVI value of the grasslands in the study area was small in some months, the growing season (April to October) was selected to analyse the NDVI–climate relationship. Here, we analysed the value of R between them in all grassland type at different monthly time scales (i.e., in the within-growing season and the inter-growing season).

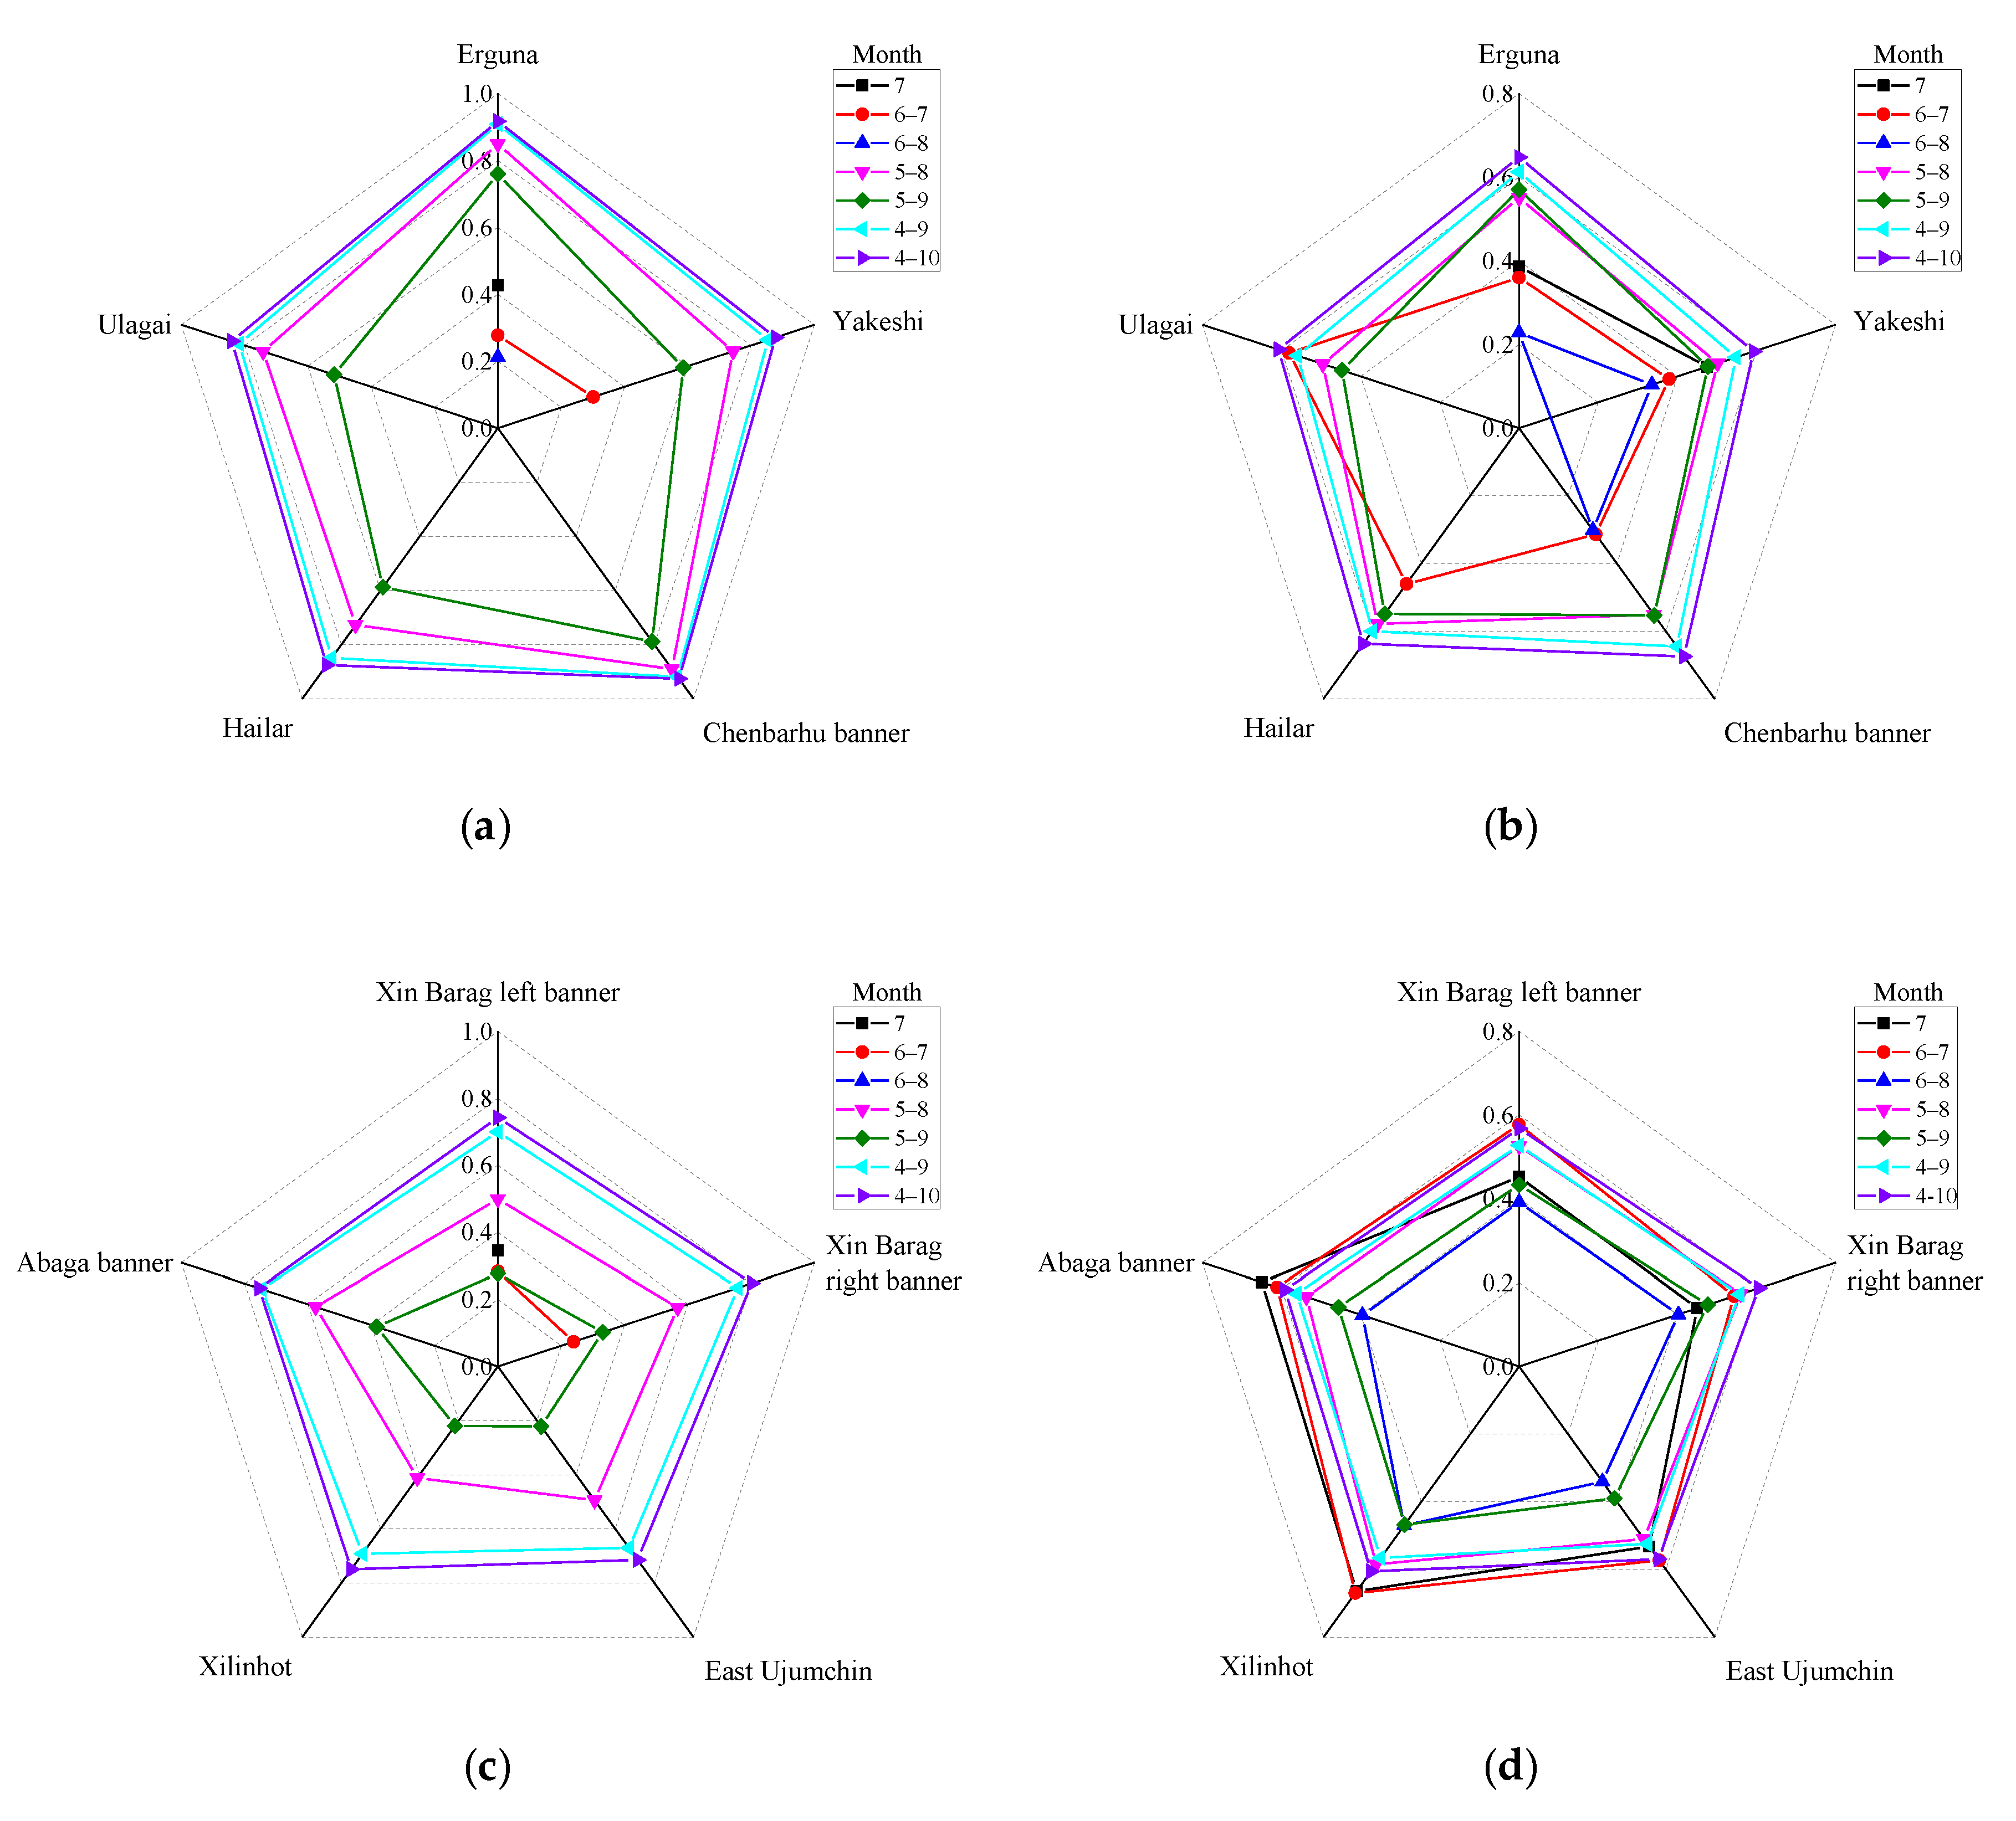
3.2.1. Correlation between NDVI and Climate Factors in the Within-Growing Season

We calculated the value of R between NDVI and climate factors near meteorological stations in the current month (1982–2015) (Figure 6). The value of R between them gradually decreased from East to West, and they were all significantly positively correlated. And the value of R between NDVI and temperature were higher, indicating that temperature had a greater impact on grassland than did precipitation, especially over meadow steppes.
We also analysed the lag between NDVI and climate factors (Figure 7). NDVI was significantly affected by climate factors of the current month in the meadow steppe. However, NDVI was more sensitive to climate factors of the previous month than to those of the current month in the other two grassland types.

3.2.2. Correlation between NDVI and Climate Factors in the Inter-Growing Season

Compared to the value of R between NDVI and climate factors in the within-growing season, the value of R in the inter-growing season were not as high, and there were positive and negative correlations. In terms of temperature (Table 1), the temperature had a significant impact on the meadow steppe in April, May and October, when the temperature promoted the growth of grasslands. In April and October, there was a significant positive correlation between temperature and the typical steppe, while there was a significant negative correlation between temperature and the typical steppe in June and August. However, the relationship between temperature and the desert steppe was not significant. In terms of precipitation (Table 1), precipitation in July had a significant impact on the meadow steppe, the typical grassland was sensitive to precipitation from May to July, of which July was the most sensitive, and precipitation had the most extensive impact on desert steppe, with August having the greatest impact.
For all grassland type, we calculated the value of R between NDVI and climate factors of the current and previous months and took the month with the highest correlation coefficient (p < 0.05) as the lagged month (Figure 8). In terms of temperature, for the meadow steppe, NDVI was significantly affected by the temperature of the current month in April and May. For the typical steppe, NDVI was sensitive to the temperature of the current month in April, June, and August, while NDVI was significantly affected by the temperature of the previous month in July, September, and October. For the desert steppe, NDVI was sensitive to the temperature of the current month in April, while NDVI was mainly affected by the temperature of the previous month in September. In terms of precipitation, for the meadow steppe, NDVI was affected by the precipitation of the previous month in June and August. For the typical steppe, NDVI was sensitive to the precipitation of the current month in May and July, and NDVI was significantly affected by the precipitation of the previous month in June and August, while NDVI was sensitive to precipitation of the previous two months in September and October. For the desert steppe, NDVI was sensitive to the precipitation of the current month in May, to the precipitation of the previous month from June to September, and to the precipitation of the previous two months in October.

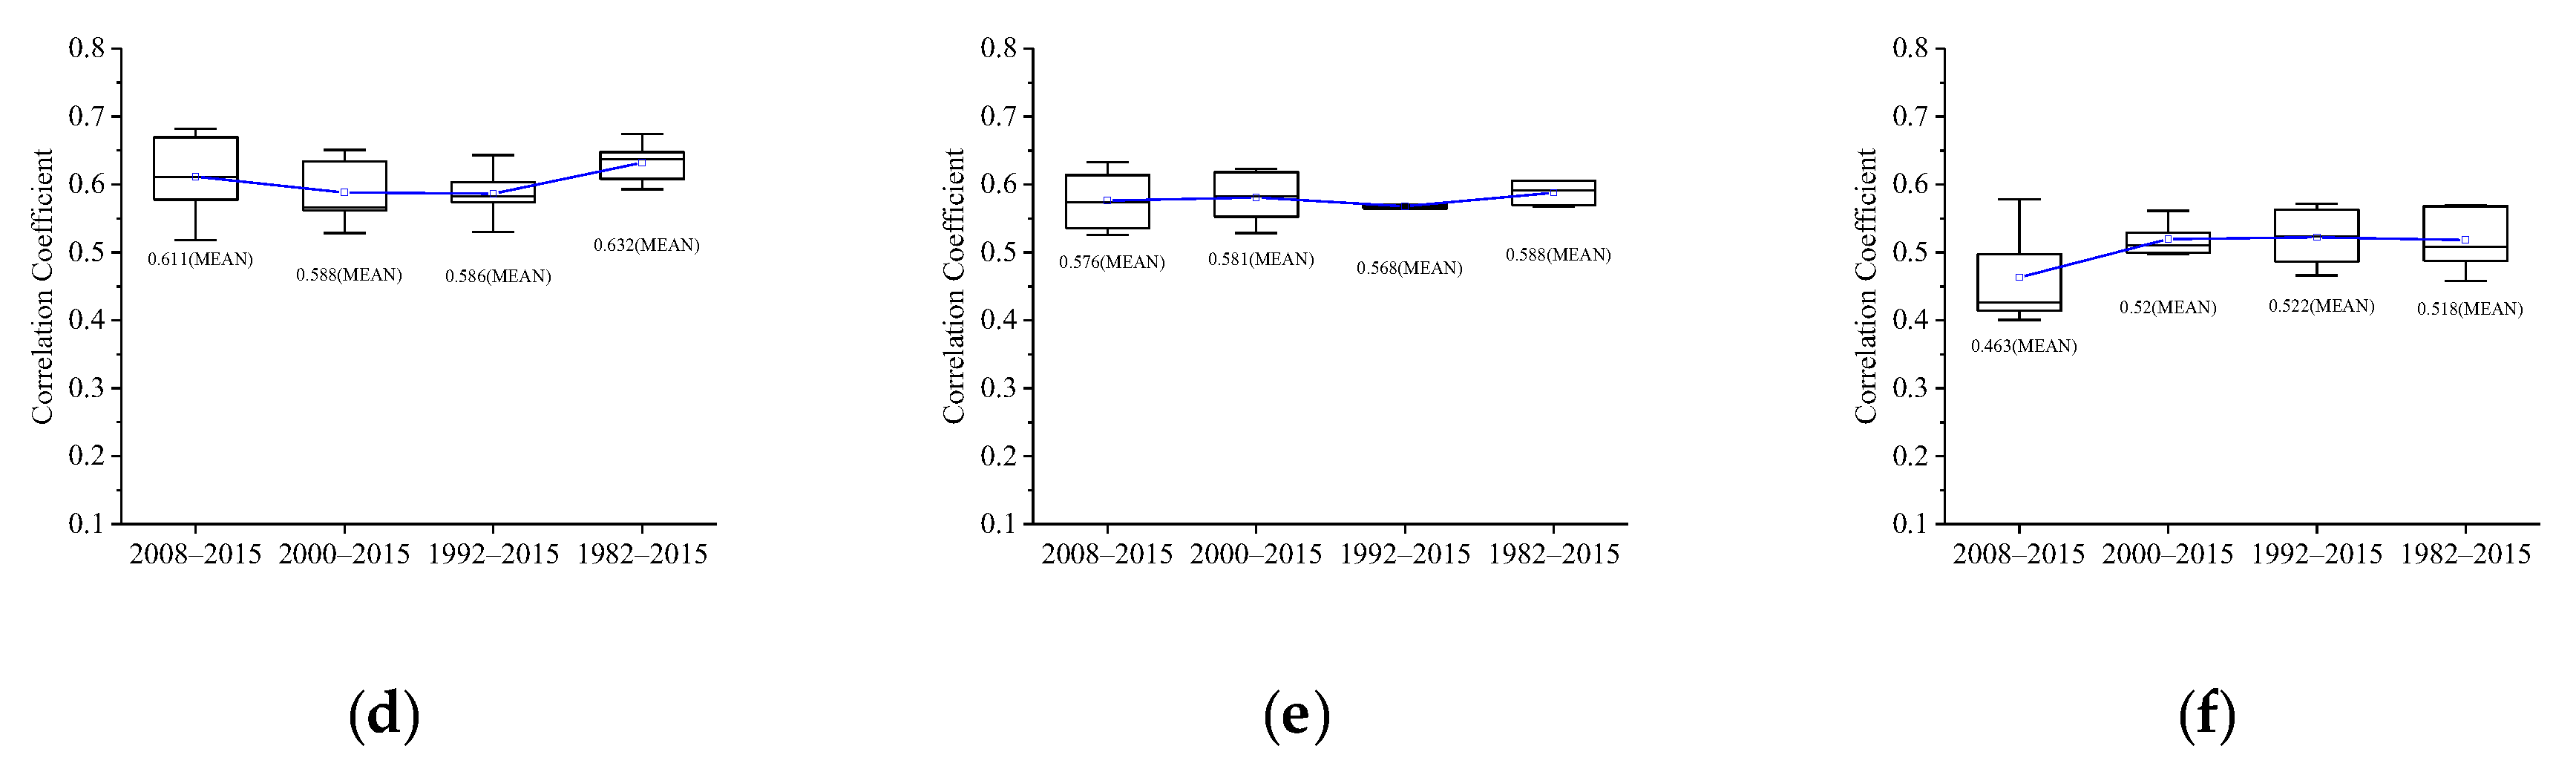
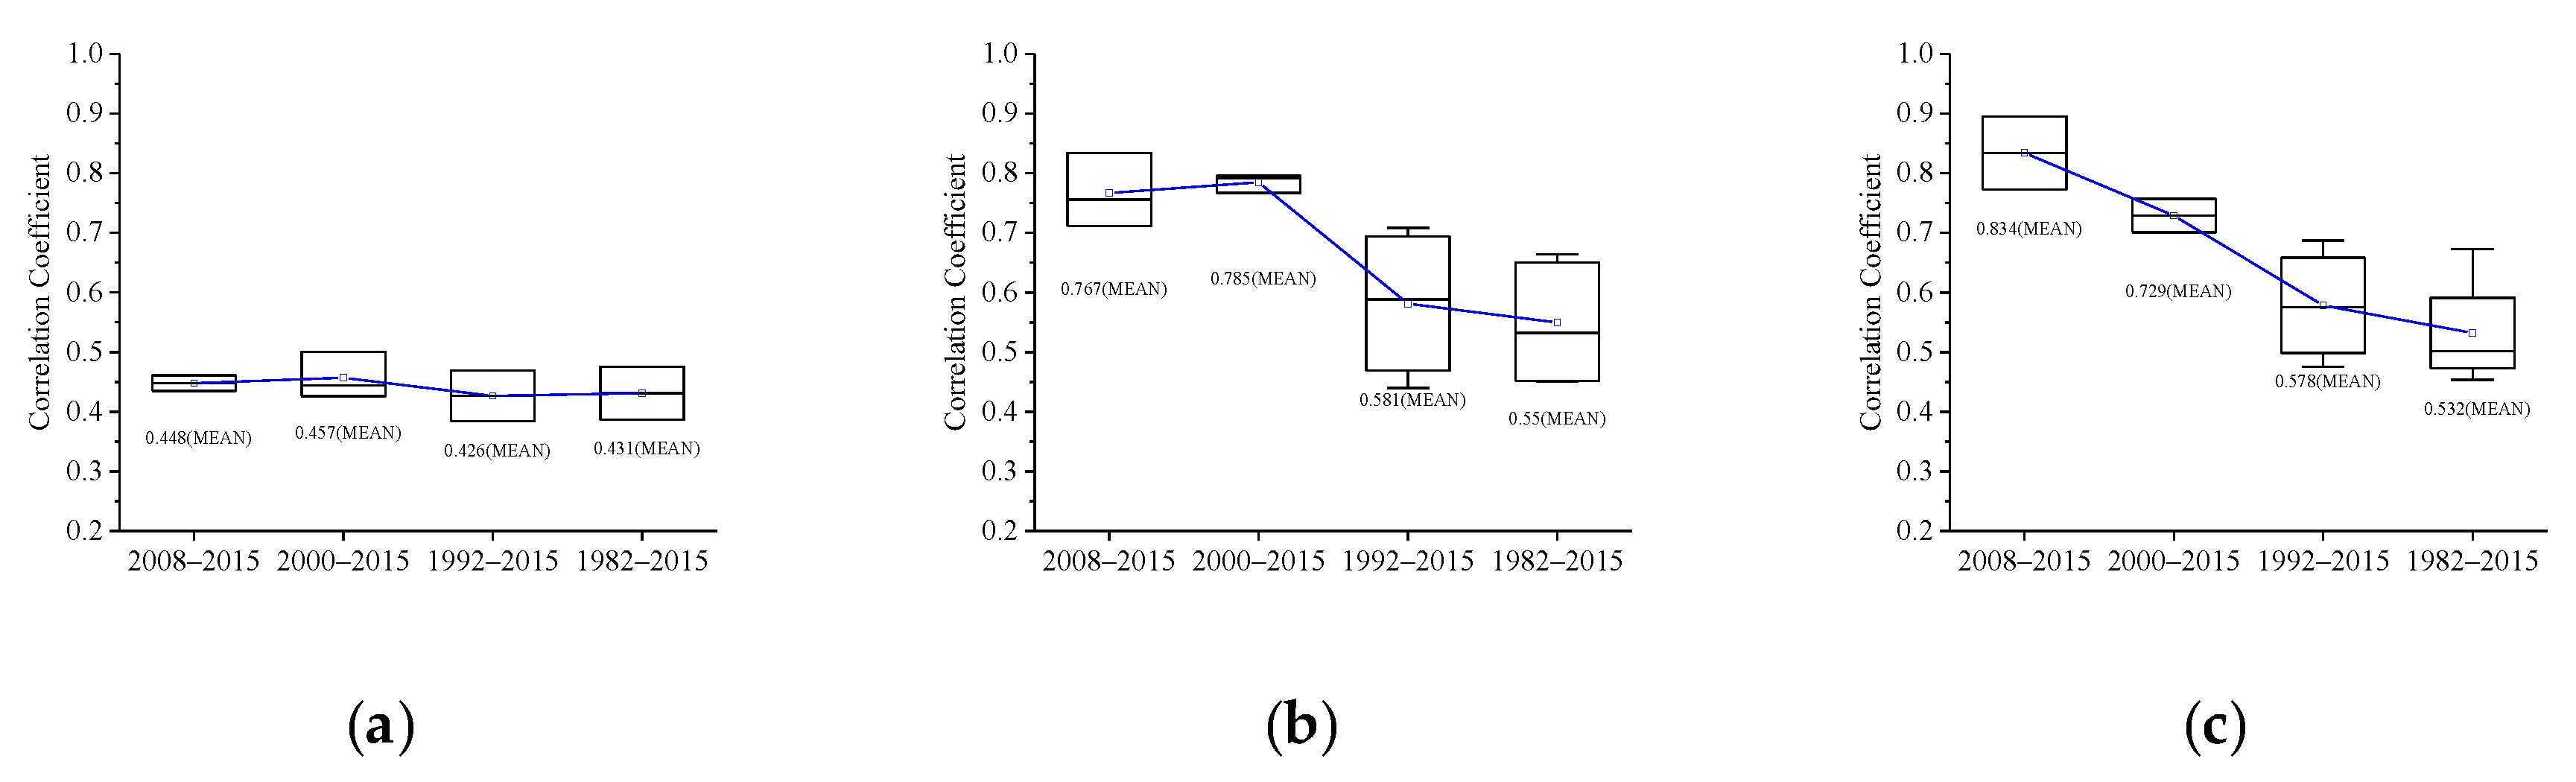
3.2.3. Change in the NDVI–Climate Relationship at Multiple Time Scales

We analysed the change in R between NDVI and climate factors at multiple time scales (Figure 9). In the within-growing season, with the increase in time series, the value of R between NDVI and climate factors fluctuated slightly, but all of them showed increasing trends in all grassland types. The value of R between NDVI and temperature were always higher. The fluctuation in R between NDVI and temperature in the meadow steppe was the smallest, and the fluctuation in the desert steppe was largest, which may be due to the fact that the desert steppe is vulnerable to extreme climates or is greatly affected by non-climate factors.
Due to abnormal climate change, the uncertainty of the climate factors increased, and the value of R between NDVI and climate factors were not very significant in the inter-growing season. The value of R between NDVI and precipitation in July were relatively significant. To analyse the variation in R in the inter-growing season with increasing time series length, we used precipitation as an example to analyse the variation (Figure 10). We found that the value of R between NDVI and precipitation changed steadily in the meadow steppe. However, the value of R between NDVI and precipitation decreased with the increase in the time series of the typical steppe and desert steppe, which may have been due to more uncertainty caused by the increase in the sample number, which caused the correlation degree to decrease. We also found that the change in the correlation coefficient became increasingly smaller and tended toward stability.

4. Discussion

Vegetation growth is mainly driven by hydrothermal conditions. The synchronization of rainfall and temperature caused by the monsoon climate in China occurs in summer, and the high temperatures and abundance of precipitation in summer usually correspond with a high vegetation index. This kind of repetition over many years will inevitably result in high correlation between the two variables. In the within-growing season, the correlation coefficients obtained by this analysis method are a kind of pseudo correlation, which may not truly reflect the impact of water and heat conditions on vegetation, so this type of analysis should be carefully used in the future [47]. In the inter-growing season, the NDVI–climate relationship in different months was analysed separately, which can reduce the synchronization of rainfall and temperature and eliminate the possibility of false correlation [47], and the response of NDVI to hydrothermal conditions is different in different months, so the value of R between them obtained by this analysis method may be more realistic for reflecting the response of NDVI to climate change.
Here, we also analysed the influence of the synchronization of rainfall and temperature on the NDVI–climate relationship by increasing the time range of the growing season (Figure 11). The expansion of the range indicated that the phenomenon of rain and heat occurring during the same period was increasingly obvious. We can see that the value of R between NDVI and climate factors in all grassland types was also increasing. During the period from May to September, a lag between NDVI and climate factors was possible, resulting in a low value in R between them, and during the period from June to July, the NDVI–climate relationship was more significant, resulting in a higher value of R between them. However, most studies did not consider the phenomenon of water and heat synchronization when analysing the NDVI–climate relationship, so the results need to be verified [13,41,42,54]. In addition, in the study of the meteorological drought index, most studies did not take into account the phenomenon of rain and heat occurrence during the same period [56,57,58,59], and whether the meteorological drought index also had the same periodicity should be considered. So, when exploring the NDVI–climate relationship, we should first analyse the climate types of the region to avoid the impact of rain and heat occurrence during the same period.
The growth of vegetation is the result of various factors [60,61], and climate factors play a vital role. Revealing the NDVI–climate relationship has been challenging, and the relationship between them is obviously effected by the scale. At the long-term scale, climate determines the vegetation type, and the climate has experienced many large alternations between dry and wet conditions. Thus, today’s vegetation pattern was formed against the background of substantial climate changes [62]. At the short-term scale, vegetation and climate interact and undergo subtle changes, and the relationship between them is extremely complex and nonlinear [63]. At the regional scale, due to the influence of water and heat factors, the climate determines the distribution of vegetation, such as meadow steppe, typical steppe, and desert steppe, showing zonal characteristics. At the local scale, vegetation change is likely to be closely related to human activities [64,65]. In addition, changes in the non-climate environment, such as changes in the groundwater level and soil matrix, will affect the NDVI–climate relationship [66,67]. Therefore, to improve the prediction of NDVI response to future climate change, we should consider all kinds of uncertainty factors when analysing the NDVI–climate relationship.

5. Conclusions

In the study, taking Inner Mongolian grassland as an example, we analysed the temporal changes in NDVI and climate factors, and explored the differences in R between them at different monthly time scales and analysed the change in R between them at multiple time scales. The main conclusions are as follows:
(1)
NDVI was affected by temperature and precipitation from 1982 to 2015 in the area, showing obvious periodic changes, and NDVI showed a certain time lag for climate factors.
(2)
The NDVI–climate relationship was quite different when comparing the within-growing season and the inter-growing season. NDVI had a high value of R with climate factors in the within-growing season, while the significant correlation between them was different in different months in the inter-growing season.
(3)
With the increase in time series, the value of R between NDVI and climate factors of all grassland types showed a trend of increase in the within-growing season, while the value of R between NDVI and precipitation decreased but then tended toward stability in the inter-growing season.
(4)
Due to the synchronization of rainfall and temperature, the correlation coefficients obtained by the within-growing season method were a kind of pseudo correlation, which may not truly reflect the impact of water and heat conditions on vegetation, so this method should be carefully used in the future. In the inter-growing season, the NDVI–climate relationship in different months was analysed separately, which can reduce the impact of rain and heat in the same period and may be more realistic to reflect the relationship between them. So the inter-growing season method is more suitable for the analysis of the NDVI–climate relationship.
Global climate change is becoming increasingly intense, and extreme climate events are occurring more frequently. In view of the complex vegetation–climate relationship, it is always challenging to explore the relationship between them. Our findings will provide a reference for choosing a more scientific and reasonable way to study the NDVI–climate relationship in the future.

Author Contributions

Z.P., S.F., and W.Y. designed the study of the paper, contributed to the ideas, interpretation of the data, and manuscript writing; L.W. and W.H. contributed to data processing and manuscript modifying; M.W. and Q.Z. contributed to data processing and analysis; D.N.K. contributed to formal analysis. All authors contributed to the discussion and commented on the manuscript at all stages.

Funding

This paper was supported by the National Key Research and Development Program of China (grant number 2018YFC1506500), the Fundamental Research Funds (grant number 2019Z010) and the National Natural Science Foundation of China (grant number 41671432).

Acknowledgments

The authors sincerely thank the anonymous reviewers and the editors for their valuable comments and constructive suggestions.

Conflicts of Interest

The authors declare no conflicts of interest.

References

  1. Nemani, R.R.; Keeling, C.D.; Hashimoto, H.; Jolly, W.M.; Piper, S.C.; Tucker, C.J.; Myneni, R.B.; Running, S.W. Climate-driven increases in global terrestrial net primary production from 1982 to 1999. Science 2003, 300, 1560–1563. [Google Scholar] [CrossRef] [Green Version]
  2. Woodward, F.I.; Lomas, M.R.; Kelly, C.K. Global climate and the distribution of plant biomes. Philos. Trans. R. Soc. B 2004, 359, 1465–1476. [Google Scholar] [CrossRef] [PubMed] [Green Version]
  3. Xia, J.Y.; Chen, J.Q.; Piao, S.L.; Ciais, P.; Luo, Y.Q.; Wan, S.Q. Terrestrial carbon cycle affected by non-uniform climate warming. Nat. Geosci. 2014, 7, 173–180. [Google Scholar] [CrossRef]
  4. Liu, Y.; Li, L.; Chen, X.; Zhang, R.; Yang, J. Temporal-spatial variations and influencing factors of vegetation cover in Xinjiang from 1982 to 2013 based on GIMMS-NDVI3g. Glob. Planet. Chang. 2018, 169, 145–155. [Google Scholar] [CrossRef]
  5. Buitenwerf, R.; Rose, L.; Higgins, S.I. Three decades of multi-dimensional change in global leaf phenology. Nat. Clim. Chang. 2015, 5, 364–368. [Google Scholar] [CrossRef]
  6. Xu, Y.; Yang, J.; Chen, Y. NDVI-based vegetation responses to climate change in an arid area of China. Theor. Appl. Climatol. 2015, 126, 213–222. [Google Scholar] [CrossRef]
  7. Xu, X.; Du, H.; Fan, W.; Hu, J.; Mao, F.; Dong, H. Long-term trend in vegetation gross primary production, phenology and their relationships inferred from the FLUXNET data. J. Environ. Manag. 2019, 246, 605–616. [Google Scholar] [CrossRef]
  8. Wu, X.C.; Liu, H.Y.; Li, X.Y.; Ciais, P.; Babst, F.; Guo, W.C.; Zhang, C.C.; Magliulo, V.; Pavelka, M.; Liu, S.M.; et al. Differentiating drought legacy effects on vegetation growth over the temperate Northern Hemisphere. Glob. Chang. Biol. 2018, 24, 504–516. [Google Scholar] [CrossRef]
  9. Manea, A.; Sloane, D.R.; Leishman, M.R. Reductions in native grass biomass associated with drought facilitates the invasion of an exotic grass into a model grassland system. Oecologia 2016, 181, 175–183. [Google Scholar] [CrossRef]
  10. Na, L.; Na, R.; Zhang, J.; Tong, S.; Shan, Y.; Ying, H.; Li, X.; Bao, Y. Vegetation Dynamics and Diverse Responses to Extreme Climate Events in Different Vegetation Types of Inner Mongolia. Atmosphere 2018, 9, 394. [Google Scholar] [CrossRef] [Green Version]
  11. Fang, S.B.; Qi, Y.; Han, G.J.; Li, Q.X.; Zhou, G.S. Changing Trends and Abrupt Features of Extreme Temperature in Mainland China from 1960 to 2010. Atmosphere 2016, 7, 22. [Google Scholar] [CrossRef] [Green Version]
  12. Fang, S.B.; Qi, Y.; Yu, W.G.; Liang, H.Y.; Han, G.J.; Li, Q.X.; Shen, S.H.; Zhou, G.S.; Shi, G.X. Change in temperature extremes and its correlation with mean temperature in mainland China from 1960 to 2015. Int. J. Climatol. 2017, 37, 3910–3918. [Google Scholar] [CrossRef]
  13. Li, W.; Du, J.; Li, S.; Zhou, X.; Duan, Z.; Li, R.; Wu, S.; Wang, S.; Li, M. The variation of vegetation productivity and its relationship to temperature and precipitation based on the GLASS-LAI of different African ecosystems from 1982 to 2013. Int. J. Biometeorol. 2019, 63, 847–860. [Google Scholar] [CrossRef] [PubMed]
  14. Jiang, C.; Zhang, L.B. Climate Change and Its Impact on the Eco-Environment of the Three-Rivers Headwater Region on the Tibetan Plateau, China. Int. J. Environ. Res. Public Health 2015, 12, 12057–12081. [Google Scholar] [CrossRef] [Green Version]
  15. Shen, X.J.; Liu, B.H.; Zhou, D.W. Using GIMMS NDVI time series to estimate the impacts of grassland vegetation cover on surface air temperatures in the temperate grassland region of China. Remote Sens. Lett. 2016, 7, 229–238. [Google Scholar] [CrossRef]
  16. Lu, Q.; Zhao, D.; Wu, S.; Dai, E.; Gao, J. Using the NDVI to analyze trends and stability of grassland vegetation cover in Inner Mongolia. Theor. Appl. Climatol. 2018, 135, 1629–1640. [Google Scholar] [CrossRef]
  17. Guo, L.; Wu, S.; Zhao, D.; Yin, Y.; Leng, G.; Zhang, Q. NDVI-Based Vegetation Change in Inner Mongolia from 1982 to 2006 and Its Relationship to Climate at the Biome Scale. Adv. Meteorol. 2014, 2014, 1–12. [Google Scholar] [CrossRef]
  18. Chu, H.; Venevsky, S.; Wu, C.; Wang, M. NDVI-based vegetation dynamics and its response to climate changes at Amur-Heilongjiang River Basin from 1982 to 2015. Sci. Total Environ. 2019, 650, 2051–2062. [Google Scholar] [CrossRef]
  19. Wen, Y.; Liu, X.; Yang, J.; Lin, K.; Du, G. NDVI indicated inter-seasonal non-uniform time-lag responses of terrestrial vegetation growth to daily maximum and minimum temperature. Glob. Planet. Chang. 2019, 177, 27–38. [Google Scholar] [CrossRef]
  20. Wei, Z.F.; Huang, Q.Y.; Zhang, R. Dynamics of Vegetation Coverage and Response to Climate Change in China-South Asia-Southeast Asia during 1982–2013. Appl. Ecol. Environ. Res. 2019, 17, 2865–2879. [Google Scholar] [CrossRef]
  21. Huang, X.L.; Zhang, T.B.; Yi, G.H.; He, D.; Zhou, X.B.; Li, J.J.; Bie, X.J.; Miao, J.Q. Dynamic Changes of NDVI in the Growing Season of the Tibetan Plateau During the Past 17 Years and Its Response to Climate Change. Int. J. Environ. Res. Public Health 2019, 16, 3452. [Google Scholar] [CrossRef] [PubMed] [Green Version]
  22. Mao, D.H.; Wang, Z.M.; Luo, L.; Ren, C.Y. Integrating AVHRR and MODIS data to monitor NDVI changes and their relationships with climatic parameters in Northeast China. Int. J. Appl. Earth Obs. Geoinf. 2012, 18, 528–536. [Google Scholar] [CrossRef]
  23. Jin, J.X.; Wang, Y.; Jiang, H.; Cheng, M. Recent NDVI-Based Variation in Growth of Boreal Intact Forest Landscapes and Its Correlation with Climatic Variables. Sustainability 2016, 8, 326. [Google Scholar] [CrossRef] [Green Version]
  24. Maselli, F. Monitoring forest conditions in a protected Mediterranean coastal area by the analysis of multiyear NDVI data. Remote Sens. Environ. 2004, 89, 423–433. [Google Scholar] [CrossRef]
  25. Shabanov, N.V.; Zhou, L.M.; Knyazikhin, Y.; Myneni, R.B.; Tucker, C.J. Analysis of interannual changes in northern vegetation activity observed in AVHRR data from 1981 to 1994. IEEE Trans. Geosci. Remote 2002, 40, 115–130. [Google Scholar] [CrossRef] [Green Version]
  26. Mao, J.F.; Shi, X.Y.; Thornton, P.E.; Hoffman, F.M.; Zhu, Z.C.; Myneni, R.B. Global Latitudinal-Asymmetric Vegetation Growth Trends and Their Driving Mechanisms: 1982–2009. Remote Sens. 2013, 5, 1484–1497. [Google Scholar] [CrossRef] [Green Version]
  27. Piao, S.L.; Tan, J.G.; Chen, A.P.; Fu, Y.H.; Ciais, P.; Liu, Q.; Janssens, I.A.; Vicca, S.; Zeng, Z.Z.; Jeong, S.J.; et al. Leaf onset in the northern hemisphere triggered by daytime temperature. Nat. Commun. 2015, 6, 8. [Google Scholar] [CrossRef] [Green Version]
  28. Camberlin, P.; Martiny, N.; Philippon, N.; Richard, Y. Determinants of the interannual relationships between remote sensed photosynthetic activity and rainfall in tropical Africa. Remote Sens. Environ. 2007, 106, 199–216. [Google Scholar] [CrossRef] [Green Version]
  29. Piao, S.L.; Wang, X.H.; Ciais, P.; Zhu, B.; Wang, T.; Liu, J. Changes in satellite-derived vegetation growth trend in temperate and boreal Eurasia from 1982 to 2006. Glob. Chang. Biol. 2011, 17, 3228–3239. [Google Scholar] [CrossRef]
  30. Park, H.S.; Sohn, B.J. Recent trends in changes of vegetation over East Asia coupled with temperature and rainfall variations. J. Geophys. Res. Atmos. 2010, 115. [Google Scholar] [CrossRef]
  31. Mu, S.; Li, J.; Chen, Y.; Gang, C.; Zhou, W.; Ju, W. Spatial Differences of Variations of Vegetation Coverage in Inner Mongolia during 2001–2010. Acta Geogr. Sin. 2012, 67, 1255–1268. [Google Scholar]
  32. Liu, S.L.; Wang, T. Climate change and local adaptation strategies in the middle Inner Mongolia, northern China. Environ. Earth Sci. 2012, 66, 1449–1458. [Google Scholar] [CrossRef]
  33. John, R.; Chen, J.; Ou-Yang, Z.-T.; Xiao, J.; Becker, R.; Samanta, A.; Ganguly, S.; Yuan, W.; Batkhishig, O. Vegetation response to extreme climate events on the Mongolian Plateau from 2000 to 2010. Environ. Res. Lett. 2013, 8. [Google Scholar] [CrossRef]
  34. Li, C.; Wang, J.; Hu, R.; Yin, S.; Bao, Y.; Ayal, D.Y. Relationship between vegetation change and extreme climate indices on the Inner Mongolia Plateau, China, from 1982 to 2013. Ecol. Indic. 2018, 89, 101–109. [Google Scholar] [CrossRef]
  35. Wen, Y.; Liu, X.; Xin, Q.; Wu, J.; Xu, X.; Pei, F.; Li, X.; Du, G.; Cai, Y.; Lin, K.; et al. Cumulative Effects of Climatic Factors on Terrestrial Vegetation Growth. J. Geophys. Res. Biogeosci. 2019, 124, 789–806. [Google Scholar] [CrossRef]
  36. Xu, G.; Zhang, H.; Chen, B.; Zhang, H.; Innes, J.; Wang, G.; Yan, J.; Zheng, Y.; Zhu, Z.; Myneni, R.J.R.S. Changes in Vegetation Growth Dynamics and Relations with Climate over China’s Landmass from 1982 to 2011. Remote Sens. 2014, 6, 3263–3283. [Google Scholar] [CrossRef] [Green Version]
  37. Mulder, C.P.H.; Iles, D.T.; Rockwell, R.F. Increased variance in temperature and lag effects alter phenological responses to rapid warming in a subarctic plant community. Glob. Chang. Biol. 2017, 23, 801–814. [Google Scholar] [CrossRef]
  38. Zhang, X.; Ge, Q.; Zheng, J. Relationship between climate change and vegetation in Beijing using remote sensed data and phenological data. Acta Phytoecol. Sin. 2004, 28, 499–506. [Google Scholar]
  39. Pang, J.; Du, Z.; Zhang, X. Time-lagged response of vegetation to hydrothermal factors in xinjiang region. Chin. J. Agric. Resour. Reg. Plan. 2015, 36, 82–88. [Google Scholar]
  40. Song, Y.; Ma, M. A statistical analysis of the relationship between climatic factors and the Normalized Difference Vegetation Index in China. Int. J. Remote Sens. 2011, 32, 3947–3965. [Google Scholar] [CrossRef]
  41. Liu, X.; Zhang, J.; Zhu, X.; Pan, Y.; Liu, Y.; Zhang, D.; Lin, Z. Spatiotemporal changes in vegetation coverage and its driving factors in the Three-River Headwaters Region during 2000–2011. J. Geogr. Sci. 2014, 24, 288–302. [Google Scholar] [CrossRef]
  42. Shen, B.; Fang, S.; Li, G. Vegetation Coverage Changes and Their Response to Meteorological Variables from 2000 to 2009 in Naqu, Tibet, China. Can. J. Remote Sens. 2014, 40, 67–74. [Google Scholar] [CrossRef]
  43. Shao, H.; Wu, J.; Liu, M.; Yang, W. Responses of Vegetation Changes to Climatic Variations in Panxi Area Based on the MODIS Multispectral Data. Spectrosc. Spectr. Anal. 2014, 34, 167–171. [Google Scholar]
  44. Liu, X.; Tian, Z.; Zhang, A.; Zhao, A.; Liu, H. Impacts of Climate on Spatiotemporal Variations in Vegetation NDVI from 1982–2015 in Inner Mongolia, China. Sustainability 2019, 11, 768. [Google Scholar] [CrossRef] [Green Version]
  45. Li, C.; Leal Filho, W.; Yin, J.; Hu, R.; Wang, J.; Yang, C.; Yin, S.; Bao, Y.; Ayal, D.Y. Assessing vegetation response to multi-time-scale drought across inner Mongolia plateau. J. Clean. Prod. 2018, 179, 210–216. [Google Scholar] [CrossRef]
  46. Ma, L.; Wang, J.; Liu, T.; Huang, X.; Liu, D.; Li, H. Response Relationship between Vegetation and Climate Factors in Horqin Sandy Land from 2000 to 2012. Trans. Chin. Soc. Agric. Mach. 2016, 47, 162–172. [Google Scholar]
  47. Shen, B.; Fang, S.; Yu, W. Different correlations between NDVI and meteorological factors at temporal-time scales. J. Remote Sens. 2016, 20, 481–490. [Google Scholar] [CrossRef]
  48. Yang, J.; Wan, Z.Q.; Borjigin, S.; Zhang, D.; Yan, Y.L.; Chen, Y.L.; Gu, R.; Gao, Q.Z. Changing Trends of NDVI and Their Responses to Climatic Variation in Different Types of Grassland in Inner Mongolia from 1982 to 2011. Sustainability 2019, 11, 3256. [Google Scholar] [CrossRef] [Green Version]
  49. Miao, L.J.; Ye, P.L.; He, B.; Chen, L.Z.; Cui, X.F. Future Climate Impact on the Desertification in the Dry Land Asia Using AVHRR GIMMS NDVI3g Data. Remote Sens. 2015, 7, 3863–3877. [Google Scholar] [CrossRef] [Green Version]
  50. Wanda, D.K.; Stef, L.; Michael, H.; Laurent, T.; Pol, C.; Sensing, S.B.J.R. Assessment of Regional Vegetation Response to Climate Anomalies: A Case Study for Australia Using GIMMS NDVI Time Series between 1982 and 2006. Remote Sens. 2017, 9, 34. [Google Scholar] [CrossRef] [Green Version]
  51. Holben, B.N. Characteristics of maximum-value composite images from temporal AVHRR data. Int. J. Remote Sens. 2007, 7, 1417–1434. [Google Scholar] [CrossRef]
  52. Zhu, W.; Li, S. The dynamic response of forest vegetation to hydrothermal conditions in the Funiu Mountains of western Henan Province. J. Geogr. Sci. 2017, 27, 565–578. [Google Scholar] [CrossRef] [Green Version]
  53. Ma, S.; Bao, G.; Guo, G.; Yang, L.; Dai, Q.; Zheng, L. Change Trend of Vegetation and Its Responses to Climate Change in the Source Region of the Yellow River. J. Arid Meteorol. 2018, 36, 226–233. [Google Scholar]
  54. Hu, M.Q.; Mao, F.; Sun, H.; Hou, Y.Y. Study of normalized difference vegetation index variation and its correlation with climate factors in the three-river-source region. Int. J. Appl. Earth Obs. Geoinf. 2011, 13, 24–33. [Google Scholar] [CrossRef]
  55. Cao, Y.; Zhang, L.; Yuan, L. Correlation Analysis of Normalized Difference Vegetation Index (NDVI) and Climatic Factors in the Vegetative Growing Season in Liaoning Province. Chin. Bull. Bot. 2018, 53, 82–93. [Google Scholar]
  56. Jiao, W.; Zhang, L.; Chang, Q.; Fu, D.; Cen, Y.; Tong, Q. Evaluating an Enhanced Vegetation Condition Index (VCI) Based on VIUPD for Drought Monitoring in the Continental United States. Remote Sens. 2016, 8, 224. [Google Scholar] [CrossRef] [Green Version]
  57. Zhang, A.; Jia, G. Monitoring meteorological drought in semiarid regions using multi-sensor microwave remote sensing data. Remote Sens. Environ. 2013, 134, 12–23. [Google Scholar] [CrossRef]
  58. Wang, K.; Li, T.; Wei, J. Exploring Drought Conditions in the Three River Headwaters Region from 2002 to 2011 Using Multiple Drought Indices. Water 2019, 11, 190. [Google Scholar] [CrossRef] [Green Version]
  59. Liu, S.; Zhang, Y.; Cheng, F.; Hou, X.; Zhao, S. Response of Grassland Degradation to Drought at Different Time-Scales in Qinghai Province: Spatio-Temporal Characteristics, Correlation, and Implications. Remote Sens. 2017, 9, 1329. [Google Scholar] [CrossRef] [Green Version]
  60. Fang, S.B.; Zhang, X.S. Control of vegetation distribution: Climate, geological substrate, and geomorphic factors. A case study of grassland in Ordos, Inner Mongolia, China. Can. J. Remote Sens. 2013, 39, 167–174. [Google Scholar] [CrossRef]
  61. Jiang, C.; Wang, F. Environmental Change in the Agro-Pastoral Transitional Zone, Northern China: Patterns, Drivers, and Implications. Int. J. Environ. Res. Public Health 2016, 13, 165. [Google Scholar] [CrossRef] [PubMed] [Green Version]
  62. Wang, X.; Chen, F.H.; Dong, Z.; Xia, D. Evolution of the southern Mu Us Desert in north China over the past 50 years: An analysis using proxies of human activity and climate parameters. Land Degrad. Dev. 2005, 16, 351–366. [Google Scholar] [CrossRef]
  63. Zhang, J.; Zhang, Y.; Qin, S.; Wu, B.; Lai, Z.J.L.D. Effects of seasonal variability of climatic factors on vegetation coverage across drylands in northern China. Land Degrad. Dev. 2017, 29, 1782–1791. [Google Scholar] [CrossRef]
  64. Shao, Y.Y.; Zhang, Y.Q.; Wu, X.Q.; Bourque, C.P.A.; Zhang, J.T.; Qin, S.G.; Wu, B. Relating historical vegetation cover to aridity patterns in the greater desert region of northern China: Implications to planned and existing restoration projects. Ecol. Indic. 2018, 89, 528–537. [Google Scholar] [CrossRef]
  65. Xiu, L.N.; Yan, C.Z.; Li, X.S.; Qian, D.W.; Feng, K. Monitoring the response of vegetation dynamics to ecological engineering in the Mu Us Sandy Land of China from 1982 to 2014. Environ. Monit. Assess. 2018, 190, 18. [Google Scholar] [CrossRef]
  66. Lv, J.J.; Wang, X.S.; Zhou, Y.X.; Qian, K.Z.; Wan, L.; Eamus, D.; Tao, Z.P. Groundwater-dependent distribution of vegetation in Hailiutu River catchment, a semi-arid region in China. Ecohydrology 2013, 6, 142–149. [Google Scholar] [CrossRef]
  67. Liang, P.; Yang, X.P. Landscape spatial patterns in the Maowusu (Mu Us) Sandy Land, northern China and their impact factors. Catena 2016, 145, 321–333. [Google Scholar] [CrossRef]
Figure 1. The spatial distribution of grassland types (left) (the inset map indicates where the study area is in China) and the elevations and average NDVI (the normalized difference vegetation index) values of the meteorological stations (right) in this study.
Sustainability 11 07243 g001
Figure 2. Change in NDVI from 1982 to 2015 in the area: (a) monthly scales; (b) annual average scale (top) and monthly average scale (bottom).
Sustainability 11 07243 g002
Figure 3. Change in average temperature from 1982 to 2015 in the area: (a) monthly scales; (b) annual average scale (top) and monthly average scale (bottom).
Sustainability 11 07243 g003
Figure 4. Change in precipitation from 1982 to 2015 in the area: (a) monthly scales; (b) annual average scale (top) and monthly average scale (bottom).
Sustainability 11 07243 g004
Figure 5. Monthly average changes in NDVI and climate factors in the area.
Sustainability 11 07243 g005
Figure 6. The value of R between NDVI and climate factors (all grassland type): (a) temperature and (b) precipitation. All coefficients were significant at p < 0.05.
Sustainability 11 07243 g006
Figure 7. The time lag in R between NDVI and climate factors (all grassland type): (a) temperature and (b) precipitation. T0, T1, T2, and T3 represent temperature variables in the previous 0–3 months, respectively; P0, P1, P2, and P3 represent precipitation variables in previous 0–3 months, respectively. All coefficients were significant at p < 0.05.
Sustainability 11 07243 g007aSustainability 11 07243 g007b
Figure 8. The monthly lags between NDVI and climate factors (all grassland type): (a) temperature and (b) precipitation.
Sustainability 11 07243 g008
Figure 9. Change in R between NDVI and climate factors at multiple time scales (the within-growing season): Temperature: (a) meadow steppe, (b) typical steppe, (c) desert steppe. Precipitation: (d) meadow steppe, (e) typical steppe, (f) desert steppe. All coefficients were significant at p < 0.05.
Sustainability 11 07243 g009aSustainability 11 07243 g009b
Figure 10. Change in R between NDVI and precipitation at multiple time scales (the inter-growing season): (a) meadow steppe, (b) typical steppe and (c) desert steppe. All coefficients were significant at p < 0.05.
Sustainability 11 07243 g010
Figure 11. Change in R between NDVI and climate factors during different periods. Temperature: (a) meadow steppe, (c) typical steppe, and (e) desert steppe. Precipitation: (b) meadow steppe, (d) typical steppe, and (f) desert steppe. All coefficients were significant at p < 0.05.
Sustainability 11 07243 g011aSustainability 11 07243 g011b
Table 1. The value of R between NDVI and climate factors (all grassland type).
Grassland TypeClimate FactorAprilMayJuneJulyAugustSeptemberOctober
Meadow steppeTemperature0.4570.573 0.410
Precipitation 0.431
Typical steppeTemperature0.408 −0.420 −0.440 0.389
Precipitation 0.4140.4910.550
Desert steppeTemperature−0.368
Precipitation 0.5150.4360.5320.542
All coefficients are significant at p < 0.05.

