Linking Social Perception and Provision of Ecosystem Services in a Sprawling Urban Landscape: A Case Study of Multan, Pakistan

 ,
,
Abstract
:1. Introduction
- To what extent does the public in the study area believe the quality and provision of ecosystem services has changed in the recent past (i.e., the past ten years)?
- Having answered the first question, to what extent does the public believe that urban sprawl is responsible for the perceived changes in the quality and provision of ecosystem services?
- What are the underlying socio-demographic causes for these individual opinions?
2. Methodology
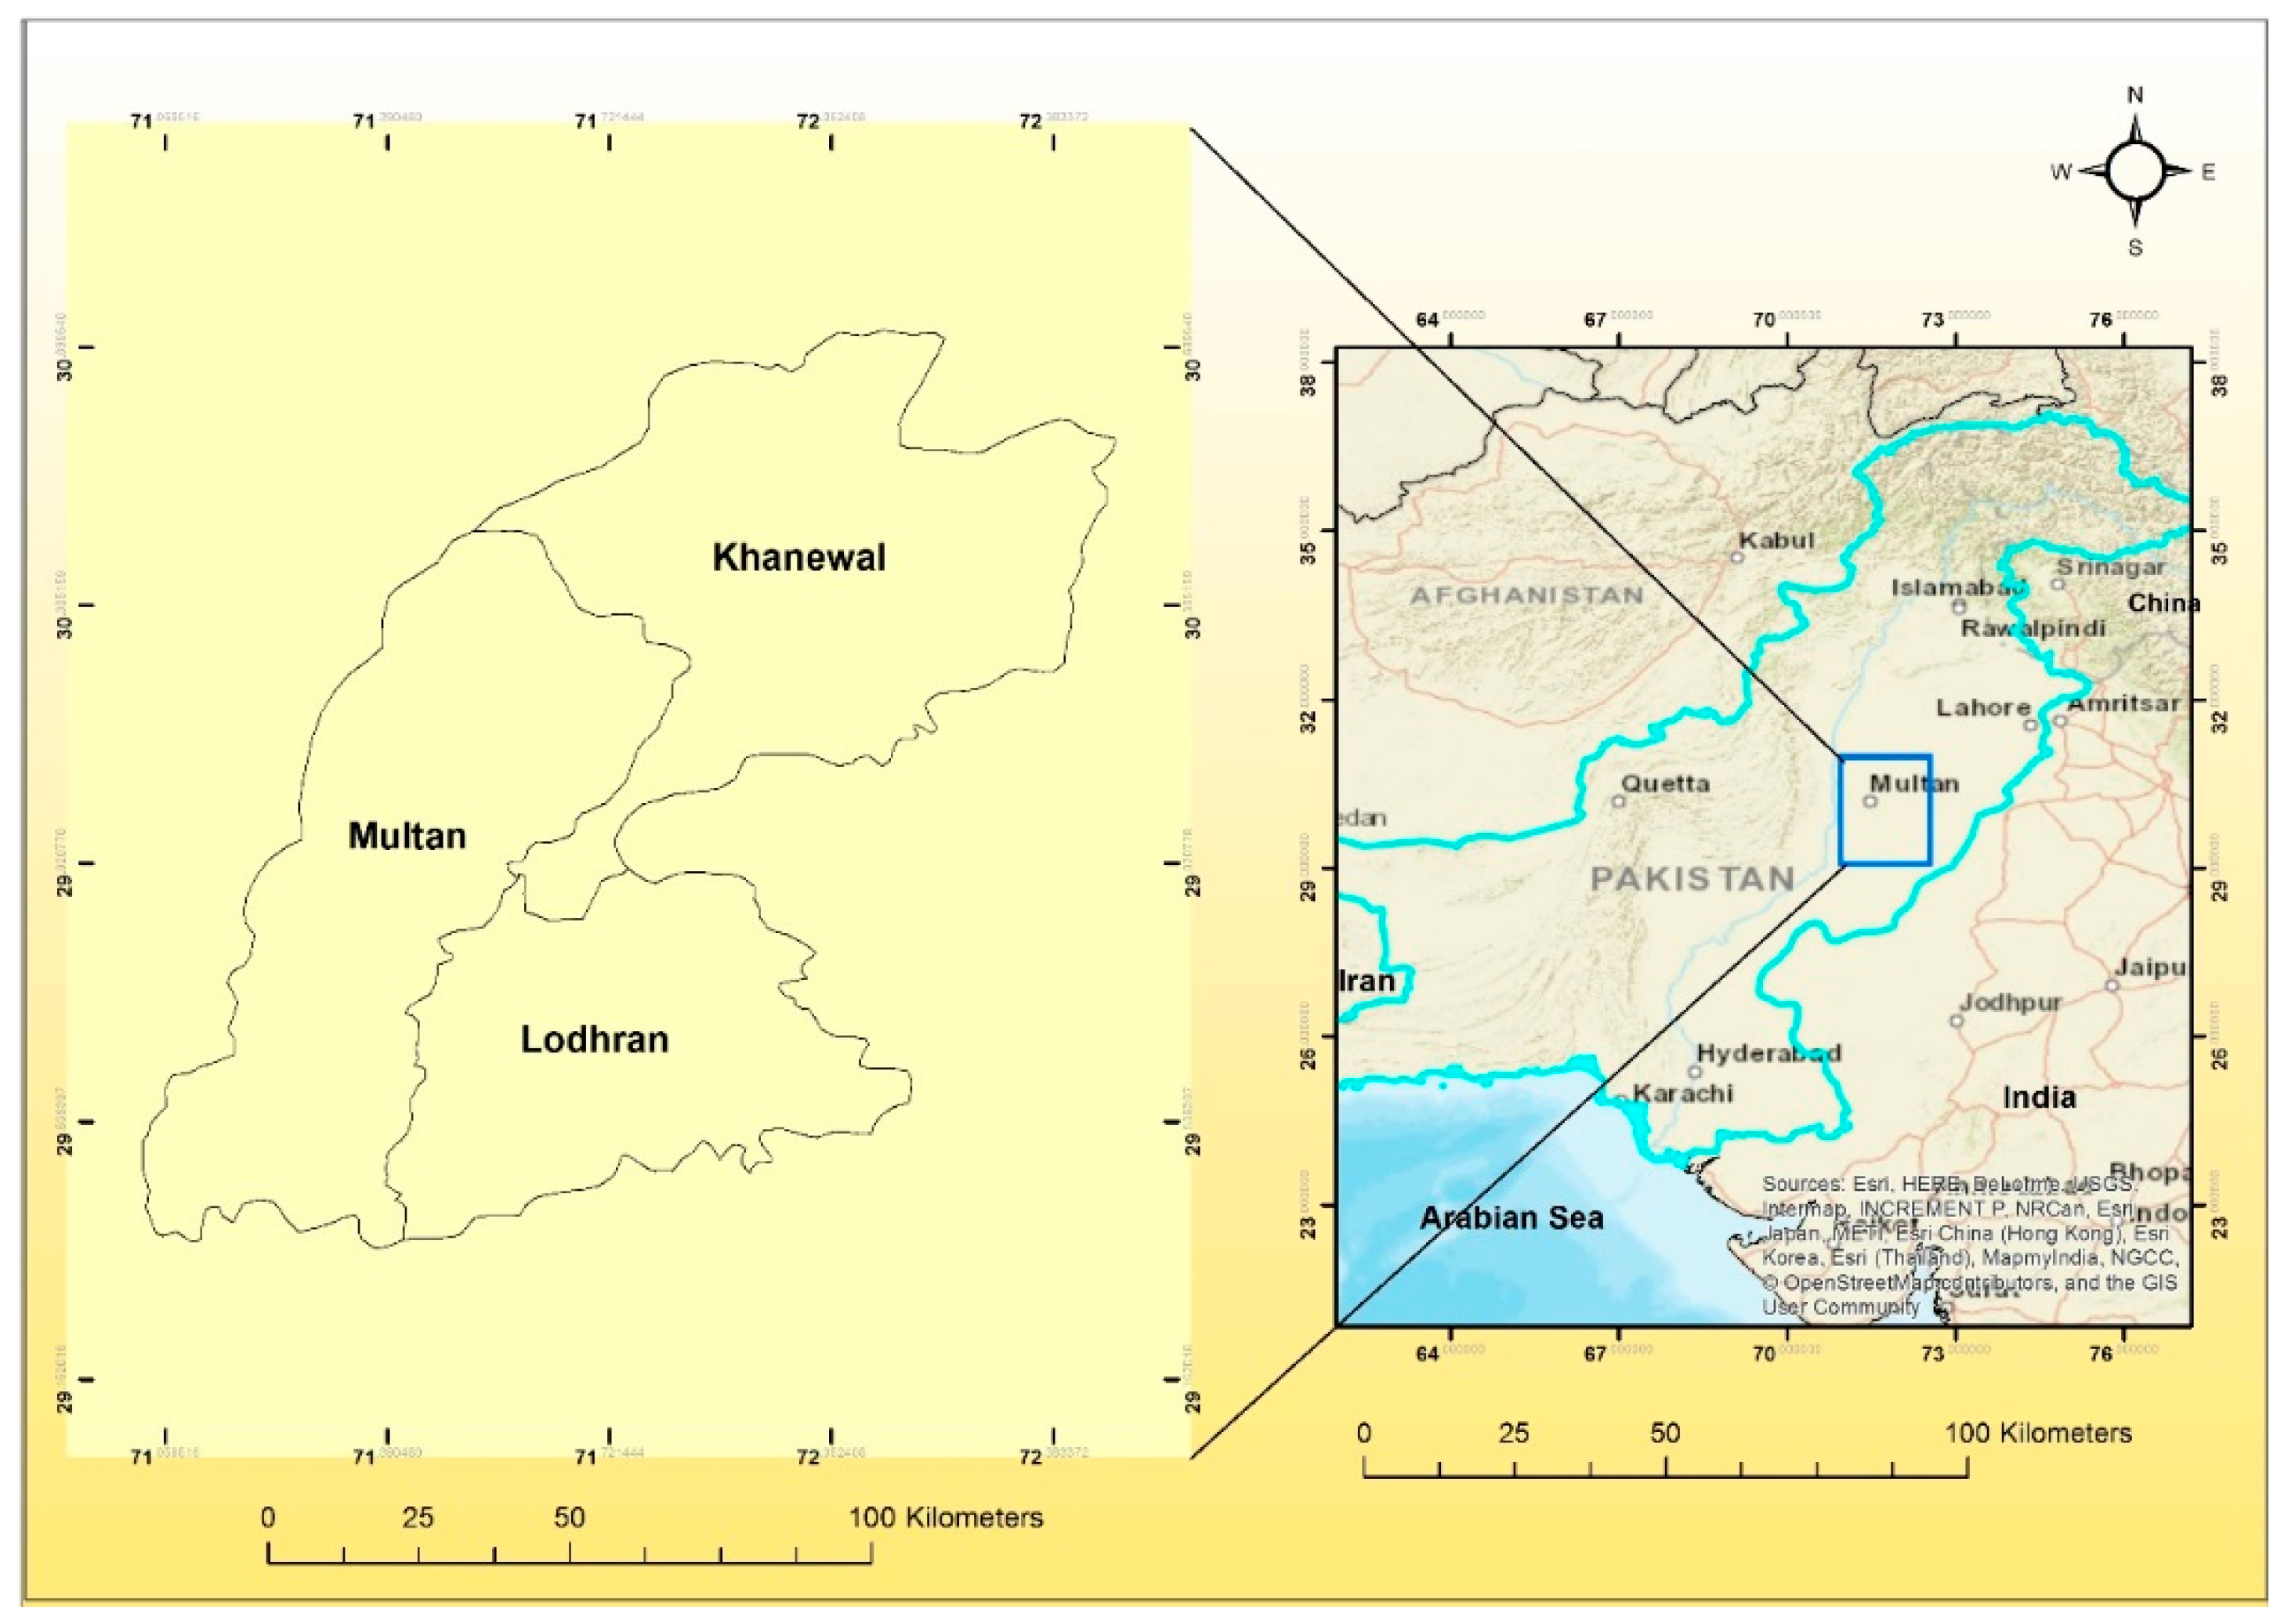
2.1. Study Area
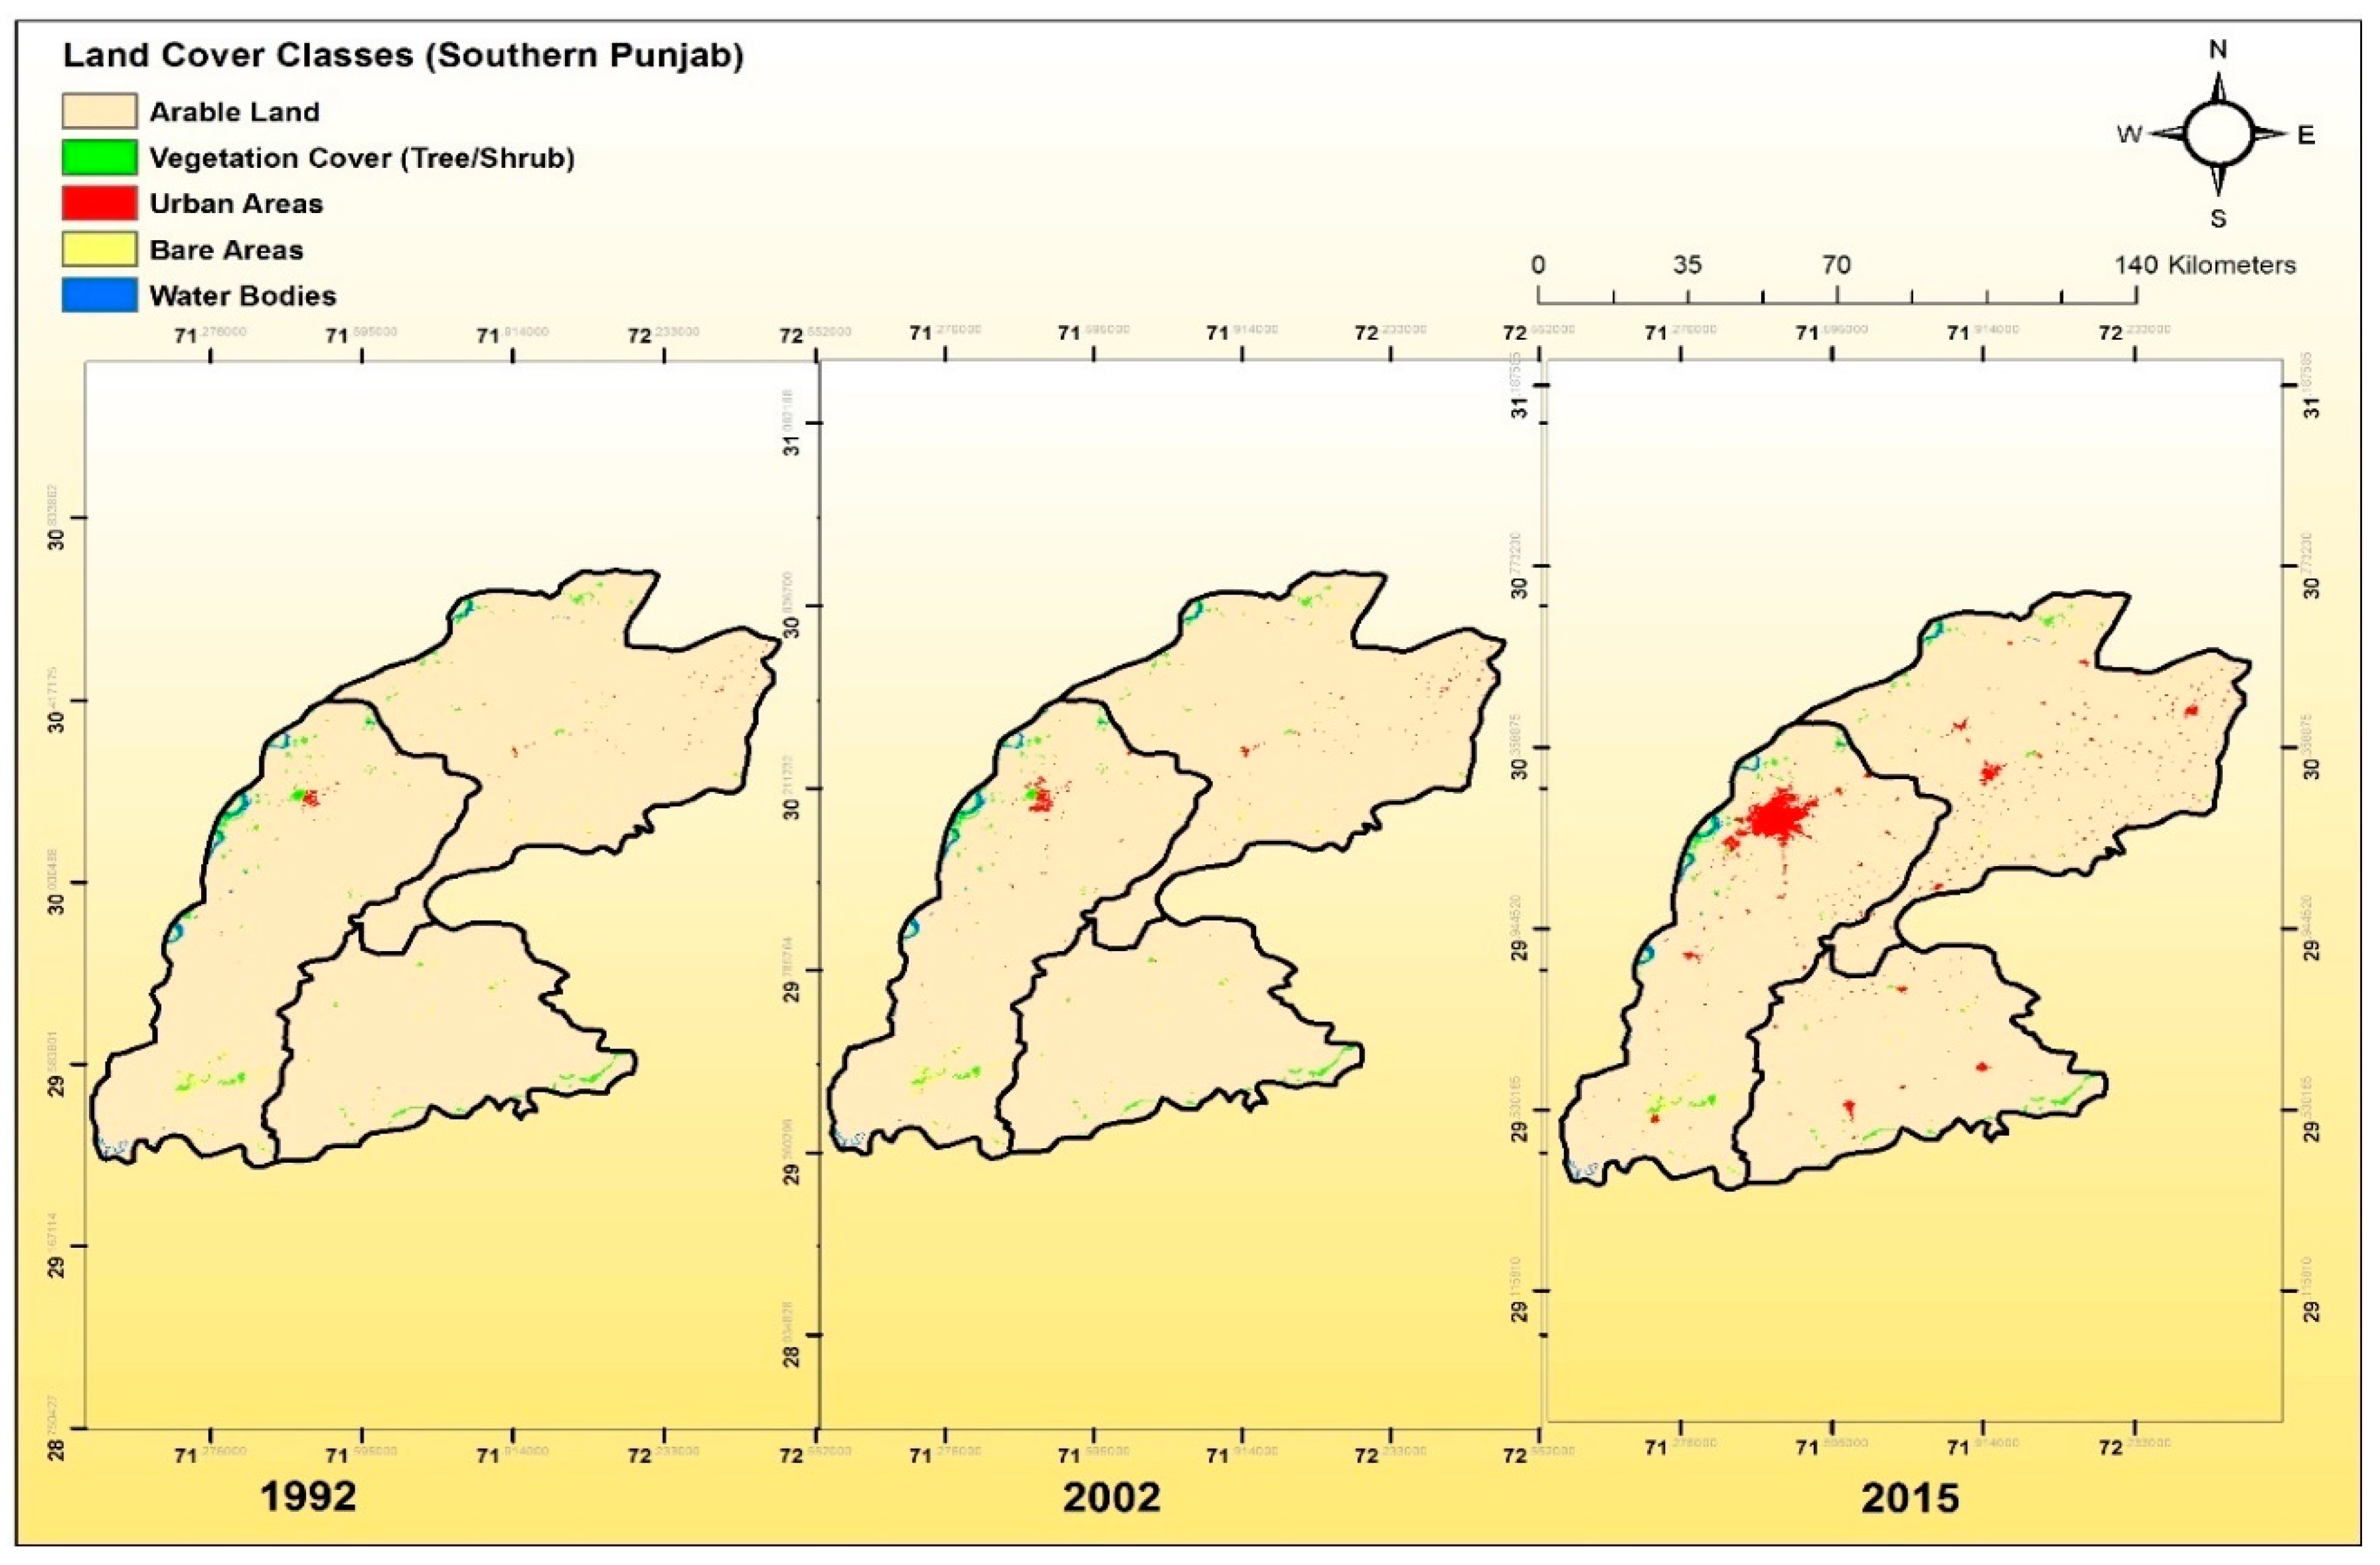
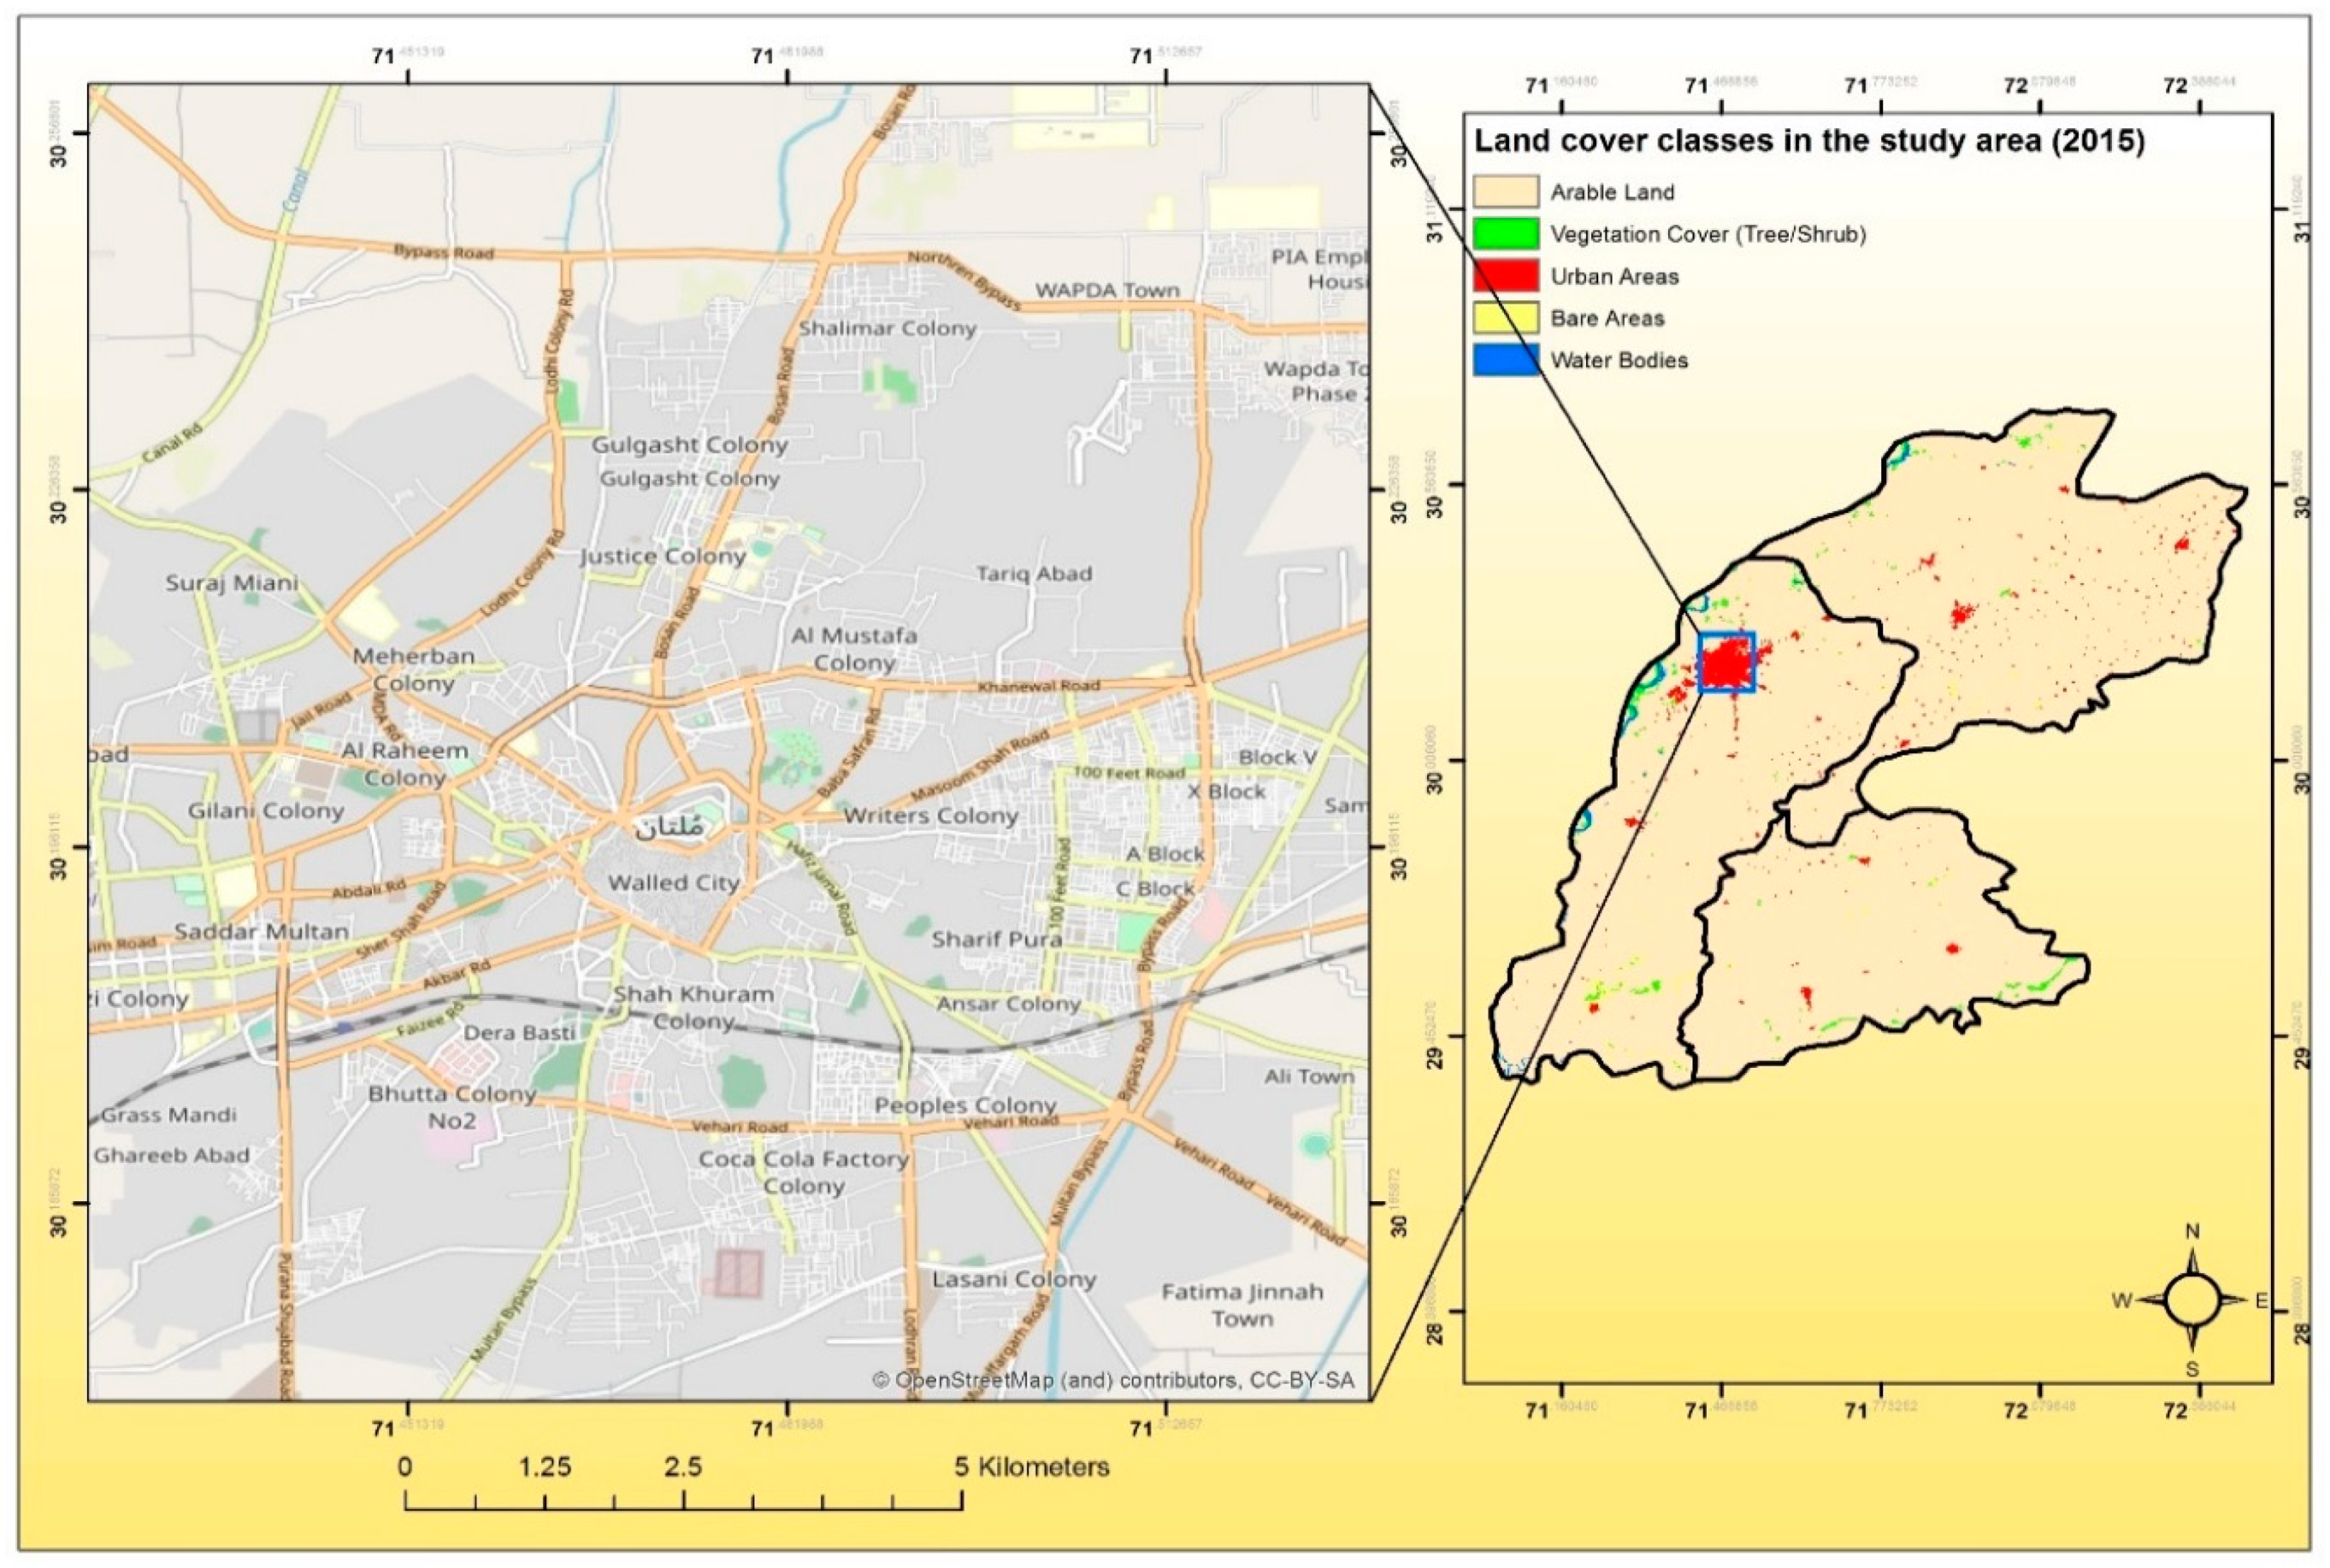
- Step 1: Quantifying the Historic Land Use Change Patterns in Multan City
- Step 2: Perception of the Local Community about the Changes in Ecosystem Services as Affected by Urban Sprawl
2.2. Design of the Survey Instrument
2.3. Population Sampling
2.4. Statistical Analysis
3. Results
3.1. Understanding Public Perception of Urban Sprawl and Its Effects on the Provision of Ecosystem Services through Qualitative Analysis
3.1.1. The Demographic Profile of the Respondents
3.1.2. Constructs
3.1.3. Multiple Regression Model
4. Discussion
Limitations of the Study
5. Conclusions
Supplementary Materials
Author Contributions
Acknowledgments
Conflicts of Interest
Ethical Statement
References
- Zhou, D.; Tian, Y.; Jiang, G. Spatio-temporal investigation of the interactive relationship between urbanization and ecosystem services: Case study of the Jingjinji urban agglomeration, China. Ecol. Indic. 2018, 95, 152–164. [Google Scholar] [CrossRef]
- Secretariat of the Convention on Biological Diversity Cities and Biodiversity Outlook. 2012. Available online: https://www.google.com/url?sa=t&rct=j&q=&esrc=s&source=web&cd=2&ved=2ahUKEwix6vK-g4bgAhXYAYgKHeHAAUIQFjABegQIAxAC&url=https%3A%2F%2Fwww.cbd.int%2Fauthorities%2Fdoc%2Fcbo-1%2Fcbd-cbo1-summary-en-f-web.pdf&usg=AOvVaw2by9T1jQ24Qzugi8LWhzHE (accessed on 6 July 2018).
- Dobbs, C.; Hernández-Moreno, Á.; Reyes-Paecke, S.; Miranda, M.D. Exploring temporal dynamics of urban ecosystem services in Latin America: The case of Bogota (Colombia) and Santiago (Chile). Ecol. Indic. 2018, 85, 1068–1080. [Google Scholar] [CrossRef]
- Ewing, R. Is Los Angeles-Style Sprawl Desirable? J. Am. Plan. Assoc. 1997, 63, 107–126. [Google Scholar] [CrossRef]
- Sun, X.; Crittenden, J.C.; Li, F.; Lu, Z.; Dou, X. Urban expansion simulation and the spatio-temporal changes of ecosystem services, a case study in Atlanta Metropolitan area, USA. Sci. Total Environ. 2018, 622–623, 974–987. [Google Scholar] [CrossRef] [PubMed]
- Rees, W.E. Ecological footprints and appropriated carrying capacity: What urban economics leaves out. Environ. Urban. 1992, 4, 121–130. [Google Scholar] [CrossRef]
- Dupras, J.; Alam, M. Urban Sprawl and Ecosystem Services: A Half Century Perspective in the Montreal Area (Quebec, Canada). J. Environ. Policy Plan. 2015, 17, 180–200. [Google Scholar] [CrossRef]
- Sieber, J.; Pons, M. Assessment of urban ecosystem services using ecosystem services reviews and GIS-based tools. Procedia Eng. 2015, 115, 53–60. [Google Scholar] [CrossRef]
- Castro, A.J.; Vaughn, C.C.; Julian, J.P.; Llorente, M.G.; Bowman, K.N. Social Perception and Supply of Ecosystem Services—A Watershed Approach for Carbon Related Ecosystem Services. Biodivers. Ecosyst. Link. Struct. Funct. 2015. [Google Scholar] [CrossRef]
- Liu, Y.; Yue, W.; Fan, P. Spatial determinants of urban land conversion in large Chinese cities: A case of Hangzhou. Environ. Plan. B Plan. Des. 2011, 38, 706–725. [Google Scholar] [CrossRef]
- Journal, I.; Mohapatra, S. An Ecological Analysis of Carrying Capacity and Sustainability. Int. J. Sci. Res. 2015, 2, 335–338. [Google Scholar]
- Świąder, M.; Szewrański, S.; Kazak, J.; van Hoof, J.; Lin, D.; Wackernagel, M.; Alves, A. Application of Ecological Footprint Accounting as a Part of an Integrated Assessment of Environmental Carrying Capacity: A Case Study of the Footprint of Food of a Large City. Resources 2018, 7, 52. [Google Scholar] [CrossRef]
- Jung, C.; Kim, C.; Kim, S.; Suh, K. Analysis of environmental carrying capacity with emergy perspective of Jeju Island. Sustainability 2018, 10, 1681. [Google Scholar] [CrossRef]
- Raudsepp-Hearne, C.; Peterson, G.D.; Bennett, E.M. Ecosystem service bundles for analyzing tradeoffs in diverse landscapes. Proc. Natl. Acad. Sci. USA 2010, 107, 5242–5247. [Google Scholar] [CrossRef] [PubMed] [Green Version]
- Spake, R.; Lasseur, R.; Crouzat, E.; Bullock, J.M.; Lavorel, S.; Parks, K.E.; Schaafsma, M.; Bennett, E.M.; Maes, J.; Mulligan, M.; et al. Unpacking ecosystem service bundles: Towards predictive mapping of synergies and trade-offs between ecosystem services. Glob. Environ. Chang. 2017, 47, 37–50. [Google Scholar] [CrossRef]
- Kong, L.; Zheng, H.; Xiao, Y.; Ouyang, Z.; Li, C.; Zhang, J.; Huang, B. Mapping ecosystem service bundles to detect distinct types of multifunctionality within the diverse landscape of the yangtze river basin, China. Sustainability 2018, 10, 857. [Google Scholar] [CrossRef]
- Inostroza, L. Measuring urban ecosystem functions through “Technomass”—A novel indicator to assess urban metabolism. Ecol. Indic. 2014, 42, 10–19. [Google Scholar] [CrossRef]
- Olander, L.P.; Johnston, R.J.; Tallis, H.; Kagan, J.; Maguire, L.A.; Polasky, S.; Urban, D.; Boyd, J.; Wainger, L.; Palmer, M. Benefit relevant indicators: Ecosystem services measures that link ecological and social outcomes. Ecol. Indic. 2018, 85, 1262–1272. [Google Scholar] [CrossRef]
- Beardsley, K.; Thorne, J.H.; Roth, N.E.; Gao, S.; McCoy, M.C. Assessing the influence of rapid urban growth and regional policies on biological resources. Landsc. Urban Plan. 2009, 93, 172–183. [Google Scholar] [CrossRef]
- Bengston, D.N.; Fletcher, J.O.; Nelson, K.C. Public policies for managing urban growth and protecting open space: Policy instruments and lessons learned in the United States. Landsc. Urban Plan. 2004, 69, 271–286. [Google Scholar] [CrossRef]
- Westerink, J.; Haase, D.; Bauer, A.; Ravetz, J.; Jarrige, F.; Aalbers, C.B.E.M. Dealing with Sustainability Trade-Offs of the Compact City in Peri-Urban Planning Across European City Regions. Eur. Plan. Stud. 2013, 21, 473–497. [Google Scholar] [CrossRef]
- Bengston, D.N.; Potts, R.S.; Fan, D.P.; Goetz, E.G. An analysis of the public discourse about urban sprawl in the United States: Monitoring concern about a major threat to forests. For. Policy Econ. 2005, 7, 745–756. [Google Scholar] [CrossRef]
- Chen, C.; Wang, Y.; Jia, J. Public perceptions of ecosystem services and preferences for design scenarios of the flooded bank along the Three Gorges Reservoir: Implications for sustainable management of novel ecosystems. Urban For. Urban Green. 2018, 34, 196–204. [Google Scholar] [CrossRef]
- Vihervaara, P.; Rönkä, M.; Walls, M. Trends in ecosystem service research: Early steps and current drivers. Ambio 2010, 39, 314–324. [Google Scholar] [CrossRef] [PubMed]
- Fagerholm, N.; Käyhkö, N.; Ndumbaro, F.; Khamis, M. Community stakeholders’ knowledge in landscape assessments—Mapping indicators for landscape services. Ecol. Indic. 2012, 18, 421–433. [Google Scholar] [CrossRef]
- Seppelt, R.; Dormann, C.F.; Eppink, F.V.; Lautenbach, S.; Schmidt, S. A quantitative review of ecosystem service studies: Approaches, shortcomings and the road ahead. J. Appl. Ecol. 2011, 48, 630–636. [Google Scholar] [CrossRef]
- Lee, T.M.; Markowitz, E.M.; Howe, P.D.; Ko, C.Y.; Leiserowitz, A.A. Predictors of public climate change awareness and risk perception around the world. Nat. Clim. Chang. 2015, 5, 1014–1020. [Google Scholar] [CrossRef]
- Paul, S.; Nagendra, H. Factors Influencing Perceptions and Use of Urban Nature: Surveys of Park Visitors in Delhi. Land 2017, 6, 27. [Google Scholar] [CrossRef]
- Pereira, P.; Monkevičius, A.; Siarova, H. Public Perception of Environmental, Social and Economic Impacts of Urban Sprawl in Vilnius. Soc. Stud. 2014, 6, 259–290. [Google Scholar] [CrossRef] [Green Version]
- Haller, A. The “sowing of concrete”: Peri-urban smallholder perceptions of rural-urban land change in the Central Peruvian Andes. Land Use Policy 2014, 38, 239–247. [Google Scholar] [CrossRef] [PubMed]
- Shirazi, S.A.; Kazmi, J.H. Analysis of socio-environmental impacts of the loss of urban trees and vegetation in Lahore, Pakistan: A review of public perception. Ecol. Process. 2016, 5. [Google Scholar] [CrossRef]
- Brinkoff, T. The Principal Agglomerations of the World City Population. Available online: http/www.citypopulation.deindex.html (accessed on 3 August 2018).
- Jafari, M.; Majedi, H.; Monavari, S.M.; Alesheikh, A.A.; Zarkesh, M.K. Dynamic simulation of urban expansion through a CA-markov model case study: Hyrcanian region, Gilan, Iran. Eur. J. Remote Sens. 2016, 49, 513–529. [Google Scholar] [CrossRef]
- Weilenmann, B.; Seidl, I.; Schulz, T. The socio-economic determinants of urban sprawl between 1980 and 2010 in Switzerland. Landsc. Urban Plan. 2017, 157, 468–482. [Google Scholar] [CrossRef]
- Shaikh, H.; Ijaz, N. International Growth Center. 2017. Available online: https://www.theigc.org/blog/the-six-biggest-challe (accessed on 3 August 2018).
- Minallah, M.N.; Ghaffar, A.; Rafique, M.; Mohsin, M. Urban Growth and Socio-Economic Development in Gujranwala, Pakistan: A Geographical Analysis. Pak. J. Sci. 2016, 68, 176–183. [Google Scholar]
- Aslam, A.Q.; Ahmad, S.R.; Ahmad, I.; Hussain, Y.; Hussain, M.S. Vulnerability and impact assessment of extreme climatic event: A case study of southern Punjab, Pakistan. Sci. Total Environ. 2017, 580, 468–481. [Google Scholar] [CrossRef] [PubMed]
- Umair, S. Sindh, Punjab to Suffer the Most Amid Climate Change Consequences. Available online: https://www.pakistantoday.com.pk/2018/06/28/hyderabad-most-vulnerable-to-suffer-from-climate-change-impacts/ (accessed on 9 September 2018).
- Manzoor, S.A.; Jamil, A.; Ansari, A.N.; Siddique, S.; Javed, J.; Khan, Z.; Youaf, M.; Ijaz, M. How do we perceive climate change? Digging deep in to the public climate change awareness and beliefs in the urban community of Southern Punjab, Pakistan. Russ. J. Agric. Socio-Econ. Sci. 2016, 5, 149–159. [Google Scholar] [CrossRef]
- Pakistan Bureau of Statistics 6th Population & Housing Census-2017. 2018. Available online: http://www.pbscensus.gov.pk/ (accessed on 21 October 2018).
- Manzoor, S.A.; Griffiths, G.; Iizuka, K.; Lukac, M. Land Cover and Climate Change May Limit Invasiveness of Rhododendron ponticum in Wales. Front. Plant Sci. 2018. [Google Scholar] [CrossRef]
- Iizuka, K.; Johnson, B.A.; Onishi, A.; Magcale-Macandog, D.B.; Endo, I.; Bragais, M. Modeling Future Urban Sprawl and Landscape Change in the Laguna de Bay Area, Philippines. Land 2017, 6, 26. [Google Scholar] [CrossRef]
- Zizinga, A.; Kangalawe, R.; Ainslie, A.; Tenywa, M.; Majaliwa, J.; Saronga, N.; Amoako, E. Analysis of Farmer’s Choices for Climate Change Adaptation Practices in South-Western Uganda, 1980–2009. Climate 2017, 5, 89. [Google Scholar] [CrossRef]
- O’Herrin, K.; Day, S.D.; Wiseman, P.E.; Friedel, C.R.; Munsell, J.F. University student perceptions of urban forestry as a career path. Urban For. Urban Green. 2018, 34, 294–304. [Google Scholar] [CrossRef]
- Cronbach, L.J.; Meehl, P.E. Construct validity in Psychological test. Psychol. Bull. 1955, 52, 281–302. [Google Scholar] [CrossRef]
- Wong, L.P.; Alias, H.; Aghamohammadi, N.; Aghazadeh, S.; Nik Sulaiman, N.M. Urban heat island experience, control measures and health impact: A survey among working community in the city of Kuala Lumpur. Sustain. Cities Soc. 2017, 35, 660–668. [Google Scholar] [CrossRef]
- Park, S. A preliminary study on connectivity and perceived values of community green spaces. Sustainability 2017, 9, 692. [Google Scholar] [CrossRef]
- Yamane, T. Statistics, An Introductory Analysis, 2nd ed.; Harper and Row: New York, NY, USA, 1967. [Google Scholar]
- Solecki, W.; Seto, K.C.; Marcotullio, P.J. It’s time for an urbanization science. Environment 2013, 55, 12–16. [Google Scholar] [CrossRef]
- Hodson, M.; Marvin, S. Urbanism in the anthropocene: Ecological urbanism or premium ecological enclaves? City 2010, 14, 298–313. [Google Scholar] [CrossRef]
- Elmqvist, T.; Fragkias, M.; Goodness, J.; Güneralp, B.; Marcotullio, P.J.; McDonald, R.I.; Parnell, S.; Schewenius, M.; Sendstad, M.; Seto, K.C.; et al. Regional Assessment of Asia; Springer: Berlin, Germany, 2013; ISBN 9789400770881. [Google Scholar]
- Adaku, E. Urban Sprawl: A view from developing and developed Countries. Afr. J. Geogr. Reg. Plan. 2014, 1, 193–207. [Google Scholar]
- European Environment Agency. Urban Sprawl in Europe—The Ignored Challenge; European Environment Agency: Copenhagen, Denmark, 2006; Volume 10, ISBN 9781405139175.
- Zhou, D.; Zhang, Z.; Shi, M. Where is the future for a growing metropolis in North China under water resource constraints? Sustain. Sci. 2015, 10, 113–122. [Google Scholar] [CrossRef]
- Grimm, N.B.; Faeth, S.H.; Golubiewski, N.E.; Redman, C.L.; Wu, J.; Bai, X.; Briggs, J.M.; Grimm, N.B.; Faeth, S.H.; Golubiewski, N.E.; et al. Global Change and the Ecology of Cities Global Change and the Ecology of Cities. Science 2015, 319, 756–760. [Google Scholar] [CrossRef] [PubMed]
- Sung, C.Y.; Yi, Y.J.; Li, M.H. Impervious surface regulation and urban sprawl as its unintended consequence. Land Use Policy 2013, 32, 317–323. [Google Scholar] [CrossRef]
- Johnson, M.P. Environmental impacts of urban sprawl: A survey of the literature and proposed research agenda. Environ. Plan. A 2001, 33, 717–735. [Google Scholar] [CrossRef]
- SBSTTA. CBD Executive Secretary Ways and means to support ecosystem restoration. CBD SBSTA 15 2011, 17. [Google Scholar] [CrossRef]
- Butt, M.J.; Waqas, A.; Iqbal, M.F.; Muhammad, G.; Lodhi, M.A.K. Assessment of Urban Sprawl of Islamabad Metropolitan Area Using Multi-Sensor and Multi-Temporal Satellite Data. Arab. J. Sci. Eng. 2012, 37, 101–114. [Google Scholar] [CrossRef]
- Kopecká, M.; Nagendra, H.; Millington, A. Urban Land Systems: An Ecosystems Perspective. Land 2018, 7, 5. [Google Scholar] [CrossRef]
- Haase, D.; Frantzeskaki, N.; Elmqvist, T. Ecosystem services in urban landscapes: Practical applications and governance implications. Ambio 2014, 43, 407–412. [Google Scholar] [CrossRef] [PubMed]
- Maraja, R.; Barkmann, J.; Tscharntke, T. Perceptions of cultural ecosystem services from urban green. Ecosyst. Serv. 2016, 17, 33–39. [Google Scholar] [CrossRef]
- Lyytimäki, J.; Petersen, L.K.; Normander, B.; Bezák, P. Nature as a nuisance? Ecosystem services and disservices to urban lifestyle. Environ. Sci. 2008, 5, 161–172. [Google Scholar] [CrossRef] [Green Version]
- Rahman, S.M.A.; Tasmin, S.; Uddin, M.K.; Islam, M.T.; Sujauddin, M. Climate change awareness among the high school students: Case study from a climate vulnerable country. Int. J. Built Environ. Sustain. 2014, 1, 18–26. [Google Scholar] [CrossRef]
- Ajuang, C.O.; Abuom, P.O.; Bosire, E.K.; Dida, G.O.; Anyona, D.N. Determinants of climate change awareness level in upper Nyakach Division, Kisumu County, Kenya. Springerplus 2016, 5. [Google Scholar] [CrossRef]
- Gottschalk, T.K.; Aue, B.; Hotes, S.; Ekschmitt, K. Influence of grain size on species-habitat models. Ecol. Model. 2011, 222, 3403–3412. [Google Scholar] [CrossRef]
- Manzoor, S.A.; Griffiths, G.; Lukac, M. Species distribution model transferability and model grain size—Finer may not always be better. Sci. Rep. 2018, 1–9. [Google Scholar] [CrossRef]
- IUCN Pakistan’s Billion Tree Tsunami Restores 350,000 Hectares of Forests and Degraded Land to Surpass Bonn Challenge Commitment. Available online: https://www.iucn.org/news/forests/201708/pakistan’s-billion-tree-tsunami-restores-350000-hectares-forests-and-degraded-land-surpass-bonn-challenge-commitment (accessed on 15 November 2018).


| Construct Name | Description | Questions | Average Response | Average Constructs | SE | Cronbach’s Alpha |
|---|---|---|---|---|---|---|
| Perceived changes in ecosystem services | Whether the respondents believe there is a change in the provision of ecosystem services in Multan city | Air quality has decreased | 4.65 | 4.13 | 0.49 | 0.71 |
| Water pollution has increased | 4.4 | |||||
| Urban temperature has increased | 4.21 | |||||
| The number of green spaces has decreased | 4.09 | |||||
| Biodiversity has decreased | 3.85 | |||||
| Agricultural land has decreased | 4.13 | |||||
| Soil erosion has become more frequent | 3.6 | |||||
| Urban sprawl as a driver of changes in ecosystem services | Whether the respondents perceive urban sprawl as a causal agent for the changes in ecosystem services in Multan city | Air quality is affected by urban sprawl | 4.3 | 3.77 | 0.59 | 0.64 |
| Water quality is affected by urban sprawl | 4.35 | |||||
| Urban temperature is affected by urban sprawl | 3.51 | |||||
| No. of green spaces is affected by urban sprawl | 3.67 | |||||
| Biodiversity is affected by urban sprawl | 3.7 | |||||
| Agricultural land is affected by urban sprawl | 3.8 | |||||
| Urban sprawl drives soil erosion | 3.1 |
| Demographic Characteristics (n = 148) | Frequency | Percent | |
|---|---|---|---|
| Gender | Male | 137 | 57.8 |
| Female | 100 | 42.2 | |
| Age | Youth (18–35 years) | 156 | 65.8 |
| Mature (>35 years) | 81 | 34.2 | |
| Literacy | Illiterate | 83 | 35 |
| Literate | 154 | 65 | |
| Profession | Farming | 61 | 25.7 |
| Others | 176 | 74.3 | |
| Residential area | Urban | 152 | 64.1 |
| Peri-Urban | 85 | 35.9 | |
| Monthly Income | Low Income Class < $250 | 73 | 30.8 |
| High Income | 164 | 69.2 |
| Land Cover Class | 1992 | 2002 | 2015 | Change (%) | Change (%) | Change (ha) | Change (ha) |
|---|---|---|---|---|---|---|---|
| 1992–2002 | 2002–2015 | 1992–2002 | 2002–2015 | ||||
| Arable land | 1,123,652.20 | 1,121,903.70 | 1,103,968.40 | −0.16 | −1.6 | −1748.5 | −17935.3 |
| Vegetation cover | 12,845.40 | 12,438.60 | 11,529.70 | −3.2 | −7.4 | −406.8 | −908.9 |
| Urban area | 1800.4 | 3825.9 | 22,998.90 | 112.5 | 501.1 | 2025.5 | 19173 |
| Bare area | 7158.5 | 7054.6 | 6959.4 | −1.5 | −1.3 | −103.9 | −95.2 |
| Body of water | 4933.9 | 5167.6 | 4933.9 | 4.8 | −4.5 | 233.7 | −233.7 |
| Dependent Variables | Independent Variables | Unstandardized Regression Coefficient | Standardized Coefficient (Beta) | p-Value | R2 | |
|---|---|---|---|---|---|---|
| Model 1 | Perception about changes in ecosystem services in Multan | Gender | 0.032 | 0.31 | 0.627 | 14.5 |
| Age | 0.037 | 0.034 | 0.590 | |||
| Literacy | −0.234 | −0.22 | 0.001 * | |||
| Profession | 0.094 | 0.081 | 0.243 | |||
| Residential area | 0.132 | 0.124 | 0.058 | |||
| Income | −0.167 | −0.151 | 0.024 * | |||
| Model 2 | Perception about urban sprawl as a driver of change in the ecosystem services in Multan | Gender | −0.031 | −0.025 | 0.697 | 13.2 |
| Age | −0.020 | −0.015 | 0.807 | |||
| Literacy | −0.354 | −0.275 | 0.001 * | |||
| Profession | −0.178 | −0.126 | 0.064 | |||
| Residential area | 0.119 | 0.093 | 0.149 | |||
| Income | 0.05 | 0.04 | 0.539 |
© 2019 by the authors. Licensee MDPI, Basel, Switzerland. This article is an open access article distributed under the terms and conditions of the Creative Commons Attribution (CC BY) license (http://creativecommons.org/licenses/by/4.0/).
Share and Cite
Manzoor, S.A.; Malik, A.; Zubair, M.; Griffiths, G.; Lukac, M. Linking Social Perception and Provision of Ecosystem Services in a Sprawling Urban Landscape: A Case Study of Multan, Pakistan. Sustainability 2019, 11, 654. https://0-doi-org.brum.beds.ac.uk/10.3390/su11030654
Manzoor SA, Malik A, Zubair M, Griffiths G, Lukac M. Linking Social Perception and Provision of Ecosystem Services in a Sprawling Urban Landscape: A Case Study of Multan, Pakistan. Sustainability. 2019; 11(3):654. https://0-doi-org.brum.beds.ac.uk/10.3390/su11030654
Chicago/Turabian StyleManzoor, Syed Amir, Aisha Malik, Muhammad Zubair, Geoffrey Griffiths, and Martin Lukac. 2019. "Linking Social Perception and Provision of Ecosystem Services in a Sprawling Urban Landscape: A Case Study of Multan, Pakistan" Sustainability 11, no. 3: 654. https://0-doi-org.brum.beds.ac.uk/10.3390/su11030654