Water Bodies’ Cooling Effects on Urban Land Daytime Surface Temperature: Ecosystem Service Reducing Heat Island Effect


1
Suzhou Urban and Environment Research Institute, Xi’an Jiaotong-liverpool University, Suzhou 215200, Jiangsu, China
2
Department of Health and Environmental Sciences, Xi’an Jiaotong-liverpool University, Suzhou 215123, Jiangsu, China
3
Huai’an Research Institute of New-type Urbanization, Xi’an Jiaotong-liverpool University, Huai’an 223005, Jiangsu, China
*
Author to whom correspondence should be addressed.
Sustainability 2019, 11(3), 787; https://0-doi-org.brum.beds.ac.uk/10.3390/su11030787
Submission received: 20 December 2018
/
Revised: 26 January 2019
/
Accepted: 31 January 2019
/
Published: 2 February 2019
(This article belongs to the Special Issue Urban Remote Sensing: Sustainability of Earth’s Environment, Resources and Ecology)
Abstract
:The urban heat island (UHI) effect caused by urbanization is a major environmental concern. Utilizing cooling effects of water bodies as one type of ecosystem service is an important way to mitigate UHI in urban areas during the daytime. This study aims to examine the influence of water bodies’ cooling effects on the urban land surface temperature (LST). The potential influence on the relationship between urban land cover and the LST are also discussed. The daytime LST in April was retrieved from Landsat-8 thermal infrared band and the grid-based method was adopted to analyze the potential influence. The results indicated that Suzhou Bay is broadly capable of lowering daytime temperatures. The cooling distance can reach 800 m in horizontal space, and the maximum cooling effect was 3.02 °C. Furthermore, the distance to the Suzhou Bay is a great factor for the relationship between land cover and the LST. We found that the cooling effects have weakened the correct quantitative correlation between land cover (e.g., green space and impervious surface) and the LST, particularly green space in the range of 200 m. In addition, the cooling effects have strengthened the “cool edge” phenomenon when analyzing the relationship between the normal difference vegetation index (NDVI) and the LST. We suggest that the distance to the water bodies should be effectively utilized in the microclimate regulation provided by ecosystem services of water bodies. When investigating the thermal effects of urban land, urban planners and designers should consider water bodies’ effects on surrounding areas. These findings have implications for understanding the role of water bodies with ecosystem services of temperature mitigation, which must be fully appreciated for sustainable urban and landscape planning.
1. Introduction
In recent years, anthropogenic impacts caused by rapid urbanization and climate change have profoundly influenced biodiversity and ecosystem functioning. Urban heat island (UHI) effects are among such anthropogenic disturbances to influence urban communities [1]. The UHI is one of the major environmental problems in the world [1,2,3], as well as in China [4,5,6]. Land use, water bodies, urban structures and location have important influences on the urban land surface temperature (LST) [7,8,9,10,11]. Previous studies indicated the composition and configuration of land cover (e.g., green space, impervious surface and water bodies) can greatly impact the LST [12,13,14,15,16]. Among them, green space was considered as an effective way to reduce the UHI through shading, evaporative cooling, and air exchange. The increased coverage of green space [17,18,19], the aggregated patterns and patch sizes [20,21,22,23], and edge characteristics [24,25] have stronger cooling effects for mitigating UHI.
Water bodies (e.g., oceans, lakes, rivers and streams) are an important factor for temperature mitigation during the daytime, though water bodies may provide a warming effect during the nighttime [26,27,28]. As water bodies have a greater specific heat capacity compared to other physical objects, its warming-up rate is slower than other materials, resulting in the cool island effects during the daytime [29]. This cool island effect can potentially reduce UHI in urban areas, particularly those with a larger surface water area [30,31]. Saaroni and Ziv [32] revealed that even small water bodies (the scale of 100 m) can reduce heat stress during the daytime. Kim et al. [33] found that the stream has changed sensible heat flux and mitigated the temperature in Seoul, Korea. Völker et al. [34] revealed that the average cooling for water bodies compared to urban reference sites was 2.5 °C through a systematic literature review. However, the urban form (e.g., land cover, architectural form, surface roughness and terrain height) of surrounding water bodies can affect the cooling effects [35,36]. Murakawa et al. [37] found the horizontal influences of the Ota River on the microclimate can reach at least a few hundred meters. Hathway and Sharples [35] found that the cooling effects of a river (22 m wide) can reach to 30 m from the river bank in Sheffield.
Studies on the urban thermal environment are performed using different research methods. Deriving data empirically from on-site measurements is conducted using calibrated thermometers either at fixed stations or with mobile devices. On-site measurement of data needs standardized measurement procedures at the various locations. Thermal infrared remote sensing technology can make up for the spatial restrictions of on-site measurement data, making fast and efficient visual spatial patterns possible. Many scholars have applied remote sensing data in LST retrieval and examination of the influence of water bodies on the LST. Previous studies showed that the water bodies’ cooling effects are influenced by the size, shape and location [36,38,39]. Sun et al. [40] and Hou et al. [41] found that the shape and location could significantly affect the cooling effects of wetlands in urban regions. Du et al. [39] found the cooling effects of rivers are significantly less than those of lakes in Shanghai, and the average horizontal distance of the cooling effects was 0.74 km. Cai et al. [36] indicated that water bodies’ cooling effects have an obvious influence on the relationship between the LST and urban form factors (e.g., sky view factor and mean building height) in Chongqing, China.
Many studies have examined the cooling effects of water bodies on the LST. However, previous studies paid little attention to the propagation of cooling effects from water bodies to surrounding areas. Furthermore, few scholars test the cooling effects on the relationship between land cover and the LST, particularly in those cities with a large surface water area. Our study was carried out in Suzhou, a rapidly urbanizing city with a large surface water area. Understanding the influence of water bodies with the ecosystem service of temperature mitigation on the urban thermal environment is therefore of great importance for many other cities in China and around the world [42,43]. The aims of this study are as follows: (1) assess water bodies’ cooling effects on the LST in Suzhou Bay during the daytime, and reveal how far the maximum cooling distance can reach the surrounding area; and (2) test whether the cooling effects influence the relationship between land cover and the LST as the distance from water bodies increases. The objective of this study is to provide implications for microclimate regulation through ecosystem services of water bodies, achieving more ecological environments with sustainable urban and landscape planning.
2. Materials and Methods
2.1. Study Area
Suzhou is located in south-eastern Jiangsu Province in China (119°55′-121°20′E, 30°47′-32°02′N). Its urban land area is 4652.84 km2, and the water area (including rivers, lakes and shallows) accounts for 36.6% of its total territory. By the end of 2017, there were 5.51 million residents in its built-up area (473.33 km2). Suzhou has experienced rapid urbanization and significant UHI effects since 2000 [16,44,45]. Our study focuses on the area between Wuzhong District and Wujiang District, which has been defined as a vacation-oriented resort in Suzhou (Figure 1). It is necessary to investigate the thermal environment and improve the living environments in this area. In order to investigate the cooling effects of a large water body, we selected Suzhou Bay as a typical water body for the following analysis. The study area is about 72.11 km2, with Suzhou Bay accounting for 32.34% of the study area.
2.2. Data
One cloud-free Landsat-8 image which covered the study area (Row/Path: 038/119) was acquired at 10:30 a.m. (time in China), April 28, 2018 from USGS Earth Resources Observation and Science (EROS) Center. The digital surface model (DSM) was obtained from the Advanced Land Observing Satellite Global Digital Surface Model (AW3D30), provided by Japan Aerospace Exploration Agency. The land impervious surface map (30 m) and building cover data were obtained from the China GEOSS Data Sharing Network (Source: http://www.chinageoss.org/en/index.html) and Baidu Map (1:500), respectively.
2.3. Materials and Methods
2.3.1. LST Retrieval
The LST map was retrieved from Landsat-8 thermal infrared band. The effective at-satellite temperature was converted by the at-sensor radiance, at-sensor brightness temperature and the radiance of a blackbody target of kinetic temperatures [46,47]. The LST was expressed in equation as follows:
where T is the effective at-satellite temperature in Kelvin; K1 and K2 are the calibration constants (K1 = 774.89 W·m−2·sr−1·μm−1, K2 = 1321.08 K), respectively; LT is the radiance of a blackbody target in W·m−2·sr−1·μm−1.
where Lλ is the at-sensor radiance in W·m−2·sr−1·μm−1; L↑and L↓are the upwelling and downwelling atmospheric radiance in W·m−2·sr−1·μm−1, respectively; τ and ε are the total atmospheric transmissivity and the land surface emissivity, respectively.
2.3.2. Urban Land Cover
Coverage of the impervious surface (IS), vegetation fractional coverage (VFC), digital surface model (DSM) and building density (BD) were selected as the main analysis factors. The reflectance values of near-infrared band (B5) and red band (B4) were used to calculate the normal difference vegetation index (NDVI). The VFC was expressed in equation form as follows:
where NDVIsoil and NDVIveg are the NDVI values in the bare soil area and fully covered vegetation areas, respectively. The VFC measures the coverage of vegetation, and the VFC equals zero when the cell is bare soil. The VFC equals one when the cell is vegetation fully covered.
2.3.3. Grid-Based Method
In order to assess the potential maximum cooling distance of water bodies in the surrounding area, the spatial variation of the LST along an axis going from the edge of water bodies to the surrounding area has been given. We set a grid size of 200 m as the analysis scale [31,36] and a total of 1236 polygon grids were created to clip IS, VFC, DSM, BD and LST. In order to test whether the cooling effects influence the relationships between each factor and the LST as the distance from water bodies increases, we gradually removed the polygon grids depending on the distance from the Suzhou Bay, and the remaining polygon grids were used to analyze the relationships between each factor and the LST.
2.3.4. Statistical Analysis
The relationships between each factor and the LST were investigated by Pearson correlation analysis, linear and curve fitting. The correlation coefficients and t-statistics were used to compare the differences on each distance gradient.
3. Results
3.1. The Maximum Cooling Distance and the Correlation with the LST
The LST changed along the distance from the edge of Suzhou Bay to the surrounding area (Figure 2a). We found a significant positive correlation between the distances and mean LST, particularly when the distance was less than 800 m. Figure 2b shows that the correlation coefficient decreased as the distance increased when the polygon grids near the Suzhou Bay were gradually removed. Notably, the correlation coefficient was stable after the distance reached 800 m. This indicated that the surrounding area near water bodies had been affected by its cooling effects. In order to calculate the maximum cooling distance of Suzhou Bay, we tried to identify the inflection point of the fitting curves in Figure 2a. The results showed that the maximum cooling distance was 752 m, and the maximum cooling effect was 3.02 °C. Based on the spatial overlaying analysis, we can deduce that about 35.88% of the study area may be affected by the cooling effects of Suzhou Bay.
3.2. The Cooling Effects on the Correlations between Land Factors and the LST
The scatter plots between each factor and the mean LST at different distance gradients are shown in Figure 3. After gradually removing the influenced polygon grids, some linear fittings were observed between each factor (e.g., IS and VFC) and the LST. We found the polygon grids near the Suzhou Bay had low LST values, meaning the water bodies had an impact on surrounding area and affected the relationship between land cover and the LST.
We found significantly negative correlations between VFC and the mean LST. Similarly, a relatively weak correlation was observed without considering the water bodies’ cooling effects. The correlation coefficient was –0.416 (p < 0.01) when using all polygon grids. After removing polygon grids for distances less than 200 m, the correlation coefficient immediately increased (R = −0.514). When the polygon grids for distances less than 600 m were removed, the correlation coefficient rose to the maximum (R = −0.526).
Although there were significantly positive correlations between the IS coverage and mean LST, the correlation coefficient shows the differences when the polygon grids near the Suzhou Bay were gradually removed. A relatively weak correlation was observed without considering the water bodies’ cooling effects. The correlation coefficient was 0.616 (p < 0.01) when we used all polygon grids. However, the correlation coefficient rose to 0.635 (p < 0.01) when the polygon grids for distances less than 200 m were removed.
The difference of correlation coefficients between VFC and mean LST was 0.098 in the range of 200 m from the Suzhou Bay, which is much greater than the difference of correlation coefficients between IS coverage and the mean LST. Compared with the IS coverage, the VFC was more susceptible to the cooling effects of Suzhou Bay, particularly in the range of 200 m. Another important finding from the relationship between NDVI and the LST also supports this phenomenon. As a commonly used index to identify the green space, NDVI can be used as an important indicator of the LST. Figure 4a shows a weak negative correlation between NDVI and mean LST when using all polygon grids. After excluding the polygon grids where distances were less than 200 m to Suzhou Bay, the R squared value was considerably greater than in Figure 4a. In addition, the “temperature edge” phenomenon was clearly displayed in Figure 4a. The warm edge shows the expected relationship between NDVI and the mean LST, indicative of the cooling effects of green space. Remarkably, the polygon grids with the same NDVI values were cooler compared to those near the warm edge. The LST was positively correlated with the DSM. Lots of polygon grids surrounding water bodies (polygon grids on the lower-left of Figure 4a) had low mean LST and DSM, indicating that lower DSM areas were easily affected by the cooling effects.
Correlations between each factor and the mean LST are shown in Table 1. The absolute values of correlation coefficients (e.g., IS and VFC) increased first and then stabilized as the distance increased. Specifically, the correlation between IS coverage and the mean LST reached the maximum when the distance was more than 200 m. This suggests that the distance to the water bodies has weakened the correct correlation between IS coverage and the mean LST. Similarly, the correlation between BD and the mean LST reached the maximum when the distance was more than 200 m. This phenomenon also occurred in the correlation between VFC and mean LST in the range of 600 m. The correlation coefficients between DSM and the LST changed little with the increase of the distance.
Overall, the distance to the water bodies is a great factor for the relationship between urban land cover and the LST, and the cooling effects have changed the correct quantitative relationship between land cover and the LST, particularly green space in the range of 200 m.
4. Discussion
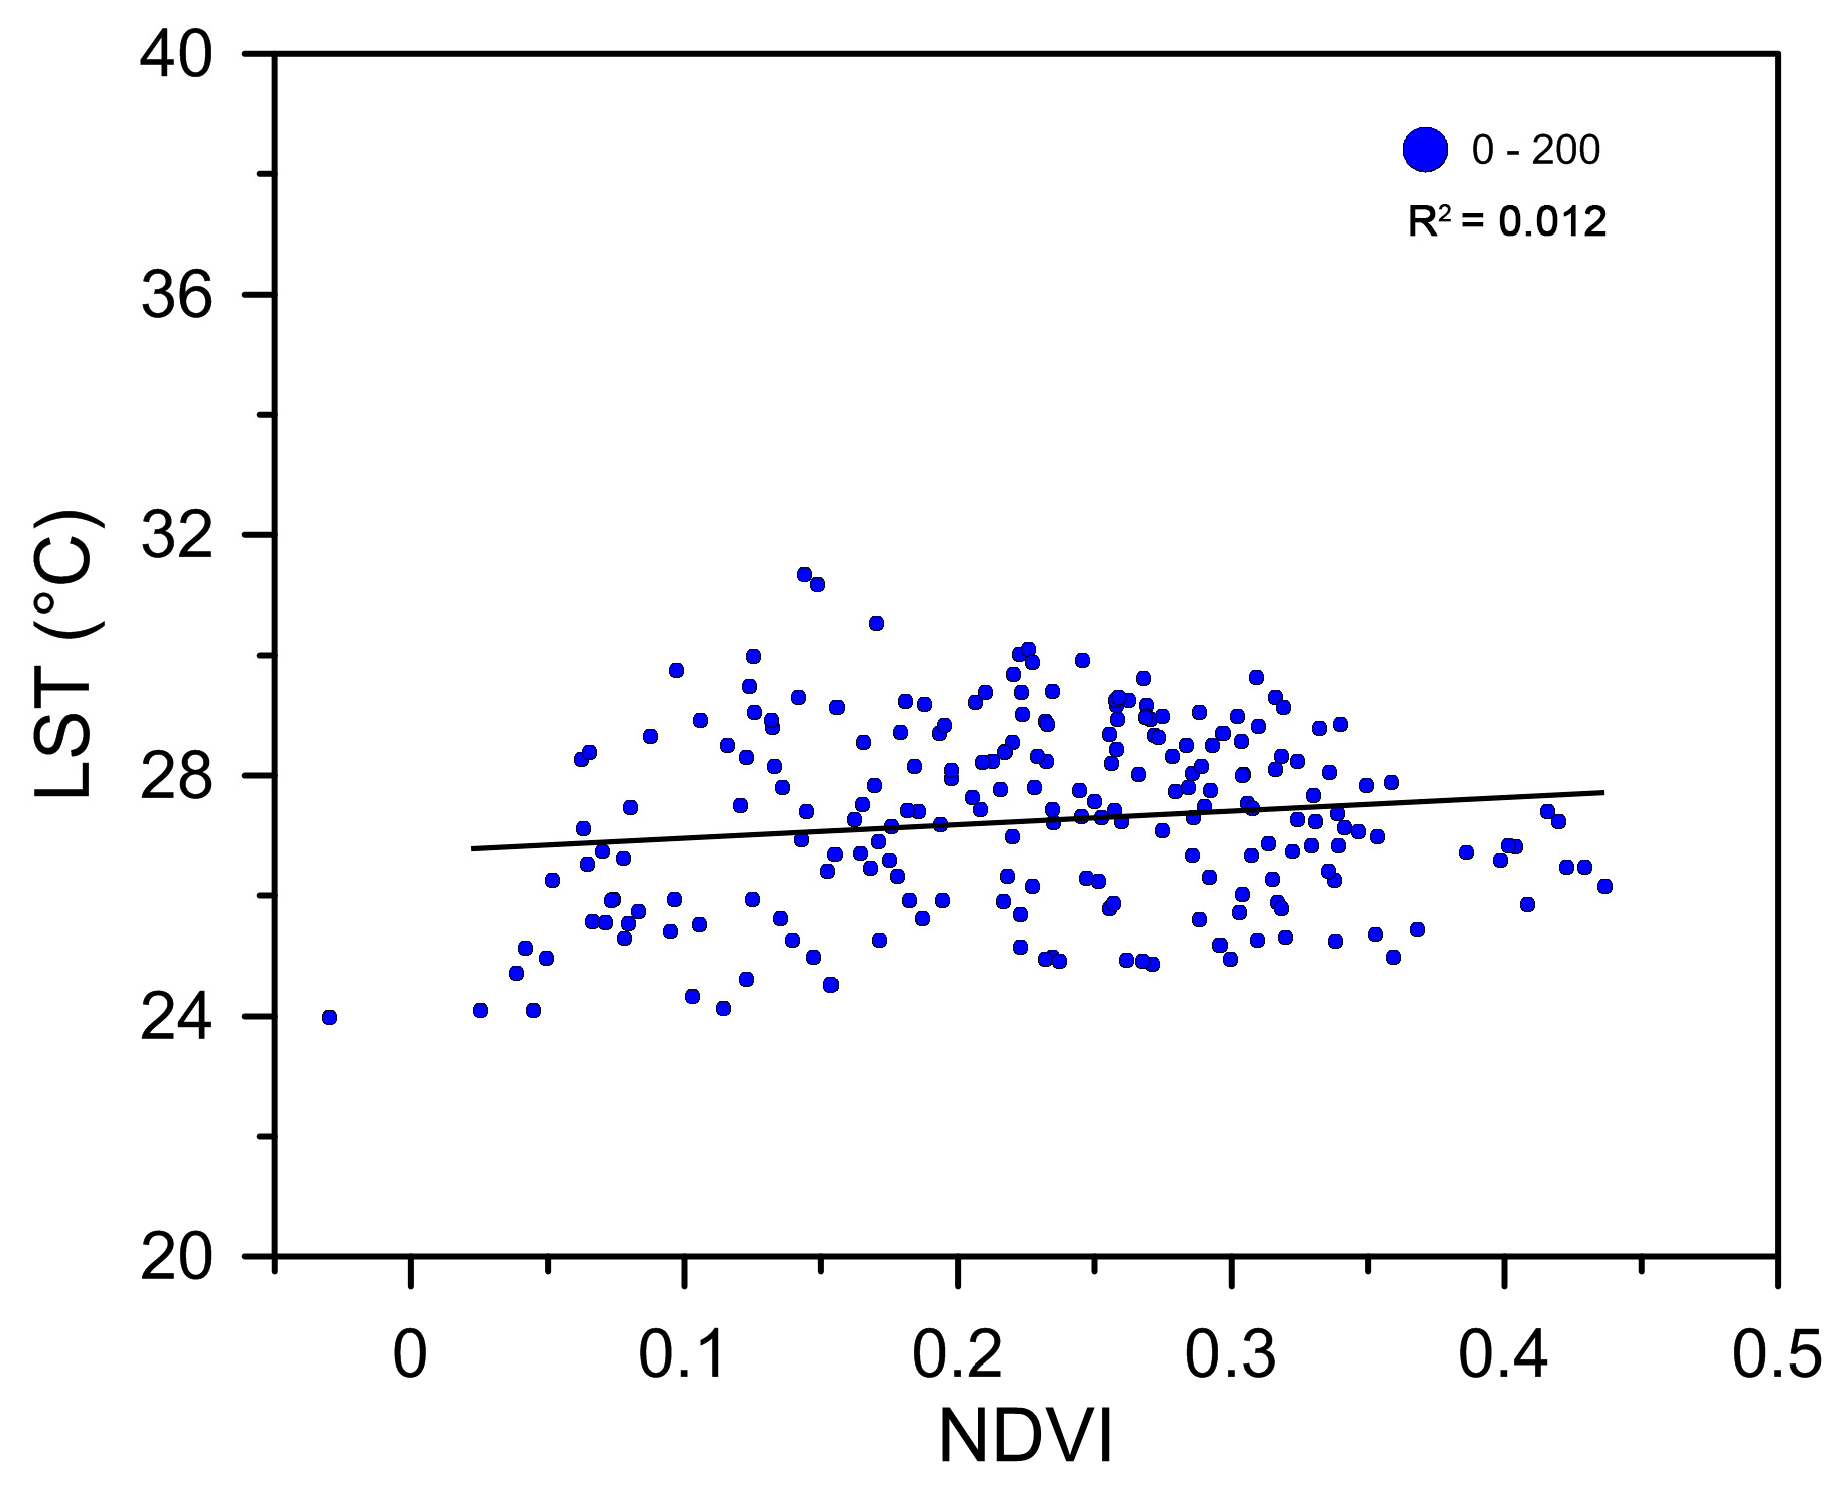
Our study demonstrated that Suzhou Bay is broadly capable of lowering daytime temperatures. Notably, the distance to water bodies has a great influence on the LST, particularly in cities with a larger surface water area. Specifically, the cooling effects have weakened the correct quantitative relationship between land cover (e.g., green space and impervious surface) and the LST in urban areas. In addition, the cooling effects can also influence the relationship between BD and LST. The BD was slightly negatively correlated with the mean LST, and the R squared values only ranged from 0.006 to 0.045. We found that the negative correlation gradually disappeared as the distances increased from the water bodies. Similar results were found by Cai et al. [36]. The cooling effects have a great impact on the relationship between NDVI and the LST. We found the polygon grids with distances less than 200 m to Suzhou Bay were slightly positive correlated with mean LST (Figure 5), rather than the correct negative correlation between NDVI and mean LST. Similar results were obtained by previous studies [48,49,50]. Chen and Zhang [51] also revealed that a combination of Modified Normalized Difference Water Index and NDVI was the best indicator of the LST.
A “temperature edge” phenomenon has been shown by previous studies when analyzing the relationship between NDVI and the LST [48,52,53,54]. In our study, we also found the “cool edge” and “warm edge” were clearly displayed in the scatter plot of NDVI and the mean LST. We found that most of the NDVI values near the cool edge were the polygon grids affected by the cooling effects of water bodies. When we removed these polygon grids (distance <200m), the range of values was considerably smaller than in Figure 4a. This suggests that water bodies’ cooling effects have strengthened this “cool edge” phenomenon. This phenomenon requires us adopt a new method to correctly distinguish the cooling potential of green space due to evapotranspiration, as well as the cooling effects of water bodies [55].
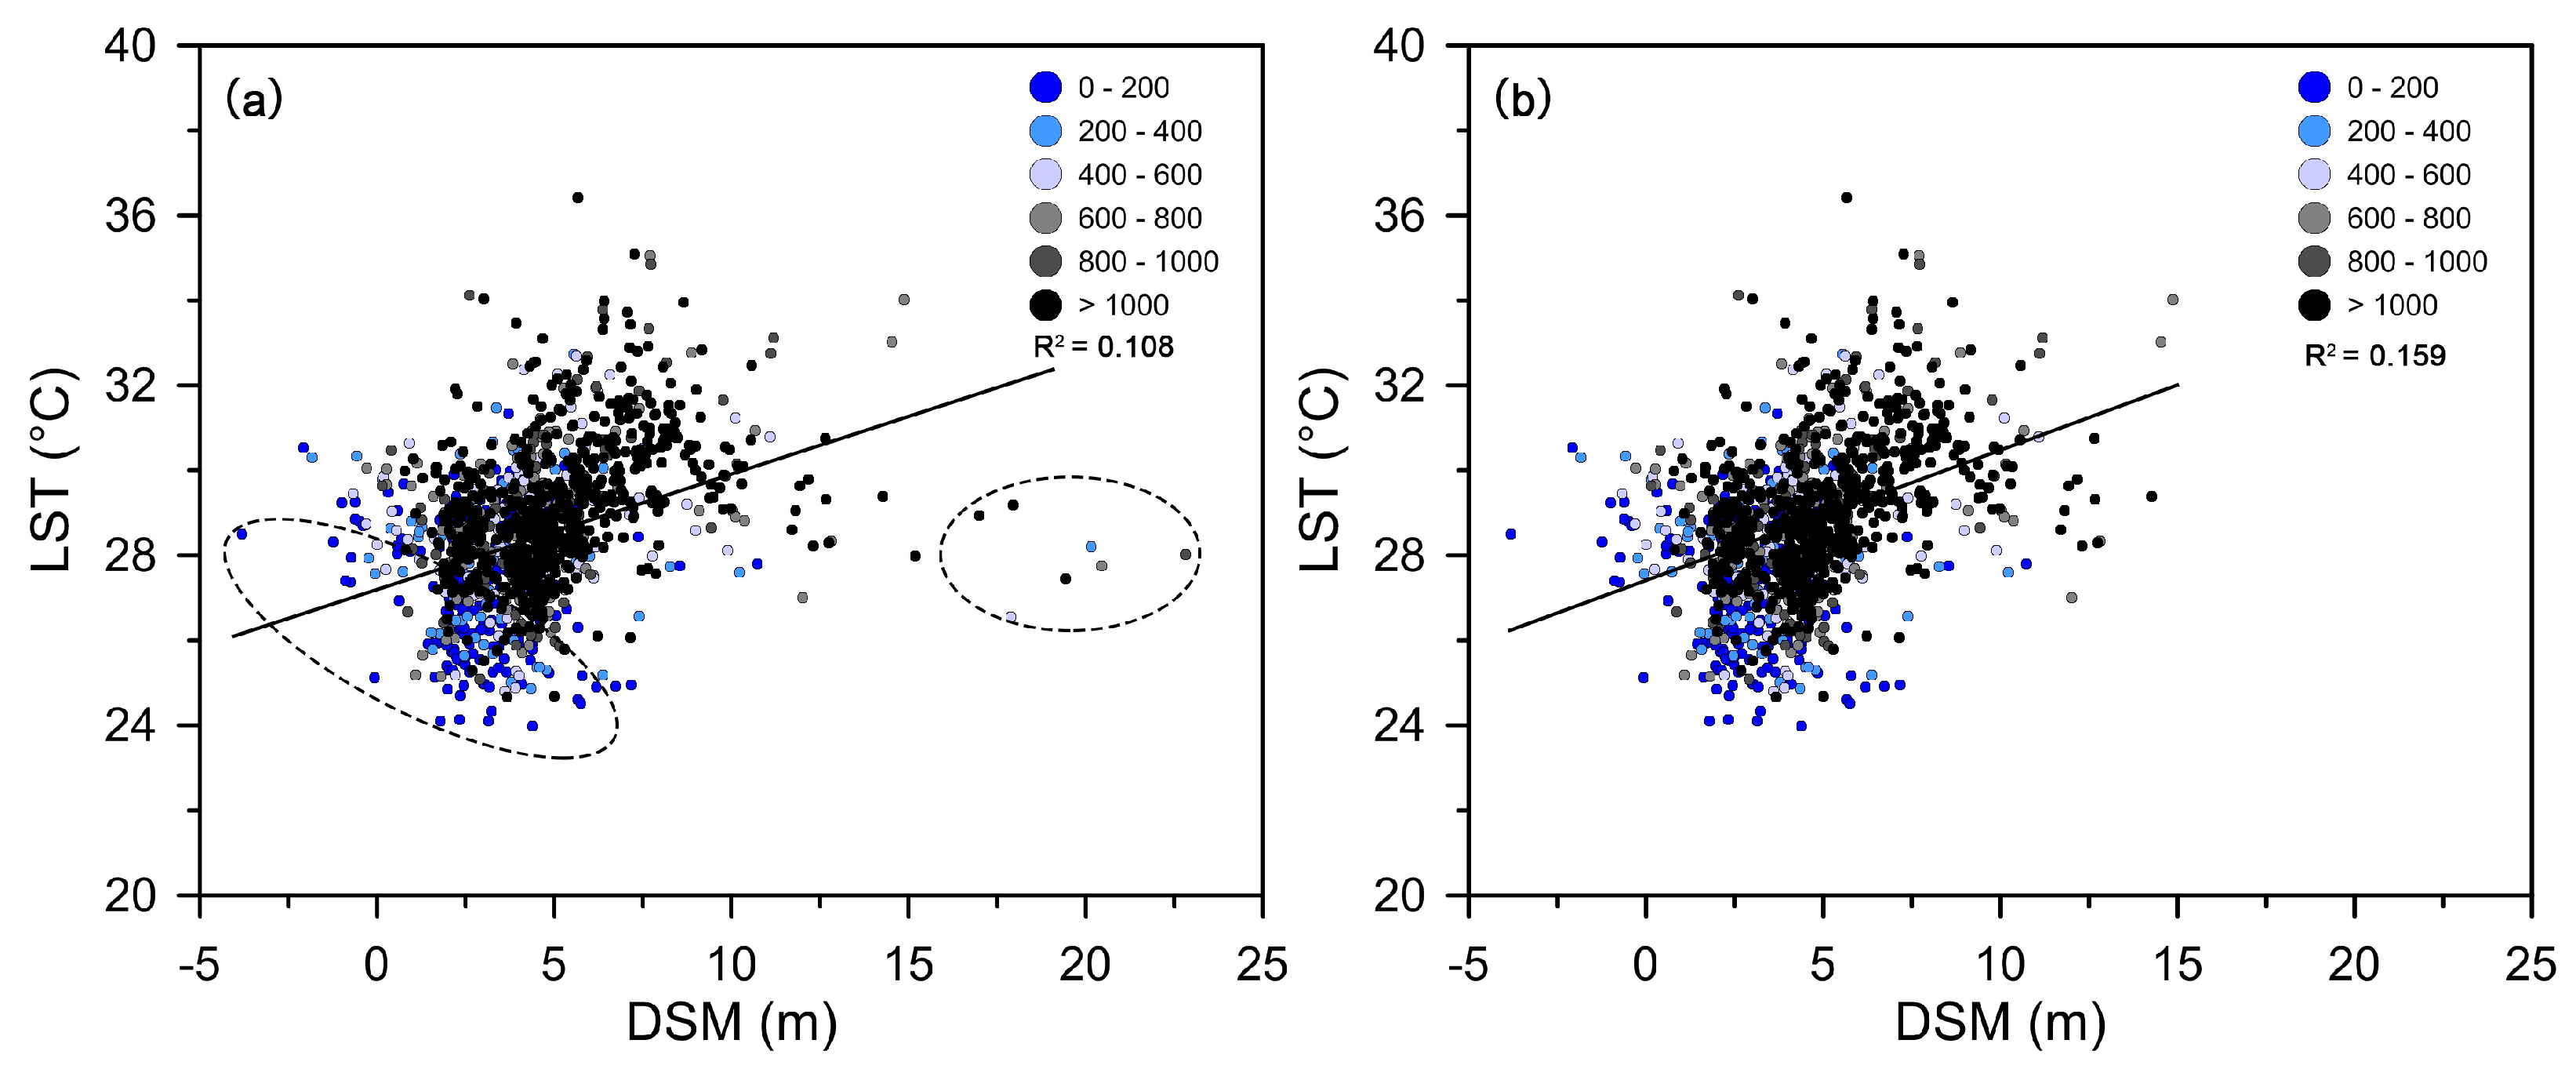
The solar radiation can be greatly blocked by large amounts of shadows, which can be provided by high buildings, resulting in a lower LST [56,57]. In our study, the LST was positively correlated with the DSM (Figure 6), which is not entirely consistent with the previous study [36]. This can be approached from two aspects, the first one being data sources. In most cases, the DSM represents the earth’s surface and includes all objects (e.g., buildings, bridges and trees) on it. Although the DSM can be used as a proxy for height, the high value area of DSM mainly reflects the distribution of the rooftop materials of buildings. It can be concluded from Figure 1b,c that the high value area of DSM basically corresponds with the high LST area. The rooftop materials of buildings in the study area lead to an extraordinary relationship between DSM and the LST. Similar findings were also reported by Guo et al. [58]. The second idea is the low-rise urban form in the study area. The mean height of most grids is less than 15 m, and large amounts of shadows cannot be provided in this area. In addition, the cooling effects provided by high-rise buildings will be weakened by the median-low resolution when calculating the mean value of the image cell. Consequently, we cannot find the negative correlation between DSM and mean LST in this area. When we removed the polygon grids with the relatively higher DSM values (samples on the right of Figure 6a), the R squared value between the mean LST and DSM increased. Based on this point we can still find the cooling effects caused by the shadows of high buildings.
5. Conclusions
The cooling effects of water bodies on the LST in Suzhou Bay area during the daytime were examined by using the Landsat-8 thermal infrared band. The potential influence of cooling effects on the relationship between the urban land surface temperature and land cover were discussed. Our study indicated that Suzhou Bay’s cooling effects decrease as the distance from the water bodies increases. The cooling effects are significant when horizontal distance is less than 800 m. Furthermore, the distance to Suzhou Bay is a great factor for the relationship between the land cover and the LST. We found that the cooling effects have weakened the correct relationship between land covers and the LST in urban areas near large water bodies. Compared with IS, the green space was more susceptible to the cooling effects of Suzhou Bay, particularly in the range of 200 m. We also found that the Suzhou Bay’s cooling effects have strengthened the “cool edge” phenomenon when analyzing the relationship between the LST and NDVI. This study suggests that large water bodies are broadly capable of lowering daytime temperatures, and the distance to the water bodies should be effectively utilized in microclimate regulation provided by water bodies in cities which have a larger surface water area. In addition, urban planners and designers need to fully appreciate the cooling effects on surrounding areas when investigating the thermal effects of the land cover during the daytime. With improving quantification of the spatial variations of water bodies’ cooling effects, these findings have implications for understanding the role of water bodies with ecosystem services of temperature mitigation, which must be fully appreciated for sustainable urban and landscape planning.
Author Contributions
Conceptualization, Y.Z.; Data curation, Z.W.; Formal analysis, Z.W.; Funding acquisition, Y.Z.; Methodology, Z.W.; Project administration, Z.W.; Supervision, Y.Z.; Writing—original draft, Z.W.; Writing—review & editing, Y.Z. All authors have read and approved the final manuscript.
Funding
This work was supported by XJTLU Research Development Fund (RDF-15-01-50), Jiangsu Science and Technology Program (BK20171238) and Huai’an Science and Technology Program (HAS201617).
Acknowledgments
The authors would like to thank Wenli Qin, Yunling He and Williamson Gustave for their technical support.
Conflicts of Interest
The authors declare no conflict of interest.
References
- Merckx, T.; Souffreau, C.; Kaiser, A.; Baardsen, L.F.; Backeljau, T.; Bonte, D.; Brans, K.I.; Cours, M.; Dahirel, M.; Debortoli, N.; et al. Body-size shifts in aquatic and terrestrial urban communities. Nature 2018, 558, 113–117. [Google Scholar] [CrossRef] [PubMed]
- Wong, K.V.; Paddon, A.; Jimenez, A. Review of world urban heat islands: Many linked to increased mortality. J. Energy Resour. Technol. 2013, 135, 22101–22112. [Google Scholar] [CrossRef]
- Gago, E.J.; Roldán, J.; Pacheco-Torres, R.; Ordóñez, J. The city and urban heat islands: A review of strategies to mitigate adverse effects. Renew. Sustain. Energ. Rev. 2013, 25, 749–758. [Google Scholar] [CrossRef]
- Li, J.; Song, C.; Cao, L.; Zhu, F.; Meng, X.; Wu, J. Impacts of landscape structure on surface urban heat islands: A case study of Shanghai, China. Remote Sens. Environ. 2011, 115, 3249–3263. [Google Scholar] [CrossRef]
- Sheng, L.; Tang, X.; You, H.; Gu, Q.; Hu, H. Comparison of the urban heat island intensity quantified by using air temperature and Landsat land surface temperature in Hangzhou, China. Ecol. Indic. 2017, 72, 738–746. [Google Scholar] [CrossRef]
- Peng, J.; Xie, P.; Liu, Y.; Ma, J. Urban thermal environment dynamics and associated landscape pattern factors: A case study in the Beijing metropolitan region. Remote Sens. Environ. 2016, 173, 145–155. [Google Scholar] [CrossRef]
- Oke, T.R. Review of Urban Climatology, 1968–1973; World Meteorological Organization Publication: Genève, Switzerland, 1974. [Google Scholar]
- Weng, Q.; Liu, H.; Lu, D. Assessing the effects of land use and land cover patterns on thermal conditions using landscape metrics in city of Indianapolis, United States. Urban Ecosyst. 2007, 10, 203–219. [Google Scholar] [CrossRef]
- Schwarz, N.; Manceur, A.M. Analyzing the Influence of Urban Forms on Surface Urban Heat Islands in Europe. J. Urban Plan. Dev. 2015, 141, A4014003. [Google Scholar] [CrossRef]
- Deilami, K.; Kamruzzaman, M.; Liu, Y. Urban heat island effect: A systematic review of spatio-temporal factors, data, methods, and mitigation measures. Int. J. Appl. Earth Obs. Geoinf. 2018, 67, 30–42. [Google Scholar] [CrossRef]
- Zhou, X.; Chen, H. Impact of urbanization-related land use land cover changes and urban morphology changes on the urban heat island phenomenon. Sci. Total Environ. 2018, 635, 1467–1476. [Google Scholar] [CrossRef]
- Oke, T.R.; Crowther, J.M.; McNaughton, K.G.; Monteith, J.L.; Gardiner, B. The micrometeorology of the urban forest. Philos. Trans. R. Soc. Lond. B 1989, 324, 335–349. [Google Scholar] [CrossRef]
- Xiao, R.; Ouyang, Z.; Zheng, H.; Li, W.; Schienke, E.W.; Wang, X. Spatial pattern of impervious surfaces and their impacts on land surface temperature in Beijing, China. J. Environ. Sci. 2007, 19, 250–256. [Google Scholar] [CrossRef]
- Bowler, D.E.; Buyung-Ali, L.; Knight, T.M.; Pullin, A.S. Urban greening to cool towns and cities: A systematic review of the empirical evidence. Landsc. Urban Plan. 2010, 97, 147–155. [Google Scholar] [CrossRef]
- Zheng, B.; Myint, S.W.; Fan, C. Spatial configuration of anthropogenic land cover impacts on urban warming. Landsc. Urban Plan. 2014, 130, 104–111. [Google Scholar] [CrossRef]
- Wu, Z.J.; Zhang, Y.X. Spatial variation of urban thermal environment and its relation to green space patterns: Implication to sustainable landscape planning. Sustainability 2018, 10, 2249. [Google Scholar] [CrossRef]
- Zhou, W.; Huang, G.; Cadenasso, M.L. Does spatial configuration matter? Understanding the effects of land cover pattern on land surface temperature in urban landscapes. Landsc. Urban Plan. 2011, 102, 54–63. [Google Scholar] [CrossRef]
- Li, X.; Zhou, W.; Ouyang, Z.; Xu, W.; Zheng, H. Spatial pattern of greenspace affects land surface temperature: Evidence from the heavily urbanized Beijing metropolitan area, China. Landsc. Ecol. 2012, 27, 887–898. [Google Scholar] [CrossRef]
- Kong, F.; Yin, H.; James, P.; Hutyra, L.R.; He, H.S. Effects of spatial pattern of greenspace on urban cooling in a large metropolitan area of eastern China. Landsc. Urban Plan. 2014, 128, 35–47. [Google Scholar] [CrossRef]
- Chen, X.; Su, Y.; Li, D.; Huang, G.; Chen, W.; Chen, S. Study on the cooling effects of urban parks on surrounding environments using Landsat TM data: A case study in Guangzhou, southern China. Int. J. Remote Sens. 2012, 33, 5889–5914. [Google Scholar] [CrossRef]
- Yu, Z.; Guo, X.; Jørgensen, G.; Vejre, H. How can urban green spaces be planned for climate adaptation in subtropical cities? Ecol. Indic. 2017, 82, 152–162. [Google Scholar] [CrossRef]
- Chen, Y.; Yu, S. Impacts of urban landscape patterns on urban thermal variations in Guangzhou, China. Int. J. Appl. Earth Obs. Geoinf. 2017, 54, 65–71. [Google Scholar] [CrossRef]
- Estoque, R.C.; Murayama, Y.; Myint, S.W. Effects of landscape composition and pattern on land surface temperature: An urban heat island study in the megacities of Southeast Asia. Sci. Total Environ. 2017, 577, 349–359. [Google Scholar] [CrossRef]
- Maimaitiyiming, M.; Ghulam, A.; Tiyip, T.; Pla, F.; Latorre-Carmona, P.; Halik, Ü.; Sawut, M.; Caetano, M. Effects of green space spatial pattern on land surface temperature: Implications for sustainable urban planning and climate change adaptation. ISPRS J. Photogramm. Remote Sens. 2014, 89, 59–66. [Google Scholar] [CrossRef] [Green Version]
- Shih, W. Greenspace patterns and the mitigation of land surface temperature in Taipei metropolis. Habitat Int. 2017, 60, 69–80. [Google Scholar] [CrossRef]
- Steeneveld, G.J.; Koopmans, S.; Heusinkveld, B.G.; Theeuwes, N.E. Refreshing the role of open water surfaces on mitigating the maximum urban heat island effect. Landsc. Urban Plan. 2014, 121, 92–96. [Google Scholar] [CrossRef]
- Gunawardena, K.R.; Wells, M.J.; Kershaw, T. Utilising green and bluespace to mitigate urban heat island intensity. Sci. Total Environ. 2017, 584–585, 1040–1055. [Google Scholar] [CrossRef]
- Moyer, A.N.; Hawkins, T.W. River effects on the heat island of a small urban area. Urban Clim. 2017, 21, 262–277. [Google Scholar] [CrossRef]
- Oke, T.R. Boundary layer climates. Earth Sci. Rev. 1987, 27, 265. [Google Scholar] [CrossRef]
- Syafii, N.I.; Ichinose, M.; Kumakura, E.; Jusuf, S.K.; Chigusa, K.; Wong, N.H. Thermal environment assessment around bodies of water in urban canyons: A scale model study. Sustain. Cities Soc. 2017, 34, 79–89. [Google Scholar] [CrossRef]
- Theeuwes, N.E.; Solcerová, A.; Steeneveld, G.J. Modeling the influence of open water surfaces on the summertime temperature and thermal comfort in the city. J. Geophys. Res. Atmos. 2013, 118, 8881–8896. [Google Scholar] [CrossRef] [Green Version]
- Saaroni, H.; Ziv, B. The impact of a small lake on heat stress in a Mediterranean urban park: The case of Tel Aviv, Israel. Int. J. Biometeorol. 2003, 47, 156–165. [Google Scholar] [CrossRef]
- Kim, Y.H.; Ryoo, S.B.; Baik, J.J.; Park, I.S.; Koo, H.J.; Nam, J.C. Does the restoration of an inner-city stream in Seoul affect local thermal environment? Theor. Appl. Climatol. 2008, 92, 239–248. [Google Scholar] [CrossRef]
- Völker, S.; Baumeister, H.; Claßen, T.; Hornberg, C.; Kistemann, T. Evidence for the temperature-mitigating capacity of urban blue space—A health geographic perspective. Erdkunde 2013, 67, 355–371. [Google Scholar] [CrossRef]
- Hathway, E.A.; Sharples, S. The interaction of rivers and urban form in mitigating the urban heat island effect: A UK case study. Build. Environ. 2012, 58, 14–22. [Google Scholar] [CrossRef]
- Cai, Z.; Han, G.; Chen, M. Do water bodies play an important role in the relationship between urban form and land surface temperature? Sustain. Cities Soc. 2018, 39, 487–498. [Google Scholar] [CrossRef]
- Murakawa, S.; Sekine, T.; Narita, K.I.; Nishina, D. Study of the effects of a river on the thermal environment in an urban area. Energy Build. 1991, 16, 993–1001. [Google Scholar] [CrossRef]
- Sun, R.; Chen, L. How can urban water bodies be designed for climate adaptation? Landsc. Urban Plan. 2012, 105, 27–33. [Google Scholar] [CrossRef]
- Du, H.; Song, X.; Jiang, H.; Kan, Z.; Wang, Z.; Cai, Y. Research on the cooling island effects of water body: A case study of Shanghai, China. Ecol. Indic. 2016, 67, 31–38. [Google Scholar] [CrossRef]
- Sun, R.; Chen, A.; Chen, L.; Lü, Y. Cooling effects of wetlands in an urban region: The case of beijing. Ecol. Indic. 2012, 20, 57–64. [Google Scholar] [CrossRef]
- Hou, P.; Chen, Y.; Qiao, W.; Cao, G.; Jiang, W.; Li, J. Near-surface air temperature retrieval from satellite images and influence by wetlands in urban region. Theor. Appl. Climatol. 2012, 111, 109–118. [Google Scholar] [CrossRef]
- Bolund, P.; Hunhammar, S. Ecosystem services in urban areas. Ecol Econ. 1999, 29, 293–301. [Google Scholar] [CrossRef]
- Brauman, K.A.; Daily, G.C.; Duarte, T.K.E.; Mooney, H.A. The nature and value of ecosystem services: An overview highlighting hydrologic services. Annu. Rev. Environ. Resour. 2007, 32, 67–98. [Google Scholar] [CrossRef]
- Xu, Y.; Qin, Z.; Zhu, Y. Spatial and temporal analysis of urban heat island in Suzhou city by remote sensing. Sci. Geogr. Sin. 2009, 29, 529–534. (In Chinese) [Google Scholar]
- Zhu, Y.; Zhu, L.; Xu, Y.; Ji, Y. Study on the urban heat island of Suzhou city based on landsat remote sensing data. Plateau Meteorol. 2010, 29, 244–250. (In Chinese) [Google Scholar]
- Jiménez-Muñoz, J.C.; Sobrino, J.A.; Skoković, D.; Mattar, C.; Cristóbal, J. Land surface temperature retrieval methods from Landsat-8 thermal infrared sensor data. IEEE Geosci. Remote Sens. Lett. 2014, 11, 1840–1843. [Google Scholar] [CrossRef]
- Yu, X.; Guo, X.; Wu, Z. Land surface temperature retrieval from Landsat 8 TIRS—Comparison between radiative transfer equation-based method, split window algorithm and single channel method. Remote Sens. 2014, 6, 9829–9852. [Google Scholar] [CrossRef]
- Zhang, X.; Estoque, R.C.; Murayama, Y. An urban heat island study in Nanchang City, China based on land surface temperature and social-ecological variables. Sustain. Cities Soc. 2017, 32, 557–568. [Google Scholar] [CrossRef]
- Xu, D.; Chen, R. Comparison of urban heat island and urban reflection in Nanjing City of China. Sustain. Cities Soc. 2017, 31, 26–36. [Google Scholar] [CrossRef]
- Guo, G.; Wu, Z.; Xiao, R.; Chen, Y.; Liu, X.; Zhang, X. Impacts of urban biophysical composition on land surface temperature in urban heat island clusters. Landsc. Urban Plan. 2015, 135, 1–10. [Google Scholar] [CrossRef]
- Chen, X.; Zhang, Y. Impacts of urban surface characteristics on spatiotemporal pattern of land surface temperature in Kunming of China. Sustain. Cities Soc. 2017, 32, 87–99. [Google Scholar] [CrossRef]
- Price, J.C. Using spatial context in satellite data to infer regional scale evapotranspiration. IEEE Trans. Geosci. Remote Sens. 1990, 28, 940–948. [Google Scholar] [CrossRef] [Green Version]
- Carlson, T.N.; Capehart, W.J.; Gillies, R.R. A new look at the simplified method for remote sensing of daily evapotranspiration. Remote Sens. Environ. 1995, 54, 161–167. [Google Scholar] [CrossRef]
- Gillies, R.; Kustas, W.; Humes, K. A verification of the ‘triangle’ method for obtaining surface soil water content and energy fluxes from remote measurements of the Normalized Difference Vegetation Index (NDVI) and surface e. Int. J. Remote Sens. 1997, 18, 3145–3166. [Google Scholar] [CrossRef]
- Coccolo, S.; Kämpf, J.; Mauree, D.; Scartezzini, J. Cooling potential of greening in the urban environment, a step further towards practice. Sustain. Cities Soc. 2018, 38, 543–559. [Google Scholar] [CrossRef]
- Ruffieux, D.; Wolfe, D.E.; Russell, C. The effect of building shadows on the vertical temperature structure of the lower atmosphere in downtown Denver. J. Appl. Meteorol. 1990, 29, 1221–1231. [Google Scholar] [CrossRef]
- Yang, X.; Li, Y. The impact of building density and building height heterogeneity on average urban albedo and street surface temperature. Build. Environ. 2015, 90, 146–156. [Google Scholar] [CrossRef]
- Guo, G.; Zhou, X.; Wu, Z.; Xiao, R.; Chen, Y. Characterizing the impact of urban morphology heterogeneity on land surface temperature in Guangzhou, China. Environ. Modell. Softw. 2016, 84, 427–439. [Google Scholar] [CrossRef]
Figure 1.
Location of the study area in China (a); distribution of the digital surface model (b), land surface temperature (c), impervious surface (d) and vegetation fractional coverage (e) in the study area.
Figure 1.
Location of the study area in China (a); distribution of the digital surface model (b), land surface temperature (c), impervious surface (d) and vegetation fractional coverage (e) in the study area.

Figure 2.
LST change along the distance from Suzhou Bay to the surrounding area (a) and correlations between mean LST and the distance (b).
Figure 2.
LST change along the distance from Suzhou Bay to the surrounding area (a) and correlations between mean LST and the distance (b).

Figure 3.
Scatter plots of mean LST and each factor (e.g., IS coverage, VFC, DSM and BD) in each distance gradient.
Figure 3.
Scatter plots of mean LST and each factor (e.g., IS coverage, VFC, DSM and BD) in each distance gradient.

Figure 4.
Relationship between NDVI and mean LST using full polygon grids (a); excluding polygon grids with distances less than 200 m from Suzhou Bay (b).
Figure 4.
Relationship between NDVI and mean LST using full polygon grids (a); excluding polygon grids with distances less than 200 m from Suzhou Bay (b).

Figure 5.
Scatter plots of NDVI and mean LST using polygon grids with distances less than 200 m to Suzhou Bay.
Figure 5.
Scatter plots of NDVI and mean LST using polygon grids with distances less than 200 m to Suzhou Bay.

Figure 6.
Relationship between the DSM and mean LST; using full polygon grids (a); excluding polygon grids whose DSM value was above 15 m (b).
Figure 6.
Relationship between the DSM and mean LST; using full polygon grids (a); excluding polygon grids whose DSM value was above 15 m (b).


Table 1.
Correlations between each factor and the mean LST.
| Distance (m) | LST (°C) | Correlations (R) | |||
|---|---|---|---|---|---|
| IS (%) | VFC | DSM (m) | BD (%) | ||
| >0 | 28.637 | 0.616 | −0.416 | 0.340 | −0.167 |
| >200 | 28.857 | 0.635 | −0.514 | 0.321 | −0.213 |
| >400 | 28.963 | 0.632 | −0.514 | 0.321 | −0.196 |
| >600 | 29.049 | 0.632 | −0.526 | 0.333 | −0.168 |
| >800 | 29.100 | 0.619 | −0.491 | 0.353 | −0.115 |
| >1000 | 29.134 | 0.617 | −0.491 | 0.361 | −0.077 |
© 2019 by the authors. Licensee MDPI, Basel, Switzerland. This article is an open access article distributed under the terms and conditions of the Creative Commons Attribution (CC BY) license (http://creativecommons.org/licenses/by/4.0/).
Share and Cite
MDPI and ACS Style
Wu, Z.; Zhang, Y. Water Bodies’ Cooling Effects on Urban Land Daytime Surface Temperature: Ecosystem Service Reducing Heat Island Effect. Sustainability 2019, 11, 787. https://0-doi-org.brum.beds.ac.uk/10.3390/su11030787
AMA Style
Wu Z, Zhang Y. Water Bodies’ Cooling Effects on Urban Land Daytime Surface Temperature: Ecosystem Service Reducing Heat Island Effect. Sustainability. 2019; 11(3):787. https://0-doi-org.brum.beds.ac.uk/10.3390/su11030787
Chicago/Turabian StyleWu, Zhijie, and Yixin Zhang. 2019. "Water Bodies’ Cooling Effects on Urban Land Daytime Surface Temperature: Ecosystem Service Reducing Heat Island Effect" Sustainability 11, no. 3: 787. https://0-doi-org.brum.beds.ac.uk/10.3390/su11030787
Note that from the first issue of 2016, this journal uses article numbers instead of page numbers. See further details here.