Article

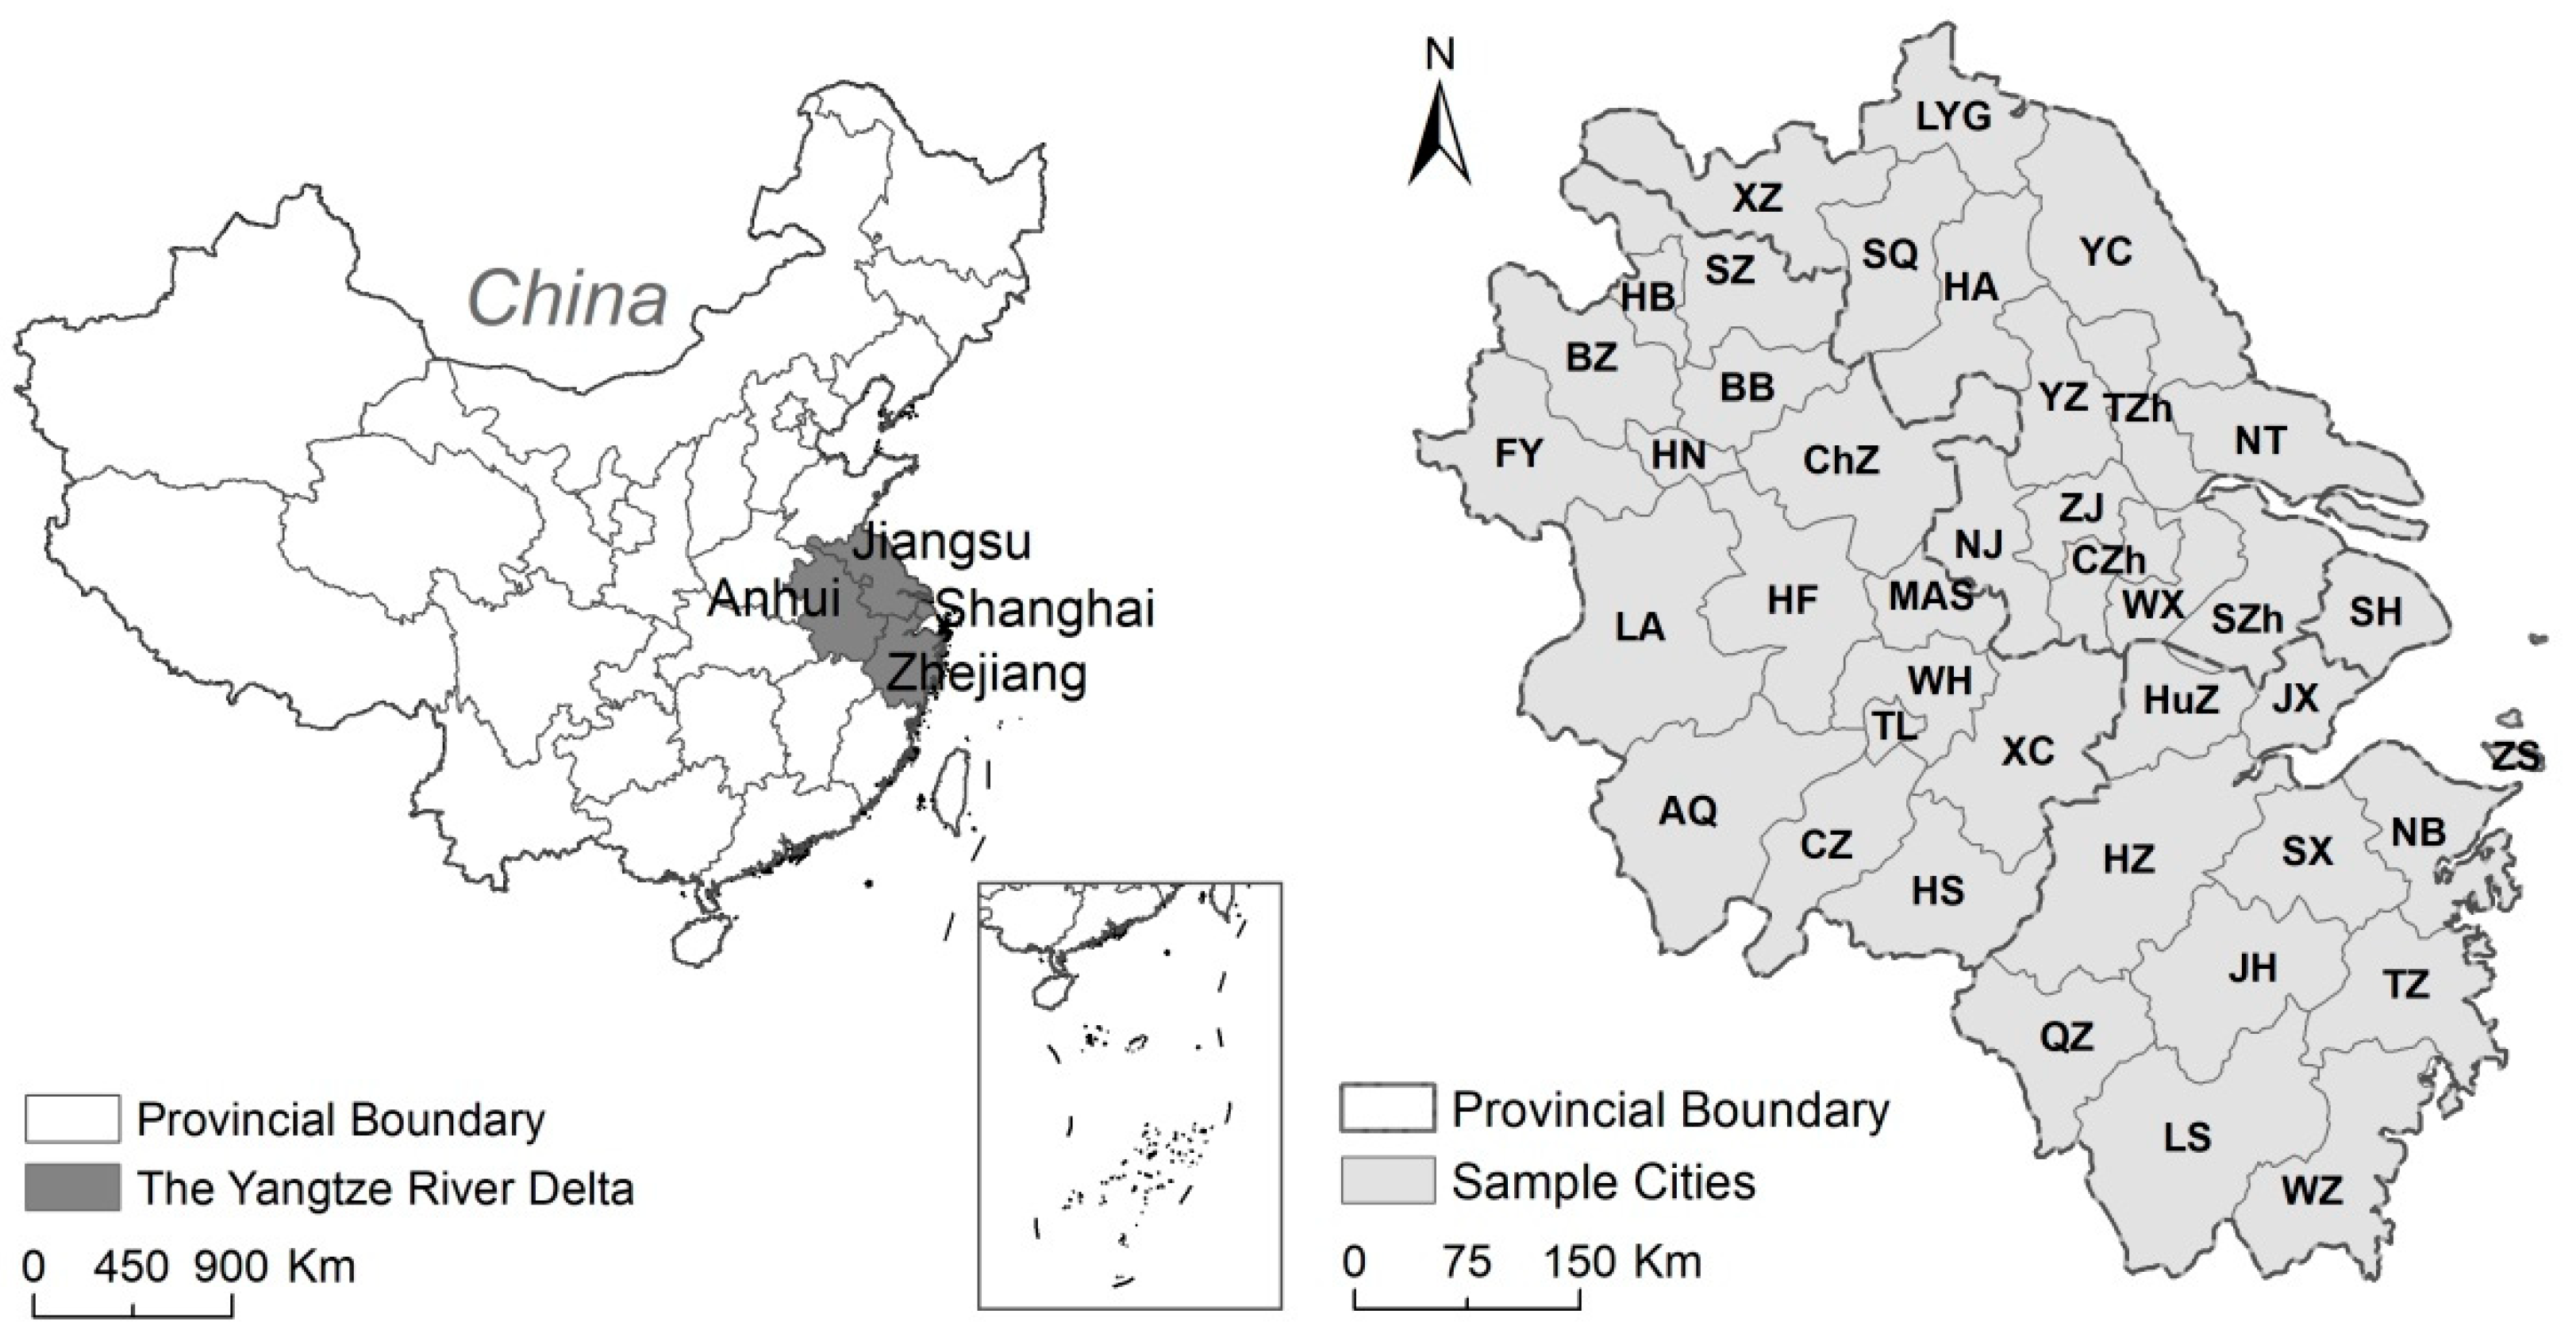
The Spatiotemporal Coupling Characteristics of Regional Urbanization and Its Influencing Factors: Taking the Yangtze River Delta as an Example

1
School of Geographic Science, Nanjing Normal University, Nanjing 210023, China
2
Jiangsu Center for Collaborative Innovation in Geographical Information Resource Development and Application, Nanjing 210023, China
*
Author to whom correspondence should be addressed.
Sustainability 2019, 11(3), 822; https://0-doi-org.brum.beds.ac.uk/10.3390/su11030822
Submission received: 2 January 2019 / Revised: 29 January 2019 / Accepted: 31 January 2019 / Published: 5 February 2019
(This article belongs to the Collection Sustainable Smart Cities and Villages)

Abstract

:
The research on the coupling coordination of regional urbanization is of great significance for achieving sustainable urbanization. Based on the theories of coordinated development, this paper constructs an index system for comprehensive evaluation of the three sub-systems of urbanization (population, economy and land urbanization). Then, the entropy method, coupling coordination degree model and spatial autocorrelation analysis are used to explore the spatiotemporal characteristics of overall and pairwise coordination among population, land and economy urbanization. Finally, the geographic detector model is used to analyze the influencing factors in the urbanization process. The results show that: (1) the levels of population, land and economy urbanization in the Yangtze River Delta have been improved from 2001 to 2016. The overall and pairwise coupling coordination degrees among them also continue to improve and the stage characteristics are presented. (2) The spatial distribution of low-level and high-level coupling coordination cities shows a certain spatial dependence and a Z-shaped pattern, respectively. The spatiotemporal characteristics of pairwise coupling coordination indicate regional imbalance of the urbanization. (3) The overall coupling coordination degree of urbanization has an apparent spatial autocorrelation, with its local spatial correlation patterns dominated by the High–High and Low–Low type agglomeration. Significant differences in local spatial correlation patterns of the pairwise coupling coordination suggest that regional synergy should not be neglected. (4) The economic development level is the main factor influencing the spatiotemporal differentiation of the coupling coordination of urbanization. Location traffic conditions and population agglomeration effect are the second most influencing factors. The evolution mechanisms of coupling coordination of urbanization are affected by factors in change. The findings highlight the importance of dealing with the relationship among population, land and economy in the process of regional urbanization and have implications for promoting the integration of urban agglomerations.

1. Introduction

Urbanization is a global process of economic and social evolution. With the acceleration of economic globalization, urbanization and urban systems are undergoing important transformation and reconstruction. As the urbanization of developed countries entered the mature stage, the focus of urbanization has already shifted from developed countries to developing countries [1]. By comparing the urbanization levels of six populous countries in Asia, Seto et al. (2010) found that China was undergoing urban transformation [2]. Since the reform and opening-up in 1978, which was known in the West as the opening of China and involved a series of programs of economic reforms, China has experienced the largest-scale and fastest urbanization process in the world. By 2016, China’s urbanization rate has increased to 59.02%, which was higher than the global urbanization rate of 54.5% [3]. However, China’s urbanization is still in a relatively low level with the particularity different from the synchronous urbanization in European and American and also from the over-urbanization in many other developing countries, which has caused widespread international concern.
Friedmann (2006) proposed that urbanization is a multi-dimensional complex process [4], including multiple sub-systems of population, land and economy urbanization. Scholars have studied various aspects of urbanization from different knowledge backgrounds. By comparing the characteristics of urbanization stages in different regions of Europe, Antrop (2004) found that urbanization has caused spatial polarization by changing population density, economic activity and mobility [5]. Taking the United States as an example, Alig et al. (2004) analyzed the current urbanization pattern and predicted the trend of urbanization [6]. Based on a meta-analysis of 326 studies, Seto et al. (2011) concluded that India, China and Africa have experienced the highest urbanization rates [7]. Yang et al. (2019) and Pan et al. (2018) reassessed urban spatial structure and land use patterns from the perspective of agglomeration economy and then predicted the location of Chicago’s future emerging commercial [8,9]. Through the development of spatial monopolistic competition model, Malykhin and Ushchev (2018) explored the formation mechanism of the spatial structure within one city [10]. Melo et al. (2009) figured out the range of values for agglomeration economies by reviewing the empirical literature on agglomeration [11]. In general, the speed and internal structure of urbanization in developed countries have been relatively stable and balanced, respectively. Current research mainly focused on the optimization of urban internal structure in counter-urbanization process, involving agglomeration economies [8,9,10,12], population re-urbanization [13] and suburbanization [14]. Although scholars have paid much attention to urbanization issues related to people’s well-being and the urbanization quality from the perspective of agglomeration economy within cities and urbanization efficiency among cities [1,8,9,11], urbanization is a regional problem involving multi-dimensions rather than a simple urban internal problem [4]. Therefore, this study could supplement the theoretical perspective of regional urbanization quality research to a certain extent by the application of coupling coordination theory in urban agglomerations.
Limited by the basic national conditions, the realistic problems of China’s urbanization are very complicated. In recent years, the phenomena of semi-urbanization such as the reduction of demographic dividend, the hollowing out of rural areas and the imbalance of economic development have emerged in endlessly [15,16,17]. Therefore, domestic scholars are more inclined to study the urbanization quality, involving new urbanization construction and sustainable urbanization [18,19,20]. According to the studies by Friedmann (2006) and Chen (2015), the high-level urbanization does not mean that there is a high-level coupling coordination among urbanization sub-systems, so whether these sub-systems are coordinated or not is the key to grasp the law of urbanization and achieve sustainable urbanization. In terms of this, the coupling coordination among urbanization sub-systems has always been the main part of the existing research literature, including the evaluation of coupling coordination level among urbanization sub-systems [21,22,23,24,25,26,27,28,29,30,31,32], the evolution characteristics of coordinated urbanization [22,23,24,25,27,28,29] and its dynamic mechanism [21,24,25,26,27]. However, there still exist some shortcomings. First, most of the existing studies focused on the coupling coordination between population and land urbanization [21,22,23,24,25] or population and economy urbanization [26,27,28,29]. There was relatively less relevant literature on the coupling coordination among the three dimensions of population, land and economy urbanization [30,31,32]. Second, the current studies emphasized spatial distribution characteristics of the coupling coordination among urbanization sub-systems, while the spatiotemporal interaction and evolution characteristics and their influencing factors still need to be further studied [22,23,24,27,28,29]. From the perspective of coupling coordination, analyzing the coordinated evolution of population, land and economy urbanization and its influencing factors, therefore, forms the core goal of this paper.
As the urbanized areas with high population density and developed economy, urban agglomerations have always been the focus and difficulty of sustainable urbanization research in the world and the Yangtze River Delta is no exception [33]. It is one of the six largest urban agglomerations in the world and the region with the highest urbanization level in China. Nowadays, the sustainable development of the Yangtze River Delta is facing greater challenges from the dual tasks of internal optimization and upgrading and enhancing international competitiveness. It should not only attach importance to the linkage and differential development among global urban agglomerations but also focus on the coordinated development within urban agglomeration [34]. Through comprehensive evaluation of urbanization efficiency and economic development level in the Yangtze River Delta, Sun et al. (2013) found that the coupling relationship between them showed an overall inverted U-shaped pattern [35]. Cao et al. (2011) made a comprehensive evaluation of the urbanization level of this region from population, economic structure and land use in urbanization process and highlighted the importance of coordinating relations among these three dimensions [36]. Under the background of economic globalization and regional integration, therefore, this paper takes 41 prefecture-level cities in Jiangsu Province, Zhejiang Province, Anhui Province and Shanghai as the research objects (Figure 1). Prefecture-level city is the second level of the administrative structure of China, ranking below a province and above a county. Based on the measurement of population, land and economy urbanization level, the coupling coordination degree model is used to evaluate the overall and pairwise coupling coordination among the three urbanization sub-systems from 2001 to 2016. Then, the spatial autocorrelation and geographical detector model are used to analyze the spatiotemporal evolution of coupling coordination and its influencing factors. We are committed to providing references for the construction of new-type urbanization, giving full play to the radiation effects of the core cities and achieving the healthy and sustainable urbanization in the Yangtze River Delta. This study highlighted the importance of dealing with the relationship among population, land and economy in the process of regional urbanization by deepening the understanding of their spatiotemporal interaction, it can provide reference for the urbanization in other countries or regions of the world.

2. Index System of Urbanization and Methods

2.1. Index System of Urbanization

Urbanization includes multiple sub-systems such as population, land and economy urbanization, among which population urbanization is the core, land urbanization is the carrier and economy urbanization is the driving force. Population urbanization refers to the transforming process of agricultural population to non-agricultural population, whose essence is the population and infrastructures are gradually concentrated to cities. It can be seen that population urbanization includes changes in population attributes, changes in the structure of population employment and concentration of urban public service facilities [21,22,31,37,38]. Land urbanization refers to the process of transforming agricultural land and rural construction land into urban construction land, including the increase of the scale of urban construction land and the adjustment of its internal structure [20,22,23,24,25,39]. Economy urbanization mainly refers to the improvement of economic aggregate and the transformation of economic structure. Industrialization is the direct driving force, while the rise and prosperity of the tertiary industry is the performance of urbanization [37,38,40,41]. The coordinated development of the three dimensions determines the direction and quality of regional urbanization [31,37].
Based on the principles of being scientific, comprehensive, representative and the availability of data, we select 14 indicators to build the evaluation index systems of population, land and economy urbanization for each city in the Yangtze River Delta according to the existing studies [21,22,23,24,25,37,42,43] (Table 1). A total of 9184 data collected in this study are mainly from the China Urban Statistical Yearbooks, the provincial statistical yearbooks of Jiangsu, Zhejiang, Anhui and Shanghai and the statistical yearbooks of each prefecture-level city from 2002 to 2017. In consideration of the continuity of the data, the data of Chaohu city before 2011 has been added to Hefei city according to the latest division of administrative units of prefecture-level cities [36].

2.2. Methods

2.2.1. The Entropy Method

The concept of information entropy originated from physics and was introduced by Shannon to measure the disorder degree of the system [20,22,32]. As an objective evaluation method, the entropy method can not only avoid the subjective judgment of researchers but also solve the problem of information overlaps among multiple indexes. Up to now, the entropy method has been widely used in many fields such as sustainable development evaluation and socio-economy research. Therefore, the entropy method is chosen to measure the level of population, land and economy urbanization of 41 prefecture-level cities in the Yangtze River Delta [22]. The specific calculation process can be divided into the following four steps:
(1) Set the normalized matrix X
X   =   ( x ij ) m × n   =   [ x 11 x 12 x 1 n x 21 x 21 x 2 n x m 1 x m 2 x m n ]
where xij is the normalized value of the jth indicator of the ith city; There are 41 prefecture-level cities in the Yangtze River Delta and 14 indicators for each city; therefore, m = 41, n = 14.
(2) Calculate the contribution fij of xij.
f i j = x i j / i = 1 m x i j
(3) Calculate the entropy value ej of the jth indicator.
e j = k i = 1 m f i j l n f i j ,   ( k = 1 / l n m )
(4) Calculate the weight Zj of the jth indicator.
Z j = ( 1 e j ) / j = 1 n ( 1 e j )
From the formula (4), we can see that the smaller the entropy value ej of the jth indicator, the larger the weight coefficient Zj of this indicator, indicating the greater the amount of information provided by the indicator to explain the research object [20,22].

2.2.2. The Coupling Coordination Degree Model

The coupling coordination degree model has obvious advantages in interpreting the relationship between two or more systems, which can more clearly describe the phenomenon that their influences with each other through interaction mechanisms and reflect the level of coordinated development among them. This model is very suitable for our research goal of explaining the interaction intensity and spatiotemporal evolution of coupling degrees among population, land and economy urbanization [20,42]. Therefore, based on the reference of the knowledge of coupling coordination in physics, the coupling degree model and the coupling coordination degree model among the three sub-systems of urbanization are built [31,37]. The temporal variation characteristics and coupling trends of the three sub-systems of urbanization in Yangtze River Delta are then quantitatively studied. The coupling degree model is defined as follows:
C = 3 u 1 u 2 u 3 3 / ( u 1 + u 2 + u 3 )
where u1, u2 and u3 represent population urbanization, land urbanization and economy urbanization, respectively; C is the coupling degree among the three urbanization sub-systems. For further exploration of the pairwise coupling relations among population, land and economy urbanization, the model (5) can be changed to the following forms [31,43]:
C 12 = 2 u 1 u 2 2 / ( u 1 + u 2 )   or   C 13 = 2 u 1 u 3 2 / ( u 1 + u 3 )   or   C 23 = 2 u 2 u 3 2 / ( u 2 + u 3 )
In order to better reflect the coordination relationships among the three sub-systems of urbanization, the coupling coordination degree model is built as follows [31,37,43]:
D = C × T , T = α u 1 + β u 2 + φ u 3
where D is the coupling coordination degree among population urbanization, land urbanization and economy urbanization; T is the comprehensive coordination index of the three urbanization sub-systems; The undetermined coefficients are characterized by α, β and φ. According to the relevant literature, we take α = β = 0.4, φ = 0.2. On the basis of the value of D, the coupling coordination degree D among population, land and economy urbanization can be divided into five stages: (1) when 0 ≤ D < 0.4, it is unsatisfactory coupling coordination (Type I); (2) when 0.4 ≤ D < 0.6, it is low-level coupling coordination (Type II); (3) when 0.6 ≤ D < 0.8, it is medium-level coupling coordination (Type III); when 0.8 ≤ D < 0.9, it is high-level coupling coordination (Type IV); and when 0.9 ≤ D < 1.0, it is satisfactory coupling coordination (Type V) [22,23,31].
In order to further describe the pairwise coupling coordination relationships among population, land and economy urbanization, the model (7) can be changed to the following forms:
D 12 = C 12 T 12   or   D 13 = C 13 T 13   or   D 23 = C 23 T 23
When T12 = αu1 + βu2, D12 is the coupling coordination degree between population urbanization and land urbanization; When T13 = αu1 + φu3, D13 is the coupling coordination degree between population urbanization and economy urbanization; and when T23 = βu2 + φu3, D23 is the coupling coordination degree between land urbanization and economy urbanization. The coefficients α and φ are both set to be 0.5 when calculating D13; When calculating D12 and D23, the coefficient α, β and φ are set to be 0.6, 0.4 and 0.6, respectively [31,36].

2.2.3. Spatial Autocorrelation Analysis

Spatial autocorrelation includes global spatial autocorrelation and local spatial autocorrelation. Global spatial autocorrelation is mainly used to analyze the spatial correlation feature of one geographic element in the whole region, which is usually measured by Global Moran’s I. Local spatial autocorrelation is mainly used to measure the local spatial correlation feature of one geographic element, which is usually measured by Local Moran’s I [44,45]. The formula of global Moran’s I is as follows:
I = i = 1 n j = 1 n w i j ( x i x ¯ ) ( x j x ¯ ) / s 2 i = 1 n j = 1 n w i j
The formula of the local spatial autocorrelation is as follows:
I i = z i j = 1 n w i j z j
where xi and xj are the observed value of the city i and city j, respectively; n is the number of geographical units; x ¯ and s2 are the mean value and standard deviation of the observed value x; wij is a spatial weight matrix based on neighborhood criteria; zi and zj are the normalized values of variance of the observed value x of the city i and city j, respectively [44,45].

2.2.4. Geographical Detector Model

The coupling coordination among urbanization sub-systems is affected by various factors, such as the economic development level, government’s macro-control and regional traffic conditions. There are many presuppositions in dealing with such socio-economic problems by the traditional methods, while the geographical detector model proposed by Wang (2016) is less restricted by presuppositions [46,47]. And it has been widely used in many fields such as the analysis of spatial differentiation of geographic elements and spatial evolution mechanism. In this study, this model is introduced to explain the impacts of the influencing factors on the spatiotemporal evolutions of overall coupling coordination (D) and pairwise coupling coordination (D12, D13 and D23) among population, land and economy urbanization in the Yangtze River Delta. The formula is as follows:
P H , U = 1 1 n σ 2 i = 1 m n i σ i 2
where: PH,U is the power of influencing factor H; n and ni represent the total number of samples in the research area and the sub research area, respectively. In this research, n = 41; m is the categories number of influence factor; σ2 and σ2i are the variance of the coupling coordination degree of the whole region and the sub-region, respectively; when σ2 ≠ 0, the model is established. The value range of PH,U is (0, 1). The closer PH,U is to 1, the greater the impact of the influence factor H on spatial differentiation of coupling coordination degree.

3. Results

In order to conduct a comparative study among the levels of land, economy and population urbanization, all the data has been standardized through the method of min-max normalization. Then, the entropy method is used to evaluate the levels of land, economy and population urbanization in the Yangtze River Delta. As is shown in Figure 2a, the scores of the three sub-systems of urbanization have been significantly improved during the research period. Specifically, the mean value of population urbanization increased from 0.063 in 2001 to 0.142 in 2016, with an average annual growth rate of 5.57%. The mean value of land urbanization was 0.080, which steadily increased from 0.051 to 0.120, with an average annual growth rate of 5.87%. And the mean value of economy urbanization was 0.095. The level of population urbanization has always been higher than that of economy urbanization before 2013, which is a special feature of regional urbanization in developing countries like China. However, the growth rate of economy urbanization is the fastest among the three sub-systems of urbanization, with an average annual growth rate of 7.00%. In 2013, the level of economy urbanization exceeded that of population urbanization and has been ranked first ever since.

3.1. The Measurement Results of Coupling Coordination Degree

Based on the measurement of land urbanization, economy urbanization and population urbanization of 41 prefecture-level cities in the Yangtze River Delta during the period of 2001 to 2016, the variation characteristics of the mean values of overall coupling coordination degree (D) and pairwise coupling coordination degree (D12, D13 and D23) are calculated by using the coupling coordination degree model (Figure 2b).

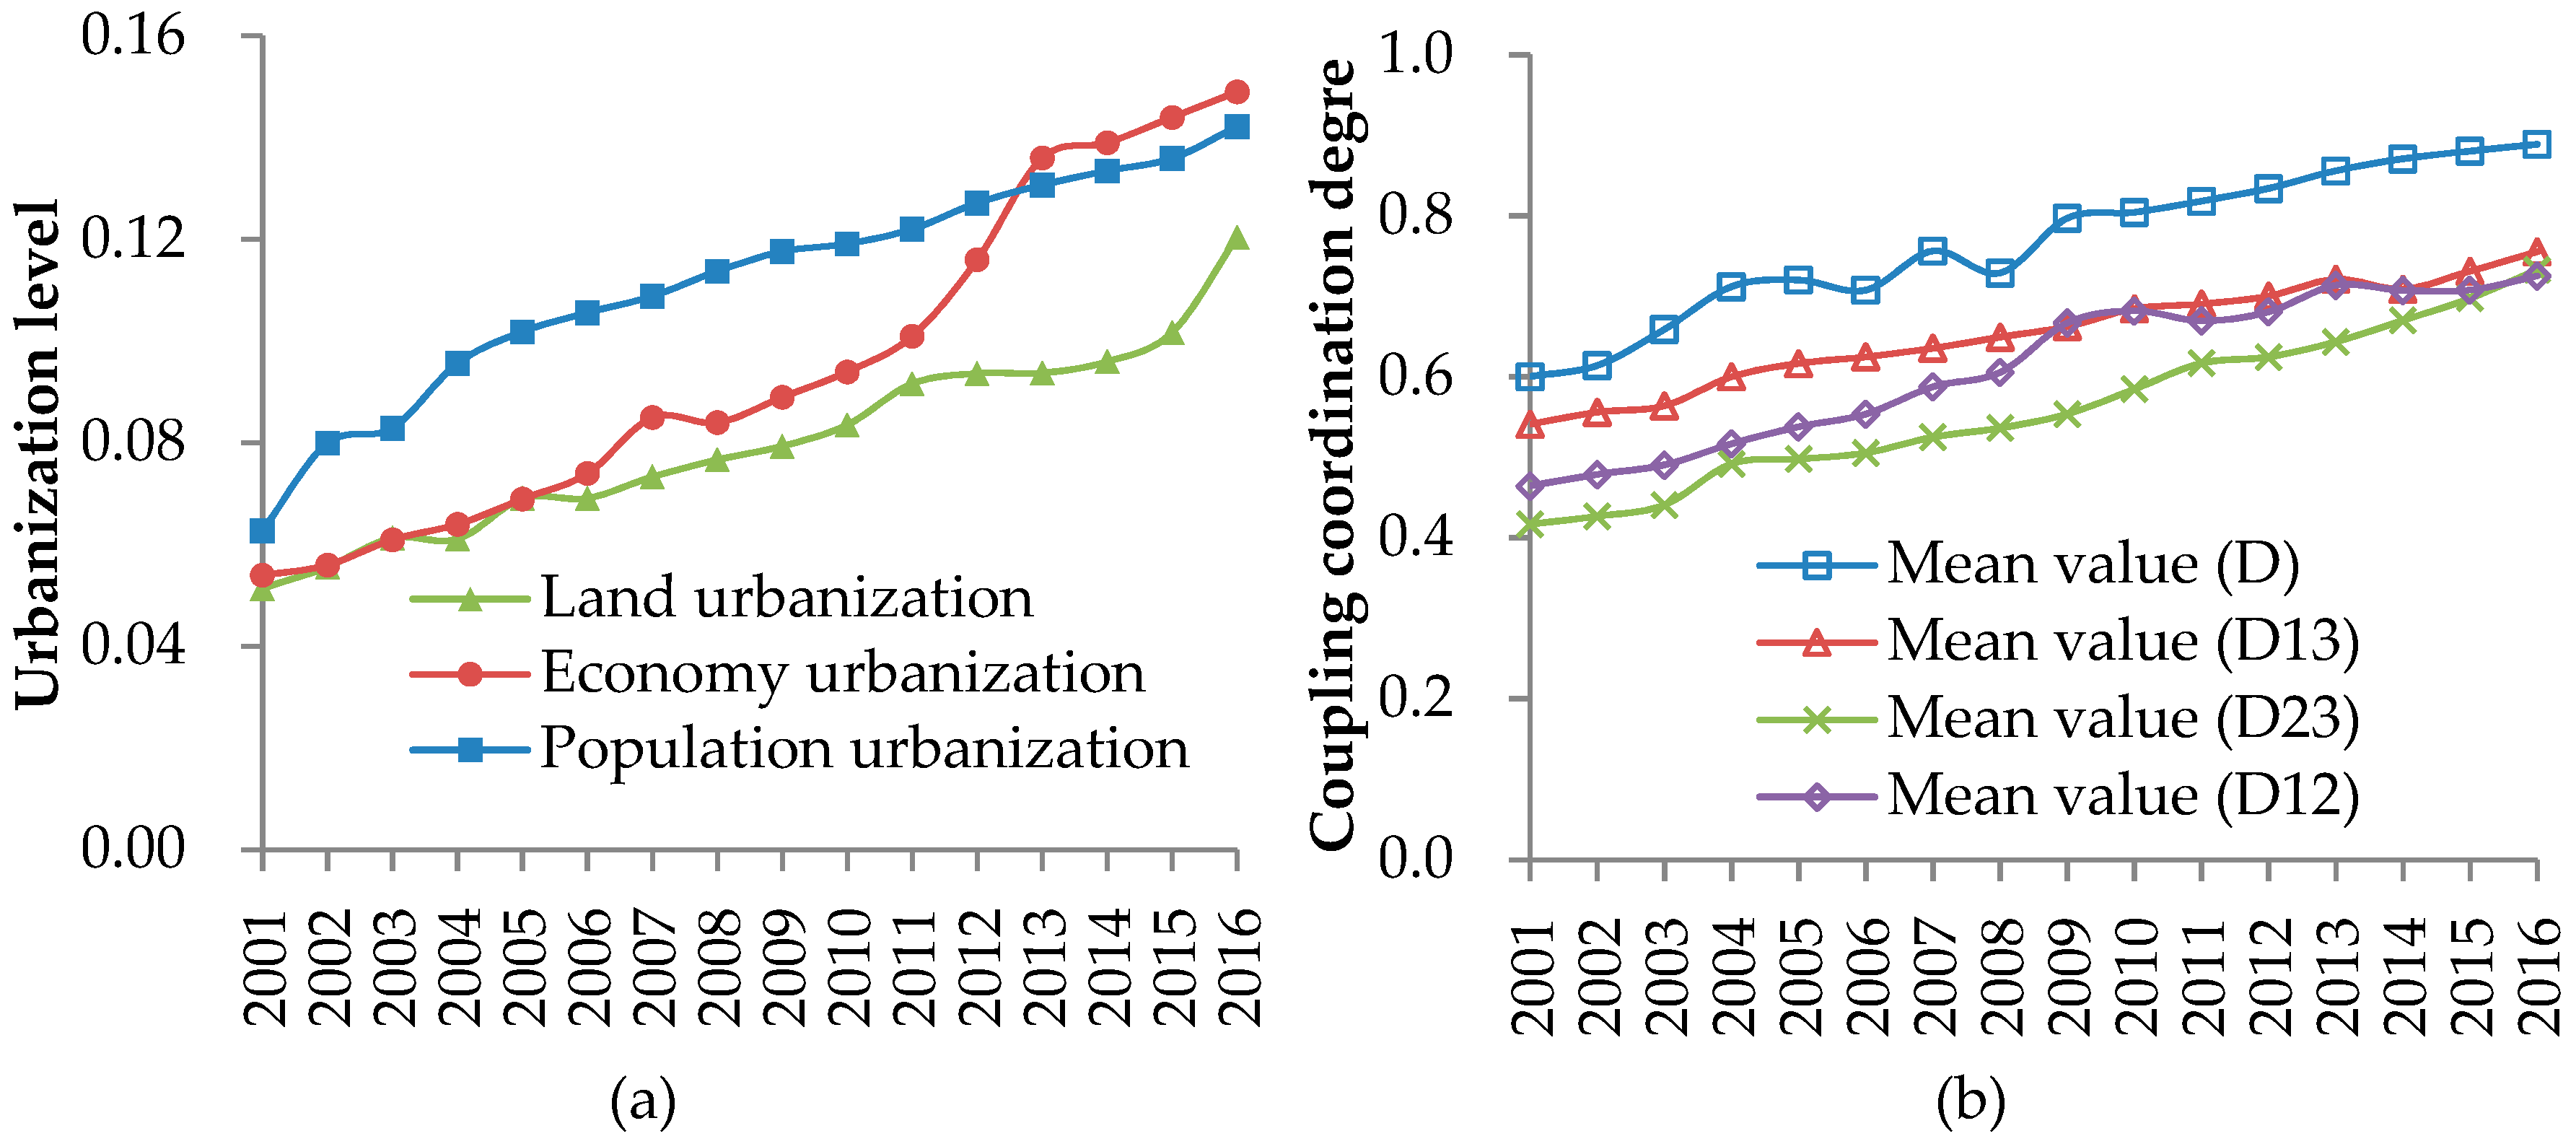
3.1.1. Overall Coordination Degree

The overall coupling coordination degree of population, land and economy urbanization in the Yangtze River Delta has increased significantly from 0.600 in 2001 to 0.889 in 2016, with a great decline in 2008 because of the US subprime crisis. This special event has led to significant slowdown in the economy urbanization. However, the coupling coordination of urbanization in this region has quickly recovered owning to the rapid adoption of effective bailout plans and policy measures by the government. On the whole, the overall coordination degrees of regional population, land and economy urbanization were always at a high level during the study period. From the perspective of development stage, the coupling coordination degrees from 2001 to 2009 have been less than 0.8, which belongs to medium-level coupling coordination (Type III). And the coupling coordination degrees of population, land and economy urbanization from 2010 to 2016 belonged to satisfactory coupling coordination (Type V). To a certain extent, this indicates that the development of population, land and industry in the Yangtze River Delta is highly coordinated. The urbanization in this region has been in a relatively healthy state since 2000.

3.1.2. Pairwise Coupling Coordination Degree

As shown in Figure 2, the pairwise coupling coordination degrees among the three urbanization sub-systems have significantly improved during the study period. The mean values of coupling coordination degrees between land and economy urbanization (D23) increased from 0.417 in 2001 to 0.733 in 2016, with an average annual growth rate of 3.83%. From 2001 to 2009, the mean values of D13 were apparently higher than those of D12 and D23, showing that there existed the land-centered urbanization in early years. The problem of industrial hollowing-out in the urbanization process cannot be ignored. Some scholars have also demonstrated the existence of similar problem in the coupling co-evolution study of urbanization in Yangtze River Economic Belt of China [31]. From 2010 to 2016, the mean values of D12 have increased steadily, while the mean values of D13 and D23 have been unstable, which may be related to the adjustment of industrial structure in most cities in the later period. The mean value of D13 increased to 0.755 after industrial adjustment, which is higher than those of D12 (0.733) and D23 (0.725) in 2016.

3.2. Spatiotemporal Differentiation of Coupling Coordination

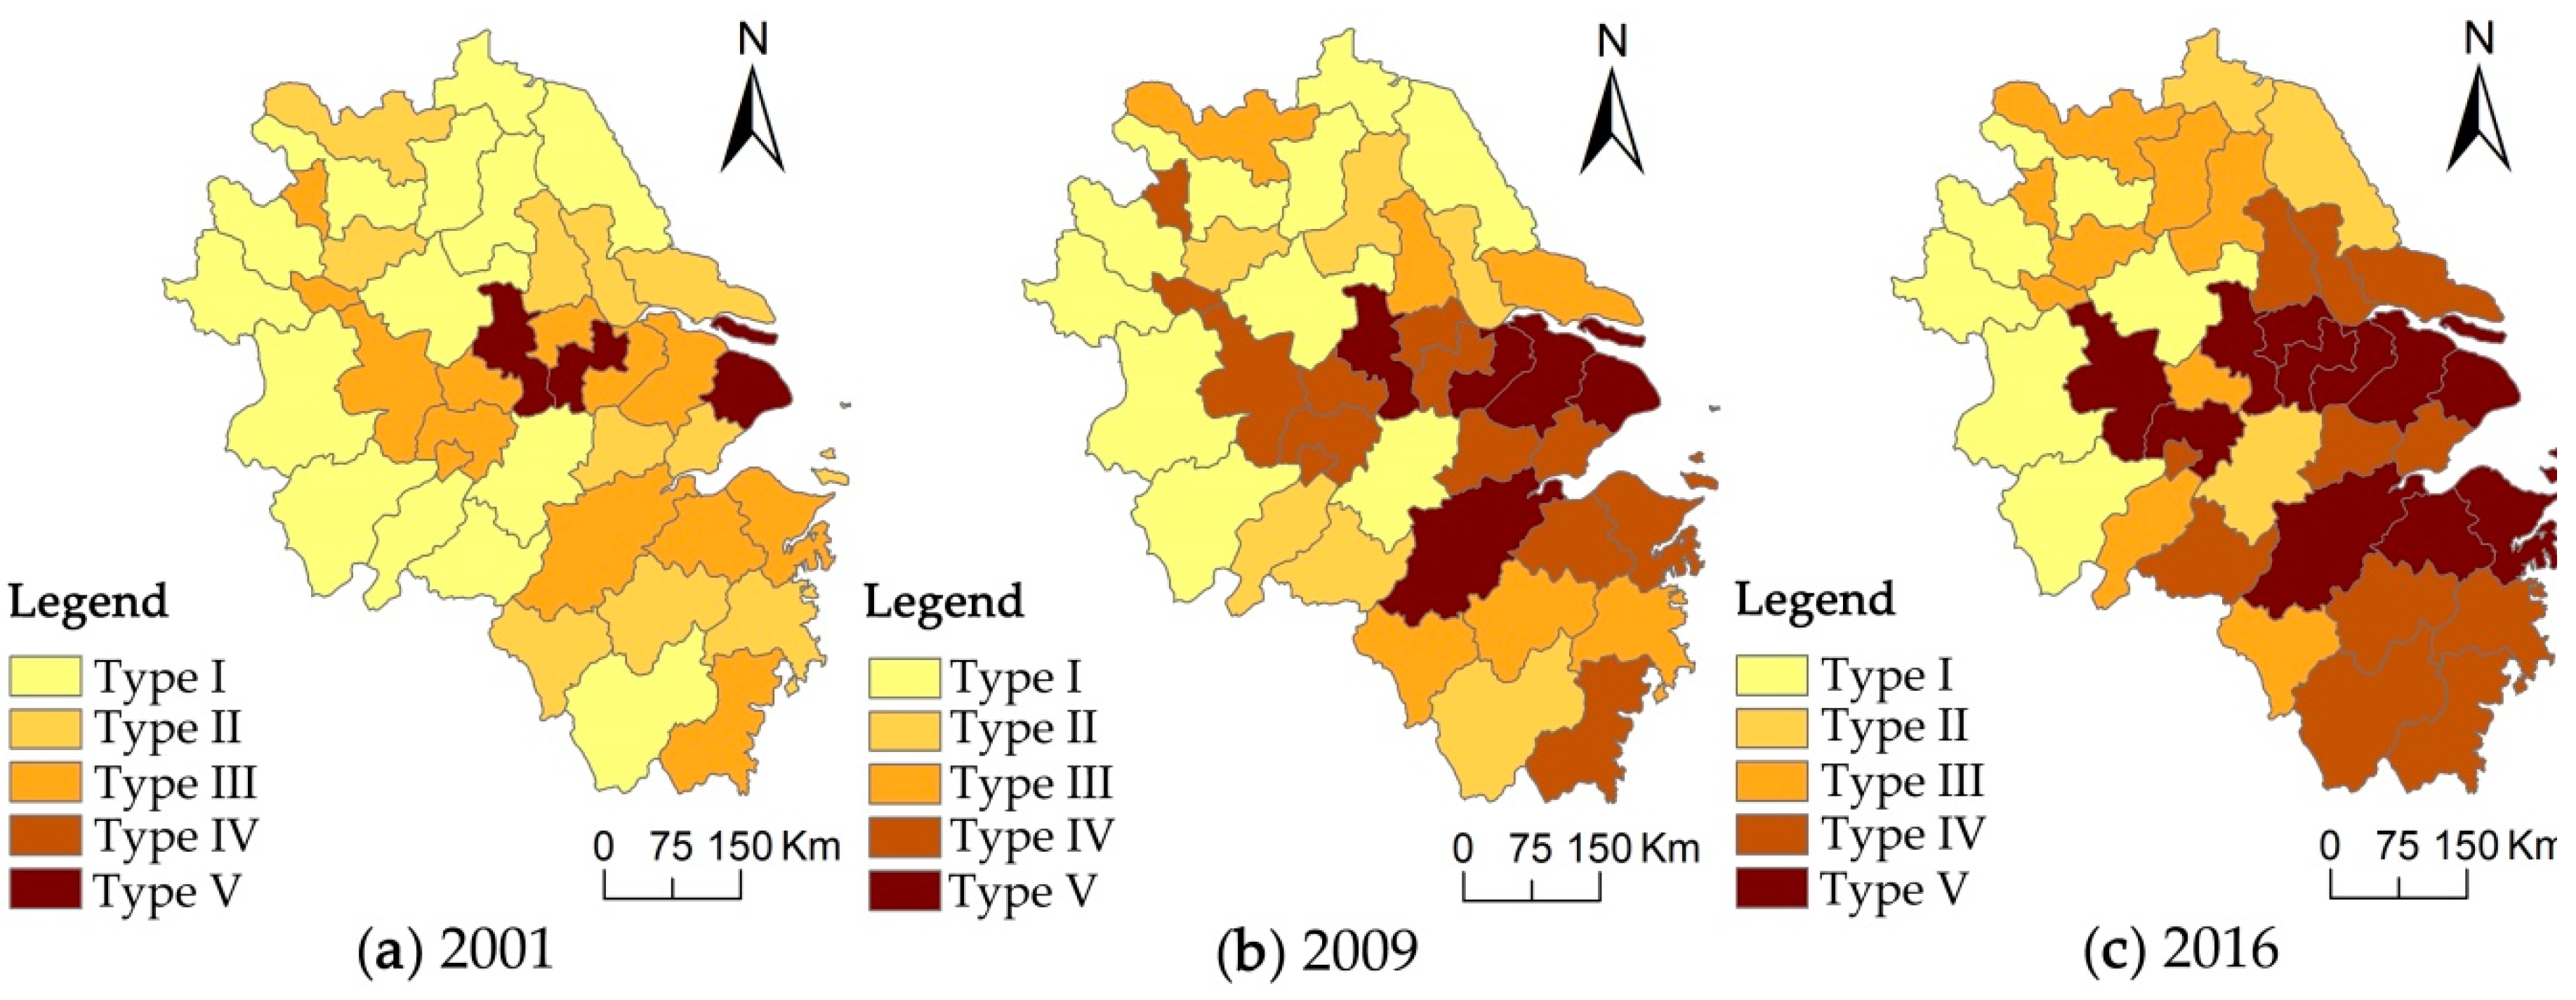
3.2.1. Spatiotemporal Differentiation of Overall Coupling Coordination Degree

Based on the measurement results of overall and pairwise coupling coordination degrees among population, land and economy urbanization in the Yangtze River Delta from 2001 to 2016, we chose the ArcGIS software to visualize the calculated results in 2001, 2009 and 2016. As shown in Figure 3, the spatial distributions of low-level and high-level coupling coordination cities show spatial dependence and a Z-shaped pattern, respectively. Specifically, only Shanghai, Nanjing and Changzhou were in the stage of high-level coupling coordination in 2001, while the cities in the stage of unsatisfactory coupling coordination (Type I) accounted for 34.15% of the total and were mostly distributed in northern Jiangsu, northern Anhui, western Anhui and southern Anhui. In 2009, the coupling coordination level of regional urbanization was significantly improved, the urbanization of Hangzhou, Suzhou and Wuxi were all improved to the stage of satisfactory coupling coordination (Type V) and cities (such as Hefei, Maanshan, Wuhu and Tongling) which were originally in the stage of Type III also entered the stage of Type IV. In 2016, the spatial distribution characteristic of coupling coordination of urbanization has been clear, the cities in the stage of Type V were mainly distributed on the development axes of “Hefei-Nanjing-Shanghai-Hangzhou-Ningbo” and the overall coupling coordination level of urbanization in most cities of southern Jiangsu and Zhejiang has been greatly improved.

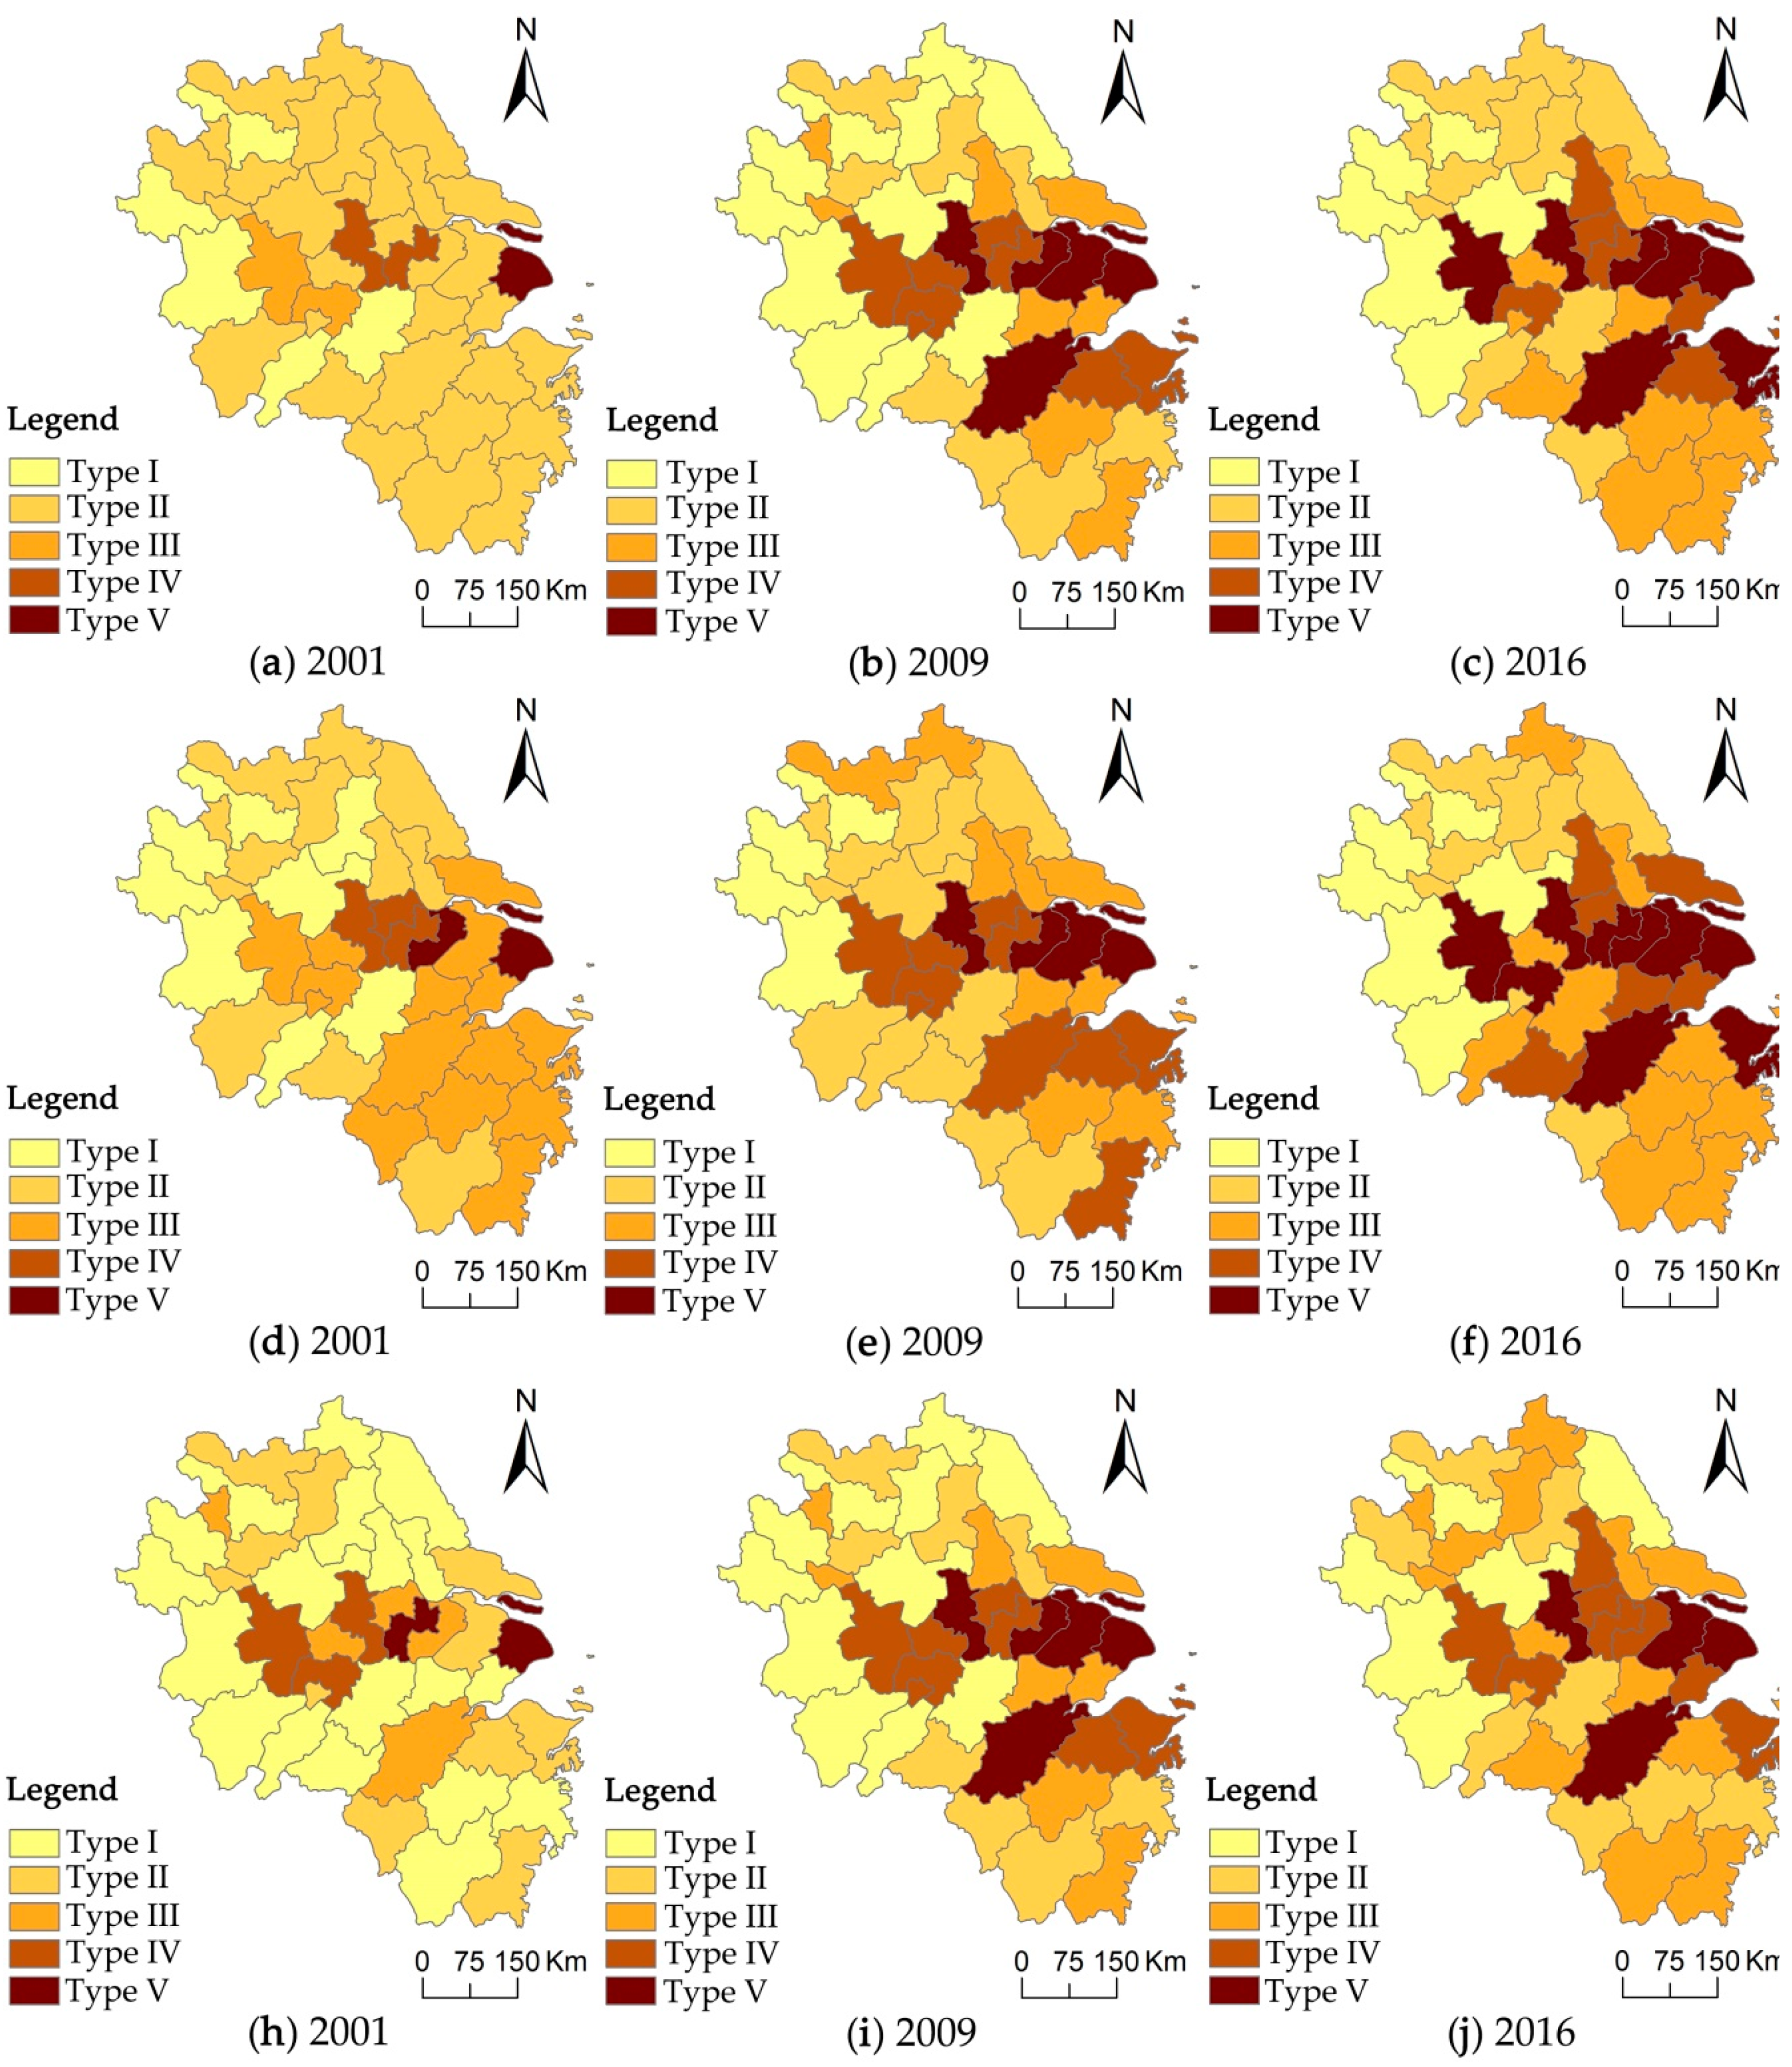
3.2.2. Spatiotemporal Differentiation of Pairwise Coupling Coordination Degree

The differences in the evolution characteristics of pairwise coupling coordination indicate population, land and economy urbanization are regionally unbalanced, among which the spatiotemporal evolutions of D13 and D12 present stage characteristics, the spatial differentiation characteristics of D23 and D are the most similar. From the Figure 4, the spatial evolution characteristic of D13 has become gradually clear. In 2001, D13 of most cities was in the stage of Type II. While, in 2009, the coupling coordination degrees of these cities located in northern Jiangsu, southern Anhui and Northern Anhui decreased, such as Lianyungang, Suqian, Bozhou and Anqing. By 2016, the spatial distribution of the cities in the stage of Type V was relatively stable and D13 in most cities in northern Jiangsu and Zhejiang has been improved significantly. The spatial differentiation characteristics of D23 are the most similar to that of D, showing that the key to solve the imbalance of urbanization is to deal well with the relationship between economy urbanization and land urbanization. Sustainable economic development and land resource allocation modes are of great significance to optimize and control the process of regional urbanization. The spatial characteristics of D12 are in a relatively stable state and its regional equilibrium is gradually growing. In 2001, 19 cities were in the stage of Type I, accounting for 46.34%, while the number of the cities at this stage decreased obviously in 2009; By 2016, the number of the cities in the stage of Type I has further decreased to 6, including Fuyang, Luan, Anqing, Chuzhou, Suzhou and Yancheng.

3.3. The Spatial Agglomeration of Coupling Coordination

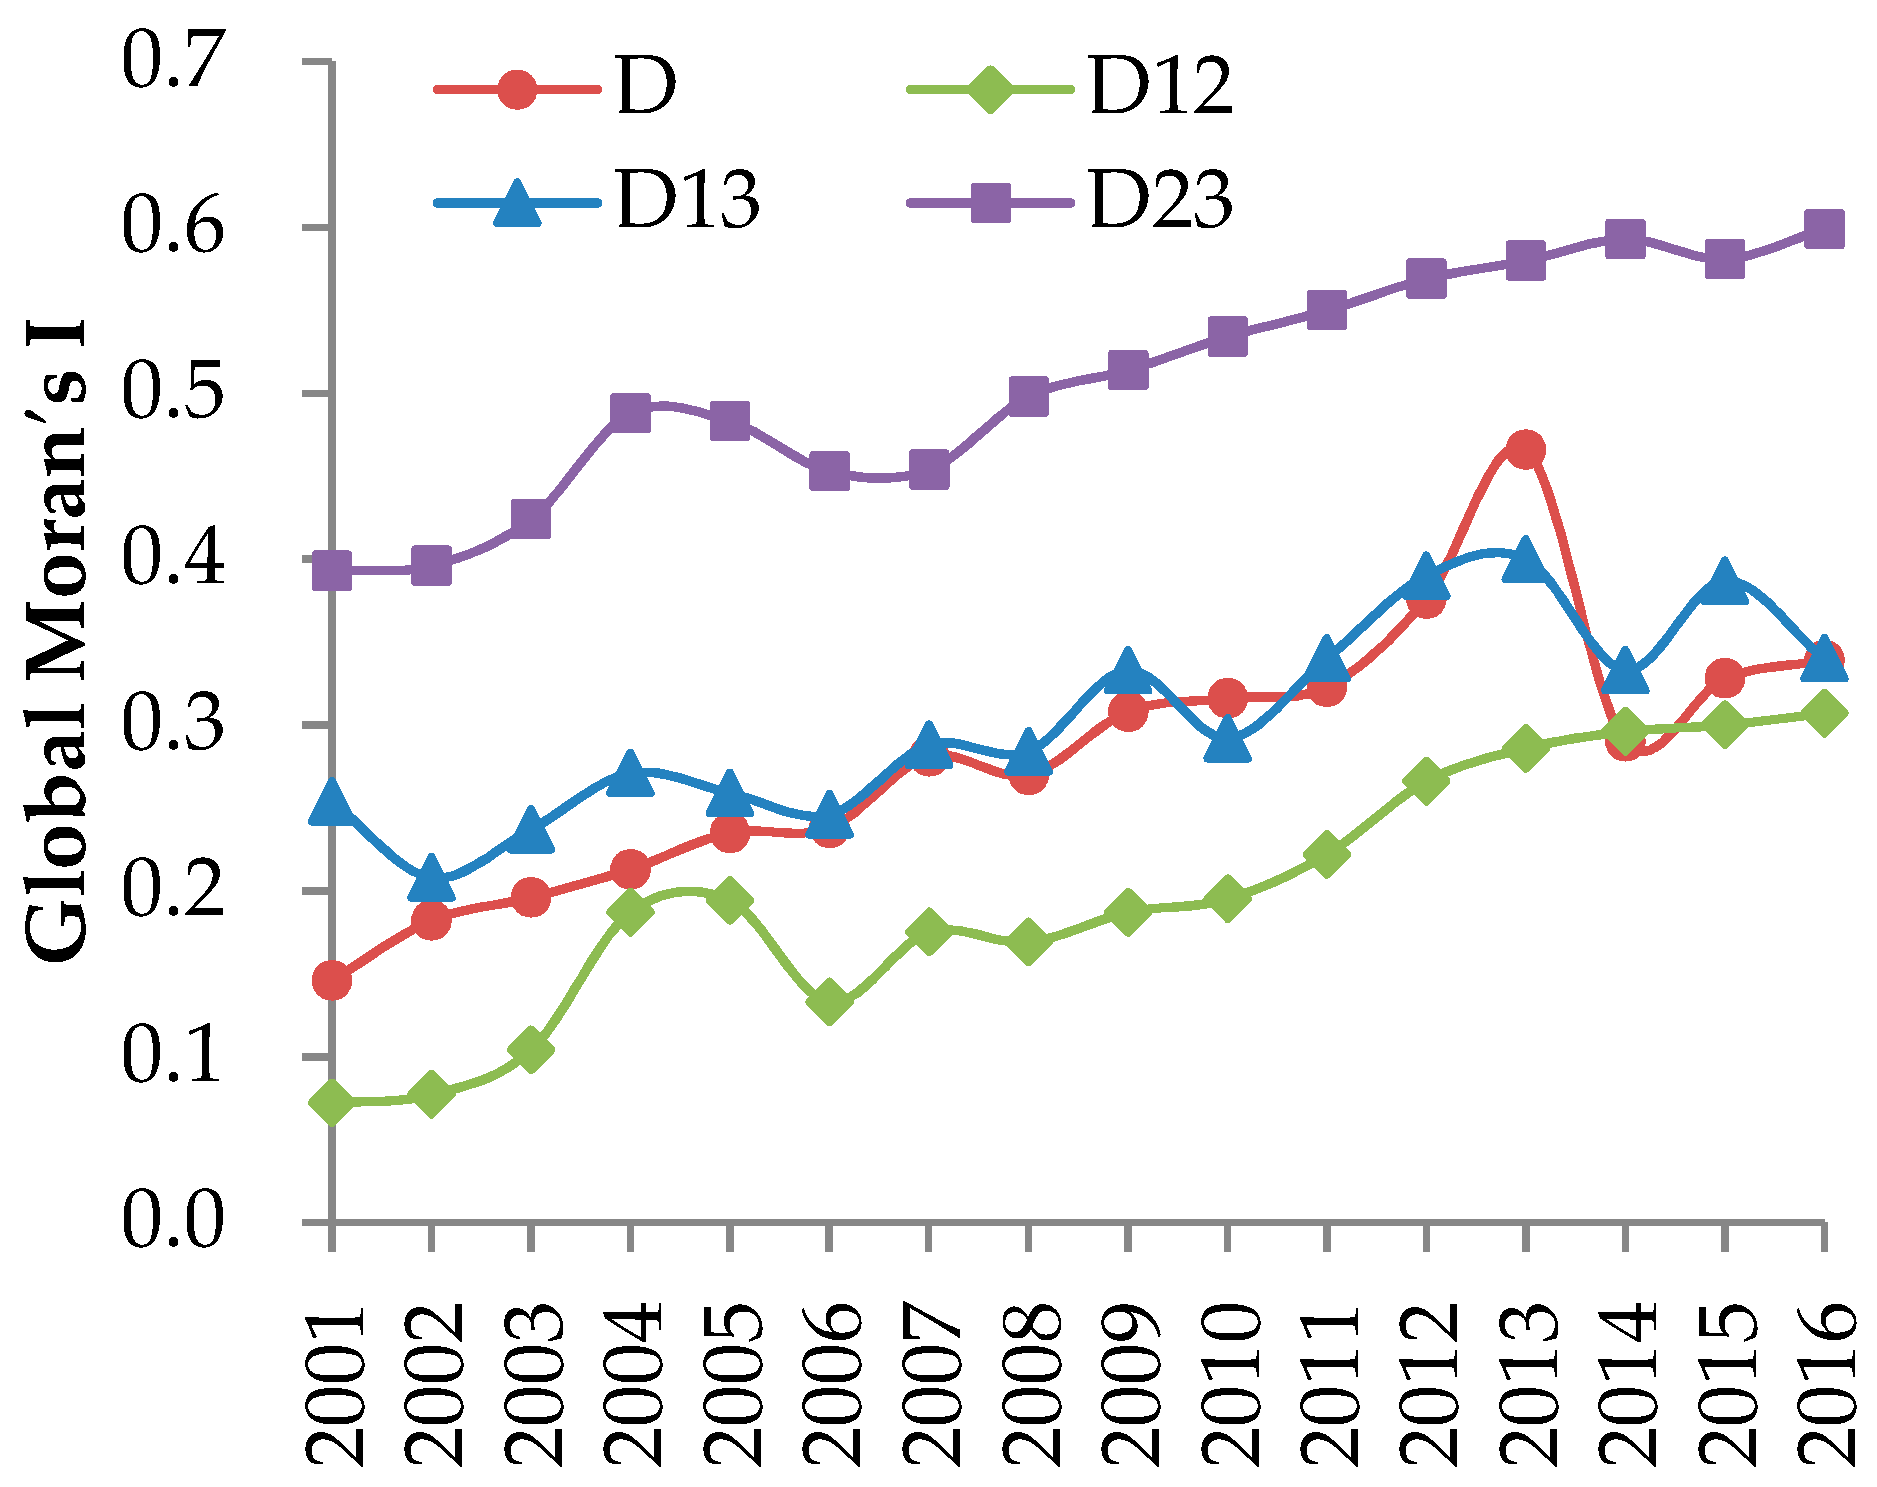
3.3.1. Global Spatial Autocorrelation Analysis

The distribution of any spatial element is nothing more than the three patterns of agglomeration, dispersion and uniformity. In order to more clearly discover the spatial distribution patterns and evolution laws of the coupling coordination of regional urbanization in the Yangtze River Delta, the spatial autocorrelation analysis is used in this part. The Moran’s I values of D, D12, D13 and D23 from 2001 to 2016 were calculated, with the results shown in Figure 5. The overall coupling coordination degrees of urbanization were significantly positive spatial autocorrelation, with the Moran′s I value increasing from 0.146 in 2001 to 0.339 in 2016. This indicates that the cities with high-level coupling coordination of urbanization tend to be adjacent in space, so do the cities with low-level coupling coordination of urbanization.
From Figure 5, the Moran’s I values of D12 were not significant in 2001 to 2005 but increased from 0.169 in 2008 to 0.307 in 2016 with significance at the 10% level. The distribution of the cities with Moran’s I values of D13 fluctuating from 0.254 to 0.340 from 2001 to 2016, showing a significantly positive spatial autocorrelation. The Moran’s I values of D23 were at a high level during the study period, which indicates the spatial distribution of D23 tend to be concentrated in space. This spatial distribution pattern of coupling coordination between land and economy urbanization suggests that the spatial spillover effect and synergistic effect should not be neglected in the process of regional urbanization.

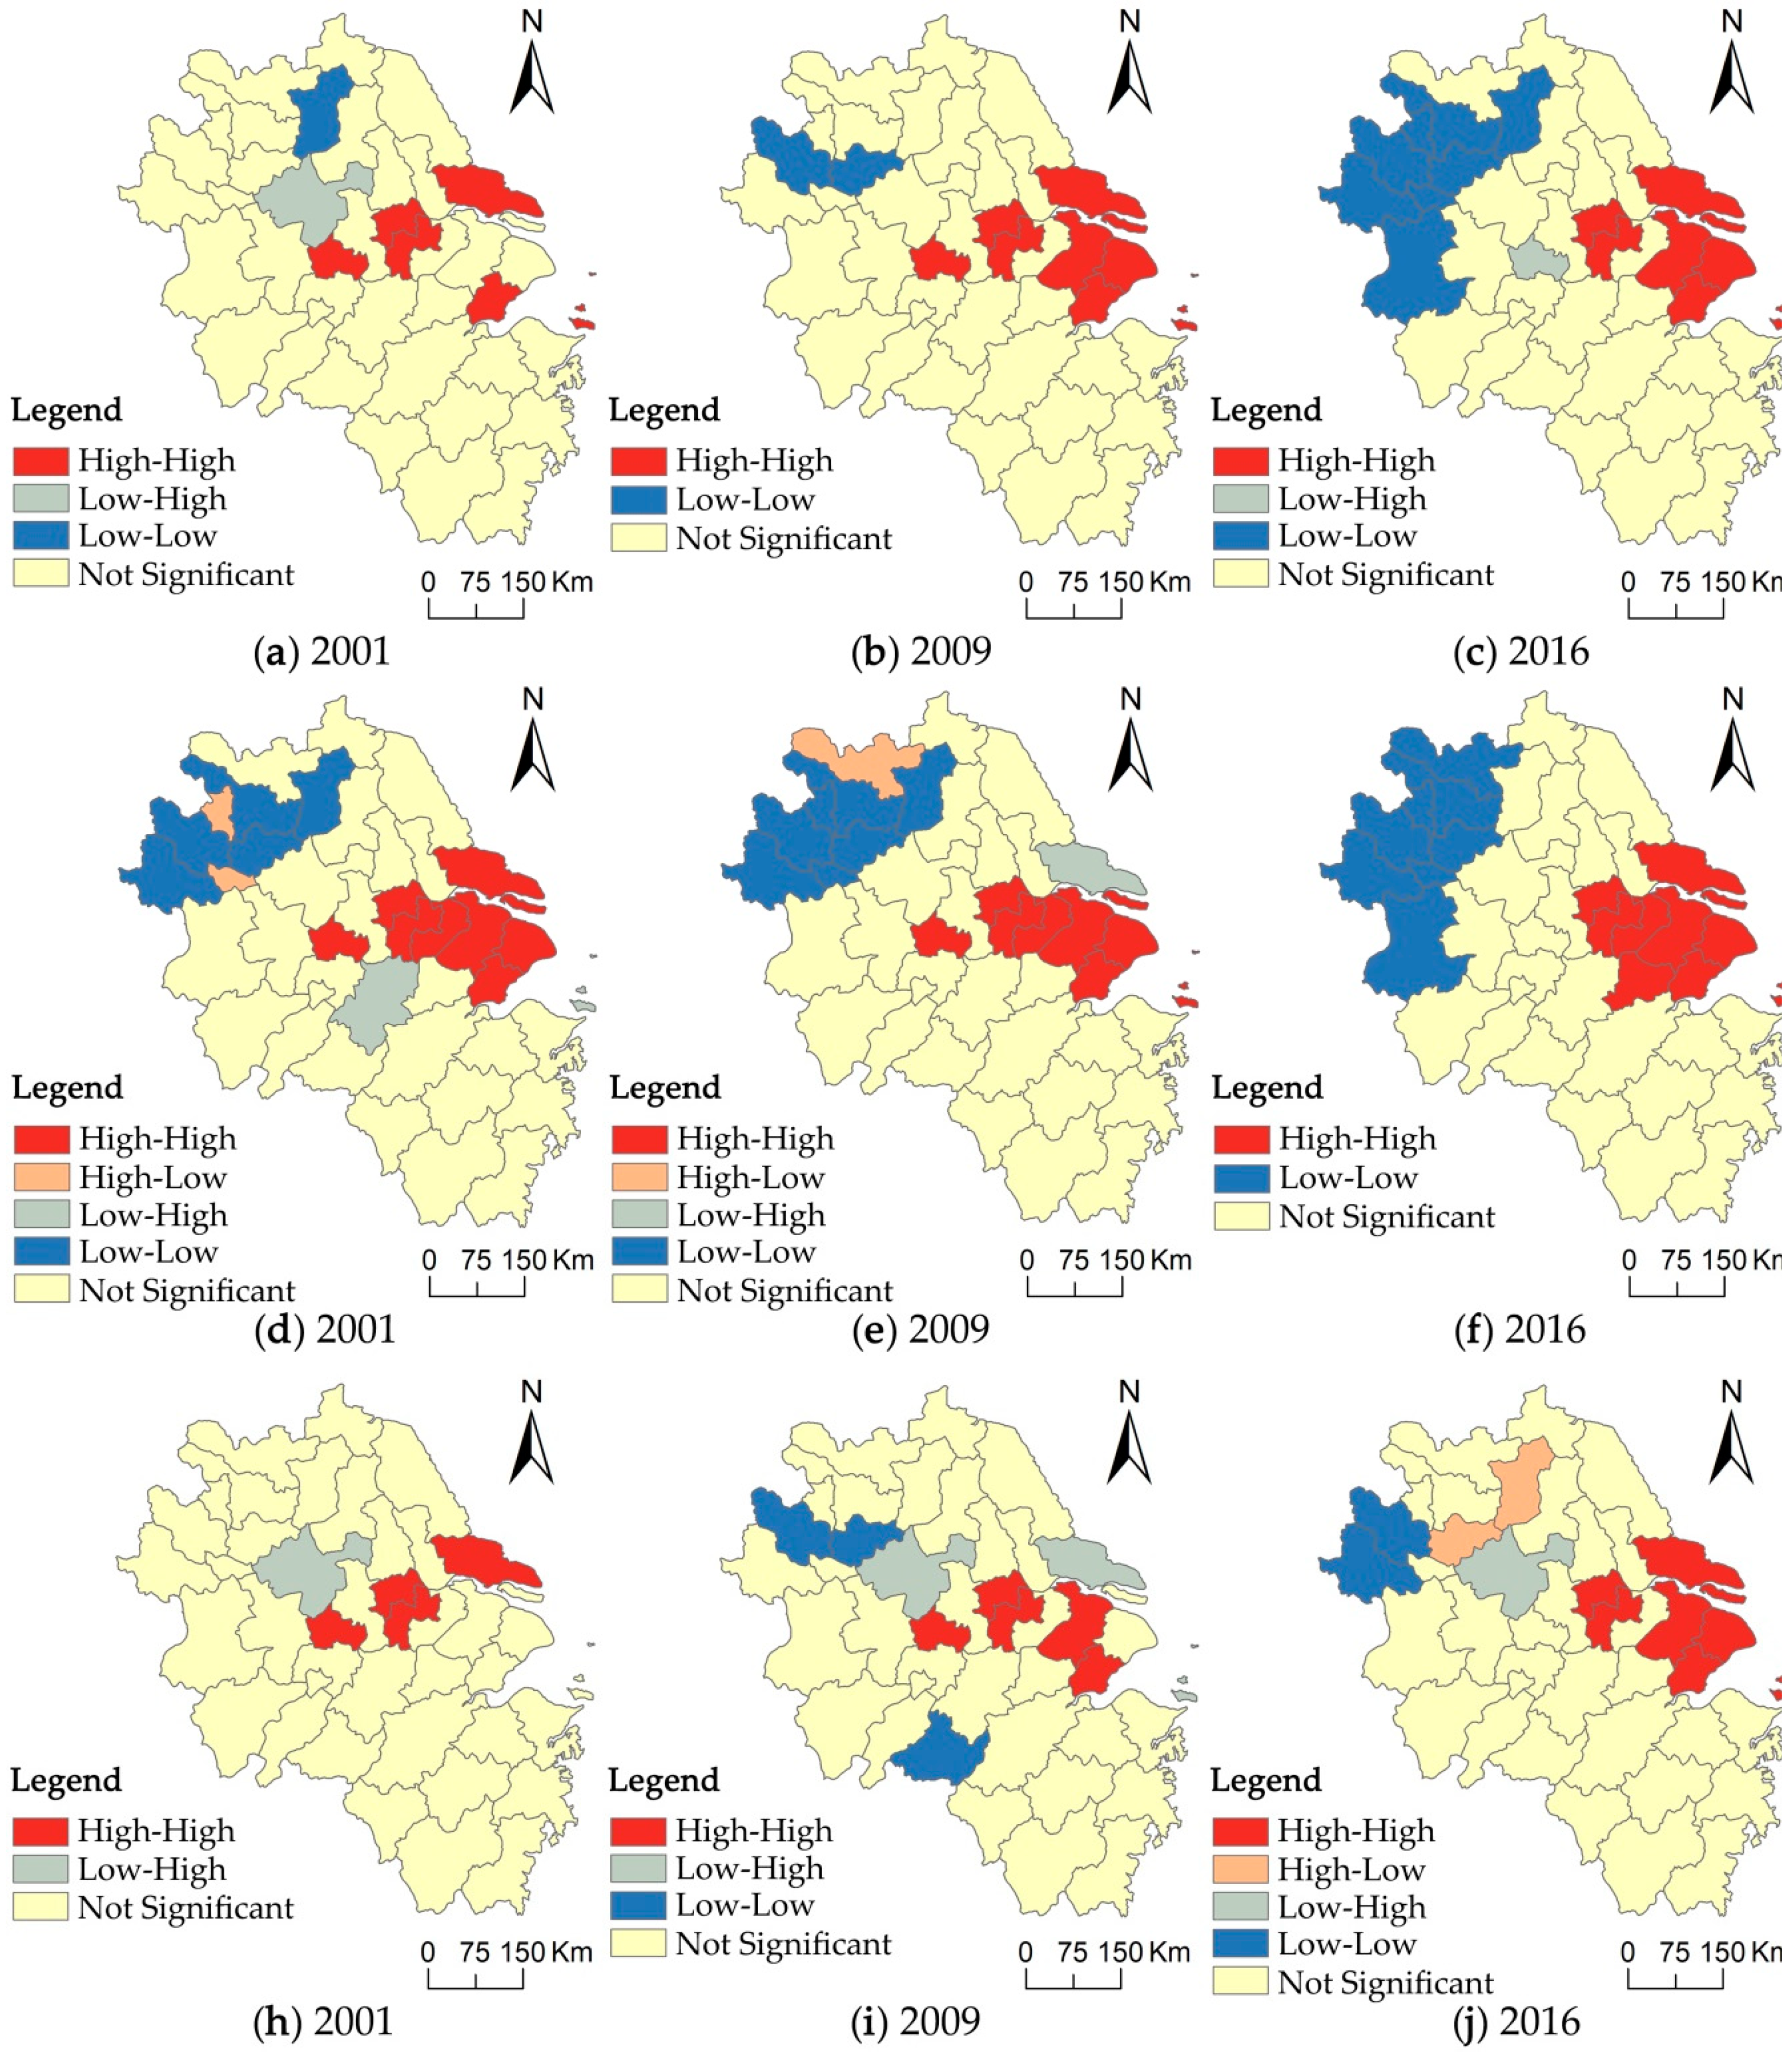
3.3.2. Local Spatial Autocorrelation Analysis

For further exploration of the evolution characteristics of local spatial correlation of the overall and pairwise coupling coordination among population, land and economy urbanization in the Yangtze River Delta, we used the formula (10) to analyze the local spatial autocorrelation of coupling coordination of urbanization in 2001, 2009 and 2016 and divided the clusters with local indicators of spatial association (LISA) into five types of High–High types, Low–Low types, High–Low types, Low–High types and Not significant types (Figure 6 and Figure 7).
Overall, except for the not significant cities, the local spatial correlation characteristics of the overall coupling coordination of population, land and economy urbanization (D) in the Yangtze River Delta were mainly High–High and Low–Low types and the positive spatial correlation characteristics were gradually prominent. Over the past 16 years, the number of the cities of High–High type has not changed significantly, while the spatial distribution of High–High types changed obviously. The cities of High–High type were mainly located in Zhenjiang, Changzhou, Nantong, Jiaxing and Zhoushan by 2016. The number of the cities of Low–Low type increased from 1 in 2001 to 8 in 2016, which mainly concentrated in northern Anhui and northern Jiangsu by 2016 (Figure 6).
There are obvious differences in the local spatial correlation characteristics of coupling coordination between the two of population, land and economy urbanization, the High–High and Low–Low types tend to be concentrated in space. The traditional economically developed regions are also high-value regions of coupling coordination degree. Specifically, the spatial distribution of High–High types of D13 were most similar to that of D, Nantong, Zhenjiang, Changzhou, Jiaxing and Zhoushan were of the High–How type in three year of 2001, 2009 and 2016; The Low–Low type of D13 was constantly expanding, forming a planar region composed of Luan, Fuyang, Huainan, Bozhou, Huaibei, Suzhou, Xuzhou and Bengbu. The High–High and Low–Low types of D23 were mainly located in southern Jiangsu, Shanghai and Northern Zhejiang. There was little change in the number of these two types of cities. The Low–High and High–Low type cities of D12 disappeared in 2016. The High–High type of D12 moved to the southeast obviously during the study period, Zhenjiang and Changzhou were of this type in 2001, 2009 and 2016. The cities of Low–Low type emerged in 2009 and were mainly distributed in Bozhou and Bengbu in 2016 (Figure 7).

3.4. Influencing Factors of Coordination Evolution of Urbanization

3.4.1. Selection of Influencing Factors

The co-evolution of urbanization system is a relatively complex process, which is affected by various factors. Previous literature hold that the economic development level is the fundamental factor that affects the coupling coordination of urbanization by driving the increase of local employment and local fiscal revenue [21,48]. The per capita GDP is suggested by Brückner (2012) to characterize it through the deflation of GDP index with 2001 as the base year [49]. Location traffic condition is an important leading force of coupling coordination of urbanization according to the studies by Deng et al. (2008) and Guo et al. (2015) [22,50], which is obtained by summing up railway mileage, highway mileage, inland waterway mileage and civil aviation routes. Population resources are the prerequisite of urbanization development [51], Liu et al. (2018) concluded that population agglomeration effect is positively correlated with the coupling coordination of urbanization by using geographic weighted regression model [30]. Therefore, urban population density is chosen to characterize this indicator. Technology development level reflects the strength of science and technology to support the high-quality development of urbanization. Science and technology is the primary productive force, which can provide continuous driving force for the development of a city [21,22]. We choose the number of scientific research practitioners per million people to characterize it. Government macro regulation is the guaranteed force for coordinated development of urbanization by adopting the top-down policies and regulations, reflecting the impacts of local government behaviors on urbanization development [51,52]. According to the study by Choy et al. (2013), government behavior directly affects the local industrial structure and then affects the urbanization process [53]. The proportion of added value of secondary and tertiary industry to GDP is selected to characterize this indicator. Based on the review and discussion above, the five indicators of economic development level (Eco), location traffic conditions (Tra), population agglomeration effect (Pop), technology development level (Tec) and government macro regulation (Gov) were chosen to analyze the spatiotemporal evolution of the overall and pairwise coupling coordination among population, land and economy urbanization in the Yangtze River Delta.

3.4.2. Analysis of Estimated Results

There are some differences in the effects of various factors on the spatiotemporal evolution of coupling coordination of urbanization. It can be seen from Table 2 that the spatial differentiation of D in 2001 was mainly affected by Eco and Pop, with the influence coefficients of 0.601 and 0.549, respectively. In 2009, the effect of Eco on the spatial evolution of D increased to 0.622 and the effect of Pop decreased to 0.503 but the influences of the two factors were still greater than those that of other indicators. By 2016, the effect of Eco and Tra increased to 0.687 and 0.426, respectively. However, the influence of Pop and Tec decreased to 0.418 and 0.309, respectively. The impact of Gov became significant at the 10% level in 2016. Overall, the economic development level has always been the leading factor for the spatiotemporal differentiation of coupling coordination of urbanization in the Yangtze River Delta. The effect of location traffic conditions has become more and more important, indicating that the improvements in the flow efficiencies of such factors (capital and population) brought by traffic development enhanced their influences on co-evolution of regional urbanization. The effect of population agglomeration has been decreasing, showing that the effect of the transfer of rural population to cities on the coupling coordination of urbanization has been constantly decreasing under the background of urban-rural integration.
From the impact values of these factors, it can be seen that the economic development level has been the main influencing factor of the spatial differentiation of D13 and D23, with its influence improving significantly from 2001 to 2016. The effect of location traffic conditions on the spatial differentiation of D12 is significantly stronger than that of D13 and D23 and the impact increased to the maximum value of 0.439 in 2016. The effects of population agglomeration on spatial differentiations of D13 and D23 decreased significantly, while its effect on D12 increased from 0.369 in 2001 to 0.453 in 2016. The technology development level mainly affected the spatial differentiation of D13 in 2001, however, the effect of which on the spatial differentiation of D23 were obviously higher than those of D12 and D13 in 2009 and 2016. This indicates that the advance of science and technology promotes regional economic development and intensive use of land by improving labor productivity and promoting industrial upgrading and thus promotes the coupling coordination of economy urbanization and land urbanization. The effects of government macro-regulation on spatial differentiation of D12 and D23 are stronger than that of D13, which indicates that the role of government behavior in land urbanization cannot be ignored.

4. Discussion

The urbanization in most countries has experienced a long historical process [1]. The urbanization rates in developed countries today are generally 70% or even more than 80%. In retrospect of their urbanization process, the early urbanization rate increased by an average of 0.16% to 0.24% per year and only 0.30% to 0.52% per year at their accelerated stage of urbanization [1,54]. However, due to the excessive pursuit of rapid urbanization, the cities in many developing countries in the world (especially in Latin America) have been suffering from widespread metropolitan diseases, such as traffic congestion, unemployment and vast slums, which have caused profound contradictions within society and even become the main causes of social unrest [15,54]. In China, the urbanization rate is close to 60% with the annual growth rate of nearly 1.33% nowadays. Although scholars have carried out many research on regional urbanization from the perspectives of agglomeration economy and urbanization efficiency and put forward lots of useful suggestions [8,9,11,35], this one-sided pursuit of the speed of urbanization in many cities has already brought about large numbers of problems [17,55,56]. Therefore, China should summarize the experiences and lessons from high-speed urbanization in various regions (large, medium and small cities, urban agglomerations) to promote coupling coordination of population, land and economy urbanization and ultimately realize sustainable development of regional urbanization [57]. This study supplemented the theoretical perspective of regional urbanization quality research through the application of coupling coordination theory.
The coupling coordination of regional urbanization is of great importance to the quality of urban agglomerations [56]. Thus, a large amount of literature have been carried out to develop different indicators systems for different regions, making the results incomparable [20,30,31]. Although the mature evaluation index system has not yet established in academia, the evaluation index systems of population, land and economy urbanization established in this study are still of exploratory significance and referable for follow-up studies. The results also pointed out that the overall and pairwise coupling coordination degrees of urbanization in the Yangtze River Delta has experienced an overall improvement from 2001 to 2016. However, the regional imbalance of coupling coordination indicates the development of regional urbanization is still full of challenges, especially for cities with low-level coupling coordination [15,17,30].
Through spatial autocorrelation analysis, the spatiotemporal evolution paths and local correlation patterns of coupling coordination of regional urbanization have been revealed. This provides a theoretical basis for different cities to determine their development direction and deal with the relationship among population, land and economic development in urbanization process. Population, land and economy urbanization jointly drive the overall coupling coordination of urbanization, so the coupling coordination of the three urbanization sub-systems is the prerequisite for sustainable urbanization [37,57]. In the study of urban agglomerations in developing countries, we should not only pay attention to the efficiency of regional urbanization and the degree of economic agglomeration, which have been emphasized in developed countries where population re-urbanization has occurred [8,9,35,54] but also to the coupling coordination of urbanization sub-systems within urban agglomeration. Nowadays, China should abandon the development mode of land-centered urbanization and choose the way forward for people-oriented urbanization [15,19,20]. Using the geographic detector model as a means for explaining the change of the overall and pairwise coupling coordination degree provides a reference for the exploration of the evolution mechanisms of coupling coordination of urbanization. The findings provide more targeted guidance for urbanization transformation in the Yangtze River Delta and theoretical references for regional urbanization in other developing countries.
At the critical stage that China’s urbanization transforms from quantitative expansion to quality improvement, we cannot blindly copy the existing western urbanization theories [1,20]. What we should do is to fully understand that urbanization in developed countries like Europe and America is a long-term and gradual process and learn lessons from the over-urbanization in Latin America [54]. Urbanization is a regional problem rather than a simple problem within one city [11,12]. Therefore, only by investigating multi-dimensional coordinated development of urbanization can we make a scientific judgment and guidance on regional urbanization process, so as to achieve sustainable urbanization [57]. This study has several limitations. For example, as the co-evolution of regional urbanization is a complicated process, the evaluation index systems of urbanization established by us could be improved in future work. Besides, this paper conducts a realistic study mainly based on statistical data, which may be too absolute. Therefore, the follow-up studies are suggested to combine qualitative and quantitative methods to further deepen the understanding of the coupling coordination of urbanization and its mechanism.

5. Conclusions

The study on the coupling coordination of regional urbanization is of great significance to provide references for the construction of new-type urbanization, guide local governments to narrow regional differences and realize the healthy and sustainable urbanization [20,37]. Based on the entropy method, an index system was established to evaluate the level of population, land and economy urbanization of 41 prefecture-level cities in the Yangtze River Delta from 2001 to 2016. Then, the overall and pairwise coupling coordination degrees of the three urbanization sub-systems were calculated by the coupling coordination degree model. Finally, the spatial autocorrelation and the geographic detector model were used to explore the spatiotemporal evolution of coupling coordination of urbanization and its influencing factors. The following are the main conclusions:
(1)
From 2001 to 2016, the level of population, economy and land urbanization in the Yangtze River Delta has been improved, indicating the development of regional urbanization was relatively healthy. The overall coupling coordination degrees of urbanization increased from 0.600 in 2001 to 0.889 in 2016, which was at a high level and can be divided into two stages of medium-level coupling coordination from 2001 to 2009 and high-level coupling coordination from 2010 to 2016. The pairwise coupling coordination degrees of three urbanization sub-systems have also been greatly improved, especially the coupling coordination degree between economy and land urbanization. There existed some problems of attaching importance to land but not to population and industrial hollowing-out in the early urbanization process. However, the coupling coordination level of regional population and economy urbanization has been greatly improved through the transformation and upgrading of industrial structure in the later period.
(2)
The low-level coupling coordination cities of urbanization are mainly distributed in western Anhui, northern Anhui and northern Jiangsu and show a certain spatial dependence. More reasonable development strategies are necessary for these regions to promote the coordinated development of population, land and economy [49,50]. The spatial distribution of high-level coupling coordination cities gradually presents a Z-shaped pattern of central Anhui, southern Jiangsu, Shanghai, southern Anhui and northern Zhejiang. There were obvious differences in the spatiotemporal differentiation characteristics of pairwise coupling coordination degrees, among which the spatiotemporal evolution characteristics of coupling coordination between economy and land urbanization are the most similar to those of the overall coupling coordination. Therefore, sustainable economic development and land resource allocation are the keys for optimizing and regulating the process of regional urbanization.
(3)
The overall and pairwise coupling coordination of urbanization had a significantly positive global spatial autocorrelation in the Yangtze River Delta, with the levels of spatial dependence increasing year by year. The local spatial correlation of the overall coupling coordination was dominated by High–High and Low–Low types, with the cities of High–High type mainly located in Zhenjiang, Changzhou, Nantong, Jiaxing and Zhoushan. The High–High and Low–Low type of pairwise coupling coordination tended to be concentrated in space. The regions with advanced economy such as Shanghai, southern Jiangsu and Northern Zhejiang were also agglomeration regions of high-level coupling coordination of urbanization. Accordingly, enhancing the spillover effects and driving effects of the cities of High–High type on their neighboring cities is essential for achieving coupling coordination of regional urbanization [22]. The primary task of achieving coupling coordination for these areas with Low–Low type may still be the development of economy.
(4)
There are different factors that affect the spatiotemporal evolution of coupling coordination of regional urbanization at each stage in the Yangtze River Delta. The economic development level has always been the primary influencing factor. The impact of population agglomeration has been decreasing, while the effects of location traffic conditions, technology development and government macro regulation have been gradually highlighted. Therefore, to promote the sustained and coordinated development of regional urbanization, local policymakers should focus on some particular factors in different periods [30]. The differences in various factors that affect the spatiotemporal evolution of pairwise coupling coordination indicate that differentiating development strategies are prerequisites for cultivating new impetuses for new-type urbanization and achieving the co-evolution of regional urbanization [15,48].
Both new urbanization and smart city construction aim to achieve sustainable urban development [58,59]. After 40 years of reform and opening-up, China, like other countries in the world, has experienced the social development chaos of the urban malaise due to rapid urbanization. The findings of this study have several implications for the construction of smart cities. First, the evaluation index systems of urbanization established in this paper from the perspective of coupling coordination could effectively circumvent the normative bias in smart cities research and has a guiding significance to the evaluation of the construction of smart cities [60,61]. Second, the construction of smart cities is not a simple city construction based on information and communication technologies (ICTs) [58] but emphasizes the coordination of various elements within one city, as well as the coordinated development of infrastructures, economic elements and human resources among cities [60]. Therefore, the significantly positive spatial autocorrelation of the coupling coordination of regional urbanization indicates that special attention should be paid to the coordinated development among cities in the process of building smart cities and the radiation and driving effects of high-level coupling coordination cities on their neighboring cities with low-level coupling coordination to reduce the regional differences [60,61]. Third, in the process of building smart cities, local governments should fully consider different factors based on the different stages of the coupling coordination of urbanization to realize the transformation from big cities to smart cities and provide reasonable policy recommendations for the construction of smart cities in other developing countries [61,62].

Author Contributions

Conceptualization, D.X. and G.H.; Formal analysis, D.X; Methodology, D.X.; Writing—original draft, D.X.; Writing—review & editing, G.H.

Funding

This research was funded by the National Natural Science Foundation of China [Grant No. 41671137; 41771151; 41771154; 41871141].

Acknowledgments

We thank the academic editors and anonymous reviewers for their kind suggestions and valuable comments.

Conflicts of Interest

The authors declare no conflict of interest.

References

  1. Chen, M. Research progress and scientific issues in the field of urbanization. Geogr. Res. 2015, 34, 614–630. [Google Scholar]
  2. Seto, K.C.; Sánchez-Rodríguez, R.; Fragkias, M. The new geography of contemporary urbanization and the environment. Annu. Rev. Environ. Res. 2010, 35, 167–194. [Google Scholar] [CrossRef]
  3. Wang, Y.; Ma, L.; Liu, Y. Progress and trend analysis of urbanization research: Visualized quantitative study based on CiteSpace and HistCite. Prog. Geogr. 2018, 37, 239–254. [Google Scholar]
  4. Friedmann, J. Four theses in the study of China’s urbanization. Int. J. Urban Reg. Res. 2006, 30, 440–451. [Google Scholar] [CrossRef]
  5. Antrop, M. Landscape change and the urbanization process in Europe. Landsc. Urban Plan. 2004, 67, 9–26. [Google Scholar] [CrossRef]
  6. Alig, R.J.; Kline, J.D.; Lichtenstein, M. Urbanization on the US landscape: Looking ahead in the 21st century. Landsc. Urban Plan. 2004, 69, 219–234. [Google Scholar] [CrossRef]
  7. Seto, K.C.; Fragkias, M.; Güneralp, B.; Reilly, M.K. A meta-analysis of global urban land expansion. PLoS ONE 2011, 6, e23777. [Google Scholar] [CrossRef] [PubMed]
  8. Yang, T.; Pan, H.; Hewings, G.; Jin, Y. Understanding urban sub-centers with heterogeneity in agglomeration economies—Where do emerging commercial establishments locate? Cities 2019, 86, 25–26. [Google Scholar] [CrossRef]
  9. Pan, H.; Deal, B.; Chen, Y.; Hewings, G. A reassessment of urban structure and land-use patterns: Distance to CBD or network-based?—Evidence from Chicago. Reg. Sci. Urban Econ. 2018, 70, 215–228. [Google Scholar] [CrossRef]
  10. Malykhin, N.; Ushchev, P. How market interactions shape the city structure. Reg. Sci. Urban Econ. 2018, 71, 122–136. [Google Scholar] [CrossRef]
  11. Melo, P.C.; Graham, D.J.; Noland, R.B. A meta-analysis of estimates of urban agglomeration economies. Reg. Sci. Urban Econ. 2009, 39, 332–342. [Google Scholar] [CrossRef] [Green Version]
  12. Chung, S.; Hewings, G.J.D. Competitive and complementary relationship between regional economies: A study of the Great Lake states. Spat. Econ. Anal. 2015, 10, 205–229. [Google Scholar] [CrossRef]
  13. Mulligan, G.F. Revisiting the urbanization curve. Cities 2013, 32, 113–122. [Google Scholar] [CrossRef]
  14. Nagy, R.C.; Lockaby, B.G. Urbanization in the southeastern United States: Socioeconomic forces and ecological responses along an urban-rural gradient. Urban Ecosyst. 2011, 14, 71–86. [Google Scholar] [CrossRef]
  15. Chen, M.; Liu, W.; Lu, D. Challenges and the way forward in China’s new-type urbanization. Land Use Policy 2016, 55, 334–339. [Google Scholar] [CrossRef] [Green Version]
  16. Burchell, R.W.; Mukherji, S. Conventional development versus managed growth: The costs of sprawl. Res. Pract. 2003, 93, 1534–1540. [Google Scholar] [CrossRef]
  17. Cao, S.; Lv, Y.; Zheng, H.; Wang, X. Challenges facing China’s unbalanced urbanization strategy. Land Use Policy 2014, 39, 412–415. [Google Scholar] [CrossRef]
  18. Yao, S.; Zhang, P.; Yu, C.; Li, G.; Wang, C. The theory and practice of new urbanization in China. Sci. Geogr. Sin. 2014, 34, 641–647. [Google Scholar]
  19. Lu, D.; Cheng, M. Several viewpoints on the background of compiling the “National New Urbanization Planning (2014–2020)”. Acta Geogr. Sin. 2015, 70, 179–185. [Google Scholar]
  20. Wei, C.; Wang, Z.; Lan, X.; Zhang, H.; Fan, M. The spatial-temporal characteristics and dilemmas of sustainable urbanization in China: A new perspective based on the concept of five-in-one. Sustainability 2018, 10, 4733. [Google Scholar] [CrossRef]
  21. Wang, Y.; Yuan, Y.; Wang, Y.; Zhang, X.; Qiao, W. Relationship and mechanism of coupling development between population and land urbanization: A case study of Jiangsu Province. Geogr. Res. 2017, 36, 149–160. [Google Scholar]
  22. Guo, F.; Li, C.; Cheng, C.; Gan, J. Spatial-temporal coupling characteristics of population urbanization and land urbanization in northeast China. Econ. Geogr. 2015, 35, 49–56. [Google Scholar]
  23. Pan, A.; Liu, Y. The degree of imbalance between population urbanization and land urbanization of Xiangjiang River Basin. Econ. Geogr. 2014, 34, 63–68. [Google Scholar]
  24. Wu, Y.; Liu, Y.; Li, Y. Spatio-temporal coupling of demographic-landscape urbanization and its driving forces in China. Acta Geogr. Sin. 2018, 73, 1865–1879. [Google Scholar]
  25. Cui, X. Population urbanization and land urbanization in ethnic minority areas: Disequilibrium and spatial heterogeneity. China Popul. Resour. Environ. 2014, 24, 63–72. [Google Scholar]
  26. Wang, Y.; Peng, B.; Xiong, J.; Wang, Q. The economy urbanization and population urbanization of Dongting Lake area in China since 2001. Sci. Geogr. Sin. 2014, 34, 67–75. [Google Scholar]
  27. Li, X.; Li, X.; Ou, M. Evaluation of urbanization development coordination and analysis of regional disparities in Jiangsu Province. Hum. Geogr. 2012, 125, 50–54. [Google Scholar]
  28. Wang, Y.F.; Liu, Y.S.; Yan, B.; Li, Y.R. Spatial patterns and influencing factors of urban-rural coordinated development in China. Sci. Geogr. Sin. 2016, 36, 20–28. [Google Scholar]
  29. Yang, Q.; Wang, X. Temporal-Spatial coupling analysis between population change trend and socioeconomic development in China from 1952 to 2010. J. Remote Sens. 2016, 20, 1424–1434. [Google Scholar]
  30. Liu, Y.; Zhou, G.; Liu, D.; Yu, H.; Zhu, L.; Zhang, J. The interaction of population, industry and land in process of urbanization in China: A case study in Jilin Province. Chin. Geogr. Sci. 2018, 28, 529–542. [Google Scholar] [CrossRef]
  31. Zhang, Y.; Cao, W.; Liang, S.; Hu, Y. Research on the co-evolution temporal and spatial patterns of urbanization in Yangtze River economic belt. Resour. Environ. Yangtze Basin 2016, 25, 715–723. [Google Scholar]
  32. Jia, X.; Li, J.; Jia, W. Measure on new urbanization coordination level and compare spatial differences of Anhui Province. Econ. Geogr. 2016, 36, 80–86. [Google Scholar]
  33. Gu, C.; Wu, L.; Cook, I. Progress in research on Chinese urbanization. Front. Archit. Res. 2012, 1, 101–149. [Google Scholar] [Green Version]
  34. Cohen, B. Urbanization in developing countries: Current trends, future projections, and key challenges for sustainability. Technol. Soc. 2008, 28, 63–80. [Google Scholar] [CrossRef]
  35. Sun, D.; Zhang, J.; Zhang, M.; Yu, Z.; Hu, Y.; Zhou, Z. Coupling relationship between urbanization efficiency and economic development level in the Yangtze River Delta. Geogr. Res. 2013, 32, 1060–1071. [Google Scholar]
  36. Cao, G.; Bian, X.; Liu, T. Comprehensive evaluation of the urbanization level in Yangtze River Delta Region: An index framework based on the population, economic structure and land use. Geogr. Res. 2011, 12, 2139–2149. [Google Scholar]
  37. Cao, W.; Zhang, X.; Pan, Y.; Zhang, C. Coordinate development among population, land and economy urbanization in developed area: The case of Jiangsu Province. China Popul. Resour. Environ. 2012, 22, 141–146. [Google Scholar]
  38. Liu, Y.; Yao, C.; Wang, G.; Bao, S. An integrated sustainable development approach to modeling the eco-environmental effects from urbanization. Ecol. Indic. 2011, 11, 1599–1608. [Google Scholar] [CrossRef]
  39. Yang, Y.; Feng, Z.; Zhao, Y.; You, Z. Coordination between urban land expansion and population growth in China. Geogr. Res. 2013, 32, 1668–1678. [Google Scholar]
  40. Sun, H.; Huang, Z.; Xu, D.; Shi, X.; Liu, H.; Tan, L.; Ge, J. The spatial characteristics and drive mechanism of coupling relationship between urbanization and eco-environment in the Pan Yangtze River Delta. Econ. Geogr. 2017, 2, 022. [Google Scholar]
  41. Xu, C.; Wang, S.; Zhou, Y.; Wang, L.; Liu, W. A comprehensive quantitative evaluation of new sustainable urbanization level in 20 Chinese urban agglomerations. Sustainability 2016, 8, 91. [Google Scholar] [CrossRef]
  42. He, S.; Shao, X. Spatial clustering and coupling coordination of population-land-economic urbanization in Beijing-Tianjin-Hebei region. Econ. Geogr. 2018, 38, 95–102. [Google Scholar]
  43. Yang, R.; Liu, Y.; Long, H.; Qiao, L. Spatio-temporal characteristics of rural settlements and land use in the Bohai Rim of China. J. Geogr. Sci. 2015, 25, 559–572. [Google Scholar] [CrossRef] [Green Version]
  44. Cliff, A.D.; Ord, J.K. Spatial and temporal analysis: Autocorrelation in space and time. In Quantitative Geography: A British View; Pion: London, UK, 1981; pp. 127–144. [Google Scholar]
  45. Anselin, L. Local indicators of spatial association—LISA. Geogr. Anal. 1995, 27, 93–115. [Google Scholar] [CrossRef]
  46. Wang, J.; Li, X.; Christakos, G.; Liao, Y.; Zhang, T.; Gu, X.; Zheng, X. Geographical detectors-based health risk assessment and its application in the neural tube defects study of the Heshun region, China. Int. J. Geogr. Inf. Sci. 2010, 24, 107–127. [Google Scholar] [CrossRef]
  47. Wang, J.; Zhang, T.; Fu, B. A measure of spatial stratified heterogeneity. Ecol. Indic. 2016, 67, 250–256. [Google Scholar] [CrossRef] [Green Version]
  48. Cheng, M.; Lu, D.; Zhang, H. Comprehensive evaluation and the driving factors of China’s urbanization. Acta Geogr. Sin. 2009, 64, 387–398. [Google Scholar]
  49. Brückner, M. Economic growth, size of the agricultural sector, and urbanization in Africa. J. Urban Econ. 2012, 71, 26–36. [Google Scholar] [CrossRef] [Green Version]
  50. Deng, X.; Huang, J.; Rozelle, S. Growth, population and industrialization, and urban land expansion of China. J. Urban Econ. 2008, 63, 96–115. [Google Scholar] [CrossRef]
  51. Lu, Q.; Liang, F.; Bi, X.; Duffy, R.; Zhao, Z. Effects of urbanization and industrialization on agricultural land use in Shandong Peninsula of China. Ecol. Indic. 2011, 11, 1710–1714. [Google Scholar] [CrossRef] [Green Version]
  52. Yu, X.J.; Ng, C.N. Spatial and temporal dynamics of urban sprawl along two urban-rural transects: A case study of Guangzhou, China. Landsc. Urban Plan. 2007, 79, 96–109. [Google Scholar] [CrossRef]
  53. Choy, L.H.T.; Lai, Y.; Lok, W. Economic performance of industrial development on collective land in the urbanization process in China: Empirical evidence from Shenzhen. Habitat Int. 2013, 37, 184–193. [Google Scholar] [CrossRef]
  54. Chen, M.; Zhang, H.; Liu, W.; Zhang, W. The global pattern of urbanization and economic growth: Evidence from the last three decades. PLoS ONE 2014, 9, e103799. [Google Scholar] [CrossRef] [PubMed]
  55. Liu, Y.; Yang, Y.; Li, Y.; Li, J. Conversion from rural settlements and arable land under rapid urbanization in Beijing during 1985–2010. J. Rural Stud. 2017, 51, 141–150. [Google Scholar] [CrossRef]
  56. Liu, Y.; Xu, J.; Luo, H. An integrated approach to modelling the economy-society-ecology system in urbanization process. Sustainability 2014, 6, 1946–1972. [Google Scholar] [CrossRef]
  57. Zhang, Y.; Su, Z.; Li, G.; Zhuo, Y.; Xu, Z. Spatial-temporal evolution of sustainable urbanization development: A perspective of the coupling coordination development based on population, industry, and built-up land spatial agglomeration. Sustainability 2018, 10, 1766. [Google Scholar] [CrossRef]
  58. Höjer, M.; Wangel, J. Smart sustainable cities: Definition and challenges. Adv. Intell. Syst. Comput. 2014, 310, 333–349. [Google Scholar]
  59. Angelidou, M.; Psaltoglou, A.; Komninos, N.; Kakderi, C.; Tsarchopoulos, P.; Panori, A. Enhancing sustainable urban development through smart city applications. J. Sci. Technol. Policy Manag. 2017, 9, 146–169. [Google Scholar] [CrossRef]
  60. Anna, V.; Lytras, M.D.; Damiani, E.; Mathkour, H. Policy making for smart cities: Innovation and social inclusive economic growth for sustainability. J. Sci. Technol. Policy Manag. 2018, 9, 126–133. [Google Scholar]
  61. Anna, V.; Lytras, M.D. Rescaling and refocusing smart cities research: From mega cities to smart villages. J. Sci. Technol. Policy Manag. 2018, 9, 134–145. [Google Scholar]
  62. Lytras, M.D.; Visvizi, A. Who uses smart city services and what to make of it: Toward interdisciplinary smart cities research. Sustainability 2018, 10, 1998. [Google Scholar] [CrossRef]
Figure 1. The location of the Yangtze River Delta comprising the province-level administrations of Jiangsu, Zhejiang, Anhui and Shanghai (Jiangsu Province includes 13 cities of Nanjing (NJ), Xuzhou (XZ), Lianyungang (LYG), Suqian (SQ), Huaian (HA), Yancheng (YC), Yangzhou (YZ), Taizhou (TZh), Nantong (NT), Zhenjiang (ZJ), Changzhou (Czh), Wuxi (WX) and Suzhou (SZh). Anhui Province includes 16 cities of Hefei (HF), Huaibei (HB), Huainan (HN), Bozhou (BZ), Fuyang (FY), Suzhou (SZ), Bengbu (BB), Chuzhou (ChZ), Luan (LA), Maanshan (MAS), Wuhu (WH), Anqing (AQ), Tongling (TL), Chizhou (CZ), Huangshan (HS), Xuancheng (XC). Zhejiang Province includes 11 cities of Hangzhou (HZ), Huzhou (HuZ), Jiaxing (JX), Zhoushan (ZS), Shaoxing (SX), Ningbo (NB), Taizhou (TZ), Quzhou (QZ), Lishui (Lishui), Jinhua (JH) and Wenzhou (WZ)).
Sustainability 11 00822 g001
Figure 2. The levels of population urbanization, land urbanization, economy urbanization (a) and the mean values of their coupling coordination degree (b).
Sustainability 11 00822 g002
Figure 3. The spatiotemporal patterns of overall coupling coordination degrees of population, land and economy urbanization in 2001 (a), 2009 (b) and 2016 (c) (This research classified the coupling coordination degree into five types, which were unsatisfactory coupling coordination (Type I), low-level coupling coordination (Type II), medium-level coupling coordination (Type III), high-level coupling coordination (Type IV) and satisfactory coupling coordination (Type V), the same below).
Sustainability 11 00822 g003
Figure 4. The spatiotemporal patterns of D13 in 2001 (a), 2009 (b) and 2016 (c); The spatiotemporal patterns of D23 in 2001 (d), 2009 (e) and 2016 (f); The spatiotemporal patterns of D12 in 2001 (h), 2009 (i) and 2016 (j).
Sustainability 11 00822 g004
Figure 5. Moran′s I values of coupling coordination degrees of urbanization.
Sustainability 11 00822 g005
Figure 6. LISA clustering of D in (a) 2001, (b) 2009 and (c) 2016.
Sustainability 11 00822 g006
Figure 7. LISA clustering of D13 in (a) 2001, (b) 2009 and (c) 2016; LISA clustering of D23 in (d) 2001, (e) 2009 and (f) 2016; LISA clustering of D12 in (h) 2001, (i) 2009 and (j) 2016.
Sustainability 11 00822 g007
Table 1. Evaluation index systems of population, land and economy urbanization.
Criteria IndicatorsWeight
Population urbanizationProportion of urban population to the total population (%)0.0757
Urban population density (persons/km2)0.0756
Proportion of employment in the secondary and tertiary industry (%)0.0844
Number of college students per 10,000 people (person)0.0650
Collection of public books per 100 people (books, pieces)0.0617
Number of buses per 10,000 people (vehicle)0.0725
Number of sickbeds per 1000 people (sheet)0.0521
Economy urbanizationPer capita GDP (Chinese Yuan)0.0697
Proportion of the value of secondary and tertiary industry to GDP (%)0.0839
Per capita retail sales of social consumer goods (Yuan)0.0649
Land urbanizationBuilt-up areas (m2)0.0645
Per capita built-up areas (m2)0.0792
Proportion of built-up areas to urban areas (%)0.0731
Per capita urban road areas (m2)0.0776
Table 2. The impact of each indicator on coupling coordination of urbanization.
TypeYearEcoTraPopTecGov
D20010.601 ***0.277 **0.549 *0.2190.180 *
20090.622 **0.379 *0.503 **0.312 **0.422
20160.687 **0.426 ***0.418 *0.309 **0.337 *
D1220010.4110.417 *0.369 *0.173 *0.404 *
20090.300 *0.409 ***0.374 *0.194 *0.439 *
20160.315 **0.439 **0.453 **0.285 *0.308 **
D1320010.622 **0.362 *0.472 **0.228 ***0.325 **
20090.647 **0.379 **0.437 **0.201 ***0.359 **
20160.660 ***0.430 **0.421 ***0.372 *0.370 ***
D2320010.519 **0.159 *0.429 *0.207 **0.469 *
20090.523 ***0.3230.301 **0.300 **0.511 ***
20160.618 ***0.362 *0.298 **0.378 ***0.521 *
Note: ***, ** and * indicate significance at the 1%, 5% and 10% level, respectively.

