Long-Term Ground Settlements over Mined-Out Region Induced by Railway Construction and Operation

School of Civil Engineering and Transportation, South China University of Technology, Guangzhou 510641, China
*
Author to whom correspondence should be addressed.
Sustainability 2019, 11(3), 875; https://0-doi-org.brum.beds.ac.uk/10.3390/su11030875
Submission received: 20 December 2018
/
Revised: 2 February 2019
/
Accepted: 3 February 2019
/
Published: 8 February 2019
(This article belongs to the Special Issue Resilience and Sustainability of Civil Infrastructures under Extreme Loads)
Abstract
:With the rapid development of railway construction and the massive exploitation of mineral resources, many railway projects have had to cross mining areas and their caverns. However, the settlement of the ground surface may cause severe damage to human-built structures and lead to the loss of human lives. The research on ground deformation monitoring over caverns is undoubtedly important and has a guiding role in railway design. Settlement observation points were set up around the mine, establishing a ground subsidence monitoring level network that has been in operation for 11 years. The ground settlement and lateral displacement along the designed railway were studied. A finite element model was established to predict the long-term ground settlements over the mined-out region induced by designed railway embankment construction and train operation. The results show that the predicted ground settlement induced by railway embankment construction is smaller than the ground settlement induced by the mined-out cavity. One train pass-by has an insignificant impact on the safety of train operation. However, when the number of train pass-bys increases to 10,000,000 times and 20,000,000 times, the cumulative deformations of the ground at different depths are quite large, which may affect the safety of the railway operation. Thus, it is necessary to deal with settlement issues when designing railway construction.
1. Introduction
In China, railway is an important national infrastructure and a popular means of transportation, which plays a key role in China’s comprehensive transportation system. China has a vast territory, a large population, and an uneven distribution of resources. Therefore, economical and fast railways generally have greater advantages and become a widely used mode of transportation. The same thing is happening around the world. The reliable, efficient, safe, and environmentally sound inter-urban long distance rail freight is needed to support economic growth and maintain the quality of life [1].
However, there are many problems in major countries related to railways crossing mineral caves. In China, the line selection principle of railway engineering above the mined-out region is mainly to avoid. Even though the railway needs to cross the mining areas, it should also retain a certain width of safe pillars to ensure the safety of railway operation. In recent years, with the rapid development of railway construction and the massive exploitation of mineral resources, many railway projects have to cross the mining area and its cavern. The original survey design specifications and related manuals cannot meet the requirements of the design standards for the evaluation and treatment of the cavern. The settlement of the ground surface, especially when it occurs in a rapid and differential manner, may cause severe damage to human-built structures and the loss of human lives [2]. Therefore, the research on long-term ground settlements over mined-out regions has undoubtedly played an important guiding role in railway designs.
Salt mine subsidence is more likely to be manifested as ground collapse, cracking, squirting, and surface subsidence, which makes predictions very difficult [3,4]. In order to mine salt mines more effectively and reduce the damage and loss caused by ground settlement, many scholars have done relevant research regarding the establishment of a salt mine subsidence evaluation system in recent decades [5,6,7]. Most of these studies focus on salt mine water-soluble mining, a summarization of accident causes, determination of reasonable roof span evaluation methods, the establishment of relevant mechanical models based on the stratigraphic characteristics of salt mines, modification and improvement of probabilistic integration methods in salt mine water-soluble mining, and the prediction of water-soluble mining surface failure and subsidence caused by various mathematical systems and computer methods [8,9,10,11,12].
Salt mine mining subsidence prediction is a project that is closely related to practical experience. There are many influencing factors, and each influencing factor needs to accumulate a large amount of field experiences [13,14]. There have been many research results in the summary of the scene accidents of surface subsidence in salt mining areas. For example, Cai and Li [15] obtained the rock stratum and surface movement after actual observation and theoretical analysis according to the surface collapse of the Yingcheng salt mine; the general law presented in time and space. Yu et al. [16] carried out the roadway deformation measurement to observe and analyze the ground trend of change after mining in the Qiaohou Salt Mine in Yunnan. Wang et al. [17] used the engineering geological evaluation method to predict and evaluate the surface subsidence in view of the geological conditions and mining characteristics of the Jintan Salt Mine in Jiangsu Province of China.
The evaluation of the ground and building foundation deformation and stability is a very complicated problem. It is difficult to fully reflect the various factors affecting the deformation and stability by using on-site monitoring, statistical analysis, and other theoretical methods. Numerical analysis can take all the influencing factors into consideration, which saves time and effort, as well as money. Therefore, using numerical analysis to analyze the ground and building foundation deformation and stability over mined-out regions becomes an effective and applicable method. In the late 1990s, Yao [18] successively used the boundary element method and the finite element method to study the stability of the foundation over the mined-out regions, and then, the numerical method was widely used in the evaluation of the stability. A two-dimensional numerical model was used to simulate the effects on surface subsidence due to the discontinuity of overly hard rock formations of longwall mining. Diaz-Fernandez used the influence function to automatically predict the surface subsidence [19]. Alexander [20] proposed that geological structures (such as fault location and joint orientation) play an extremely important role in affecting the surface subsidence over the mined-out regions.
Fan and Li [21] simulated the water-soluble mining subsidence of a salt rock mine by finite element analysis software, and revealed the law of water-soil mining subsidence, and analyzed the ground deformation under the action of a multi-solution cavity. The simulation results showed that the internal water pressure played a controlling role for the stability of the cavity. Increasing the internal water pressure can support the roof of the cavity. Liu et al. [22] used the ADINA nonlinear finite element program to simulate the stability of the thin-layer salt rock water-soluble cavity. The effects of the cavity span, height, salt angle, and cavity geometry on the stability of the cavity were analyzed. Li [23] calculated the influence degree of cavity stability on surface subsidence through engineering examples, and summarized the degree of surface subsidence caused by the instability or even collapse of the cavity. The boundary element method is used to simulate and analyze the stability of the cavity in the Yipinglang salt mine in Yunnan by Yu et al. [24]. According to the difference in the lateral pressure coefficient, different cavity modes should be selected. Ren et al. [25] used the cusp catastrophe theory to study the critical conditions of the instability of the pillars in the Yanyan well group, and analyzed the release mechanism of the column’s collapse instability.
The prediction of surface settlement over the mined-out regions can also be predicted by fuzzy mathematics. Li et al. [26] used the fuzzy mathematics to analyze the comprehensive influence matrix of various factors of salt mining. However, a large amount of actual observation data is required in the prediction process. As for the mining depth of minerals, due to the restriction of production conditions and technical factors at that time, the mining depth is generally not more than 500 m, and few minerals can reach 1000 m, as shown in Table 1. Moreover, the study of railway crossing mine is rare.
Recently, a railway was designed inevitably to cross a mine area. The construction of this railway plays an important role in improving the regional railway network structure, improving the radiation capacity of the railway network, improving the inter-city transport capacity of the Pearl River Delta, and optimizing the transport organization. It also develops the railway system as a ring junction pattern with goods outside and passengers inside, and realizes the separate operation of passenger and cargo lines. It has the advantage of greatly improving the line capacity, and solving the cross-interference problem between passenger and cargo trains. In order to obtain sufficient monitoring data to ensure the safety of railway embankment construction, the settlement observation was set up on the ground over the nitrate mine, and the ground subsidence monitoring level network was established for 11 years to study the ground settlement and lateral displacement along the designed railway. A finite element model was established to predict the long-term ground settlements over the mined-out region induced by railway embankment construction and train operation. The safety of the railway construction was comprehensively evaluated to explore the feasibility of railway construction over the mined-out region.
2. Statement of the Problem
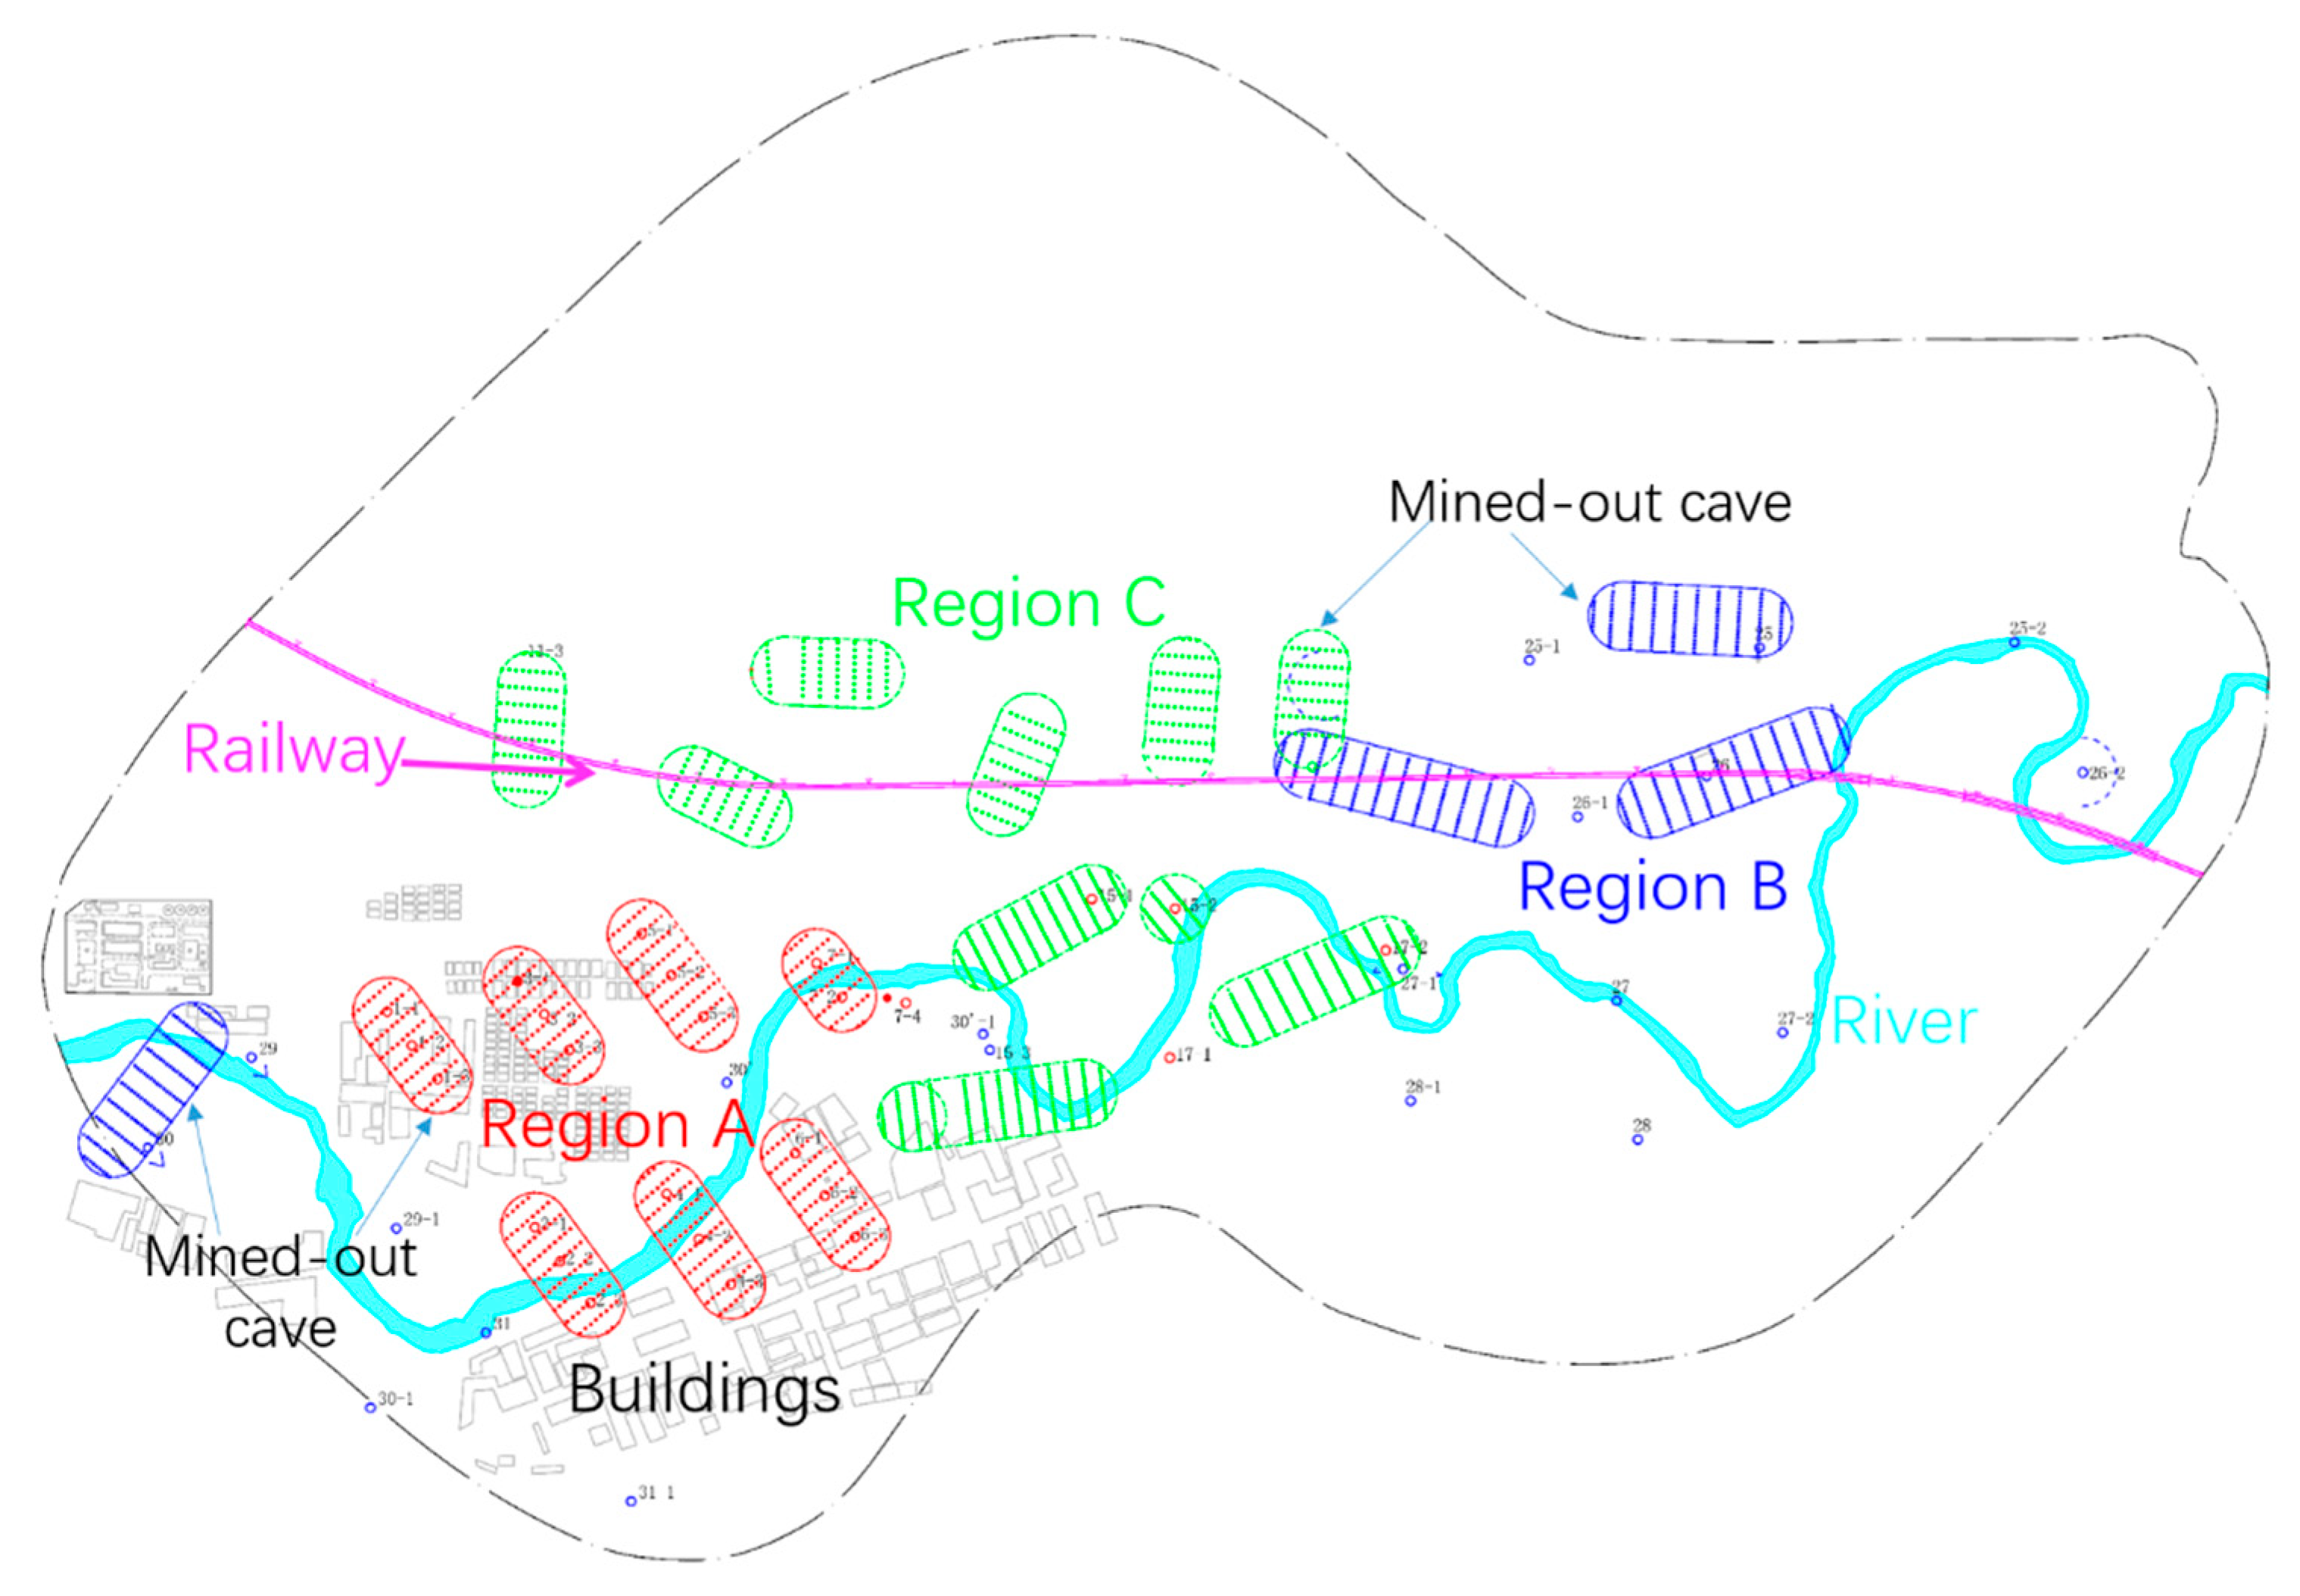
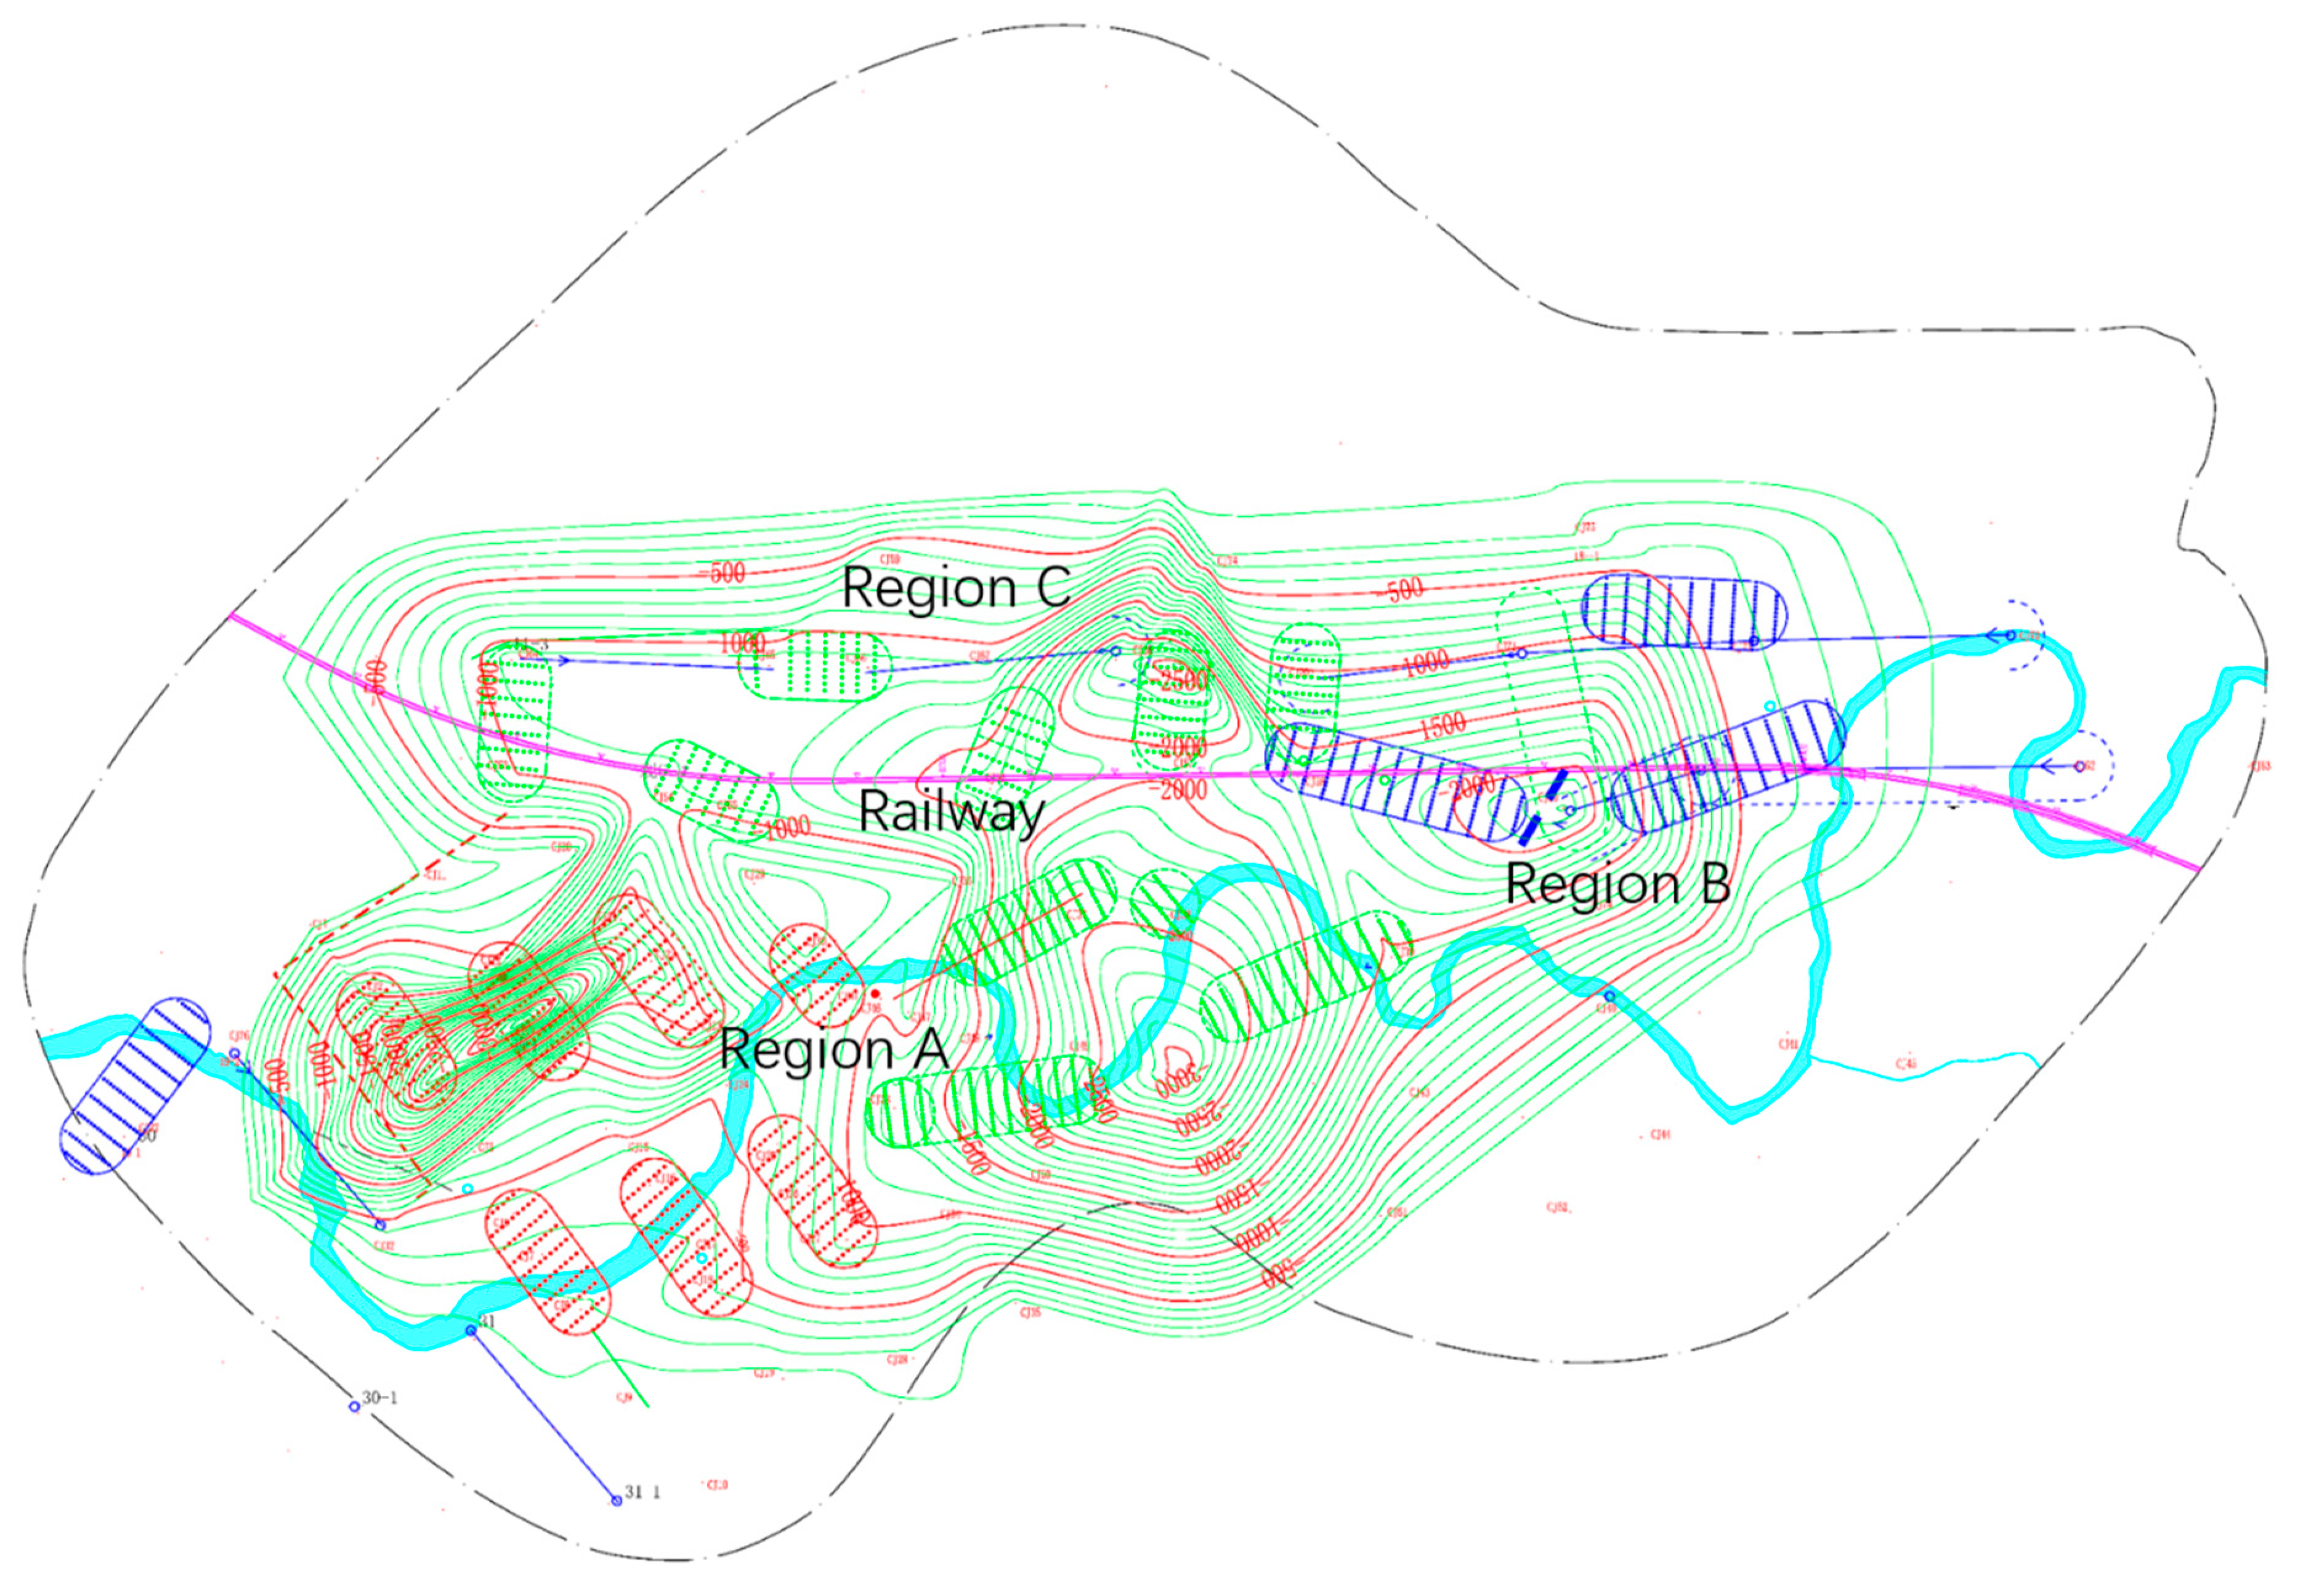
The Guangzhou Railway Northeast Line Project is located in the Pearl River Delta region, within the Huadu District, Baiyun District, Luogang District. Some part of the designed railway with the distance of 2400 m is inevitable to cross a mine area, which is shown in Figure 1. The Nitrate Mine is located in the northern part of Guangzhou city with an area of 46.86 km2, which was mined since 1994 and stopped in 2017. The products of the mine are raw material brine with the depth of 500–600 m underground. The ground surface of the mining area has a river, and the terrain is relatively flat and open, and there also built some residential buildings, fish ponds, and farmlands.
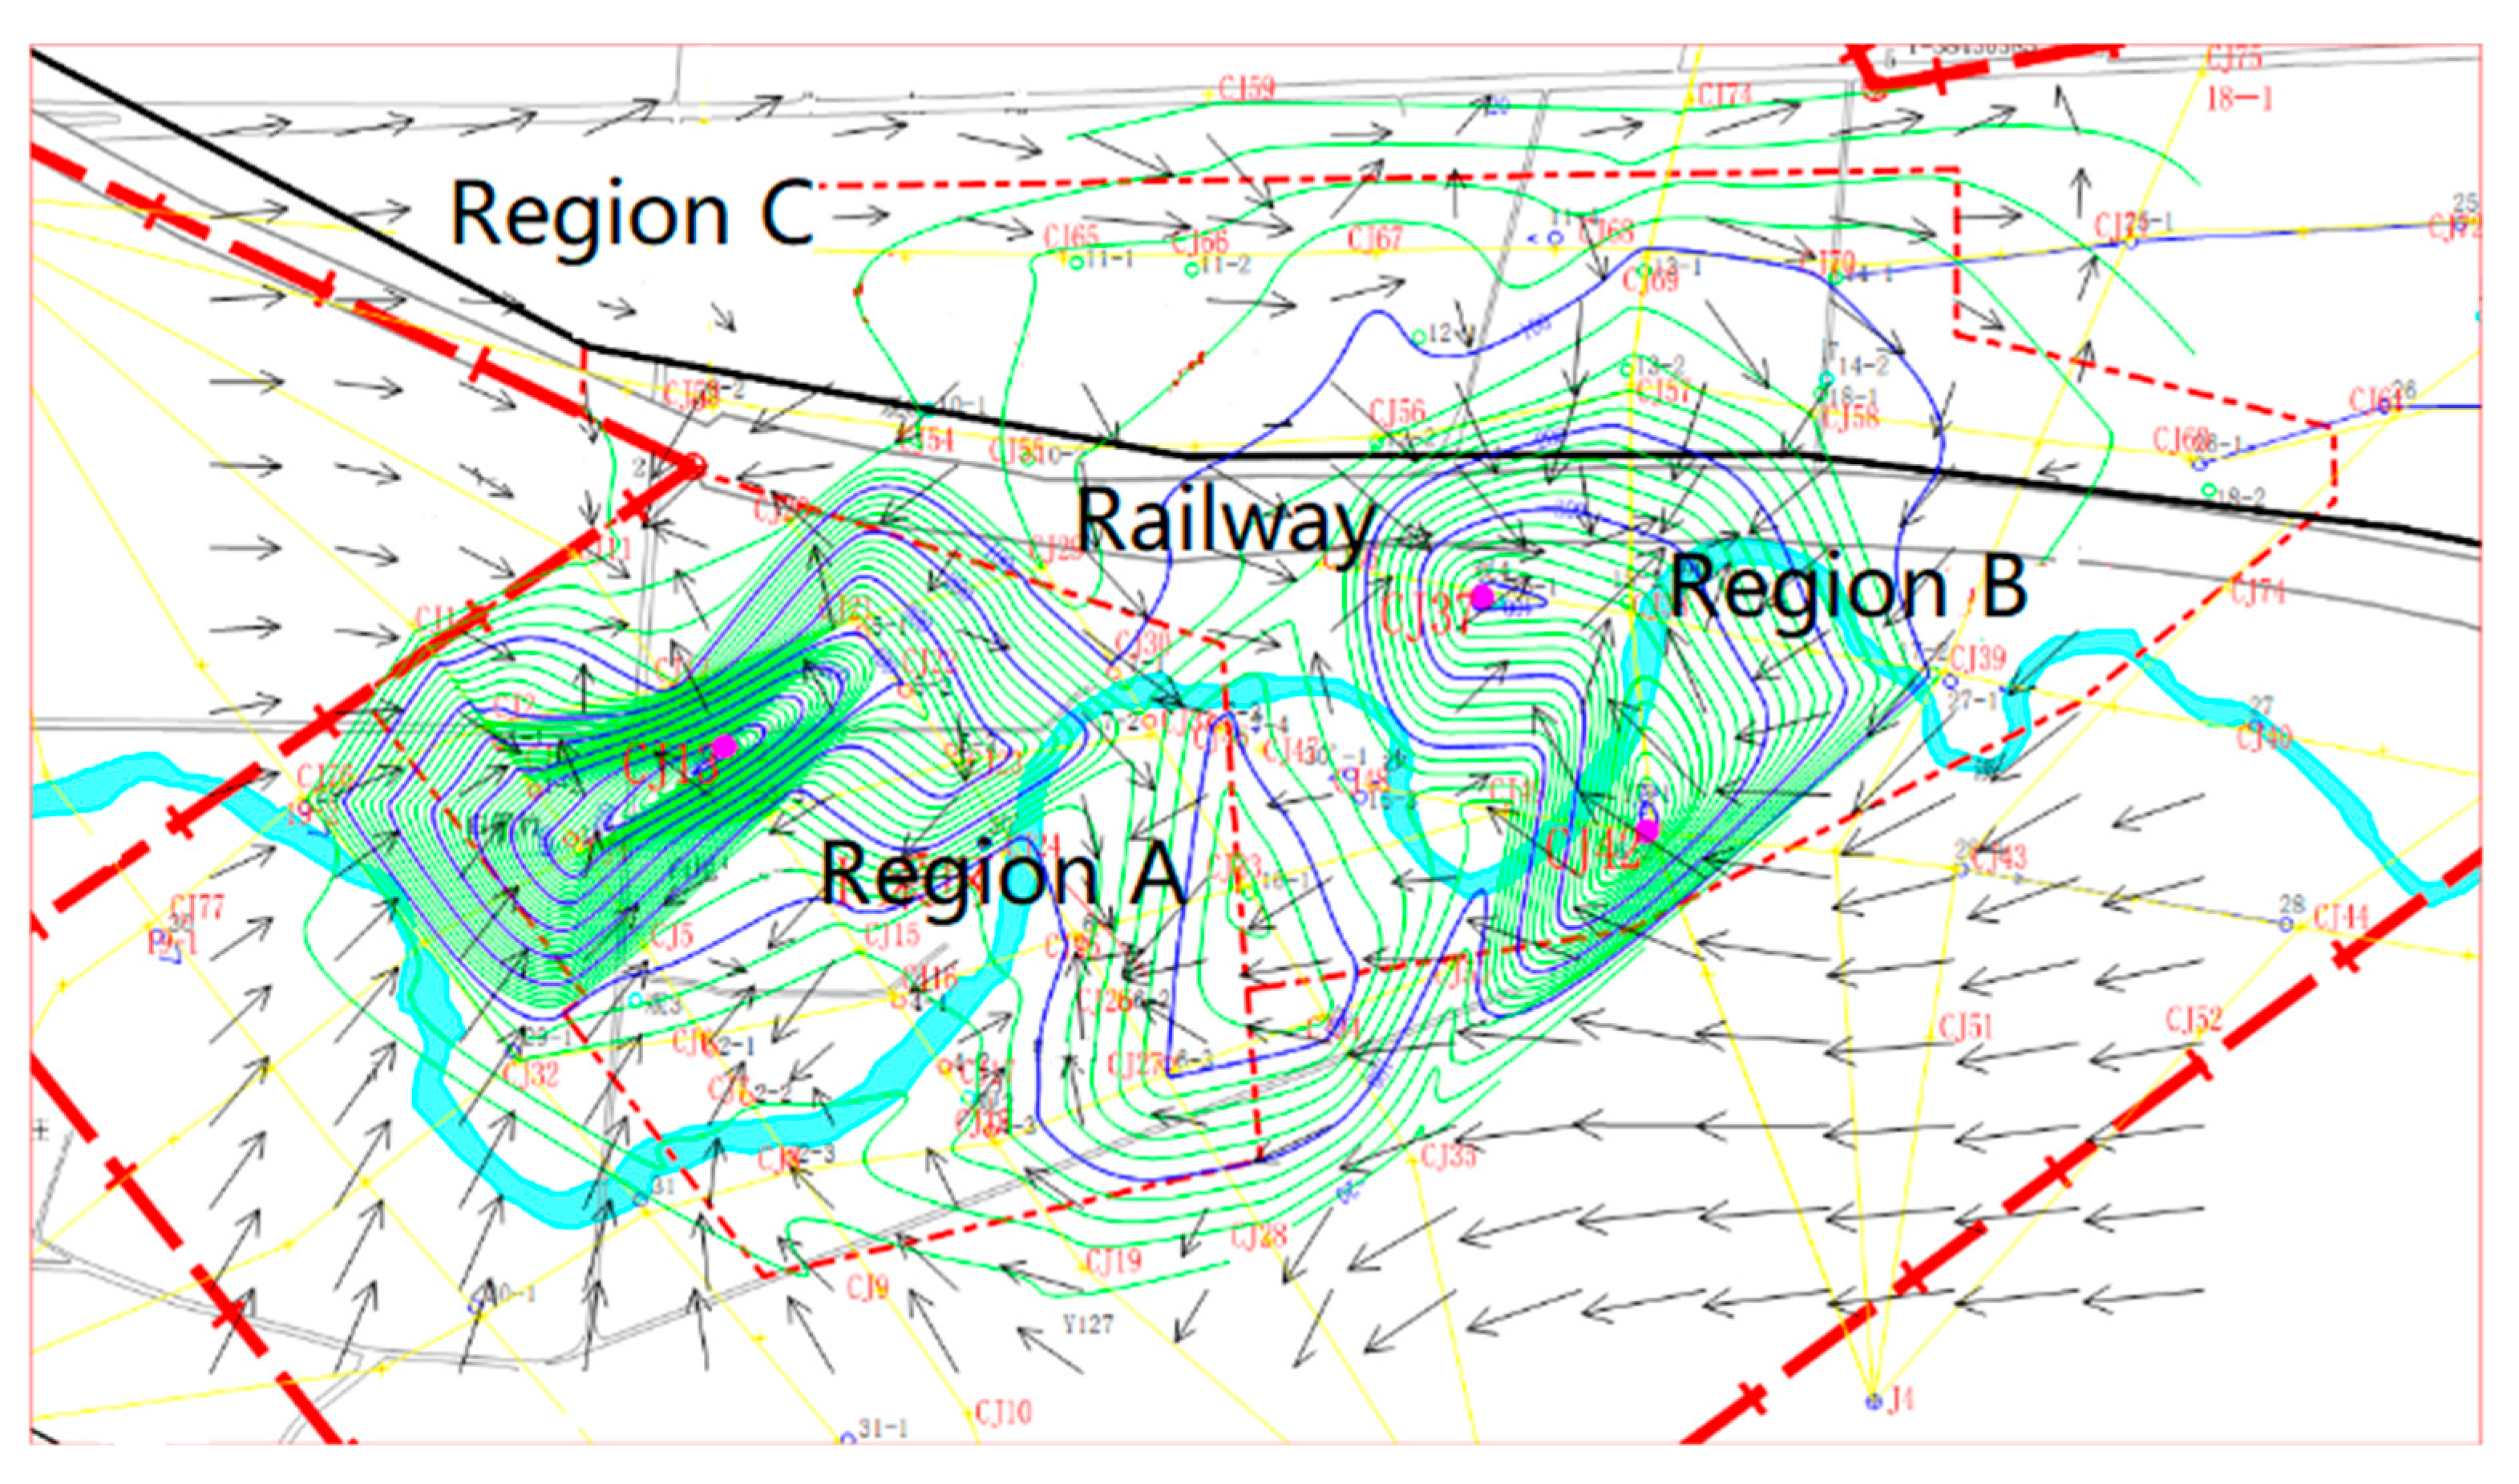
As shown in Figure 1, the mining area is divided into three regions, including region A, region B, and region C, which correspond to different mining times. The mined-out cave of three regions are represented by different colors. Region A (red) consisted of 21 wells, which went into operation in 1994. Region B (blue) opened in 1998 and consisted of 22 wells, and region C (green) had 31 wells and use began in 2013. The wells can be seen in Figure 1, which was represented by small circle of number. By the end of 2017, the mining area had consumed more than 40 million tons of stone salt ore. The mining area has formed an underground mined area of 1.066 km2, of which several cavities were distributed under and near the proposed railway. Most of the upper salt layers in this mining area are calcareous argillaceous rocks, which are easy to be softened. Under the disturbance of the water-soluble mining method, the natural balance is easy to be destroyed, which may cause ground fractures and ground subsidence as well as seriously threaten the safety of the designed railway construction and operation [27]. For the mechanized excavation of the mine, a long-term settlement observation system was established to monitor the ground deformation.
3. Ground Deformation Monitoring
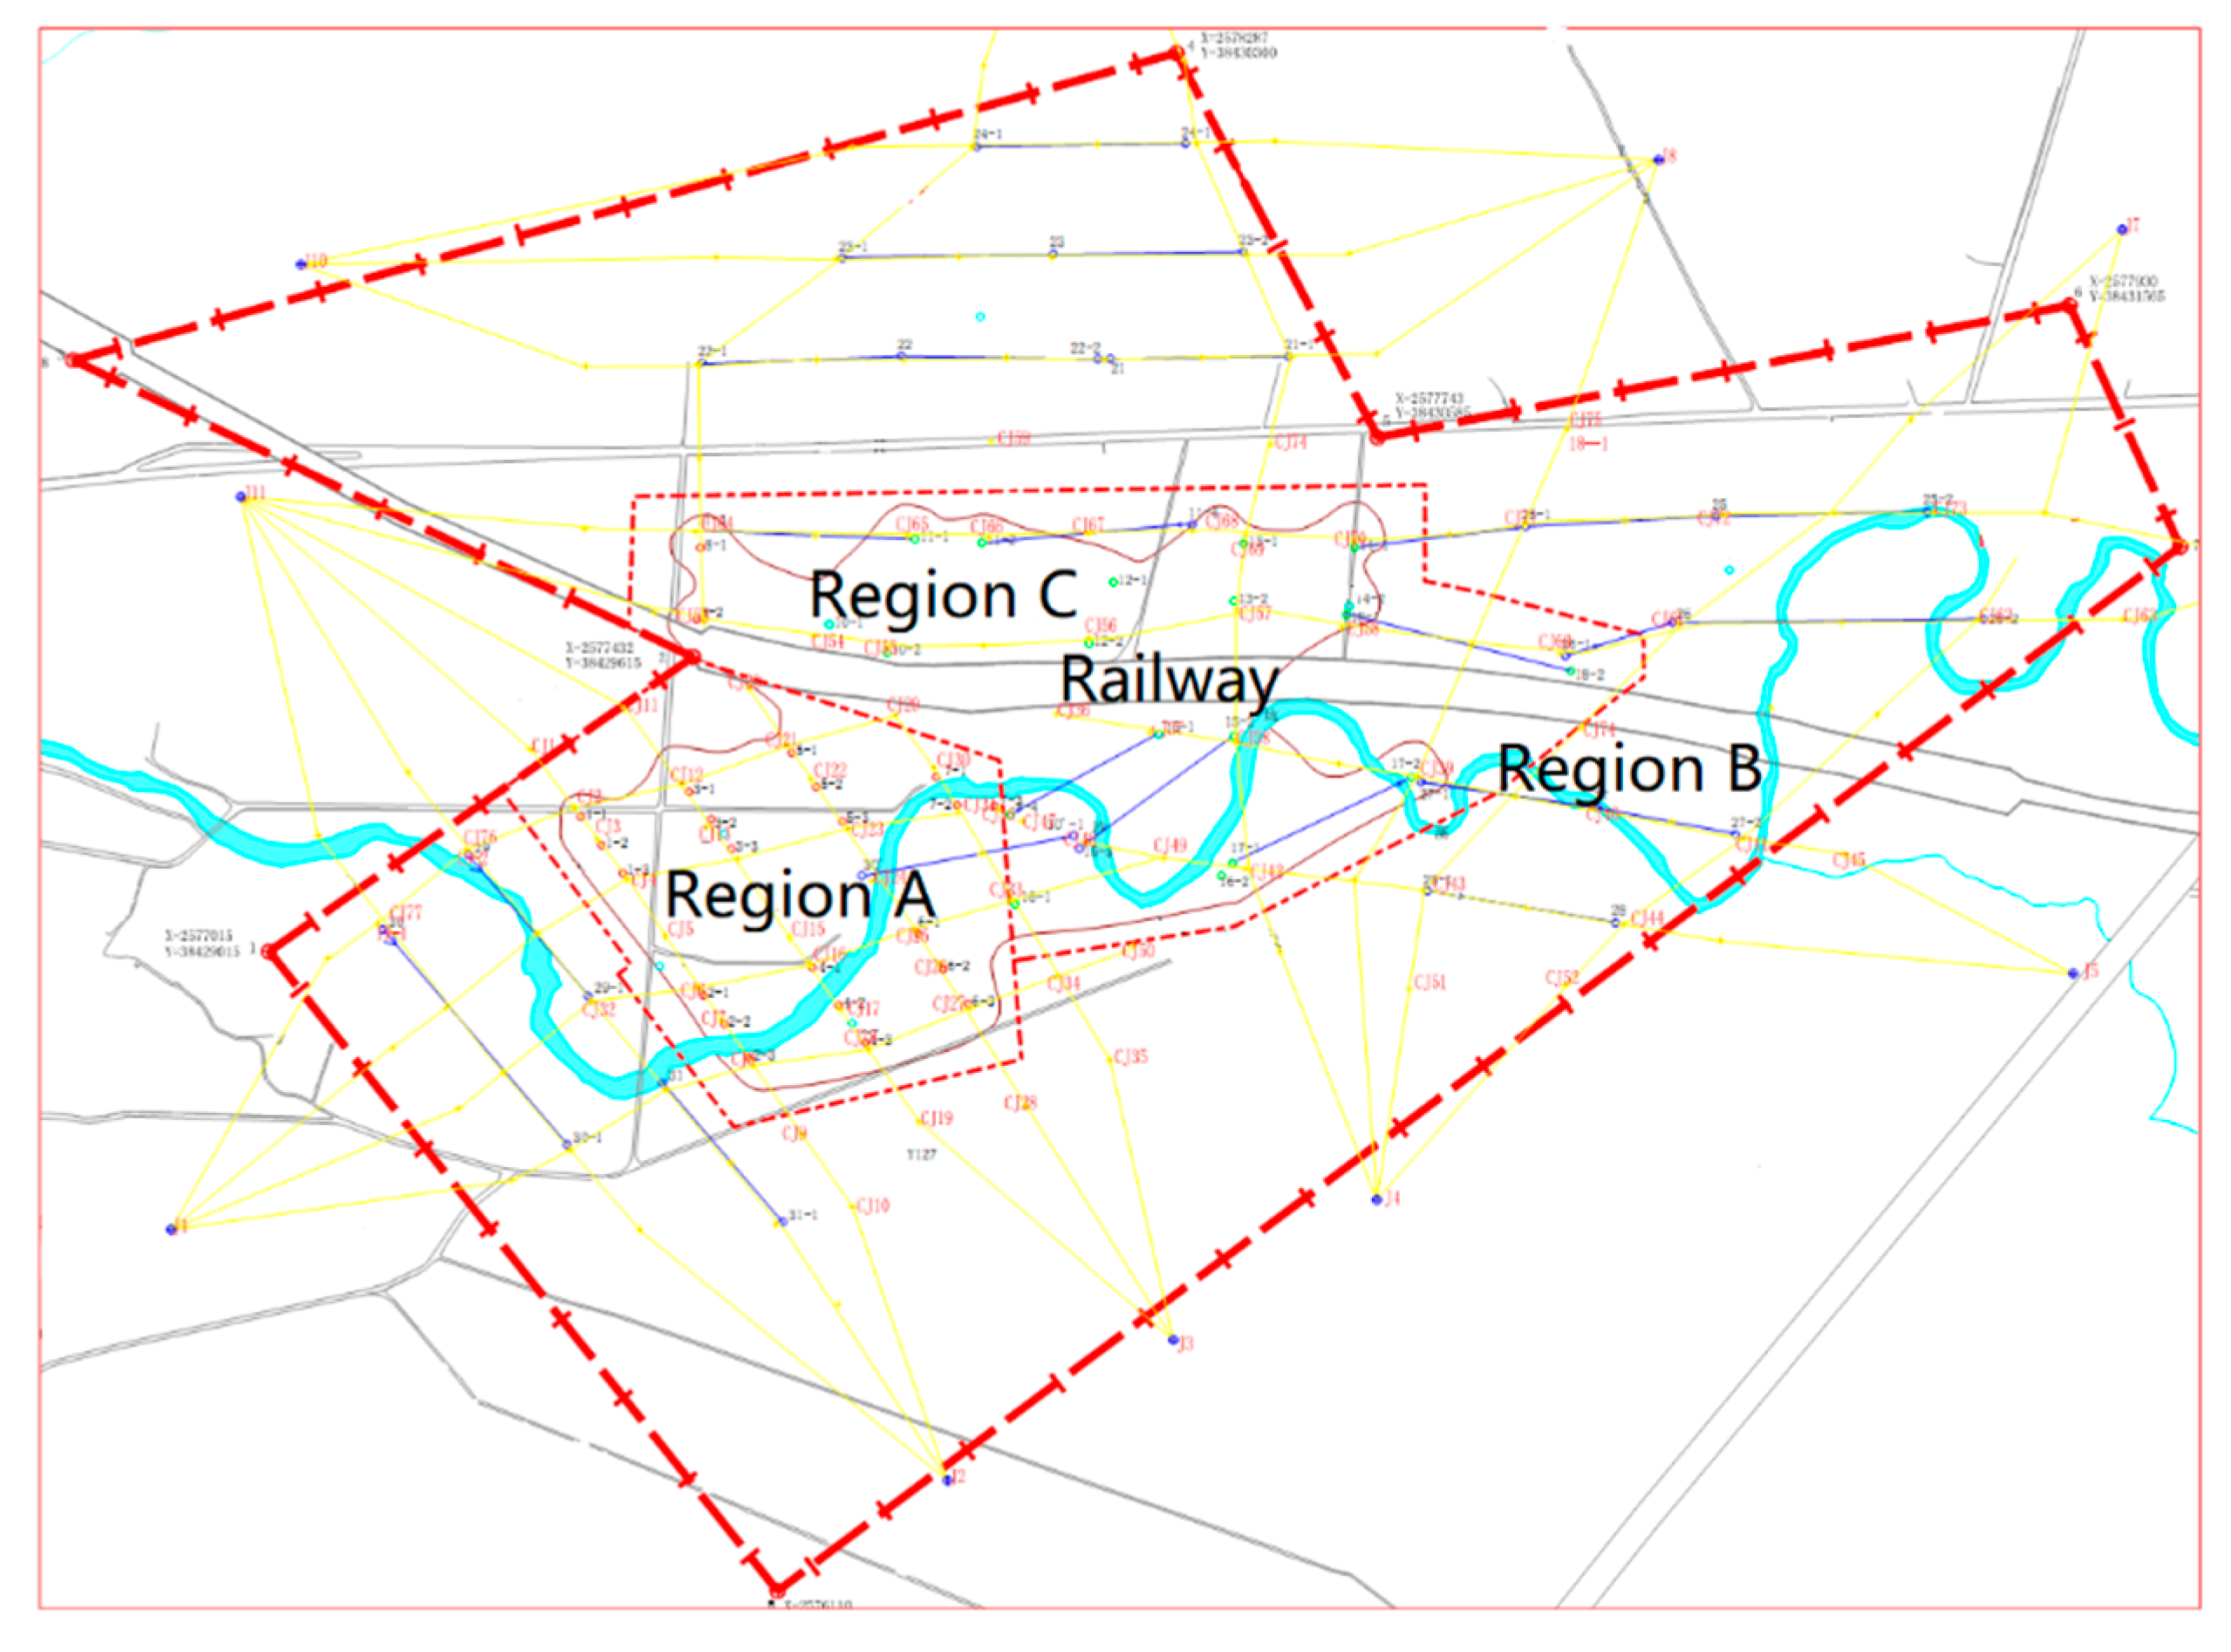
The mine has set up observation points around all the wells, and established a ground deformation monitoring level network, as shown in Figure 2. The observation points are named as CJ with numbers in the figure, and a total of 89 observation points were set. However, due to the destruction of some observation points in the construction of residential buildings, factory buildings, and agricultural production, the settlement observations could not be continuously tracked and measured, and some observation points even lost their usefulness. Through statistics on effective deformation data for 11 years from 2007 to 2017, the ground and building surface cracking, ground settlement, and lateral displacement were analyzed.
3.1. Ground Surface Cracking
Through field investigation, in some regions of the mining area, there have been unfavorable phenomena such as ground and building surface cracking. More serious is that large ground settlement has been observed the roads in the eastern part of region A. In addition, the slate joints laid in front of a six-story residential building in the south of region A were burst and sounded strongly, and some villagers felt shaking. The two adjacent residential buildings showed cracks of up to about one cm. The ground cracking pictures taken at the mine area were shown in Figure 3. Most of the cracks are one to four meters in length, with a maximum length of eight meters, and 0.5–30-mm wide.
According to the investigation, ground deformation monitoring and other relevant data, combined with the comprehensive factors such as the mining horizon, mining process, and influence range of Nitrate Mine, it is believed that the main reason for the cracking of some building surface in this area was due to the different ground settlement rates induced by the top part settlement of the cavern. However, the superposition of the natural compaction of the Quaternary soil layer is not ruled out. The range of settlement is relatively large, and the settlement rate is relatively uniform, and the influence on the ground structures is slow.
3.2. Ground Settlement
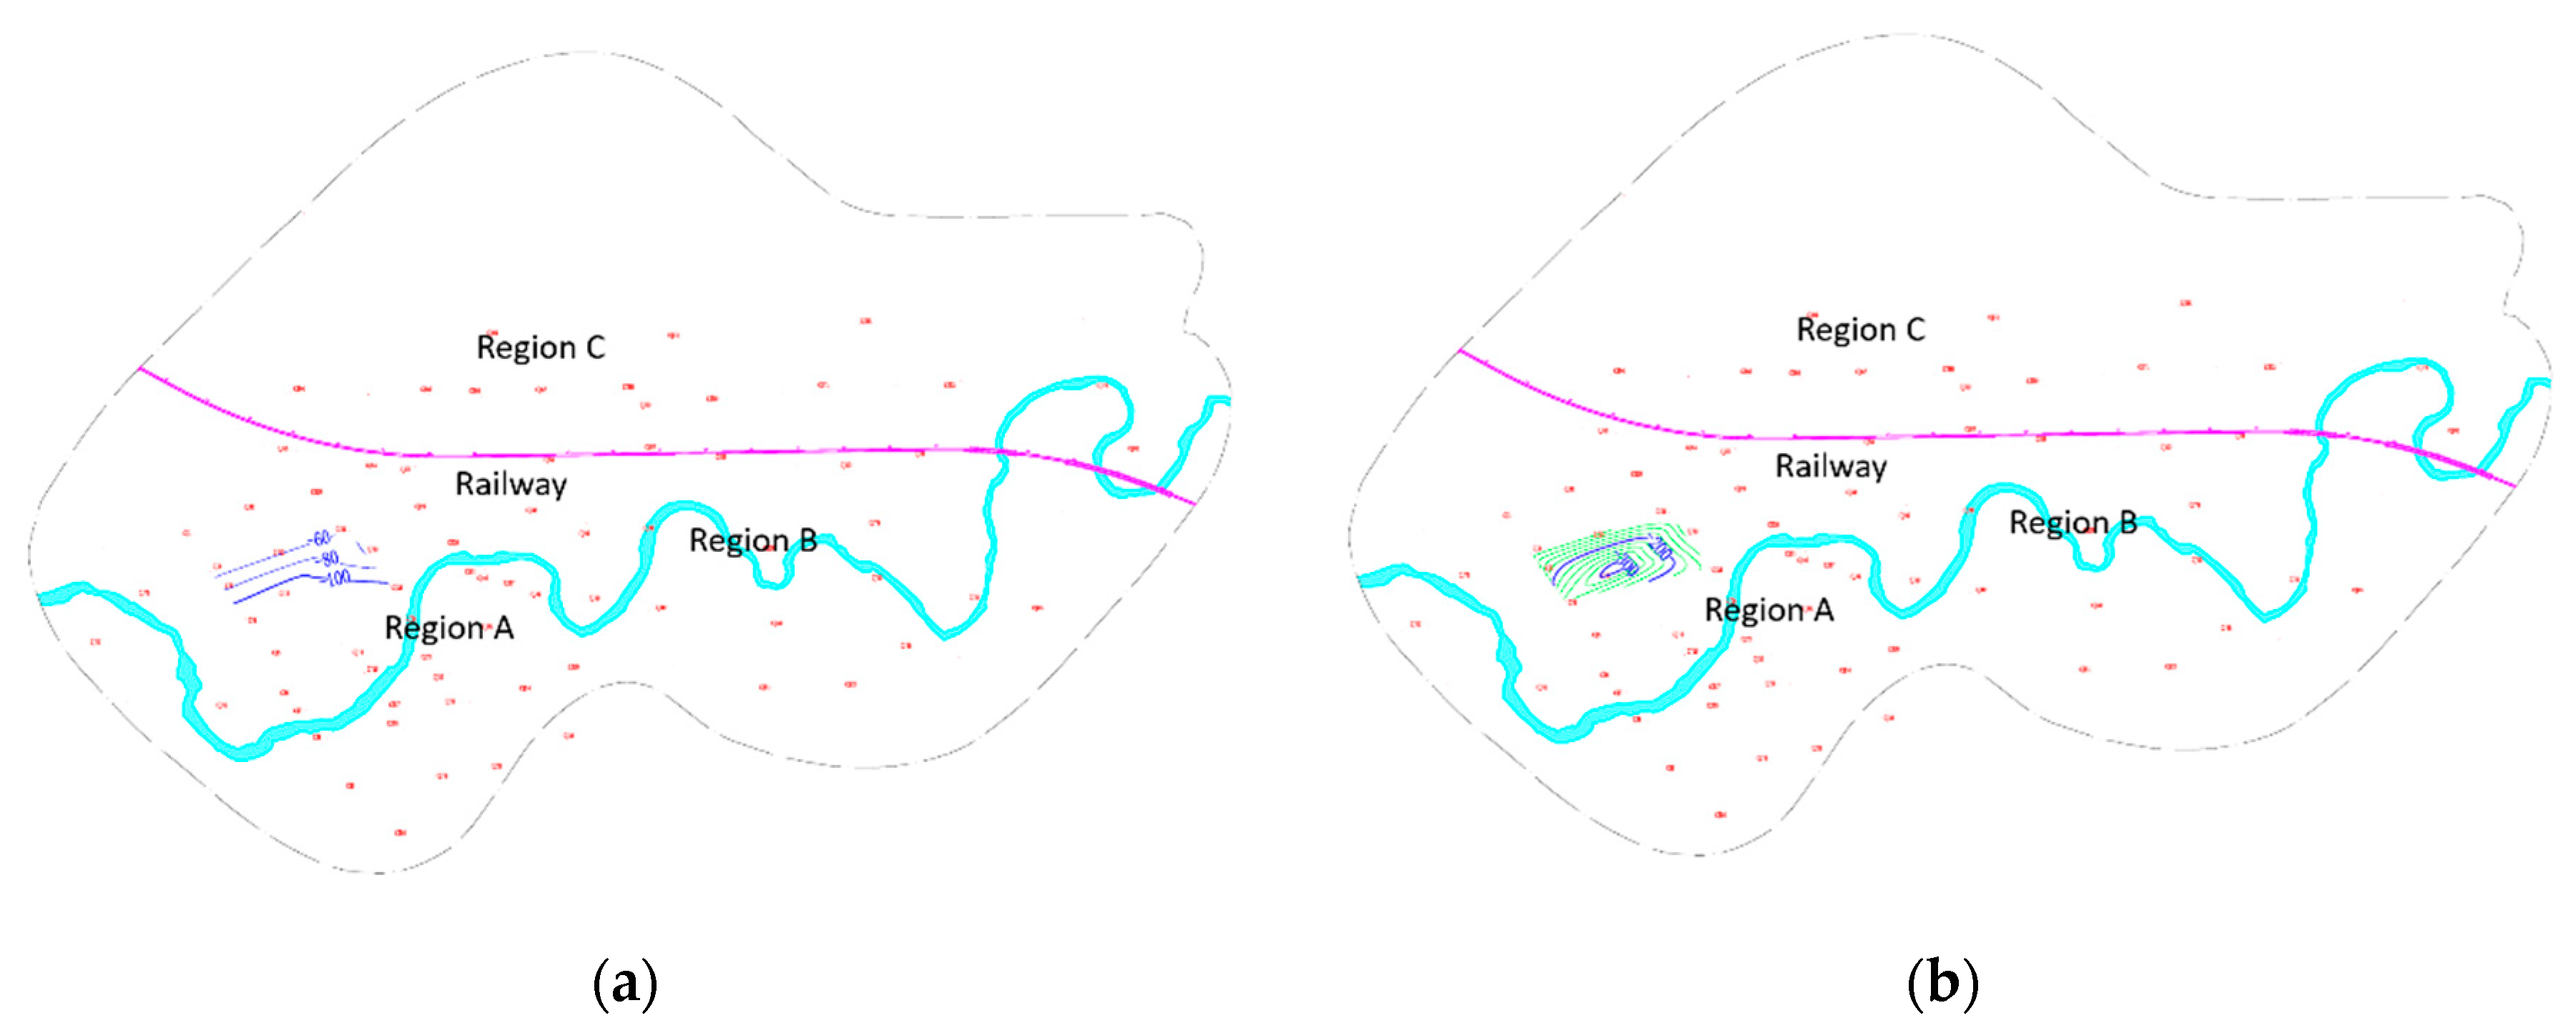
If the ground settlement analysis of the monitoring points only focuses on a single point, the actual settlement of the mining area cannot be explained. Therefore, the accumulated settlement of the monitoring points should be calculated, and the monitoring data of the regions A, B, and C will be effectively superimposed. Figure 4 shows a contour map of the ground settlement over the mines from January 2007, and the period of monitoring is 11 years. In order to avoid misunderstanding, all the time uses months to the present, in which January 2007 is the first month.
The settlement of region A was small for 12 months from the beginning of monitoring, and then accelerated subsidence began to occur, and the maximum cumulative settlement at 36 months reached 323 mm. With the mining progress of region B and region C, the settlement of region A did not stop, and the settlement continued at a large rate. The region A formed a settlement area with a length of about 600 m and a width of about 400 m with the distributed of the northeastward ellipse. The subsidence area is about 0.32 km2. The cumulative maximum settlement is more than 750 mm. The average annual settlement rate in 132 months was 37.3 mm, of which the central settlement rate of 62.7 mm per year in region A was the largest.
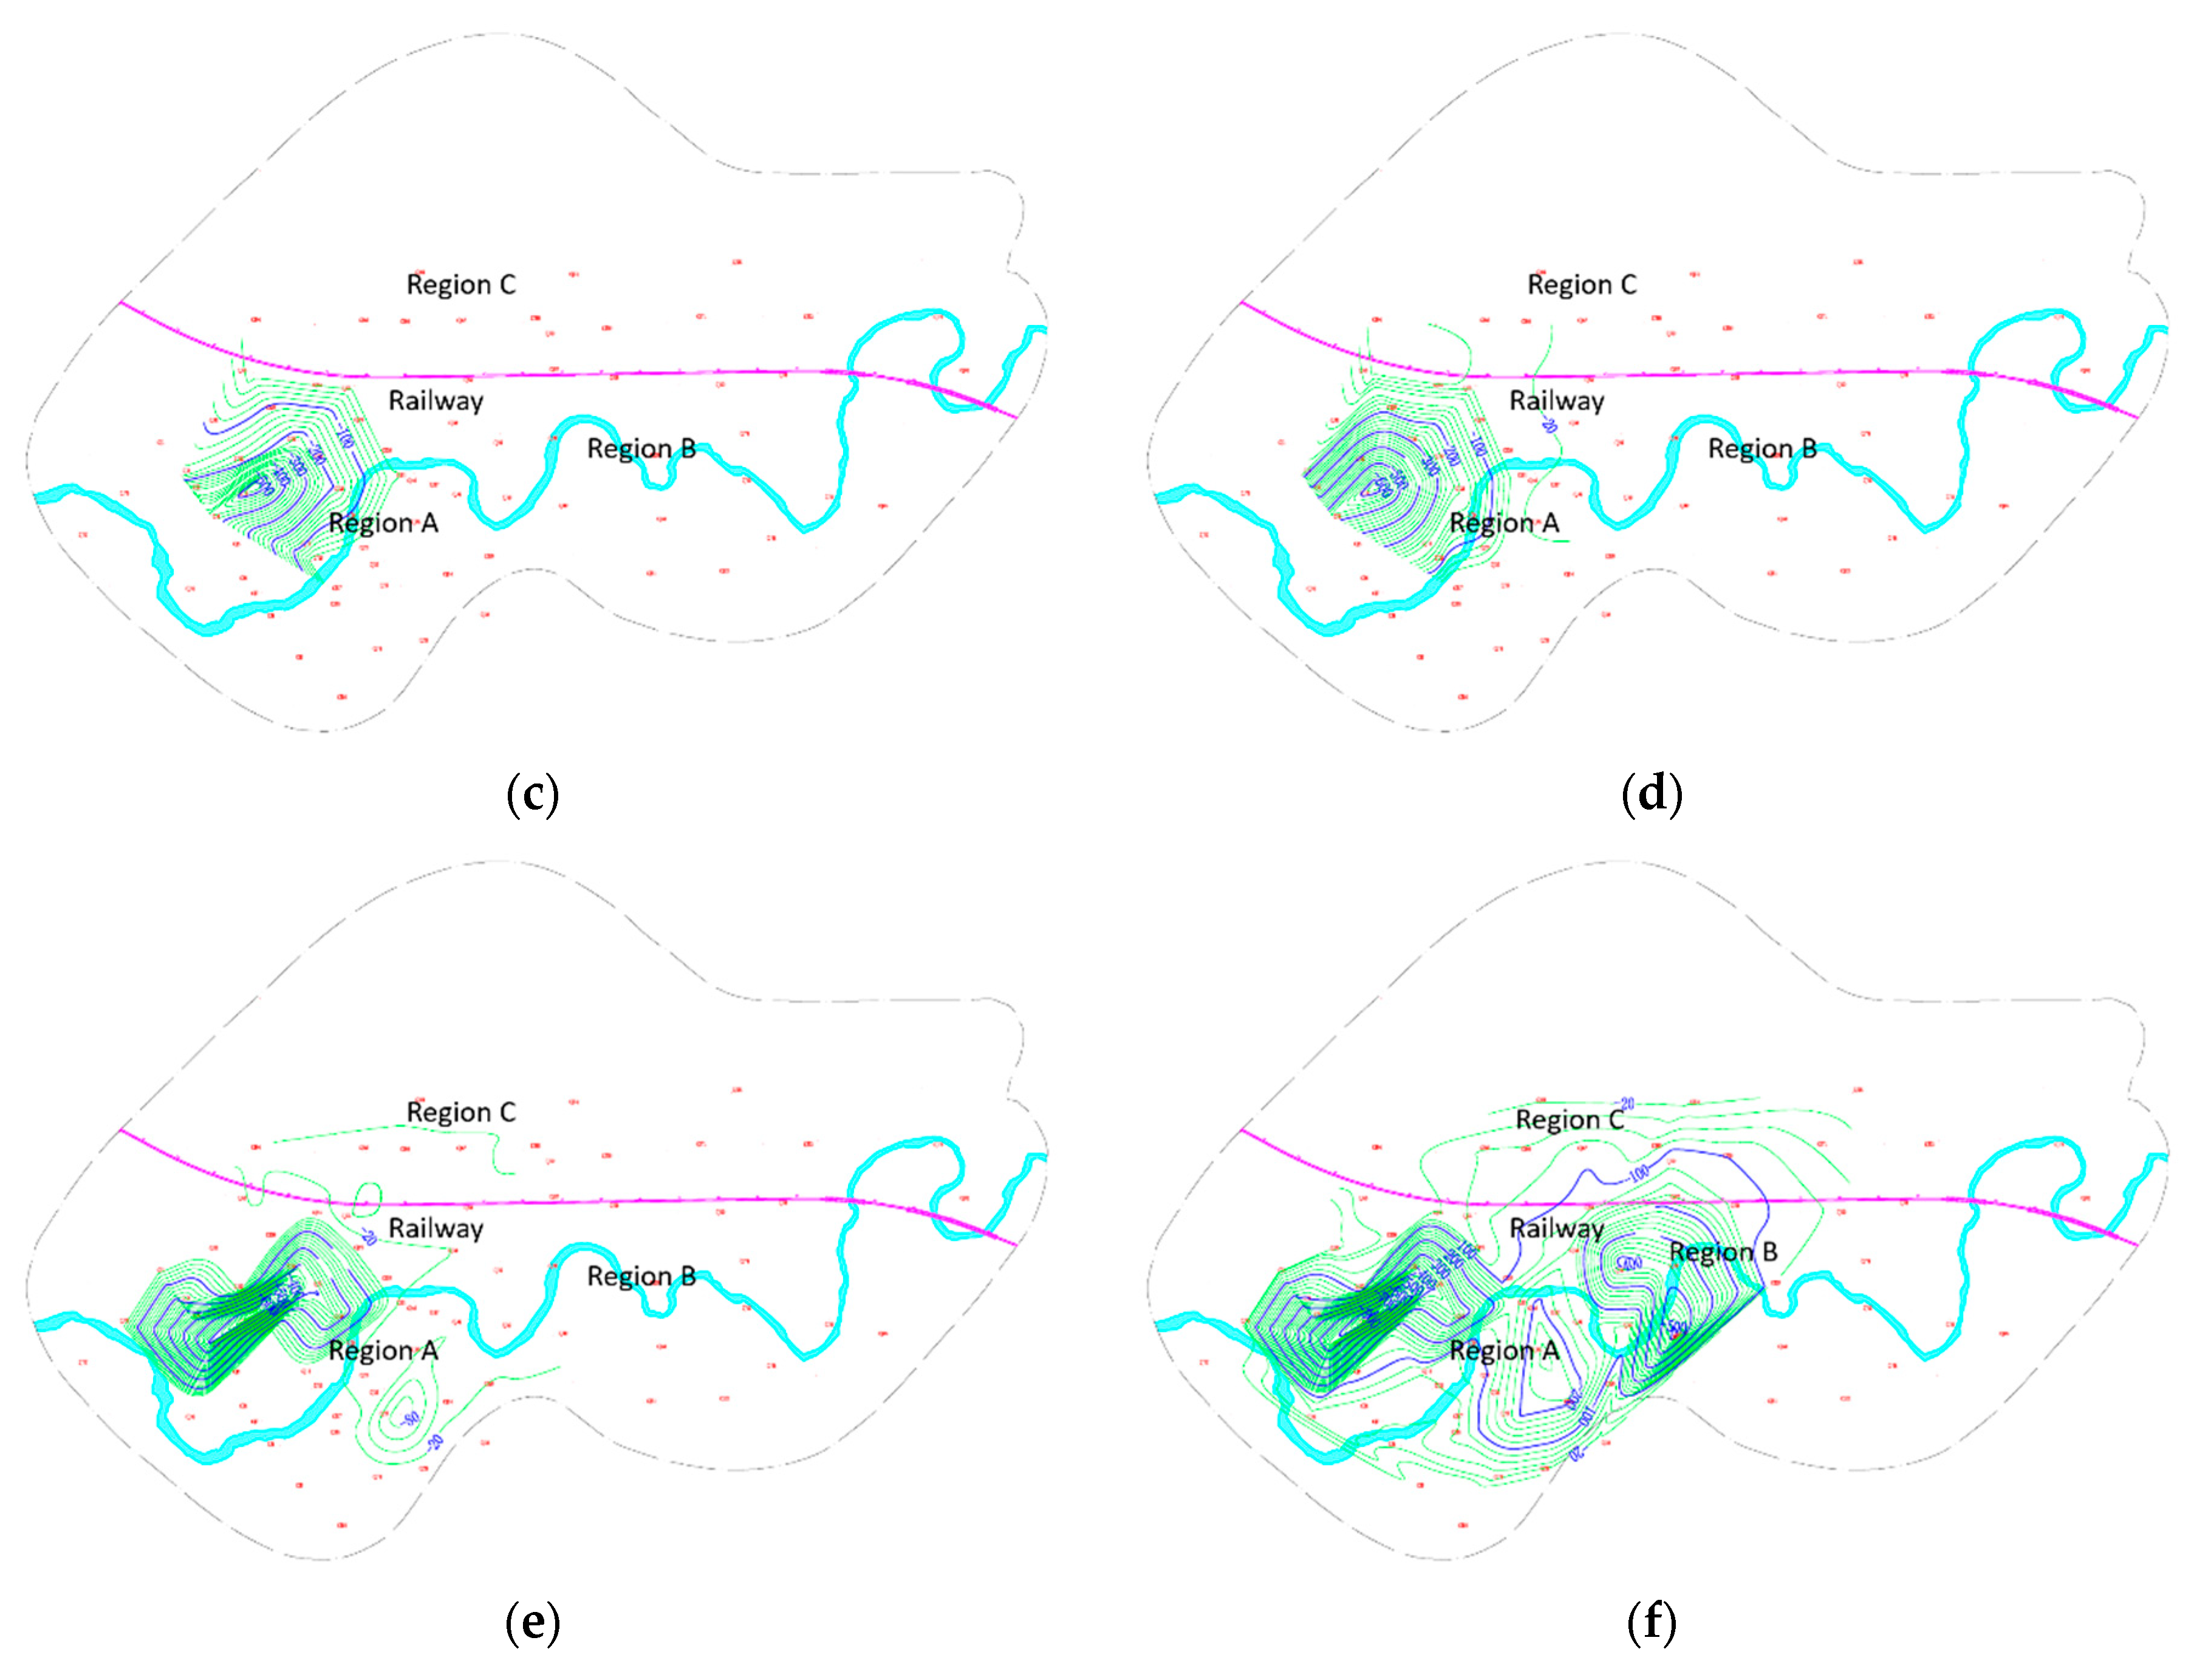
Region B was started at 48 months in Figure 4. In 108 months, the settlement rate of region B increased, and forming a settlement area with a length of about 1500 m and a width of about 700 m. The settlement area is about 1.0 km2. In 132 months, the average annual settlement rate of region B was 63.91 mm. Compared with the region A, the settlement rate of region B was significantly larger, and the settlement area gradually increased.
Mining began at region C at 108 months. At present, the settlement in region C is also being developed. It can be seen from the contour map that the settlement range is expanding, and the settlement value is increasing. The settlement of region A has always been a center of settlement, which is showed as a funnel-shaped feature. The data of the comprehensive three region settlement observation shows that the settlement rate has a significant increase after a period of mining. At present, the ground settlement rate is increasing from west to east, and the settlement area is still expanding at a relatively rapid rate. The settlement range is gradually expanding to the north and east.
After surveying the four km2 area of the mining area and surrounding areas, 36 ground settlement locations were found, mainly including ground and pavement cracking, wall cracks, etc. The ground settlement area was about 1.3 km2, which was similar to the mineral burial area. The village buildings and factories in the mining area is relatively dense. Due to the regional differences of settlement in the mining area, the building structure of the small area has not yet been significantly impacted.
Generally, the salt caverns formed by salt mining generally have the changes related to stress, the roof deformation of the cavern, roof collapse, and ground subsidence. Especially after the mined-out area is formed, the salt mine will still dissolve and soften further, and the roof may collapse. The collapsed mudstone will soften in water and it is unable to support the upper rock. The dome formed by collapse gradually rises, the bedrock surface flexes and sinks, and land subsidence occurs.
The ground subsidence caused by salt mining can be divided into three stages: the stable subsidence stage, the accelerated subsidence stage, and the collapse stage. If no large-scale underground mined-out area communication is formed after mining, the stability of the mine will be maintained for a long time after the end of mining, and the subsidence will gradually disappear. Most salt mines in the world maintain in the stable settlement stage. In the 19th century, the Winsford Meadowbank salt mines in England adopted the chamber and pillar method to extract 152 m to 213 m underground of salt with a recovery rate of 65% to 75%, and no surface subsidence appeared. In the 1930s, controlled salt extraction was adopted near Holford, Scotland, and no subsidence occurred. In China, the control measures such as brine filling and drilling sealing were adopted at the mining area of Xiangheng salt mine. After 15 years of mining, no surface subsidence has occurred. Due to the deep mining location of the salt mine in Shalongda, China, the water-soluble depth is below 2000 m underground. In addition, with good water-isolating strata and good water source pressure supply around, the ground subsidence is extremely small. This shows that the possibility of surface subsidence can be reduced or even avoided by setting a reasonable mining plan according to the geological conditions of the salt mine itself. From the monitoring data of ground subsidence in mining areas region A and region B, it can be found that the subsidence has accelerated, and there is no sign of convergence, indicating that the region A and region B mining areas are still in the phase of accelerated subsidence. By the end of 2017, the maximum settlement along the designed railway appeared near the center of the region B mining area, with the settlement of about 140 mm.
3.3. Ground Lateral Displacement
The cumulative horizontal displacement vector obtained in 132 months is shown in Figure 5. The horizontal displacement is relatively small, and the maximum horizontal displacement is less than 20 mm. It is mainly due to the horizontal movement caused by uneven settlement.
4. Ground Settlements over Mined-Out Region Induced by Railway Construction
In order to ensure the safety of railway embankment construction and operation, it is necessary to predict long-term ground settlement after construction. The numerical simulation method has unique advantages. It can simulate the influence of complex surface and special geological structures, study the surface deformation law, and save time and effort in analysis. This section uses the finite element method to construct a three-dimensional geological model to study the impact of mechanized excavation on ground and building settlements.
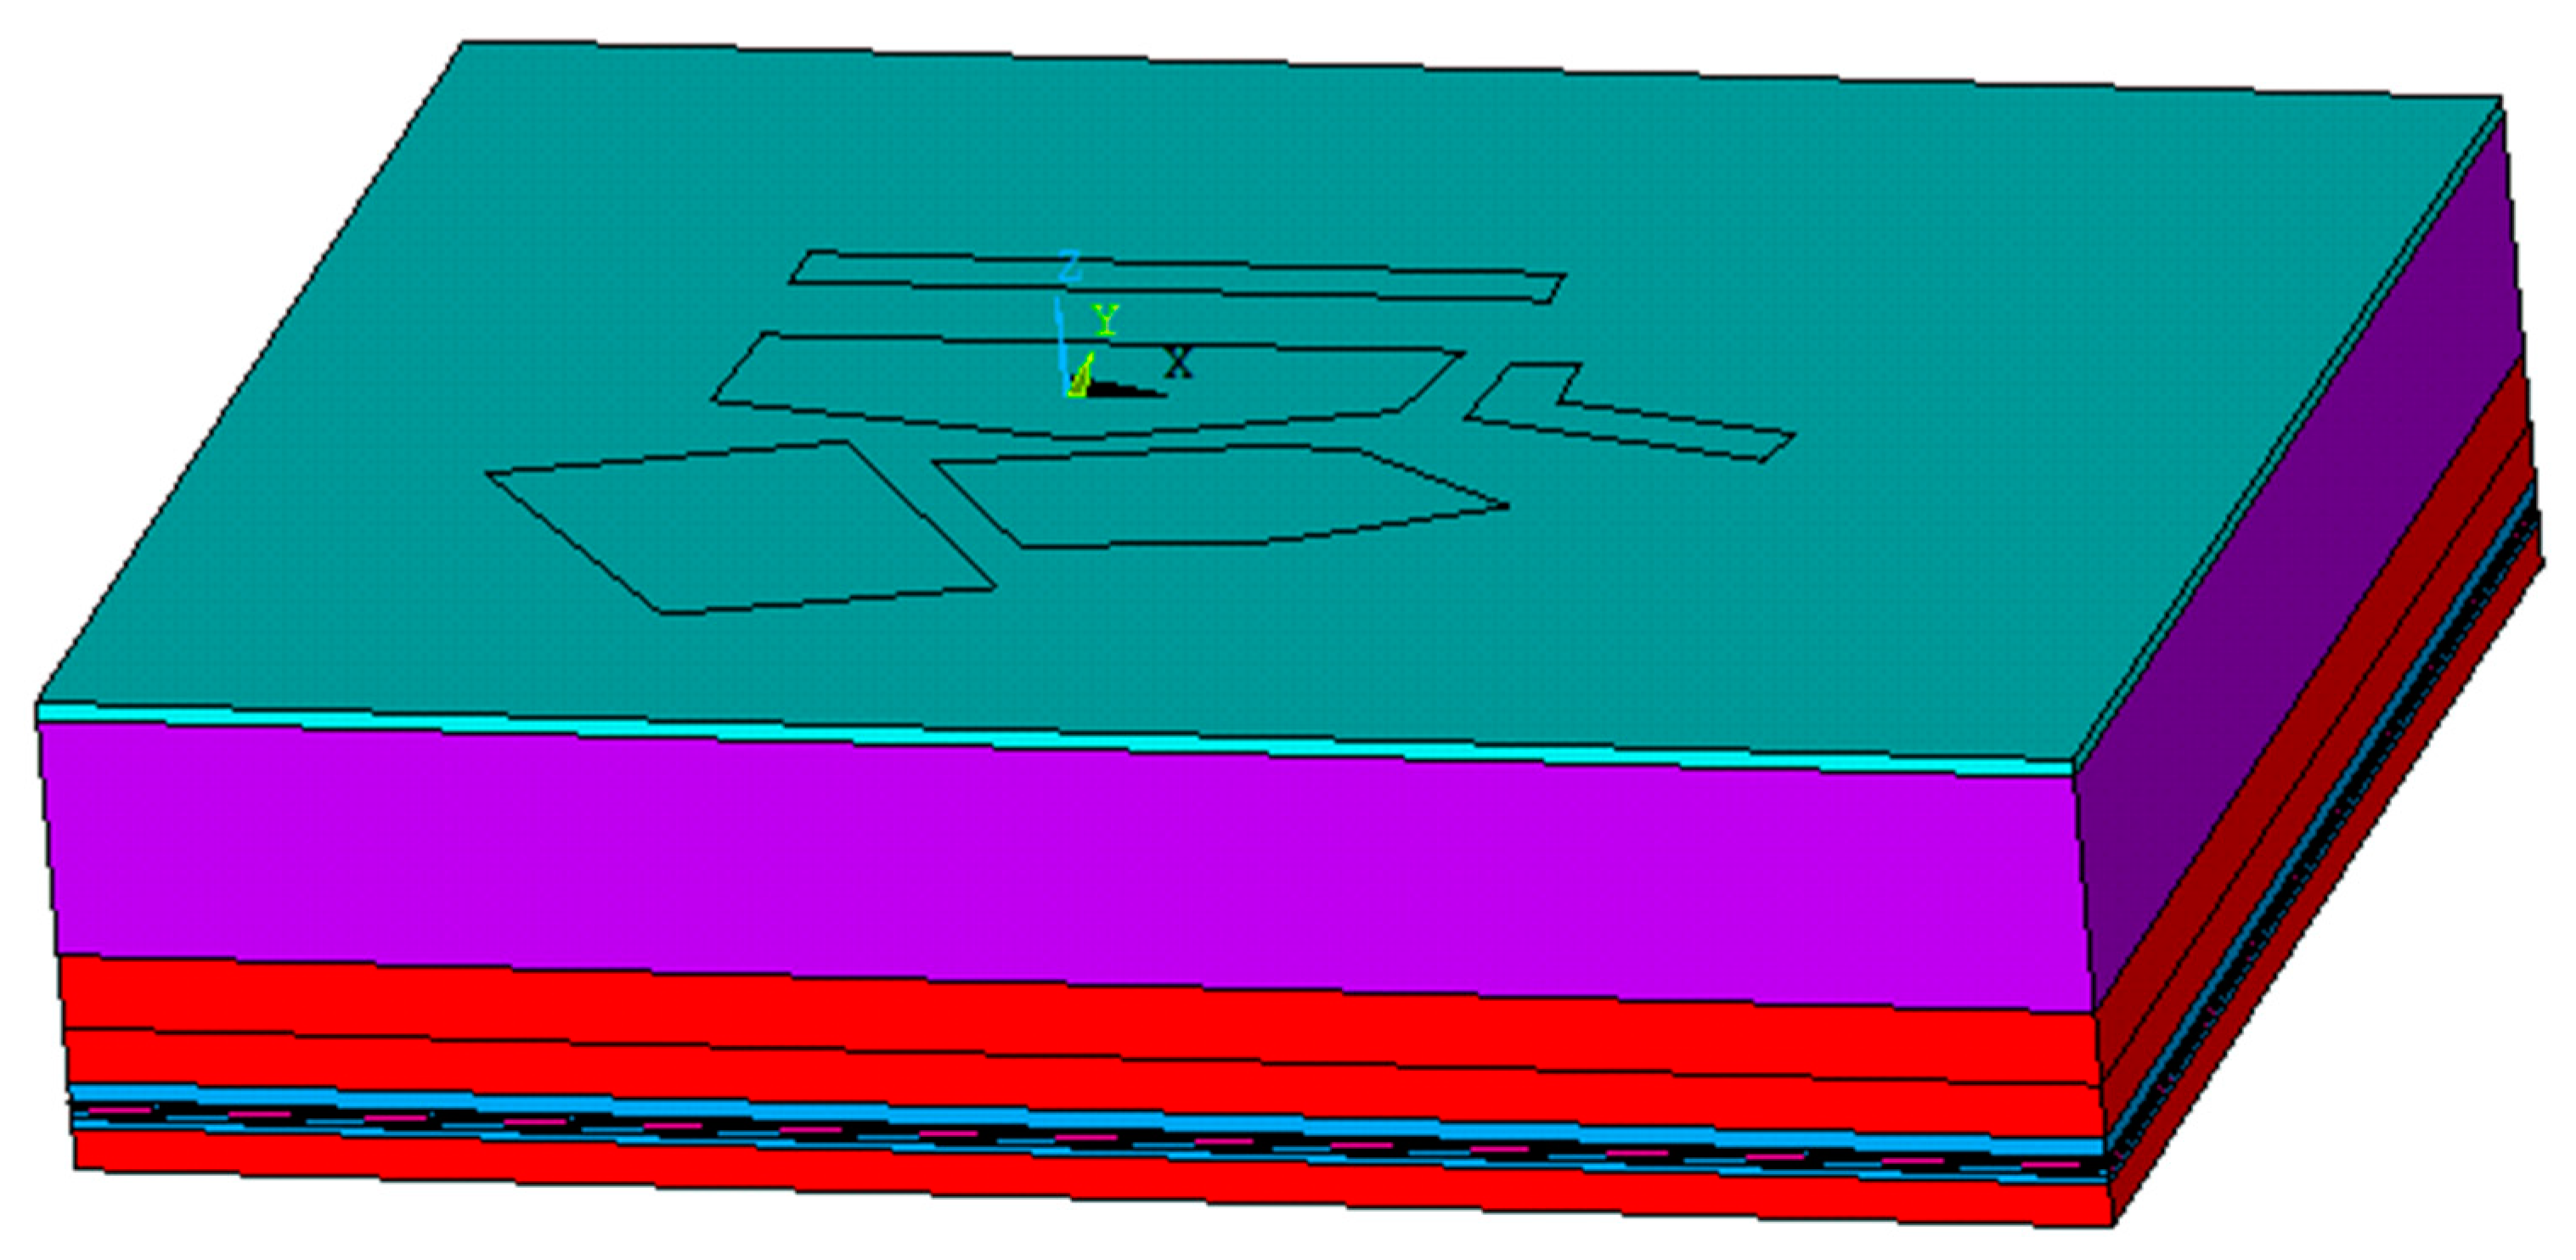
According to the actual mining situation, the model length is 2500 m, the width is 2000 m, and the depth is 600 m, as shown in Figure 6. The soil layers are divided into five types from top to bottom, including a quaternary soil layer, silty mudstone, mudstone, halite, and interlayer, as listed in Table 2. The physical and mechanical parameters are based on an engineering geological survey report, which is shown in Table 3.
The bottom of the model is fixed with constraints, and the four sides are hinged to the hinge. Soil is assumed as ideal elastoplastic model, which compliance with the Mohr–Coulomb failure criterion.
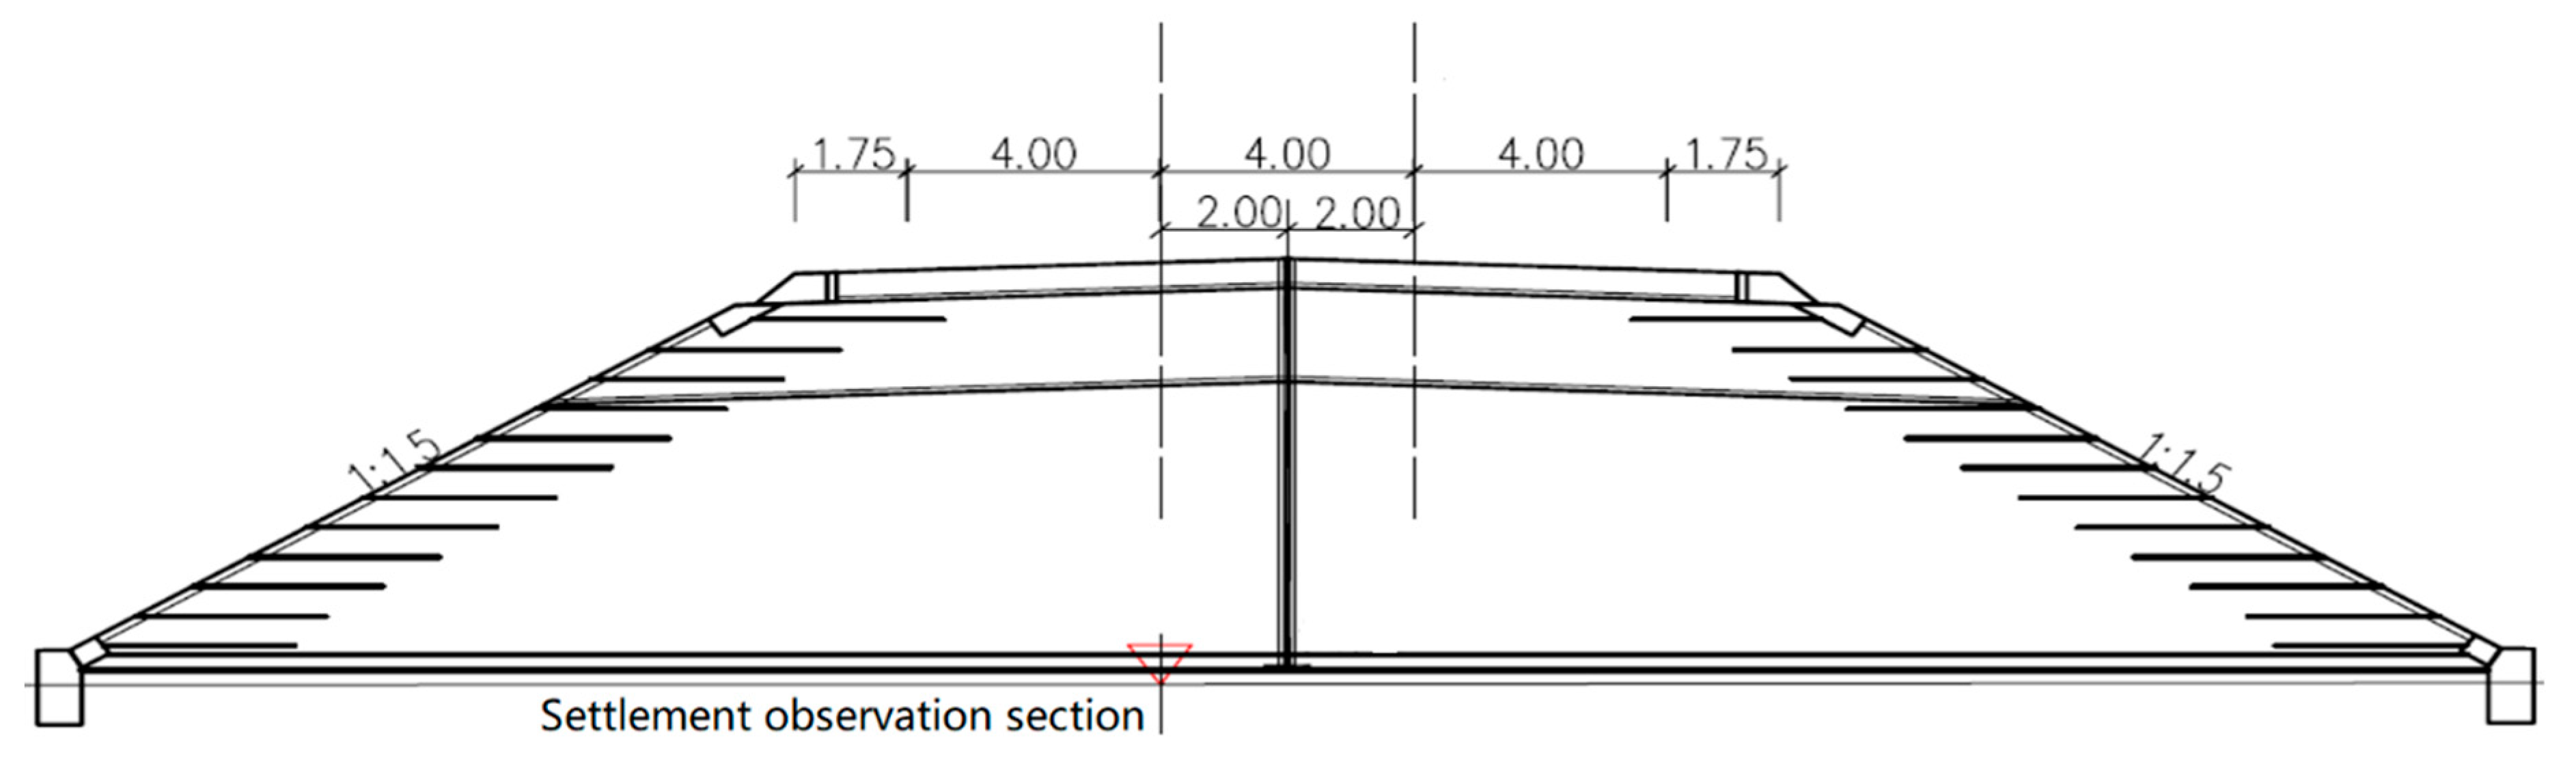
The new railway embankment is built on the ground according to the design location in Figure 1. A triangular arch is set on the railway embankment surface, and a 4% drainage slope is provided on both sides from the center of the railway line. On the embankment section, a concrete shoulder with a top width of 0.4 m is built. The drawing of the railway embankment is shown in Figure 7. The height of the embankment is eight meters, which uses stratified paving and the height of each layer is based on the designed guideline. A settlement observation section is set at different depths below the embankment, including one meter, 4 m, 10 m, 16 m, and 24 m below the ground surface.
For the convenience of the research, this model has the following assumptions:
- (a)
- Due to the complexity of the rock mass and its structure, it is impossible to take all the factors into consideration when performing large-scale calculations. Therefore, the same stratum is treated according to the isotropic medium.
- (b)
- The formation of the soil and rock layer is affected by many factors in the formation process; its shape cannot be regular, and the inclination and thickness of the rock layer are constantly changing. In order to facilitate the establishment of models and calculations, the interface of the rock layer is usually not considered.
- (c)
- The tectonic stress is ignored; the self-heavy stress is regarded as the ground stress.
- (d)
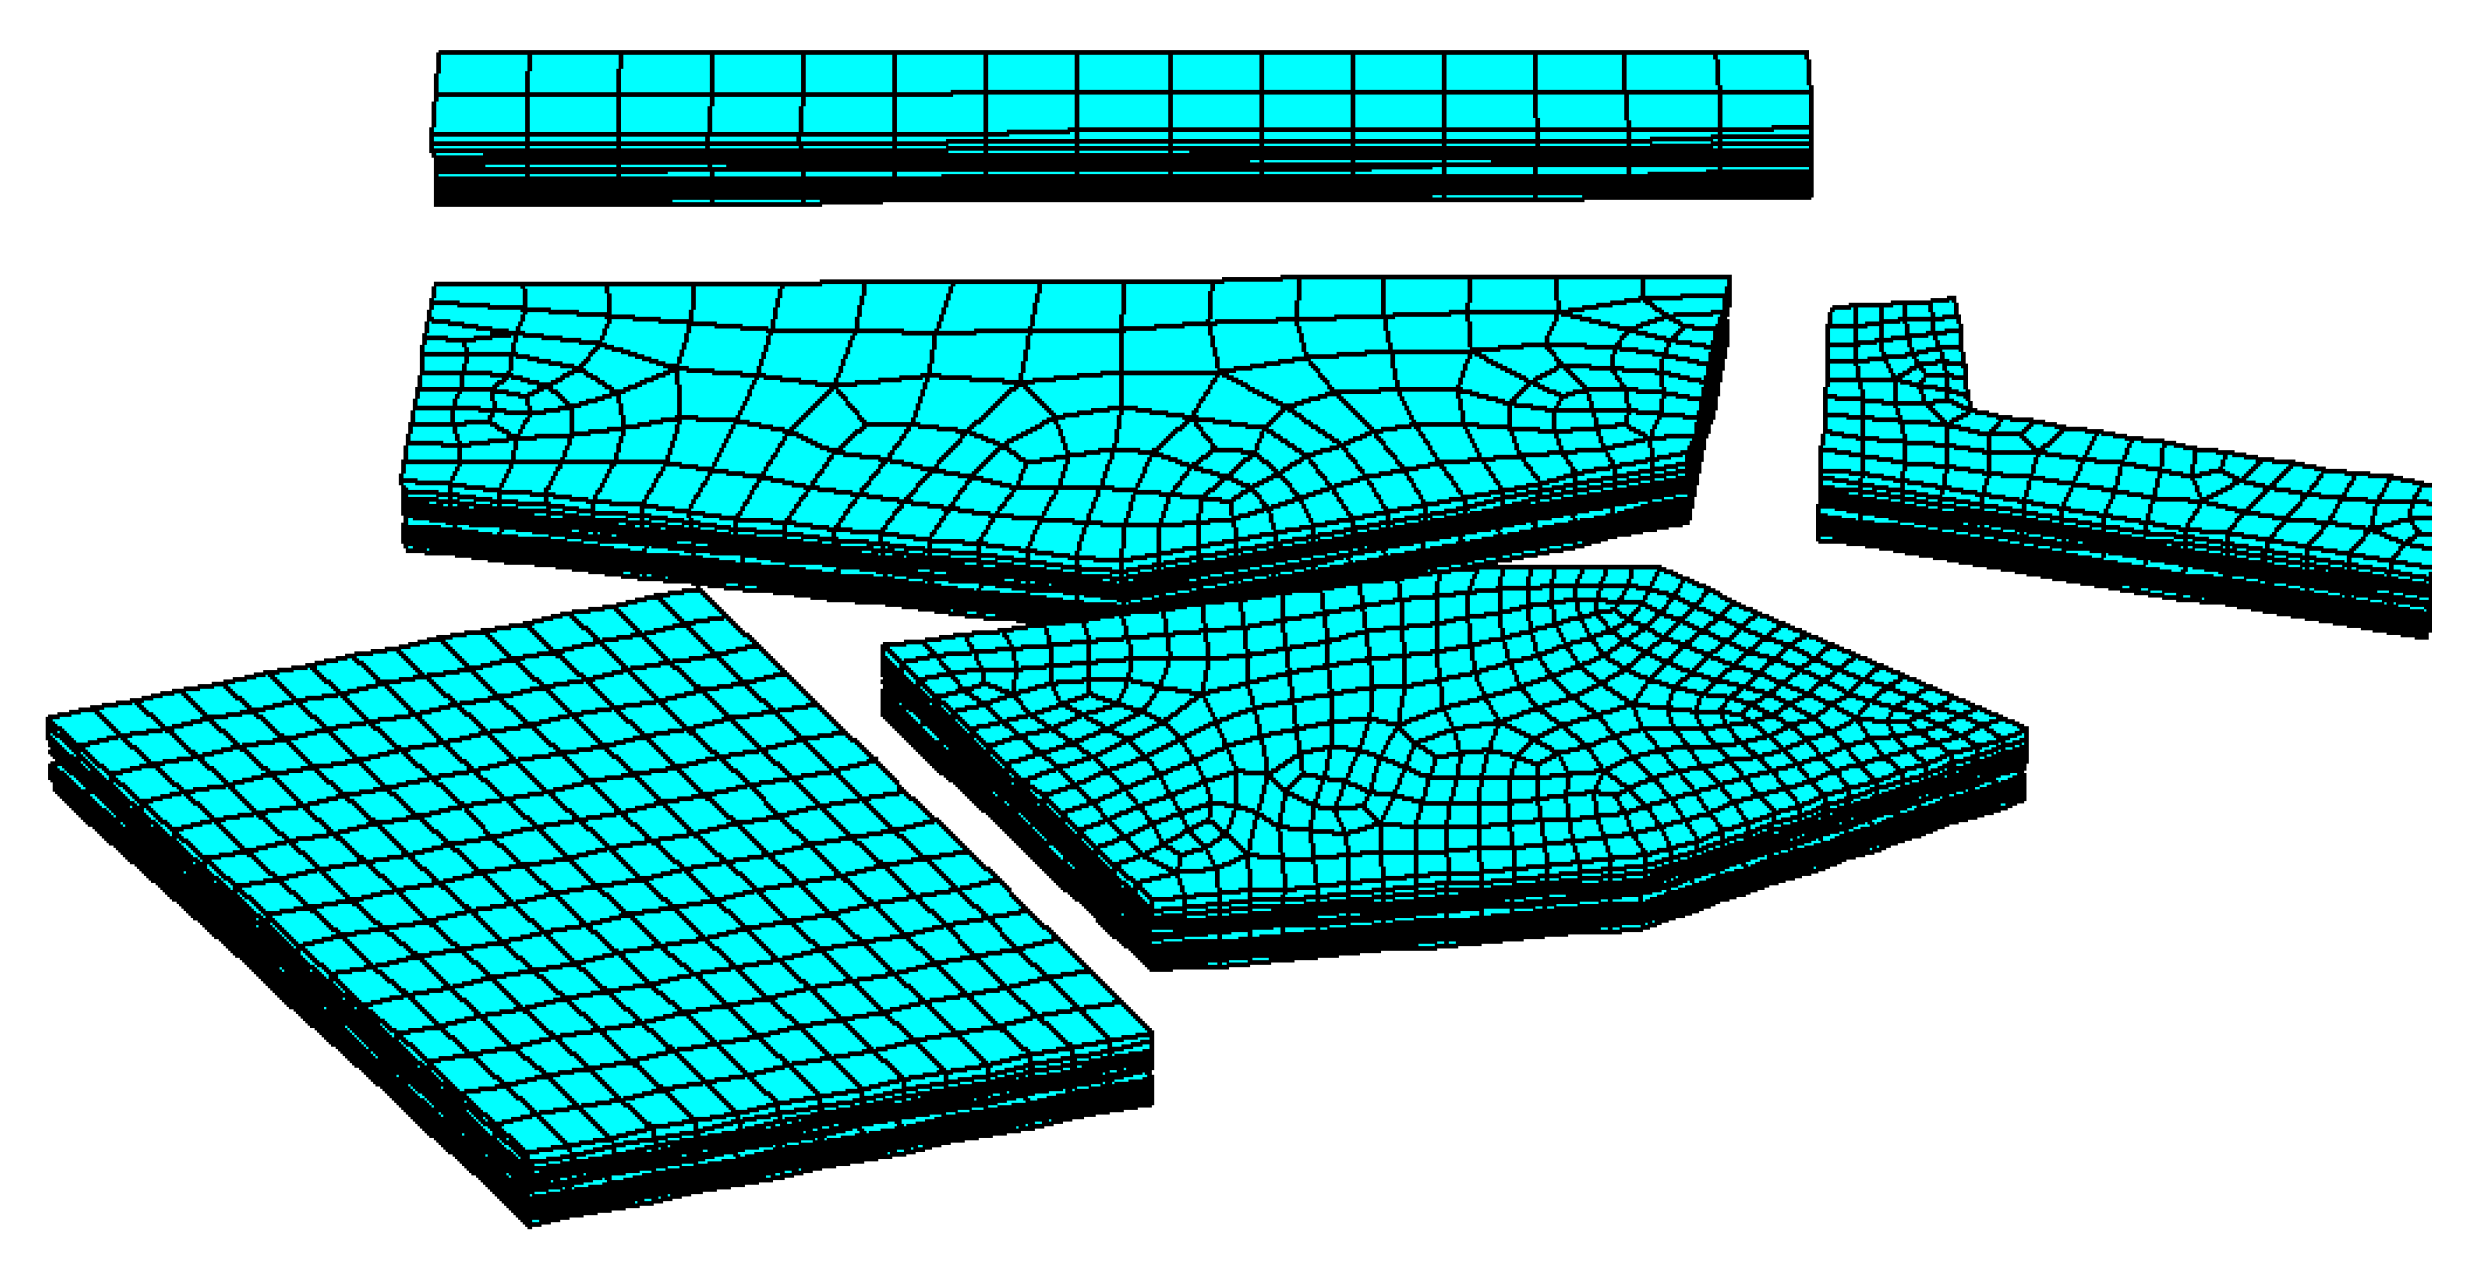
- Due to the complexity of the problem and the unpredictability of the size of the cavity, it is only possible to model the entire mining zone and simplify the cavity. The similar cavities are spliced into a large mined-out cavity. Therefore, the cavities are finally reduced to five areas; the finite element model is shown in Figure 8. The order of salt mine excavation is in accordance with the actual project.
In this model simulation, firstly, the validity of the model is verified by the monitoring settlement data. Then, settlement at different depths from the ground was calculated, and the long-term ground surface settlement was predicted.
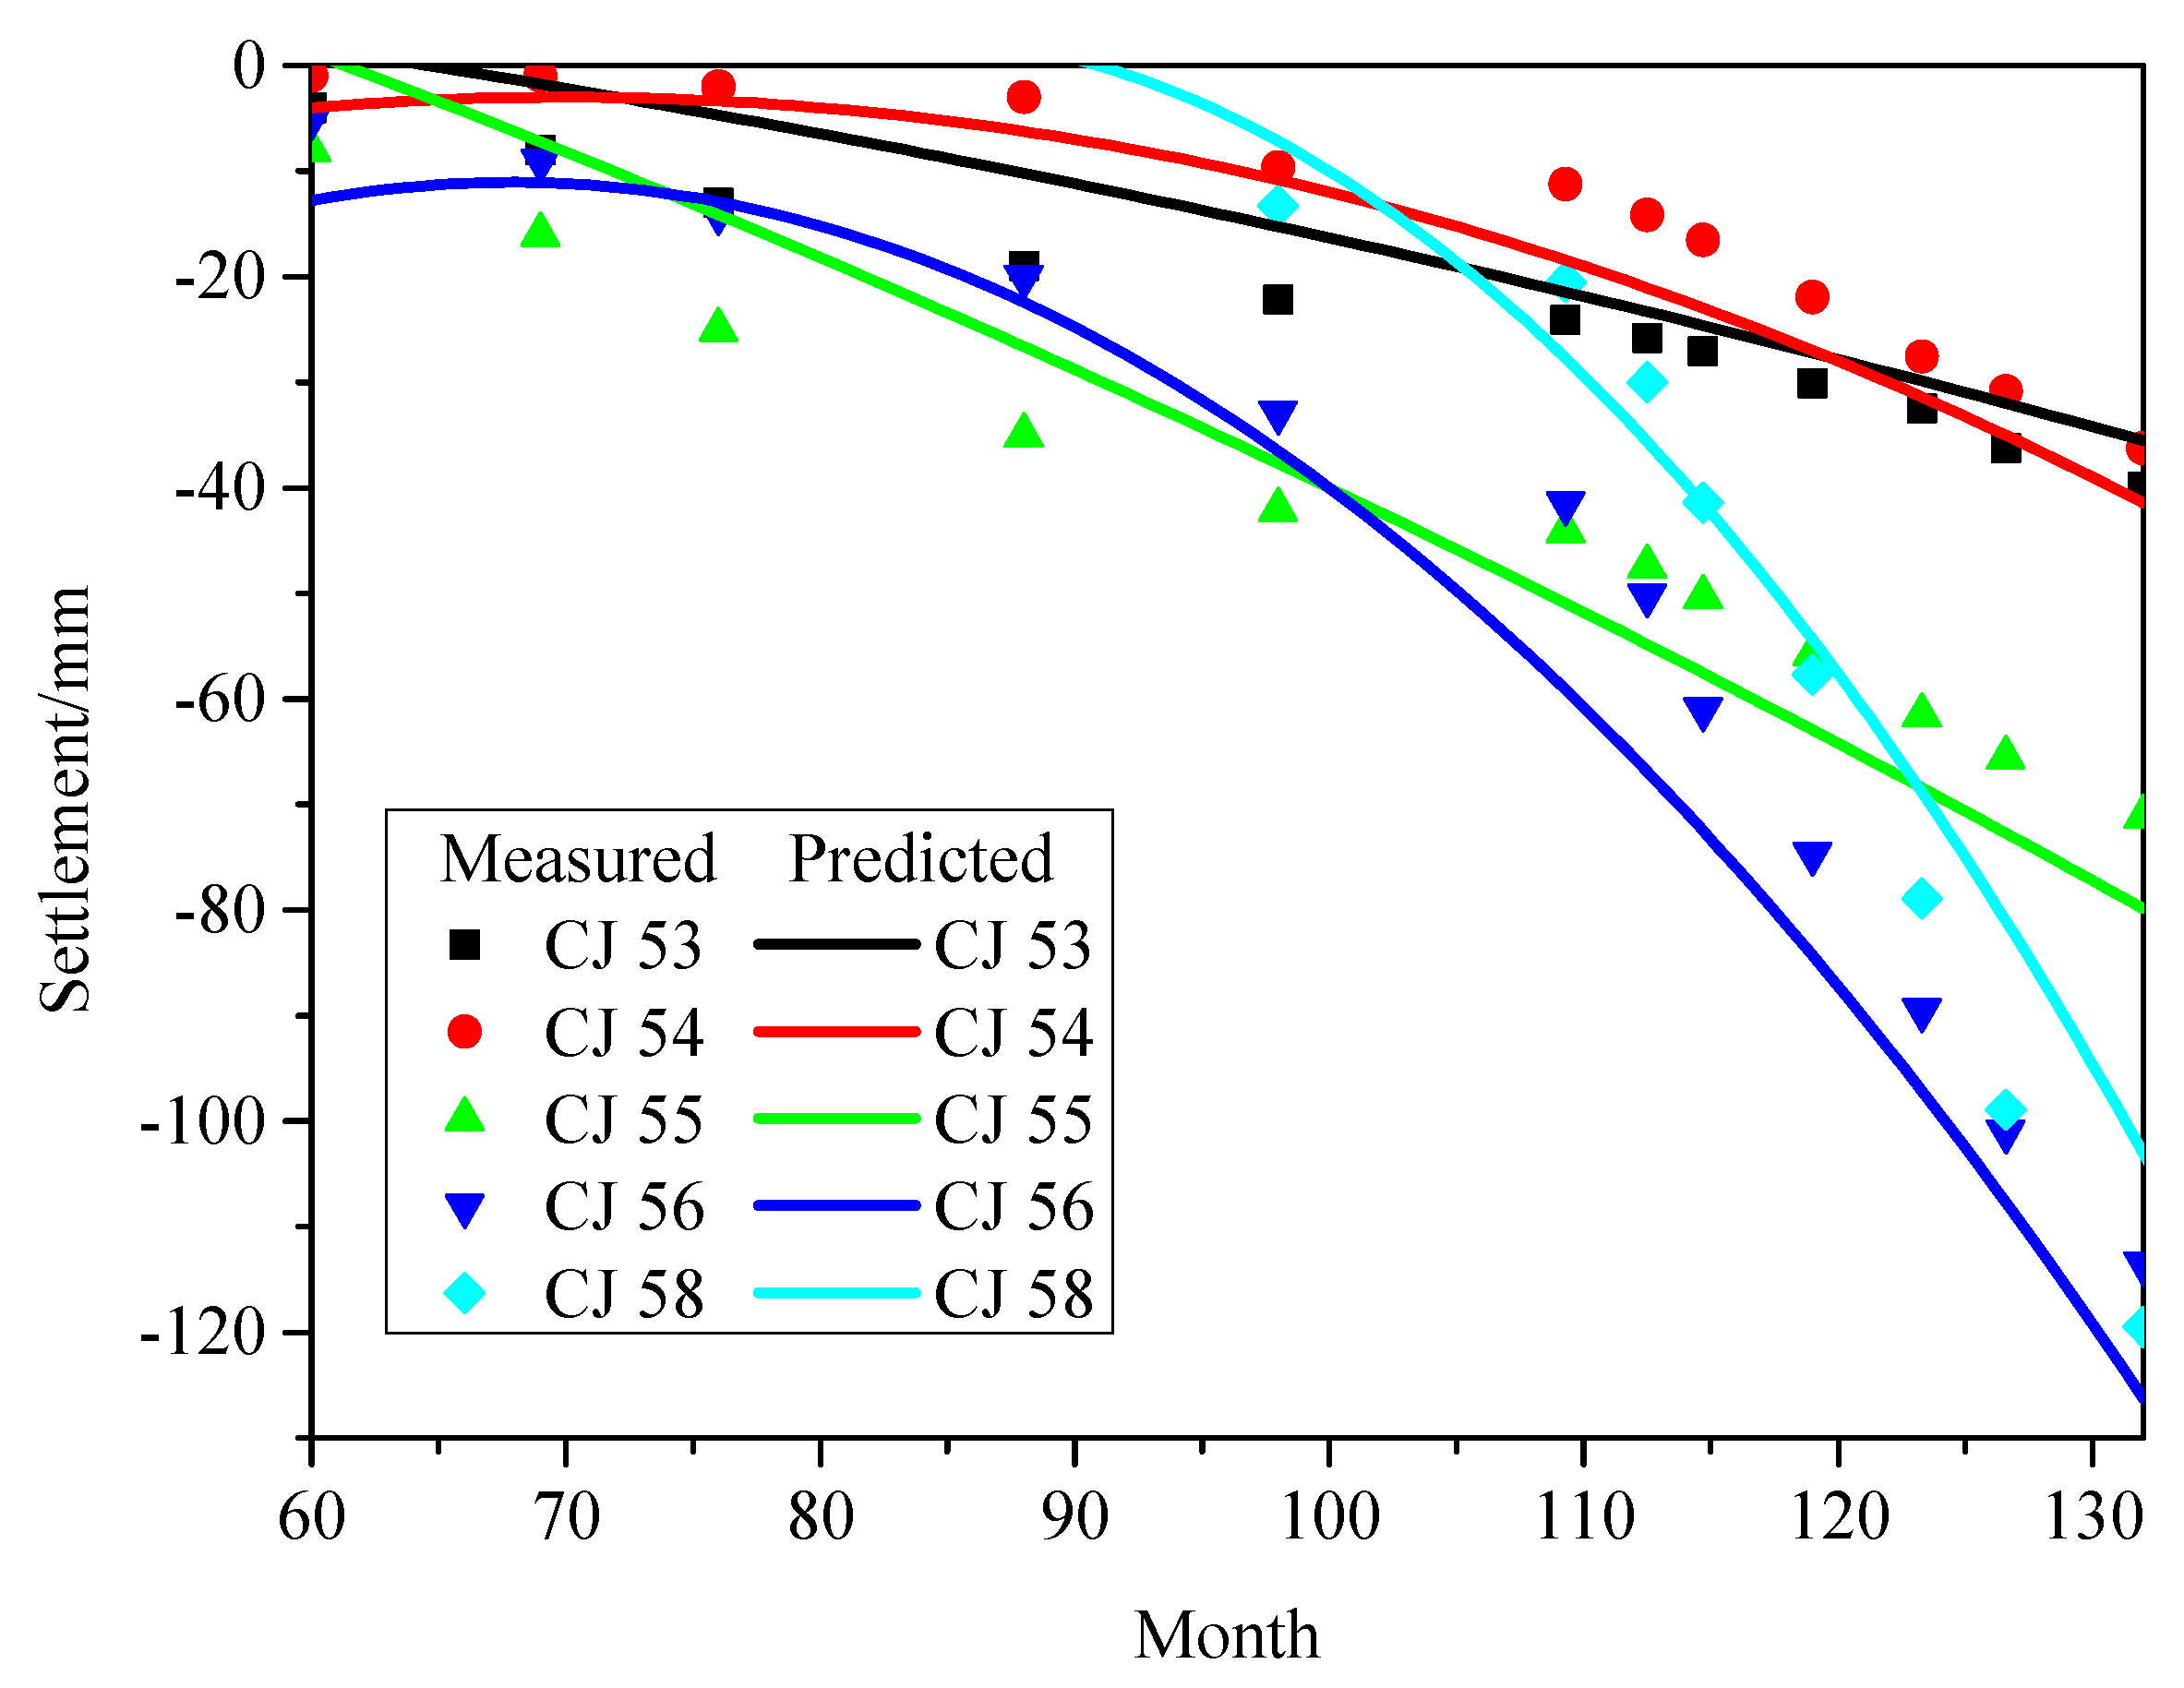
4.1. Model Validation
In order to verify the accuracy of the model, five monitoring points—CJ53, CJ54, CJ55, CJ56, and CJ58—along the railway are selected to compare the predicted settlement and measured settlement. The comparison is shown in Figure 9.
As shown in Figure 4, the selected monitoring points along the railway show obvious settlement after 60 months. Therefore, the comparison of predicted settlement and measured settlement is from 60 months to 132 months. In Figure 8, a good match can be seen between the measured settlement and the predicted settlement. It can be considered that the finite element model can effectively predict the ground settlement.
4.2. Soil Settlement below Railway Embankment
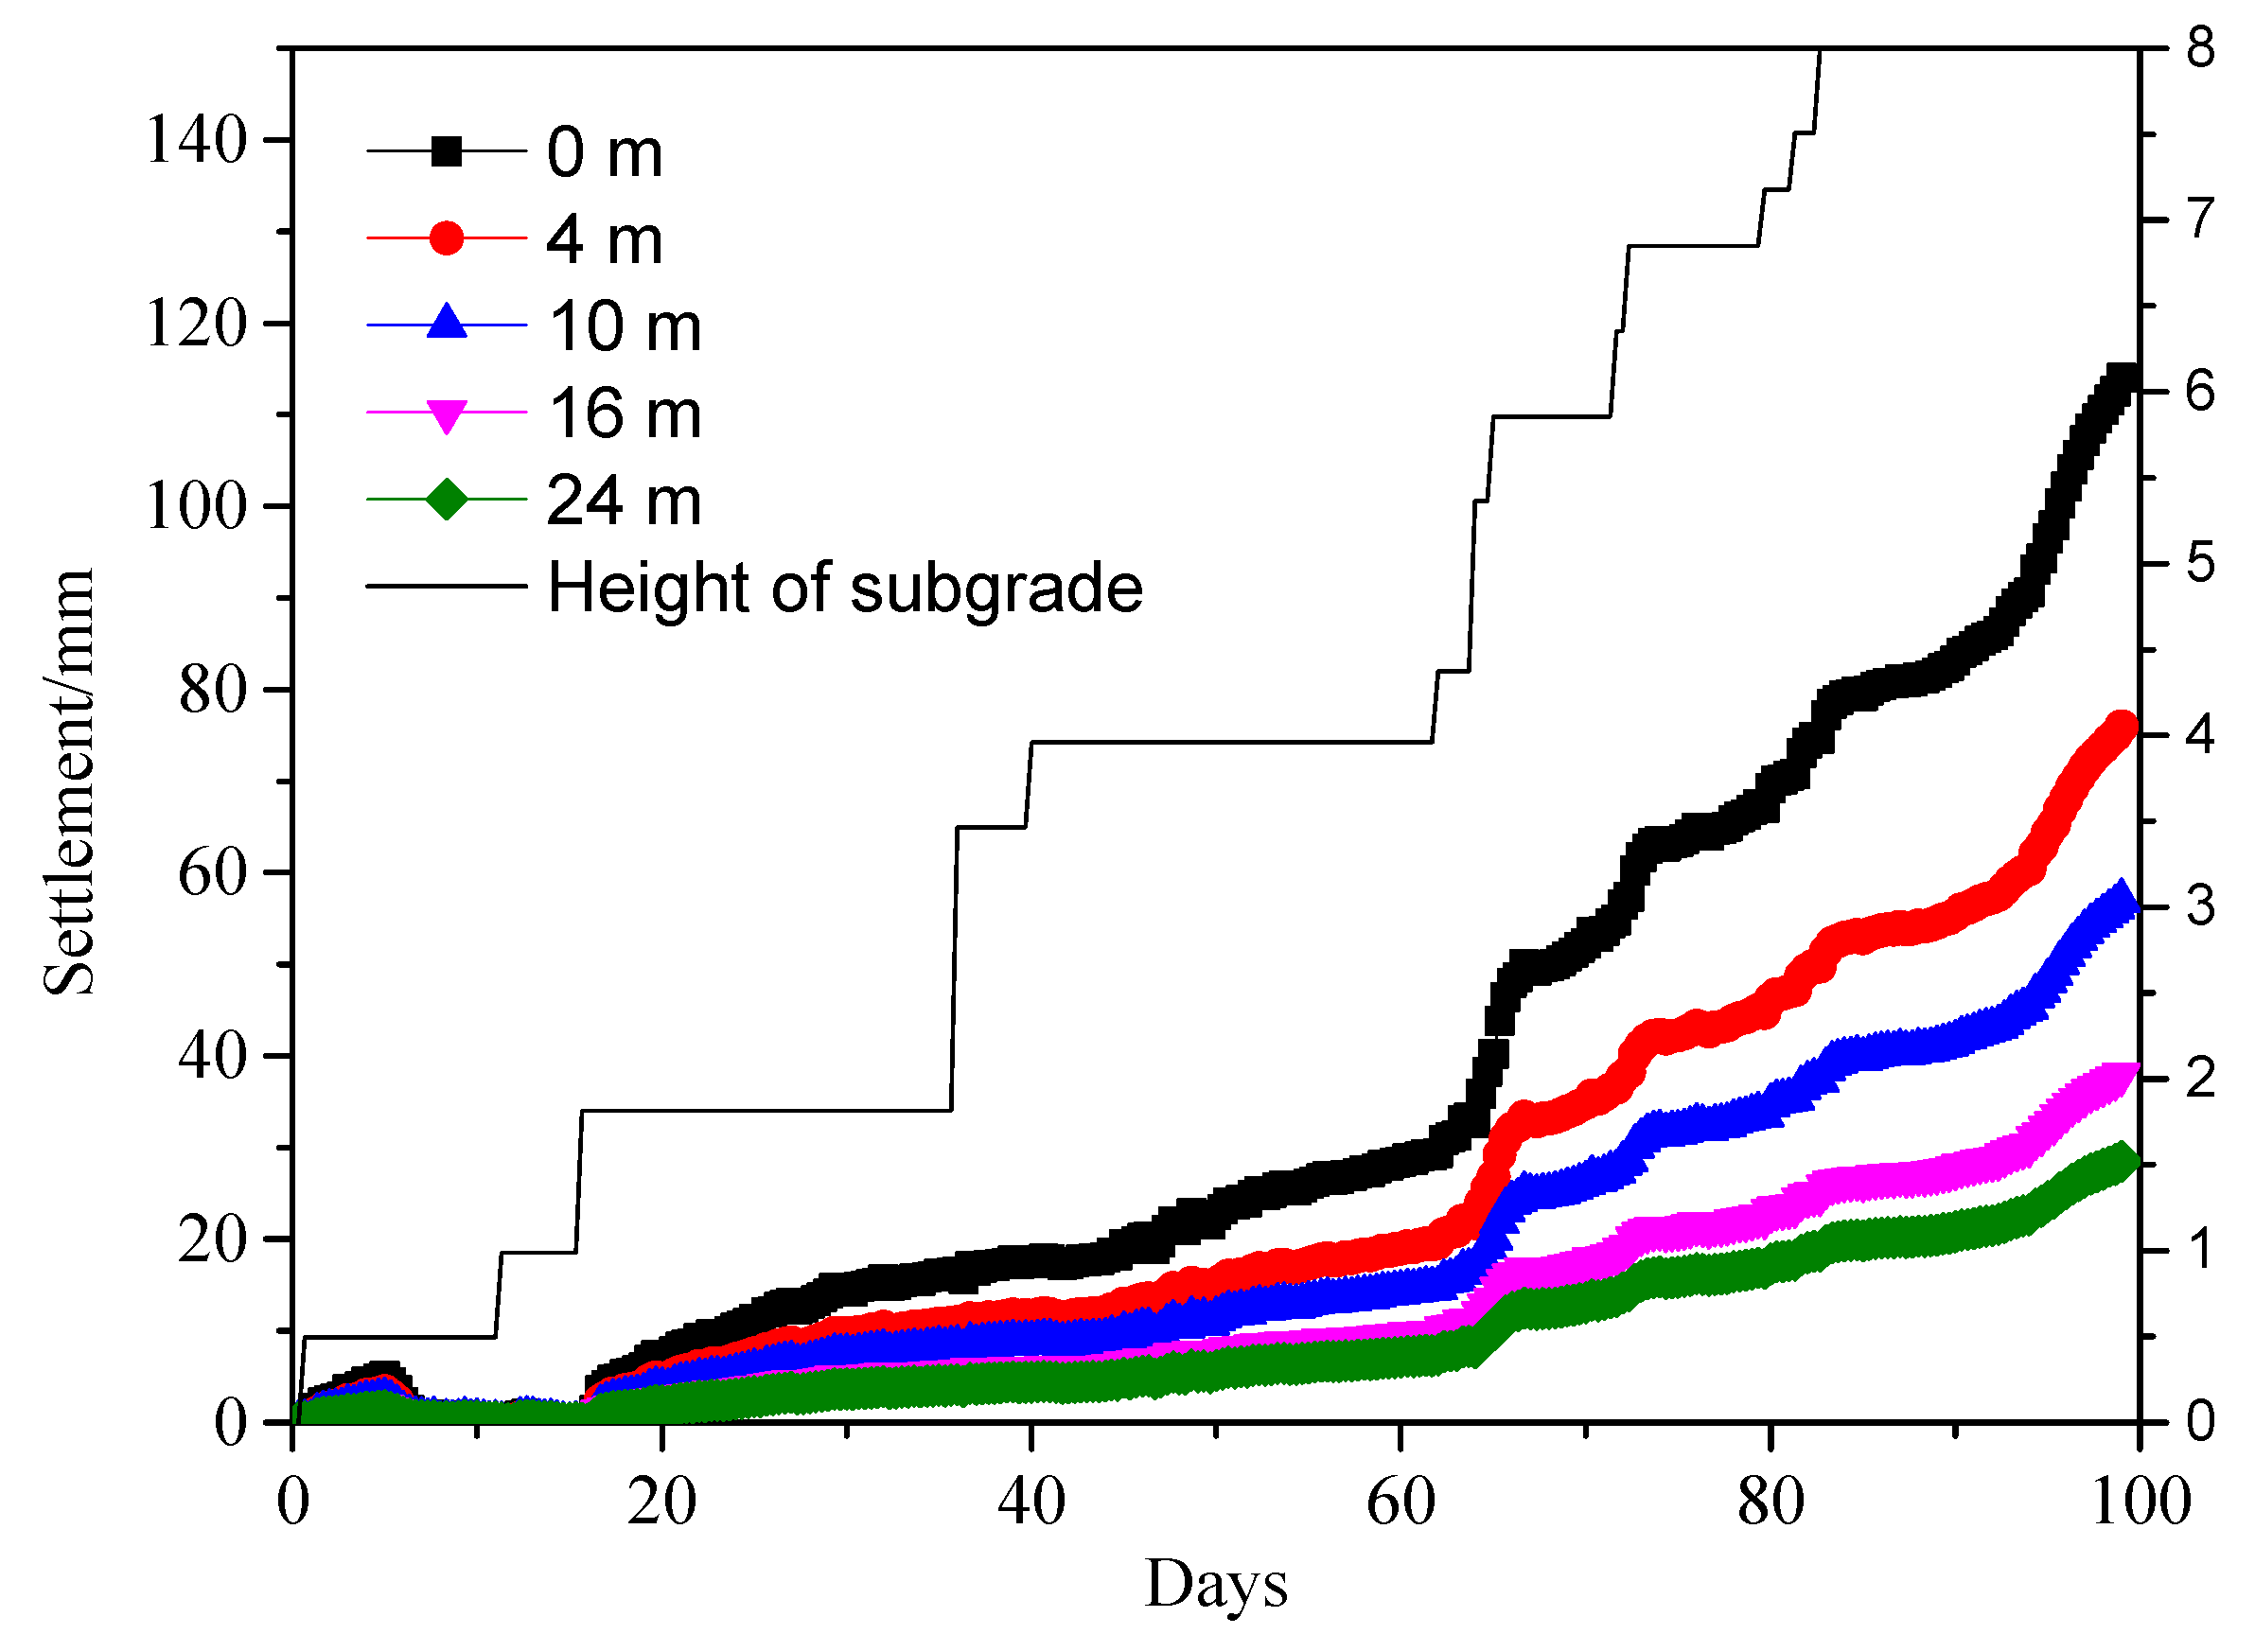
In order to obtain the soil settlement at different depths below the railway embankment, a section near monitoring point CJ56 is selected due to the settlement around CJ56 being the largest along the railway. However, the total settlement consists of a consolidation settlement induced by the mined-out cavity and an additional load induced by embankment soil. Therefore, the consolidation settlement induced by the mined-out cavity should be removed to only consider the settlement induced by additional embankment load. Figure 10 shows the settlement of zero meters, 4 m, 10 m, 16 m, and 24 m below the railway embankment change with the different embankment heights.
As shown in Figure 10, the settlement of soil layers at different depths has a significant increasing trend with the increase of embankment height. When the embankment height is small, the settlement of the soil layer at different depths is also small. With the increase of the embankment height, the settlement of the soil layer at different depths also increases accordingly.
During the embankment filling period, the settlement of the soil layer at different depths increases rapidly, which is reflected in the curve as the slope becomes larger. During the intermittent period of filling, the settlement of the soil layer at different depths will fluctuate up or down. This is also in line with the general rule, because in the intermittent period of filling, the base soil layer is filled with load pressure from the top, which leads to the compression deformation of the soil.
The settlement of the soil layer at different depths is also different. The depth of the soil layer is inversely proportional to the settlement. The deeper the soil layer, the smaller the settlement. On the contrary, the shallower the soil layer, the larger the settlement. It means the settlement of the deep soil layer is less than the settlement of the shallow soil layer.
4.3. Long-Term Ground Surface Settlement
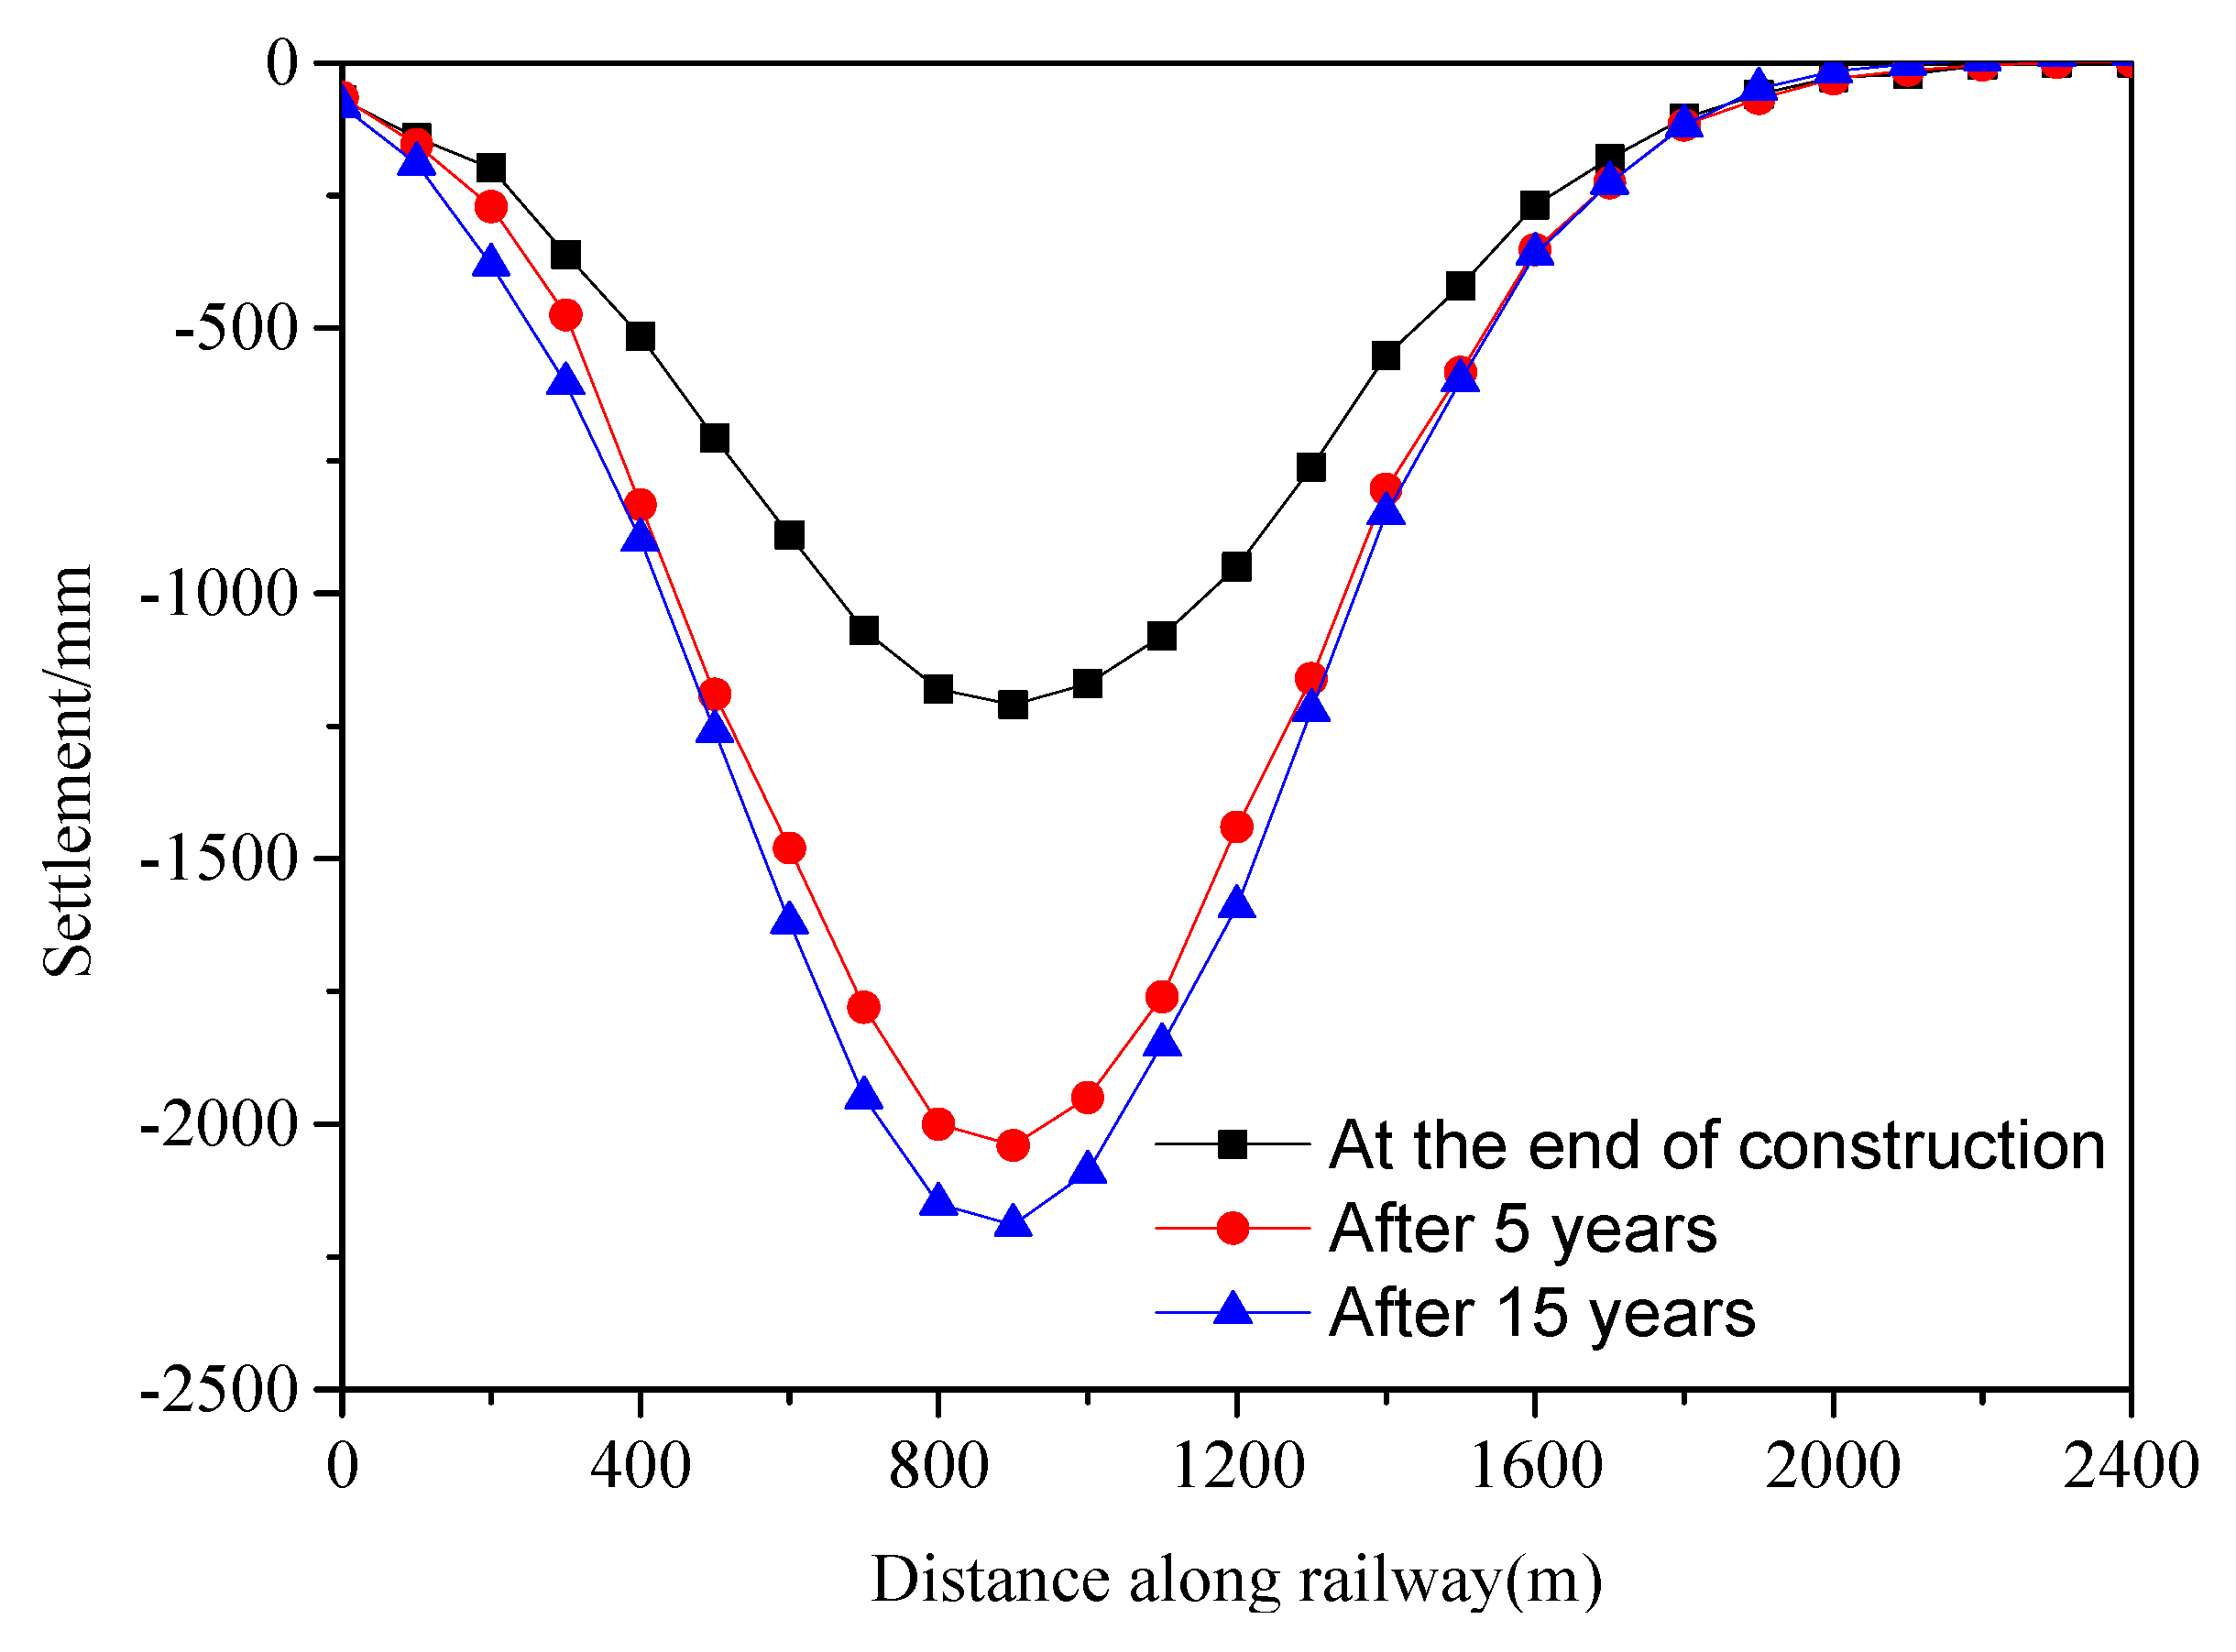
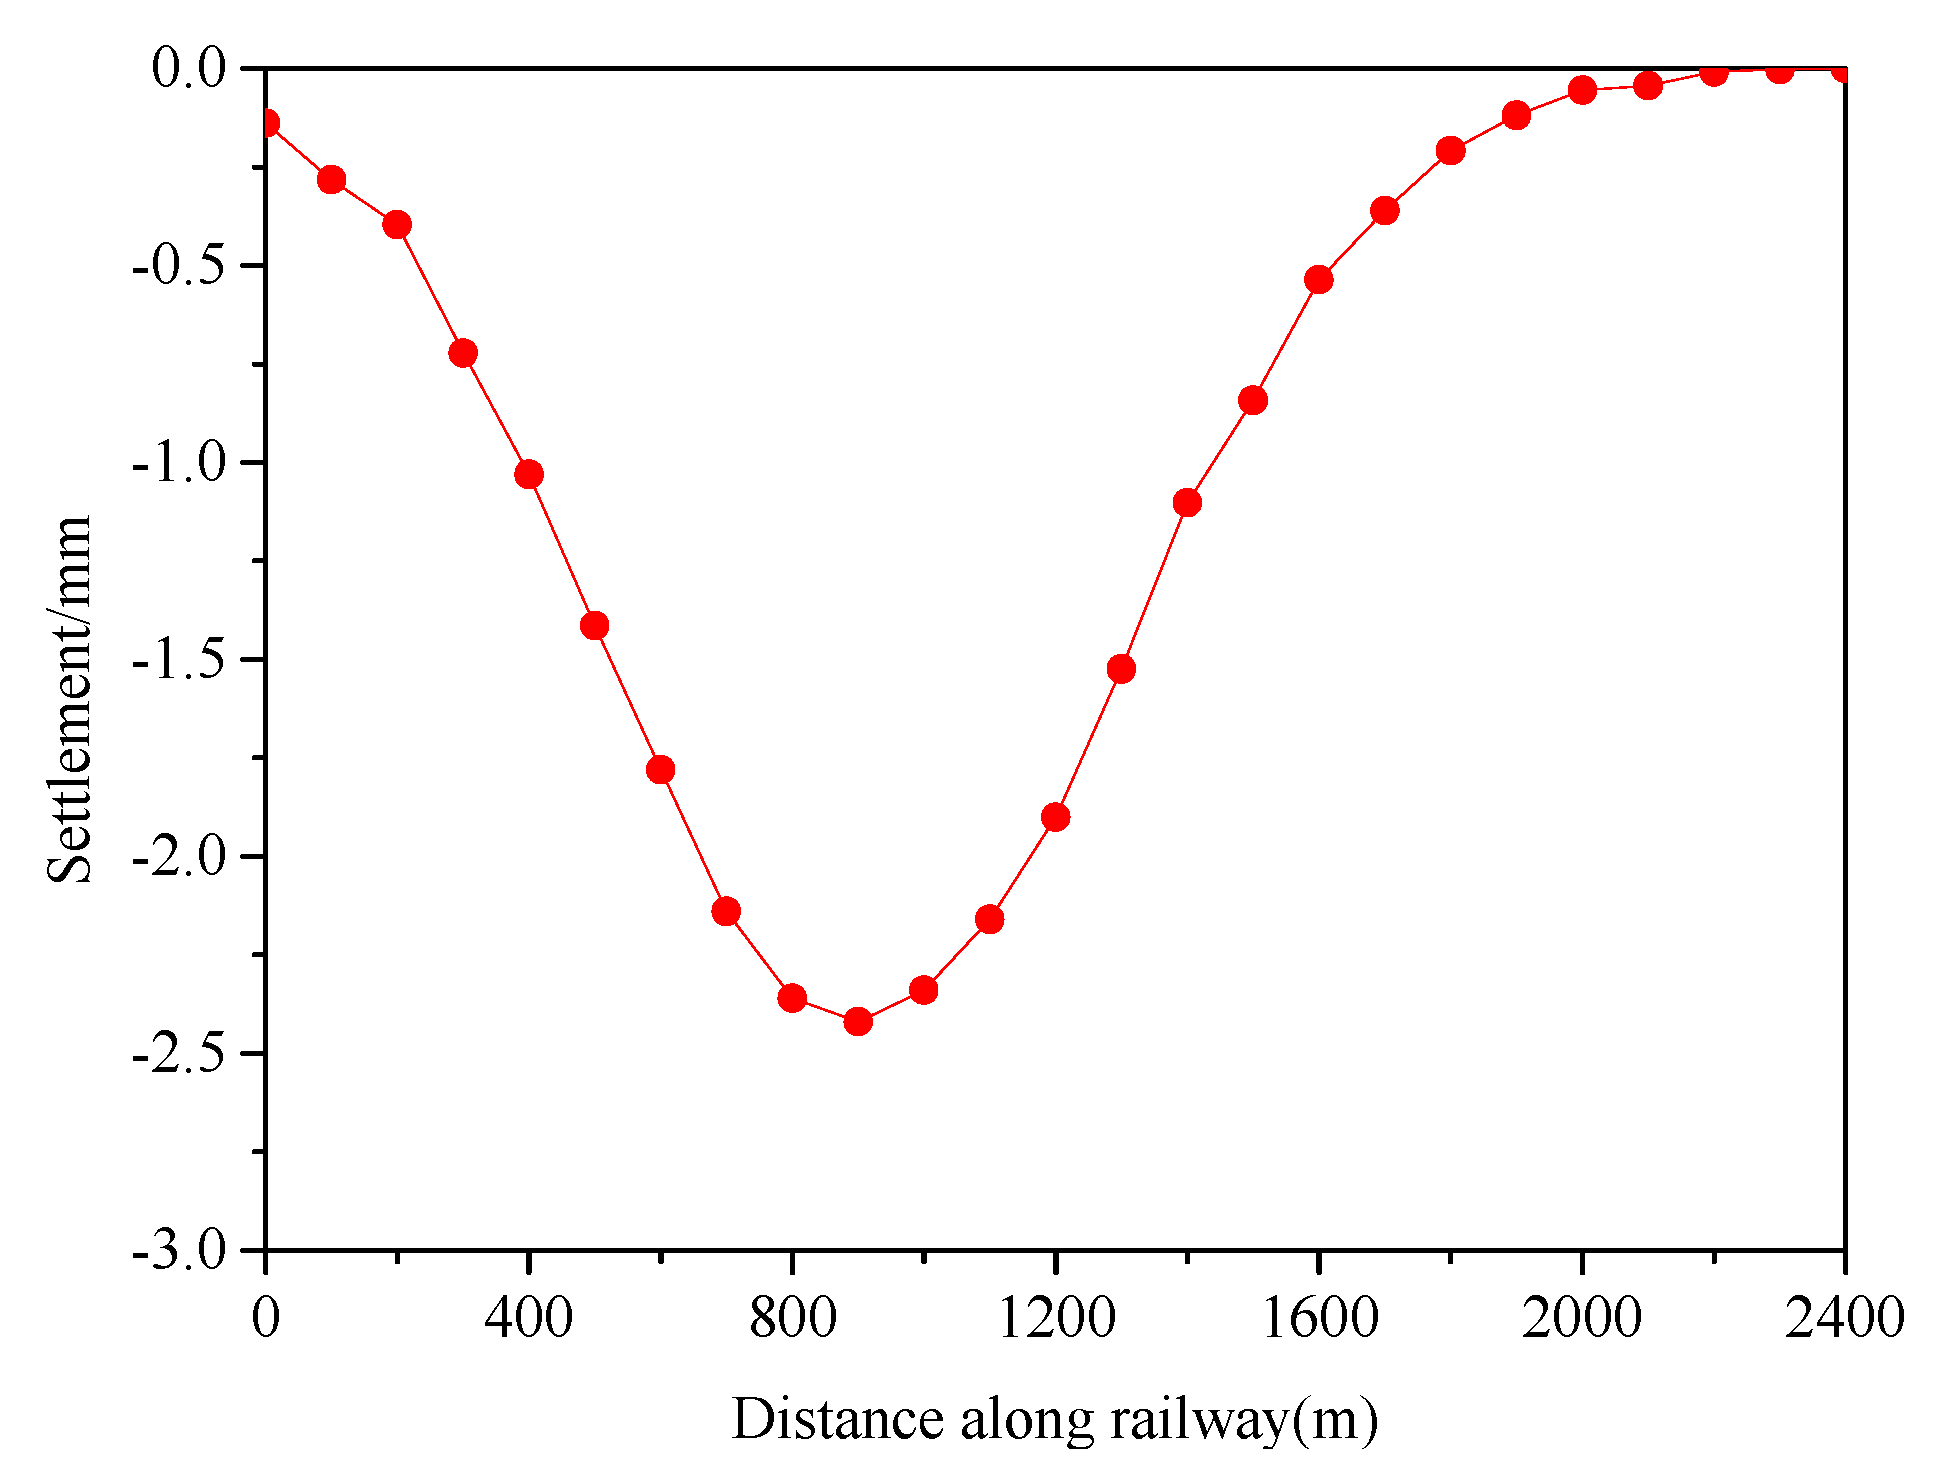
Long-term settlement is a matter of great concern. It is related to whether the train can operate safely, smoothly, and comfortably. The Figure 11 shows the different periods of settlement along the railway surface of the embankment from the left side to the right side of the mining area with the distance of 2400 m.
It can be seen from the figure that ground settlement along the railway is basically the same at different times. The settlement along the railway surface of the embankment can be divided into two stages. The first stage is the linearization of settlement, and the settlement increased quickly, which is from about 1.2 m at the end of the construction to about 2.0 m after five years. The second stage is that the settlement value tends to be stable from five years to 15 years. The location of maximum settlement is close to region B. Compared to the settlement induced by the railway embankment construction, the total settlement is much larger. It indicates that the main cause of settlement is not railway embankment construction, but rather a mined-out cavity. In addition, the creep properties of the salt rock are not considered. After the end of mining, the salt rock around the mined-out cavity is in a state of partial stress, and the salt rock will continuously shrink to the mined-out cavity, which will continue to cause ground settlement.
Due to the settlement becoming stable after five years, the predicted settlement for the whole mining area is shown for five years, as shown in Figure 12. The maximum settlements of three regions are between two and three meters. For the residential buildings in the south of region A, the settlements are between one and 1.5 m, which will increase the damage of the buildings. It needs to reinforce the mined-out area urgently to avoid bigger losses.
5. Ground Settlements over Mined-Out Region Induced by Train Operation
In order to analyze the dynamic deformation mechanism caused by moving train loads, this section establishes the train track coupling dynamic model, fully considering the influence of track irregularity, and calculating the wheel–rail interaction when the train runs on the track structure in the time domain. On this basis, the finite element model of the track structure and ground is built based on the finite element model of Section 4 and excitation by moving train loads, and the dynamic response characteristics of the ground under moving load are obtained.
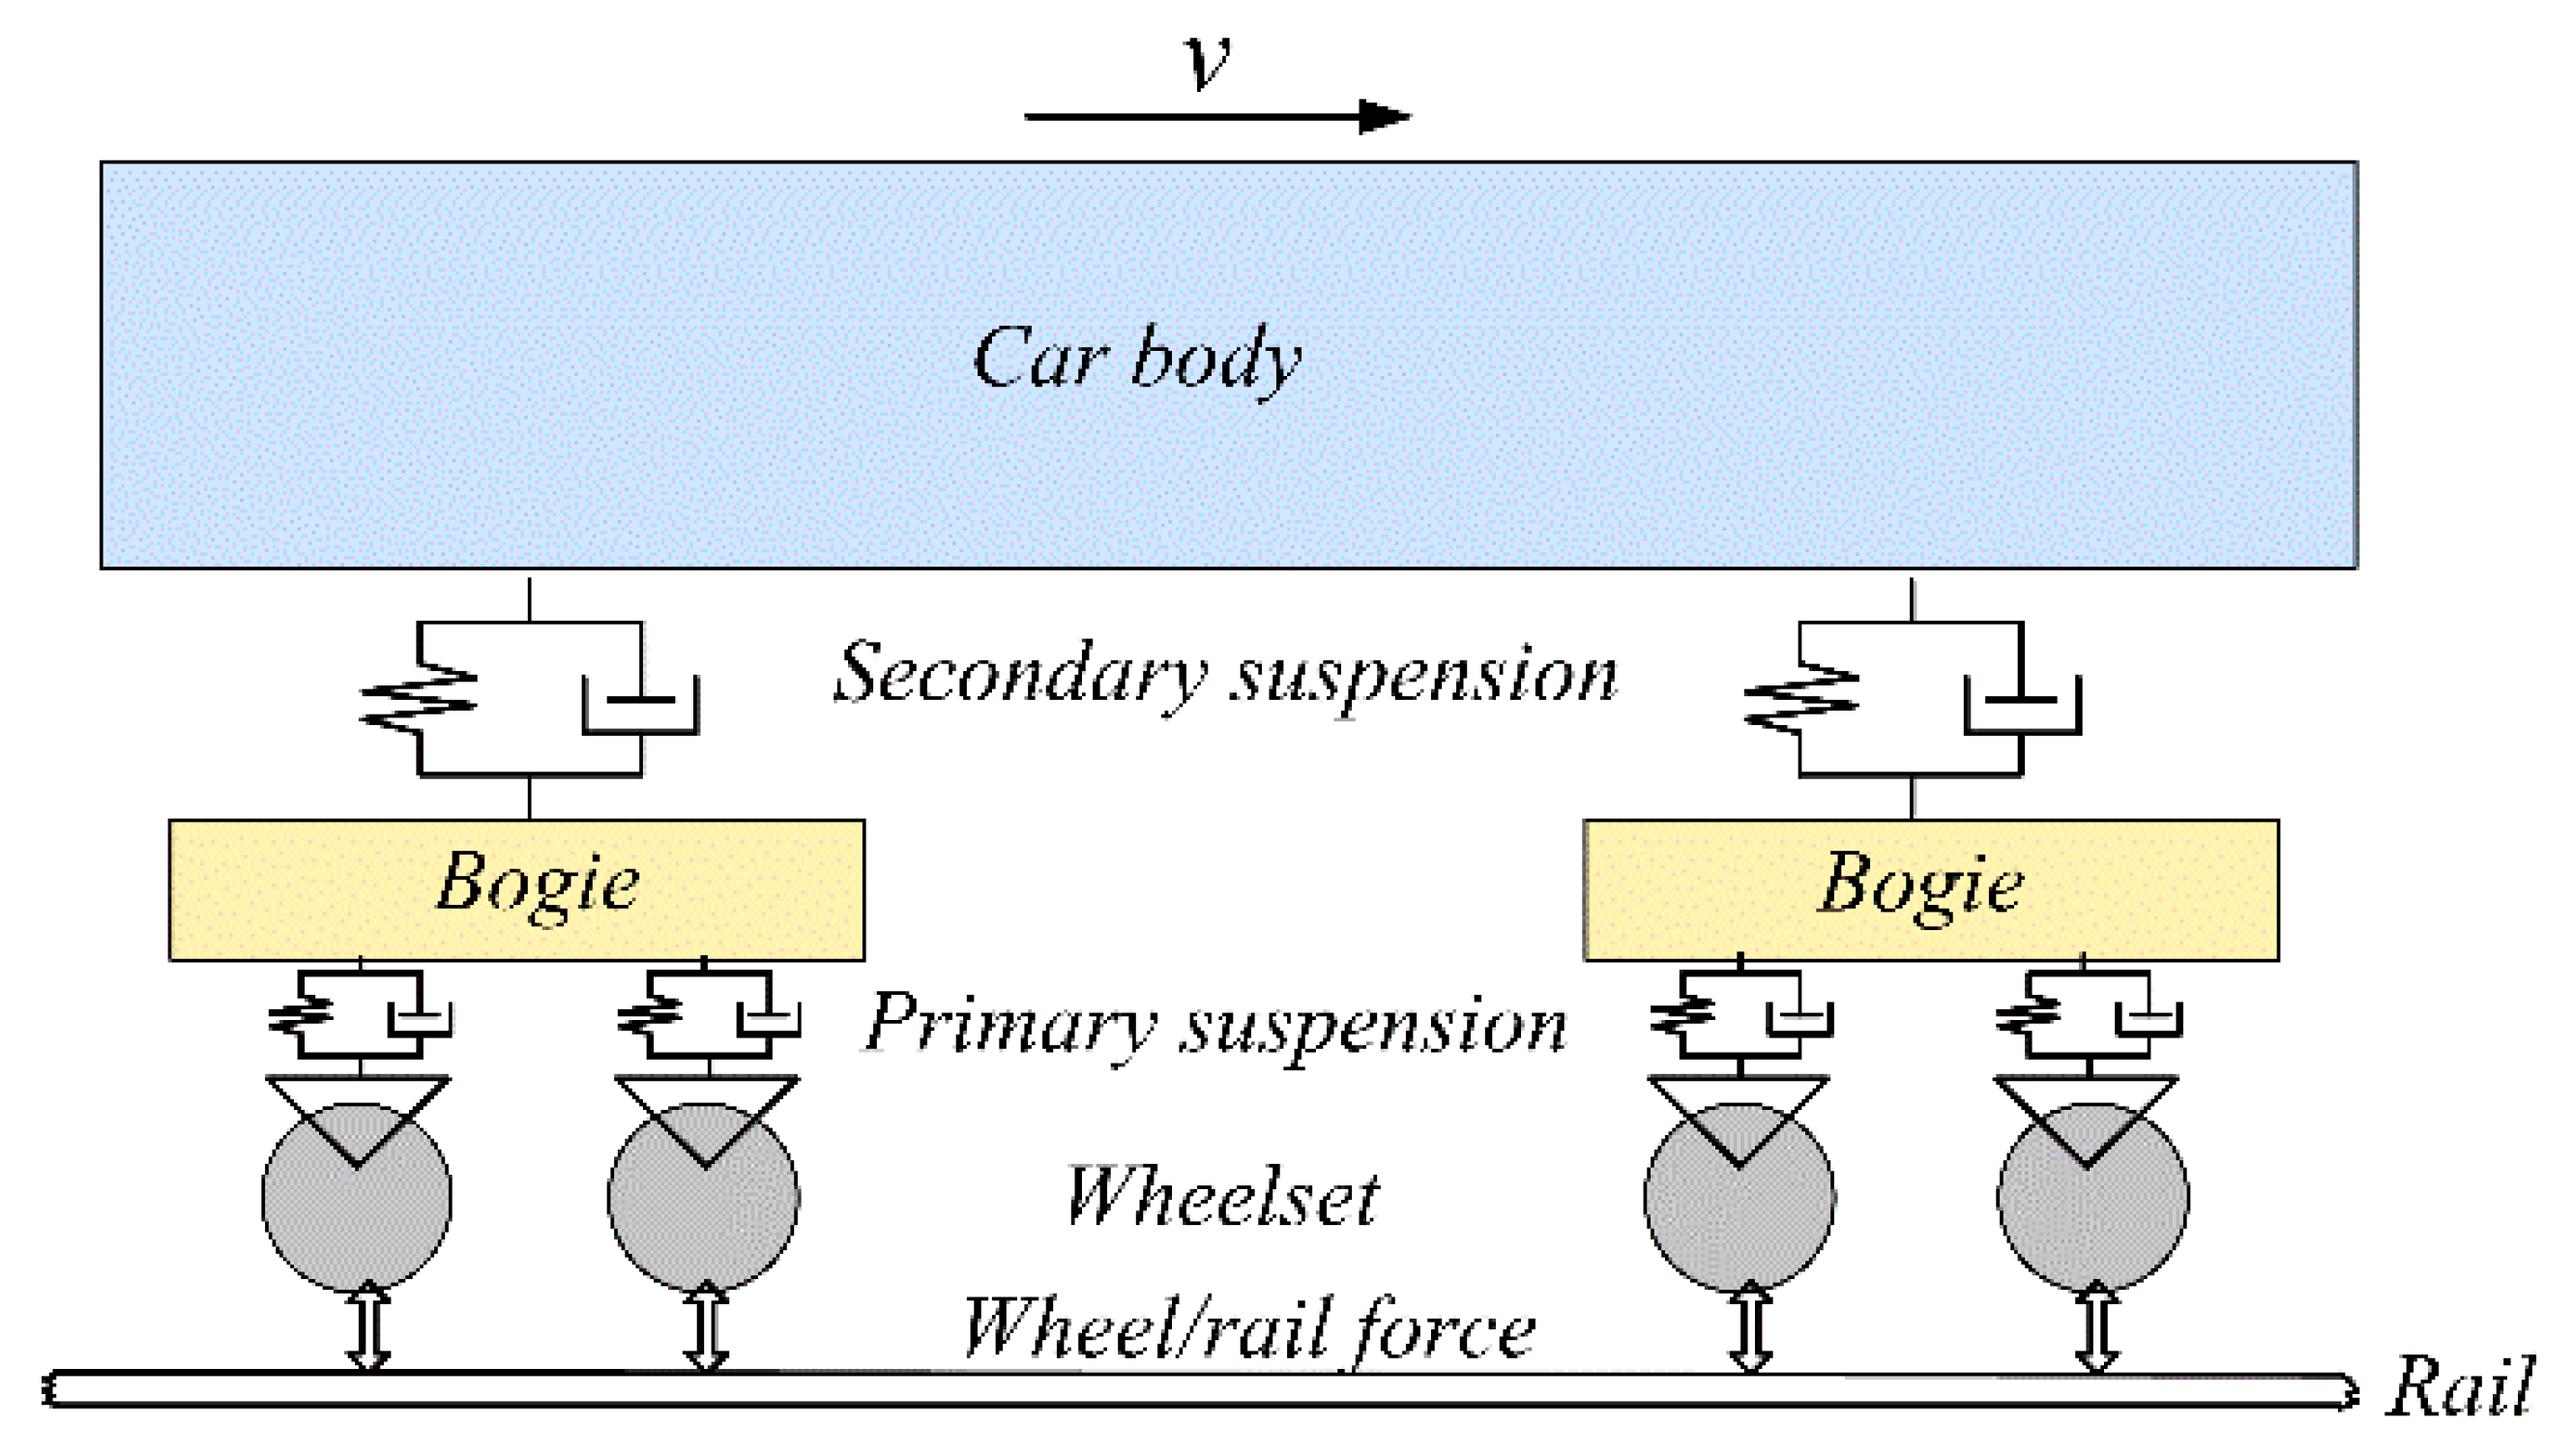
5.1. Dynamics Model of Train
A vertical dynamics model with 10 degrees of freedom (DOFs) is built for the train based on the theory of the multi-body system dynamics. Figure 13 illustrates the schematic drawing of the vertical dynamics model of a train. In this mode, the car body, two bogies, and four wheelsets are represented using mass blocks. All of these mass blocks can move up and down along the vertical direction. Also, the car body and two bogies can rotate in the vertical plane. The spring-dampers are used to connect each mass block to simulate the primary and secondary suspensions in the train.
According to Newton’s second law, the dynamics equations for the train model can be expressed as:
where x means the vector of the 10 DOFs in the vehicle; and M, C, and K represents the mass, damping, and stiffness matrix of the multi-body system. The symbol F is the load vector applied to the vehicle, which is actually the contribution of the dynamic interaction forces between the wheelsets and the rail. The wheel/rail forces can be calculated according to the nonlinear Hertz contact theory, in which the effect of the rail irregularity is also taken into account. The dynamics parameters of train are listed in Table 4.
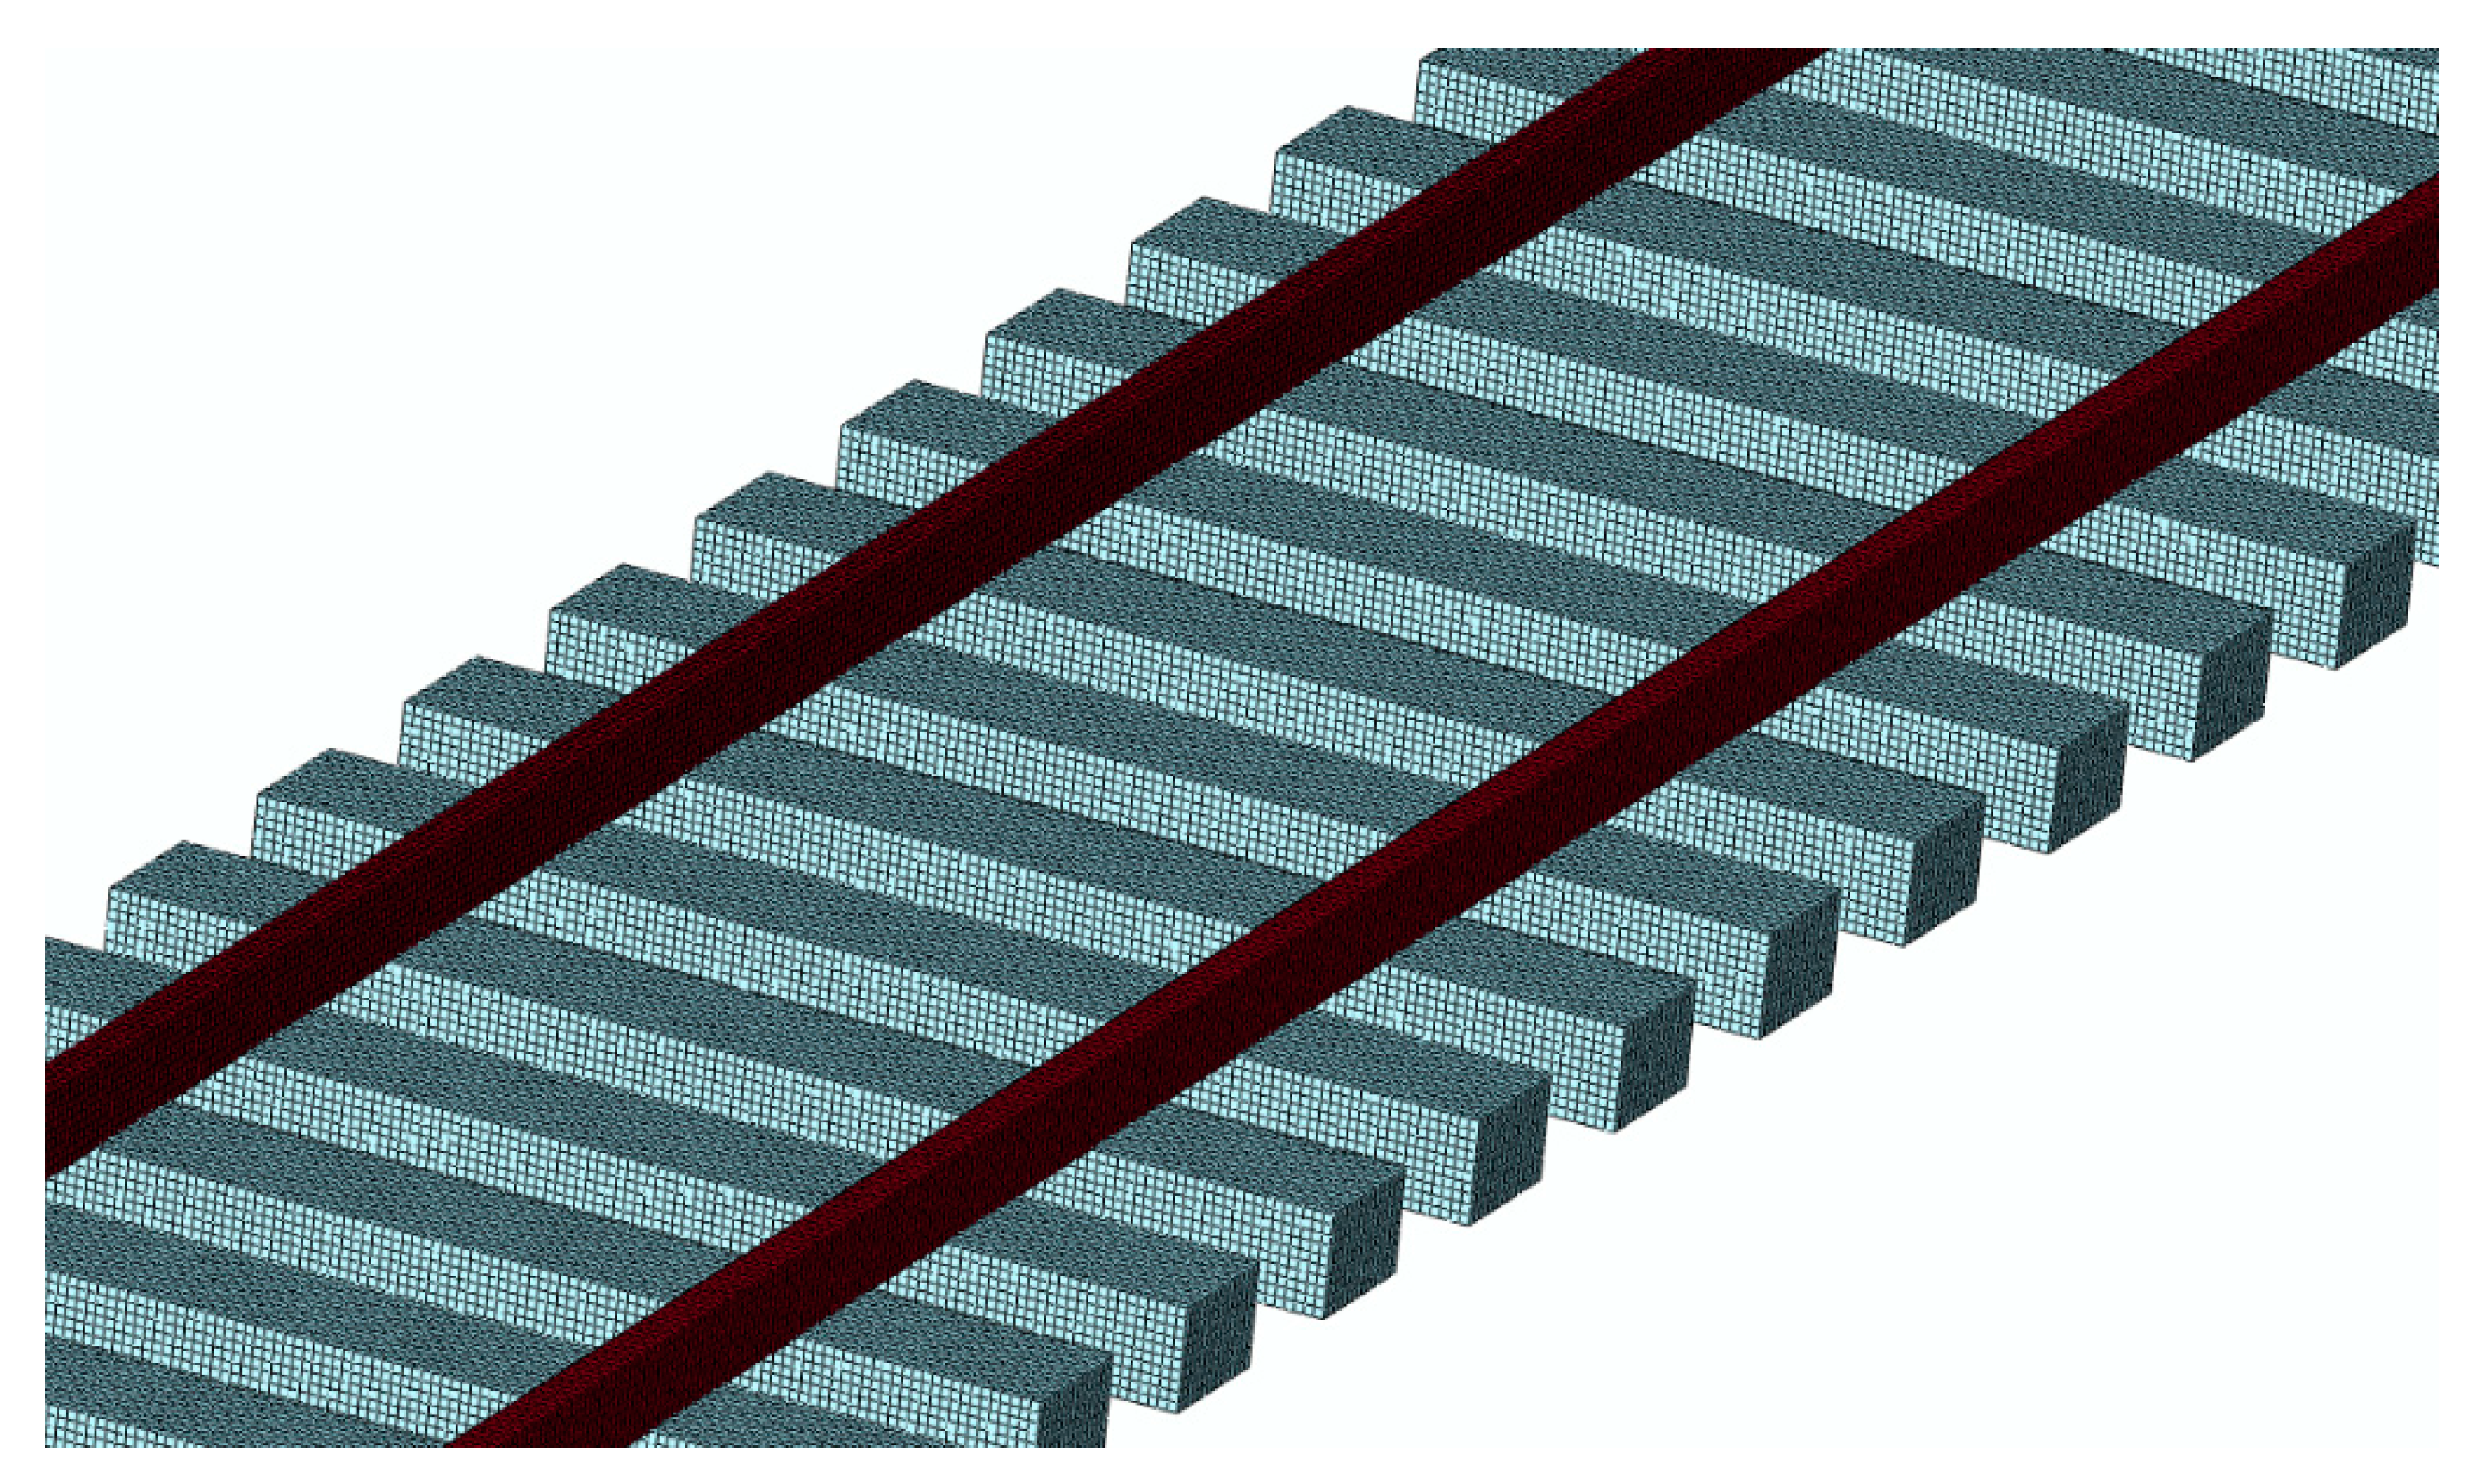
5.2. Dynamics Model of Track Structure
A finite element model is established for the track structure. Figure 14 shows the schematic drawing of the finite element model of the track structure. In this model, the rails and sleepers with real geometry sizes are all modeled using hexahedral solid elements. The rail pads under the rail are modeled using the spring-dampers. The mechanical parameters of each component in the finite element model such as the density, the Young’s modulus, and damping are chosen according to the material properties of the field track structures, as shown in Table 5. The track adopts 60 kg/m, U75V hot-rolled steel rail, and the distance between two rails is 1.435 m.
Track irregularity is the main reason of dynamic response caused by train operation, and it is the excitation source of the wheel–rail system. Considering that the established train track dynamic model only considers the vertical dynamic response, the track irregularity is based on the spectrum used by Lombaert [28]. The simulation is as follows:
where , , .
For the train load, this paper simulates moving train loads by applying wheel–rail contact force, which was obtained from the train track dynamic model to the rail surface. The train speed is 160 km/h for the boundary condition, which was obtained by coupling the finite element and the infinite element to simulate infinite ground [29]. It has wide applicability in the problem of simulating the infinite domain without losing the accuracy of the calculation.
5.3. Train-Induced Ground Settlement
This section mainly studies the settlement of train dynamic load on the ground above the mined-out cavity. Figure 15 shows the process of simulating the train passing through the mined-out cavity. At this time, the train is running in the center of the mined-out cavity.
The settlement induced by the dynamic load of the train has time-shift characteristics; the settlement changed with different time of the train operation. It can be seen from Figure 15 that the maximum settlement induced by the train operation is about 2.5 mm. When the train runs to the non-mining area, the ground settlement is less than the settlement induced by train runs inside the mining area. The settlement is obvious when the train runs at the center of the mining area. Beyond the area of the mined-out cavity, the dynamic load has less impact on the ground settlement. At the end of the train operation, the maximum residual settlement of 1.4 mm occurred on the ground surface. For the evaluation of the stability of the railway embankment, it can analyze the residual deformation of the ground surface caused by the additional dynamic load. Therefore, the maximum residual settlement of 1.4 mm caused by train operation has less impact on the safety of train operation.
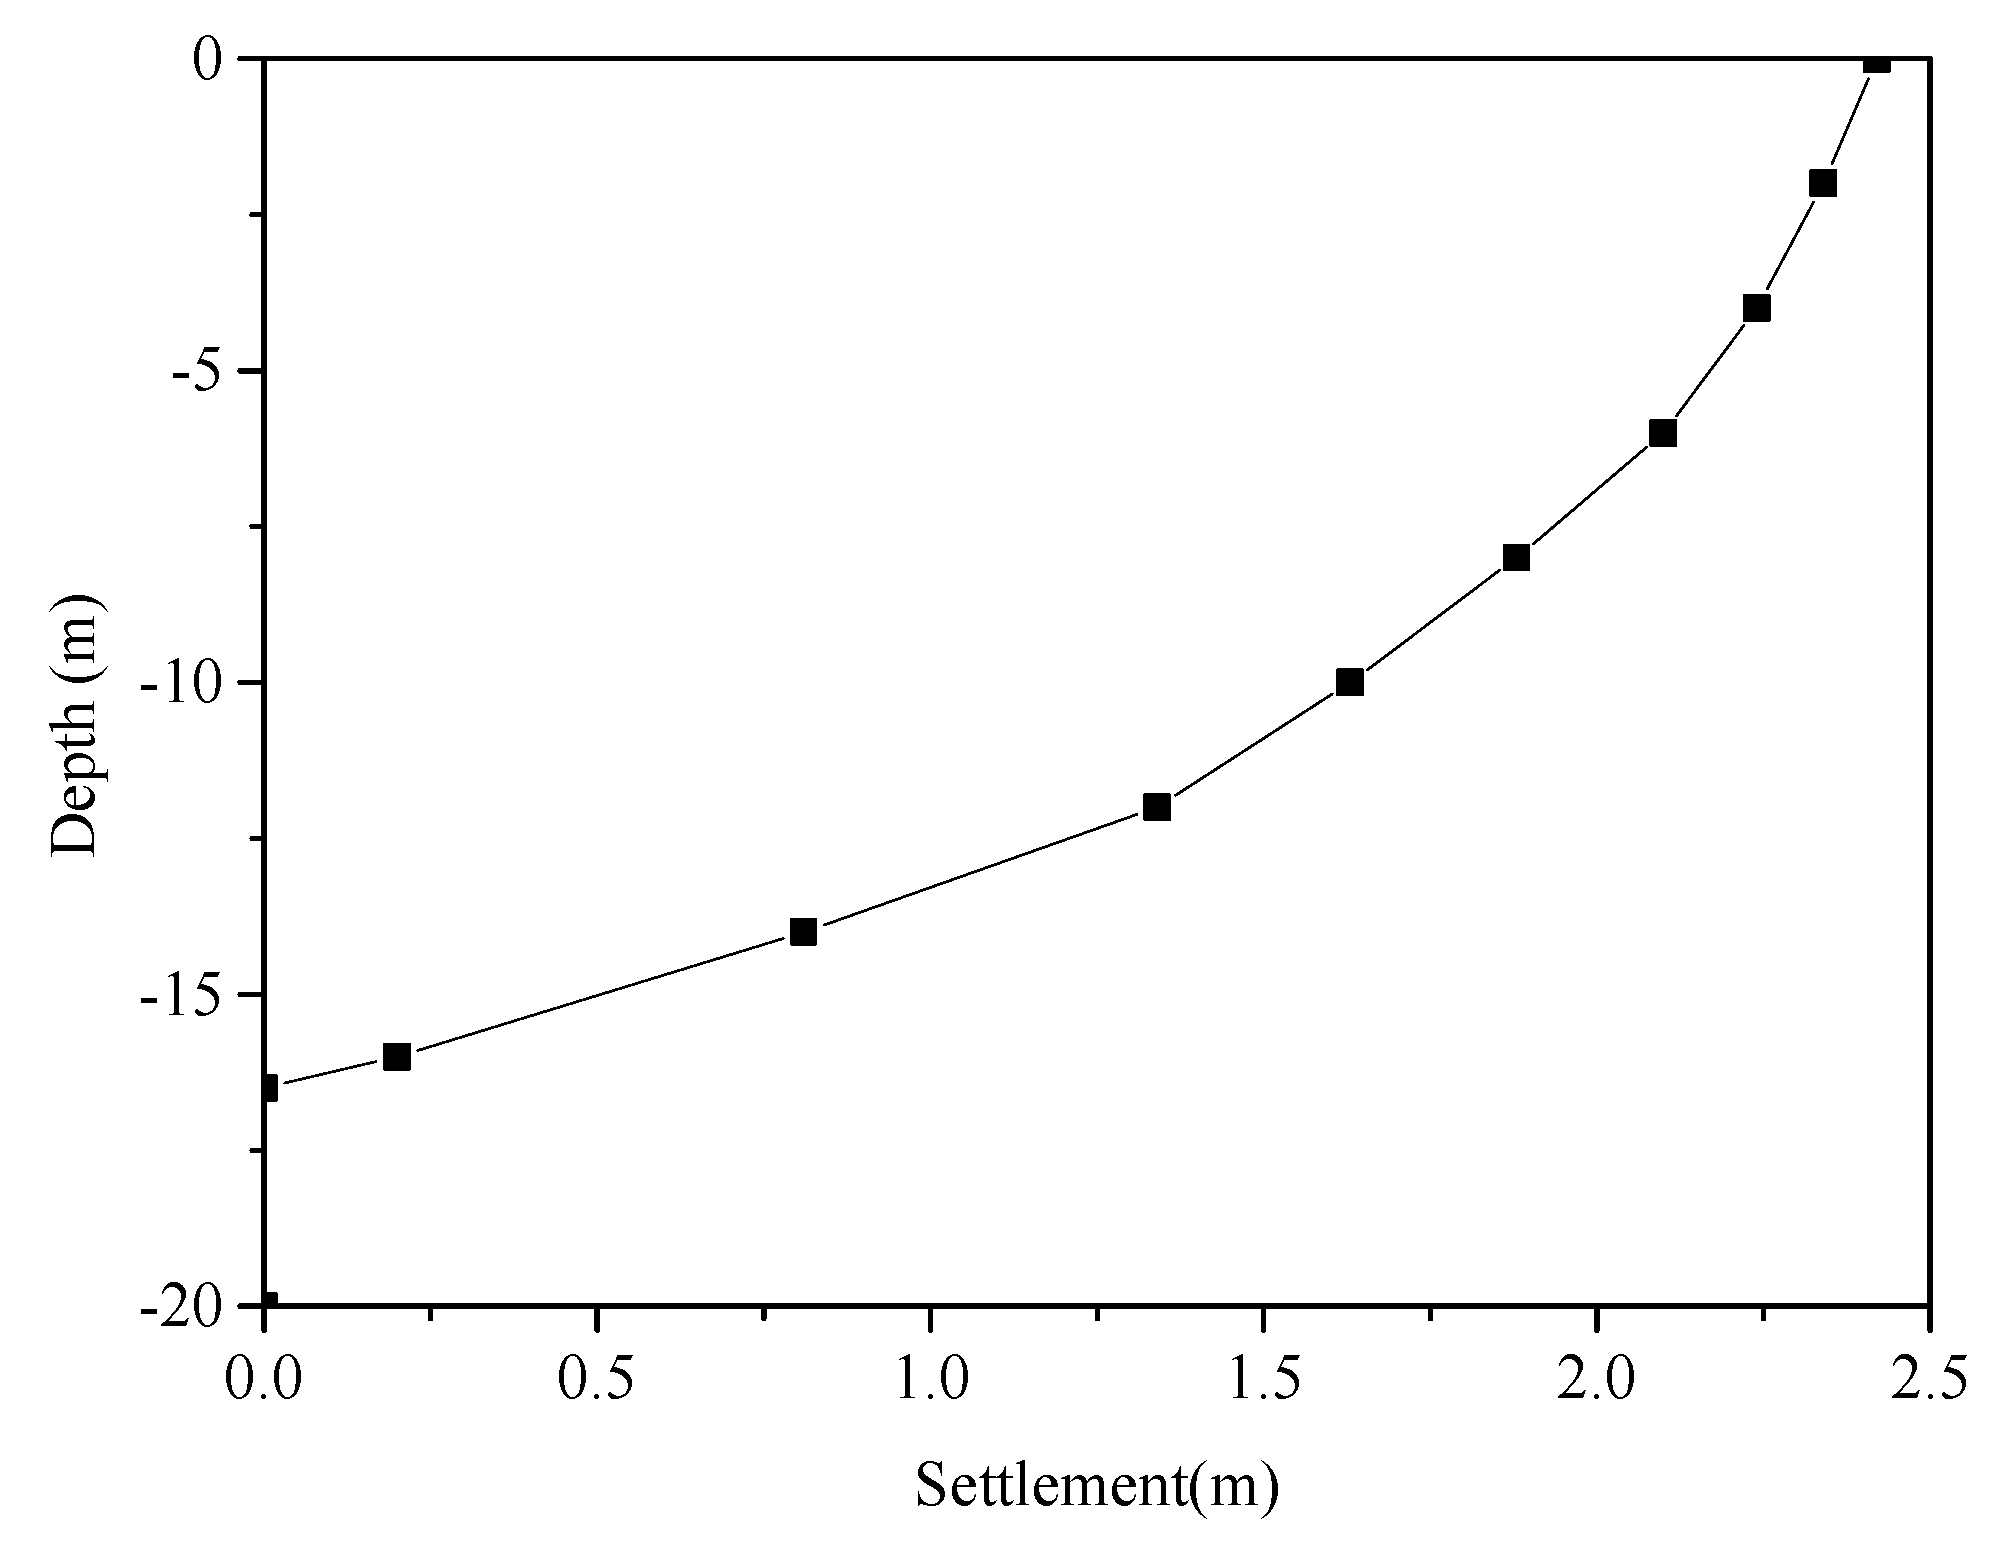
Figure 16 shows the soil settlement at different depths below the ground surface. The impact depth of about 16 m induced by train operation can be found, which indicates that the influence of one pass-by train is small.
In order to predict the cumulative deformation of the ground under the moving train dynamic load, the empirical formula that was proposed by Chai and Miura [30] was used. The formula was established by the soil cumulative plastic strain results based on the indoor dynamic triaxial test, which is defined as:
where is the cumulative plastic strain, is the number of cyclic loadings, is the dynamic deviatoric stress, is the initial static deviatoric stress, and is the static strength of the soil. When the soil is undrained, , can be obtained by the shear test.
The specific analysis process is:
- (a)
- Dynamic analysis of the three-dimensional track ground finite element model. The dynamic moving load is the wheel–rail contact force obtained by the train track dynamic model.
- (b)
- The dynamic analysis is carried out to obtain the dynamic response of the soil after one single train pass-by. The maximum dynamic deviator stress of the soil can be obtained.
- (c)
- The static analysis of the model can obtain the initial static deviator stress of the soil.
- (d)
- Use the empirical formula Equation (3) to calculate the plastic cumulative strain of the ground under any vehicle load times, and calculate the cumulative deformation of the ground.
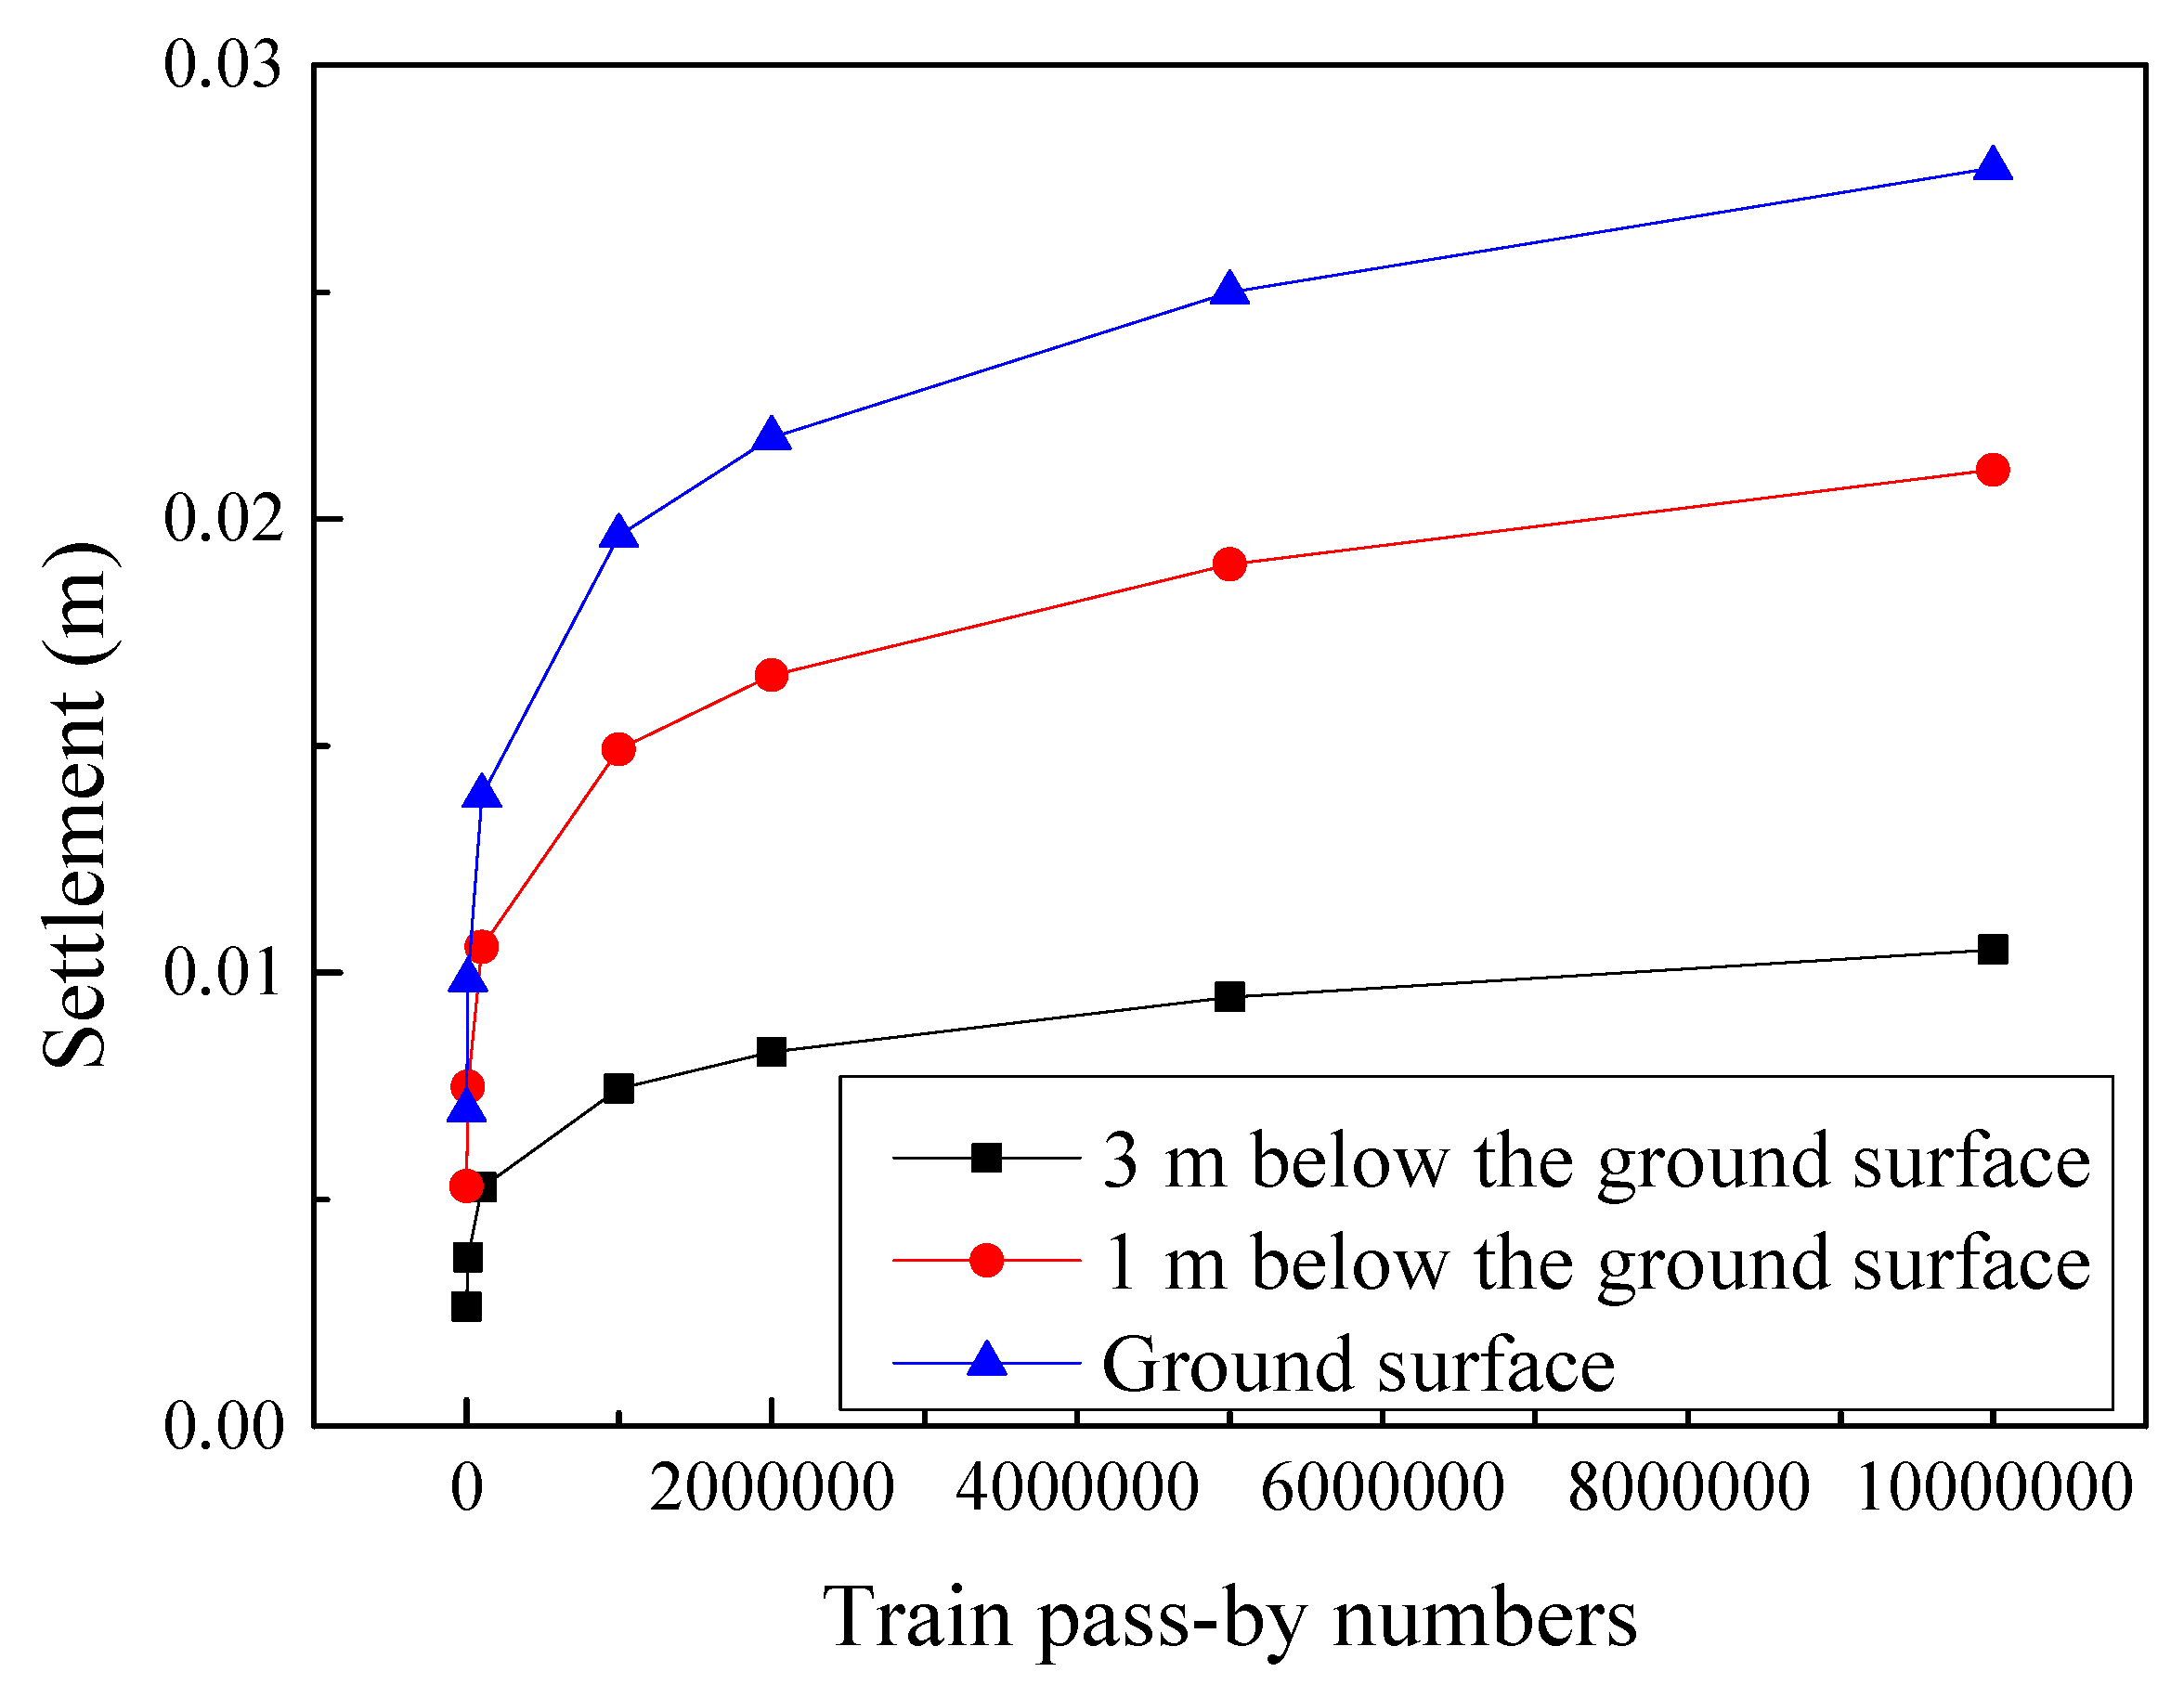
The integral deformation of the soil can be obtained by integrating the plastic strain in the depth direction. It can be seen from Figure 17 that the cumulative deformation of the ground increases with the increase of the number of times of loading. The deformation rate is the largest in the early stage of loading, and as the number of loads increases, the growth rate of cumulative deformation gradually decreases, and 500,000 times is the inflection point of the curve. Before 500,000 train operations, the cumulative deformations of the soil at the ground surface, one meter under the ground surface, and three meters under the ground surface are close to each other. However, when the number of loading increases to 10,000,000 times and 20,000,000 times, the cumulative deformations of the ground at different depths are quite different. This may affect the safety of the railway operation; thus, foundation reinforcement measures ought to be considered during construction.
According to the above analysis, the ground settlement is caused by mining, rather than embankment construction and train operation. The mined-out region is too large and difficult to manage. The salt mine should stop mining immediately to avoid the mined-out region expanding further and thus increasing processing difficulty. For abandoned wells in the mining area, it is necessary to carry out grouting sealing in the hole and to reinforce the weak broken zone by grouting. On the one hand, it can block the loss path of quaternary sand and soil particles, thus preventing further loss and the tunneling of quaternary strata. On the other hand, this method can seal the brine in the cave and make use of the good tightness of salt rock and cover mudstone, so that the brine pressure will increase with the shrinkage of the cave and increase the brine pressure’s supporting force on the roof, and further inhibit the subsidence of the overlying strata and ground subsidence.
6. Conclusions
In this paper, the settlement observation points were set up around the salt mine, and the ground settlement monitoring level network was established. The ground settlement and lateral displacement along the railway were studied last for 11 years. A finite element model was established to predicted long-term ground settlements over the mined-out region induced by designed railway construction and train operation. The conclusions are as follows:
- The finite element model can effectively predict the ground settlement induced by mechanical excavation of the salt mine and railway embankment construction as well as train operation. The cause of settlement is mainly due to the impact of the mined-out cavity, rather than railway construction and operation. For the design of the railway crossing the mining area, it is necessary to avoid crossing the settlement center area as much as possible, and establish a long-term settlement observation system.
- The mechanical excavations of the salt mine mainly lead to large ground settlement, and the horizontal displacement is relatively small.
- One train pass-by has less impact on the ground settlement. However, when the number of train pass-by increases to 10,000,000 times and 20,000,000 times, the cumulative deformations of the ground at different depth are quite large, which may affect the safety of the railway operation.
Author Contributions
Conceptualization, Y.W.; methodology, Y.W.; software, S.J.; validation, S.J. and Y.W.; data curation, S.J.; writing—original draft preparation, S.J.; writing—review and editing, Y.W.
Funding
This research was funded by China Railway Guangzhou Bureau Group Co., Ltd.
Conflicts of Interest
The authors declare no conflict of interest.
References
- Aditjandra, P.T.; Zunder, T.H.; Islam, D.M.Z.; Palacin, R. Green Rail Transportation: Improving Rail Freight to Support Green Corridors. In Green Transportation Logistics; Springer: Cham, Switzerland, 2016; pp. 413–454. [Google Scholar]
- Desir, G.; Gutiérrez, F.; Merino, J.; Carbonel, D.; Benito-Calvo, A.; Guerrero, J.; Fabregat, I. Rapid subsidence in damaging sinkholes: Measurement by high-precision leveling and the role of salt dissolution. Geomorphology 2018, 303, 393–409. [Google Scholar] [CrossRef]
- Chengzong, C.; Guangzhong, C.; Peisong, D. A study on the stability of railway subgrade in a salt lake. Proc. Int. Symp. Eng. Complex Rock Form. 1988, 607–614. [Google Scholar] [CrossRef]
- Yang, C.; Jing, W.; Daemen, J.J.K.; Zhang, G.; Du, C. Analysis of major risks associated with hydrocarbon storage caverns in bedded salt rock. Reliab. Eng. Syst. Saf. 2013, 113, 94–111. [Google Scholar] [CrossRef]
- Einstein, H.H.; Vick, S.G. Geological model for a tunnel cost model. In Proceedings of the Rapid Excavation and Tunneling Conference, San Francisco, CA, USA, 24–27 June 1974; pp. 1701–1720. [Google Scholar]
- Einstein, H.H. Risk and risk analysis in rock engineering. Tunn. Undergr. Space Technol. 1996, 11, 141–155. [Google Scholar] [CrossRef]
- Diamantidis, D.; Zuccarelli, F.; Westhäuser, A. Safety of long railway tunnels. Reliab. Eng. Syst. Saf. 2000, 67, 135–145. [Google Scholar] [CrossRef]
- Cagno, E.; De Ambroggi, M.; Grande, O.; Trucco, P. Risk analysis of underground infrastructures in urban areas. Reliab. Eng. Syst. Saf. 2011, 96, 139–148. [Google Scholar] [CrossRef]
- Bérest, P.; Brouard, B. Safety of salt caverns used for underground storage blow out; mechanical instability; seepage; cavern abandonment. Oil Gas Sci. Technol. 2003, 58, 361–384. [Google Scholar] [CrossRef]
- Yang, C.; Wang, T.; Li, Y.; Yang, H.; Li, J.; Qu, D.; Xu, B.; Yang, Y.; Daemen, J.J.K. Feasibility analysis of using abandoned salt caverns for large-scale underground energy storage in China. Appl. Energy 2015, 137, 467–481. [Google Scholar] [CrossRef]
- Chan, K.S.; Bodner, S.R.; Fossum, A.F.; Munson, D.E. A damage mechanics treatment of creep failure in rock salt. Int. J. Damage Mech. 1997, 6, 121–152. [Google Scholar] [CrossRef]
- Li, Y.; Yang, C. On fracture saturation in layered rocks. Int. J. Rock Mech. Min. Sci. 2007, 6, 936–941. [Google Scholar] [CrossRef]
- Heusermann, S.; Rolfs, O.; Schmidt, U. Nonlinear finite-element analysis of solution mined storage caverns in rock salt using the LUBBY2 constitutive model. Comput. Struct. 2003, 81, 629–638. [Google Scholar] [CrossRef]
- Zhang, N.; Ma, L.; Wang, M.; Zhang, Q.; Li, J.; Fan, P. Comprehensive risk evaluation of underground energy storage caverns in bedded rock salt. J. Loss Prev. Process Ind. 2017, 45, 264–276. [Google Scholar] [CrossRef]
- Cai, K.; Li, Y. The theory and practice of infrared radiation surveying technology of geological structure in pit. J. Xiangtan Min. Inst. 2002, 17, 5–8. [Google Scholar] [CrossRef]
- Yu, X.D.; Yang, Z. Environmental Impacts of the Mining Activities in the High Mountain Regions of Yunnan Province, China. In Proceedings of the ISRM International Symposium—EUROCK 2002, Madeira, Portugal, 25–27 November 2002; International Society for Rock Mechanics and Rock Engineering: Salzburg, Austria, 2002. [Google Scholar]
- Guangya, W.; Bin, S.; Zulin, Q.; Shiliang, W. Investigation on Hetang earth fissure in south Jiangyin. Geotech. Investig. Surv. 2009, 4, 2. [Google Scholar]
- Yao, X.L.; Reddish, D.J.; Whittake, B.N.R. Non-linear finite element analysis of surface subsidence arising from inclined seam extraction. Int. J. Rock Mech. Min. Sci. Geomech. 1993, 30, 4. [Google Scholar] [CrossRef]
- O’connor, K.M.; Dowding, C.H. Distinct element modeling and analysis of mining-induced subsidence. Rock Mech. Rock Eng. 1992, 25, 1–24. [Google Scholar] [CrossRef]
- Díaz-Fernández, M.E.; Álvarez-Fernández, M.I.; Álvarez-Vigil, A.E. Computation of influence functions for automatic mining subsidence prediction. Comput. Geosci. 2010, 14, 83–103. [Google Scholar] [CrossRef]
- Fan, Y.; Li, X. Study of 3D finite-element modeling on the law of solution mining subsidence. Ind. Miner. Process. 2008, 9, 6. [Google Scholar]
- Liu, C.; Xu, L.; Xian, X. Fractal-like kinetic characteristics of rock salt dissolution in water. Colloids Surf. A Physicochem. Eng. Asp. 2002, 201, 231–235. [Google Scholar] [CrossRef]
- Li, X.; Wang, S.; Malekian, R.; Hao, S.; Li, Z. Numerical Simulation of Rock Breakage Modes under Confining Pressures in Deep Mining: An Experimental Investigation. IEEE Access 2016, 4, 5710–5720. [Google Scholar] [CrossRef]
- Yu, X.B.; Xie, Q.; Li, X.Y.; Na, Y.K.; Song, Z.P. Cycle loading tests of rock samples under direct tension and compression and bi-modular constitutive model. Chin. J. Geotech. Eng. 2005, 27, 988. [Google Scholar]
- Ren, S.; Jiang, D.Y.; Yang, C.H.; Jiang, Z.W. Study on a new probability integral 3D model for forecasting solution mining subsidence of rock salt. Rock Soil Mech. 2007, 28, 133–138. [Google Scholar]
- Wenxiu, L. Fuzzy mathematics models on rockmass displacements due to open-underground combined mining for thick ore body with steep dip angle. Chin. J. Rock Mech. Eng. 2004, 23, 572–577. [Google Scholar]
- Zou, C.; Wang, Y.; Moore, J.A.; Sanayei, M. Train-induced field vibration measurements of ground and over-track buildings. Sci. Total Environ. 2017, 575, 1339–1351. [Google Scholar] [CrossRef] [PubMed]
- Lombaert, G.; Degrande, G. Ground-borne vibration due to static and dynamic axle loads of InterCity and high-speed trains. J. Sound Vib. 2009, 319, 1036–1066. [Google Scholar] [CrossRef]
- Yang, J.; Li, P.; Lu, Z. Numerical simulation and in-situ measurement of ground-borne vibration due to subway system. Sustainability 2018, 10, 2439. [Google Scholar] [CrossRef]
- Chai, J.C.; Miura, N. Traffic-load-induced permanent deformation of road on soft subsoil. J. Geotech. Geo-Environ. Eng. 2002, 10, 907–916. [Google Scholar] [CrossRef]
Figure 1.
Plan view of railway and mined-out cave.

Figure 2.
Ground deformation monitoring level network.

Figure 3.
Ground crack.

Figure 4.
Settlement contour map of mine area after (a) 12 months; (b) 36 months; (c) 60 months; (d) 84 months; (e) 108 months; and (f) 132 months.
Figure 4.
Settlement contour map of mine area after (a) 12 months; (b) 36 months; (c) 60 months; (d) 84 months; (e) 108 months; and (f) 132 months.


Figure 5.
Lateral displacement vector.

Figure 6.
Finite element model.

Figure 7.
Railway embankment.

Figure 8.
Finite element model of mined-out cavities.

Figure 9.
Comparison of predicted settlement and measured settlement.

Figure 10.
Soil settlement at different depths below the railway embankment change with different embankment heights.
Figure 10.
Soil settlement at different depths below the railway embankment change with different embankment heights.

Figure 11.
Predicted long-term settlement along the railway.

Figure 12.
Predicted settlement contour map of the mine area after five years of railway construction.
Figure 12.
Predicted settlement contour map of the mine area after five years of railway construction.

Figure 13.
Schematic drawing of the dynamics model of a train.

Figure 14.
Schematic drawing of the dynamics model of track structure.

Figure 15.
Ground settlement along the railway during the train runs in the central area of the mined-out cavity.
Figure 15.
Ground settlement along the railway during the train runs in the central area of the mined-out cavity.

Figure 16.
Soil settlement at different depths below the ground surface.

Figure 17.
Cumulative soil settlement changed with different train pass-by numbers.


Table 1.
Statistics of mining depth.
| Name | Depth/m | Name | Depth/m |
|---|---|---|---|
| Catalina mine | 280 | Nantong mine | 281 |
| Poblek mine | 441 | Panzhihua mine | 56–102 |
| Sverdlov mine | 360 | Denghe mine | 305–325 |
| Southlowitz mine | 250 | Zibo mine | 173 |
| Yorkshire ore | 90 | Ganshan mine | 100 |
| North England mine | 550 | Weishan mine | 213 |
| Hucknall mine | 176 | Shengli mine | 506 |
| Lancashire mine | 640 | Linyi mine | 112 |
Table 2.
Soil layer distribution.
| Depth (m) | Soil Layer |
|---|---|
| 25.5 | Quaternary soil layer |
| 324.5 | Silty mudstone |
| 412.5 | Mudstone |
| 481.52 | Mudstone |
| 491.49 | Halite |
| 494.72 | Interlayer |
| 497.88 | Halite |
| 505.13 | Interlayer |
| 509.91 | Halite |
| 512.79 | Interlayer |
| 516.22 | Halite |
| 600 | Mudstone |
Table 3.
Physical and mechanical properties of soil layers.
| Soil Layer | Density (kg/m3) | Elasticity Modulus (GPa) | Poisson’s Ratio | Cohesion (MPa) | Inner Friction Angle (°) |
|---|---|---|---|---|---|
| Quaternary soil layer | 1800 | 0.01 | 0.3 | / | / |
| Silty mudstone | 2200 | 0.9 | 0.27 | 0.5 | 35 |
| Mudstone | 2400 | 0.9 | 0.27 | 0.5 | 35 |
| Halite | 2200 | 1.2 | 0.3 | 0.5 | 30 |
| Interlayer | 2200 | 0.4 | 0.2 | 0.5 | 30 |
| Railway embankment | 2000 | 0.015 | 0.27 | / | / |
Table 4.
Dynamics parameters of the train.
| Distance between two bogies | 12.6 m | Wheelset mass | 1800 kg |
| Distance between two axles of bogie | 2.0 m | Wheel rolling radius | 0.42 m |
| Car mass | 50,320 kg | Primary suspension stiffness | 2.45 × 10⁶ kN/m |
| Car body inertia | 1.513 × 10⁶ kg∙m2 | Secondary suspension stiffness | 1.04 × 10⁶ kN/m |
| Bogie mass | 3000 kg | Primary suspension damping | 8 × 10⁴ kN∙s/m |
| Bogie inertia | 2100 kg∙m2 | Secondary suspension damping | 6 × 10⁴ kN∙s/m |
Table 5.
Track structure parameters.
| Rail elastic modulus | N/m2 | 2.06 × 10¹¹ | Rail mass | kg/m | 60.64 |
| Rail cross-sectional area | m2 | 7.745 × 10⁻³ | Rail section moment of inertia | m4 | 3.217 × 10⁻⁵ |
| Rail density | kg/m3 | 7830 | Rail elastic pad damping | N∙s/m | 5 × 10⁴ |
| Rail elastic pad stiffness | MN/m | 100 | Sleeper mass | kg | 251 |
| Sleeper spacing | m | 0.6 | Ballast elastic modulus | Pa | 0.8 × 10⁸ |
| Sleeper elastic modulus | MPa | 30,000 | Ballast elastic modulus | MPa | 300 |
| Ballast mass | kg | 630 | Embankment elastic modulus | Pa/m | 1.3 × 10⁸ |
| Ballast damping | N∙s/m | 1.6 × 10⁵ | Embankment damping | N∙s/m | 6.32 × 10⁴ |
© 2019 by the authors. Licensee MDPI, Basel, Switzerland. This article is an open access article distributed under the terms and conditions of the Creative Commons Attribution (CC BY) license (http://creativecommons.org/licenses/by/4.0/).
Share and Cite
MDPI and ACS Style
Jiang, S.; Wang, Y. Long-Term Ground Settlements over Mined-Out Region Induced by Railway Construction and Operation. Sustainability 2019, 11, 875. https://0-doi-org.brum.beds.ac.uk/10.3390/su11030875
AMA Style
Jiang S, Wang Y. Long-Term Ground Settlements over Mined-Out Region Induced by Railway Construction and Operation. Sustainability. 2019; 11(3):875. https://0-doi-org.brum.beds.ac.uk/10.3390/su11030875
Chicago/Turabian StyleJiang, Shuo, and Yimin Wang. 2019. "Long-Term Ground Settlements over Mined-Out Region Induced by Railway Construction and Operation" Sustainability 11, no. 3: 875. https://0-doi-org.brum.beds.ac.uk/10.3390/su11030875
Note that from the first issue of 2016, this journal uses article numbers instead of page numbers. See further details here.