Economic Diversification Potential in the Rentier States towards a Sustainable Development: A Theoretical Model


Abstract
:1. Introduction
- Manufacturing goods of cars, home appliances, electronics, textiles, industrial equipment, and machinery, etc.
- Information and technology services, technical consultancy.
2. A Theoretical Model for an Effective Economic Diversification in a Rentier State
2.1. The Model Basics
- The internationally tradable sector is assumed to be comprising manufacturing goods, such as steel, clothes, textiles, machinery, engines, transport equipment and durable consumer goods, and the specific services, such as consultancy, IT and logistics.
- Non-tradable sectors are those, such as general services (banking, telecommunications, and healthcare), recreational businesses, and construction activities.
- While the price of a tradable good is set in the international market, the price of the non-tradable good is set in the domestic economy.
- Production characteristic of tradable sectors has increasing returns to scale (IRS), but requires a significant upfront capital investment (fixed cost) and skilled labor, which demand premium wages.
- The private agents will not enter into tradable sectors if there is no sufficient domestic demand to cover fixed cost and make a profit.
- Non-tradable sectors require much less capital investment and have constant returns to scale (CRS) production function.
- The ruler allows extraction, production, transportation and sales of natural resources to international and/or joint ventures and/or national corporations at varying levels at different times balancing the power and economic returns seeking recognition and acceptance from his population; and seeking recognition and protection from his international partners or allies.
- The ruler precedes the distribution of rent revenue (R) from sales to the population through public employment in return for their political acquiescence (rentier agreement).
- Therefore, rent revenue (R) is a significant source of political power and driver of domestic consumption.
- The ruler owns a significant share in the non-tradable sectors (banking, healthcare) to control a significant portion of the economy to prevent private agents from getting too much economic power at his expense.
- In the case of declining rent revenues, the ruler will face a dilemma of decreasing public wages or lay off some employees.
- Both of these options are undesirable in the rentier, such as GCC, states since they may induce challenge to the political authority of the ruler from the population [37].
- Hence, the ruler will support the diversification of the economy towards tradable sectors in order to create good paying jobs for the citizens as long as his share of the economy is not compromised and his political and social authority lasts.
2.2. Assumptions of the Model
XT = β × lT – F where XT is the amount produced, lT is the amount of labor used with β > 1 due to IRS or using advanced technology (opposed to fringe production). Here β is a parameter and represents the technological advancement of the economy/country meaning that the higher country’s advancement, then higher β. F represents initial (fixed) investment cost measured as labor units according to Murphy et al. (1989). In that equation, F has the same unit with labor and output.
XN = lN, where lN is the amount of labor used. We assume no fixed capital costs for the production of non-tradable goods or services.
2.3. Decision Variables and Scenarios of the Model
- Number of private agents operating in the nontradable sector for the second period (NN2),
- Number of private agents operating in the tradable sector for the second period (NT2).
3. A Solution of the Model and the Potential Scenario Outcomes for Economic Diversification
- P1+ε × CT + × CT + R = CT × (1 + P1+ε), where CT = and CN = Pε
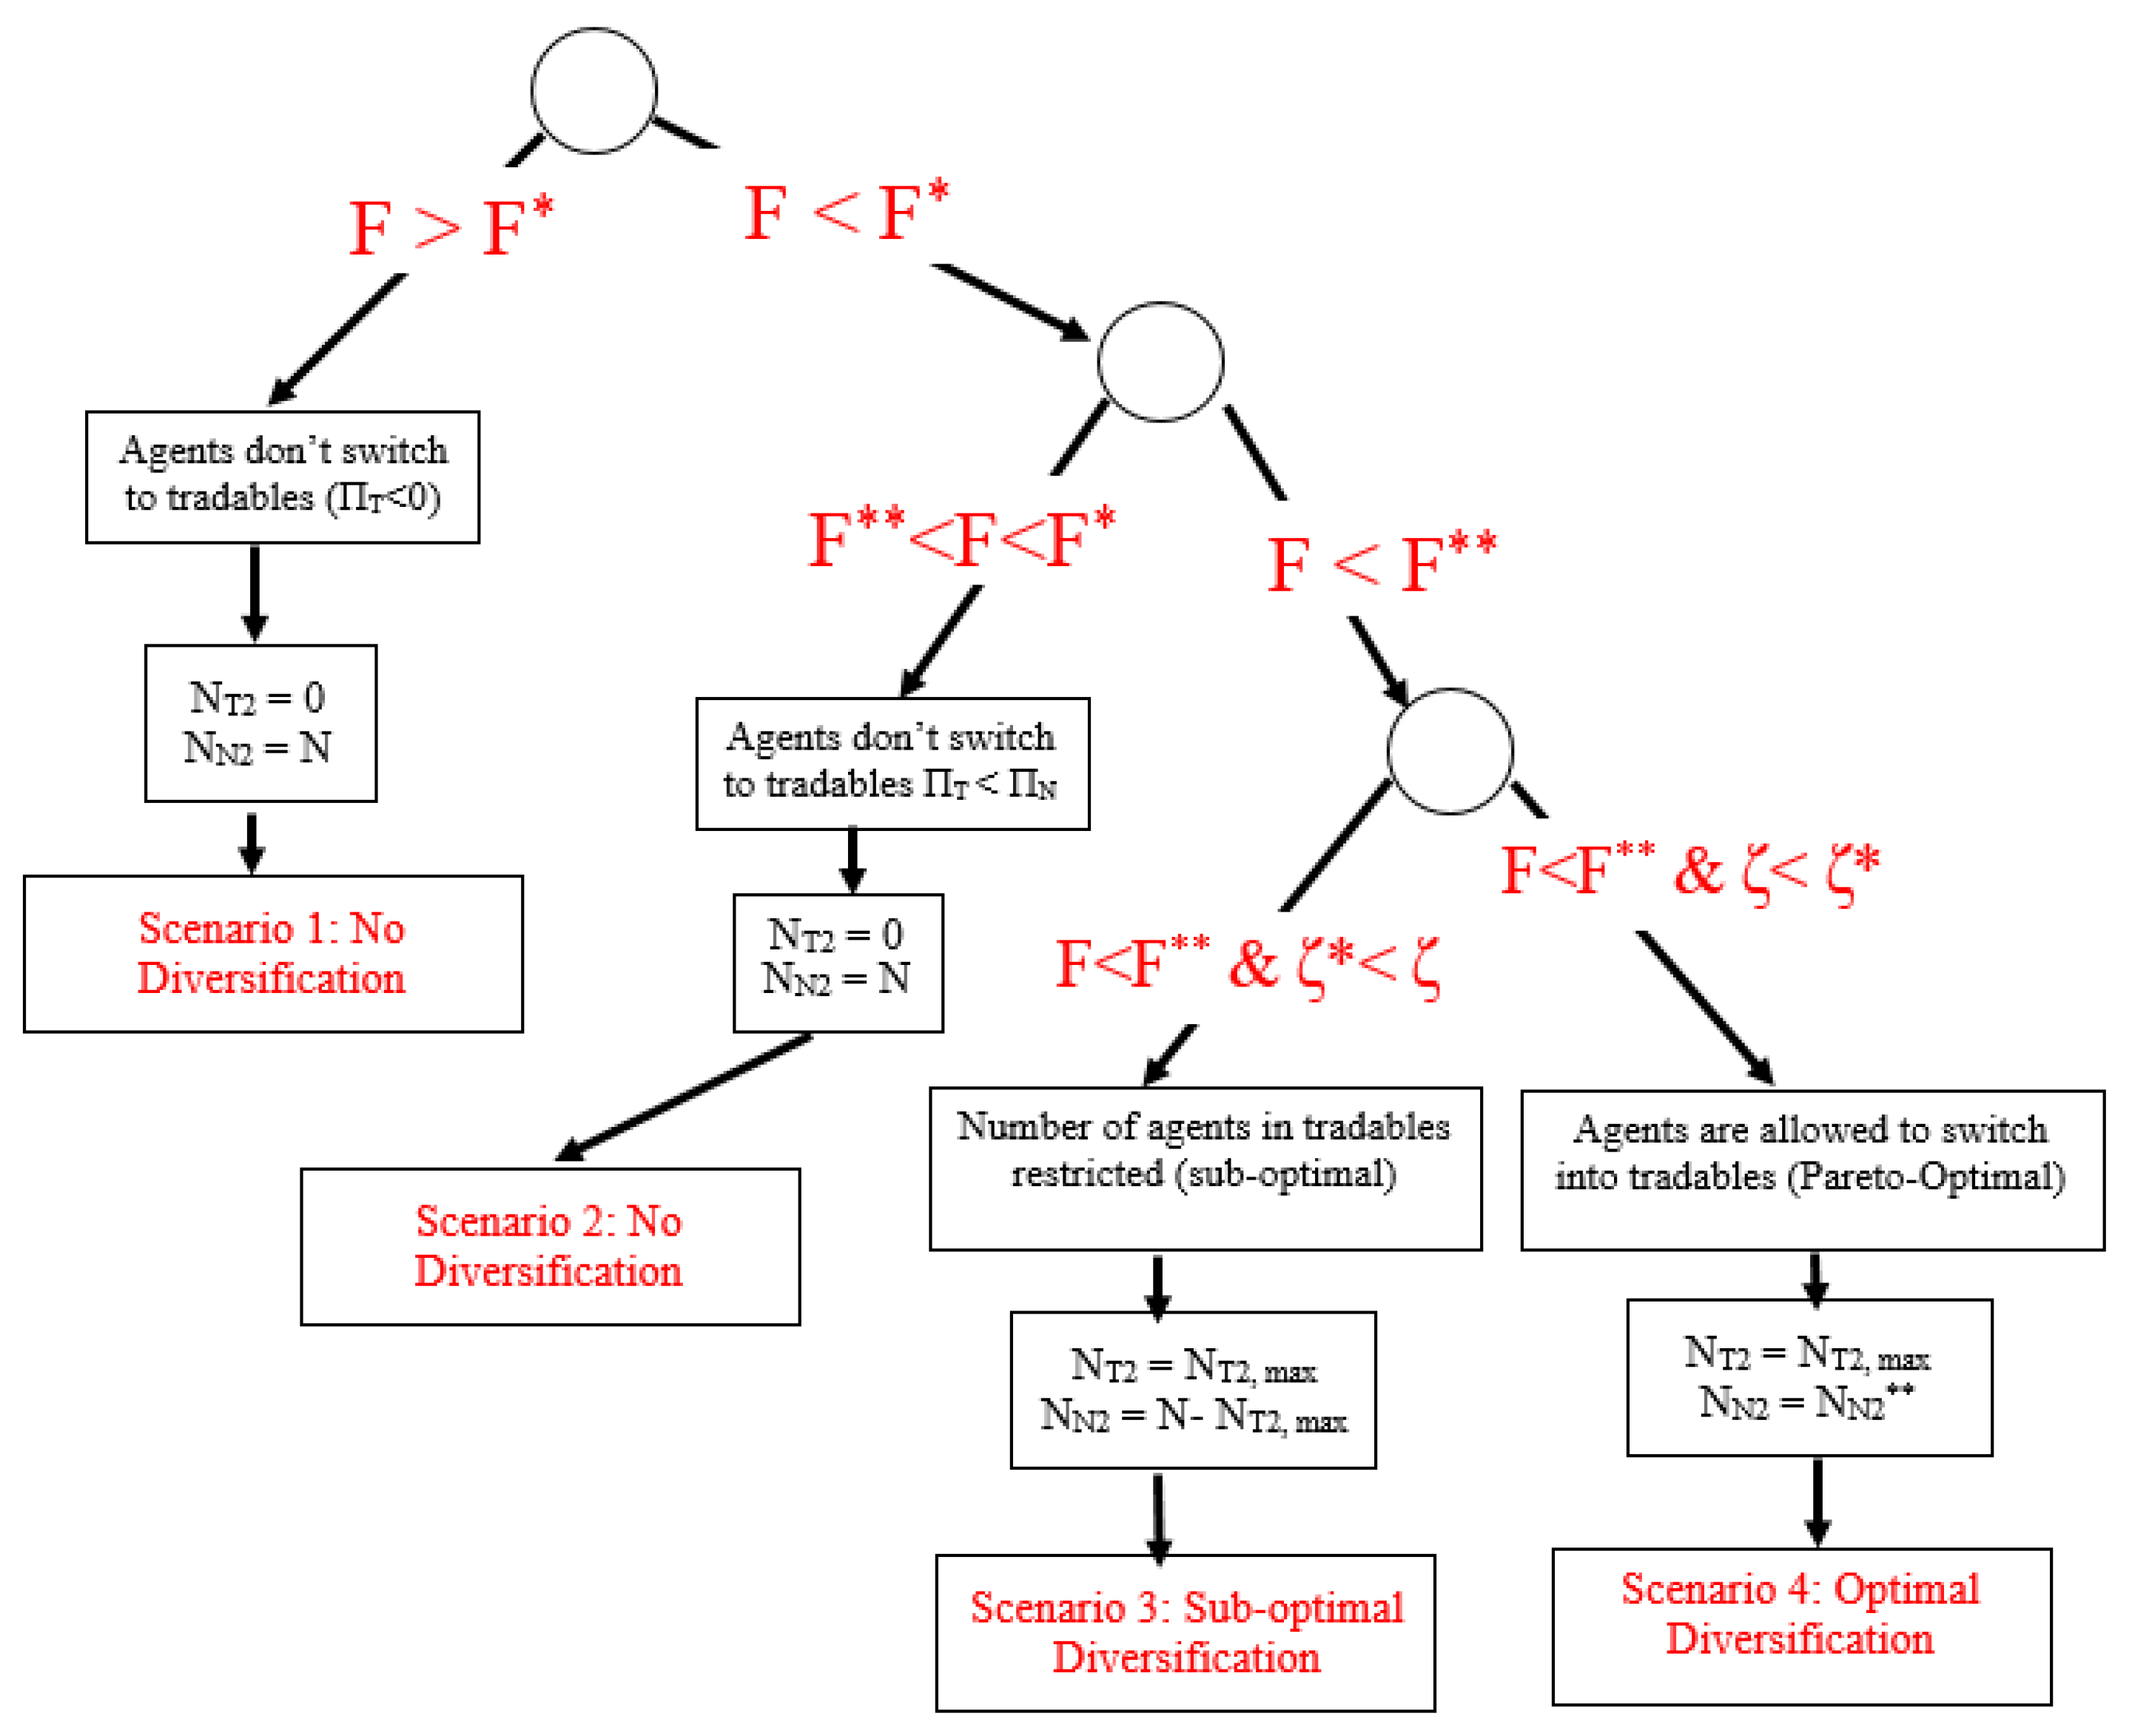
3.1. Potential Scenarios for Economic Diversification in a Rentier State
- Number of private agents operating in the nontradable sector for the second period (NN2),
- Number of private agents operating in the tradable sector for the second period (NT2).
- To stay in nontradable sectors,
- To move into tradable sectors in order to maximize their expected profits (πNT2 or πT2).
3.2. Findings of the Model
- The fixed cost of tradable sectors (F) can be relatively high or low for private agents to make a profit.
- The ruler’s controlling share in the economy (ζ) can be relatively high or low, which could restrict the economic diversification potential towards tradable sectors.
4. Conclusions
- The fixed cost of tradable sectors (F) can be relatively high or low for private agents to make a profit;
- The ruler’s controlling share in the economy (ζ) can be relatively high or low which could restrict the economic diversification potential towards tradable sectors.
5. Discussions
Author Contributions
Funding
Acknowledgments
Conflicts of Interest
References
- Hvidt, M. Economic and Institutional Reforms in the Arab Gulf Countries. Middle East J. 2011, 65, 85–102. [Google Scholar] [CrossRef]
- Ismail, K. The Structural Manifestation of the ‘Dutch Disease’: The Case of Oil Exporting Countries. IMF Work. Pap. 2010, 10, 1–36. [Google Scholar] [CrossRef]
- Matsen, E.; Torvik, R. Optimal dutch disease. J. Dev. Econ. 2005, 78, 494–515. [Google Scholar] [CrossRef]
- Hausmann, R.; Rigobon, R. An alternative interpretation of the ’resource curse’: Theory and policy implications. Available online: https://www.nber.org/papers/w9424 (accessed on 22 January 2019).
- Herb, M. Taxation and representation. Stud. Comp. Int. Dev. 2003, 38, 3. [Google Scholar] [CrossRef]
- Gray, M. A Theory of ‘Late Rentierism’ in the Arab States of the Gulf. Available online: https://repository.library.georgetown.edu/bitstream/handle/10822/558291/CIRSOccasionalPaper7MatthewGray2011.pdf (accessed on 22 January 2019).
- Mahdavy, H. The patterns and problems of economic development in rentier states: The case of Iran. In Studies in the Economic History of the Middle East: From the Rise of Islam to the Present Day; Oxford University Press: London, UK, 1970; pp. 428–467. [Google Scholar]
- Beblawi, H. The rentier state in the Arab world. Arab Stud. Q. 1987, 9, 383–398. [Google Scholar]
- Wiktorowicz, Q. The limits of democracy in the Middle East: The case of Jordan. Middle East J. 1999, 53, 606–620. [Google Scholar]
- Hvidt, M. Economic diversification in GCC countries: Past record and future trends. Lond. Sch. Econ. Political Sci. 2013, 27, 1–55. [Google Scholar]
- Luciani, F.G. Allocation vs. production states: A theoretical framework. In The Rentier State, 1st ed.; Routledge: Abingdon-on-Thames, UK, 1990; pp. 65–84. [Google Scholar]
- Kaya, A.; Tsai, I. Inclusive Economic Institutions in the Gulf Cooperation Council States: Current Status and Theoretical Implications. Rev. Middle East Econ. Financ. 2016, 12, 139–173. [Google Scholar] [CrossRef]
- Reed, D. Economic Change, Governance and Natural Resource Wealth: The Political Economy of Change in Southern Africa; Routledge: Abingdon-on-Thames, UK, 2001. [Google Scholar]
- Arezki, R.; Blanchard, O. Seven Questions About the Recent Oil Price Slump. Available online: https://blogs.imf.org/2014/12/22/seven-questions-about-the-recent-oil-price-slump/ (accessed on 22 January 2019).
- Arbib, J.; Seba, T. Rethinking Transportation 2020–2030. Available online: https://static1.squarespace.com/static/585c3439be65942f022bbf9b/t/591a2e4be6f2e1c13df930c5/1494888038959/RethinkX+Report_051517.pdf (accessed on 22 January 2019).
- Kilian, L. The impact of the shale oil revolution on US oil and gasoline prices. Rev. Environ. Econ. Policy 2016, 10, 185–205. [Google Scholar] [CrossRef]
- Kaya, A.; Choucri, N.; Tsai, I.-T.; Mezher, T. Energy consumption and transition dynamics to a sustainable future under a rentier economy: The case of the GCC states. In Sustainability in the Gulf: Challenges and Opportunities; Routledge: Abingdon-on-Thames, UK, 2017. [Google Scholar]
- Rautava, J. The role of oil prices and the real exchange rate in Russia’s economy—A cointegration approach. J. Comp. Econ. 2004, 32, 315–327. [Google Scholar] [CrossRef]
- Pindyck, R.S. Volatility in natural gas and oil markets. J. Energy Dev. 2004, 30, 1–19. [Google Scholar]
- Obi, C. Resource Governance and the Crisis of Development. In The Palgrave Handbook of African Politics, Governance and Development; Springer: New York, NY, USA, 2018; pp. 607–618. [Google Scholar]
- Callen, M.T.; Cherif, R.; Hasanov, F.; Hegazy, M.A.; Khandelwal, P. Economic Diversification in the GCC: Past, Present, and Future; International Monetary Fund: Washington, DC, USA, 2014. [Google Scholar]
- Hertog, S. Defying the resource curse: explaining successful state-owned enterprises in rentier states. World Politics 2010, 62, 261–301. [Google Scholar] [CrossRef]
- Tsai, I.-T.; Kaya, A. Economic Diversification and the Emergence of Inclusive Economic Institutions in the Gulf Cooperation Council States. In Policy-Making in the GCC: State, Citizens and Institutions; I.B. Taurus: London, UK, 2016; pp. 118–143. [Google Scholar]
- Tok, M.E.; Alkhater, L.R.M.; Pal, L.A. Policy-making in a transformative state: The case of Qatar. In Policy-Making in a Transformative State; Springer: New York, NY, USA, 2016; pp. 1–35. [Google Scholar]
- Gray, M. Theorising politics, patronage, and corruption in the Arab monarchies of the Gulf. In Clientelism and Patronage in the Middle East and North Africa; Routledge: Abingdon-on-Thames, UK, 2018; pp. 59–80. [Google Scholar]
- Al-Saleh, Y. Crystallising the Dubai model of cluster-based development. Place Brand. Public Dipl. 2018, 14, 305–317. [Google Scholar] [CrossRef]
- Pang, B.; Keng, S.; Zhong, L. Sprinting with Small Steps: China’s Cadre Management and Authoritarian Resilience. Available online: https://0-www-journals-uchicago-edu.brum.beds.ac.uk/doi/abs/10.1086/696870 (accessed on 22 January 2019).
- Riley, J. Authoritarian Institutions and Economic Growth: The Case of Singapore. Available online: https://lup.lub.lu.se/student-papers/search/publication/8950618 (accessed on 22 January 2019).
- Acemoglu, D.; Johnson, S.; Robinson, J.A. Institutions as a fundamental cause of long-run growth. Handb. Econ. Growth 2005, 1, 385–472. [Google Scholar]
- Albouy, D. The Colonial Origins of Comparative Development: A Reexamination Based on Improved Settler Mortality Data. Available online: https://eml.berkeley.edu/~webfac/dromer/e237_F04/albouy.pdf (accessed on 22 January 2019).
- Sachs, J.D.; Warner, A.M. The big push, natural resource booms and growth. J. Dev. Econ. 1999, 59, 43–76. [Google Scholar] [CrossRef]
- Acemoglu, D. Why not a political Coase theorem? Social conflict, commitment, and politics. J. Comp. Econ. 2003, 31, 620–652. [Google Scholar] [CrossRef]
- Osunmuyiwa, O.; Biermann, F.; Kalfagianni, A. Applying the multi-level perspective on socio-technical transitions to rentier states: The case of renewable energy transitions in Nigeria. J. Environ. Policy Plan. 2018, 20, 143–156. [Google Scholar] [CrossRef]
- Atalay, Y. Understanding Input and Output Legitimacy of Environmental Policymaking in The Gulf Cooperation Council States. Environ. Policy Gov. 2018, 28, 39–50. [Google Scholar] [CrossRef]
- Hanieh, A. Capitalism and Class in the Gulf Arab States; Springer: New York, NY, USA, 2016. [Google Scholar]
- Ali, O.; Elbadawi, I.; Selim, H. The Political Economy of Public Sector Employment In Resource Dependent Countries; Cambridge University Press: Cambridge, UK, 2016. [Google Scholar]
- Van der Ploeg, F. Natural resources: Curse or blessing? J. Econ. Lit. 2011, 49, 366–420. [Google Scholar] [CrossRef]
- Hertog, S. The Political Economy of Labour Markets and Migration in the Gulf; Sleiman-Haidar, R., Ed.; LSE Kuwait Programme: London, UK, 2016. [Google Scholar]
- Oh, J. Concentration, congestion, and the dynamics: Spatial re-modeling of the Murphy, Shleifer, and Vishny model. Lett. Spat. Resour. Sci. 2008, 1, 77–97. [Google Scholar] [CrossRef]
- Forstenlechner, I.; Rutledge, E. Unemployment in the Gulf: Time to update the ‘social contract’. Middle East Policy 2010, 17, 38–51. [Google Scholar] [CrossRef]
- Dibeh, G. The Political Economy of Monetary Policy in Resource-Rich Arab Economies. Available online: https://ideas.repec.org/p/erg/wpaper/896.html (accessed on 22 January 2019).
- Bjorvatn, K.; Coniglio, N.D. Big push or big failure? On the effectiveness of industrialization policies for economic development. J. Jpn. Int. Econ. 2012, 26, 129–141. [Google Scholar] [CrossRef]
- Murphy, K.M.; Shleifer, A.; Vishny, R.W. Industrialization and the big push. J. Polit. Econ. 1989, 97, 1003–1026. [Google Scholar] [CrossRef]
- Hertog, S. The Private Sector and Reform in the Gulf Cooperation Council; LSE Kuwait Programme: London, UK, 2013. [Google Scholar]
- Ulrichsen, K.C. Post-rentier Economic Challenges. India Q. 2017, 73, 210–226. [Google Scholar] [CrossRef]
- Yamada, M. Gulf-Asia relations as ‘post-rentier’ diversification? The case of the petrochemical industry in Saudi Arabia. J. Arab. Stud. 2011, 1, 99–116. [Google Scholar] [CrossRef]
- Levins, C.M. The rentier state and the survival of Arab absolute monarchies. Rutgers JL Relig 2012, 14, 388. [Google Scholar]


| The Ruler Decides Following to Maximize Economic Diversification at the End of t = 1 | Exogenous Shock | Parameters |
|---|---|---|
| NN2 | R → R/2 (P:1 + θ → 1 + θ/2) | F, ζ |
| NT2 |
| Ruler’s Decision at the End of t = 1 | Size of the Economy | Public Employment and Wages |
|---|---|---|
| NN2: No action needed | Y2 = (1+ (1 + θ/2)1+ε) × R/2 | LG1 = LG2 W1 = 1 + u, W2 = (1 + u)/2 |
| NT2: No action needed |
| Ruler’s Decision at the End of t = 1 | Size of the Economy | Public Employment and Wages |
|---|---|---|
| NN2: No action needed | Y2 = (1 + (1 + θ/2)1+ε) × R/2 | LG1 = LG2 W1 = 1 + u, W2 = (1 + u)/2 |
| NT2: No action needed |
| Ruler’s Decision At the End of t = 1 | Size of the Economy | Public Employment and Wages |
|---|---|---|
| NN2: No action needed | Y2 = (1 + (1 + θ/2)1+ε) × R/2 < (1 + (1 + θ/2)1+ε) × R/2 | LG1 ≥ LG2 W1 = 1 + u, (1 + u)/2 ≤ W2 ≤ 1 + u |
| NT2: Restricted to NT2,max |
| Ruler’s Decision At the End of t = 1 | Size of the Economy | Public Employment and Wages |
|---|---|---|
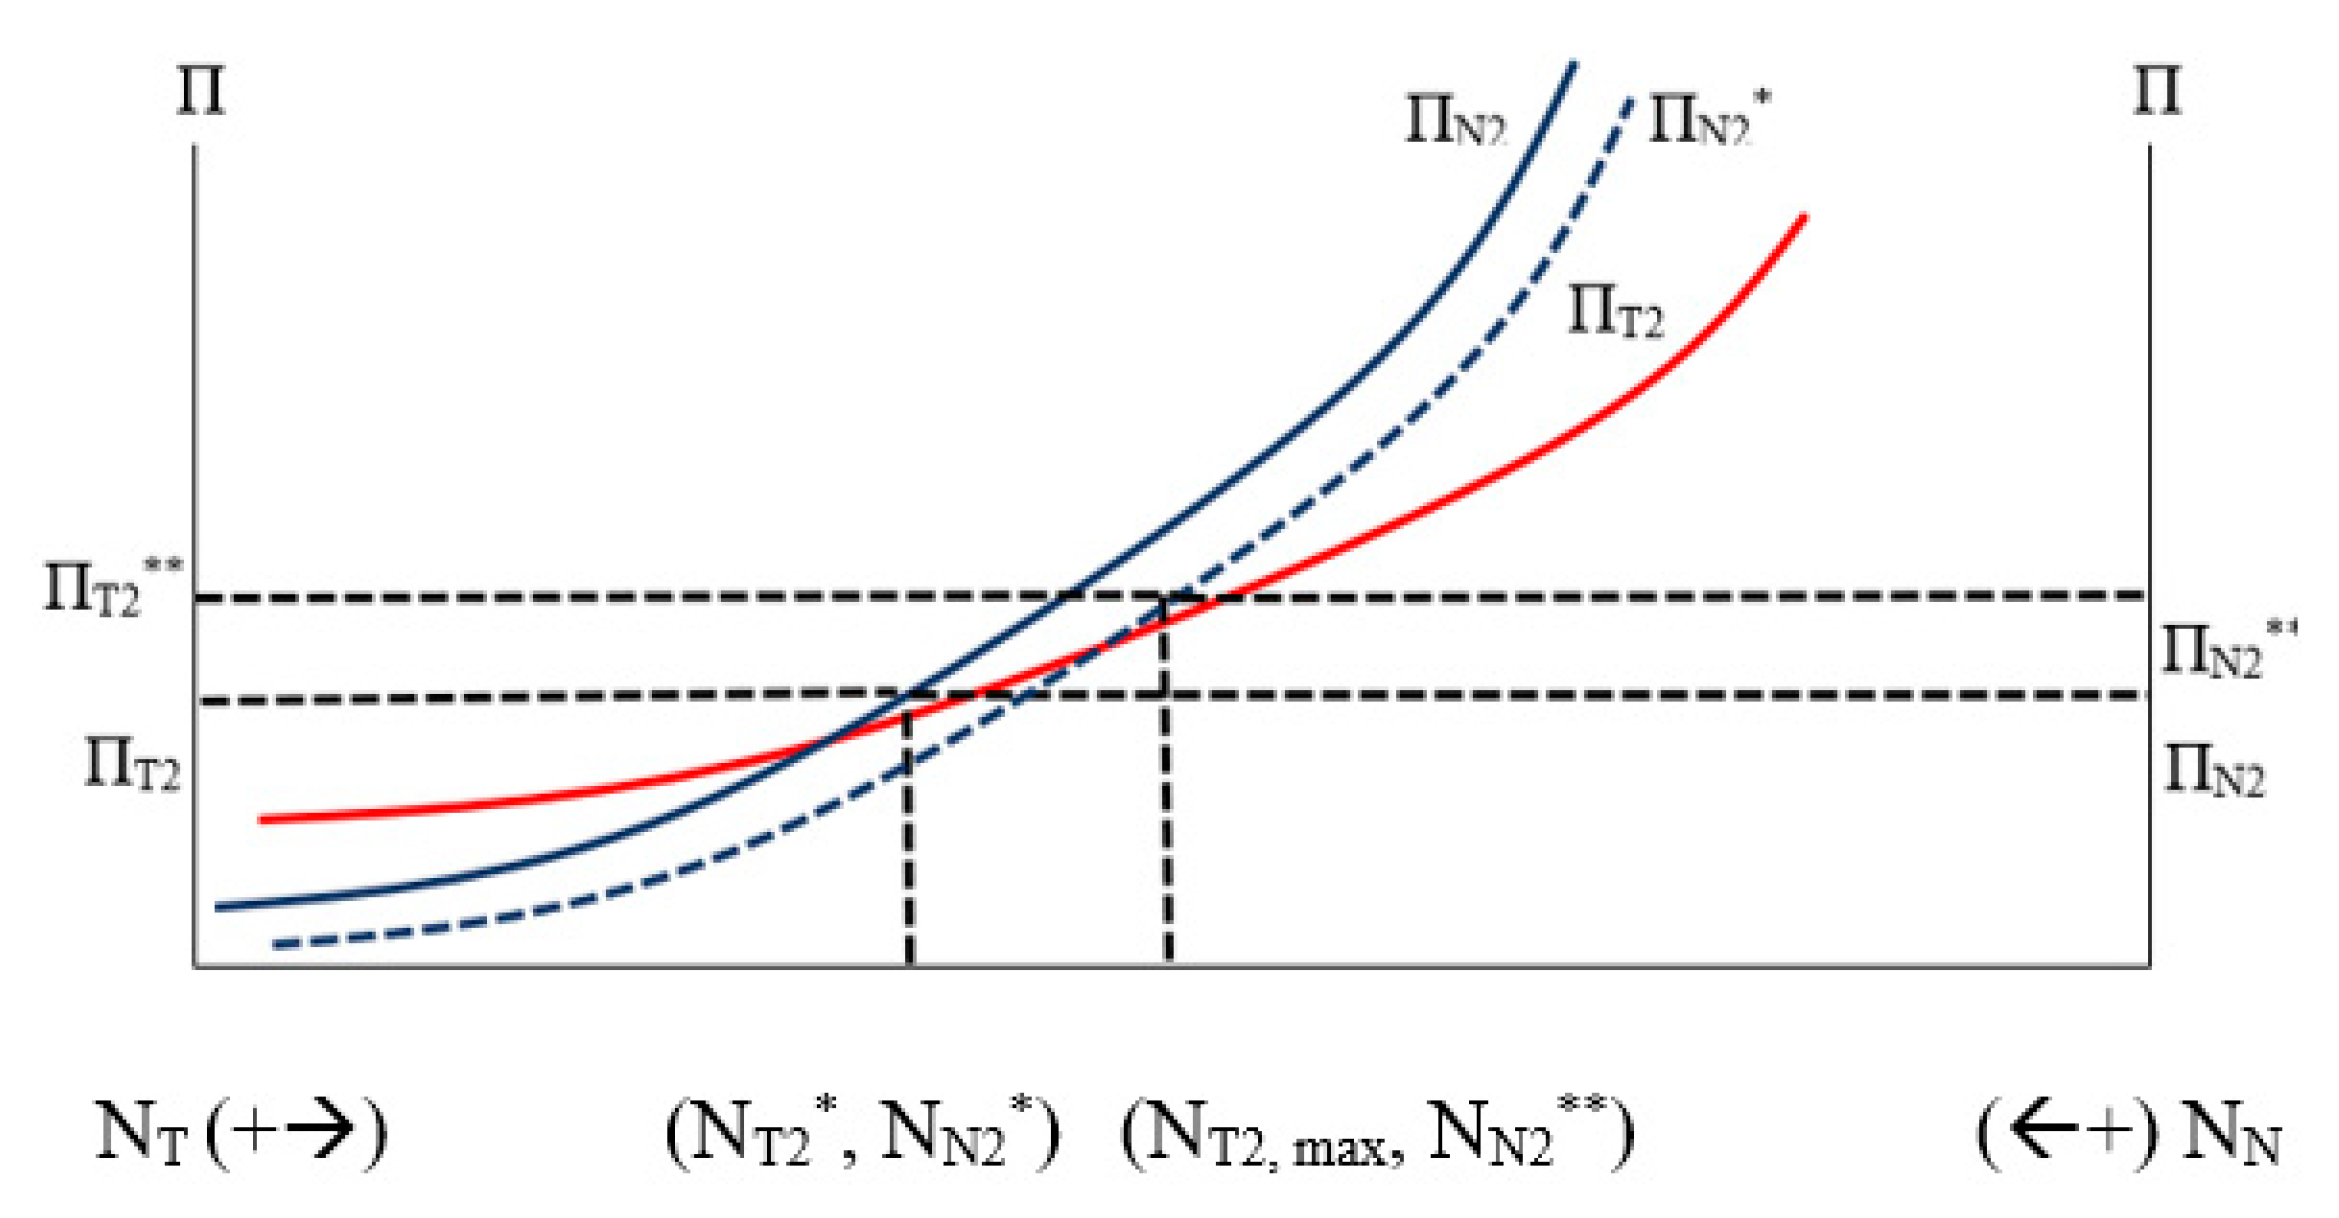
| NN2: Increased to NN2** from NN2* | Y2 = (1 + (1 + θ/2)1+ε) × R/2 > (1+ (1 + θ/2)1+ε) × R/2 | LG1 ≥ LG2 W1 = 1 + u, (1 + u)/2 ≤ W2 ≤ 1 + u |
| NT2: Increased to NT2,max |
| Scenarios | Binding Equations of the Scenario | Key Driver of the Scenario | Level of Diversification |
|---|---|---|---|
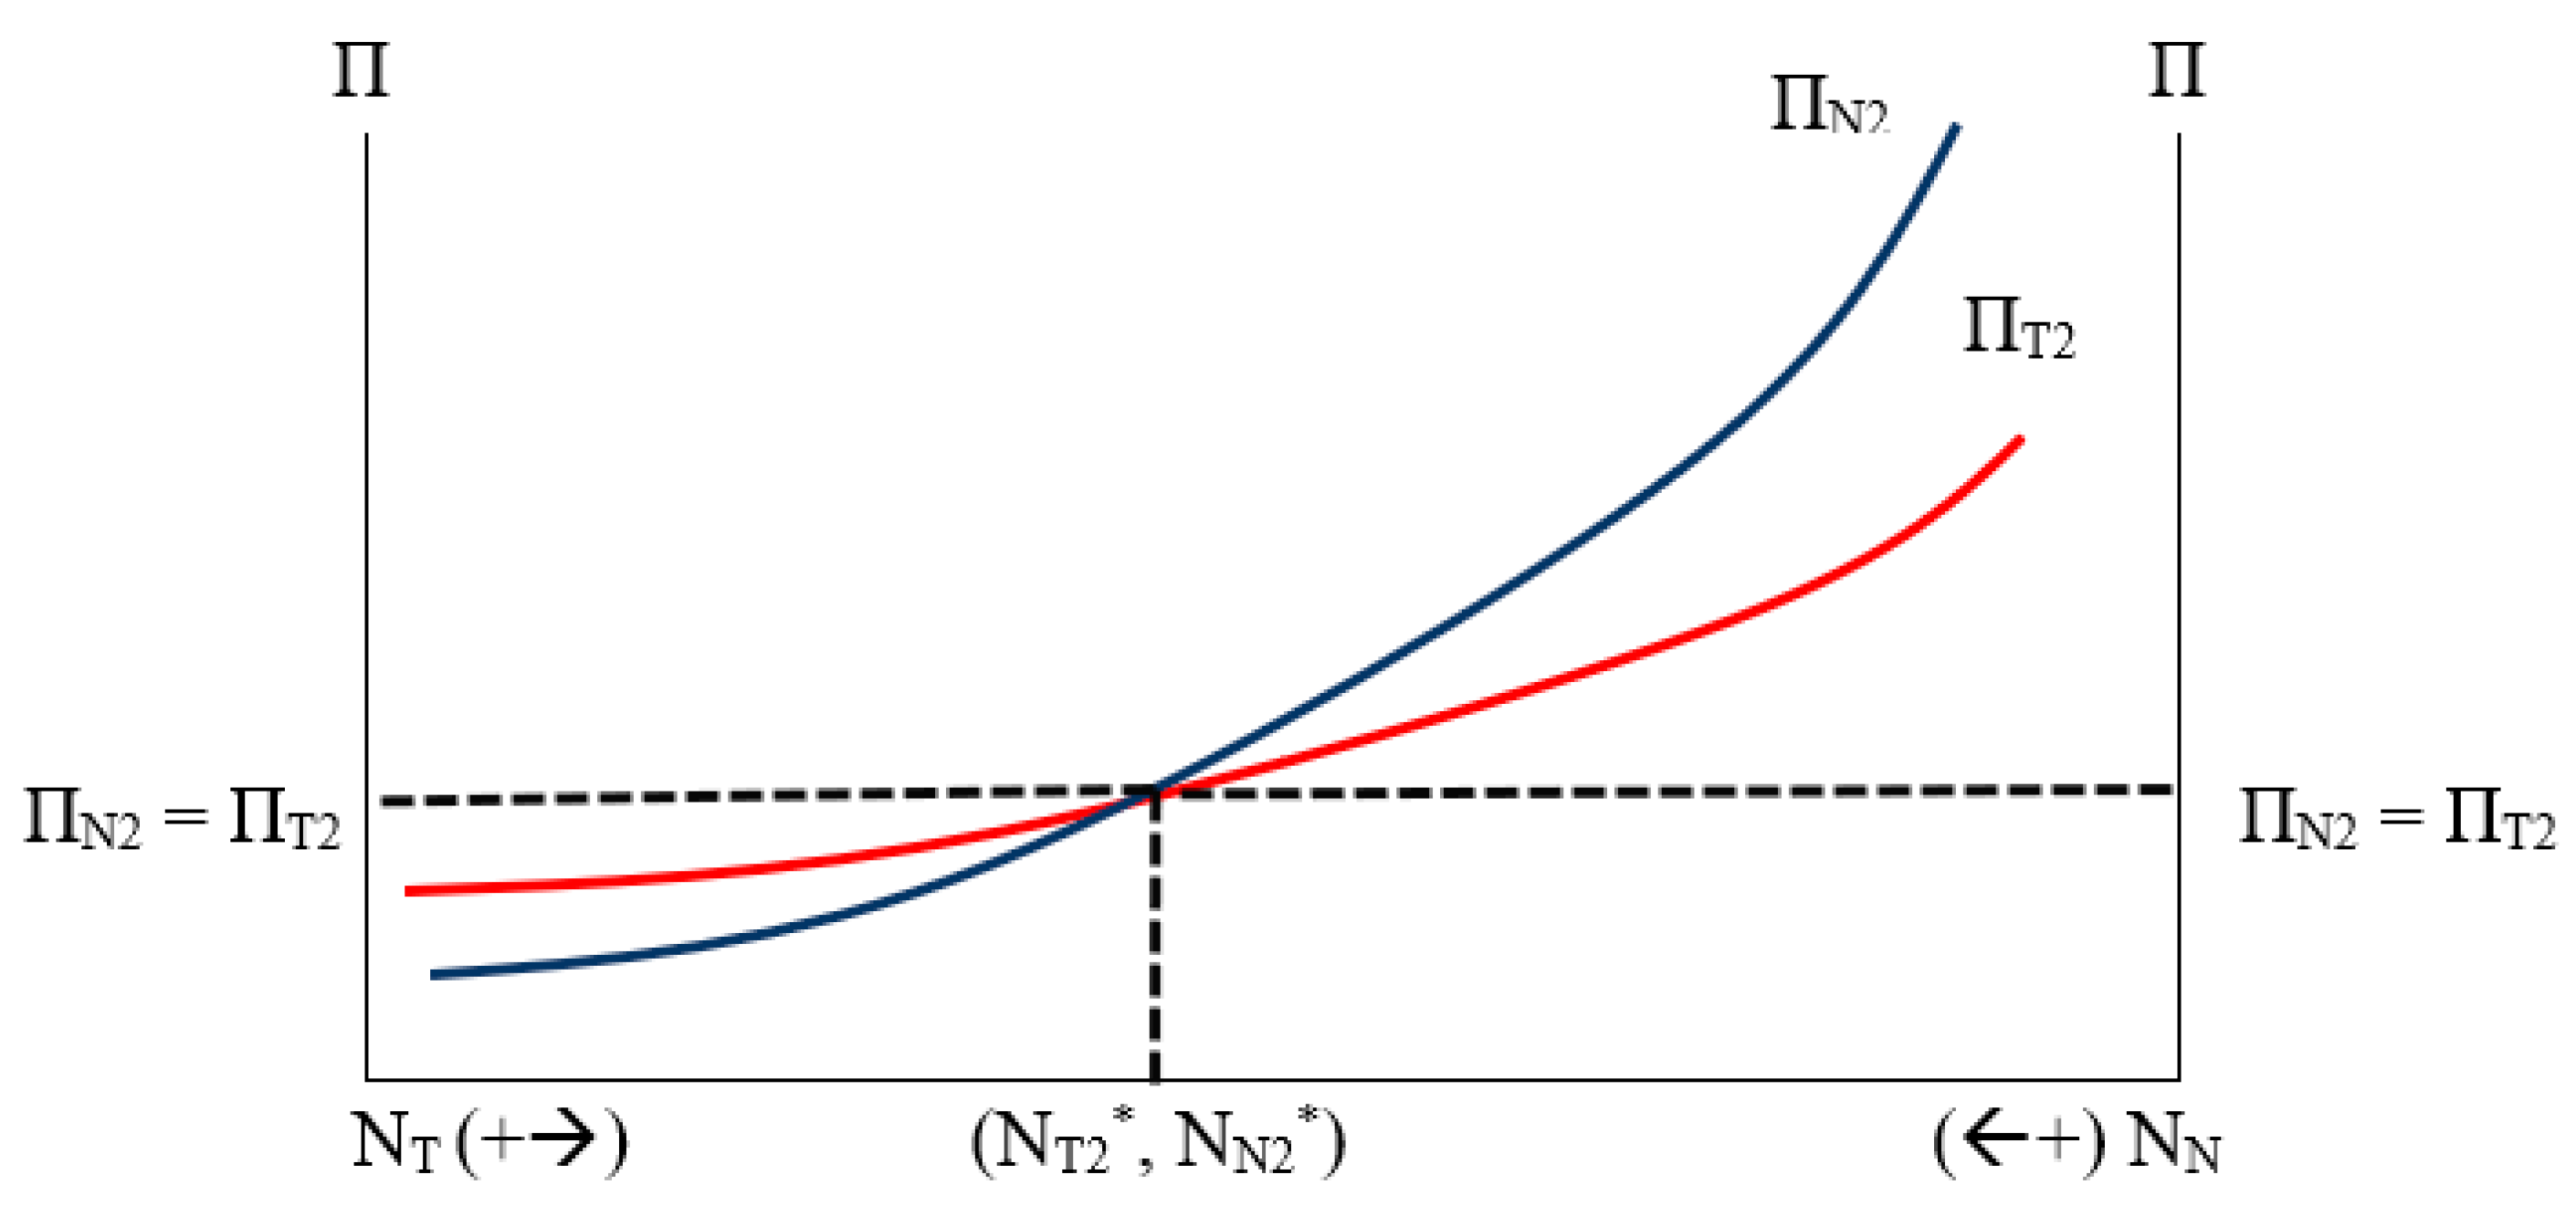
| Scenario 1 | F < F* = | F* < F → Π < 0 | No diversification |
| Scenario 2 | F**< F < F* = | F** < F < F* → ΠT < ΠN | No diversification |
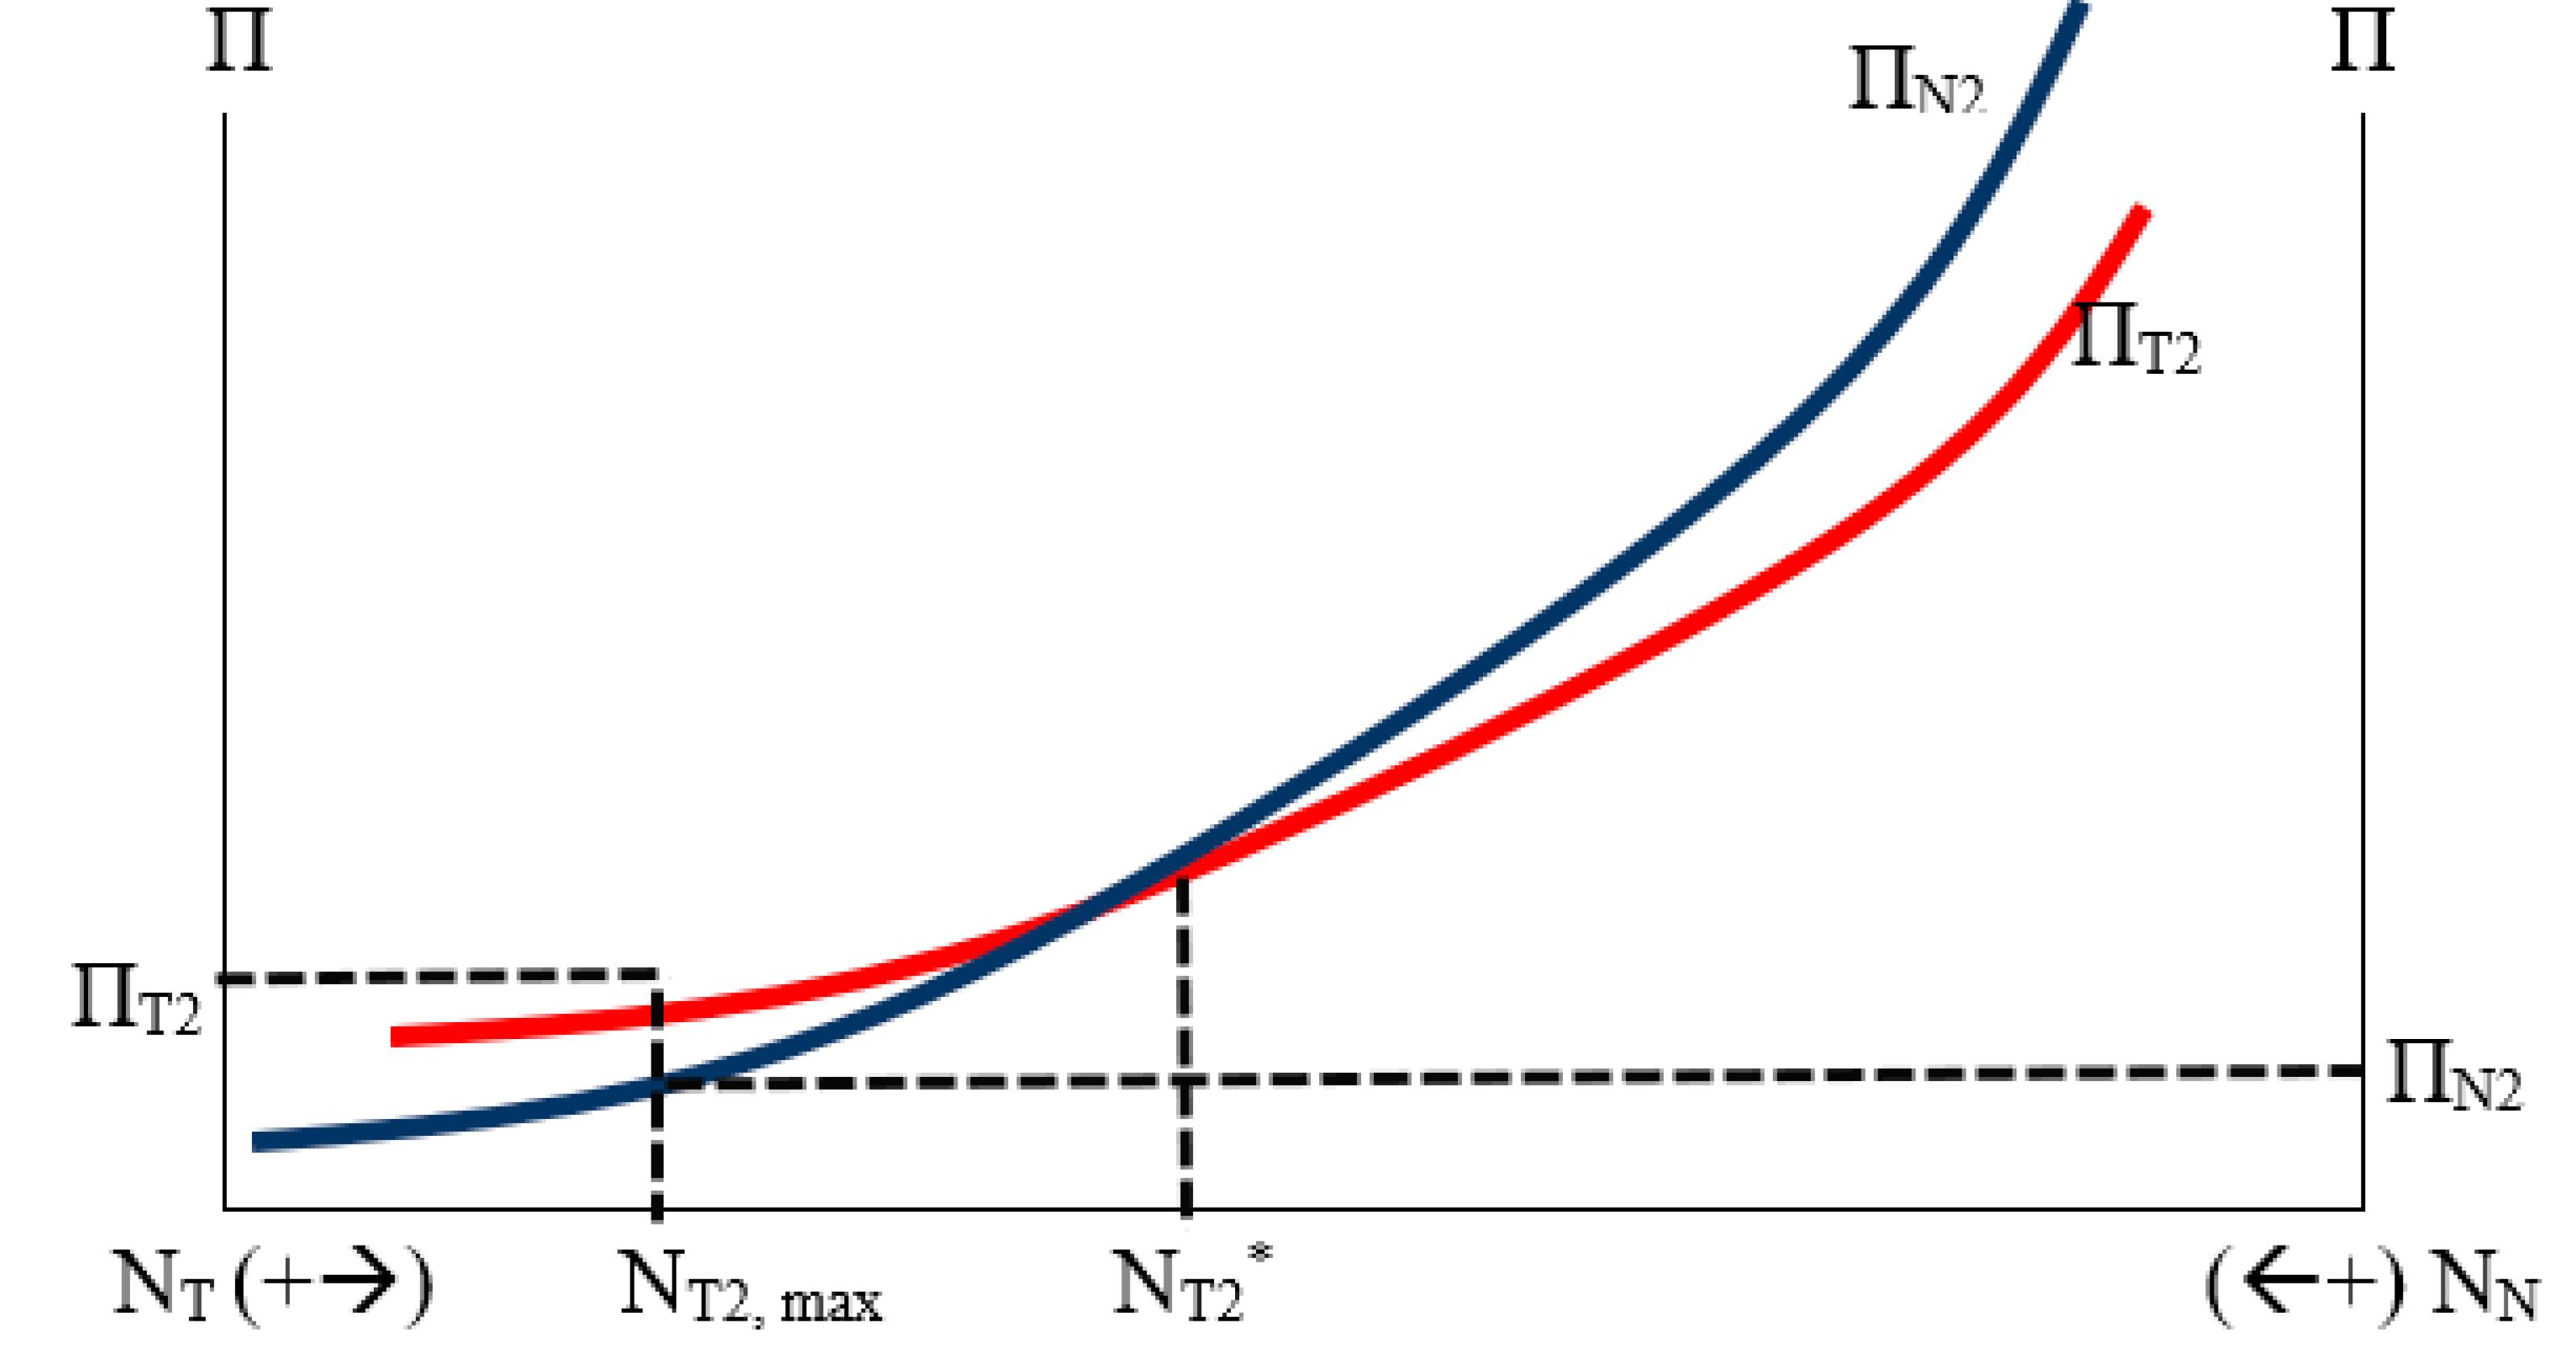
| Scenario 3 | ζ* = < ζ | ζ*< ζ → NT,max < NT2* | Sub-optimal diversification |
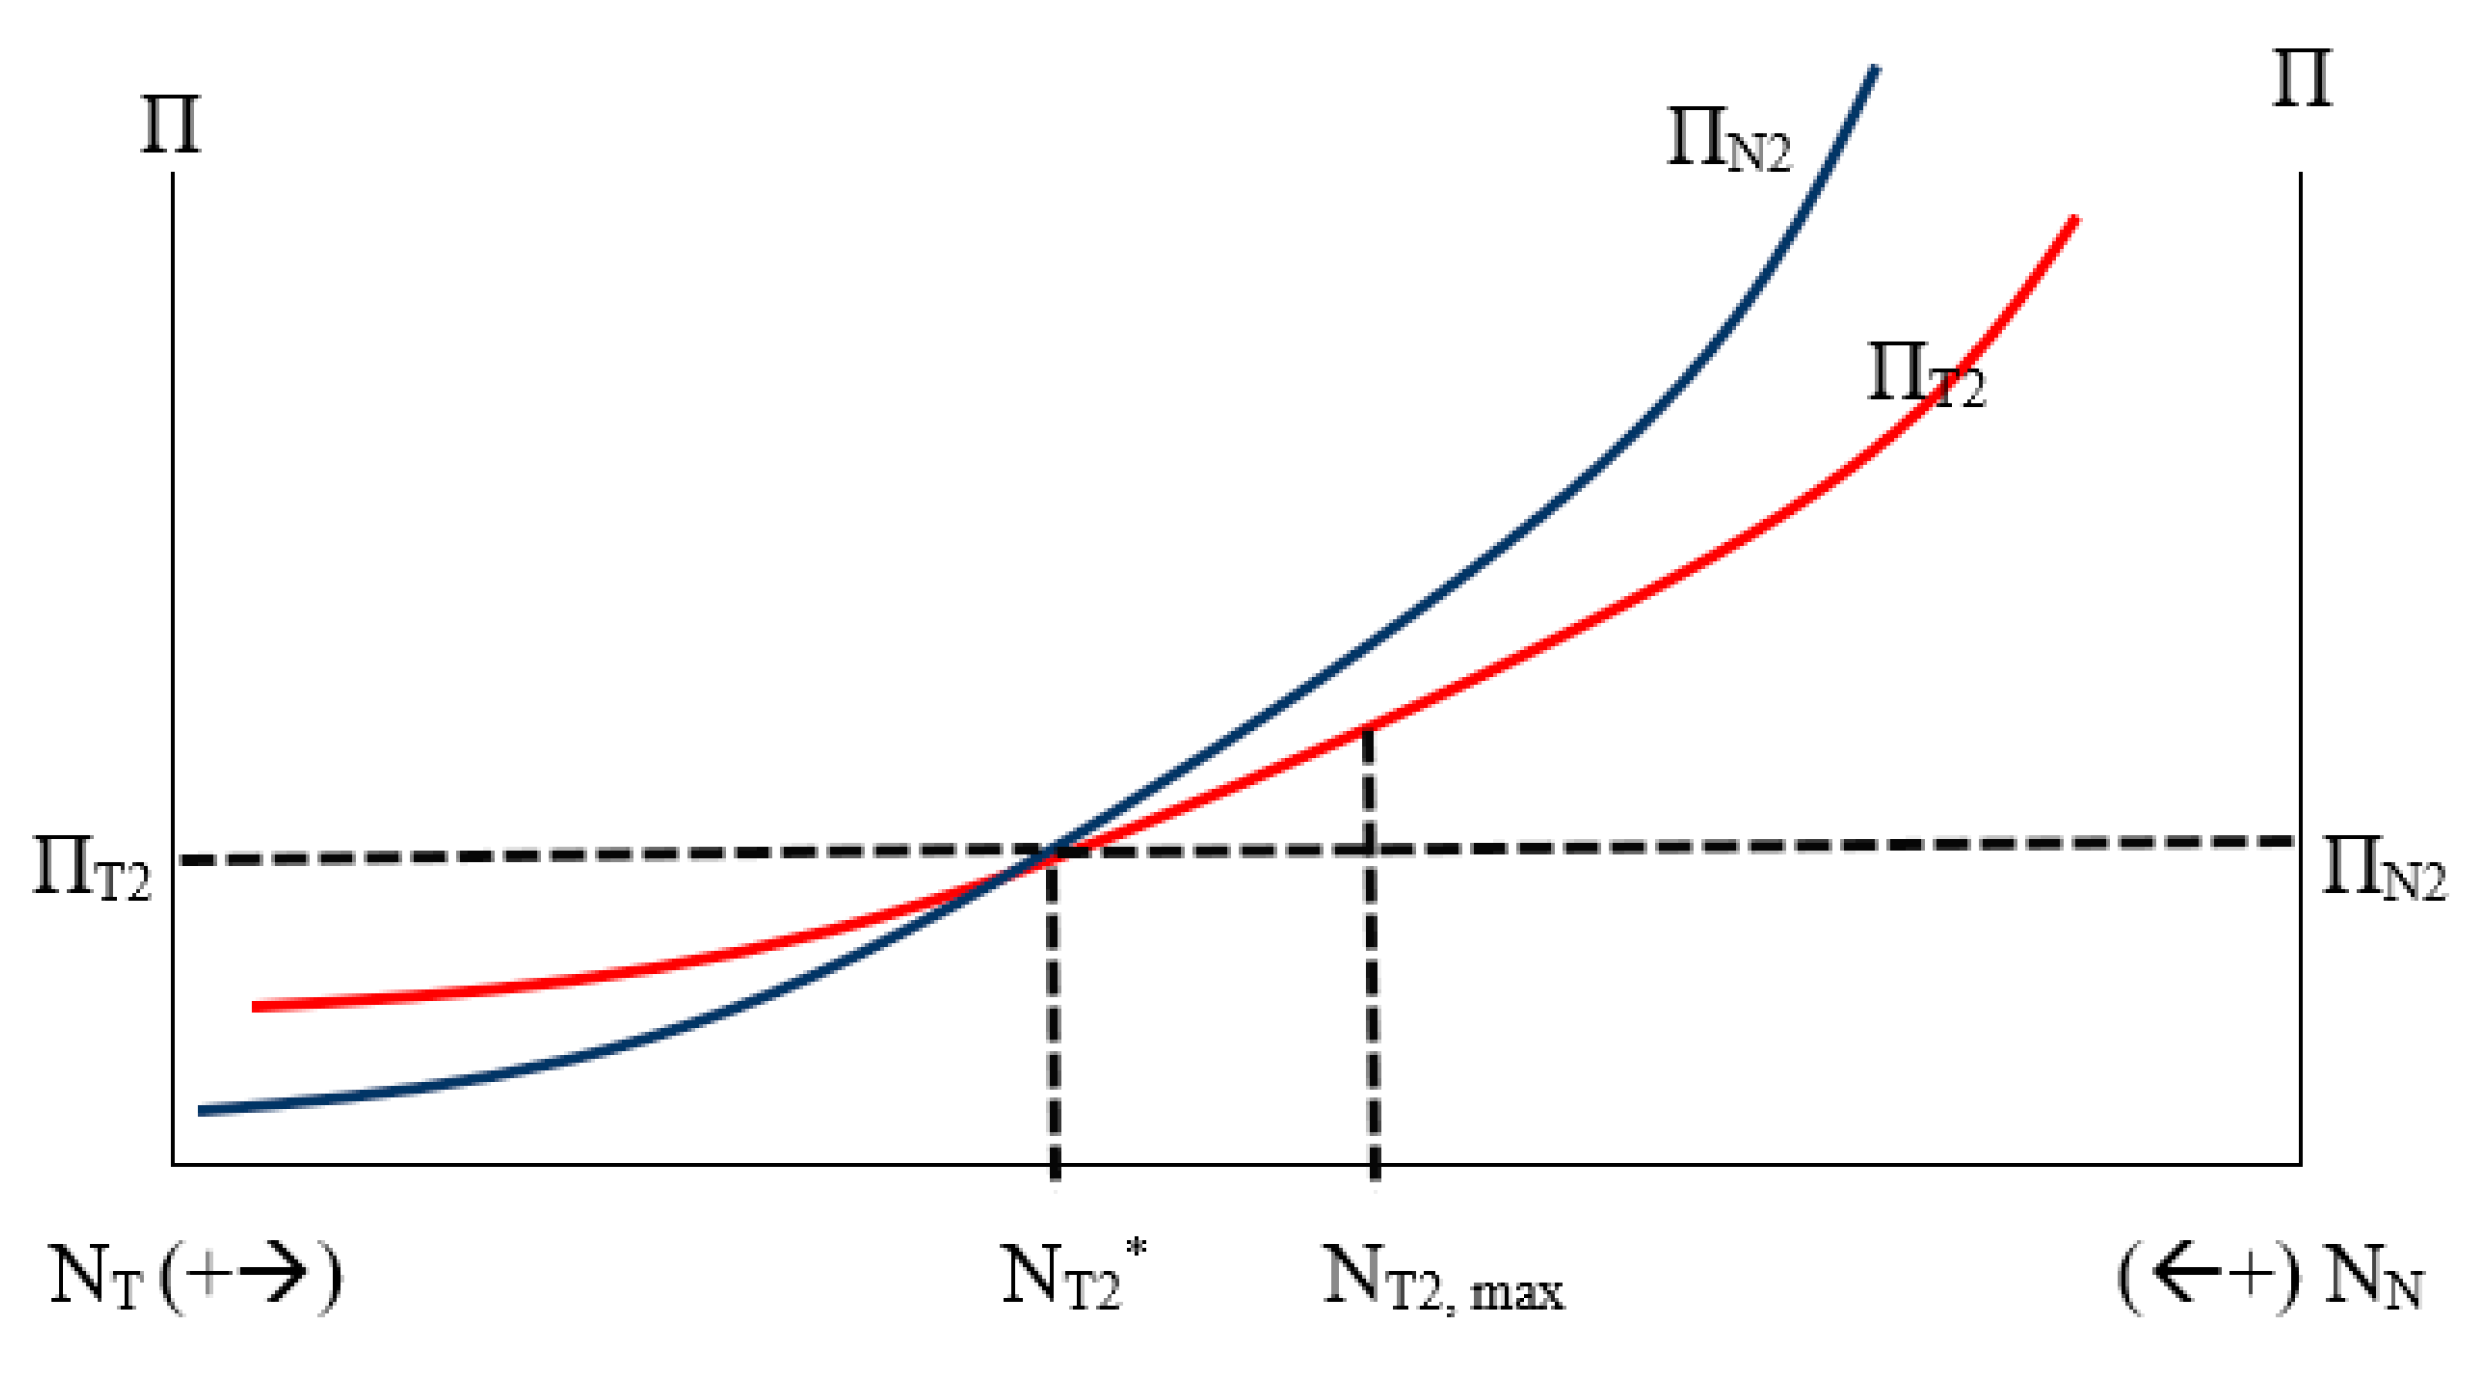
| Scenario 4 | ζ < ζ* = | ζ < ζ* → NT2* < NT,max | Optimal diversification |
| Scenario 1: Poverty Trap in which Tradable Sectors is not Profitable at all | |||
| Ruler’s Decision | Size of the Economy | Public Employment and Wages | |
| NN2: No action needed | NT2: No action needed | Y2 = (1 + (1 + θ/2)1+ε) × R/2 | LG1 ≥ LG2 |
| WG1 = 1 + u, (1 + u)/2 ≤ WG2 ≤ 1 + u | |||
| Scenario 2: Tradable sectors Profitable even with a Single Agent Operating | |||
| Ruler’s Decision | Size of the Economy | Public Employment and Wages | |
| NN2: No action needed | NT2: No action needed | Y2 = (1 + (1 + θ/2)1+ε) × R/2 | LG1 ≥ LG2 WG1 = 1 + u, (1 + u)/2 ≤ WG2 ≤ 1 + u |
| Scenario 3: Profits of Tradable and Nontradable Sectors Equate at a Point Higher than the Ruler can Tolerate | |||
| Ruler’s Decision | Size of the Economy | Public Employment and Wages | |
| NN2: No action needed | NT2: Restricted to NT2,max | Y2 = (1 + (1 + θ/2)1+ε) × R/2 < (1 + (1 + θ/2)1+ε) × R/2 | LG1 ≥ LG2 |
| WG1 = 1 + u, (1 + u)/2 ≤ WG2 ≤ 1 + u | |||
| Scenario 4: Profits of Tradable and Nontradable Sectors Equate at a Point Lower than the Ruler can Tolerate in the Second Period | |||
| Ruler’s Decision | Size of the Economy | Public Employment and Wages | |
| NN2: Increased to NN2** from NN2* | NT2: Increases to NT2,max from NT2* at scenario | Y2 = (1 + (1 + θ/2)1+ε) × R/2 > (1 + (1 + θ/2)1+ε) × R/2 | LG1 ≥ LG2 WG1 = 1 + u, (1 + u)/2 ≤ WG2 ≤ 1 + u |
© 2019 by the authors. Licensee MDPI, Basel, Switzerland. This article is an open access article distributed under the terms and conditions of the Creative Commons Attribution (CC BY) license (http://creativecommons.org/licenses/by/4.0/).
Share and Cite
Kaya, A.; Tok, E.; Koc, M.; Mezher, T.; Tsai, I.-T. Economic Diversification Potential in the Rentier States towards a Sustainable Development: A Theoretical Model. Sustainability 2019, 11, 911. https://0-doi-org.brum.beds.ac.uk/10.3390/su11030911
Kaya A, Tok E, Koc M, Mezher T, Tsai I-T. Economic Diversification Potential in the Rentier States towards a Sustainable Development: A Theoretical Model. Sustainability. 2019; 11(3):911. https://0-doi-org.brum.beds.ac.uk/10.3390/su11030911
Chicago/Turabian StyleKaya, Abdullah, Evren Tok, Muammer Koc, Toufic Mezher, and I-Tsung Tsai. 2019. "Economic Diversification Potential in the Rentier States towards a Sustainable Development: A Theoretical Model" Sustainability 11, no. 3: 911. https://0-doi-org.brum.beds.ac.uk/10.3390/su11030911