Article

Analysis of Hong Kong’s Wind Energy: Power Potential, Development Constraints, and Experiences from Other Countries for Local Wind Energy Promotion Strategies

1
Department of Power Engineering, North China Electric Power University (Baoding), Beijing 071000, China
2
Renewable Energy Research Group (RERG), Department of Building Services Engineering, The Hong Kong Polytechnic University, Hong Kong 999077, China
*
Author to whom correspondence should be addressed.
Sustainability 2019, 11(3), 924; https://0-doi-org.brum.beds.ac.uk/10.3390/su11030924
Submission received: 31 December 2018 / Revised: 30 January 2019 / Accepted: 31 January 2019 / Published: 12 February 2019

Abstract

:
The wind energy utilization in Hong Kong is limited, although its potential has proven to be significant. The lack of effective policy for wind energy development is the main constraint. In this paper, the wind power potential in Hong Kong is analyzed, and the wind power potential assessment is conducted based on one-year field measured wind data using Light Detection & Ranging (LiDAR) technology in a proposed offshore wind farm. Results show that the offshore wind power potential in Hong Kong was 14,449 GWh which occupied 32.20% of electricity consumption in 2017. In addition, the electricity market and power structure in Hong Kong are also reviewed with the existing policies related to renewable energy development. Conclusions can be made that the renewable energy target in Hong Kong is out of date and until now there have been no specific effective policies on wind energy. In order to urge Hong Kong, catch up with other countries/regions on wind energy development, the histories and evolution of wind energy policies in other countries, especially in Denmark, are reviewed and discussed. Suggestions are provided in the aspects of economics, public attitude, and political factors which can stimulate wind power development in Hong Kong.

1. Introduction

Renewable energy policy is a country’s strategy on renewable energy production, distribution, and consumption, in which legislation, incentives, target and taxation are included [1,2,3,4,5]. Feed-in tariff (FIT) and Renewable Portfolio Standard (RPS) are two typical incentive types in renewable energy policy all over the world [6,7,8]. Figure 1 shows the number of countries with types of renewable energy policies [9]. Note that not all policy types in use are shown in this Figure. Countries are considered to have policies when at least one national or state/provincial-level policy is in place. It can be seen that until 2018, more than 130 countries have power regulatory incentives/mandates which can stimulate the development of renewable energies.
As costs fall, it was recorded that renewable energy markets continue to diversify geographically all over the world [10,11,12,13,14]. Europe remains an important market, as well as an innovation center, and also, activities continue to shift towards other regions with China again leading the world in new RE power capacity installations in 2018 [15,16,17,18,19,20].
Meanwhile, various countries have different RE electricity generation targets [21,22,23,24]. RE target is a defining feature of the global energy landscape. At the end of 2016, more than 176 countries around the world with at least one kind of RE target, which was about four-fold of 43 countries in 2005. 50% is Denmark’s target during the year 2020–2021 while in fact, most of this RE power comes from wind energy. Besides Denmark, wind energy market all over the world was brisk with a total of installation capacity of 39.125 GW by the end of 2017 [25].
Hong Kong, by contrast, has been stagnant in this. The limitation of relevant incentives and policies in Hong Kong makes the local renewable energies contribute to an insignificant energy share [26]. According to the annual Hong Kong Energy End-use Data, which include the RE data from the year 2010, the weighting of RE in energy end-use was 0.6%. “The End-use Data 2018” indicated that the total RE was 1913 TJ with a weighting of 0.655% [27] and the RE weighting in electricity consumption is only 0.1% (shown in Figure 2), which was with an unincreased percentage compared with that of 2010, and was far behind the target of 1–2% energy share (HK RE Net, 2017). Among this 0.6%–0.7%, the weighting of wind energy was less than 1%.
How about the wind energy potential in Hong Kong? A comprehensive wind power potential analysis with the cost of energy (analysis) is indispensable for policy-making in the decision-making process for wind energy development strategies. To investigate the wind power potential of a specific region or district, the chronological and probabilistic method are the commonly used in wind data analysis [28,29]. Studies emerge every year about different locations all over the world. Genç, M.S.’s team has forced the topic of wind energy power potential combined with other systems, as well as the energy cost analysis in Turkey, and some outstanding contributions have been made [30]. For example, the wind energy power potential and wind characteristics in Kayseri are evaluated [31], and the economic analysis for separate wind energy conversion systems are conducted for different locations in Turkey [32,33]. Besides, the combined wind energy systems such as the water pumping system [34,35] and wind-electrolyzer fuel cell system [36], with their cost analysis, are provided, which give comprehensive ideas and methods for the wind energy system analysis. Bilgili, M. and Besir Sahin have also studied wind energy potential in Turkey using Weibull and Rayleigh probability density functions, as well as WAsP (Wind Atlas Analysis and Application Program) which quantified the energy potential in different regions of Turkey [37,38]. Wind energy potential in Taiwan, Egypt, and India are also evaluated and analyzed [39,40,41]. For Hong Kong, the wind energy potential is investigated by different researchers with some economic analysis which will be stated in the following sections. It is believed to be significant that Hong Kong has great wind power potential in our previous studies [42,43,44]. However, the exploitation and utilization of wind energy are far behind. How to make Hong Kong catch up with the global push on wind energy development, is of great significance for energy independence and security, especially for Hong Kong with its high population density.
It was found that wind energy development is highly correlated with local electricity market situations, which means that developing wind power is a response to high electricity demand [45,46]. Meanwhile, considering energy security in countries which depend highly upon foreign oil, the volatility of oil price can also affect wind capacity development [47,48]. Developing wind energy can liberate a country or region from high dependence upon electricity importation [49,50].
Meanwhile, from the aspect of environment, the average temperatures of Hong Kong in selected years are shown in Figure 3. The report from the Observatory showed that, in 2015, the hottest June and July were recorded 130 years since records began in 1885. The average temperature of these two months was at least 1 degree Celsius higher than the long-term average one with many hot days and nights. It means that people need to beat the heat by turning on their air conditioning, which will inevitably use more electricity and cost more money, initiating a vicious cycle. The electricity generated in Hong Kong relies heavily on imported fossil fuels, especially coal. Meanwhile, the more energy we use, the more greenhouse gases we produce, which will accelerate global warming. The development of wind energy can help Hong Kong to halt this and prompt it to get rid of energy importation with the improvement of energy security [51,52].
In this paper, both the electricity market and the wind energy developing condition in Hong Kong will be analyzed with the renewable energy policies in Hong Kong related to wind energy. Hong Kong’s offshore wind power potential will be investigated by employing one-year wind data measured from the proposed offshore wind farm near Lamma Island. Based on the wind energy policy reviews from other countries, especially Denmark, suggestions will be provided on driving the growth of wind energy in Hong Kong from the aspects of economics, public attitude, and political factors.

2. Wind Power in Hong Kong

2.1. Wind Power Potential of Hong Kong in the Literature

In general, wind resources in Hong Kong are divided into two categories, including wind energy on land and offshore wind resources.

2.1.1. Wind Resources on Land

The wind resources on land include the wind farms in rural locations and individual wind turbines in high-rise buildings.
1. Wind farm in rural locations
Studies on wind power density in terms of energy per unit area (W/m2) in Hong Kong land area at a height of 65 m above ground level generated by WAsP show that high wind resources generally occur on top of mountains or hills [54] and based on these, considering the wind farm in rural areas are installed in a linear arrangement on mountain ridges, the estimated resource potential from this arrangement in Hong Kong is 2630 GWh/yr (26.3 × 10⁸ kWh/yr), given the total area of the relatively high wind resource in Hong Kong is about 393 km2. Lu et al. has also conducted some research on the wind power in Hong Kong’s island which analyzed wind data in five typical locations in Hong Kong [55,56]. Results in these studies showed that there is great wind power potential on land in Hong Kong.
2. Individual turbines in high-rise buildings
It is well known that high-rise buildings have the effect of enhancement on wind conditions. Small wind turbines may theoretically be installed on the rooftops of existing high-rise buildings. Lu et al. [57,58] investigated the wind aerodynamics and wind flows over the buildings based on local meteorological data and local high-rise building characteristics. It was concluded that wind power utilization in high-rise buildings in Hong Kong is feasible theoretically. In the EMSD report [54] feasibility was determined under the following three assumptions: (1) Approximately 30,000 buildings in Hong Kong, with the height equal or greater than 65 m; (2) No constraints to installation of wind turbines on buildings; and (3) Installation of one turbine per building on average. The resulting theoretical wind resource for urban high-rise buildings in Hong Kong is therefore between 2 and 3 TWh/yr (20–30 × 108 kWh/yr).

2.1.2. Offshore Wind Resources

A rough assessment of the total area of relatively high wind resource (larger than 200 W/m2) in Hong Kong offshore (about 744 km2) was also conducted in the EMSD report. The estimated wind power potential in this report is 8058 GWh/yr [54]. Figure 4 shows the potential sites after considering all constraints in offshore wind farm development, which is colored in green. In our previous study, wind characteristics from the Hong Kong observatory were analyzed in the four selected offshore locations in different areas [42]. The 5 MW wind turbines are selected to be installed in the wind farm after the micro-siting by a multiple population genetic algorithm. Economic analysis considering different factors, i.e., the capital cost of wind turbines, fixed charge rate, as well as maintenance charge, labor force, etc., are conducted. The cost of energy ranges from 1.87 HKD/kWh to 11.88 HKD/kWh with the payback periods ranges from 14.44 year to 75.89 year. Higher costs of energy and longer payback periods show that the water area near Sha Chau is not suitable for wind energy development and thus, results show that the potential offshore wind farm area in and beyond (2 km away from its boundary) Hong Kong is 357.78 km2 and the annual wind power potential is 112.81 × 10⁸ kWh, which is 25.06% of the annual electricity consumption of Hong Kong in 2011.
Li also conducted a study on the offshore wind power potential, in which two types of turbine layout spacing (10D × 10D, 10D × 5D) are selected in a hypothetical offshore wind farm in the southeastern water area [59]. The results are concluded in Table 1 with some typical studies on Hong Kong’s wind power potential.
Note that the studies on offshore wind power potential in previous studies are based on the wind data measured by Hong Kong Observatory on land near the water area [60], such as the Automatic Weather Station in Waglan Island. The limitations of wind data measured by Hong Kong Observatory cannot represent the wind condition on the wind farm site. Thus, site-measured wind data has great advantages in evaluating wind power potential offshore. The field measurement of wind data will be introduced and analyzed in Section 2.2.

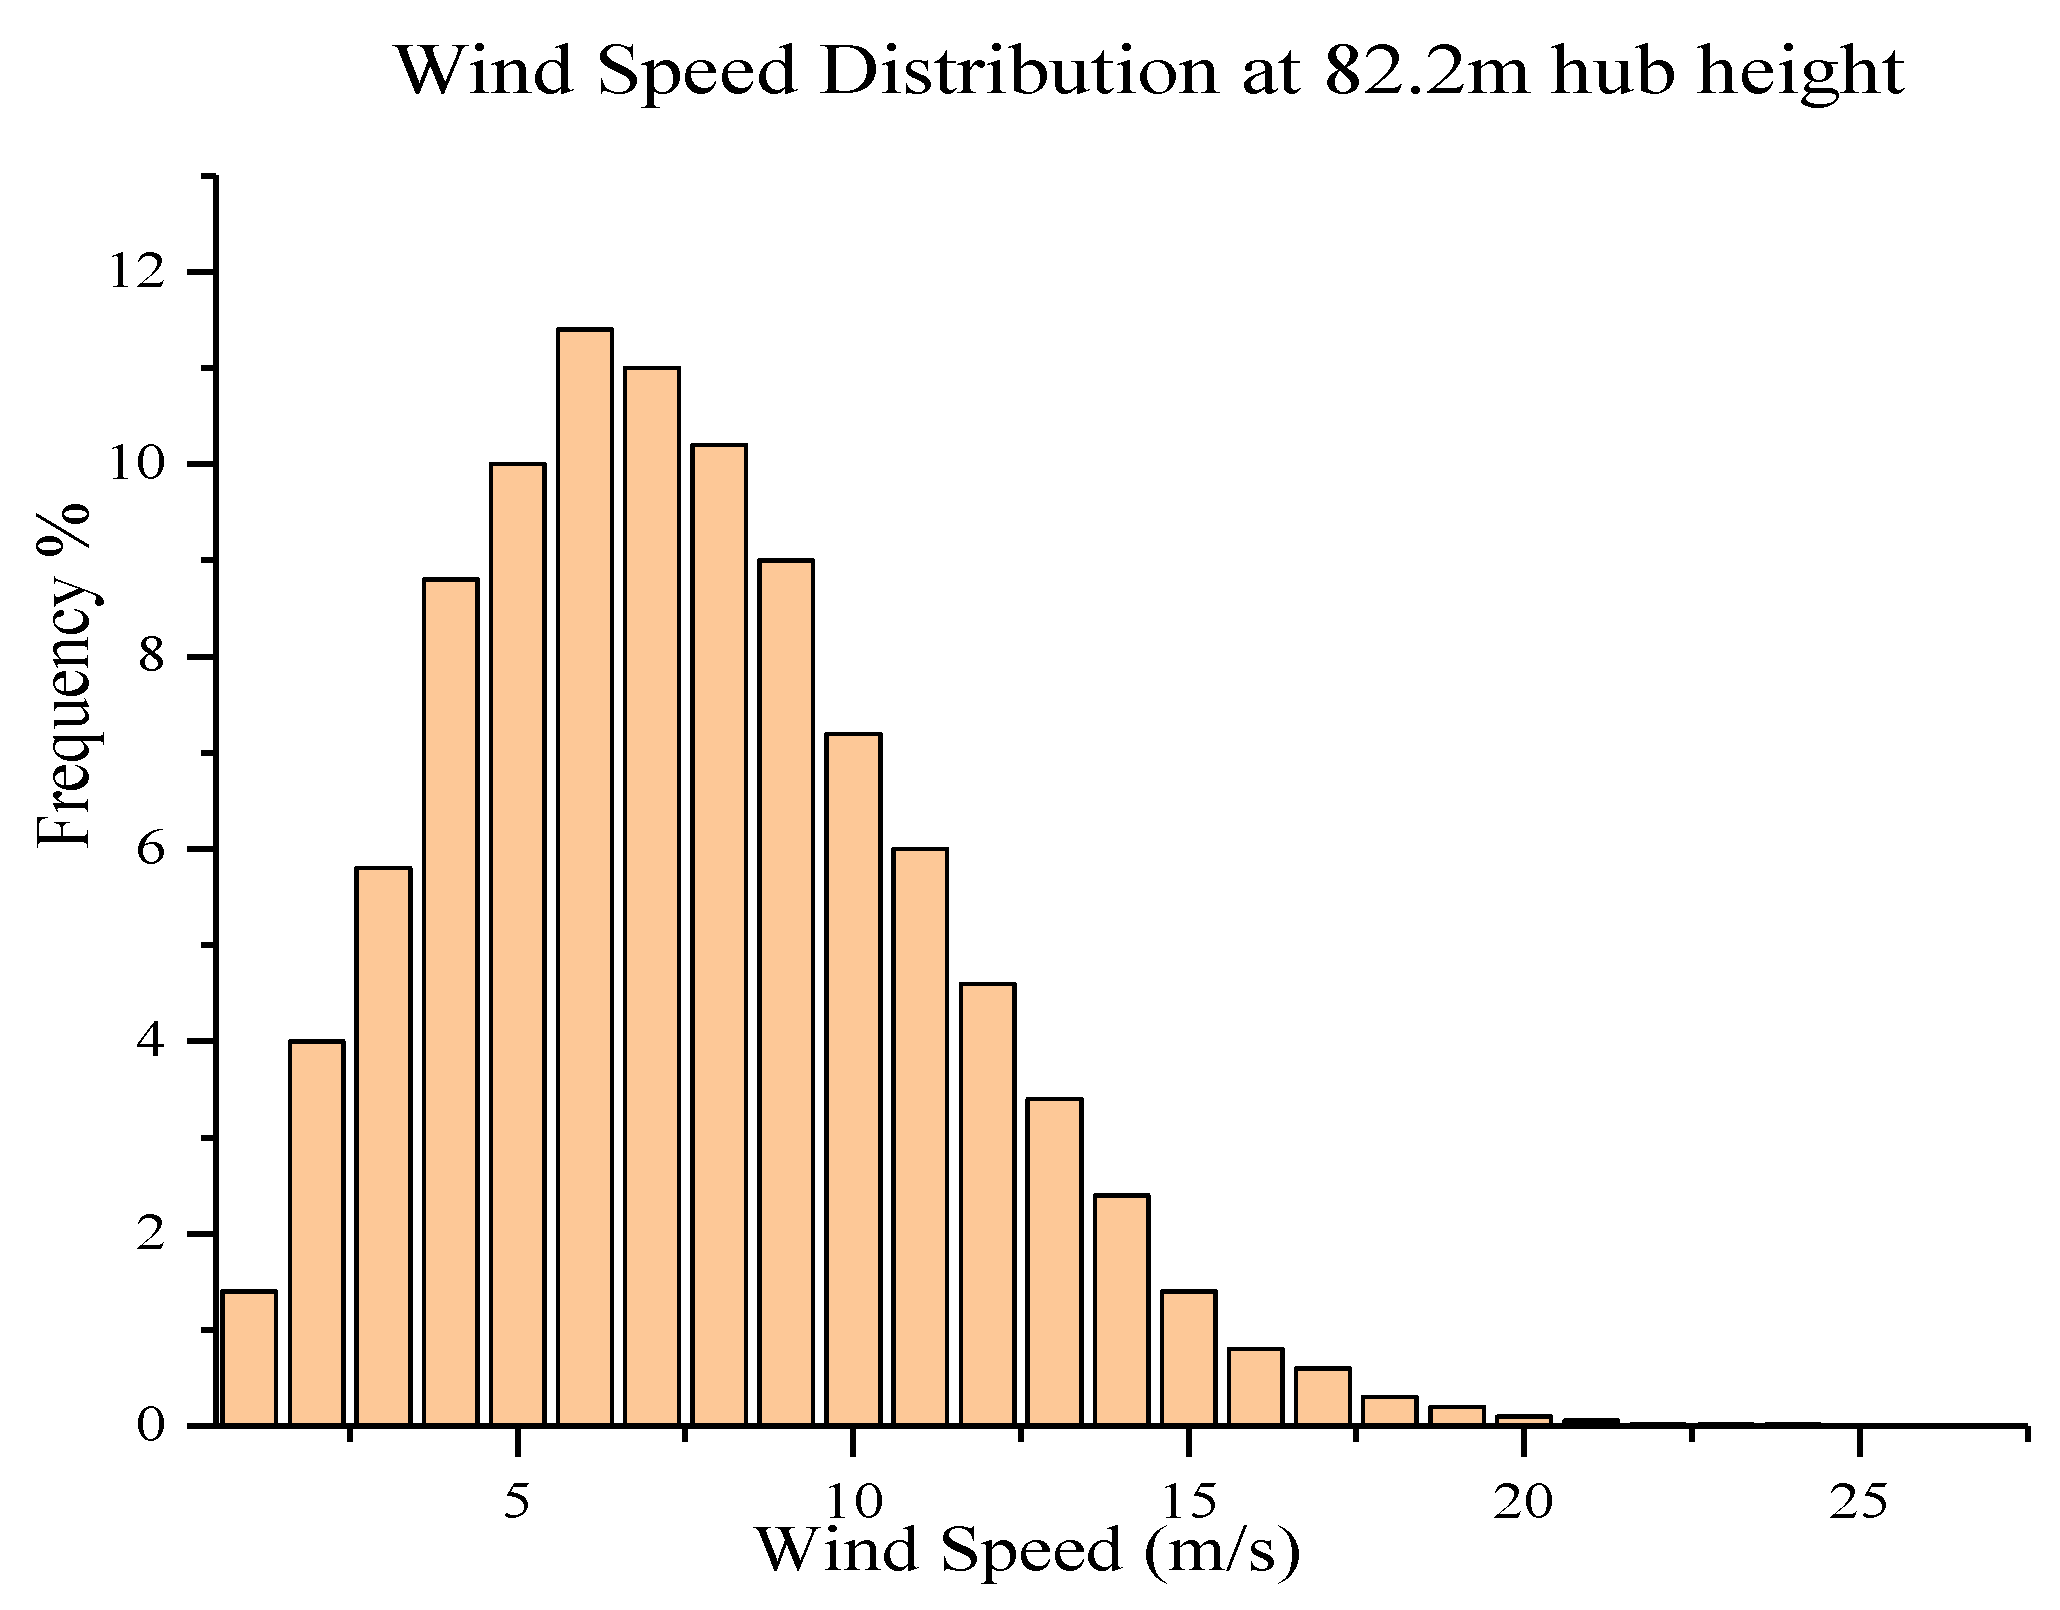
2.2. Offshore Wind Power Potential Analysis Based on Field Measurement Using LIDAR

The Hongkong Electric Co., Ltd. (HK Electric) proposed building an offshore wind farm which would be located at a 600-hectare site about 3.5 km southwest of Lamma Island with the wind monitoring station at the selected wind farm [61]. A wind monitoring station had been set up within the proposed wind farm to pursue a meteorological and oceanographic data collection campaign in March 2012. Light Detection & Ranging (LiDAR) technology was adopted for wind monitoring.
The wind monitoring campaign aimed to collect additional data for optimizing the offshore wind farm design. The measurement range of wind speed of LiDAR is 0–50 m/s with the instantaneous wind speed. In this paper, the one-year wind data from March 2012 to February 2013 were used for the wind farm optimization analysis. Diagram of the one-year wind speed at the turbine hub height of 82 m is shown in Figure 5. Note that the wind data was calculated using the wind shear formula. The long term annual average wind speed measured at the Southwest Lamma offshore is 7.03 m/s.
Results in our previous study which conducted the Hong Kong offshore wind power assessment [42] show that Lamma Island has an intermediate wind condition compared with those three locations. Meanwhile, considering the geographical of Hong Kong, Lamma Island in the Southern water which, facing the South China Sea, can represent the wind conditions to some extent. Thus, in this paper, combining the field measured wind data, the hypothetical offshore wind farm in Figure 4 marked No. 2 was selected to conduct the assessment as it was at the same locations with the Hong Kong Electric’s wind farm. The Multi-Population Genetic Algorithm program developed by the author in previous studies [42,62] was used to search the optimal layout pattern of this selected wind farm with the assessment of Hong Kong offshore wind power potential. Details are shown in Table 2. With the optimal number of 25 turbines (5MW) installed in the wind farm, the annual power generation is 5.78 × 10⁸ kWh, and the cost of energy (COE) is 1.55 HKD/kWh. Compared with that conducted using the wind data provided by the Hong Kong observatory [42], the COE has decreased from 1.87 HKD/kWh to 1.55 HKD/kWh, which indicate significance of the field measured wind data. According to this, the total annual offshore wind power potential in Hong Kong is 14,449 GWh, which occupies 32.02% of the electricity consumption of Hong Kong in 2017 [27].
It can be seen that there is a significant wind energy resource potential which, if captured and exploited, would undoubtedly create a material contribution for the reduction of the environmental impact caused by conventional energy supplies.

2.3. Current Situation of Wind Energy in Hong Kong

There are no indigenous energy resources in Hong Kong, and all energy sources are imported from overseas. Currently, two investor-owned companies, the China Light & Power Hong Kong Limited (CLP) and the Hongkong Electric Company Limited (HK Electric) supply electricity for Hong Kong with their networks covering different areas. Coals are the main fuels which make up about half of total fuel consumption [63]. The application of wind energy in Hong Kong is at the early stage of demonstration phase.

2.3.1. Wind Energy Application in Hong Kong

Although there is great wind power potential in Hong Kong, the wind power utilization is barely satisfactory. As it is mentioned above, the weighting of wind energy provided by Hong Kong energy end-use data in 2016 was less than 1% of the total RE, while the weight of RE in Hong Kong was 0.56% in 2013 [27]. There are some small wind turbine projects supported by both government and non-government and proposed yet ultimately aborted offshore wind farms as well.
1. Small wind turbine projects
Most small wind turbine projects in Hong Kong are rooftop turbines, or stand-alone power supply systems, probably in conjunction with PV panels. Some typical projects are listed in Table 3. Note that the list given in Table 3 is not meant to be exhaustive. No new projected has been installed after the year 2011.
2. Large wind turbine projects
The first commercial-scale wind turbine in Hong Kong was installed by HK Electric. It is a Nordex N50/800 kW machine with a rotor diameter of 50 m and hub height of 46m. The rated power of the turbine is 800 kW and on average provides slightly over 100 kW of power, with a capacity factor of 13%. It is installed at Tai Ling on Lamma Island and was inaugurated in February 2006. It can offset 800 tonnes of CO2 emission every year on average [64,65].
3. Offshore wind farm projects
Two offshore wind farms were proposed by HK Electric and CLP at southwest Lamma waters (SLW) and Southeastern Waters (SEW), respectively [66,67].
The total capacity of the offshore wind farm at SEW was 100 MW, with 28–35 turbines rated 2.5–3.6 MW installed. If it is operated, its 100 MW capacity can generate about 170 million kWh per year, which can offset 62,000 tonnes of coal and 150,000 tonnes of carbon dioxide emissions. The EIA report of the SLW Offshore Wind Farm was approved in May 2010. HK Electric is carrying out wind monitoring work using LiDAR technology at the site to collect wind resources data [61]. The offshore wind farm is scheduled for completion by 2015; however, it was postponed due to capital-intensive consideration and critical voices from the public.
The above reactions happened for the SEW offshore wind farm as well, which is a double of the SWL Offshore Wind Farm’s. The proposed SEW has a capacity of 200 MW, with an area of 16 km2. More than 67 wind turbines of 3 MW or 40 turbines with 5 MW were suggested to be installed. It was reported that about 1% of total Hong Kong electricity needs in 2008 can be produced by this wind farm [66]. However, critical voices come from different parties on the environmental effects and longterm payback period. The public’s attitude towards wind energy in Hong Kong is negative. According to the government consultation document on the future of Hong Kong electricity, having an offshore wind farm to power 1–2% of the city will result in a 3–5% increase in the electricity tariff [68]. However, the high cost of offshore wind energy can be offset and decreased with maturation of the technologies.

2.3.2. Wind Energy Policy in Hong Kong

In Hong Kong, the lack of government support and incentives remains the key limiting factor for the promoting of wind energy. Although sustainability was the theme of the Hong Kong Government’s environmental review paper from 1996 [63,69], extremely little had been mentioned and done for promoting renewable energy.
In the “First Sustainable Development Strategy for Hong Kong” published in 2005 [70], a target of 1–2% of HK’s electricity supply met by RE by 2012 was set. However, compared with targets in other countries/regions shown in Figure 2, this target is far from being satisfied.
The “Scheme of Control Agreements (SCA) 2009–2018” was an agreement signed by the government and the two local power companies, in which an environmental incentive was proposed and it encouraged power companies to develop renewable energy. 11% of the average renewables net fixed assets was permitted to return. The SCA was theoretically effective because both the government and power companies can benefit and the government can realize its RE target while the power companies can get a higher permitted rate of return. Under the effect of SCA, both the offshore wind farm at SLW and SEW were proposed. However, it turned out that the SCA is not effective enough because of low average net fixed assets compared with the higher investment long time payback period.
Unfortunately, in the “Public Consultation on Future Fuel Mix for Electricity for Hong Kong” in 2014 [71], there was no clear target for Renewable Energy while in “A Clean Air Plan for Hong Kong” in 2013 [72], only the goal of achieving the new Air Quality Objectives (AQOs) by 2020 was mentioned.
It has been criticized that Hong Kong completely lacks legislation, strategies, and incentives for the integration of renewable energy. In general, except policy from the government, when developing RE in a specific region, four other factors should also be considered: technical personnel, geographical conditions, public attitude, and social capitals. For Hong Kong, the five aspects’ conditions, which affect the RE development is shown in Figure 6. Hong Kong has abundant geographical conditions for wind energy development with enough technical personnel and social capitals; however, social consciousness is not very high. There is no pressure from the public to the government for developing RE technologies and also, both the government and power company react less positively to the long-time payback, high risk, and low return RE project. It is essential to learn from other countries/regions to raise passions of the social and power company, as well as to help the government to propose effective policies for RE development, especially for wind energy.

3. Lessons for Effective Wind Energy Policy from Denmark

3.1. Typical Concepts in Wind Energy Policy

Policy for promoting renewable energy is designed to reduce reliance on fossil fuels and ensure security of power supply, reduce environmental impacts such as greenhouse gas emissions, as well as encourage new industrial development [73]. For countries with well-designed renewable energy policies, substantial environmental and economic benefits have been obtained. However, considering different policy approaches leading to different outcomes, the most effective policy is necessary for a country which requires better understanding of the linkage between policy mechanisms and energy developments [45,74,75]. Target and incentive are important for an effective policy.
Targets: It is common for the national government to set targets for the contribution that renewable energies will make to meet overall energy consumption. It can be a reference for the government or public to check and measure renewable energy development progress [24,76].
Feed-in tariff (FIT) and Renewable portfolio standard (RPS): FIT and RPS emerged and were regarded as the most significant policies to promote power generation from renewable energies [73]. The FIT is a pricing policy mechanism which guaranteed the renewable energy generators a fixed price for the generated electricity [77]. The RPS is a quota system that requires power/electricity suppliers to source a certain proportion of their electricity from renewable energy [78]. It is a quantity regulation, letting the market determine a reasonable price for renewable energy technologies. The price and quantity are the two aspects of electricity generated by renewable energy. In FIT, the prices are set politically and the quantity is market driven, whereas in RPS, the quantity is established politically and the price is determined by the market.
To accelerate investment in renewable energy technologies, the FIT offers long-time contracts to electricity producers, often from 8 to 15 years, but sometimes as many as 20 to 30 years, typically according to the cost of generation of each technology [79]. The goal of feed-in tariff is to offer cost-based compensation to renewable energy producers [80].
The FIT was firstly implemented in the US in 1978 in the law of National Energy Act (NEA), which aimed to encourage energy conservation and development of new kinds of energy resources [81]. As one of the five separate Acts, the Public Utility Regulatory Policies Act (PUPRA) was established to grant a high price which was slowly dismantled by liberalized markets in the US [82]. However, in the mid-1990s, in Denmark and Germany, utilities were required to purchase electricity generated by renewable energy at a price established by the government which was regards as the second wave of FIT [83]. The utilization of FIT can compensate the renewable energy developers for the high investment as well as the environmental benefits of generation.
Trends and development related to FIT on different renewable energy resources vary from countries and regions. Taking China as an example, under series renewable energy law, for instance, The Notice on Improving the Pricing Policy for On-Grid Solar Photovoltaic Power Prices and The Notice on Improving Policy for On-Grid Wind Power Prices etc., the FIT rates for different renewable energy resources are concluded in Table 4. Regardless of the types of renewable energy resources, research indicated that FIT can effectively promote renewable energy capacity development [84,85,86]. See Figure 7.
A renewable portfolio standard is a policy instrument that requires increased production of electricity from renewable energy sources. It has other common names such as renewable electricity standard (RES) in US and renewable obligation in the UK [78,88]. The difference between FIT and RPS is that the RPS program tends to encourage more price competition between different types of renewable energy. The adoption of RPS will result in competition and innovation which will deliver renewable energy at the lowest possible cost, increasing the competitiveness of renewable energy compared with cheaper fossil fuel energy sources.
RPS has been adopted in many countries, especially in the United States, which is the most successful policy that has stimulated renewable energy capacity in US combined with federal production tax credits. For example, in California, Governor Jerry Brown signed climate law mandating 50% renewable power by 2030 on October 7, 2015 [89]. For more than a decade, California has required utilities to use more renewable energy power and the previous target is 33% renewable power by the end of 2020. This target is a level the utilities are confident they will meet. The increasing target in the past years (30% by 2020, 40% by 2030, and 70% by 2040) led to a construction boom for wind farms and solar power plants, and the 50% target will stimulate renewable energy development undoubtedly.
It can be concluded that FIT performs better than RPS in the stage of cumulative wind capacity development, which can promote wind energy under a long-term effect while RPS can provide some incentives to the developers in the short run [45]. To stimulate local wind energy capacity development, it is better to combine these two policies by the government to build a more predictable investment environment.
For wind energy, effective and suitable energy policy could help to increase wind power generation as well as stimulate the energy industry. The existing successful energy policy for some countries can grant revelation and inspiration for Hong Kong’s wind energy promotion. For local policy design, it is important to learn successful experiences and practices from other countries/regions. The long-term goal for Danish energy policy is: the entire energy supply including electricity, heating, industry, and transport is to be covered by renewable energy by 2050.

3.2. Wind Energy Development in Denmark

The promotion of wind power in Demark in the last three decades was very successful. It benefited from several factors, especially systematic government support, including effective economic tariff schemes and broad public support [90]. Figure 8 shows the total installed capacity of wind project in Denmark. In 2014, wind energy accounted for 39.1% of Denmark’s electricity consumption.

3.3. History and Evolution of Wind Energy Policy in Denmark: 7 phases

Compared with other countries, Denmark has its unique and advantaged conditions for wind energy development. The long-standing interests in wind energy (windmills) make the wind energy in Denmark not only as an alternative energy but also a complementary source [73]. Even in the 1970s, there were many wind turbine manufacturers who had played significant roles in wind energy policy promotion and wind energy development [90,92]. Both the energy crises and the nuclear accident at Three Mile Island in 1970s provided strong impetus for wind energy development in Denmark. The policy developing history is concluded in Table 4.

3.4. Experiences from Denmark

Important conclusions can be drawn from the Danish experience: both the FIT and public attitude are important for the wind energy development.
For FIT, the wind energy tariff depends on several factors: the location of the project (onshore/offshore), the start data of operations, and the number of full-load delivered. A market price element, a compensation for balancing, and a government subsidy, are included in the tariff. The wind energy market reacted closely to the tariff. It can also be observed from Figure 8 that, after the FIT was abandoned in 2004, the market reaction to the abandoned FIT was that the wind power capacity declined rapidly (500 MW to over 3000 MW from 1993 to 2004 while only 129 MW from 2004 to 2008) and the wind market stalled until 2008, when a new support framework was introduced [93].
Besides the effective policies, the public had quite a significant role in wind energy development [94]. In 2009, the Danish Wind Industry Association conducted a survey on the Danish public’s opinion on energy production in the future. Results showed that 91% of the population thinks that Denmark should expand the use of wind power and 85% support the wind energy expansion in their local areas [95]. Not surprisingly, this extensive support has a long historical standing in the period of consumer-owned windmills. In addition, the extensively liberalized and privatized Danish electricity markets have also facilitated wind energy installations [96,97,98].
It is also worth mentioning that universities and research institutions are important partners for the Danish wind industry, i.e., Risø National Laboratory for sustainable energy in Technical University of Denmark (DTU) [99], Danish Wind Industry Association [100] etc.
The Danish government was Europe’s first country to bring in large subsidies for wind energy, including the feed-in-tariff system. Effective policies in Denmark were successfully replicated in Germany. Denmark is also one of the first countries to use environmental taxation to reduce air pollution and CO2 emissions and to support renewable energy development.
The enabling conditions for wind industry development in Denmark attributed to the following aspects:
  • Effective rule of law and transparency in the administrative and permitting processes: A coherent and long-term policy framework has been in place for 30 years;
  • A clear and effective pricing structure (combination of market price and premium ensures);
  • Effective industrial development strategy-energy plans;
  • Provisions for access to the grid: priority access is guaranteed to renewable energy producers;
  • Expression of political commitment from government (e.g., targets);
  • A functioning finance sector (for example, most Danish offshore wind project are financed by utilities.); and
  • Public acceptance.

4. Suggestions for Hong Kong for Wind Energy Development

To stimulate the wind power development in Hong Kong, three aspects should be paid attention to, they are economics, public attitude, and political factors.

4.1. Economics

Surveys show that both the government and power companies in Hong Kong react less for wind energy development because the high investment and long-time payback and also, the public do not want to pay HKD 1.8–2.3 per unit for wind power while the electricity price now is HKD 1/kWh. Thus, how to reduce the cost of energy (COE) is the main issue for Hong Kong when planning wind projects. With the maturation of technologies, wind project cost decreases [101,102]. When planning wind projects in Hong Kong, the following factors should be considered:
  • Based on the National Renewable Energy Laboratory (NREL)’s report, the turbine cost of onshore and offshore wind project is 68% and 32% of the total capital [103]. So, the selection of a wind turbine which can produce significantly more power than other devices at the same wind speed is essential. For example, select turbines with new blade types, new control technologies, longer and lighter blades, or installed with taller wind towers, etc.
  • In Hong Kong, it was proved that there is great wind power potential with suitable geographical conditions for wind energy development [43]. At the stage of project planning, the location selection is important for the power generation of the project. Thus, windy locations with long-term wind resources observation and analysis are indispensable essential.
  • Reducing the operating cost can also significantly help to reduce the COE of wind energy. After the location is determined with specific turbines selected, the turbine layout optimization should be conducted and from which, the optimal turbine layout pattern can be obtained with higher power generation and decreased turbine interactions, and thus, the minimum COE can be obtained.
  • Other considerations, such as financing costs, site-specific characteristics, availability, and cost of skilled labor, transportation and logistics, and other factors, should be considered.

4.2. Public Attitude

Public attitude and social acceptance for wind energy is another important challenge. The public is always in a conflict and dilemma situation when facing the choice between wind turbines and landscape. In Great Britain’s study [104], this phenomenon is called a “green to green” dilemma, which means that locals living nearby a planned wind project have to choose between a global good and the local bad. They know that the wind project can reduce CO2 emissions, but they have to face the negative impact of turbines on the local landscape. Other studies [105,106,107] have also shown that public attitude towards wind projects based on broader factors relating to environmental, aesthetic, and socioeconomic dimensions. After considering all factors affecting the public attitude, it can be concluded that wind projects with minimal environmental impact and contribution to local economies, which are aesthetically pleasing, will be socially accepted. Factors contributing to society’s acceptance of a wind project include the ownership of the wind project, local information on the project, local network, as well as integration of the wind project developers.
For Hong Kong, two activities can help to achieve local acceptance of wind project, as provided below:
  • Providing information and involving the public in the decision-making process and the actual project development and design process: for example, organizing seminars or workshops on the environmental and economic benefits of wind projects and also, a public enquiry on the impact on the local landscape, etc.
  • Encouraging local ownership or financial participation in the projects, including:
    • Promoting local ownership: fund support for local groups or encourage wind projects to offer certain percent of ownership to locals;
    • Compensation for loss of value of real property: financial compensation to individual property owners;
    • Providing fund support to locals, for example, enhancement of local scenic and recreational values.

4.3. Political Factors

As the policy maker, the government should propose effective wind energy policy. In designing or adjusting wind energy policies, multiple goals should be taken into consideration together for the government. For Hong Kong, reducing oil dependence and carbon emissions to improve the air quality, relieving power supply pressure, setting up a new industry, as well as providing new job opportunities, are beneficial. Therefore, the proposed energy strategy will include, but not be limited to the following items:
  • Proposing the Hong Kong Renewable Energy Law and setting up targets of wind electricity share from renewable energy, especially from wind energy in Hong Kong. Both a long-time and short-medium time target should be proposed and the target of 2–3%, which is out of date, should be totally abandoned.
  • Subsidy polices with detailed incentives and subsidies are appreciated:
    • A fixed feed-in tariff: considering the large initial investment of a wind project, a higher fixed feed-in tariff can stimulate enthusiasm of investors. Previous incentives on wind projects, such as 11% of the average renewables net fixed assets was permitted to return’ from SCA proposed in 2008 can give experiences when determining the incentives.
    • A continual supplement to the market price can make wind energy competitive with other traditional power until wind project technologies has matured enough to obtain a lower cost.
    • Environmental protection tariffs can be imposed on non-renewable energy resources.
  • When the policies are established, periodical evaluation on the socio-economic influences of the proposed policies should be conducted to ensure the policy effective; for example, regular seminars or workshops with public surveys held by the government or community can help policy-makers achieve immediate feedback for policy adjusting.

5. Conclusions and Policy Implications

In this paper, a comprehensive analysis of Hong Kong’s wind energy from power potential to development constraints is conducted with the experiences from other countries as well as suggestions for local wind energy promotion. Detailed conclusions can be summarized as follows:
  • The power potential of wind energy in literature which is divided into three types (land, high-rising building and offshore wind) is reviewed. Great wind power potential in Hong Kong can be observed and concluded as to which represents a large part of annual electricity consumption.
  • The offshore wind power potential using field measured offshore wind data in the proposed offshore wind farm by Hong Kong Electric Co., Ltd. is conducted in this paper. Results show that the offshore wind power potential is estimated to be 14,449 GWh, which occupied 32.02% of electricity consumption in 2017.
  • The electricity market and power structure in Hong Kong is also reviewed with the existing policy related to wind energy development. Conclusions can be made that the renewable energy target in Hong Kong set in 2006 of 2–3% is out of date and until now, there is no specific policy on wind energy.
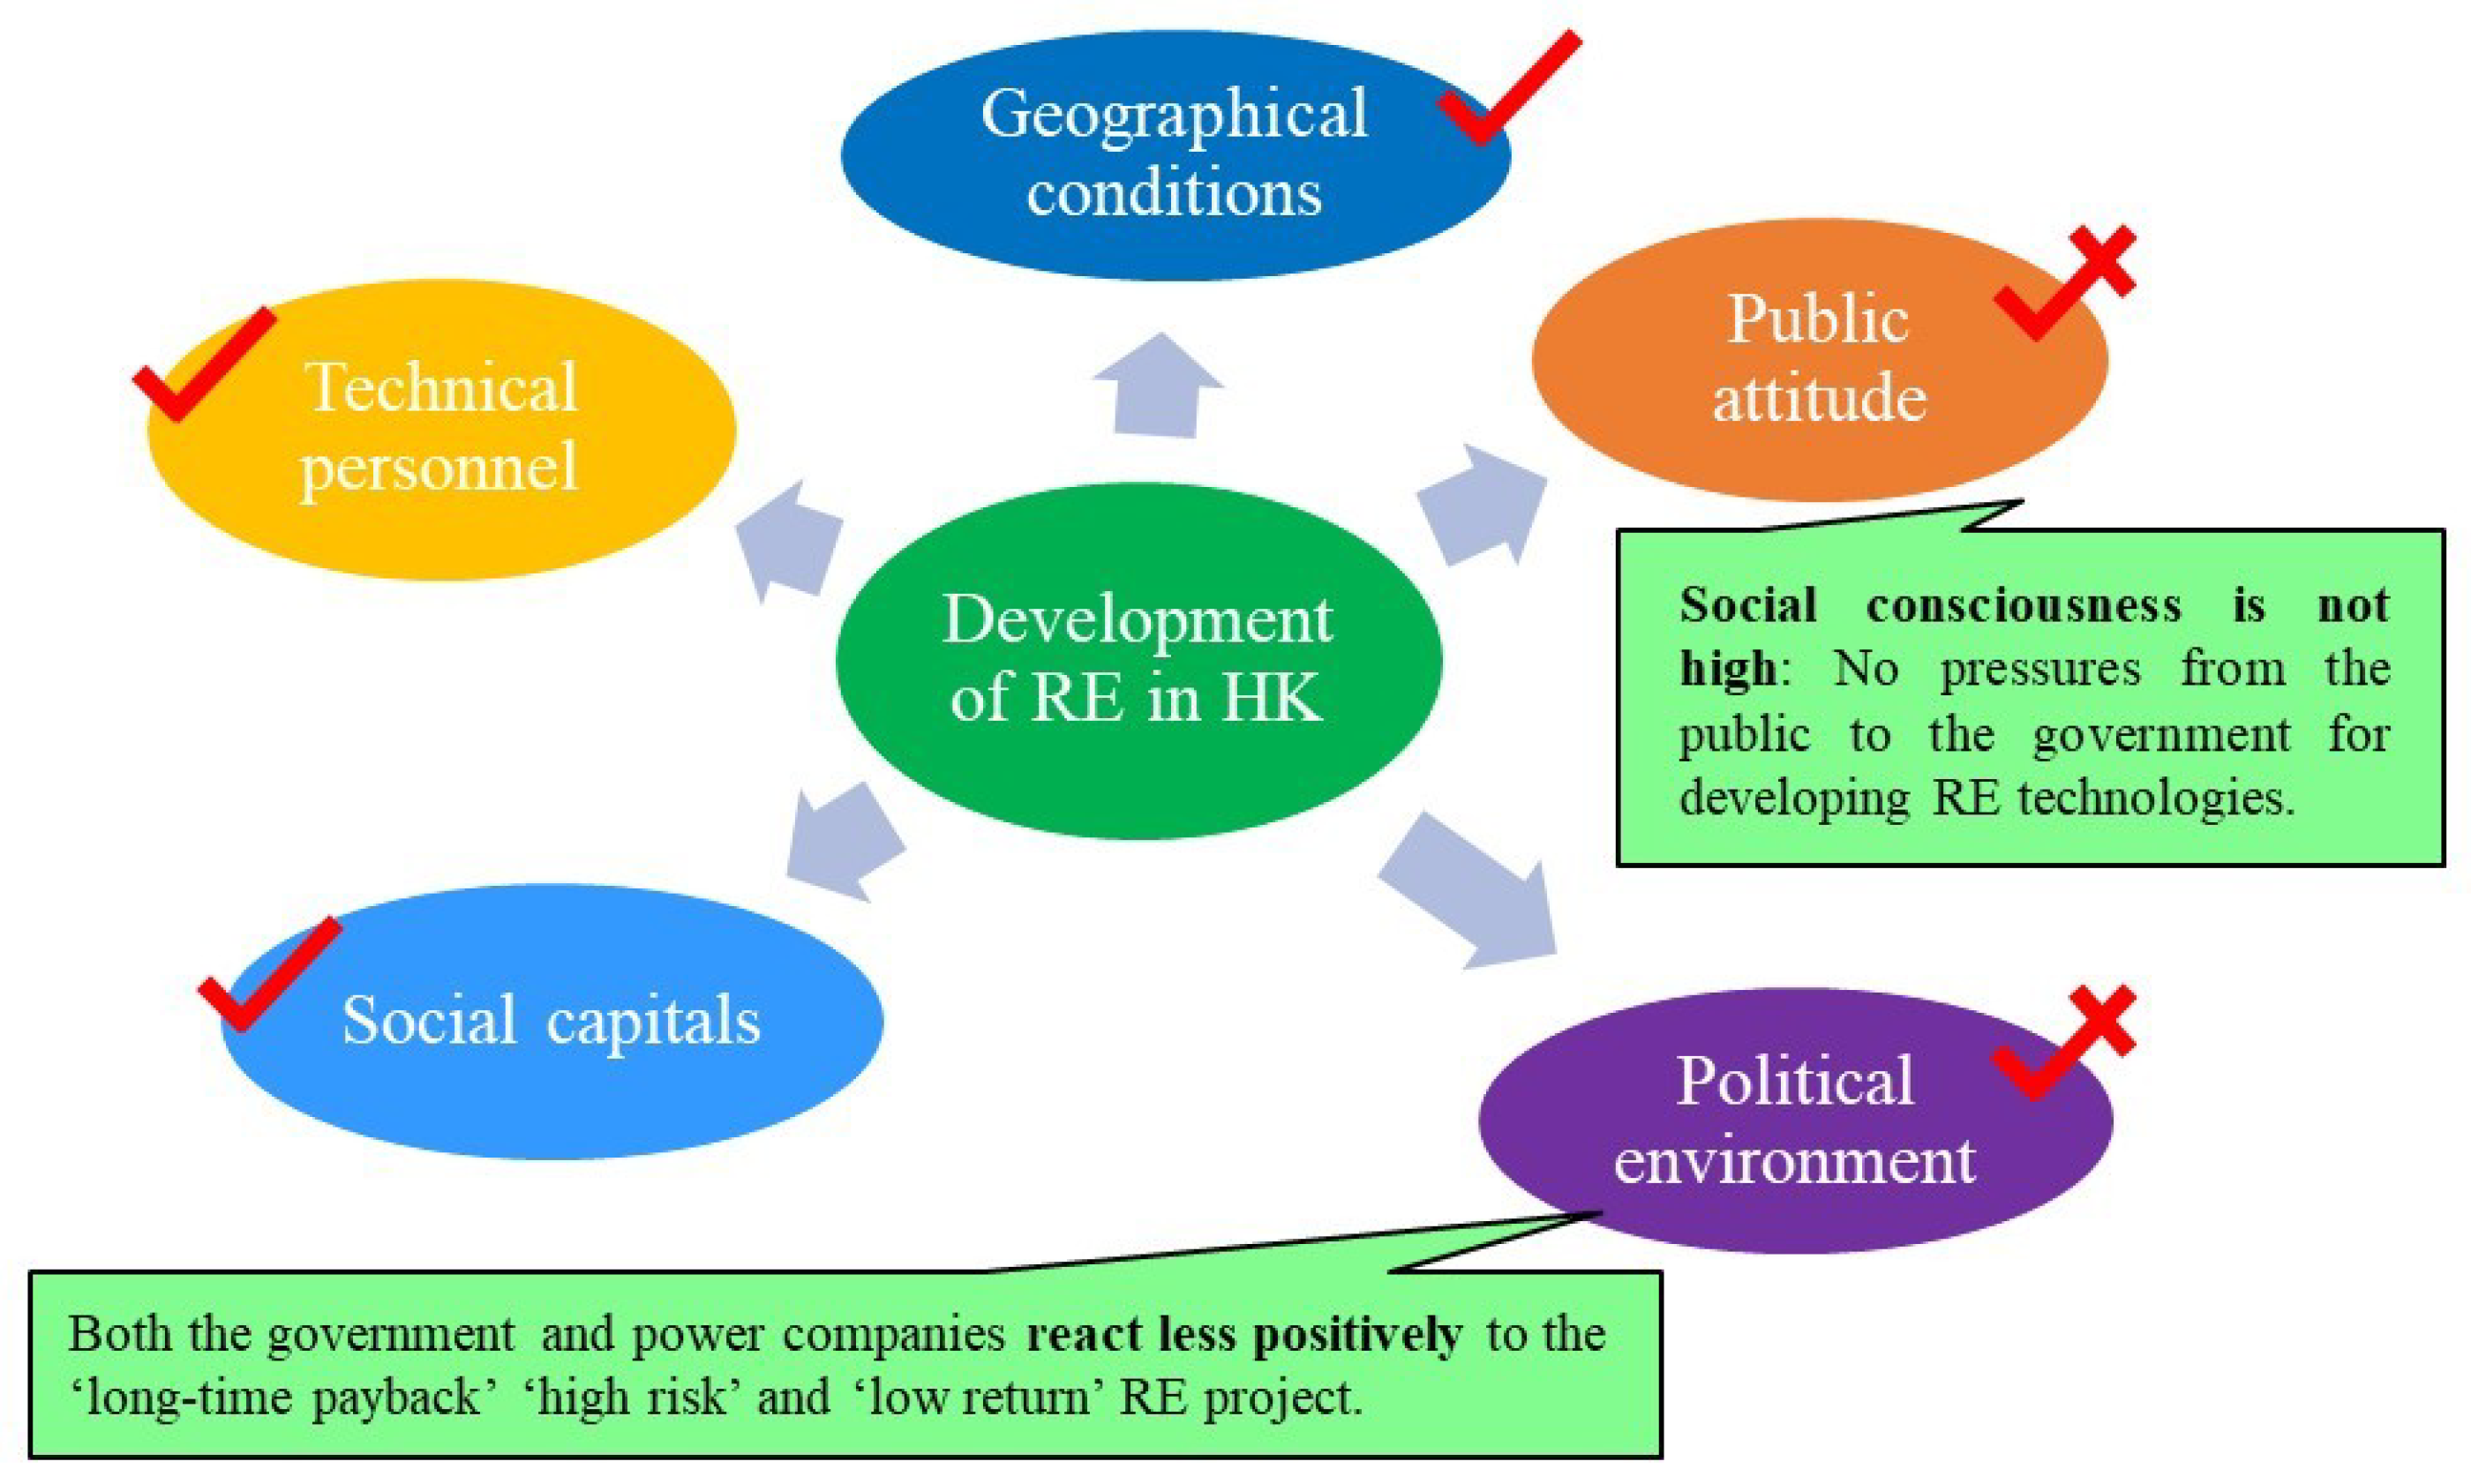
  • Wind energy utilization in Hong Kong is limited, although its potential has proved to be significant. The lack of effective policy for wind energy development in Hong Kong is the main constraint. The government, power companies, and public react little to wind project development.
  • The histories and evolutions of wind energy policies in Denmark are reviewed and discussed. It is concluded that both the detailed incentives, such as FIT and public attitude, are important for wind energy development.
  • Based on successful experiences in Denmark, suggestions are proposed for Hong Kong to develop wind energy. Economics, public attitude, and political factors are the three main aspects which can stimulate wind power development in Hong Kong. Detailed information and suggestions for these three aspects were investigated.

Author Contributions

Paper writing, X.G.; data analysis and figure drafting, L.X.; paper design, L.L.; data analysis and policy design, Y.L.

Funding

This work is supported by the National Natural Science Foundation of China (No.51606068), a collaborative research grant from industry 8-ZG2L in Hong Kong, and ‘the Fundamental Research Funds for the Central Universities (2018MS101). The on-site wind data is provided by Hongkong Electric Co., Ltd.

Conflicts of Interest

The authors declare no conflict of interest.

References

  1. Saidur, R.; Islam, M.R.; Rahim, N.A.; Solangi, K.H. A review on global wind energy policy. Renew. Sustain. Energy Rev. 2010, 14, 1744–1762. [Google Scholar] [CrossRef]
  2. Li, P.; Han, Z.; Jia, X.; Mei, Z.; Han, X.; Wang, Z. Analysis and comparison on thermodynamic and economic performances of an organic Rankine cycle with constant and one-dimensional dynamic turbine efficiency. Energy Convers. Manag. 2019, 180, 665–679. [Google Scholar] [CrossRef]
  3. Song, J.; Feng, Q.; Wang, X.; Fu, H.; Jiang, W.; Chen, B. Spatial Association and Effect Evaluation of CO2 Emission in the Chengdu-Chongqing Urban Agglomeration: Quantitative Evidence from Social Network Analysis. Sustainability 2019, 11, 1. [Google Scholar] [CrossRef]
  4. Lindman, Å.; Söderholm, P. Wind energy and green economy in Europe: Measuring policy-induced innovation using patent data. Appl. Energy 2016, 179, 1351–1359. [Google Scholar] [CrossRef]
  5. Alsharif, M.; Kim, J.; Kim, J. Opportunities and Challenges of Solar and Wind Energy in South Korea: A Review. Sustainability 2018, 10, 1822. [Google Scholar] [CrossRef]
  6. Cory, K.S.; Couture, T.; Kreycik, C. Feed-In Tariff Policy: Design, Implementation, and RPS Policy Interactions; National Renewable Energy Laboratory: Golden, CO, USA, 2009.
  7. Skiba, M.; Mrówczyńska, M.; Bazan-Krzywoszańska, A. Modeling the economic dependence between town development policy and increasing energy effectiveness with neural networks. Case study: The town of Zielona Góra. Appl. Energy 2017, 188, 356–366. [Google Scholar] [CrossRef]
  8. Cheng, Y.; Gao, M.; Dong, J.; Jia, J.; Zhao, X.; Li, G. Investigation on the daylight and overall energy performance of semi-transparent photovoltaic facades in cold climatic regions of China. Appl. Energy 2018, 232, 517–526. [Google Scholar] [CrossRef]
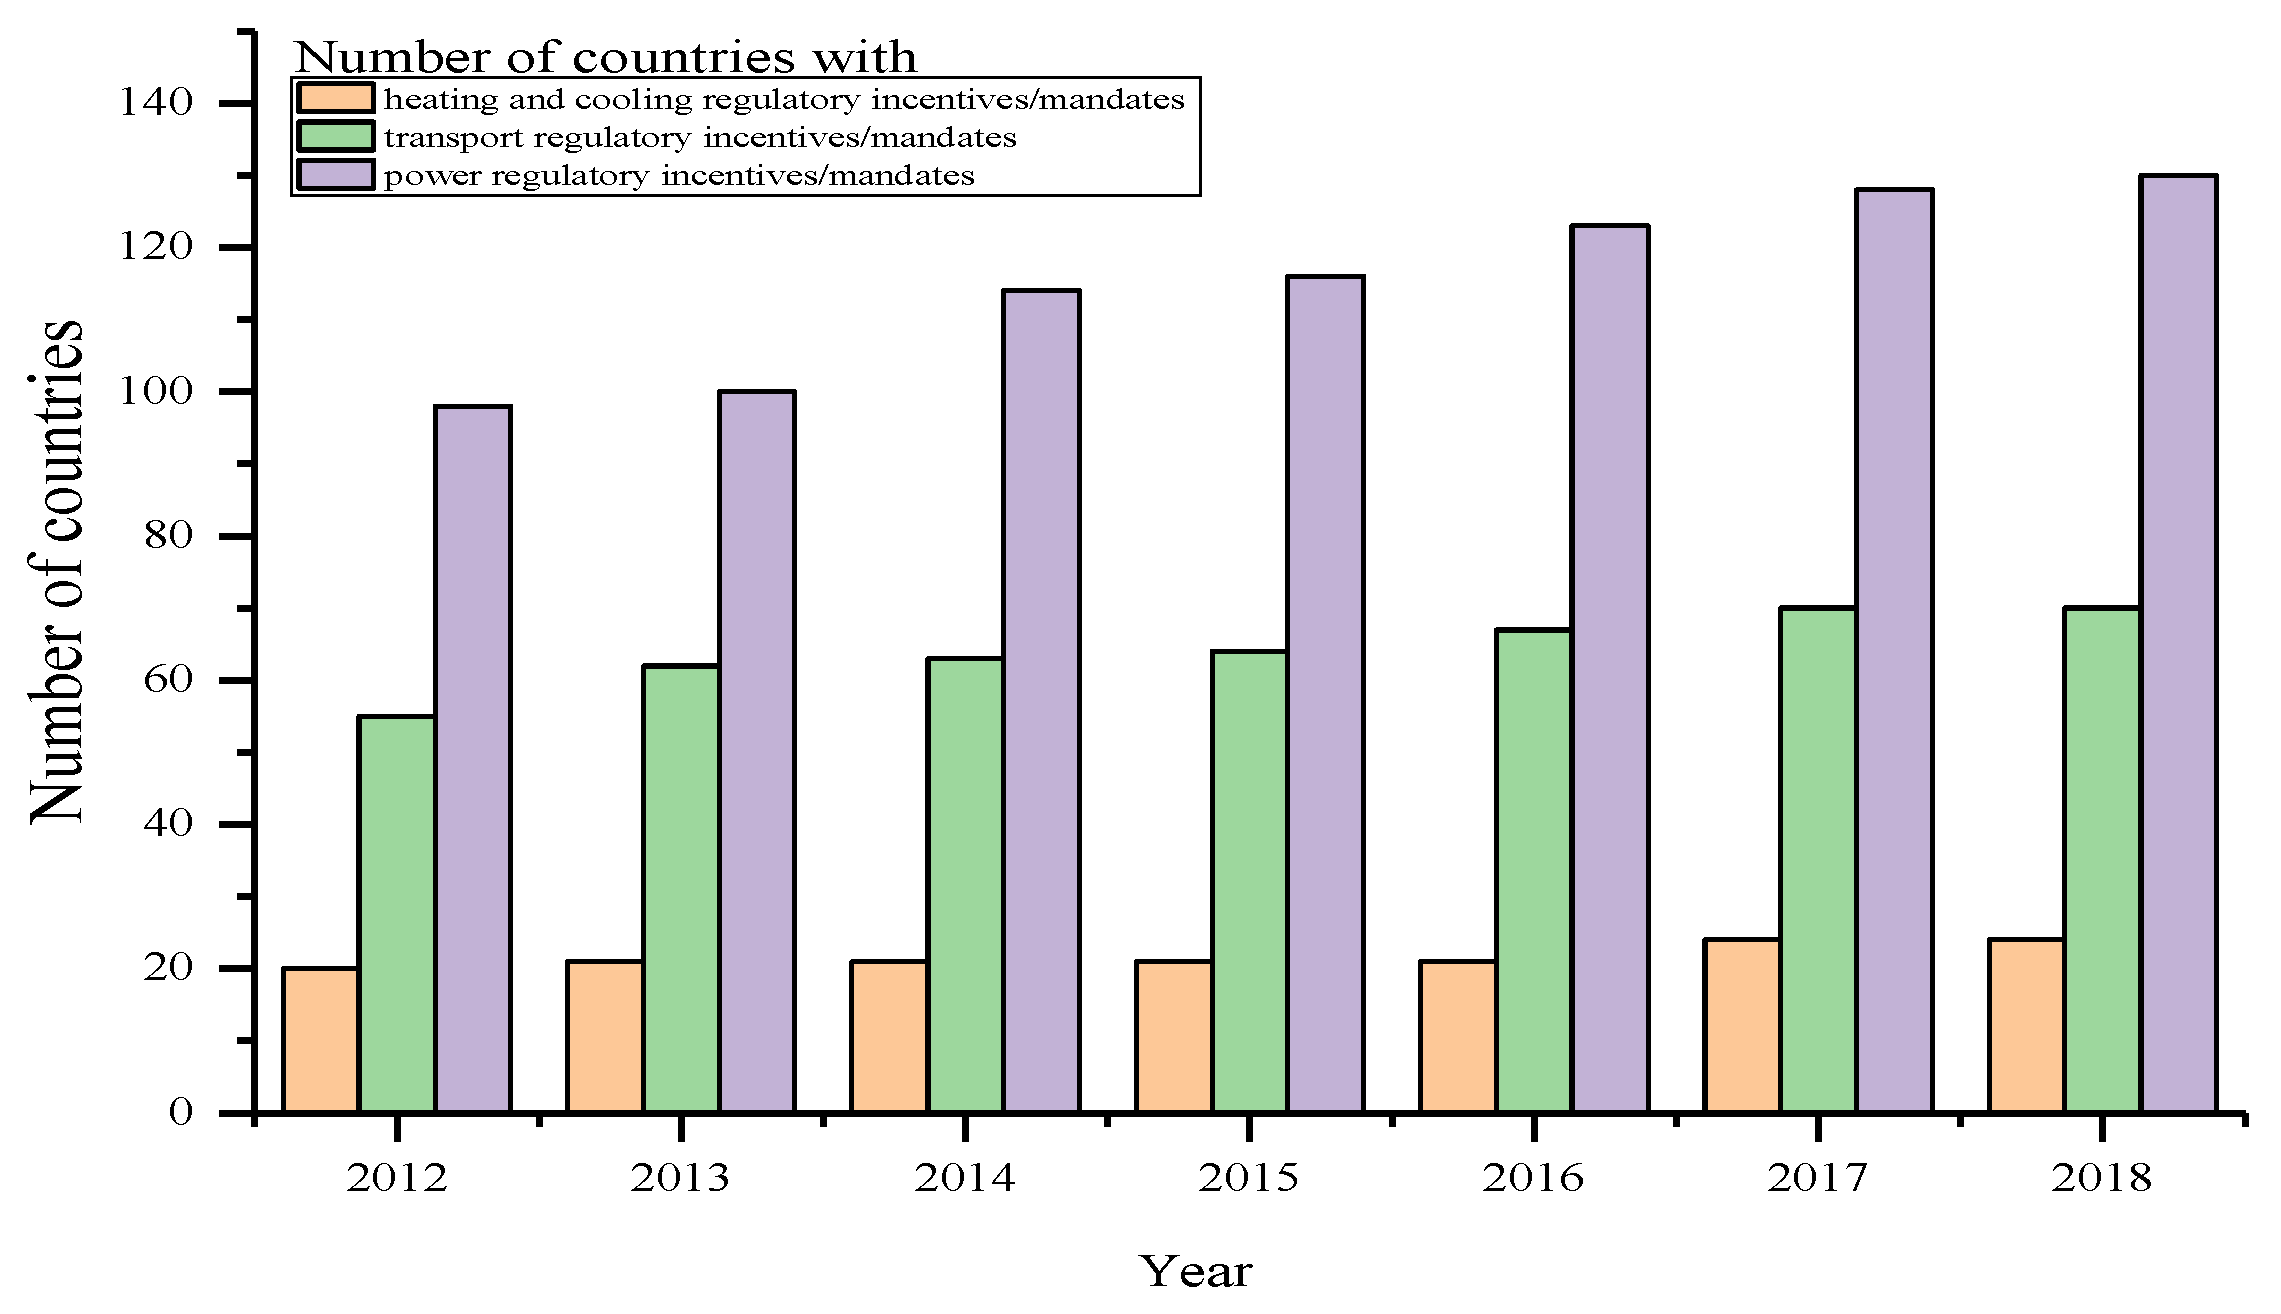
  9. International Renewable Energy Agency (IRENA). IEA/IRENA Joint Polices and Measures Database. 2018. Available online: https://www.iea.org/policiesandmeasures/renewableenergy/ (accessed on 4 July 2018).
  10. Doom, J. Poor Nations Go for Solar, Wind at Twice the Pace of Rich Ones. Renewable Energy World, 29 October 2014. [Google Scholar]
  11. Bilgili, M.; Ozbek, A.; Sahin, B.; Kahraman, A. An overview of renewable electric power capacity and progress in new technologies in the world. Renew. Sustain. Energy Rev. 2015, 49, 323–334. [Google Scholar] [CrossRef]
  12. Kim, J.; Guillaume, B.; Chung, J.; Hwang, Y. Critical and precious materials consumption and requirement in wind energy system in the EU 27. Appl. Energy 2015, 139, 327–334. [Google Scholar] [CrossRef]
  13. García-Gusano, D.; Iribarren, D.; Garraín, D. Prospective analysis of energy security: A practical life-cycle approach focused on renewable power generation and oriented towards policy-makers. Appl. Energy 2017, 190, 891–901. [Google Scholar] [CrossRef]
  14. Li, G.; Jin, Y.; Akram, M.W.; Chen, X. Research and current status of the solar photovoltaic water pumping system—A review. Renew. Sustain. Energy Rev. 2017, 79, 440–458. [Google Scholar] [CrossRef]
  15. Geng, W.; Zeng, M.; Peng, L.; Liu, X.; Li, B.; Duan, Z. China’s new energy development: Status, constraints and reforms. Renew. Sustain. Energy Rev. 2016, 53, 885–896. [Google Scholar] [CrossRef]
  16. Shen, J.; Luo, C. Overall review of renewable energy subsidy policies in China–Contradictions of intentions and effects. Renew. Sustain. Energy Rev. 2015, 41, 1478–1488. [Google Scholar] [CrossRef]
  17. He, G.; Kammen, D.M. Where, when and how much wind is available? A provincial-scale wind resource assessment for China. Energy Policy 2014, 74, 116–122. [Google Scholar] [CrossRef]
  18. Zhang, X.; Ma, C.; Song, X.; Zhou, Y.; Chen, W. The impacts of wind technology advancement on future global energy. Appl. Energy 2016, 184, 1033–1037. [Google Scholar] [CrossRef] [Green Version]
  19. Zhang, L.; Liu, Y. Analysis of New Energy Vehicles Industry Policy in China’s Cities from the Perspective of Policy instruments. Energy Procedia 2016, 104, 437–442. [Google Scholar] [CrossRef]
  20. Liu, Z.; Wu, D.; Li, J.; Yu, H.; He, B. Optimizing Building Envelope Dimensions for Passive Solar Houses in the Qinghai-Tibetan Region: Window to Wall Ratio and Depth of Sunspace. J. Therm. Sci. 2018, 1–14. [Google Scholar] [CrossRef]
  21. International Renewable Energy Agency (IRENA). Renewable Energy Target Setting. June 2015. Available online: https://www.irena.org/publications/2015/Jun/Renewable-Energy-Target-Setting (accessed on 4 July 2018).
  22. Kaplan, Y.A. Overview of wind energy in the world and assessment of current wind energy policies in Turkey. Renew. Sustain. Energy Rev. 2015, 43, 562–568. [Google Scholar] [CrossRef]
  23. Nordensvärd, J.; Urban, F. The stuttering energy transition in Germany: Wind energy policy and feed-in tariff lock-in. Energy Policy 2015, 82, 156–165. [Google Scholar] [CrossRef] [Green Version]
  24. Knopf, B.; Nahmmacher, P.; Schmid, E. The European renewable energy target for 2030—An impact assessment of the electricity sector. Energy Policy 2015, 85, 50–60. [Google Scholar] [CrossRef]
  25. GWEC (Global Wind Energy Council). Global Wind Report. 2018. Available online: www.tuulivoimayhdistys.fi/filebank/1191-GWEC_Global_Wind_Report_ April_2018.pdf (accessed on 4 July 2018).
  26. Zhang, X.; Shen, L.; Chan, S.Y. The diffusion of solar energy use in HK: What are the barriers? Energy Policy 2012, 41, 241–249. [Google Scholar] [CrossRef]
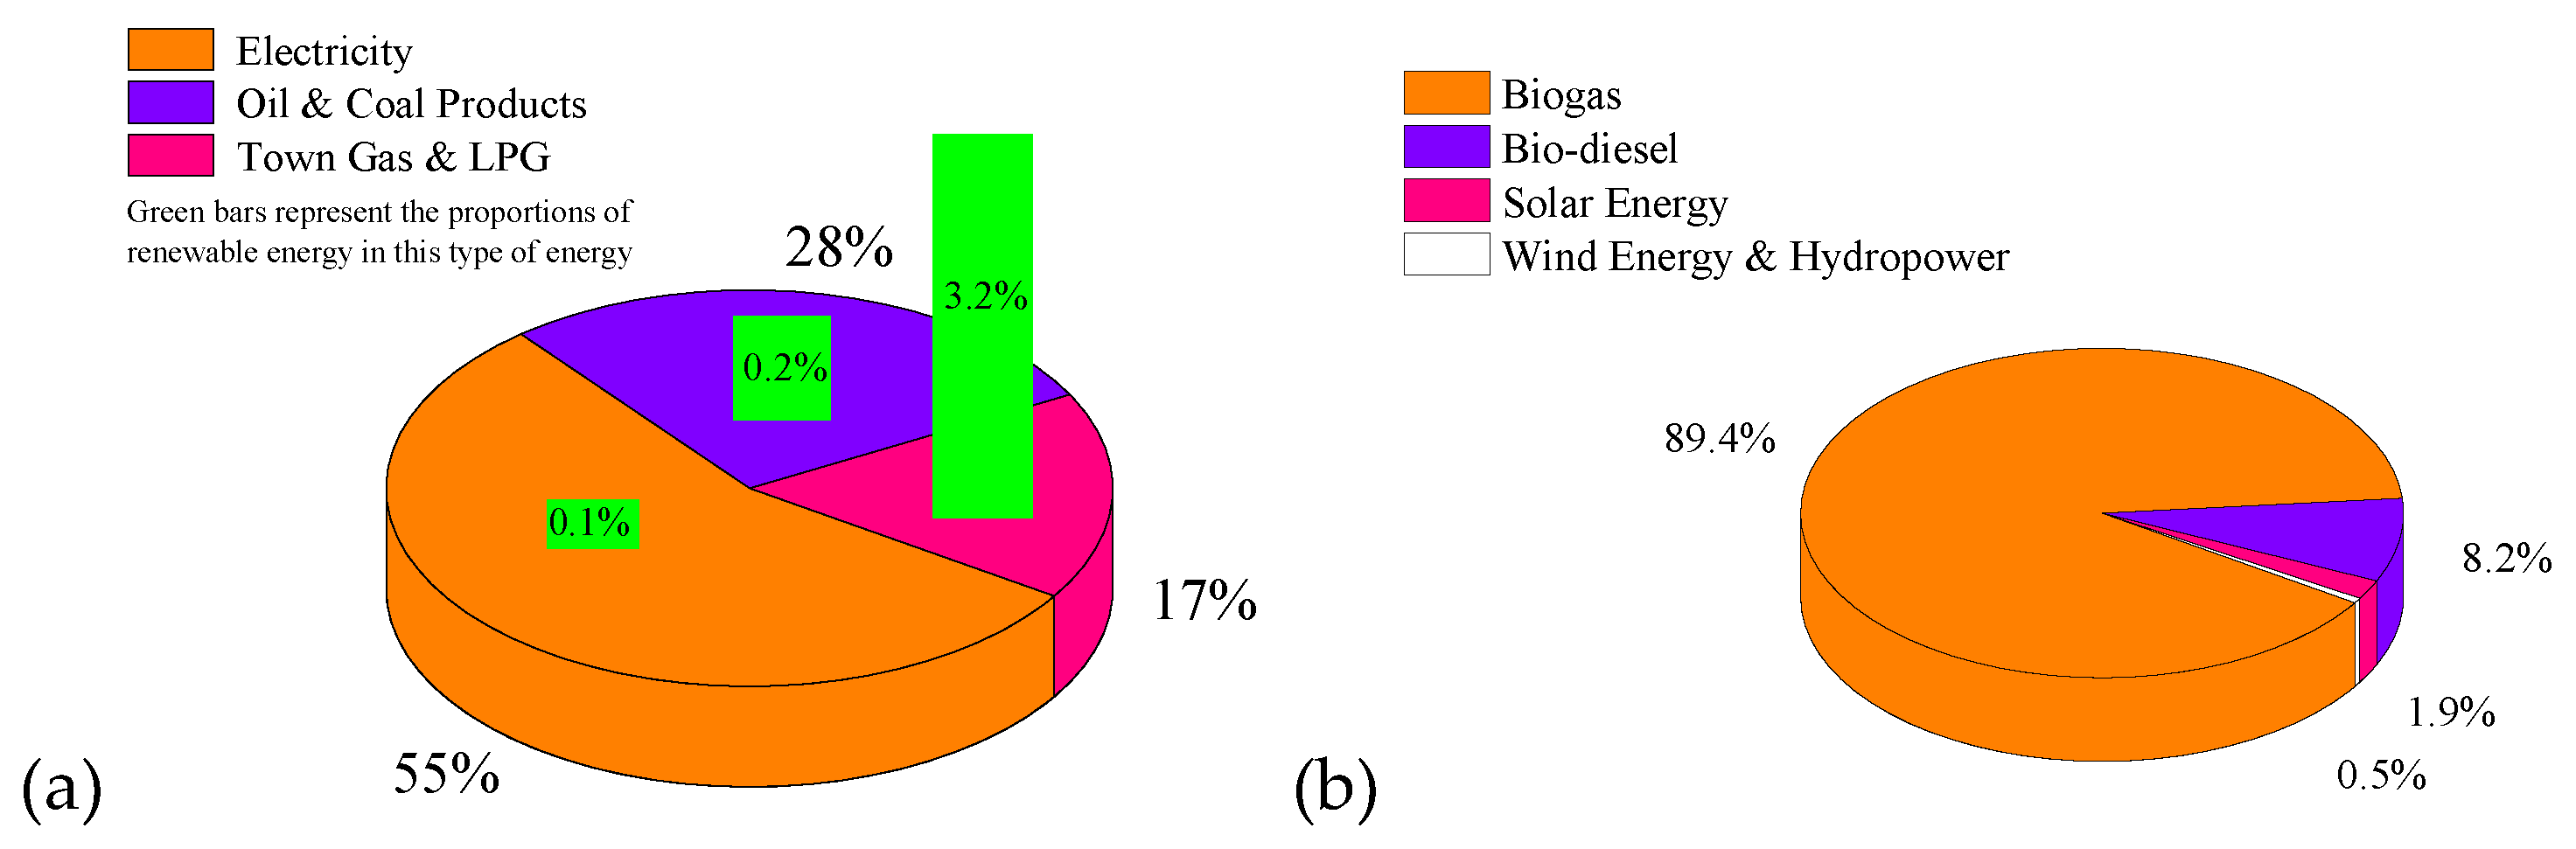
  27. Electrical and Mechanical Services Department (EMSD). Hong Kong Energy End-Use Data; The Government of the Hong Kong Special Administrative Region: Hong Kong, China, 2018.
  28. Onea, F.; Rusu, E. Efficiency assessments for some state of the art wind turbines in the coastal environments of the Black and the Caspian seas. Energy Explor. Exploit. 2016, 34, 217–234. [Google Scholar] [CrossRef] [Green Version]
  29. Rusu, L.; Ganea, D.; Mereuta, E. A joint evaluation of wave and wind energy resources in the Black Sea based on 20-year hindcast information. Energy Explor. Exploit. 2017, 36, 335–351. [Google Scholar] [CrossRef] [Green Version]
  30. Genç, M.S.; Çelik, M.; Karasu, İ. A review on wind energy and wind–hydrogen production in Turkey: A case study of hydrogen production via electrolysis system supplied by wind energy conversion system in Central Anatolian Turkey. Renew. Sustain. Energy Rev. 2012, 16, 6631–6646. [Google Scholar] [CrossRef]
  31. Genç, M.S.; Gökçek, M. Evaluation of Wind Characteristics and Energy Potential in Kayseri, Turkey. J. Energy Eng. 2009, 135, 33–43. [Google Scholar] [CrossRef]
  32. Gökçek, M.; Genç, M.S. Evaluation of electricity generation and energy cost of wind energy conversion systems (WECSs) in Central Turkey. Appl. Energy 2009, 86, 2731–2739. [Google Scholar] [CrossRef]
  33. Genç, M.S. Economic Analysis of Large-Scale Wind Energy Conversion Systems in Central Anatolian Turkey. In Clean Energy Systems and Experiences; Eguchi, K., Ed.; Intech-Sciyo: Vienna, Austria, October 2010; pp. 131–154. [Google Scholar]
  34. Genç Mustafa, S. Economic Viability of Water Pumping Systems Supplied by Wind Energy Conversion and Diesel Generator Systems in North Central Anatolia, Turkey. J. Energy Eng. 2011, 137, 21–35. [Google Scholar] [CrossRef]
  35. Paul, S.S.; Oyedepo, S.O.; Adaramola, M.S. Economic Assessment of Water Pumping Systems Using Wind Energy Conversion Systems in the Southern Part of Nigeria. Energy Explor. Exploit. 2012, 30, 1–17. [Google Scholar] [CrossRef] [Green Version]
  36. Genç, G.; Çelik, M.; Genç, M.S. Cost analysis of wind-electrolyzer-fuel cell system for energy demand in Pınarbaşı-Kayseri. Int. J. Hydrogen Energy 2012, 37, 12158–12166. [Google Scholar] [CrossRef]
  37. Bilgili, M.; Sahin, B. Investigation of Wind Energy Density in the Southern and Southwestern Region of Turkey. J. Energy Eng. 2009, 135, 12–20. [Google Scholar] [CrossRef]
  38. Sahin, B.; Bilgili, M. Wind Characteristics and Energy Potential in Belen-Hatay, Turkey. Int. J. Green Energy 2009, 6, 157–172. [Google Scholar] [CrossRef]
  39. Ahmed Shata, A.S.; Hanitsch, R. Evaluation of wind energy potential and electricity generation on the coast of Mediterranean Sea in Egypt. Renew. Energy 2006, 31, 1183–1202. [Google Scholar] [CrossRef]
  40. Chang, T.-J.; Tu, Y.-L. Evaluation of monthly capacity factor of WECS using chronological and probabilistic wind speed data: A case study of Taiwan. Renew. Energy 2007, 32, 1999–2010. [Google Scholar] [CrossRef]
  41. Nouni, M.R.; Mullick, S.C.; Kandpal, T.C. Techno-economics of small wind electric generator projects for decentralized power supply in India. Energy Policy 2007, 35, 2491–2506. [Google Scholar] [CrossRef]
  42. Gao, X.; Yang, H.; Lu, L. Study on offshore wind power potential and wind farm optimization in Hong Kong. Appl. Energy 2014, 130, 519–531. [Google Scholar] [CrossRef]
  43. Gao, X.; Yang, H.; Lu, L. Investigation into the optimal wind turbine layout patterns for a Hong Kong offshore wind farm. Energy 2014, 73, 430–442. [Google Scholar] [CrossRef]
  44. Wong, L.T.; Mui, K.W. Efficiency assessment of indoor environmental policy for air-conditioned offices in Hong Kong. Appl. Energy 2009, 86, 1933–1938. [Google Scholar] [CrossRef]
  45. Dong, C.G. Feed-in tariff vs. renewable portfolio standard: An empirical test of their relative effectiveness in promoting wind capacity development. Energy Policy 2012, 42, 476–485. [Google Scholar] [CrossRef]
  46. Ucar, A.; Balo, F. Evaluation of wind energy potential and electricity generation at six locations in Turkey. Appl. Energy 2009, 86, 1864–1872. [Google Scholar] [CrossRef]
  47. Hamilton, J.D. This is what happened to the oil price-macroeconomy relationship. J. Monet. Econ. 1996, 38, 215–220. [Google Scholar] [CrossRef]
  48. Dai, K.; Bergot, A.; Liang, C.; Xiang, W.; Huang, Z. Environmental issues associated with wind energy—A review. Renew. Energy 2015, 75, 911–921. [Google Scholar] [CrossRef]
  49. Boey, A.; Su, B. Low-carbon Transport Sectoral Development and Policy in Hong Kong and Singapore. Energy Procedia 2014, 61, 313–317. [Google Scholar] [CrossRef] [Green Version]
  50. Chipindula, J.; Botlaguduru, V.S.V.; Du, H.; Kommalapati, R.R.; Huque, Z. Life Cycle Environmental Impact of Onshore and Offshore Wind Farms in Texas. Sustainability 2018, 10, 2022. [Google Scholar] [CrossRef]
  51. Lam, T.N.T.; Botlaguduru, V.S.V.; Du, H.; Kommalapati, R.R.; Huque, Z. Impact of climate change on commercial sector air conditioning energy consumption in subtropical Hong Kong. Appl. Energy 2010, 87, 2321–2327. [Google Scholar] [CrossRef]
  52. Lee, W.L.; Yik, F.W.H. Framework for formulating a performance-based incentive-rebate scale for the demand-side-energy management scheme for commercial buildings in Hong Kong. Appl. Energy 2002, 73, 139–166. [Google Scholar] [CrossRef]
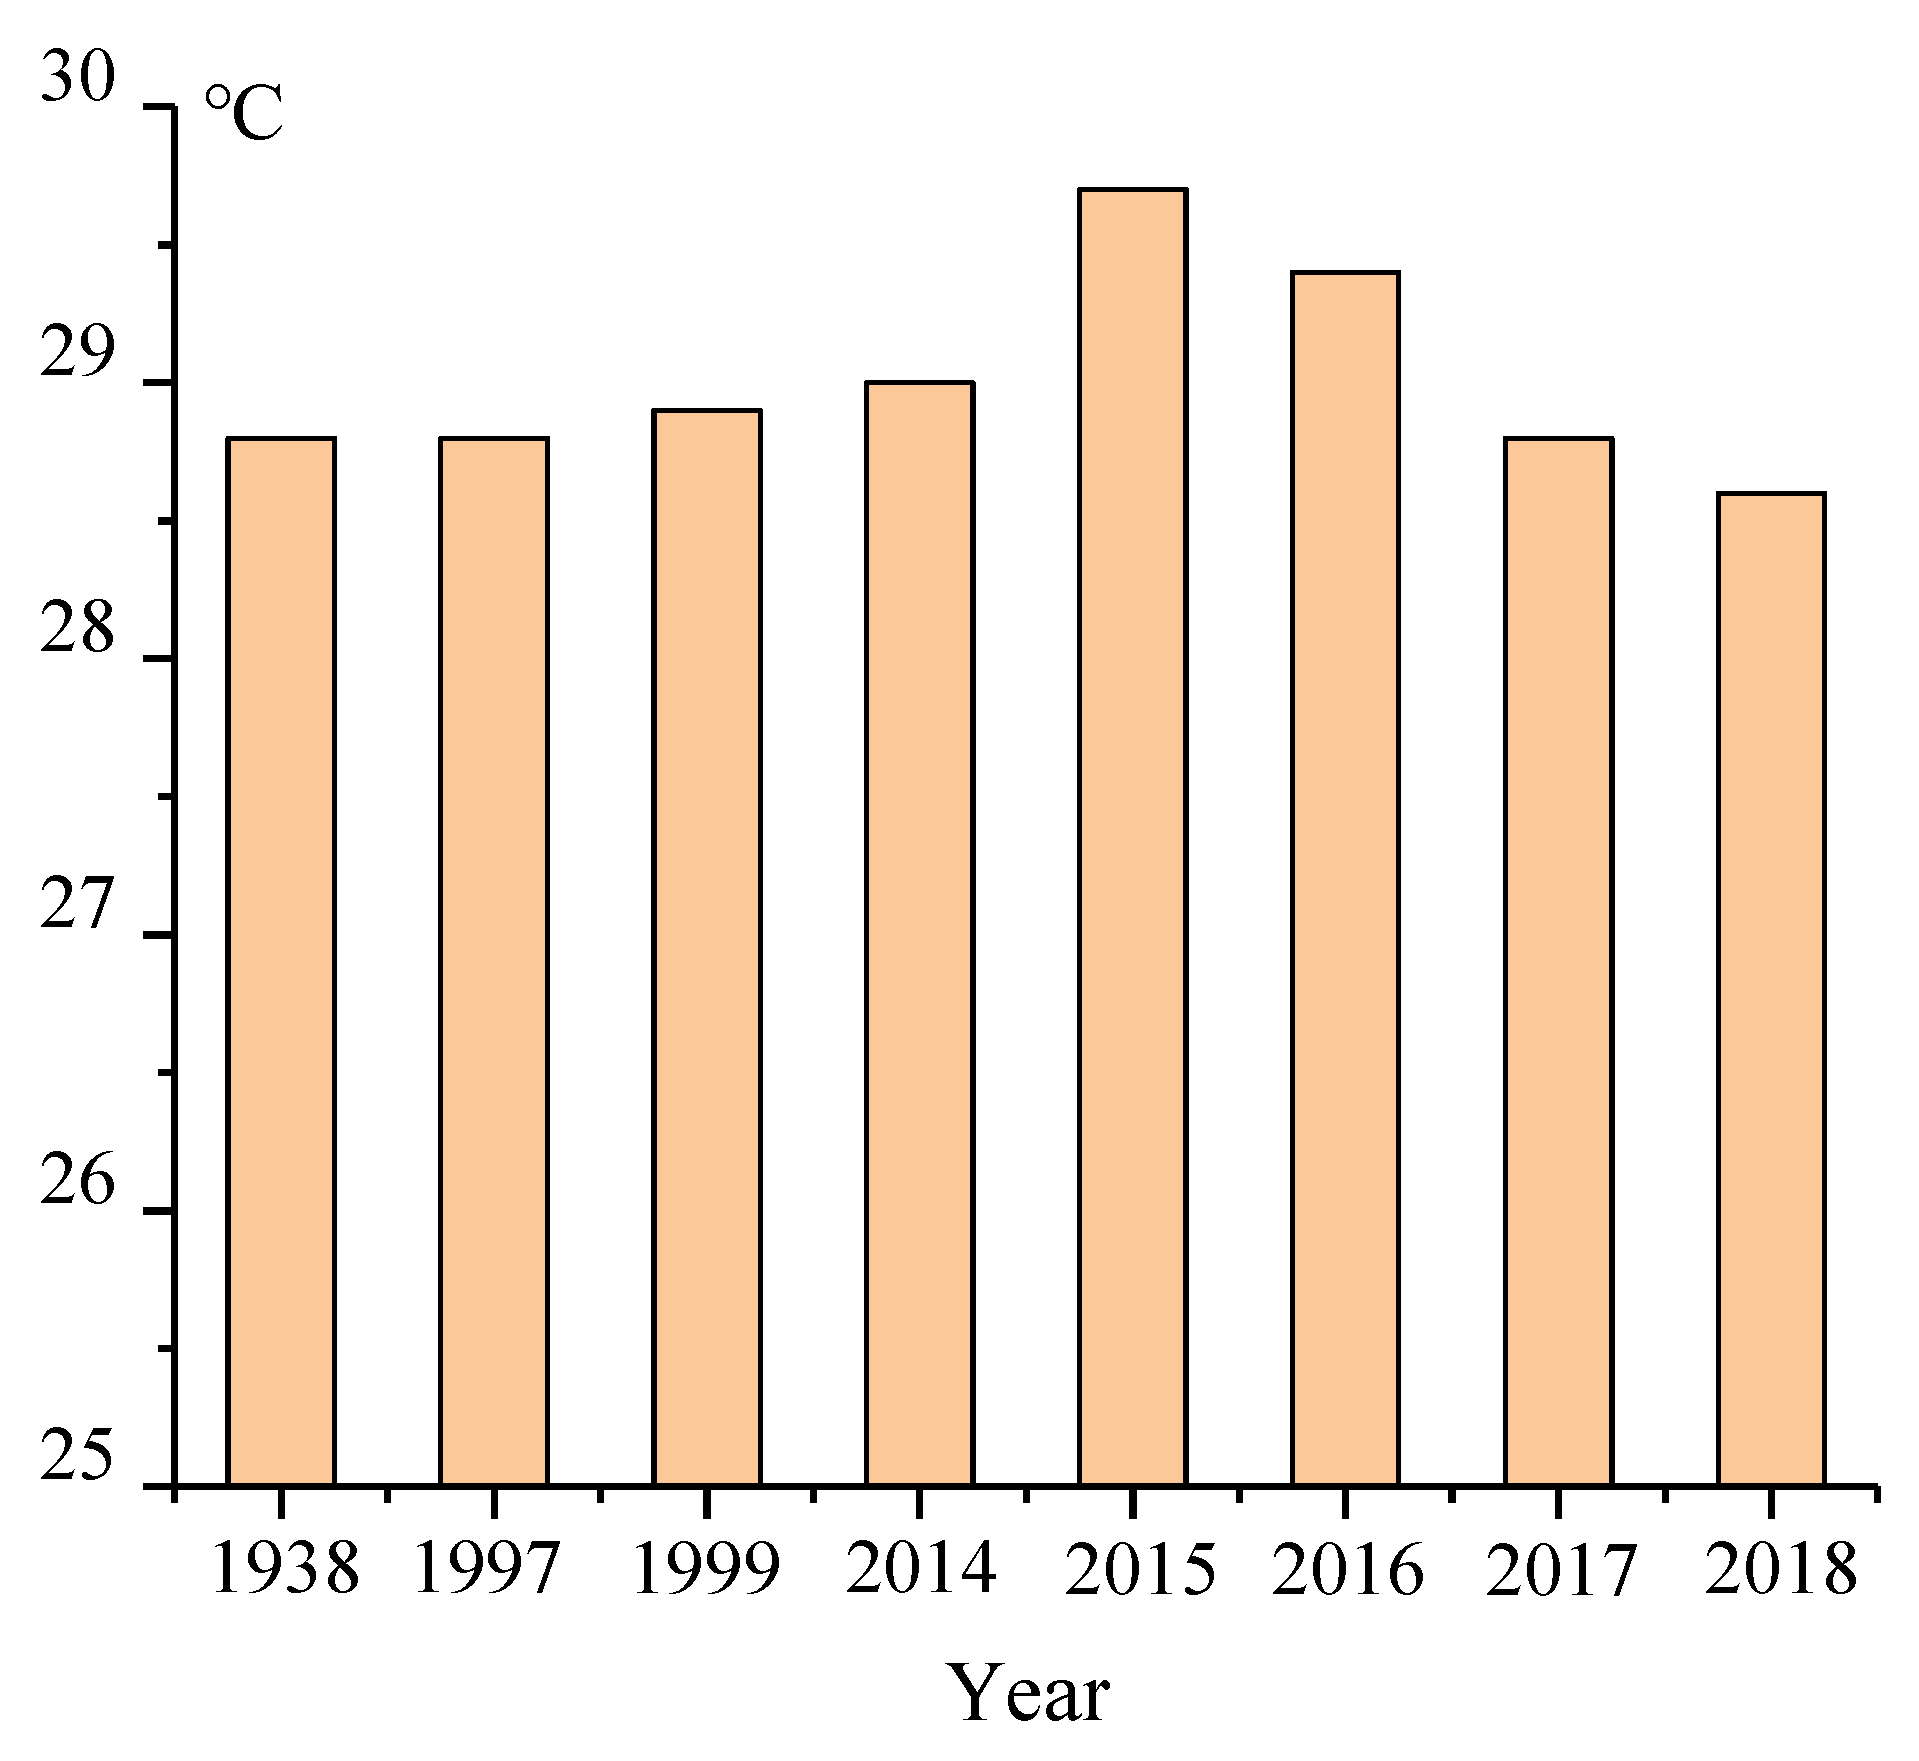
  53. Hong Kong Observatory. 2018. Available online: https://www.hko.gov.hk/contentc.htm (accessed on 4 July 2018).
  54. Study on the Potential Applications of Renewable Energy in Hong Kong-Stage 1 Study Report; Electrical & Mechanical Services Department, Government of the Hong Kong Special Administrative Region: Hong Kong, China, 2002.
  55. Lu, L.; Yang, H.; Burnett, J. Investigation on wind power potential on Hong Kong islands—An analysis of wind power and wind turbine characteristics. Renew. Energy 2002, 27, 1–12. [Google Scholar] [CrossRef]
  56. Lu, L.; Yang, H. Wind data analysis and a case study of wind power generation in Hong Kong. Wind Eng. 2001, 25, 115–123. [Google Scholar] [CrossRef]
  57. Lu, L.; Ip, K.Y. Investigation on the feasibility and enhancement methods of wind power utilization in high-rise buildings of Hong Kong. Renew. Sustain. Energy Rev. 2009, 13, 450–461. [Google Scholar] [CrossRef]
  58. Lu, L.; Sun, K. Wind power evaluation and utilization over a reference high-rise building in urban area. Energy Build. 2014, 68, 339–350. [Google Scholar] [CrossRef]
  59. Li, G. Feasibility of large scale offshore wind power for Hong Kong—A preliminary study. Renew. Energy 2000, 21, 387–402. [Google Scholar] [CrossRef]
  60. Hong Kong Observatory, Information of Weather Station. 2018. Available online: https://www.hko.gov.hk/contente.htm (accessed on 4 July 2018).
  61. The Hongkong Electric Co., Ltd. (HK Electric). Building an Offshore Wind Farm near Lamma Island.Affirms-Southwest-Lamma-Offshore-Wind-Farm. 2018. Available online: https://www.hkelectric.com/en/media-resources/press-releases/2010/02/05/EIA-Study- (accessed on 4 July 2018).
  62. Gao, X.; Yang, H.; Lu, L.; Koo, P. Wind turbine layout optimization using multi-population genetic algorithm and a case study in Hong Kong offshore. J. Wind Eng. Ind. Aerodyn. 2015, 139, 89–99. [Google Scholar] [CrossRef]
  63. Hui, S.C. From Renewable Energy to Sustainability: The Challenge for Hong Kong; Hong Kong Institution of Engineers: Hong Kong, China, 1997; pp. 351–358. [Google Scholar]
  64. Electrical & Mechanical Services Department (EMSD). HK RE Net. Available online: 2018.https://re.emsd.gov.hk/english/wind/small/small_ep.html (accessed on 5 November 2018).
  65. Electrical & Mechanical Services Department (EMSD). HEC wind turbine project on Lamma Island. 2018. Available online: https://re.emsd.gov.hk/english/wind/large/large_ep.html (accessed on 5 November 2018).
  66. HK Offshore Wind Limited. Hong Kong Offshore Wind Farm in Southeastern Waters; HK Offshore Wind Limited: Hong Kong, China, 2009. [Google Scholar]
  67. HK Offshore Wind Limited. Hong Kong Offshore Wind Farm in Southeastern Waters-Executive Summary; HK Offshore Wind Limited: Hong Kong, China, 2009. [Google Scholar]
  68. Lin, Z. Renewable Energy in Hong Kong: Worth it or not? Harbour Times. 10 July 2015. Available online: http://harbourtimes.com/2015/07/10/renewable-energy-in-hong-kong-worth-it-or-not/ (accessed on 5 November 2018).
  69. Heading towards Sustainability, The Third Review of Progress on the 1989 White Paper: Pollution in Hong Kong—A Time to Act, Planning, Environment and Lands Branch; Government Secretariat: Hong Kong, China, March 1996.
  70. A First Sustainable Development Strategy for Hong Kong, in Sustainable Development Unit; Office of the Chief Secretary for Administration: Hong Kong, China, 2005.
  71. Public Consultation on Future Fuel Mix for Electricity for Hong Kong, T.G.o.t.H.K.S.A.R; Environment Bureau: Hong Kong, China, 2014. Available online: http://www.gov.hk/en/residents/government/publication/consultation/docs/2014/FuelMix.pdf (accessed on 24 July 2018 ).
  72. A Clean Air Plan for Hong Kong; Environment Bureau, The Government of the Hong Kong Special Administrative Region: Hong Kong, China, 2013.
  73. Lipp, J. Lessons for effective renewable electricity policy from Denmark, Germany and the United Kingdom. Energy Policy 2007, 35, 5481–5495. [Google Scholar] [CrossRef]
  74. Shrimali, G.; Lynes, M.; Indvik, J. Wind energy deployment in the US: An empirical analysis of the role of federal and state policies. Renew. Sustain. Energy Rev. 2015, 43, 796–806. [Google Scholar] [CrossRef]
  75. Dai, Y.; Xue, L. China’s policy initiatives for the development of wind energy technology. Clim. Policy 2015, 15, 30–57. [Google Scholar] [CrossRef]
  76. Parker, A. Renewable Energy Target for Australia–The Role of Fuel Conversion Efficiency and Waste Biomass Valorisation. Energy Environ. 2015, 26, 847–851. [Google Scholar] [CrossRef]
  77. Cory, K.; Kreycik, C.; Williams, E. A Policymaker’s Guide to Feed-In Tariff Policy Design; National Renewable Energy Laboratory: Golden, CO, USA, 2010.
  78. Berry, T.; Jaccard, M. The renewable portfolio standard: Design considerations and an implementation survey. Energy Policy 2001, 29, 263–277. [Google Scholar] [CrossRef]
  79. Sawin, A.L. Mainstreaming Renewable Energy in the 21st Century; World Watch Institute: Washington, DC, USA, 2004. [Google Scholar]
  80. Couture, T.; Gagnon, Y. An analysis of feed-in tariff remuneration models: Implications for renewable energy investment. Energy Policy 2010, 38, 955–965. [Google Scholar] [CrossRef]
  81. Hirsh, R.F. PURPA: The spur to competition and utility restructuring. Electr. J. 1999, 12, 60–72. [Google Scholar] [CrossRef]
  82. Komor, P. Renewable Energy Policy; IUniverse: Lincoln, NE, USA, 2004. [Google Scholar]
  83. Reiche, D. Handbook of Renewable Energies in the European Union: Case Studies of the EU-15; Peter Lang: Frankfurt am Main, Germany, 2005. [Google Scholar]
  84. Butler, L.; Neuhoff, K. Comparison of feed-in tariff, quota and auction mechanisms to support wind power development. Renew. Energy 2008, 33, 1854–1867. [Google Scholar] [CrossRef]
  85. Mendonça, M. Feed-In Tariffs: Accelerating the Deployment of Renewable Energy; Routledge: London, UK, 2009. [Google Scholar]
  86. Mitchell, C.; Bauknecht, D.; Connor, P.M. Effectiveness through risk reduction: A comparison of the renewable obligation in England and Wales and the feed-in system in Germany. Energy Policy 2006, 34, 297–305. [Google Scholar] [CrossRef]
  87. Strawn, W. (Ed.) Feed-In Tariff Handbook for Asian Renewable Energy Systems; WINSTON & STRAWN: Hong Kong, China, 2014. [Google Scholar]
  88. WIKIPEDIA. Renewable Portfolio Standard. 2014. Available online: https://en.wikipedia.org/wiki/Renewable_portfolio_standard (accessed on 24 July 2018).
  89. Baker, D.R. Brown signs climate law mandating 50% renewable power by 2030. San Francisco Chronicle, 7 October 2015. [Google Scholar]
  90. Meyer, N.I. Learning from wind energy policy in the EU: Lessons from Denmark, Sweden and Spain. Eur. Environ. 2007, 17, 347–362. [Google Scholar] [CrossRef]
  91. GWEC. Global Wind Report 2015; Global Wind Energy Council: Brussels, Belgium, February 2016. [Google Scholar]
  92. Garud, R.; Karnøe, P. Bricolage versus breakthrough: Distributed and embedded agency in technology entrepreneurship. Res. Policy 2003, 32, 277–300. [Google Scholar] [CrossRef]
  93. Wang, W. Denmark: The Power of Feed-in Tariffs. 2013. Available online: http://www.cleantechies.com/2013/05/23/denmark-the-power-of-feed-in-tariffs/ (accessed on 24 July 2018).
  94. Ratinen, M.; Lund, P. Policy inclusiveness and niche development: Examples from wind energy and photovoltaics in Denmark, Germany, Finland, and Spain. Energy Res. Soc. Sci. 2015, 6, 136–145. [Google Scholar] [CrossRef]
  95. Publich Opinion. 2009. [Cited 2016]. Available online: http://www.windpower.org/en/policy/public_opinion.html (accessed on 28 January 2019).
  96. Toke, D.; Breukers, S.; Wolsink, M. Wind power deployment outcomes: How can we account for the differences? Renew. Sustain. Energy Rev. 2008, 12, 1129–1147. [Google Scholar] [CrossRef]
  97. Jamison, A.; Eyerman, R.; Cramer, J. The Making of the New Environmental Consciousness: A Comparative Study of Environmental Movements in Sweden, Denmark and the Netherlands; Edinburgh University Press: Edinburgh, UK, 1991; Volume 1. [Google Scholar]
  98. O’Neill, M. Green Parties and Political Change in Contemporary Europe: New Politics, Old Predicaments; Dartmouth Pub Co.: Hanover, NH, USA, 1997. [Google Scholar]
  99. WIKIPEDIA. Risø DTU National Laboratory for Sustainable Energy. 2016. Available online: https://en.wikipedia.org/wiki/Ris%C3%B8_DTU_National_Laboratory_for_Sustainable_Energy (accessed on 11 May 2018).
  100. Danish Wind Industry Association: Copenhagen, Denmark, 2015. Available online: https://windpower.org/en (accessed on 24 July 2018).
  101. Enevoldsen, P.; Sovacool, B.K. Examining the social acceptance of wind energy: Practical guidelines for onshore wind project development in France. Renew. Sustain. Energy Rev. 2016, 53, 178–184. [Google Scholar] [CrossRef]
  102. Mundaca, L.; Markandya, A. Assessing regional progress towards a ‘Green Energy Economy’. Appl. Energy 2016, 179, 1372–1394. [Google Scholar] [CrossRef]
  103. Moné, C.; Smith, A.; Maples, B.; Hand, M. 2013 Cost of Wind Energy Review; National Renewable Energy Laboratory: Golden, CO, USA, 2013. Available online: www.nrel.gov/publications (accessed on 24 July 2018).
  104. Warren, C.R.; Lumsden, C.; O’Dowd, S.; Birnie, R.V. ‘Green on green’: Public perceptions of wind power in Scotland and Ireland. J. Environ. Plan. Manag. 2005, 48, 853–875. [Google Scholar] [CrossRef]
  105. Roques, F.; Hiroux, C.; Saguan, M. Optimal wind power deployment in Europe—A portfolio approach. Energy Policy 2010, 38, 3245–3256. [Google Scholar] [CrossRef]
  106. Jobert, A.; Laborgne, P.; Mimler, S. Local acceptance of wind energy: Factors of success identified in French and German case studies. Energy Policy 2007, 35, 2751–2760. [Google Scholar] [CrossRef]
  107. Manwell, J.F.; McGowan, J.G.; Rogers, A.L. Wind Energy Explained: Theory, Design and Application; John Wiley & Sons: New York, NY, USA, 2010. [Google Scholar]
Figure 1. Number of countries with types of renewable energy policies (From [9]).
Sustainability 11 00924 g001
Figure 2. Hong Kong Energy End-use Data: (a) The weighting of RE (renewable energy) in respective fuel type in 2016 and (b) Types of RE capacities in Hong Kong.
Sustainability 11 00924 g002
Figure 3. The average temperature of Hong Kong in June in selected years (°C) [53].
Sustainability 11 00924 g003
Figure 4. Wind resources in Hong Kong Territorial Waters.
Sustainability 11 00924 g004
Figure 5. Wind distribution and speed probability.
Sustainability 11 00924 g005
Figure 6. Factor analysis of development conditions for RE in HK.
Sustainability 11 00924 g006
Figure 7. Feed-in Tariff rates of different renewable energy resources in China [87]. * FIT rates in China are different in different site location of power generation. In this table, a general estimation of the FIT rates range is collected. # The exchange rate is CNY1 = USD0.1564 (7th, June 2018).
Sustainability 11 00924 g007
Figure 8. Total installed wind project capacity in Denmark [91].
Sustainability 11 00924 g008
Table 1. Wind power potential in Hong Kong in literatures.
CategoryTotal AreaTotal Annual Potential
EMSD’s Report [54]Wind power in rural locations393 km2126.8–136.8 × 10⁸ (kWh)30.22% of 2011’s electricity consumption
Turbines in high-rise buildings30,000 buildings in HK > 65 m
Offshore wind-
Li’s Study [59]Turbine SpacingTotal AreaTotal Annual Potential
10D × 10D-14 TWh40% of 1998’s electricity consumption
5D × 10D-25 TWh72% of 1998’s electricity consumption
Gao’s Study [42]Scatter-112.81 × 10⁸ (kWh)25% of 2011’s electricity consumption
Table 2. Optimization results of the selected wind farm and Hong Kong offshore wind power potential assessment.
Area (km2)Number of WTsTotal Power (×108 kWh)COE (HKD/kWh)Potential Offshore Area (km2)Total (GWh)% of Electricity Consumption in 2017
16.86255.781.55421.481444932.02
Table 3. Examples of small wind turbine projects in Hong Kong [64].
Examples of Small Wind Turbine Projects by the Government
YearVenueInstalled Capacity
2011Shatin Sewage Treatment Works21 nos. of lamp pole mounted wind and solar PV hybrid system (each 0.41 kW wind turbine and 0.16 kW solar PV)
2010Shau Kei Wan Government Secondary School100W micro wind turbine system
2007EMSD Headquarters1.5 kW vertical wind turbine
Examples of Non-government Small Wind Turbine Projects in Hong Kong
YearOrganizationVenueInstallation TypeCapacity
2010Tung Chung Catholic SchoolRoof top of buildingTurbines providing electricity for weather station
2008HK ElectricMarsh Road StationGrid-connected horizontal-axis turbine2 × 2.5 kW
2007Ho Koon Nature Education 400 W Astronomical CentreBuilding roof & campusWind turbines and solar PV modules2 × 250 W
2006Sun Hung Kai PropertiesMa Wan Theme ParkGrid-connected wind power system2 × 6 kW
Table 4. Wind energy policy developing history of Denmark.
Phase No./TimeDescription
Phase 1: First Energy Plan, (Dansk Energipolitik)/1976
  • Aim: reduce dependence on imported oil (90% on oil in 1973).
  • “Sketch for an energy plan in Denmark” 1976;
  • “Energy for the future: alternative energy plan” 1983;
  • Wind turbine is still too costly with a capacity of 55 kW.
Phase 2: Second Energy Plan (Energiplan81)/1981
  • Function: Simulate the growing of energy production.
  • Introduced subsidies for the construction and operation of WTs while increase the taxes imposed on oil and coal.
  • Incentive offered to families for generation power for their community.
  • Capital grants of up to 30% of the installation costs.
  • Two orders of 100 MW wind power issued in 1985 and 1990 and 200 MW in 2000.
Phase 3: Third Energy Plan (Energi 2000 [87]), Feed-in tariff/1990
  • The first energy plans in the world without nuclear power.
  • Targets: reducing CO2 emissions by 20% in 2005 with providing 10% of electricity from wind turbines by 2005 [86].
  • Fixed feed-in tariff: 85% of the retail electricity rate by 1992 [87].
  • A refund of carbon tax for the first 5 years of operation.
  • Public hearings prior to any actual applications for turbine siting, was a significant help in getting public acceptance [87].
Phase 4: Fourth Energy Plan (Energi 21)/1996
  • Target: RE provide 12–14% consumption in 2005, 35% by 2030.
  • Offshore WF was set as a further planning regulations an additional 750 MW of OWP (five offshore WF) in 1998.
  • A net exporter of energy.
Phase 5: Electricity market liberalisation/(1999–2008)
  • In 1999, liberalise Denmark’s electricity market by 2002.
  • FIT was abandoned in 2004 and introduced a RPS mechanism [88].
  • The WP development stagnated, only 129 MW in 2004–2008.
  • ‘Energy policy statement of 2008 to address climate change’ increased the development with a funding of EUR135 million/year [89].
  • New target: Increase the utilization of RE to 20% of energy consumption by 2011 and the reduction of total energy consumption of 2% by 2011 and 4% by 2020 based on 2006.
Phase 6: Rejuvenation and strengthening of the wind sector/2009–2012
  • Installation increase to 3482 MW [90].
  • Environmental premium: for onshore wind: DKK 0.25/kWh for the first 22,000 full load hours.
  • For offshore, 0.45–0.52 DKK/kWh for first 10 years [91,92].
  • For new offshore wind since 2009, the premium plus market will not exceed (depending on location) DKK 0.518 or DKK 0.629/kWh for up to 10 TWh with 20 years of grid connection. The maximum subsidy of systems financed by utility companies is DKK 0.353/kWh. An additional DKK 0.023/kWh was provided during the whole lifetime of the turbine to compensate for the cost of balancing [92].
  • ‘Energy Strategy 2050’ in 2011 aim to achieve independence from coal, oil and gas by 2050, 50% from renewable energy by 2020 [93].
Phase 7:
Rapid development stage/2013-now
  • Electricity production from renewables accounted for 53.4% of Danish domestic electricity supply in 2014 and in which, 38.8% from wind power [94].
  • CO2 emissions have been reduced by 32.6% since 1990 [94].
  • A feed-in premium of DKK 0.25/kWh for onshore wind and the a feed-in premium of DKK 0.25/kWh [95].
  • Integration of wind power in the energy system is the key barriers to wind energy development in this stage

