Article

The Consumer Acceptance of Smart Product-Service Systems in Sharing Economy: The Effects of Perceived Interactivity and Particularity

1
School of Business, Sichuan Normal University, Chengdu 610101, China
2
Faculty of International Tourism and Management, City University of Macau, Macau 999078, China
3
School of Business, Macau University of Science and Technology, Macau 999078, China
*
Authors to whom correspondence should be addressed.
Sustainability 2019, 11(3), 928; https://0-doi-org.brum.beds.ac.uk/10.3390/su11030928
Submission received: 22 January 2019 / Revised: 9 February 2019 / Accepted: 10 February 2019 / Published: 12 February 2019
(This article belongs to the Special Issue Smart Mobility for Future Cities)

Abstract

:
With the rapid growth of the sharing economy, access-based services have emerged as an alternative and/or complementary to traditional ownership-based services. The access-based services are enabled by means of Smart Product-Service Systems (SPSSs) that integrate smart products and e-services into a single solution. However, there is a lack of studies that cover the acceptance factors for both smart products and e-services of SPSSs. Therefore, it is important to have a study to explore the factors that influence the acceptance of SPSSs. This study develops a conceptual framework which consists of the perceived interactivity of mobile apps and the particularity of the smart shared products as antecedents apart from perceived usefulness and perceived ease of use, as suggested by the Technology Acceptance Model. To test the research framework empirically, a self-reported online survey was conducted among bike sharing program users in China. A total of 520 valid responses were collected, and the partial least-square structural equation modeling (PLS-SEM) technique was used to examine the research model. The empirical results suggest that the perceived interactivity of mobile apps and the particularity of smart shared products are two significant sets of antecedents that influence consumers’ perceived ease of use and perceived usefulness, and the perceived ease of use and perceived usefulness are preconditions for the acceptance of SPSSs. The findings generate practical suggestions for SPSSs providers to increase the network size of users, improve the interactivity of mobile apps, and manage the distributions of service points.

1. Introduction

With the rapid growth of the sharing economy, access-based services have emerged as an alternative and/or complementary to traditional ownership-based services [1,2,3]. Access-based services allow customers to access a good, physical facility, network, labour, or space for a defined amount of time, in return for an access payment, while the legal ownership remains with the proprietors, who are often the service providers [4,5]. In that case, access-based services can reduce users’ budget constraints while also improving their livelihood [2]. The access-based services are enabled by means of Smart Product-Service Systems (SPSSs) that integrate smart products and e-services into single solutions [6,7,8]. Smart products make use of information and communication technology (ICT) to collect, process, and produce information, while e-services are web portals or apps which facilitate the communication between service providers and consumers [7]. For example, bike sharing systems are SPSSs that include mobile apps (as e-services) and smart bicycles (as smart shared products) integrating with sensors and the global positioning system (GPS). For success in launching an access-based service, the design of an SPSS is critical – including the design of smart products and the design of e-services. Users will only accept an SPSS if they accept both the smart product and the related e-service.
SPSSs are extended from Product-Service Systems (PSSs) that combine products and services as single solutions to consumers [7]. In some studies discussing the acceptance of PSSs [9,10,11], researchers used the Technology Acceptance Model (TAM) for obtaining an index of whether a solution would be accepted or not. TAM consists of two motivational determinants - Perceived Usefulness (PU) and Perceived Ease of Use (PEOU) [12], which serve as surrogate constructs for extrinsic motivation. However, consumers access smart shared products through e-services. Therefore, the e-service interaction between the service provider and the customer is considered as the first set of antecedents (referred to as ‘perceived interactivity’) of TAM [13] that contains three elements: perceived communication, perceived control, and perceived responsiveness [14]. On the other hand, the particular characteristics of smart shared products for supporting access-based services is considered as the second set of antecedents (referred to as ‘perceived particularity’) of TAM that consists of three specific characteristics: network externalities [15,16], perceived substitutability [17,18], and perceived ubiquity [16,17,19]. Such that, for studying the acceptance of SPSSs, this study integrates related antecedents with the motivational constructs of the TAM to form a research model.
The objective of this study is to examine the impact of the factors on the behavioural intention to use SPSSs in sharing economy. In this study, the relationships between two sets of antecedents and two technology acceptance constructs will be investigated. The literature reveals that researchers in PSSs have mainly studied service-related factors for adopting PSSs [6,20]. Some researchers have explored the key determinants of smart products [21,22] and some have identified the drivers of e-service acceptance from mobile apps [23,24]. There is a lack of studies that cover both smart-product-related and e-service-related factors that influence the acceptance of SPSSs. This study is a pioneer that contributes a comprehensive research model that can fully explain the essential requirements for both smart products and e-services of SPSSs. This study also provides a contribution to examine how perceived particularity and perceived interactivity influence usefulness and ease of use in the context of SPSSs. The study is organized as follows: the next section provides a brief literature review of the SPSSs in sharing economy, TAM, the interactivity of mobile apps, and the particularity of smart shared products. The literature review provides the rationale for modelling SPSSs acceptance based on TAM. Next, the third section presents the proposed conceptual model with the hypotheses to be tested. Following that, the sections of methodology, data analysis, and results are provided. Discussions and conclusions for the impacts on access-based services and sharing economy follow this, along with the study limitations and future work.

2. Literature Review

2.1. Smart Product-Service Systems

PSSs can be defined as business models providing an integrated mix of tangible products and intangible services that are able to fulfill final customer needs [25,26]. As innovative business approaches, PSSs have changed traditional business from solely sales to physical products to sales of a mix of products and services that jointly fulfill specific consumers’ needs [7]. There are three types of PSSs: result-oriented, product-oriented, and use-oriented PSSs [25,27,28]. In result-oriented PSSs, companies sell results or competencies rather than tangible products [28]. For example, a photocopy service is a type of result-oriented PSSs. In product-oriented PSSs, a tangible product is sold, its ownership is transferred, and additional services are then offered to guarantee the correct functionality and durability of the product [27]. For example, the purchase of a mobile phone may cover a warranty that guarantees its maintenance for a period. The use-oriented PSSs are generally acknowledged in the access-based service or sharing economy research field [6,25]. In use-oriented PSSs, the service providers sell the accessibility and use of specific products, keep the ownership, and are responsible for the maintenance and performance of products. For example, a car rental service is a use-oriented PSS. Recently, Gao et al. [29] used a customer demand approach to classify PSSs as product-oriented PSSs, application-oriented PSSs, and utility-oriented PSSs. In application-oriented PSSs, customers purchase use of the product over a given period or units of service (e.g., leasing a washing machine) for obtaining a financial advantage. In utility-oriented PSSs, customers purchase utility as an outcome (e.g., washing service) and not the use of a ‘product’.
Previous studies of PSSs have mainly aimed to address service-related issues. For example, Lee et al. [20] proposed the design of an e-service system of an electric car sharing service using mobile technology. Piscicelli et al. [6] studied the role of values in collaborative consumption in a UK-based online marketplace and found that lending and borrowing through this PSS may only be appealing to a (still) limited number of consumers sharing a certain, distinct, value orientation. Among existing studies, Fargnoli et al. [30] focused on Quality Function Deployment (QFD) to verify the service modularization for PSSs (including both product and service components) in the biomedical sector. The development of ICT is bringing use-oriented PSSs to a new level. SPSSs are ’smart’ because SPSSs guide the creation of e-services around the smart products. Therefore, the issues related to adopting SPSSs are both smart-product-related and e-service-related.
On the other hand, one of the most important characteristics of use-oriented PSSs is sustainability [31]. For example, the use of a public bicycle system provides sustainable benefits in reducing air pollution emissions (environmental sustainability), improving human health status (social sustainability), and obtaining monetary benefits for each stakeholder (economic sustainability) [32]. Since SPSS is an emerging type of use-oriented PSSs, SPSSs should also provide benefits for sustainability.

2.2. Technology Acceptance Model

Contemporary information systems (IS) literature has long been studying ‘how’ and ‘why’ individuals adopt new information technologies [33]. Several information system theoretical models have been generated in relevant disciplines, such as sociology, psychology, and economics. In all these models, Davis et al.’s TAM [12] is the most frequently used theoretical framework to address the issue of how users adopt new information technologies [34]. TAM was extended from Fishbein and Ajzen’s Theory of Reasoned Action (TRA) [35], which is a widely studied model from social psychology. According to TRA, human behavioral intention is influenced by attitudes, and attitudes are influenced by beliefs. Davis et al. applied these concepts in technology acceptance research. They used the TAM model to explain the influences of PU/PEOU on users’ intentions and actual system usage [36]. According to Davis, Bagozzi and Warshaw [36], PU is defined as “the prospective user’s subjective probability that using a specific application system will increase his or her job performance”, while PEOU is defined as “the degree to which the prospective user expects the target system to be free of effort” (p.985). TAM has been applied to IS and the related technological contexts with robustness through several tests and replications, such as wireless internet [37], mobile shopping [38], e-learning [39], and e-travel [40]. In the majority of past technology acceptance studies, PU and PEOU were reviewed as the two key determinants that influence users’ intentions to adopt new technologies [33,41,42,43]. While the TAM was introduced in 1986, until now, it has been widely applied and is still useful in predicting user behavior related to IS/ICT adoption. For example, in recent years (2017-2018), Liébana-Cabanillas et al. [44] and Choi [45] have used TAM as a theoretical lens to predict user behavior in mobile commerce. In this study, the TAM is used because it can provide a useful theoretical framework to predict user behavior in SPSSs.
In summary, TAM has been applied to different situations. However, to the best of our knowledge, there is no study that focuses on the acceptance of new technologies for access-based consumption via SPSSs in the sharing economy. The current study aims to fill this gap in the literature. Similar to some of the TAM research, this study omits attitude from TAM and tests the direct effects of PU and PEOU on intention to use SPSSs because attitude has a weak influence on intention due to the strong effects of PU and PEOU [46]. Since the antecedents of two motivational determinants of TAM in the sharing economy context should be different from the antecedents identified in previous studies in other contexts, this study also attempts to find out those antecedents.

2.3. The Perceived Interactivity of Mobile Apps

Since SPSSs are based on mobile apps, identifying consumers’ attitudes toward mobile apps is essential for understanding users’ acceptance of SPSSs. Among the many important features associated with the mobile apps, the interactivity is a unique one [14]. Perceived interactivity is users’ psychological sense of a system’s efficacy [47] and it includes three dimensions: control (internally based efficacy), responsiveness (external system efficacy), and communication [14,48,49].
Control is an internal system-based efficacy and can be translated into system users’ perceived control over where the systems are and where they are going [50]. When a consumer uses a mobile app, he/she will perceive more control of the mobile app if he/she knows where the e-services are and how to do the tasks (e.g., search for information, place the order). Therefore, perceived control as self-efficacy is an important factor under the perceived interactivity of mobile apps.
In contrast, responsiveness is an external system-based efficacy and can be rendered into users’ sense of how responsive an app or a website as a system is to their actions [50]. According to Steuer’s telepresence theory [51], users will perceive more responsiveness in a medium when that medium manages their requests/inputs quickly. When a consumer uses a mobile app, he/she expects to get instantaneous information and receive a fast response from the e-service of SPSS. Therefore, responsiveness as system-efficacy is an important factor under perceived interactivity of mobile apps.
Communication is the extent to which users believe that the system or medium facilitates two-way communication [14]. Rafaeli’s interactivity theory [52] posits that the quality of the communication is the most important determinant of interactivity. Two-way communication facilitates reciprocal relationships and subsequently affects interactivity perceptions [53,54]. Therefore, concurrent two-way communication provides a strong interactive power for mobile apps and should be an important factor under perceived interactivity of mobile apps.
In this study, since the above three elements are essential features of a mobile app for consumers to obtain e-services, these three dimensions of the “perceived interactivity” of mobile apps are proposed as a set of antecedents of the motivational determinants of the TAM in studying the acceptance of SPSSs in sharing economy.

2.4. The Particularity of Smart Shared Products

Compared with products offered by traditional businesses, SPSSs provide consumers with smart shared products with special characteristics. Although the major functionalities are similar to general products, smart shared products have certain special characteristics that support the availability of the access-based services. In this study, those special characteristics for access-based services are classified as the “particularities” of smart shared products. The literature reveals that there are three special characteristics of smart shared products: Perceived substitutability, perceived ubiquity, and network externalities.
Prior studies have suggested that shared products are preferred because they provide more benefits at a lower cost [17]. Lamberton and Rose [17] found that “perceived substitutability” is an important benefit that influences consumers’ acceptance of shared products. Hennig-Thurau, Henning and Sattler [18] argued that if shared products and consumers’ own products are substitutes, they are more likely to opt for shared products. On the other hand, consumers would not pay for the use of a smart shared product if it cannot provide equivalent functions as their own one. Therefore, perceived substitutability of ownership is an important factor under particularity of smart shared products.
Another benefit that influences consumers’ acceptance of shared products is the mobility utility [17]. Mobility utility refers to the absence of limitations on product use within a sharing system [17,18]. Serenko and Bontis [55] analogized mobility utility to the construct of ubiquity which provides anytime and anywhere access to IS. Watson et al. [56] described ubiquity as synonymous with omnipresence: “not only that they are everywhere but also that they are, in a sense, ‘nowhere’ for they become invisible as we no longer notice them” (p. 336). Of course, if a consumer cannot easily access a smart shared product, he/she will prefer to own his/her product. Thus, ubiquity is an important factor under particularity of smart shared products.
Due to interconnectedness and social nature of SPSSs, smart products exhibit the characteristics of network goods and should be subject to “network externalities”. Network externalities refer to “the utility that a user derived from consumption of the good increase with the number of other agents consuming the good (p. 424)” [57]. In the sharing economy, network externalities are divided into two types based on the number of access-based services and perceived critical mass of users. The number of access-based services is the supply side of the network, while the number of users is the demand side of the network. The utility obtained from using SPSSs is not only an increasing function of the supply side of a network, but also an increasing function of the demand network [24]. Katz and Shapiro [57] proposed “the utility that a given user derives from the good depends upon the number of other users who are in the same ‘network’ as is he or she (p. 424)”. For example, with the increase of the number of users aligned with the increase of the number of smart shared bicycles supplied, the smart shared bicycles are more likely to be accessed as more smart bicycles will be parked by users at more spots. So, network externality is an important factor under particularity of smart shared products.
In IS literature, prior studies in different contexts have individually examined how these three dimensions influence a new technology adoption. Thus, in the access-based service or sharing economy context, these three dimensions of the particularity of smart shared products may affect the motivational determinants of TAM in studying the acceptance of SPSSs in sharing economy.

3. Conceptual Framework and Hypotheses

Based on TAM [12], the current study examines the following two research objectives: (1) from the perspectives of the usage of mobile apps and smart shared products in SPSSs, the study aims at providing a model on the acceptance of SPSSs in sharing economy through introducing two types of antecedents: perceived interactivity of mobile apps and the particularity of smart shared products; (2) when SPSSs usage is affected by the perceived interactivity of mobile apps and the particularity of smart shared products, how are these antecedents related to the motivational determinants of consumers’ technology acceptance?

3.1. Relationships Between Ease of Use, Usefulnes, and Usage of SPSSs

TAM posits that two surrogate constructs, PU and PEOU, are primary motivations for new information technology acceptance behavior [36]. Additionally, previous technology adoption research has indicated that PEOU has a positive effect on PU in the context of mobile apps [38,40]. In the case of SPSSs, a consumer may be more likely to use an SPSS when he or she feels that using SPSS in an access-based service situation will be free of effort and will increase his or her task performance. The consumer may also perceive the task performance as increased if SPSS is easy to use. In line with previous research, the following hypotheses are proposed:
H1. 
The perceived ease of use of SPSSs positively influences perceived usefulness of SPSSs.
H2. 
The perceived ease of use of SPSSs positively influences intention of use of SPSSs.
H3. 
The perceived usefulness of SPSSs positively influences intention of use of SPSSs.

3.2. Antecedents of SPSSs Adoption

3.2.1. Control, Responsiveness, and Communication

Prior empirical research has indicated that there is a positive relationship between perceived interactivity and attitude or behavioral intention to a medium or system [49,50,54]. This study infers that the three dimensions of the perceived interactivity of mobile apps (control, communication, and responsiveness) may positively influence the PEOU of SPSSs in an access-based service or sharing economy.
Perceived control over the interaction process reflects a user’s confidence in performing requested activities. Perceived control is an internal system based efficacy, and can be translated into users’ control over the content, timing, and sequence of communication [14,49,50]. Perceived control has been found to greatly influence the ease of use perception [58,59,60,61,62]. Pituch and Lee [61] presented similar findings, showing that controllability has a significantly positive impact on PEOU of the e-learning systems. Therefore, when a user finds that the mobile app of an SPSS is controllable, he or she may perceive SPSS as easy to use.
Perceived responsiveness captures how the users perceive that an interactive medium responds to his or her input properly and in a timely manner. Some researchers found that perceived responsiveness has a positive relationship with PEOU. In the e-learning context, Pituch and Lee [61] argued that when an e-learning system is fast, consistent, and reasonable, this system’s response will be perceived as easy to use among learners. Therefore, if the response from a mobile app of an SPSS is very fast, the users may perceive that it is easy to use.
Perceived communication is the extent to which users believe that the system or medium facilitates two-way communication [14]. Two-way communication has been found to positively influence PEOU in previous studies [58,61,62]. Pituch and Lee [61] also supported that the two-way communication of an e-learning system makes learners feel that the system is easier to use. Thus, in the process of using SPSSs, perceived communication of mobile apps may positively influence users’ ease of use perception toward the SPSSs.
H4. 
The perceived interactivity of mobile apps has a positive effect on perceived ease of use of SPSSs.
H5. 
The perceived communication of mobile apps positively influences perceived ease of use of SPSSs.
H6. 
The perceived control of mobile apps positively influences perceived ease of use of SPSSs.
H7. 
The perceived responsiveness of mobile apps positively influences perceived ease of use of SPSSs.

3.2.2. Network Externalities, Perceived Substitutability, and Perceived Ubiquity

Prior studies have examined the effect of network externalities on new technology adoption [15,16,63]. Researchers in different contexts found that the network externalities have a positive effect on PU of the systems, such as Hsu and Lin [24] in internet-of-things (IoT). Most access-based services, such as shared cars or bicycles, exhibit strong network externalities, especially in traffic services. In access-based services, network externalities are not only due to the number of users, but also the number of services. That is the number of service points that consumers believe he or she will conveniently access a particular SPSS. An SPSS with more users and more service points may be perceived as more useful.
H8. 
The network externalities of the smart shared products positively influence perceived usefulness of SPSSs.
In the new product introduction research, a new product can substitute an old one as long as the new product is similar or superior to the old one in terms of functionality and benefit [64]. If so, when owning and sharing are seen as substitutes, consumers may prefer sharing [17,18]. Based on TAM and Uses & Gratification theory (U&G), Cha [65] found that perceived substitutability predicts the usefulness of video sharing sites. In addition, Ernst, et al. [66] also posited that perceived substitutability has a positive influence on the PU of augmented reality smart glasses. Thus, perceived substitutability of a smart shared product may be an important reason for users to perceive the usefulness of the SPSS.
H9. 
The perceived substitutability of the smart shared products positively influences perceived usefulness of SPSSs.
Ubiquity is the ability of a smart shared product to provide “anytime” and “anywhere” adaptive personalized usage. Previous literature found that perceived ubiquity of the technology is a critical determinant of the user’s attitude toward new technology. Researchers in different contexts found that the levels of the ubiquity of the products and services affect the levels of users’ participation in the systems, such as commercial sharing systems [17], mobile internet [19], and e-learning systems [16]. In access-based services, if consumers are able to access smart shared products anytime and anywhere, they will feel that it is free of effort for them to obtain the access-based services. Therefore, the perceived ubiquity of smart shared products may influence consumers’ PEOU of SPSSs.
H10. 
The perceived ubiquity of smart shared products positively influences perceived ease of use of SPSSs.
Based on the previous hypotheses, a research model is developed, as shown in Figure 1, to explain and predict the intention of SPSSs adoption.

4. Methodology

4.1. Sampling and Data Collection

Contemporary bike sharing programs refer to the provision of bicycles to enable short-term rental [67]. The bike sharing programs are a kind of use-oriented SPSSs, which usually contain technologies that allow users to search bicycles or track movements through mobile apps. Bike sharing programs have witnessed a sharp increase in both their prevalence and popularity worldwide. China currently has the world’s largest public bicycle share schemes, with over 16 million bicycles in 2017 [68]. Therefore, this study verifies the proposed research model through consumers’ adoption of bike sharing programs in China.
The data for this study were collected through an online questionnaire survey platform named Wenjuanxing (https://www.wjx.cn/), which provides a random sampling service with selection criteria. Since bike-sharing takes place in denser cities, only the people living in the main cities of China (including Beijing, Shanghai, Guangzhou, Shenzhen, Chengdu, and Changsha) were invited. Furthermore, only the people who had recent experience of using the bike sharing programs could fill in the survey. After completing the questionnaire, respondents could earn rewards from Wenjuanxing. A total of 550 people completed questionnaires collected in March 2018. The respondents were required to answer all questions in the questionnaire, and a manual data screening identified 30 monotone answers. Therefore, 520 returned responses were retained for analysis (valid response rate, 94.5%), and were used for model testing. Participants were given a definition of bike sharing programs prior to the survey: “In general, bike sharing is understood as short-term bicycle rental service conducted through online self-service transaction by a mobile app, whereby temporal rental via off-line staff service is not meant.” Table 1 provides an overview of socio-demographic and different variables of bike sharing programs usage.

4.2. Measurement

Established multi-item measures which had been tested in previous studies investigating websites’ or mobile apps’ effectiveness, commercial sharing systems utility, and ICT adoption motivations were adapted (The scales can be seen in the Appendix.). Existing measures of perceived interactivity were borrowed from Song and Zinkhan’s [14] study that included the measurements of three dimensions: (1) communication, (2) control, and (3) responsiveness. A total of 13 question items were used to assess the perceived interactivity of mobile apps. The three dimensions had good internal reliabilities (alpha values were 0.882, 0.907, and 0.91 for communication, control, and responsiveness, respectively).
Perceived ubiquity, which refers to the ability of shared bicycles to provide “anytime” and “anywhere” adaptive personalized usage, was operationalized by items from established scales [16,19,69]. Perceived substitutability items, which capture whether a shared bicycle is perceived to be considered as a closer substitute for an owned bicycle for the consumers, were adapted from the survey instruments used in Lamberton and Rose [17]. Network externality, which refers to the perceived benefit of using a shared bicycle that increases with the perceived number of users of that service [57], was operationalized by items from established scales [19,24]. A total of nine question items were used to assess these characteristics of smart shared products. The three variables also had good reliabilities (alpha values were 0.858, 0.885, and 0.890 for perceived ubiquity, substitutability, and network externality, respectively).
For TAM variables, items were adopted from Venkatesh, et al. [70] and Venkatesh and Davis [34]. The items were properly modified for the context of bike sharing programs. While PEOU items capture the effort necessary to use bike sharing programs, PU items assess whether bike sharing programs are perceived as an effective and efficient solution as a ‘last mile’ connection to the public transport. Usage intention of bike sharing programs captures consumers’ acceptance and continuous use. The TAM variables had good reliabilities (Cronbach’s alpha values were 0.910, 0.871, and 0.867 for PEOU, PU, and UI, respectively).
The questionnaire was first developed in English and then translated into Chinese. The translation was made by certified translators to ensure linguistic equivalence. Back-translation was performed to ensure the accurate depiction of the real meaning of the translation of the questionnaire. Items for all the above constructs were measured with seven-point Likert Scales (1= strongly disagree to 7= strongly agree).

5. Data Analysis and Results

The Smart-PLS 3.27 was used as the analytical tool to test the model [71]. Partial Least-Square Structural Equation Modeling (PLS-SEM) is widely used in IS research [72]. One of the advantages of using PLS-SEM is that the data do not need to meet certain normal distribution requirements [73]. Although the small sample size and use of formative indicators are not the reasons for this study using PLS-SEM, since PLS-SEM generally has a greater statistical power for detecting statistically significant relationships within a model [74], it is more suitable for the exploratory nature of this study. Furthermore, for understanding the total effects of perceived interactivity and perceived particularity, a Hierarchical Component Model (HCM) which contains two layers was constructed [75]. In this study, the lower-order component is a reflective-reflective type. PLS-SEM allows HCMs to be modeled and estimated [71]. By using the PLS-SEM, the reliability and validity of the measurement model were first examined before testing the structural model.

5.1. Measurement Model

Table 2 and Table 3 present the measurement model results, including information about factor loadings, reliability, and validity. The Cronbach’s alpha (CA) values of all constructs were over 0.7, showing a high reliability of items for each construct [76]. Composite reliabilities (CR) of all constructs ranged from 0.859 to 0.91 and exceeded the threshold value of 0.7. Furthermore, all average variance extracted (AVE) values ranged from 0.649 to 0.753 and exceeded 0.5 in all examined cases. AVE values were greater than variance due to measurement error (see Table 2). Therefore, the conditions for convergent validity were met [77]. In addition, the discriminant validity of the constructs was satisfactory since the square root of AVE of a construct is higher than any correlation with another construct (see Table 3).
Two methods were used to assess common method bias. Firstly, Harman’s one-factor test was performed [78]. Each principal construct explains roughly equal variance, indicating that our data do not suffer from high common method variance. Next, a full collinearity assessment approach was followed [79]. The full collinearity test simultaneously assesses both vertical and lateral collinearity. The variance inflation factors (VIFs) of all latent variables range from 1.847 to 3.063, which are lower than the 3.3 threshold [79,80], showing that the common method bias was less of a concern in the study.

5.2. Structural Model

Structural equation modeling was used to test the hypotheses. Figure 2 summarizes the structural model and shows the path coefficient for each path along with its significance and R2 for each endogenous variable. Consistent with the findings of previous studies of technology acceptance [16,81], PEOU has a direct positive effect on PU (β = 0.348, p < 0.001) and on the intention of use (β = 0.213, p < 0.001). PU has a direct positive effect on the intention of use (β = 0.526, p < 0.001). Perceived interactivity of mobile apps has a positive effect on PEOU. The dimensions of perceived interactivity, including perceived communication, perceived control, and perceived responsiveness, have direct effects on PEOU (β = 0.147, p = 0.002; β = 0.368, p < 0.001; and β = 0.220, p < 0.001, respectively). Perceived ubiquity positively affects PEOU (β = 0.150, p < 0.001). Perceived substitutability and network externality were found to directly relate to PU (β = 0.273, p < 0.001; β = 0.341, p < 0.001, respectively). Thus, the results from the PLS analysis support all hypotheses. Table 4 shows the direct, indirect, and total effects.

5.3. Second-order Model Analysis

In order to test the effects of perceived interactivity and perceived particularity, a second-order model was constructed and tested by adopting the repeated indicators approach. In the second-order model, perceived ubiquity was latched on its higher order scale and could not be regressed on PEOU. The results in Figure 3 show that perceived interactivity has a significant effect on PEOU and perceived particularity has a significant effect on PU. Table 5 shows the values of CR and AVE and the results of the discriminant validity test. All the values meet the requirements for reliability and validity.

6. Discussion and Conclusions

6.1. Discussions of Results

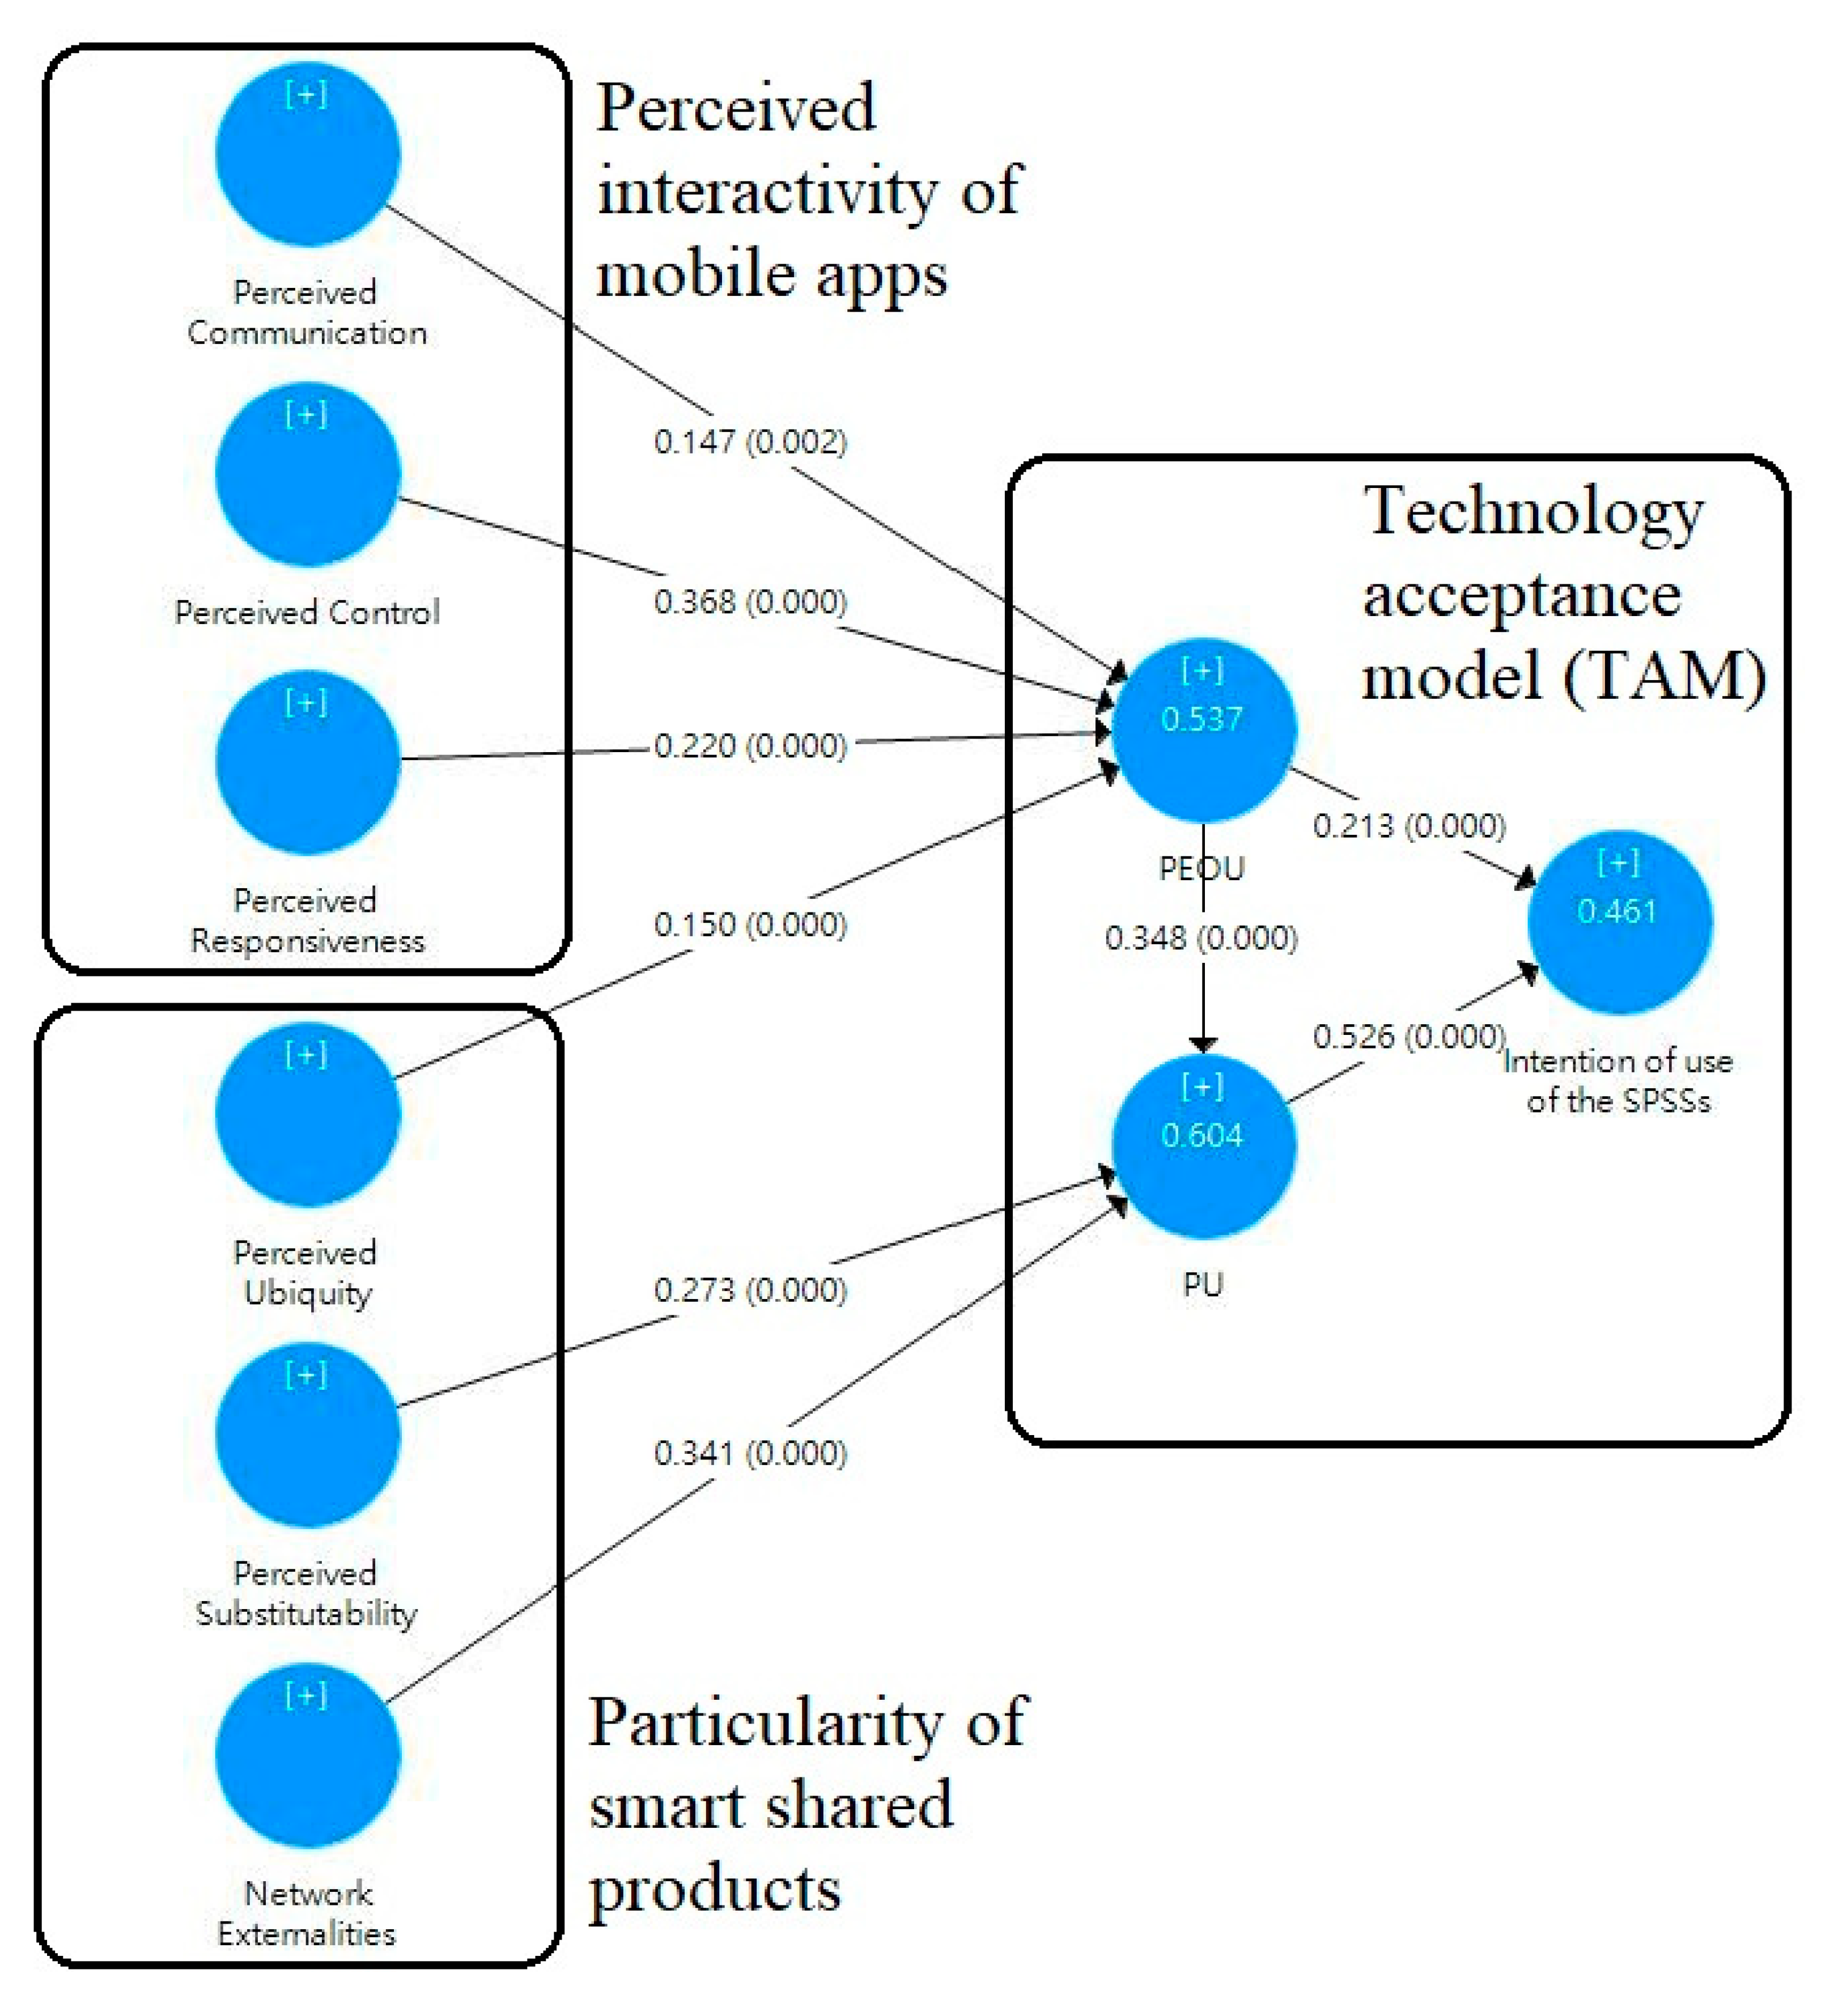
This study reveals that the intention to use SPSSs can be predicted by the proposed model (R2 = 0.461). PEOU and PU significantly and directly affect the intention of use SPSSs in sharing economy. The total effects of PEOU and PU are 0.395 and 0.526, respectively. This implies that to effectively promote the use of SPSSs in the sharing economy, it is important to make users believe that SPSSs will enhance their task performance and using SPSSs will be free of effort. Of these two drivers, PU is found to have the most significant influence on behavioral intention (β = 0.526). This highlights that PU plays a key role in predicting the user’s behavior in using SPSSs.
In addition, this study seeks to determine significant factors influencing the user’s PEOU and PU. The results reveal that PU is significantly attributed to three factors (PEOU, perceived substitutability, and network externality) that together account for 60.4% of the observed variance while explaining the PU. PEOU and network externality are found to have almost the same effect on PU (β = 0.348 and β = 0.341, respectively). Without perceived substitutability and network externality, the access-based services will not be available. In this case, with the increase in the number of users of smart shared bicycles, the number of access-based service points will be increased since smart shared bicycle service providers are willing to release more smart shared bicycles to the market. Thus, the users will find that the SPSSs are more useful – this is why network externality is an important antecedent for the PU of SPSSs. At the same time, users use smart shared bicycles for transportation because those bicycles can act as a substitute to self-owned bicycles and other transportation equipment. It explains why substitutability of the smart shared products can affect users’ perception of the usefulness of SPSSs. If a user finds that he or she cannot easily get a smart shared bicycle on the streets when he or she needs this service, the user will feel that SPSSs are not easy to use. Moreover, the indirect impact of PEOU on the intention of use through PU is 0.183 (see Table 4). The indirect effects of perceived substitutability and network externality are 0.144 and 0.179, respectively. This study shows that when consumers feel an SPSS is easy to use, the smart shared products have a large number of users, and the smart shared products are a close substitute for owned products, the consumers will perceive SPSS as useful and therefore they have a stronger intention to use it.
The results reveal that PEOU is significantly attributed to the perceived interactivity of mobile apps (i.e., perceived communication, perceived control, and perceived responsiveness) and perceived ubiquity of smart shared products. These four factors account for approximately 53.7% of the observed variance while explaining PEOU. Especially, in the three dimensions of perceived interactivity, perceived control is found to have the most significant influence on PEOU, with a coefficient much higher than the others (β = 0.368). The user perceives an SPSS to be easy to use only if he or she experiences better control of mobile apps. Besides, the responsiveness of mobile apps is also very important for PEOU (β= 0.220), because a fast and consistent response can lead to an “easy to use” feeling on the apps. Of course, reciprocal communication is necessary for making a mobile app easy to use. Without perceived ubiquity, the product cannot be easily shared. Moreover, the indirect impact of perceived communication, perceived control, perceived responsiveness, and perceived ubiquity on the intention of use are 0.058, 0.146, 0.087, and 0.059, respectively (see Table 4). The result implies that when consumers feel the mobile app is more interactive and they are able to access smart shared products anywhere and anytime, they will perceive that SPSSs are more easy to use and will have a stronger intention to use the SPSSs. This study shows that perceived control plays an important role in shaping users’ PEOU and affects users’ behavior intention to use SPSSs. Similarly, perceived communication, perceived responsiveness, and perceived ubiquity predict PEOU of SPSSs.

6.2. Conclusions

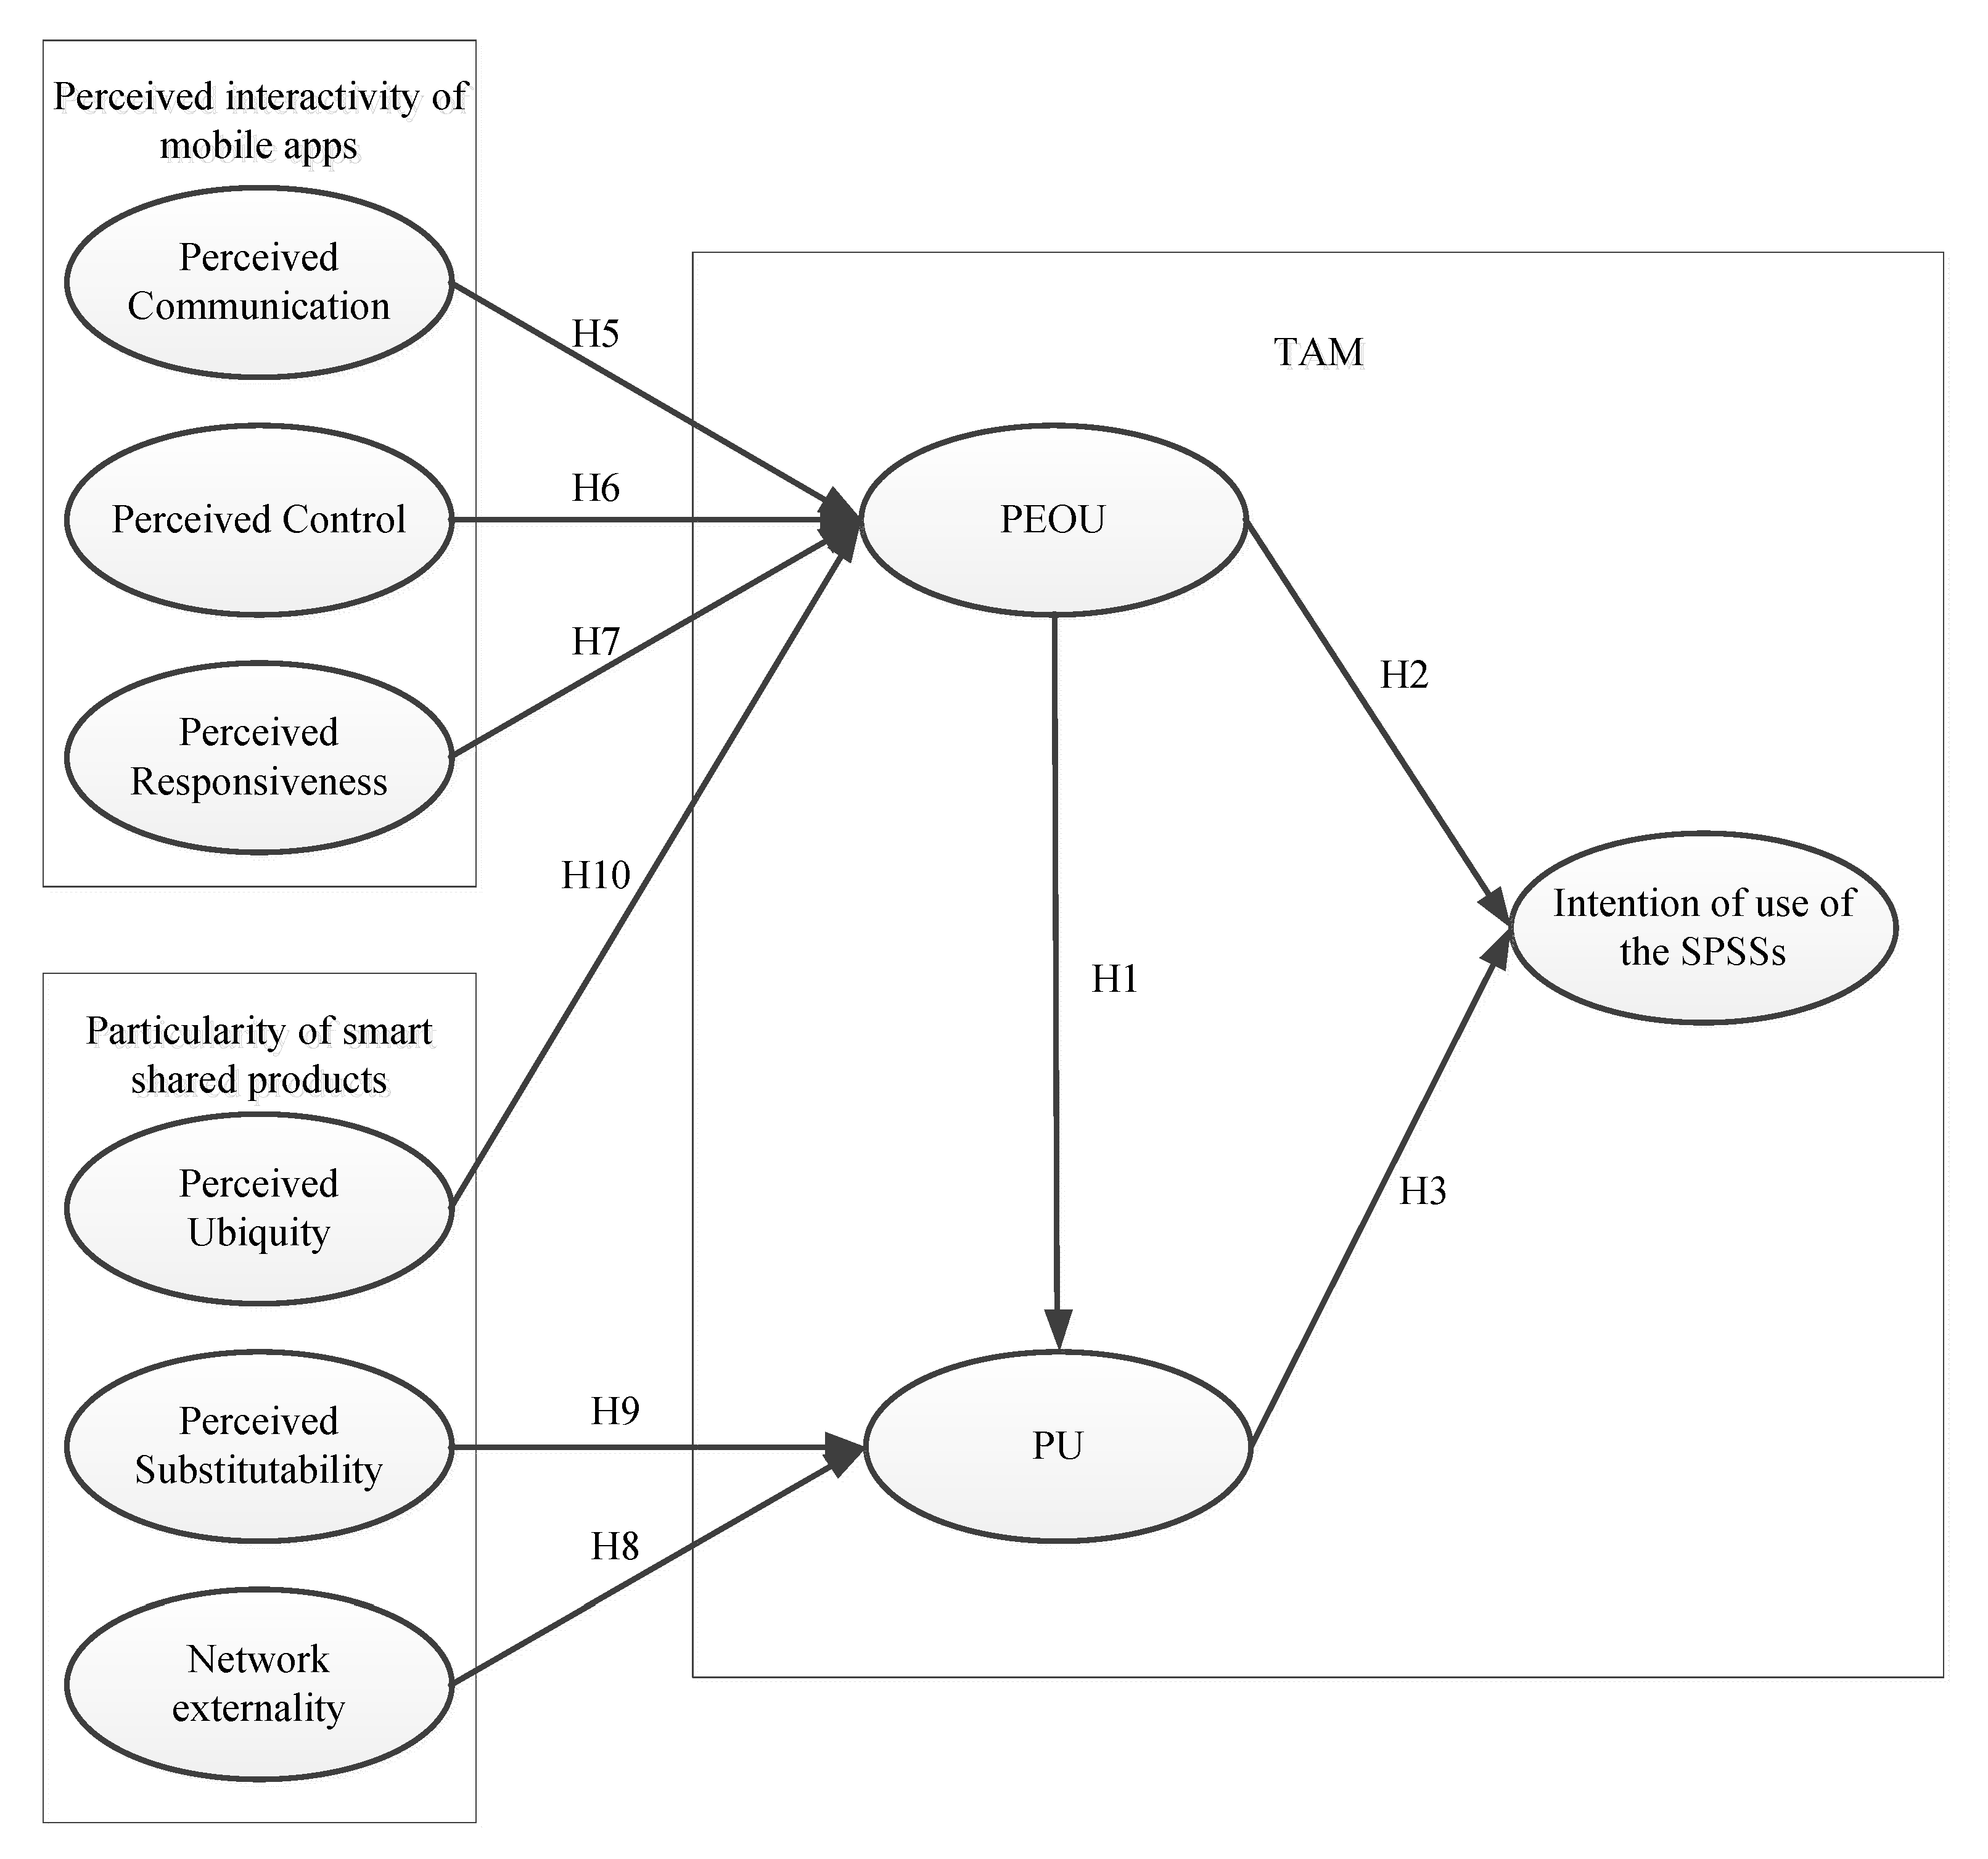
The primary objective of this study is to identify the determinants of consumers’ acceptance of SPSSs in an access-based service or sharing economy. This study takes a systems view on SPSSs and adopts TAM as a basic theoretical framework for exploring the determinants from two core components of SPSSs (i.e. smart sharing products and mobile apps) and their effects.
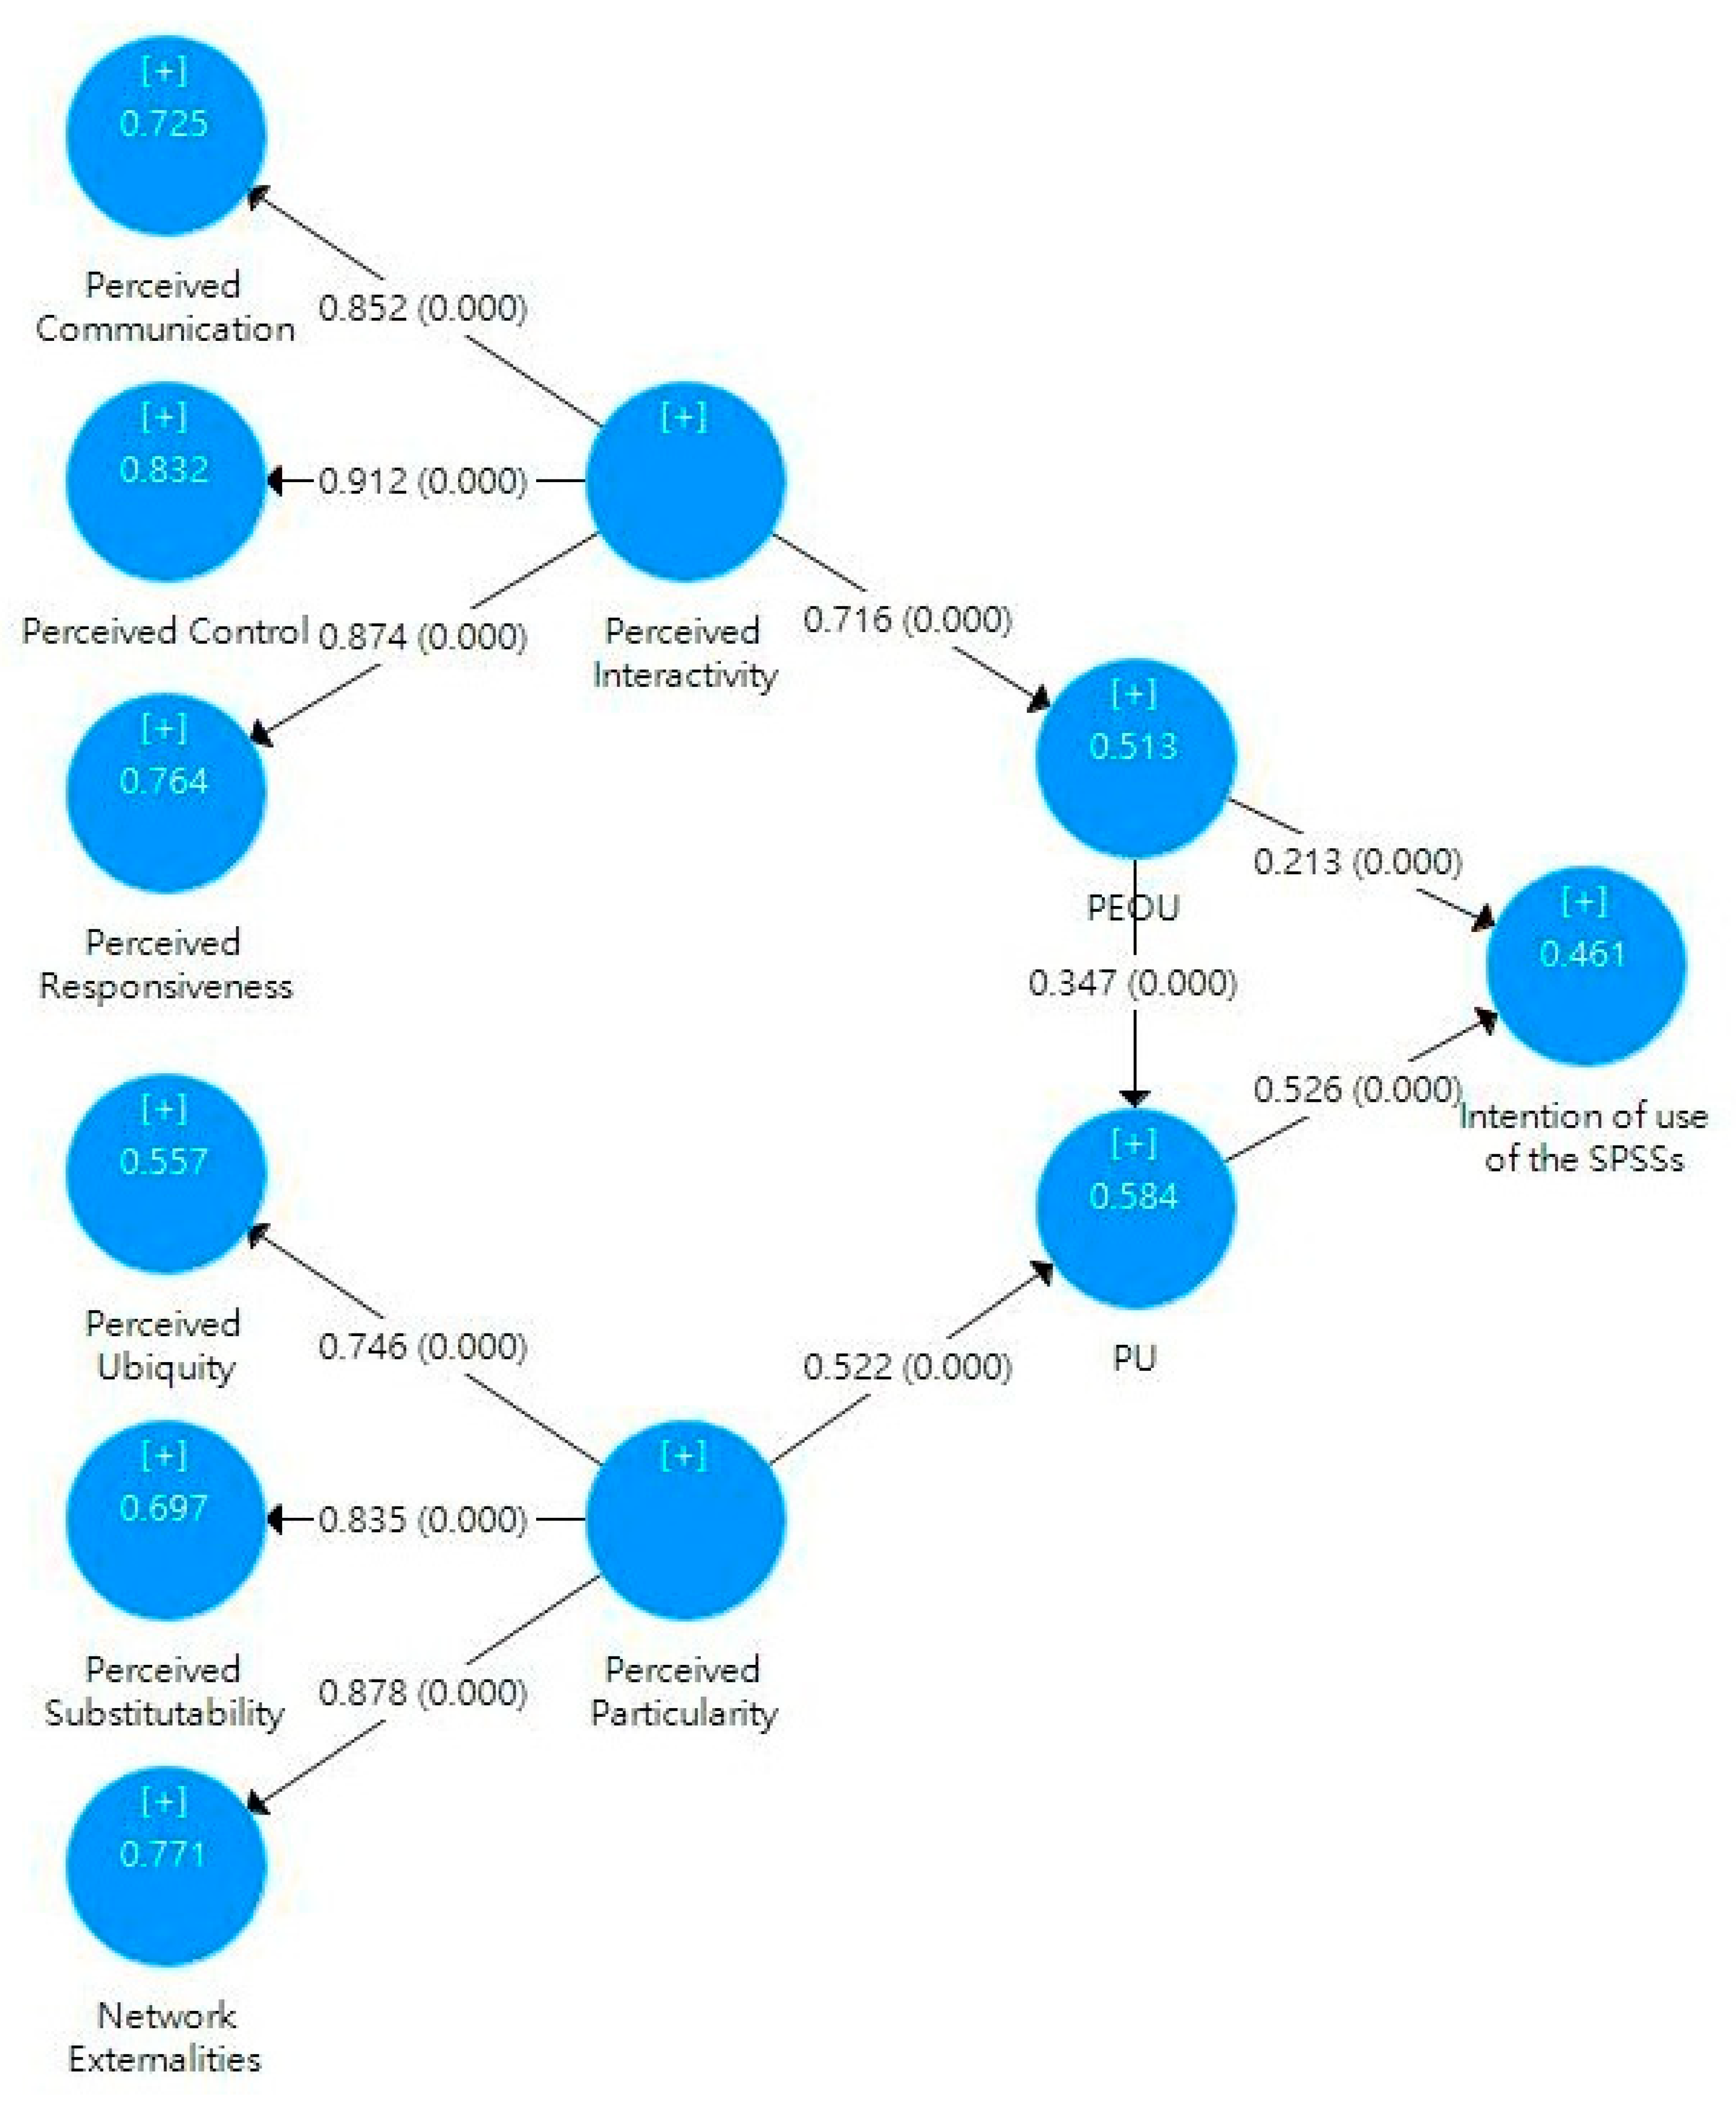
The study results indicate that the perceived interactivity of mobile apps and the particularity of smart shared products are two sets of antecedents of consumers’ intention to use the SPSSs. It has been found that control, responsiveness, and communication of mobile apps, and perceived ubiquity of smart shared products, positively and significantly affect the PEOU of SPSSs, while perceived substitutability and network externality of smart shared products positively and significantly influence the PU of SPSSs. The positive impacts of PEOU and PU on the behavioral intention to use SPSSs are also found. The results of the second-order model further show that perceived interactivity has a significant effect on the PEOU of SPSS, and perceived particularity has a significant effect on PU.

6.3. Theoretical Implications

For academic researchers, this study contributes to the following theoretical implications. First, this study is a pioneer in applying a system theory (by extending TAM) in researching a business model of sharing economy. The results of the study stress the point that once users perceive the usefulness of SPSSs, they are likely to accept and use the SPSSs. These findings are in line with previous acceptance research [16,38]. The results of this study also indicate that PEOU increases the PU of SPSSs, as presented by the findings of previous studies [16,19]. The emergence of smart technologies (e.g., sensors and GPS) for SPSSs is one of the reasons for the rapid expansion of the sharing economy (such as sharing cars and bicycles in the transportation mode). In the past, for studying PSSs, researchers seldom employed the models of technology acceptance (e.g., TRA and TAM). This indicates that few researchers treat PSSs as ‘systems’. Although the concept of SPSSs is extended from PSSs, SPSSs involve using smart technologies to facilitate the delivery of access-based services. Therefore, this study takes a system view on SPSSs and successfully applies TAM in studying the acceptance of a type of use-oriented SPSSs – the bike sharing programs in China. This study can lead a trend of using technology acceptance theories to study different business models of the sharing economy.
For studying the effects related to smart shared products, this study introduces the concept of particularity. Particularity is a term that refers to the particular characteristics of a product for which the access-based services are supported. The results of the HCM analysis confirm that perceived particularity is a source of the PU of SPSSs. Thus, SPSSs become useful for users with particular functions which support the access-based services of smart shared products. Although most of the previous studies on sharing programs indicated that perceived ubiquity [82], perceived substitutability [17], and network externality [83] had impacts on the likelihood of choosing shared products, this study is the first that groups these three factors together. The results of the study show that network externality and perceived substitutability are important determinants of PU. These results are consistent with previous studies [24,84]. Furthermore, this study confirms that perceived ubiquity positively affects the PEOU of SPSSs. This is because ubiquity-specific attributes have been treated as external factors [55] or value sources [19] for PEOU. As Lytras and Visvizi suggested, users require the advanced mobility and availability of transparent ubiquitous services that are simple to use [85]. This study contributes to a group of antecedents of the particularity of smart shared products for researchers to design their research in sharing economy. The concept of particularity introduced in this study is not only limited to the study of SPSSs in the sharing economy, but can also be applied in other research areas where a special service is available only when the related product has particular characteristics.
The results of the HCM analysis confirm that perceived interactivity is a source of PEOU of SPSSs. Therefore, SPSSs become easier for users with the increased interactivity of mobile apps. Although some researchers recently studied the interactive features of mobile apps and their effects on user behavior, most of them employed a single dimension measurement, such as Shin et al. [86]. This study validates that the three dimensions of interactivity developed by Song and Zinkhan [14] can be applied in studying SPSSs in an access-based service or sharing economy context. In Song and Zinkhan’s [19] study, they did not directly compare the effects of three elements on certain outcomes. This study finds that perceived control is the most important component affecting users’ perception in ease of use. Therefore, this study provides researchers with a reference for using these three dimensions of interactivity in their mobile commerce research.
For designing a research model, this study shows how to integrate TAM with related determinants. For example, SPSSs include two core components (the smart sharing products and mobile apps), thus perceived interactivity and perceived particularity are proposed to address these two core components, respectively. The values of CR (>0.7) and AVE (>0.5) of the second-order model analysis confirm the setting of the reflective second-order measurement scale. Therefore, there is a reflective relationship between the second-order component and the first-order components. Thus, researchers can follow this case to construct their research models referring to the core components of the systems that they intend to study.
As mentioned by Goedkoop et al. [31], sustainability is an important characteristic of use-oriented PSSs. Therefore, SPSSs should support sustainability. In this case, having the particularity of smart shared bikes and interactivity of bike sharing mobile apps, consumers can assess smart shared bikes anytime and anywhere, so consumers are willing to use them to substitute traditional transportation equipment. Therefore, bike sharing programs provide environmental sustainability in reducing air pollution emissions. People save money by using shared bikes in their daily travel and smart shared bikes providers and their supply chains can earn money from bike sharing operations. Then, bike sharing programs provide economic sustainability in obtaining monetary benefits for each stakeholder. Cycling (as a physical exercise) makes people happy, releases stress, is healthy, and improves mental well-being. Therefore, bike sharing programs provide social sustainability in improving human health status. This study shows how the particularity of smart shared products and interactivity of mobile apps enable SPSSs to provide benefits for sustainability.

6.4. Practical Implications

This study generates some potentially important insights for the SPSSs providers and smart cities strategy considerations. First, PU has a positive impact on SPSSs adoption. The high coefficient value (β = 0.526) indicates that the users are very concerned about the usefulness of using SPSSs. This study tests two antecedents of the PU of SPSSs. As recommended by Hsu and Lin [24], providers should accelerate the network effects to achieve a perception of critical mass through word-of-mouth and mass advertisements. For increasing the network size, the providers can offer a family package or group package. These types of packages can quickly enlarge the user base. Furthermore, the providers should emphasize the substitutability of the smart shared bicycles through the marketing media: The smart shared bicycles can not only replace private bicycles, but also be served as a transit tool to link up mass transportation equipment.
Second, PEOU not only has a direct effect, but also has an indirect impact, on the intention of use through PU. Therefore, the providers should also make the SPSSs easier to use, especially the mobile apps. In this study, four antecedents that can affect the PEOU of SPSSs are tested. On the mobile apps side, perceived interactivity is crucial to motivate the adoption among most users. Therefore, providers should be aware of the importance of interactivity of mobile apps. When designing the mobile apps, the designers should ensure that the design of mobile apps can support two-way communication in different communication channels. For example, mobile apps should be linked up with other social media, so as to enable users to communicate with providers through different social media. Furthermore, the providers should recruit users and obtain their experience in designing the control flow in searching services, placing orders, and making payment for the shared bicycle services. In the back-end service, the developers should investigate the mechanism running in the back-end servers in order to speed up the responsibility for solving the requests issued from the users. On the smart shared products side, the providers should not only focus on increasing the numbers of smart shared bicycles, but also manage the distributions of service points and make sure that users can find the smart shared bicycles once they need them anywhere.
Third, this study is also helpful for policy-makers to develop strategies for building smart cities. Since interaction unfolds at the intersection of the supply of information which enhances e-services for citizens [87], improving the communication, control, and responsiveness of mobile apps helps to enhance the willingness of city inhabitants to adopt and use SPSSs. The adoption and diffusion of SPSSs by citizens can make urban spaces truly smart [87,88]. Therefore, policy-making and strategy considerations for smart cities need to focus on human-centric SPSSs development and smart cities infrastructure construction.

6.5. Limitation and Future Research

The present study has several inevitable limitations and the results need to be interpreted with caution. First, data were collected in China. Therefore, the results may not be generalized for other countries. Future studies using this research model in other countries are recommended in order to further validate the research model. Second, this study only focuses on the use-oriented SPSSs. Hence, the findings of this study should not be generalized and applied to result- or product-oriented SPSSs adoption, such as launderettes or print services. Third, this study proposes a research model that consists of the interactivity of mobile apps and particularity of smart shared products as antecedents of PU and PEOU that influence the behavioral intention to use SPSSs. However, TAM has evolved into the unified theory of acceptance and use of technology (UTAUT) and UTAUT2, so more predictors of adoption are suggested, such as social influence, facilitating conditions, price, and habit. Furthermore, since this study is an exploratory study, only six elements are selected under perceived interactivity of mobile apps and particularity of smart shared products, so researchers may consider amending the structure of perceived interactivity and perceived particularity in their future research. Future research may investigate the influences of these additional variables to gain a better understanding of the adoption of SPSSs.

Author Contributions

D.L. contributed to research design, data analysis, and manuscript writing. I.K.W.L. provided efforts on data analysis and manuscript writing. Y.L. wrote the manuscript and provided quality assurance of the research. All authors read and approved the final manuscript.

Funding

This work was supported in part by the Humanity and Social Science Found Program of Ministry of Education of China under Grant 18YJA630070, the Sichuan Social Science Planning Fund Program under Grant SC17B077, the Sichuan Science and Technology Support Project under Grant 2018ZR0124, and the Chengdu Social Science Planning Fund Program under Grant 2018L07.

Conflicts of Interest

The authors declare no conflict of interest.

Appendix A

The scales of consumer acceptance of smart product-service systems in sharing economy
Item
Perceived communication (PCM) (adapted from Song and Zinkhan [14])
PCM1The mobile app of this bike sharing program accurately provided me with the location and number of bicycles in the surrounding area.
PCM2When I encountered problems in use, the mobile app of this bike sharing program provided me with a solution.
PCM3The mobile app of this bike sharing program was effective in gathering users’ feedback.
PCM4The mobile app of this bike sharing program facilitated two-way communication.
Perceived Control (PCN) (adapted from Song and Zinkhan [14])
PCU1While using mobile app of this bike sharing program, I always knew what function I am using.
PCU2When using mobile app of this bike sharing program, I clearly knew where the functional menu I need was.
PCU3When using mobile app of this bike sharing program, I could choose freely what I wanted.
PCU4I feel that I have a great deal of control over my user experience with this mobile app.
PCU5I feel that I can always control the bike through the mobile app of this bike share program.
Perceived Responsiveness (PRS) (adapted from Song and Zinkhan [14])
PRS1The mobile app of the bike sharing program processed my input very quickly.
PRS2Getting information from the mobile app was very fast.
PRS3I was able to open the mobile app of this bike sharing program without any delay.
PRS4When I clicked on the menu of the mobile app, I felt I was getting instantaneous information.
Perceived Ubiquity (PUB) (adapted from Nikou and Economides [16] and Chong et al. [19])
PUB1In my city, share bikes are available everywhere.
PUB2I can access share bikes anywhere and anytime.
Network Externality (NE) (adapted from Chong et al. [19] and Hsu and Lin [24])
NE1In my observation, bike sharing program has a large number of users.
NE2Many of my friends or families use share bike frequently.
NE3Many of my contacts use share bike frequently.
Perceived Substitutability (PS) (adapted from Lamberton and Rose [17])
PS1I believe a share bike substitutes quite well for a personally owned bicycle.
PS2Sharing a bike just as good as owning one.
PS3I believe a share bike is a closer substitute for my own bicycle.
PS4There is no substitute for owing my own bicycle. (reversed)
Perceived of Usefulness (PU) (adapted from Venkatesh and Davis [34])
PU1I find bike sharing program useful in my daily life.
PU2Using share bike increases my travel convenience.
PU3Using share bike increases my productivity.
Perceived Ease of Use (PEOU) (adapted from Venkatesh and Davis [34])
PEOU1Learning how to use bike sharing program is easy for me.
PEOU2My interaction with bike sharing program is clear and understandable.
PEOU3I find bike sharing program easy to use.
PEOU4It is easy for me to become skillful at using bike sharing program.
Usage Intention (UI) (adapted from Venkatesh and Davis [34])
UI1I intend to continue to using bike sharing program in the future.
UI2I will always try to use the bike sharing program in my daily life.
UI3I plan to continue to use bike sharing program frequently.

References

  1. Bardhi, F.; Eckhardt, G.M. Access-Based Consumption: The Case of Car Sharing. J. Consum. Res. 2012, 39, 881–898. [Google Scholar] [CrossRef]
  2. Schaefers, T.; Moser, R.; Narayanamurthy, G. Access-Based Services for the Base of the Pyramid. J. Serv. Res. 2018, 21, 421–437. [Google Scholar] [CrossRef]
  3. Schallehn, H.; Seuring, S.; Strähle, J.; Freise, M. Customer Experience Creation for after-Use Products: A Product–Service Systems-Based Review. J. Cleaner Prod. 2018. [Google Scholar] [CrossRef]
  4. Schaefers, T.; Wittkowski, K.; Benoit, S.; Ferraro, R. Contagious Effects of Customer Misbehavior in Access-Based Services. J. Serv. Res. 2016, 19, 3–21. [Google Scholar] [CrossRef]
  5. Poppelaars, F.; Bakker, C.; van Engelen, J. Does Access Trump Ownership? Exploring Consumer Acceptance of Access-Based Consumption in the Case of Smartphones. Sustainability 2018, 10, 2133. [Google Scholar] [CrossRef]
  6. Piscicelli, L.; Cooper, T.; Fisher, T. The Role of Values in Collaborative Consumption: Insights from a Product-Service System for Lending and Borrowing in the UK. J. Cleaner Prod. 2015, 97, 21–29. [Google Scholar] [CrossRef]
  7. Valencia, A.; Mugge, R.; Schoormans, J.P.L.; Schifferstein, H.N.J. The Design of Smart Product-Service Systems (Psss): An Exploration of Design Characteristics. Int. J. Des. 2015, 9, 13–28. [Google Scholar]
  8. Vezzoli, C.; Ceschin, F.; Diehl, J.C.; Kohtala, C. Why Have ‘Sustainable Product-Service Systems’ Not Been Widely Implemented?: Meeting New Design Challenges to Achieve Societal Sustainability. J. Cleaner Prod. 2012, 35, 288–290. [Google Scholar] [CrossRef]
  9. Catulli, M. What Uncertainty?: Further Insight into Why Consumers Might Be Distrustful of Product Service Systems. J. Manuf. Tech. Manag. 2012, 23, 780–793. [Google Scholar] [CrossRef]
  10. Mont, O. Institutionalisation of Sustainable Consumption Patterns Based on Shared Use. Ecol. Econ. 2004, 50, 135–153. [Google Scholar] [CrossRef]
  11. Rexfelt, O.; Ornas, V.H.a. Consumer Acceptance of Prodouct-Service Systems: Designing for Relative Advantages and Uncertainty Reductions. J. Manuf. Tech. Manag. 2009, 20, 674–699. [Google Scholar] [CrossRef]
  12. Davis, F.D. Perceived Usefulness, Perceived Ease of Use, and User Acceptance of Information Technology. MIS Q. 1989, 13, 319–340. [Google Scholar] [CrossRef]
  13. Taherdoost, H. Development of an Adoption Model to Assess User Acceptance of E-Service Technology: E-Service Technology Acceptance Model. Behav. Inform. Tech. 2018, 37, 173–197. [Google Scholar] [CrossRef]
  14. Song, J.H.; Zinkhan, G.M. Determinants of Perceived Web Site Interactivity. J. Market. 2008, 72, 99–113. [Google Scholar] [CrossRef]
  15. Zhao, L.; Lu, Y. Enhancing Perceived Interactivity through Network Externalities: An Empirical Study on Micro-Blogging Service Satisfaction and Continuance Intention. Decis. Support. Syst. 2012, 53, 825–834. [Google Scholar] [CrossRef]
  16. Nikou, S.A.; Economides, A.A. Mobile-Based Assessment: Integrating Acceptance and Motivational Factors into a Combined Model of Self-Determination Theory and Technology Acceptance. Comput. Hum. Behav. 2017, 68, 83–95. [Google Scholar] [CrossRef]
  17. Lamberton, C.P.; Rose, R.L. When Is Ours Better Than Mine? A Framework for Understanding and Altering Participation in Commercial Sharing Systems. J Market. 2012, 76, 109–125. [Google Scholar] [CrossRef]
  18. Hennig-Thurau, T.; Henning, V.; Sattler, H. Consumer File Sharing of Motion Pictures. J Market. 2007, 71, 1–18. [Google Scholar] [CrossRef]
  19. Chong, X.; Zhang, J.; Lai, K.-K.; Nie, L. An Empirical Analysis of Mobile Internet Acceptance from Value-Based View. Int. J. Mobile Comm. 2012, 10, 536–557. [Google Scholar] [CrossRef]
  20. Lee, J.; Nah, J.; Park, Y.; Sugumaran, V. Electric Car Sharing Service Using Mobile Technology. In Proceedings of the International Conference on Information Resources Management; Association for Information Systems: Seoul, Korea, 2011; pp. 12–14. [Google Scholar]
  21. Kim, K.J.; Shin, D.-H. An Acceptance Model for Smart Watches: Implications for the Adoption of Future Wearable Technology. Internet Res. 2015, 25, 527–541. [Google Scholar] [CrossRef]
  22. Mani, Z.; Chouk, I. Drivers of Consumers’ Resistance to Smart Products. J. Market. Manag. 2017, 33, 76–97. [Google Scholar] [CrossRef]
  23. Fong, L.H.N.; Lam, L.W.; Law, R. How Locus of Control Shapes Intention to Reuse Mobile Apps for Making Hotel Reservations: Evidence from Chinese Consumers. Tourism Manag. 2017, 61, 331–342. [Google Scholar] [CrossRef]
  24. Hsu, C.-L.; Lin, J.C.-C. An Empirical Examination of Consumer Adoption of Internet of Things Services: Network Externalities and Concern for Information Privacy Perspectives. Comput. Hum. Behav. 2016, 62, 516–527. [Google Scholar] [CrossRef]
  25. Tukker, A.; Tischner, U. Product-Services as a Research Field: Past, Present and Future. Reflections from a Decade of Research. J. Cleaner Prod. 2006, 14, 1552–1556. [Google Scholar] [CrossRef]
  26. Tukker, A. Product Services for a Resource-Efficient and Circular Economy—A Review. J. Cleaner Prod. 2015, 97, 76–91. [Google Scholar] [CrossRef]
  27. Baines, T.S.; Lightfoot, H.W.; Evans, S.; Neely, A.; Greenough, R.; Peppard, J.; Roy, R.; Shehab, E.; Braganza, A.; Tiwari, A. State-of-the-Art in Product-Service Systems. Proc. IME. B. J. Eng. Manufact. 2007, 221, 1543–1552. [Google Scholar] [CrossRef]
  28. Tukker, A. Eight Types of Product–Service System: Eight Ways to Sustainability? Experiences from Suspronet. Bus. Strat. Environ. 2004, 13, 246–260. [Google Scholar] [CrossRef]
  29. Gao, J.; Yao, Y.; Zhu, V.C.; Sun, L.; Lin, L. Service-Oriented Manufacturing: A New Product Pattern and Manufacturing Paradigm. J. Intell. Manuf. 2011, 22, 435–446. [Google Scholar] [CrossRef]
  30. Fargnoli, M.; Haber, N.; Sakao, T. Pss Modularisation: A Customer-Driven Integrated Approach. Int. J. Prod. Res. 2018, in press. [Google Scholar] [CrossRef]
  31. Goedkoop, M.J.; Halen, C.J.G.v.; Riele, H.R.M.t.; Rommens, P.J.M. Product Service Systems, Ecological and Economic Basics, Report for the Dutch Ministries of Environment and Economic Affairs; PRé Consultants: Amersfoort, The Netherlands, 1999. [Google Scholar]
  32. Lee, S.; Geum, Y.; Lee, H.; Park, Y. Dynamic and Multidimensional Measurement of Product-Service System (Pss) Sustainability: A Triple Bottom Line (Tbl)-Based System Dynamics Approach. J. Cleaner Prod. 2012, 32, 173–182. [Google Scholar] [CrossRef]
  33. Venkatesh, V.; Morris, M.G.; Davis, G.B.; Davis, F.D. User Acceptance of Information Technology: Toward a Unified View. MIS Q. 2003, 27, 425–478. [Google Scholar] [CrossRef]
  34. Venkatesh, V.; Davis, F.D. A Theoretical Extension of the Technology Acceptance Model: Four Longitudinal Field Studies. Manag. Sci. 2000, 46, 186–204. [Google Scholar] [CrossRef]
  35. Fishbein, M.; Ajzen, I. Belief, Attitude, Intention and Behavior: An Introduction to Theory and Research; Addison-Wesley: Reading, MA, USA, 1975. [Google Scholar]
  36. Davis, F.D.; Bagozzi, R.P.; Warshaw, P.R. User Acceptance of Computer Technology: A Comparison of Two Theoretical Models. Manag. Sci. 1989, 35, 982–1003. [Google Scholar] [CrossRef]
  37. Lu, J.; Yu, C.-S.; Liu, C.; Yao, J.E. Technology Acceptance Model for Wireless Internet. Internet Res. 2003, 13, 206–222. [Google Scholar] [CrossRef]
  38. Hubert, M.; Blut, M.; Brock, C.; Backhaus, C.; Eberhardt, T. Acceptance of Smartphone-Based Mobile Shopping: Mobile Benefits, Customer Characteristics, Perceived Risks, and the Impact of Application Context. Psychol. Market. 2017, 34, 175–194. [Google Scholar] [CrossRef] [Green Version]
  39. Zhai, X.; Dong, Y.; Yuan, J. Investigating Learners’ Technology Engagement-a Perspective from Ubiquitous Game-Based Learning in Smart Campus. IEEE Access 2018, 6, 10279–10287. [Google Scholar] [CrossRef]
  40. Lai, I.K.W. Traveler Acceptance of an App-Based Mobile Tour Guide. J. Hospit. Tourism Res. 2015, 39, 401–432. [Google Scholar] [CrossRef]
  41. Maïano, C.; Therme, P.; Mestre, D. Affective, Anxiety and Behavioral Effects of an Aversive Stimulation During a Simulated Navigation Task within a Virtual Environment: A Pilot Study. Comput. Hum. Behav. 2011, 27, 169–175. [Google Scholar] [CrossRef]
  42. Zaman, M.; Anandarajan, M.; Dai, Q. Experiencing Flow with Instant Messaging and Its Facilitating Role on Creative Behaviors. Comput. Hum. Behav. 2010, 26, 1009–1018. [Google Scholar] [CrossRef]
  43. Kanwal, F.; Rehman, M. Factors Affecting E-Learning Adoption in Developing Countries–Empirical Evidence from Pakistan’s Higher Education Sector. IEEE Access 2017, 5, 10968–10978. [Google Scholar] [CrossRef]
  44. Liébana-Cabanillas, F.; Marinković, V.; Kalinić, Z. A Sem-Neural Network Approach for Predicting Antecedents of M-Commerce Acceptance. Int. J. Inform. Manag. 2017, 37, 14–24. [Google Scholar] [CrossRef]
  45. Choi, S. What Promotes Smartphone-Based Mobile Commerce? Mobile-Specific and Self-Service Characteristics. Internet Res. 2018, 28, 105–122. [Google Scholar] [CrossRef]
  46. Venkatesh, V. Determinants of Perceived Ease of Use: Integrating Control, Intrinsic Motivation, and Emotion into the Technology Acceptance Model. Inform. Syst. Res. 2000, 11, 342–365. [Google Scholar] [CrossRef]
  47. Newhagen, J.E.; Cordes, J.W.; Levy, M.R. [email protected]: Audience Scope and the Perception of Interactivity in Viewer Mail on the Internet. J. Comm. 1995, 45, 164–175. [Google Scholar] [CrossRef]
  48. Liu, Y. Developing a Scale to Measure the Interactivity of Websites. J. Advert. Res. 2003, 43, 207–216. [Google Scholar] [CrossRef]
  49. McMillan, S.J.; Hwang, J.-S. Measures of Perceived Interactivity: An Exploration of the Role of Direction of Communication, User Control, and Time in Shaping Perceptions of Interactivity. J. Advert. 2002, 31, 29–42. [Google Scholar] [CrossRef]
  50. Wu, G. Perceived Interactivity and Attitude toward Web Sites. In Proceedings of the Conference-American Academy of Advertising; Roberts, M.S., Ed.; American Academy of Advertising, University of Florida: Gainseville, FL, USA, 1999; pp. 254–262. [Google Scholar]
  51. Steuer, J. Defining Virtual Reality: Dimensions Determining Telepresence. J. Comm. 1992, 42, 73–93. [Google Scholar] [CrossRef] [Green Version]
  52. Rafaeli, S. Interactivity: From New Media to Communication. In Advancing Communication Science: Merging Mass and Interpersonal Processes; Hawkins, R.P., Wiemann, J.M., Pingree, S., Eds.; Sage Publications: Newbury Park, CA, USA, 1988; pp. 110–134. [Google Scholar]
  53. Sicilia, M.; Ruiz, S.; Munuera, J.L. Effects of Interactivity in a Web Site. J. Advert. 2005, 34, 31–45. [Google Scholar] [CrossRef]
  54. McMillan, S.J. A Four-Part Model of Cyber-Interactivity: Some Cyber-Places Are More Interactive Than Others. New Media Soc. 2002, 4, 271–291. [Google Scholar] [CrossRef]
  55. Serenko, A.; Bontis, N. A Model of User Adoption of Mobile Portals. Q. J. Electron. Commerce 2004, 4, 69–98. [Google Scholar]
  56. Watson, R.T.; Pitt, L.F.; Berthon, P.; Zinkhan, G.M. U-Commerce: Expanding the Universe of Marketing. J. Acad. Market. Sci. 2002, 30, 333–347. [Google Scholar] [CrossRef]
  57. Katz, M.L.; Shapiro, C. Network Externalities, Competition, and Compatibility. Am. Econ. Rev. 1985, 75, 424–440. [Google Scholar]
  58. Cheng, Y.-M. Roles of Interactivity and Usage Experience in E-Learning Acceptance: A Longitudinal Study. Int. J. Web Inform. Syst. 2014, 10, 2–23. [Google Scholar] [CrossRef]
  59. Pianesi, F.; Graziola, I.; Zancanaro, M.; Goren-Bar, D. The Motivational and Control Structure Underlying the Acceptance of Adaptive Museum Guides–an Empirical Study. Interact. Comput. 2009, 21, 186–200. [Google Scholar] [CrossRef]
  60. Cyr, D.; Head, M.; Ivanov, A. Perceived Interactivity Leading to E-Loyalty: Development of a Model for Cognitive–Affective User Responses. Int. J. Hum. Comput. Stud. 2009, 67, 850–869. [Google Scholar] [CrossRef]
  61. Pituch, K.A.; Lee, Y.-K. The Influence of System Characteristics on E-Learning Use. Comput. Educ. 2006, 47, 222–244. [Google Scholar] [CrossRef]
  62. Lee, D.; Moon, J.; Kim, Y.J.; Mun, Y.Y. Antecedents and Consequences of Mobile Phone Usability: Linking Simplicity and Interactivity to Satisfaction, Trust, and Brand Loyalty. Inform. Manag. 2015, 52, 295–304. [Google Scholar] [CrossRef]
  63. Lin, C.-P.; Bhattacherjee, A. Elucidating Individual Intention to Use Interactive Information Technologies: The Role of Network Externalities. Int. J. Electron. Commerce 2008, 13, 85–108. [Google Scholar] [CrossRef]
  64. Cha, J.; Chan-Olmsted, S.M. Substitutability between Online Video Platforms and Television. Journalism Mass Comm. Q. 2012, 89, 261–278. [Google Scholar] [CrossRef]
  65. Cha, J. Usage of Video Sharing Websites: Drivers and Barriers. Telematics Informat. 2014, 31, 16–26. [Google Scholar] [CrossRef]
  66. Ernst, C.P.H.; Stock, B.; dos Santos Ferreira, T. The Usage of Augmented Reality Smartglasses: The Role of Perceived Substitutability. In Twenty-second Americas Conference on Information Systems; Association for Information Systems: San Diego, CA, USA, 2016. [Google Scholar]
  67. Fishman, E.; Washington, S.; Haworth, N.L. Bike Share: A Synthesis of the Literature. Transport Rev. 2013, 33, 148–165. [Google Scholar] [CrossRef] [Green Version]
  68. CSIC Shared Bicycle Industry Employment Research Report; China State Information Center: Beijin, China, 2017.
  69. Kleijnen, M.; Ruyter, K.d.; Wetzels, M. An Assessment of Value Creation in Mobile Service Delivery and the Moderating Role of Time Consciousness. J. Retailing 2007, 83, 33–46. [Google Scholar] [CrossRef]
  70. Venkatesh, V.; Thong, J.Y.; Xu, X. Consumer Acceptance and Use of Information Technology: Extending the Unified Theory of Acceptance and Use of Technology. MIS Q. 2012, 36, 157–178. [Google Scholar] [CrossRef]
  71. Ringle, C.M.; Wende, S.; Becker, J.-M. Smartpls 3; SmartPLS GmbH: Boenningstedt, Germany, 2015. [Google Scholar]
  72. Goodhue, D.; Lewis, W.; Thompson, R. Pls, Small Sample Size, and Statistical Power in Mis Research. In Proceedings of the 39th Annual Hawaii International Conference on System Sciences (HICSS’06), Kauia, HI, USA, 4–7 January 2006; IEEE: Kauia, HI, USA, 2006. [Google Scholar]
  73. Hair, J.F., Jr.; Hult, G.T.M.; Ringle, C.; Sarstedt, M. A Primer on Partial Least Squares Structural Equation Modeling (Pls-Sem); Sage Publications: Thousand Oaks, CA, USA, 2017. [Google Scholar]
  74. Reinartz, W.; Haenlein, M.; Henseler, J. An Empirical Comparison of the Efficacy of Covariance-Based and Variance-Based Sem. Int. J. Res. Market. 2009, 26, 332–344. [Google Scholar] [CrossRef]
  75. Lohmöller, J.-B. Latent Variable Path Modeling with Partial Least Squares; Physica: Heidelberg, Germany, 1989. [Google Scholar]
  76. Nunnally, J.C. Psychometric Theory, 2nd ed.; McGraw-Hill: New York, NY, USA, 1978. [Google Scholar]
  77. Fornell, C.; Larcker, D.F. Structural Equation Models with Unobservable Variables and Measurement Error: Algebra and Statistics. J. Market. Res. 1981, 18, 382–388. [Google Scholar] [CrossRef]
  78. Podsakoff, P.M.; Organ, D.W. Self-Reports in Organizational Research: Problems and Prospects. J. Manag. 1986, 12, 531–544. [Google Scholar] [CrossRef]
  79. Kock, N. Common Method Bias in Pls-Sem: A Full Collinearity Assessment Approach. Int. J. e-Collaboration 2015, 11, 1–10. [Google Scholar] [CrossRef]
  80. Kock, N.; Lynn, G. Lateral Collinearity and Misleading Results in Variance-Based Sem: An Illustration and Recommendations. J. Assoc. Inform. Syst. 2012, 13, 546–580. [Google Scholar] [CrossRef]
  81. Wang, C.C.; Lo, S.K.; Fang, W. Extenextending the Technology Acceptance Model to Mobile Telecommunication Innovation: The Existence of Network Externalities. J. Consum. Behav. 2008, 7, 101–110. [Google Scholar] [CrossRef]
  82. Kathan, W.; Matzler, K.; Veider, V. The Sharing Economy: Your Business Model’s Friend or Foe? Bus. Horiz. 2016, 59, 663–672. [Google Scholar] [CrossRef]
  83. Kang, J.W.; Namkung, Y. Restaurant Information Sharing on Social Networking Sites: Do Network Externalities Matter? J. Hospit. Tourism Res. 2016, 40, 739–763. [Google Scholar] [CrossRef]
  84. Chiu, C.M.; Cheng, H.L.; Huang, H.Y.; Chen, C.F. Exploring Individuals’ Subjective Well-Being and Loyalty Towards Social Network Sites from the Perspective of Network Externalities: The Facebook Case. Int. J. Inform. Manag. 2013, 33, 539–552. [Google Scholar] [CrossRef]
  85. Lytras, M.; Visvizi, A. Who Uses Smart City Services and What to Make of It: Toward Interdisciplinary Smart Cities Research. Sustainability 2018, 10, 1998. [Google Scholar] [CrossRef]
  86. Shin, D.; Choi, M.; Hyun Kim, J.; Lee, J.-g. Interaction, Engagement, and Perceived Interactivity in Single-Handed Interaction. Internet Res. 2016, 26, 1134–1157. [Google Scholar] [CrossRef]
  87. Visvizi, A.; Lytras, M.D. Rescaling and Refocusing Smart Cities Research: From Mega Cities to Smart Villages. J. Sci. Tech. Pol. Manag. 2018, 9, 134–145. [Google Scholar] [CrossRef]
  88. Visvizi, A.; Lytras, M.D.; Damiani, E.; Mathkour, H. Policy Making for Smart Cities: Innovation and Social Inclusive Economic Growth for Sustainability. J. Sci. Tech. Pol. Manag. 2018, 9, 126–133. [Google Scholar] [CrossRef]
Figure 1. The research model.
Sustainability 11 00928 g001
Figure 2. Structural model (Note: *** indicate significant at p < 0.01).
Sustainability 11 00928 g002
Figure 3. Results of the second-order model analysis.
Sustainability 11 00928 g003
Table 1. Descriptions with regard to gender, income, and bike sharing programs usage (sample size = 520).
MeasureRangeFrequencyPercentage
GenderMale26651.2%
Female25448.1%
Age18 to 3035768.7%
31 to 4012023.1%
41 to 50417.9%
Above 5120.3%
Education (completed)High School and below397.5%
Junior College and Undergraduate44485.4%
Postgraduate377.1%
Income (monthly)0 to 2500 (0 to 400 USD)21541.3%
2501 to 4500 (401 to 720 USD)12223.5%
4501 to 6500 (721 to 1040 USD)11722.5%
6501+ (over 1040 USD)6612.7%
Type of brandMobike (https://mobike.com/cn/)37972.9%
OFO (http://www.ofo.so/#/)40678.1%
DiDi (http://www.xiaojukeji.com/)8716.7%
Youon (http://www.ibike668.com/)7414.2%
Others12123%
Usage frequencyOnce every two months or less458.7%
Once a month254.8%
2-3 times per month275.2%
Once a week15229.2%
2-3 times per week15429.6%
Once a day10019.2%
2 times per day or more173.3%
Table 2. Convergent validity for the measurement model.
Construct ItemMeanS.D.Factor LoadingCronbach’s αCRAVE
PCM4.8141.036 0.8820.8800.649
PCM14.9351.2480.843
PCM24.6601.1820.715
PCM34.6811.1640.799
PCM44.9831.1920.857
PCN4.9740.984 0.9070.9070.661
PCN14.9941.1430.832
PCN24.9961.1250.826
PCN35.0131.0710.833
PCN44.9291.1950.781
PCN54.9351.1160.791
PRS4.7231.043 0.9000.9000.693
PRS14.8151.1570.861
PRS24.7671.1810.829
PRS34.5771.2210.754
PRS44.7331.1930.880
PUB5.2521.239 0.8580.8590.753
PUB15.4041.3820.891
PUB25.1001.2620.844
NE5.1891.096 0.8900.8900.730
NE15.3671.2100.837
NE25.0561.2240.837
NE35.1351.1950.888
PS4.7551.114 0.8850.8860.662
PS14.9081.2810.871
PS24.7521.3190.866
PS34.8061.3170.772
PS44.5561.2380.738
PU5.2051.029 0.8710.8710.692
PU15.1981.1760.840
PU25.2351.1400.857
PU35.1811.1480.798
PEOU5.3461.092 0.9100.9100.716
PEOU15.4131.2190.853
PEOU25.3121.2290.899
PEOU35.2691.2610.779
PEOU45.3901.2120.851
UI5.0271.139 0.8670.8660.683
UI15.2131.1710.899
UI24.9371.3470.774
UI34.9311.3180.802
Remark: PCM – Perceived Communication, PCN – Perceived Control, PEOU – Perceived Ease of Use, NE – Network Externality, UI – Usage Intention, PRS – Perceived Responsiveness, PS – Perceived Substitutability, PUB – Perceived Ubiquity, PU – Perceived Usefulness, S.D. - Standard Deviation, CR - Composite Reliability, AVE - Average Variance Extracted.
Table 3. Validity of the measurement model (values in Italic: the square root of the average variance extracted for each construct).
PCMPCNPEOUNEUIPRSPSPUBPU
PCM0.806
PCN0.740 0.831
PEOU0.658 0.736 0.846
NE0.519 0.557 0.527 0.854
UI0.405 0.564 0.606 0.549 0.826
PRS0.698 0.772 0.682 0.432 0.494 0.832
PS0.447 0.478 0.461 0.606 0.635 0.408 0.814
PUB0.473 0.438 0.485 0.715 0.383 0.383 0.457 0.868
PU0.500 0.611 0.699 0.742 0.755 0.523 0.683 0.520 0.832
Remark: PCM – Perceived Communication, PCN – Perceived Control, PEOU – Perceived Ease of Use, NE – Network Externality, UI – Usage Intention, PRS – Perceived Responsiveness, PS – Perceived Substitutability, PUB – Perceived Ubiquity, PU – Perceived Usefulness, Italic font = square-root of the AVE
Table 4. Direct, indirect, and total effects.
Dependent VariablesR-squaredIndependent VariablesDirect EffectIndirect EffectTotal Effect
PEOU0.537PCM0.147 0.147
PCN0.368 0.368
PRS0.220 0.220
PUB0.150 0.150
PU0.604PS0.273 0.273
NE0.341 0.341
PEOU0.348 0.348
PU 0.0520.052
PCM 0.0510.051
PCN 0.1280.128
PRS 0.0770.077
UI0.461PEOU0.2130.1830.395
PU0.526 0.526
PCM 0.0580.058
PCN 0.1460.146
PRS 0.0870.087
PUB 0.0590.059
PS 0.1440.144
NE 0.1790.179
Remark: PCM – Perceived Communication, PCN – Perceived Control, PEOU – Perceived Ease of Use, NE – Network Externality, UI – Usage Intention, PRS – Perceived Responsiveness, PS – Perceived Substitutability, PUB – Perceived Ubiquity, PU – Perceived Usefulness.
Table 5. Reliability and validity tests for the second-order model (values in Italic: the square root of the average variance extracted for each construct).
Cronbach’s αCRAVEPIPPPEOUPUUI
PI0.9390.9470.5790.761
PP0.8970.9160.5500.5660.741
PEOU0.9100.9370.7870.7160.5300.887
PU0.8710.9210.7940.5530.7050.6230.891
UI0.8670.9180.7900.4990.5770.5400.6580.889
Remark: PI – Perceived Interactivity, PP – Perceived Particularity, PEOU – Perceived Ease of Use, PU – Perceived Usefulness, UI – Usage Intention.

