Prioritization of Strategic Intangible Assets in Make/Buy Decisions


1
Department of Business Engineering, University of Rome “Tor Vergata”, 00133 Rome, Italy
2
Department of Industrial Engineering, University of Naples “Federico II”, 80125 Naples, Italy
3
Department of Civil and Mechanical Engineering, University of Cassino and Southern Lazio, 03043 Cassino, Italy
*
Author to whom correspondence should be addressed.
Sustainability 2019, 11(5), 1267; https://0-doi-org.brum.beds.ac.uk/10.3390/su11051267
Submission received: 8 January 2019
/
Revised: 19 February 2019
/
Accepted: 21 February 2019
/
Published: 27 February 2019
(This article belongs to the Special Issue Knowledge and Intellectual Capital Management for Sustainability)
Abstract
:Every company, in a knowledge-based economy and, in a sustainability-aware era, is “doomed” to deal with a critical mass of strategic assets, in order to achieve a sustainable competitive advantage. Maintaining this system up-to-date requires financial/organizational efforts. Therefore, in order to optimize performance, it is necessary to detect which are the assets that can be outsourced/externalized without jeopardizing the business model architecture. Nevertheless, several studies confirm the inherent risks upcoming with any decision of outsourcing; pursuing a bearable long-term advantage over competitors mostly involves combinations of resources and capabilities, i.e., intangible assets. By the means of a multi-criteria indicator, the proposed framework builds a quantitative relational ranking of such resources, disclosing their critical weight (revealing which assets are actually strategic), hence the convenience for each of them to be outsourced or kept “in-house” to create sustainable value. This solution permits a strategy-level prioritization to take informed decisions on outsourcing candidates, also returning further analytics on the status of each investigated entity. Designed as a discriminating tool in make/buy resolutions to be used alongside traditional cost-based criteria, it represents a comprehensive approach capable of appreciating the complexity of the problem and the involved risks in order to keep a sustainable momentum.
1. Introduction
When we have to cope with a “make/buy dilemma”, the general line of rational reasoning we are all familiar with is to deal with it by the means of a “cost-delta” approach. Meaning that, for evaluating the convenience of a candidate outsourcing initiative, the difference between ceasing costs from the dismissing activity/asset and the emerging costs deriving from its externalization should be calculated. This solution is used because it just works, undoubtedly, from a mere accounting perspective, at least. Unfortunately, it is not the only parameter that should be considered: what if the “in-house” possession of that cost-cut outsourced activity/asset today, were a prerequisite for catching a new business opportunity tomorrow? “Cost-cutting in absence of strategic planning leads to poor strategic decisions” [1]. That results in an undisclosed trade-off sometimes: cost-efficiency vs. strategic efficacy.
On the other hand, cost-based reasoning has the great advantage that it can be quantified analytically, and cost-accounting is absolutely solid about that. So, why not try to do the same in other aspects, which are traditionally considered only from a qualitative perspective? Why not gauge and rank them also quantitatively?
We could look beyond a cost-based analysis: a comprehensive approach which is more capable of appreciating the complexity of the problem and the risks that are involved. Several studies confirm the inherent risks that come with a decision of outsourcing, risks that can actually jeopardize the effectiveness of the whole project. This issue has been well known in literature for decades: a study by Gateway Information Services with over 250 responding participants disclosed that none of the signed outsourcing contracts arrived at their natural end without some in itinere modification [2]. In 1994 the PA Consulting Group conducted a survey which reported that 26% of participants decided to re-insource back their externalized activities. Beyond the possible disadvantages that can be disclosed from an ordinary accounting balance of the costs ceasing/emerging from the externalization, several surveys show that the failure of an outsourcing initiative can be mainly correlated to information asymmetry between the outsourcer company and the outsourcee and to the detachment of the buy/make decision itself with any strategic alignment [3].
Even starting from two basic definitions of sustainability, according to which, “meeting the needs of the present without compromising the ability of future generations to meet their own needs” [4] and “firms have to maintain and grow their economic, social and environmental capital base while actively contributing to sustainability in the political domain” [5], the absolute importance of some key-factors is clear. One of these crucial points being a resource allocation policy that is not short-sighted, in order not to jeopardize any future potential (i.e.,: success).
Furthermore, looking at the resource/capability binomial, Porter’s simplified model is quite revealing. Resources are firm-specific assets actually useful for creating an advantage in terms of lower costs or superior benefits to the consumer (differentiation) that few competitors are in a position to easily acquire [6]. Intangible assets play a key role in this game. Some examples of such resources being patents and trademarks, proprietary know-how, installed customer base, reputation of the firm, brand equity, etc. Capabilities refer to the firm’s ability to utilize its resources effectively. When this combination is successfully utilized by the company, it results in value creation. To achieve a competitive advantage, the firm must perform one or more value-creating activities in a way that creates more overall value than its competitors.
While there are several possible strategic options that provide routes to gain a competitive advantage (e.g., process-embedded quality, process/product innovation breakthrough, innovative business design, etc.), maintaining a highly effective sustainable one is often difficult to achieve since it should be both substantial and difficult to imitate or replicate by competitors, but, always, grounded on an evolving resources/capabilities combination of some kind. The crucial point is the attitude of maintaining such a position of advantage over time, which is impossible to achieve (for the above Porter’s standpoint) without a sound resource prioritization strategy.
Allocation of strategic resources is a critical issue in strategic planning. And, among them, intangible assets (IAs) play a key-role in creating and keeping any sustainable competitive advantage [7,8,9]. Such resources and value are entities that are mutually entwined: IAs embody the core competence of the company and directly influence the value creation process in the firm [10,11,12,13,14]. Therefore, whatever type of assessment is conducted on the mass of the strategic capital, it should be primarily based on those components which drive organizations to a higher degree of competition by improving the value creation process. The potential competitive advantage deriving from IAs is normally in a winning position for their owner as they are entirely characterized by knowledge-based features, such as causal ambiguity, path dependency, and social complexity. From this viewpoint, knowledge is seen as the common factor gathering all the IAs [15]. It is due to the intrinsic value of the knowledge substratum they embody that those intangible resources can play a starring role for gaining competitive advantage. Knowledge behind IAs works as a driver for the created value and, at the same time, as an enabler for its transportation along the value chain [16,17].
This is why it is so important to prioritize the IAs: their strategic relevance is so outstanding that, in case of a buy/make decision upon them, it is simply not possible to consciously limit any decision maker’s vision and use only a cost-based criterion to determine whether to outsource them or not [18]. And, compared to other strategic resources, IAs have some specific characteristics—connected to their own nature—that should mandatorily be considered when an analysis is conducted. Three crucial aspects should be factored. First, the strategic perspective, due to the key strategic role they play in the first place. Plus, both a static and a dynamic dimension. This is because the IAs are knowledge-based, therefore they inherit the “double nature” of knowledge (stock/flow) [19,20].
The goal of the present research is, in the first place, to detect priorities among a given set of IAs, according to complementary criteria. This is made in order to eventually rank them and return intelligence about the convenience of being outsourced or being kept “in-house”. Therefore, this paper is not designed for a detection of the assets to be analyzed and ranked: it starts from the assumption that the company has already identified the target assets they want to focus on and to be investigated by the means of this framework.
The proposed procedure was designed for being a discriminating tool within a decision support system in make/buy resolutions over strategic resources—IAs in particular—to be used alongside the traditional accounting criteria based on costs. Indeed, given any set of whatsoever detected IAs, it returns a quantitative ranking whose purpose is to aid in insourcing/outsourcing strategic decisions. This methodology is built around a stock/flows logic and factors the three dimensions of analysis above foreshadowed, whose simultaneous screening allows a broader vision of the complexity of the problem. It makes these three parameters converge in a Scorecard, eventually returning a Ranking Indicator and a graphical Matrix. This procedure permits to take informed decisions on strategic resources which are outsourcing candidates and also returns further valuable analytics on the status of each investigated IA.
The paper is structured as follows. Section 2 analyses the theoretical background. Section 3 unfolds the logic behind the proposed idea. Section 4 illustrates step-by-step the Resource Prioritization Scorecard (RPS) procedure. Section 5 has been designed as a calculation section, outlining a practical application from the proposed theoretical basis with a numerical example. As a final point, Section 6 summarizes the conclusions of this paper.
2. Theoretical Background
The Resource-Based View (RBV) defined an organization on the basis of the blend of resources it is composed of, and explained that competitive advantage relies on the characteristics of such retained resources, on the firm’s capability to exploit them, and on distinctive competences that link them [16,21,22,23,24]. If some key-requirements are fulfilled, such “strategic resources” play the role of driver and enabler of competitive advantage [21,25,26,27]. Next, in order to explain the sustainability of the competitive advantage, the Dynamic Capabilities (DC) theory adopted a dynamic view [28], where the kernel is a meta-(intangible) asset: the organizational capability of continuously creating, integrating, and resetting the winning blend of strategic resources within a systematic process [29]. The management of human resources can be implemented in a socially responsible way by means of the sharing of knowledge, skills, and attitudes, the improvement in communication, trust, and cooperation among employees, thus generating an institutionalized knowledge encoded in the organizational culture [30,31]. Furthermore, the Knowledge-Based View (KBV) highlighted that only the resources characterized by knowledge nature and knowledge processes [10,11,12,13,14] can unleash and sustain the whole potential competitive advantage at the rapid evolution of the market in changing environments. Therefore, intangibles resources represent the real kernel of the Strategic Capital since they embody the core competence of the company and have critical importance in a firm’s value creation processes [16,27,32]. Results from several field research have shown a significant direct link between intangible components and business performance [33,34]. Congruently, the most distinguished literature agrees on the key-role played by intangible resources to create and manage a sustainable competitive advantage [7,8,9]. Moreover, it has been demonstrated that socially responsible human resource practices can increase the level of intangible assets [35]. Among the various forms of value that companies create for different stakeholders in terms of sustainability, the intangible one is crucial: sustainability strengthens the supplier relations and information sharing among firms, [36] and supports reputation, trust, and legitimacy [37].
2.1. Insourcing/Outsourcing Issues
Following these principles, analyzed under a sustainability point of view, firms are encouraged to generate new resources while using the ones already available within their own organizations; thus, they conduct activity of resource allocation and resource development at the same time, in connection to them [38,39]. Their allocation/management is seen as one of the main causes of value creation [40,41,42] and the sustainable advantage deriving from them is a crucial decisional factor for the resource-portfolio policy of any competitive firm [43].
The choice between insourcing and outsourcing such resources is, therefore, critical. And it actually is at several levels of analysis.
From an accounting standpoint, when an outsourcing opportunity occurs, what is relevant is the balance between “ceasing costs” and “emerging costs” resulting from the operation. However, the understanding of production, transaction, and coordination costs which may affect internal sourcing is also crucial [1], and they should be all considered when outsourcing. With a focus on costs, the main issues about outsourcing IAs are originated by the fact that their existence is influenced by information asymmetry and the accounting criterion they are treated with. They can be synopsized as unavailability of detailed information on costs, the existence of hidden costs, the existence of potential risks/opportunities and the difficulties in comparing internal and external processes related to IAs [3].
But, beyond any accounting balance, it is from a strategic perspective that the most challenging point arises. The cost-side perspective simply can’t be the only keystone in buy/make decisions, especially when dealing with these type of resources [1]. Quinn and Himler [44] highlighted that the success of a buy/make decision highly depends on the candidate resource to be outsourced belonging to the circle of core business-related ones. Such types of intangible resources should be indeed internalized, most likely not having them outsourced, in order not to jeopardize the strategic alignment of the company. Actually, this choice also affects the corporate intangible patrimony and identity.
It is precisely with the above strategy-level assumptions in mind that the crucial nexus between the insourcing/outsourcing dilemma (resulting, subsequently, and from an operational angle, in buy/make decisions) and a value-creating subset of strategic resources must be considered. Especially from a sustainability perspective, any business reality is characterized by the scarcity of some resources, and those are exactly the ones that can make a difference in terms of success. Therefore, the critical step of making a farsighted choice to keep/not keep direct control over such assets becomes a major issue and a source of competitive advantage at the same time, especially in the long run. The fact that among this circle of scarce resources, most of the times, the majority is represented by intangible assets, it implies directly that a decision over the fact of internalizing or externalizing them comes with an immediate and operational-level direct consequence on the level of intangible assets actually managed by the company.
Therefore, any strategy-wise decision board, even at different organizational levels, would possibly benefit from some prioritizing criterion that, in addition to the cost-side, would factor also long-term value-creating and competitive advantage enabling features (embedded in resources that, therefore, are actually strategic) with a more farsighted perspective than a focus-on-costs one can provide.
2.2. IAs In-depth: Stock and Flow Perspective
In order to look deeper into the question and search for an adequate solution according to the specificity of the target, a necessary preliminary step is to focus on the nature of IAs first.
The KBV identified the Intangible IAs as the main “knowledge-based” source of value creation and performance. It is due to the intrinsic value of the knowledge substratum they embody, that those intangible resources can play a starring role among the strategic resources, being a sub-set of them. The potential competitive advantage deriving from IAs is normally in a winning position for their owner because such resources are entirely characterized by causal ambiguity, path dependency, and social complexity. From this viewpoint, knowledge is seen as the common factor gathering all the strategic resources and highlighting the connection with the value-related processes and with the involved assets [45].
Distinguished literature agrees on a “double nature” view of knowledge: stock and flow, which explains the subject from both a static and dynamic perspective at the same time [19,20]. The whole set of intangible resources are therefore referred to as the collection of the stock of the intangible assets themselves and the flows between them [46,47,48,49]. The set of IAs shows its essence both in a static and in a dynamic behavior, in the same way as knowledge is expressed in terms of stock and flow. Several studies highlighted the link between stocks and flows components of IAs by analyzing their structural relationship in terms of their relevance/weight and of the mutual impact/influence between them [19,46,47,50].
3. Connecting the Dots
According to the above-illustrated literature, three crucial aspects should be factored in, considering the “double nature” of the very fabric of the IAs and the strategic role they play. Their related dimensions of analysis can be therefore outlined as follows: the strategic perspective, the stock (static) dimension, the flow (dynamic) dimension. Considering that, any candidate solution which aims to aid the decisional process in make/buy decisions—for being effective—must take into consideration their quantitative measurement, in order to provide any reliable comparative insight. The problem of measuring such entities could be solved by using dimensional proxies.
In case of “flows”, the object of investigation should be an entity which represents the dynamics of the mutual relations among IAs, a proportional KPI sensitive to the flow activity among them [51]. A screening of its behavior towards the all set of IAs in terms of the flow-direction: whether it is “active” or “passive” towards the other single assets. And, for the specific purpose of this study, it should also keep track of the flow direction: inbound or outbound. This is because in order to evaluate any asset, an analytic audit of its performance in giving/receiving influence is required, assessing their “connectedness”.
As for the “stock” dimension, a valid candidate proxy should be capable of measuring the volume of the capacity of an IA to retain valuable knowledge. Indeed, knowledge becomes relevant when it is put to work effectively, when it has a role in creating value: “knowledge that can be converted into profit” [52] and “Intangible assets are value drivers that transform productive resources into value-added assets” [22]. Completing the syllogism, it means that the proxy parameter should be representative of the target asset relevance in the business model about its role in creating value [34]. And considering that we are dealing with a “galaxy” of resources, what is important is their relative relevance, among the other members of the set of resources [53] —their “magnitude”, keeping the astronomy metaphor.
About the last dimension of analysis, “sustainable competitiveness” deriving from the examined resources, it is important to notice that the DC literature [54,55,56,57,58,59] explained how companies renew their existing capabilities and resources to adapt to the changing business environment. It completes the RBV from a dynamic perspective, where the former already identified some direct factors required for any asset to be considered of strategic. In this way, intangible assets can constitute the input of the value creation process in a socially responsible configuration of human resource policies and practices [30]. The combination of such static and dynamic factors—and their direct measurement—can be used as a direct proxy of the “strategic value” of each investigated asset. In this connection, accord to [35], investments in socially responsible HR policies, in accordance with social responsibility standards, can provide companies with the opportunity to improve their performance.
4. Blueprinting the Methodology
In order to achieve the research goal above illustrated, an analysis framework is proposed in compliance with the logic workflow outlined in Section 3. The Resource Prioritization Scorecard (RPS) procedure consists of three main units plus a final step which accomplishes the convergence between the three of them, eventually returning a comprehensive key indicator. Each unit returns two main deliverables (a unit score for each IA, and the threshold value) that are used as inputs for the Scorecard. Plus, each unit returns some outputs and analytics, which can be used as internal benchmarking indicators (Table 1).
4.1. Unit-1: Connectedness
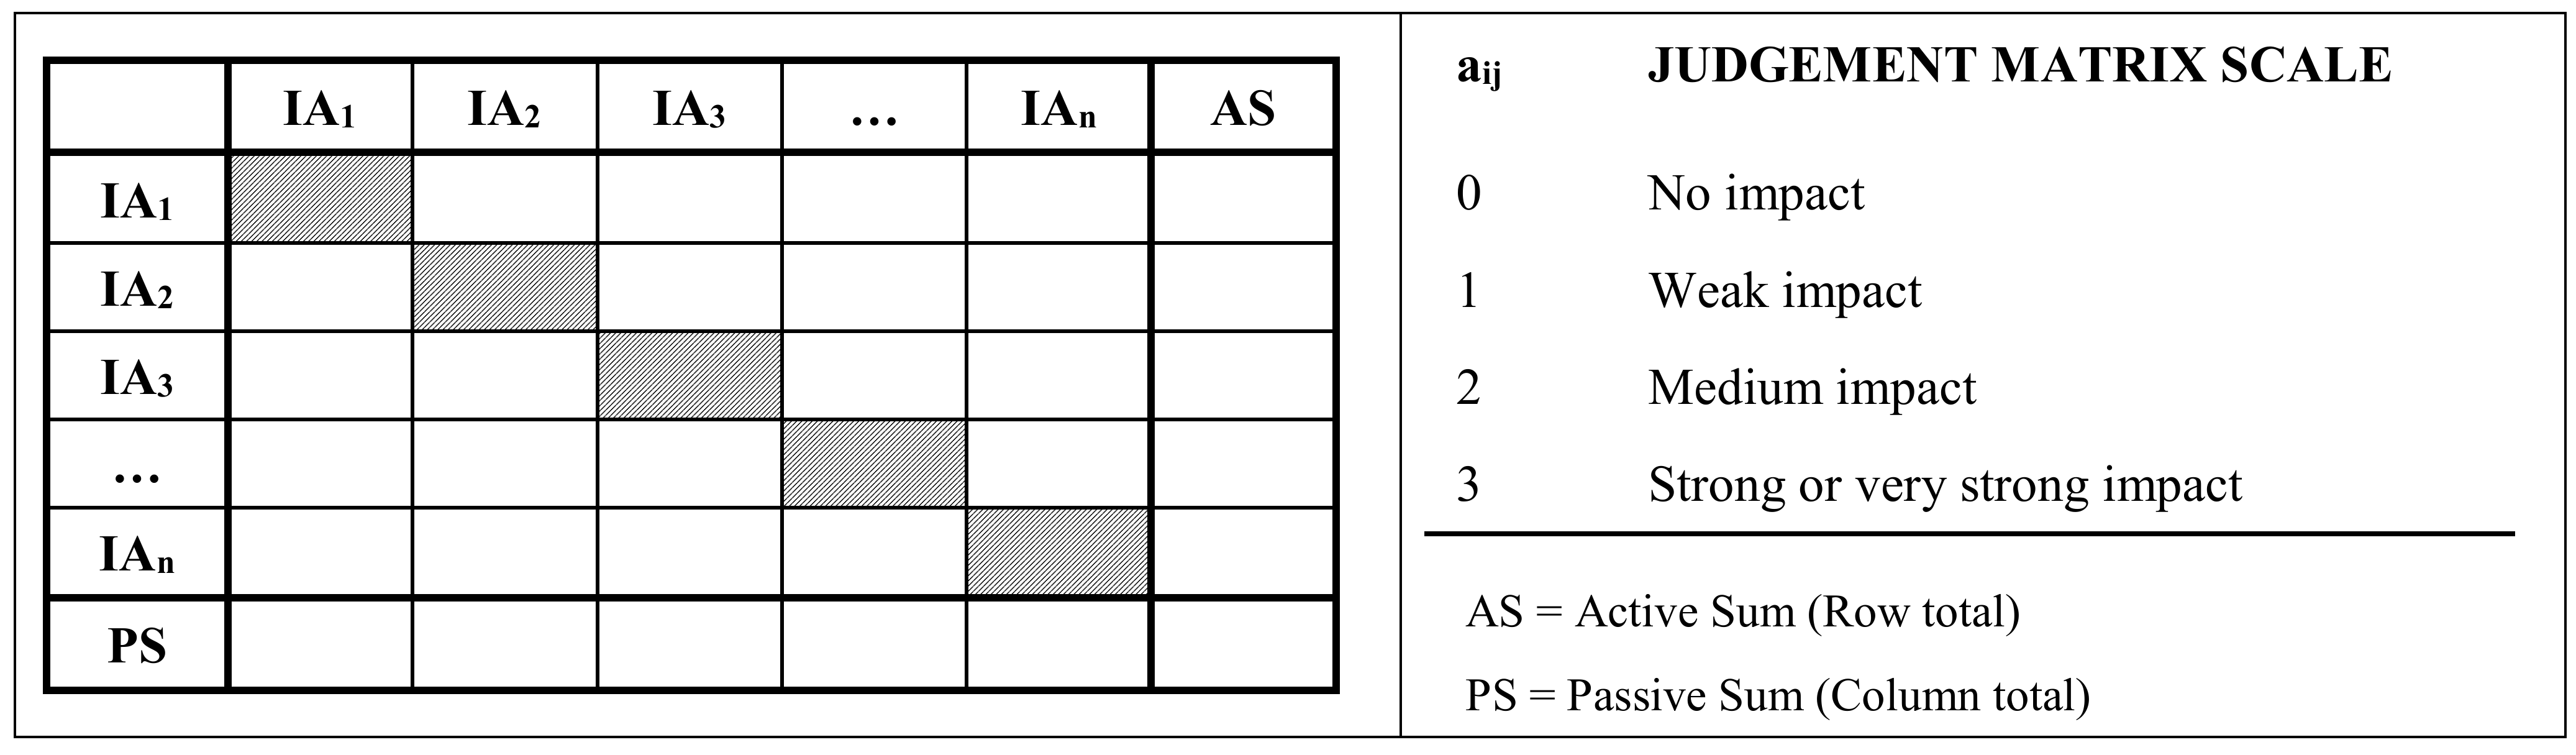
The aim of this unit is to achieve a quantitative appraisal of the existing interactions among the IAs, returning a measurement for each examined entity which can be representative of its degree of connection with the very fabric of the organization. The means to achieve this task is assessing the mutual connections of each IA with all the other identified peer-entities that have a role in the value production process. This is done via a cross-impact matrix analysis [60,61]. This methodology is capable of appraising the direct/indirect influence flows among the knots of the IA-network. This procedure is interview-based and conducted under the logic of pairwise comparisons: each question focuses on assessing the impact of one single entity on another peer-one (survey-form template in Appendix A) in a cascade manner. So, for every set of questions regarding one specific IA, the influence of such entity on/from all the other ones is eventually disclosed. Some sequential nested procedural steps are required: building the Interaction Matrix among IAs; calculating the corresponding Active Sums (Outbound Influence) and Passive Sums (Inbound Influence); computing the Total Influence value for each IA, which will be the first input of the RPS, the “convergence scorecard”.
4.1.1. Interaction Matrix
The present step focuses on assessing the network of relationships that link each single IA to the others from a quantitative perspective. This goal is achieved building an Interaction Matrix (1) related to them. The values that will populate the matrix are measured in terms of received/given flows of impacts among the studied entities, assessed via pair-wise comparisons among them. The Interaction Matrix proposed in this paper is a square matrix with matching factors listed in the same order for both rows and columns. Given any IA, the meaning of every “aij” position within the square matrix (“m x n”, where “m = n”) is the following: how much the IA corresponding to the “ith” position impacts (i.e.,: influences) on the IA corresponding to the “jth” position. Values on the diagonal are computationally considered null [62], even if—since we are speaking about intangible entities based on knowledge—some autopoiesis-like phenomenon could be theoretically possible (and quite desirable indeed) thus generating a self-loop, as illustrated by qualified literature [63].
Once all the elements of the matrix have been populated, it is possible to proceed with the calculations. In order to measure the outbound/inbound influence of each IA (i.e.: “x” subscript) —here used as a proxy of the “flow dimension” as above illustrated—two aggregation indicators are used, as in (2) and (3):
Next, in order to provide a working input to the Convergence Scorecard, it is necessary to sum up the given/received flows of impacts to calculate the Total Influence, as in (4), which stands as a proxy for the Connectedness of the examined resource among the set of IAs itself, since it factors both the outbound and the inbound flows from/to every knot of the network:
The subsequent sub-step is the Threshold Value definition for the all set of IAs. This parameter will work in the convergence scorecard as an internal level-gauge of comparison. A viable solution is making recourse to the arithmetic mean [64] among all the IAs (i.e., “i” subscript), whose distance from the score performed by the tested entity, will be the “Deviation” parameter of the convergence scorecard, as in (5).
4.1.2. Connectedness-related Corollary Analytics
Furthermore, the utilization of such a type of quantitative methodology enables the evaluation to benefit from some analytics and diagnostic indicators about the interconnections between the studied entities. The purpose of this further level of inquiry is profiling them into homogeneous groups. Using the Active and the Passive Sum totals as coordinates, the position of the set of IAs can be plotted in a Cartesian chart (Connectedness Matrix, on Figure 1). In relation to the score achieved on these two dimensions, the IAs are positioned on the graph and the plot-area can be divided into four homogeneous groups:
- ▪
- Critical: high outbound and high inbound influence
- ▪
- Active: high outbound and low inbound influence
- ▪
- Reactive: low outbound and high inbound influence
- ▪
- Buffer: low outbound and low inbound influence
4.2. Unit-2: Strategic Value
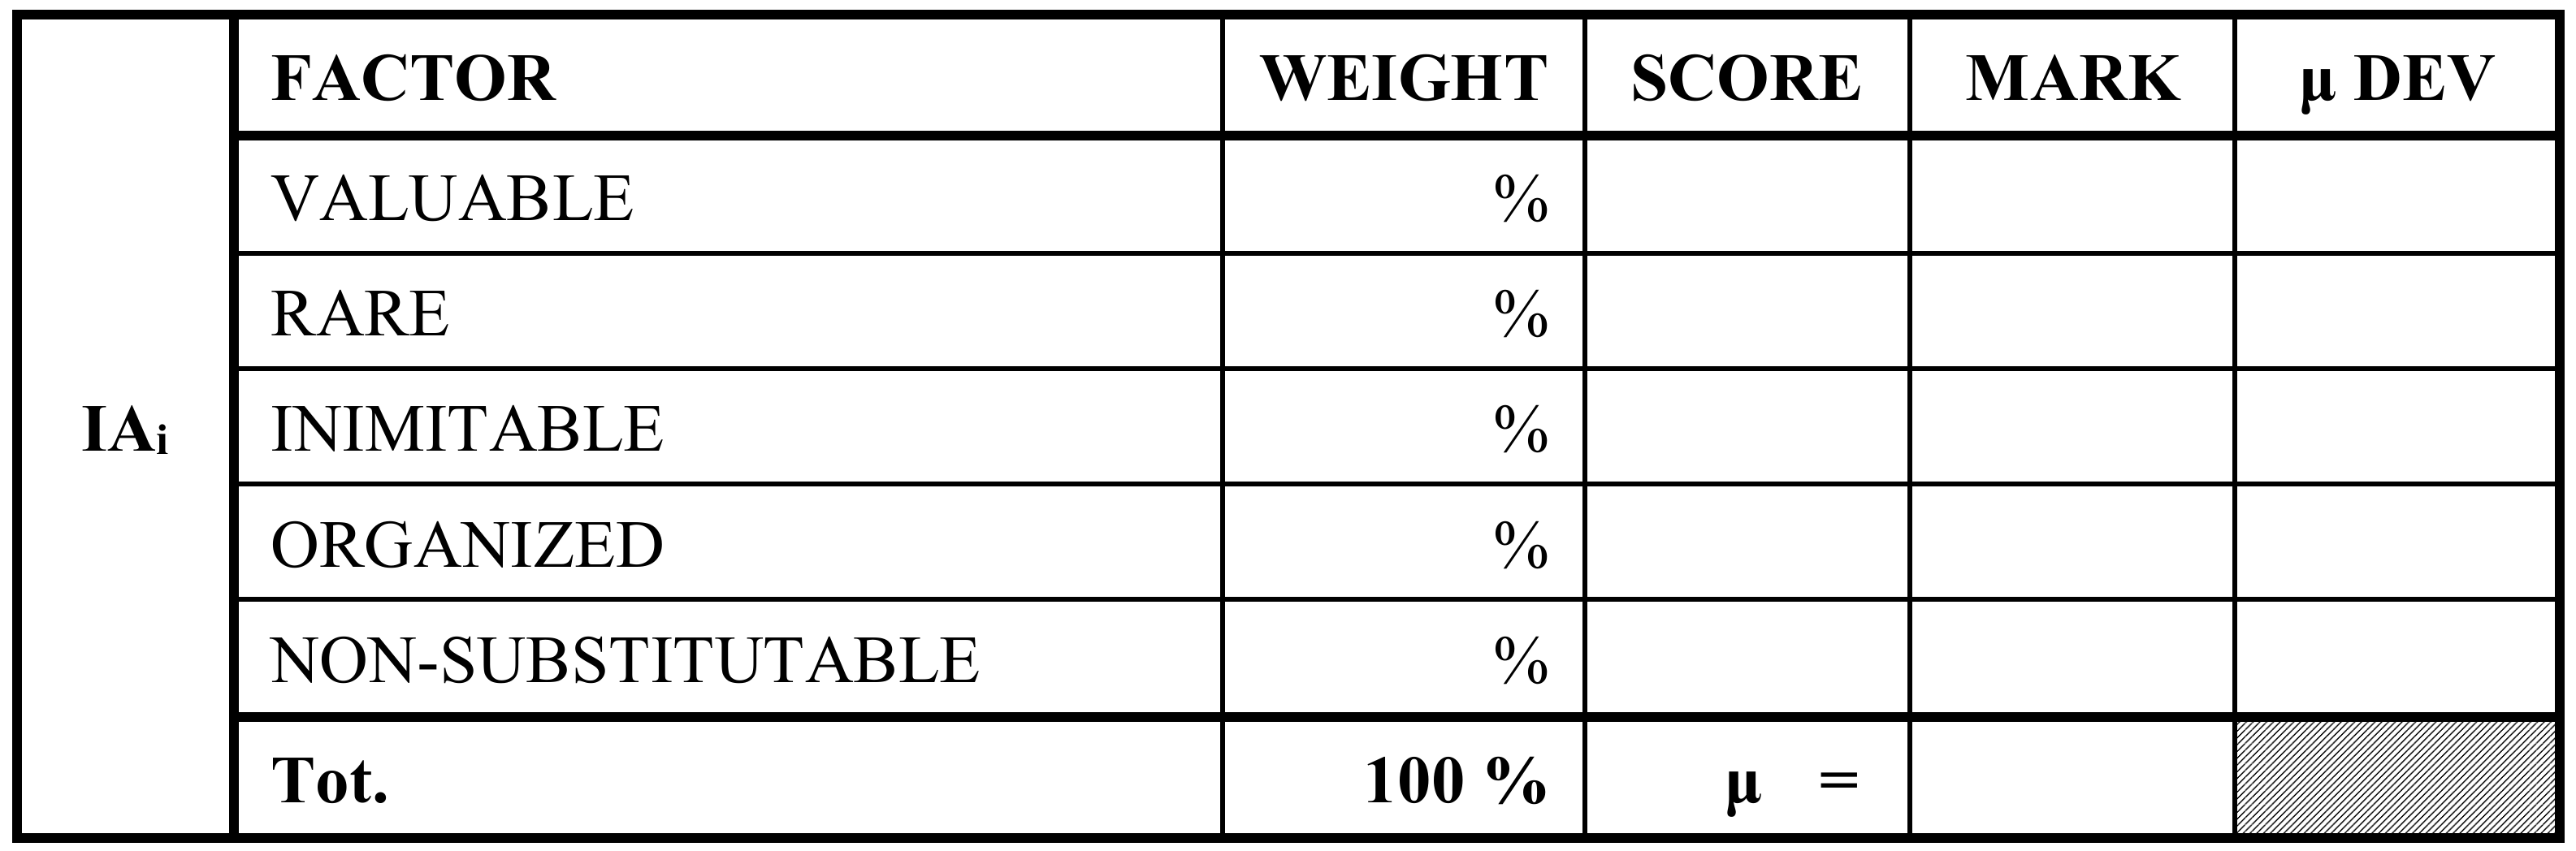
The second unit is focused on competitiveness and on the sustainability of the competitive advantage. According to the RBV and the DC [69,70,71], for a resource to be the basis of a sustainable competitive advantage, it must own some specific attributes (Factors). According to these studies, resources should be valuable, rare, inimitable, non-substitutable (Table 3), and the firm must organize to capture the value unleashed by the resource themselves.
In compliance with such requirements, the Strategic Value dimension of analysis focuses on such attributes a IA must have. Those drivers can be assessed and measured in order to obtain a judgment over their contribution to competitiveness, as in (6). Possible techniques for the assessment of those five Factors (F) range from weighted score-repartition scale to Multiple Attribute Decision Making methodologies. In this case, the former is the one to prefer (survey-form template in Appendix A). The degree of complexity and fuzziness of the Factors up to be investigated doesn’t necessarily require any. This is true for three main reasons.
First, according to the RBV and the DC, the investigated dimension is of course to be intended as part of a whole, but they independently coexist. Therefore, by design, they will be independently asked to the interviewee and they will represent a snapshot of the actual shape of that IA within that specific organization-structure in that specific moment.
Second, the semantic meaning of those five Factors is sharp and previously shared with the interviewees [81]. They don’t need to embrace the complexity of the comprehension of the phenomenon as a whole (competitiveness and its sustainability) but to focus more conveniently on the single Factors that drive it: one per time, as in parallel thinking [82].
Third, a weighted score-repartition scale is customizable about the 100%-sum weights given to any of the five Factors for each examined resource. This feature provides the necessary flexibility to the assessment process.
where the sum of the five weights equals 1. Differently from Section 4.1 and Section 3, with regards to this dimension of analysis, the arithmetic mean of the calculated values should not be considered as a valid Threshold Value. In the first place, this is due to the fact that, as above illustrated, all the examined Factors within each IA are independent. But mostly because, in order to achieve some competitive advantage, a minimum level should be guaranteed (i.e., independently from the actual factor-interdependent level of the system, as in 4.1 and 4.3). Therefore, the Strategic Value Threshold Value must be considered as the minimum level achievable by the factored drivers to guarantee competitiveness, as in (7). On the proposed model, in the numerical example on Section 5 of this paper, a level of 50% of the maximum achievable value is suggested.
4.2.1. Strategic Value-related Corollary Analytics
Along with a measurement of the Strategic Value for each IA, this unit comes with two ratio indicators, whose screening returns further information about the composition of the network of IAs. Such indicators provide some meaningful analytics above their drivers. Those figures can be useful also for evaluating the involved resources with regards to their criticality.
The first indicator is formulated as follows. For any asset (IAx), it results as the deviation of the score recorded by each Factor from the weighted mean (μw) of the five Factors among the same IA. Once ranked according to this criterion, the resulting list provides a disclosure of the “eccentricity” of the examined IA: for any IA, it rates how much a single Factor prevails/outstands on the others (numerical example provided in Section 5). The higher the absolute value of the indicator is, the more “eccentric” the IA is about that specific Factor. The algebraic sign shows if it is so in a positive or negative way, as in (8).
The aim of the second indicator is to assess how, for every specific IA, each Factor performs in comparison to the score it records on the other IAs, so that it is possible to run an internal benchmark and rank them all. For any IA, this indicator is built as the ratio between the score of the investigated Factor (Fy), and the arithmetic mean of the same Factor calculated over the entire set of IAs, as in (9).
4.3. Unit-3: Magnitude
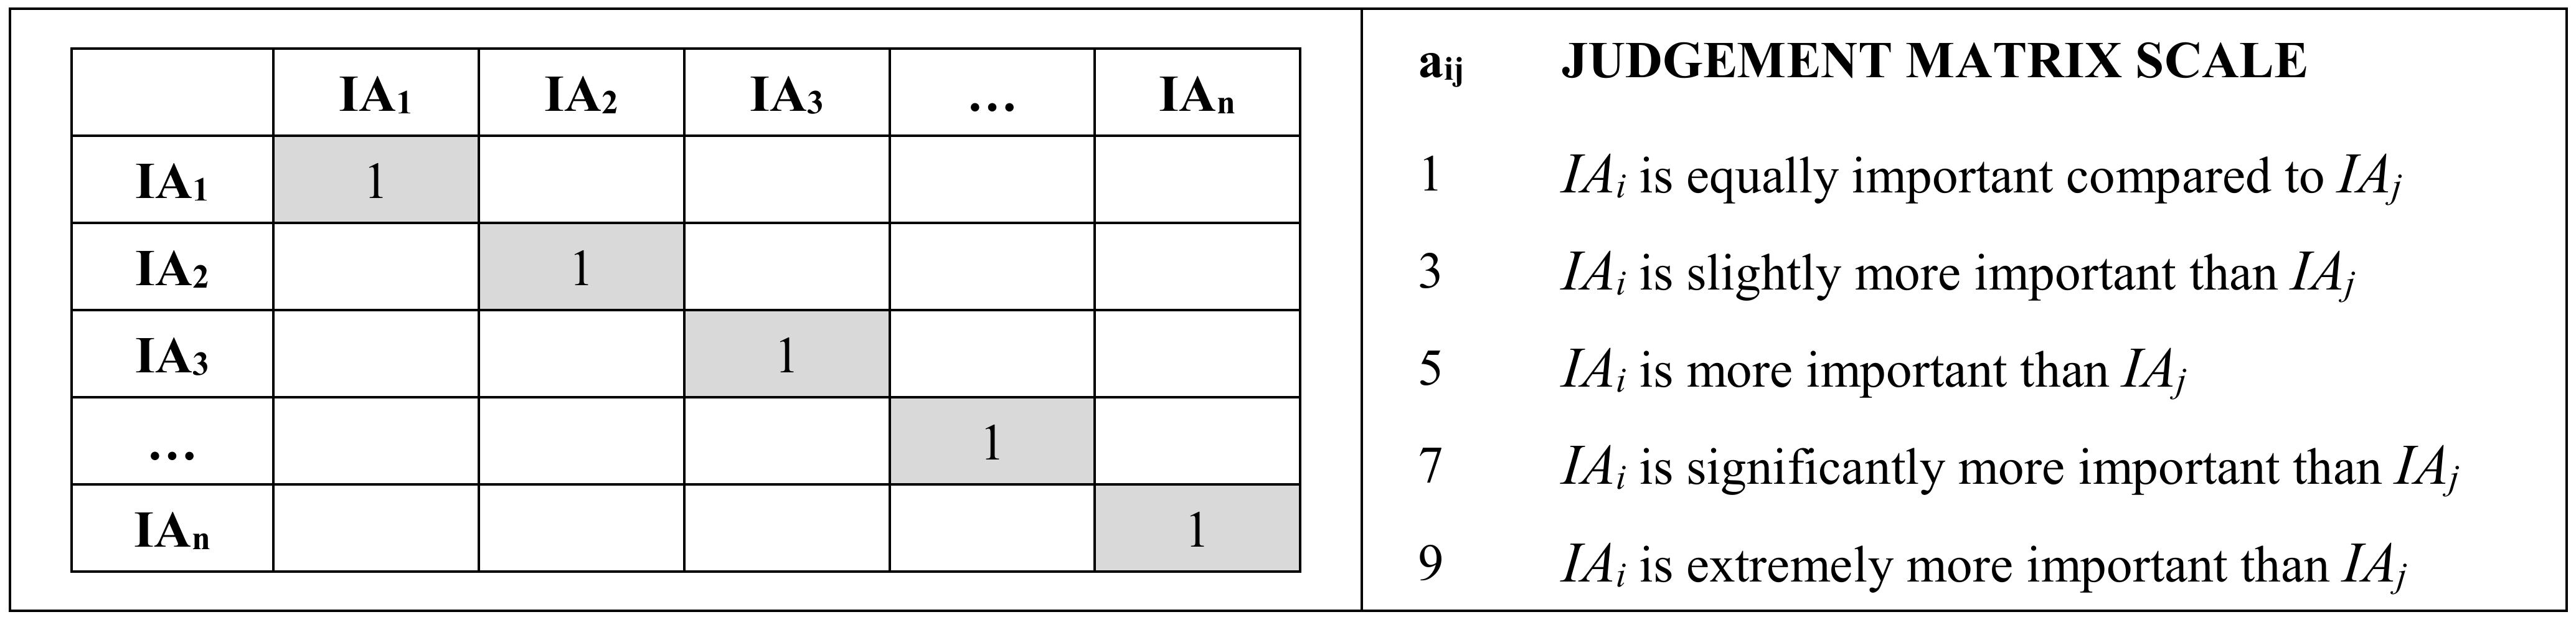
The third dimension of analysis is about the “relevance” of the examined IAs within the value-creation pattern of the organization. This parameter works as a proxy of the concept of control-risk. Outsourcing any asset unavoidably exposes the firm to the risk of lack of control on that, since it will be no longer under its direct management and supervision. Therefore, a resource detected as “highly relevant” (i.e., “critical”) should remain under the direct and continuous control of the management, in order to prevent the risk of strategic misalignments or workflow bottlenecks deriving from its accidental misdeployment/delay by the outsourcee. The purpose of this unit is to appraise the specific weight of any resource, so that the procedure returns a comparative score regarding its relative rank among the all set of IAs. This task is achieved by assessing the relative importance of each resource within the business process (survey-form template in Appendix A). The procedural goal of getting such relative weights can be pursued in different ways. One of the most resilient families of techniques that can be used at this purpose is the group known under the name of Multiple Attribute Decision Making methodologies. In particular, the AHP [53] suits this objective pretty well, since it returns sharp figures about the ranking of the investigated entities, in terms of relative measuring [83]. So, the procedure will populate a list of IAs with associated percentage values (whose total is 100%), indicating their relative weight within the value creation process (example provided in Section 5), as in (10). Furthermore, the allowance to use natural human language in the pairwise-based interviews, instead of raw number verdicts, could help in obtaining a more consistent appraisal from the interviewee.
As for the dimension named “Connectedness”, a practical solution for the definition of the Threshold Value for the all set of IAs is represented by the arithmetic mean of the calculated values, as in (11).
4.4. Resource Prioritization Scorecard
The Resource Prioritization Scorecard (RPS) is designed as a convergence scorecard which, as inputs, utilizes the outputs of the three dimensions of analysis above illustrated. Its purpose is to gather these disconnected pieces of information to build a decision-support criterion. It is finalized to plot a decision Matrix to calculate a concise indicator for a quantitative and unbiased prioritization of the set of intangible resources, in terms of convenience to externalize an asset or to keep it intra moenia.
The more “connected” an IA is, the more it is likely to be entwined with the very fabric of the organization: therefore it should be kept in-house and not outsourced. First, because the transversal value creating processes benefit from its actual deployment, to whom they are bound. Second, because it would be extremely hard to successfully outsource an asset (without causing inefficiency due to knowledge-transfer issues) whose existence is not comprehensible just as a stand-alone one (detached from the other entities). Such a typology of IA finds its own identity only within a complex system (the IA-network) which it is strongly interconnected with, driven by causal ambiguity and complexity.
Likewise, the more “strategic” an IA is, the more it should not be outsourced. Moving this asset to somewhere external would expose the firm to the risk of losing supremacy on that resource and, at the same time, to the risk of losing competitiveness deriving from it. This is because, once “outside”, the asset would be more easily subject to cloning attempts by competitors. That is the reason why is safer to outsource only the resources whose strategic profile is lower.
Last, “magnitude” plays an important role in building a judgment on whether to outsource an IA or not. Make/buy decisions are strongly influenced by the “size” of the object of the assessment. This parameter is conceived to appreciate the importance of the examined asset within the value chain: it is a proxy of its criticality. This dimension of analysis is strongly correlated to the control-risk. For all intents and purposes, the more “critical” an IA is, the more it should remain under the direct and continuous control of the management since a potential misalignment in its deployment or a lack of its “readiness” could jeopardize the entire value-creation process.
These considerations are going to be intended “ceteris paribus”, i.e., if the environmental conditions actually permit some choice. Indeed, conclusions will be different if it turns out that there is a major strategic issue over the outsourcing of an asset (e.g., a “fee to pay” for an upcoming commercial agreement with a partner that will open to new markets) or if the financial cost to keep it “inside” is not sustainable.
The raw scores recorded at each dimension of analysis need to be weighted by the means of some gauge, to assess their relative position. In order to achieve this, they are compared with the Threshold Value (that can be normalized as well, to the max unit score or to the total of the scores) of the Unit and their algebraic sum represents the Deviation.
Before populating the scorecard (Table 4), one last necessary step is required. This methodology leaves maximum flexibility to the practitioner, because of the fact it gives by design—for any Unit—the possibility to use a different scoring-scale, independently. This solution has been adopted to optimize the interviewing process since it doesn’t force the analyst to use a preset scale which could be inappropriate to the specific case. On the contrary, it leaves the analyst the freedom to customize it and make it suit best with the real-world situation. For example, if the analyst judges that the difference between the mutual influences on the Interaction Matrix is sharp and closer to a “binary” situation, for the assessment of the impacts he would prefer to would use a basic 0–3 Likert-like scale rather than a Saaty-like one. While on the Unit-2, the analyst has still freedom to choose a different mark-scale depending on potential biases (e.g., among some cultures, 0–10 sounds more familiar than 0–5) or even use different scales with different subjects, in case of a panel of interviewees.
But before putting the figures together for the convergence, scores from Unit-1 and Unit-2 (i.e.,: the “raw” calculated scores for each dimension of analysis) must be first normalized to be expressed with the same scale, in order to be dimensionally comparable. This is straightforwardly done by the means of a simple proportion to 100, as in (12).
As for the Magnitude dimension, following the original AHP procedure, it already returns 0–100 values. The Scorecard is eventually populated with normalized outputs of formulas from Unit 1, 2, 3 illustrated in the previous sections of this paper.
Where the “Deviation” parameter is the difference of the recorded unit score for that specific IA minus the corresponding Unit Threshold Value, as in (13).
4.4.1. Resource Prioritization Matrix
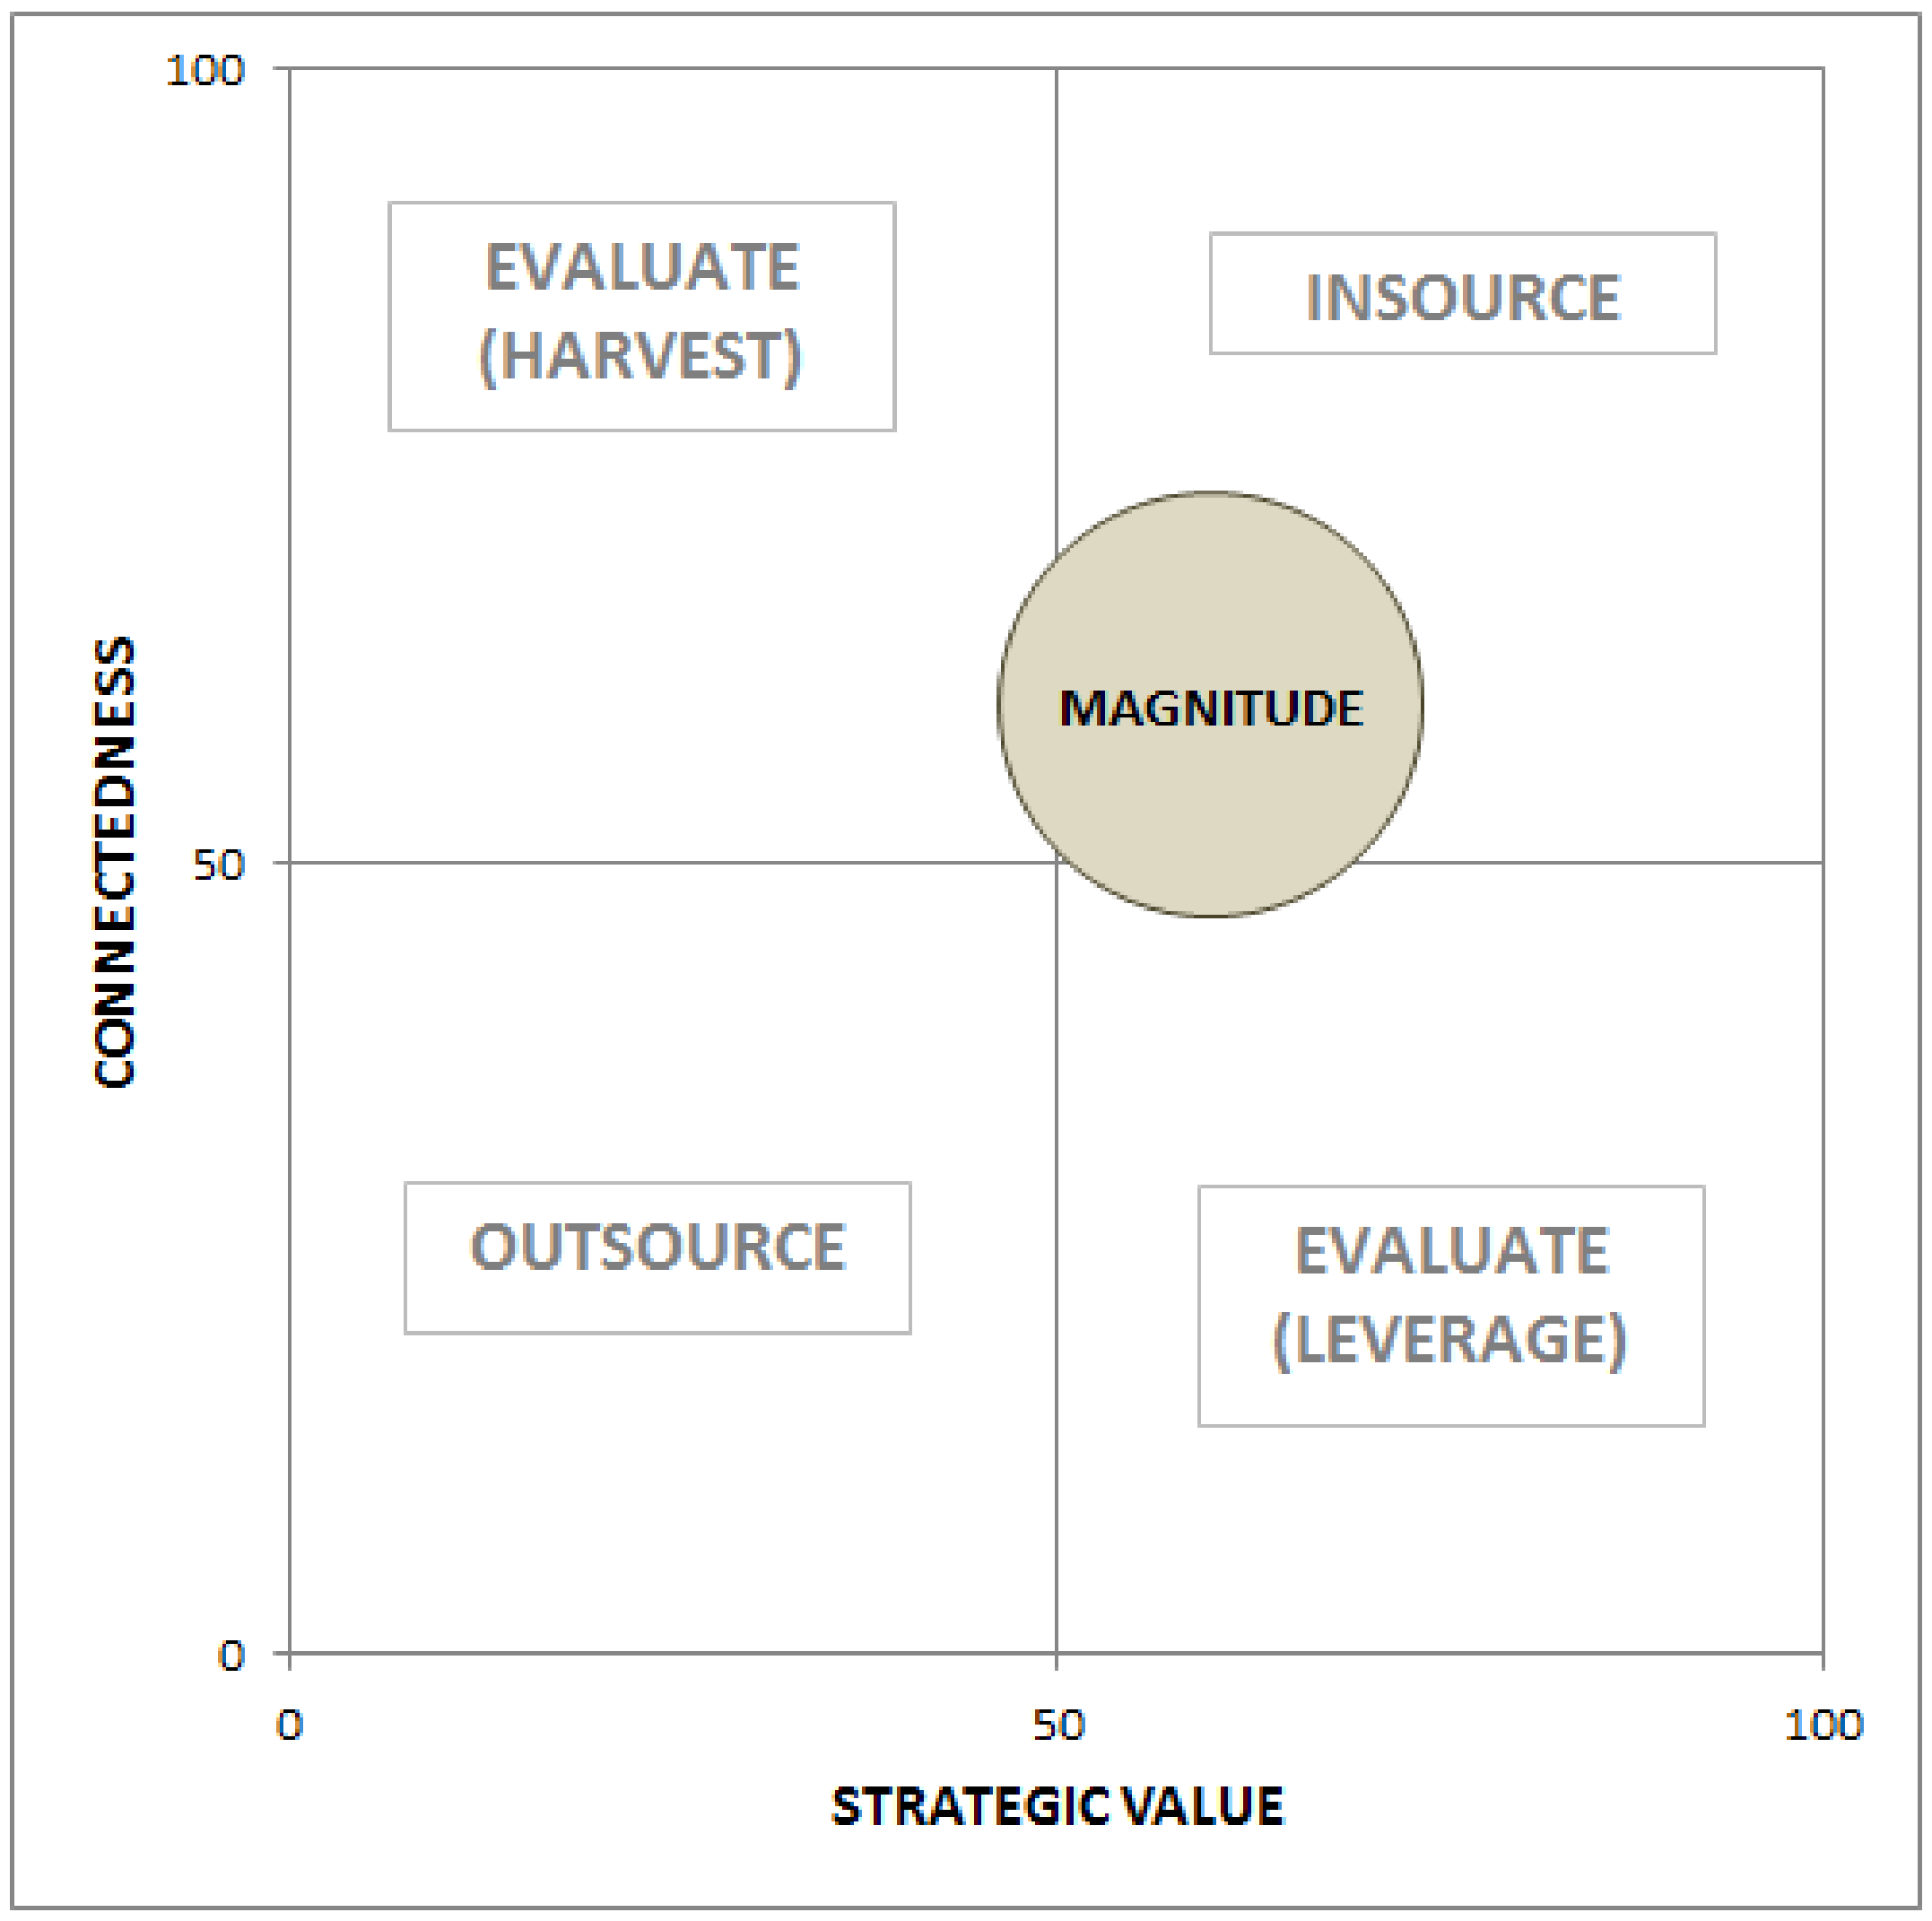
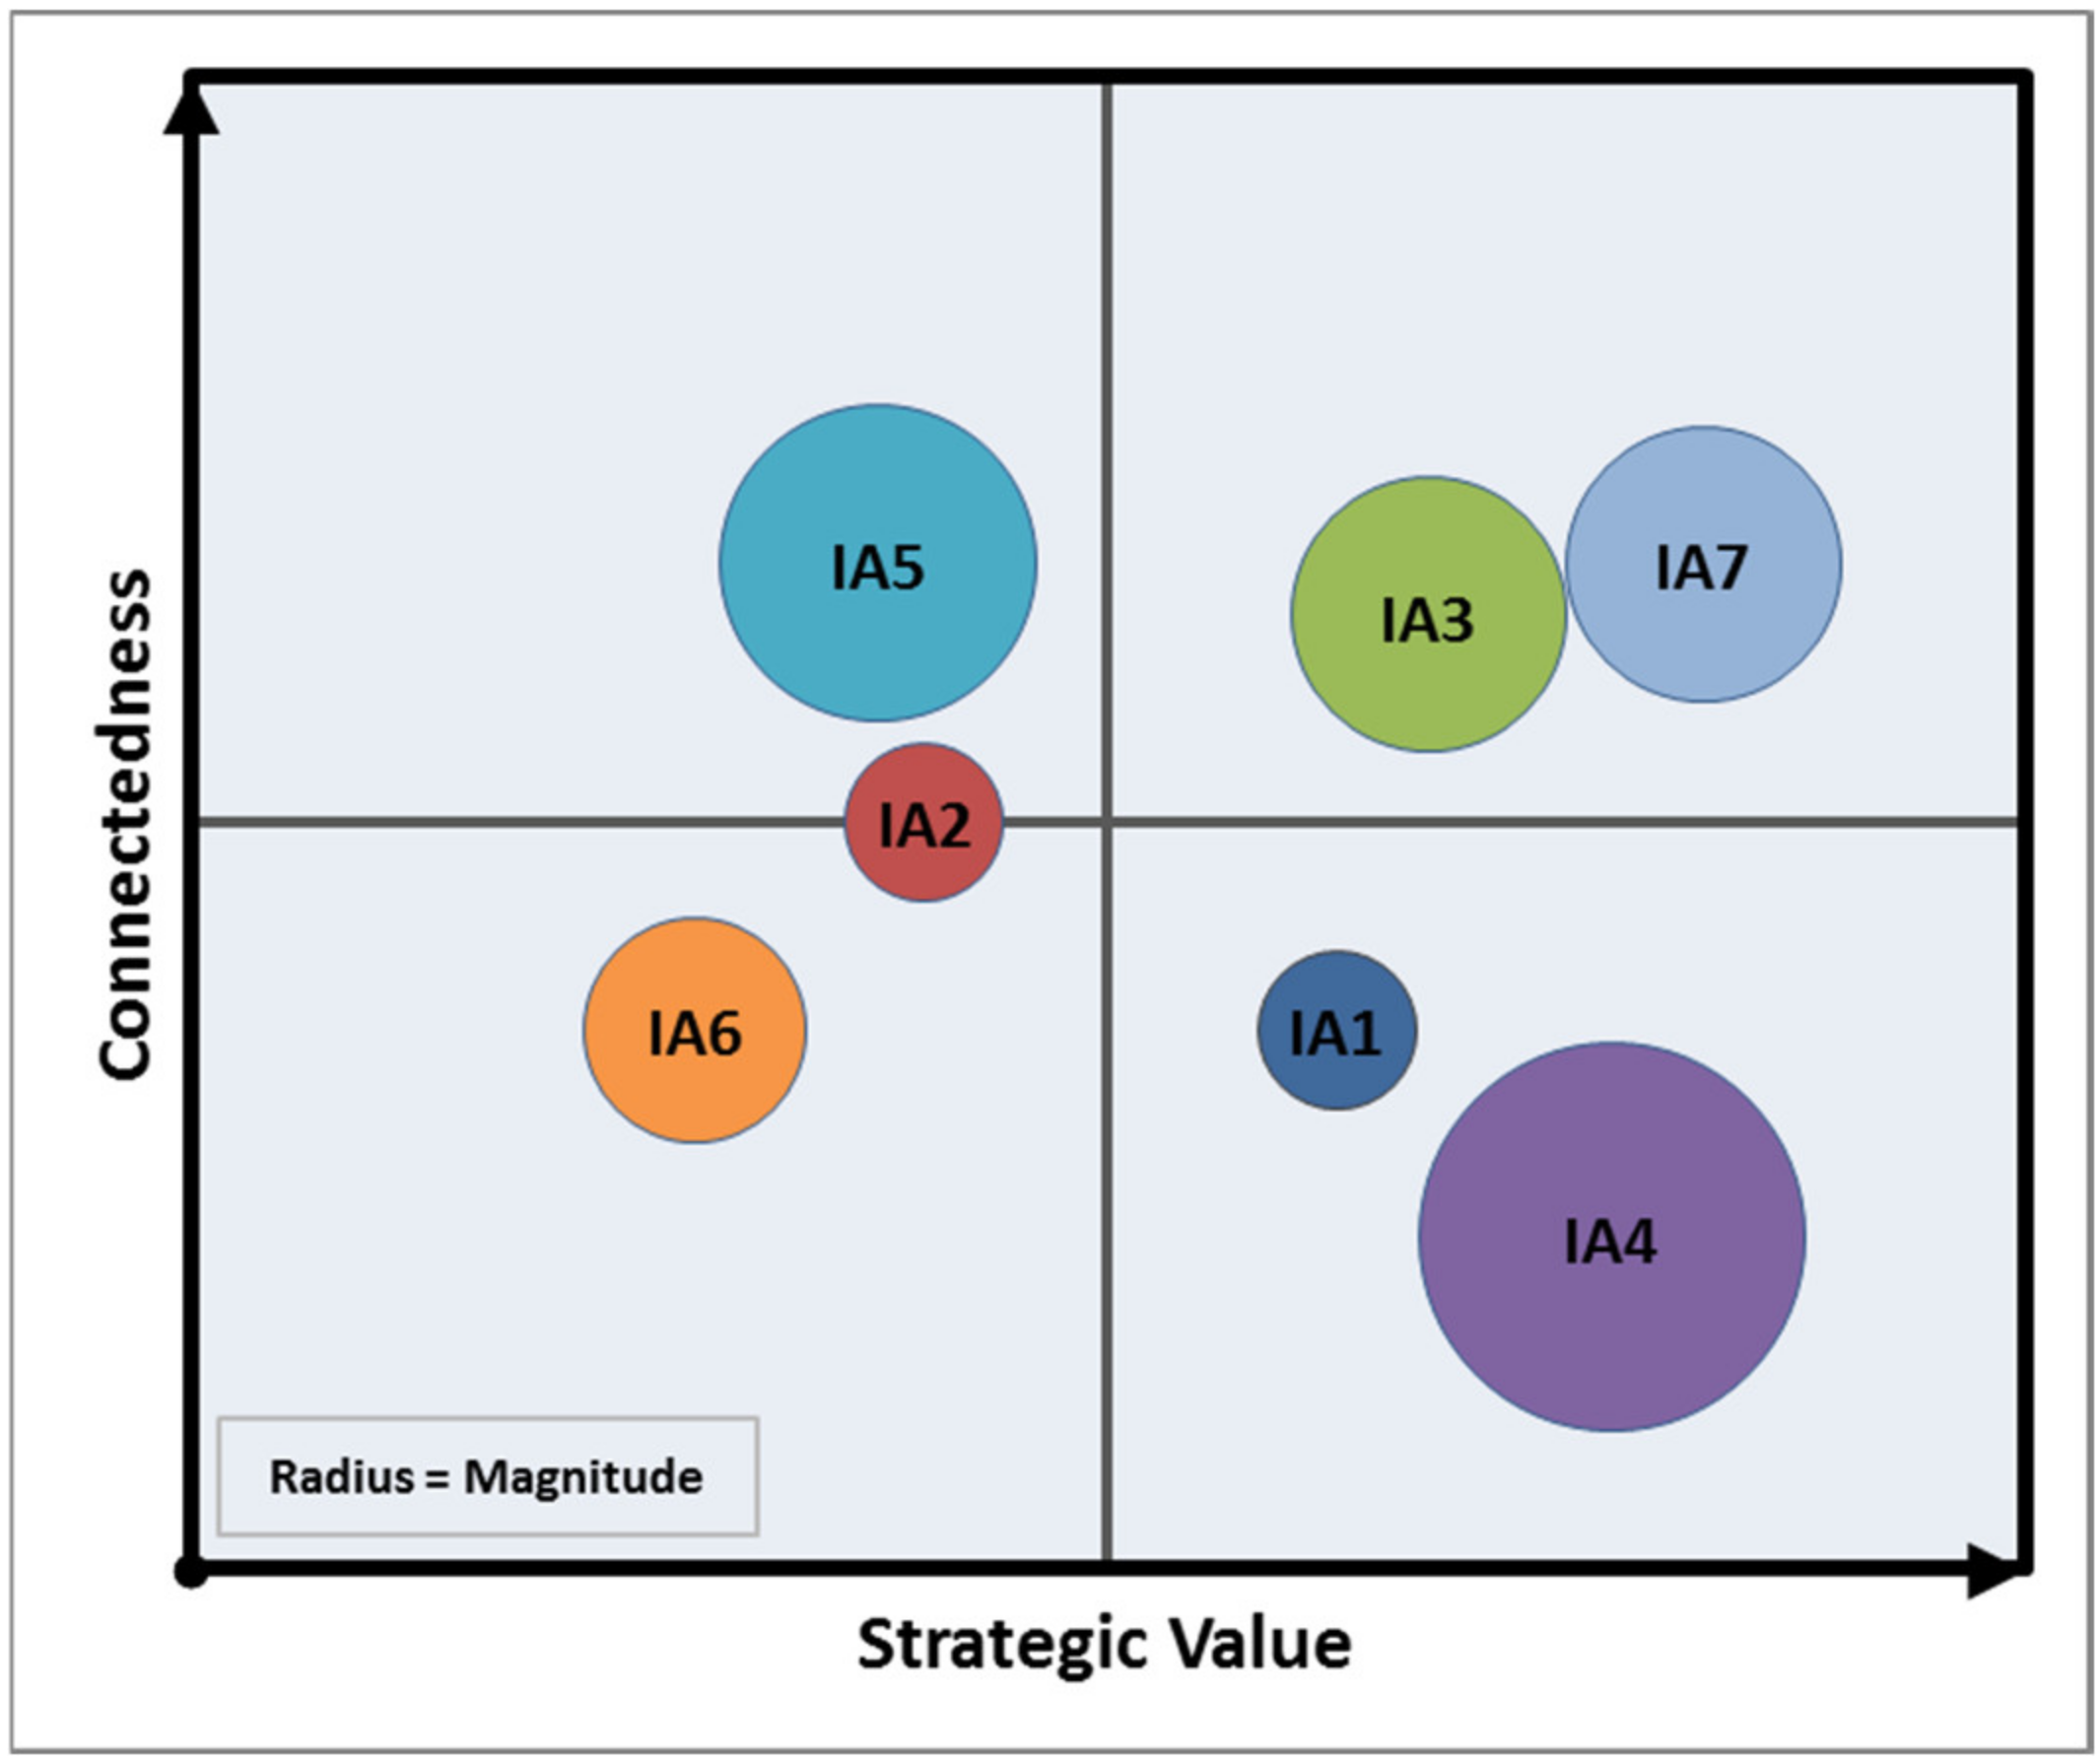
Considering the three points above illustrated, it is possible to plot the rank of every IA on a shared chart (Figure 2). In order to display its status from a graphic standpoint, the three dimensions of analysis are associated with Cartesian coordinates as follows. Values are taken directly from the Scorecard newly populated with normalized numerals. On the vertical axis: “Connectedness”. On the horizontal axis: “Strategic Value”. The combination of these two dimensions builds the Resource Prioritization Matrix. The third dimension, “Magnitude”, is quantitatively symbolized by the radius of the element representing each IA.
The top-right quadrant (High-High) is where the insource-like IAs are detected, characterized by high Connectedness and high Strategic Value. The bottom-left quadrant (Low-Low) will be populated by outsourceable resources, since the levels of the two dimensions are both low. The other two quadrants need some evaluation. Considering only the two Cartesian dimensions, at first glance, the labels that could be possibly used for them are “leverage” (bottom-right) and “harvest” (top-left). The former, for the reason that a highly strategic asset which is not yet integrated with the “connective-tissue” of the organization deserves some attention and investment on this aspect. The latter, for symmetric reasons. But on a further level of analysis, the evaluation could need to factor other aspects, related its relevance and to control-risk level, as illustrated in the previous section. So this is where Magnitude facilitates the buy/make judgment. From a visual standpoint, it is easy to catch its weight from the amplitude of the radius of the graphical elements representing the IAs. A larger radius represents a higher criticality for an IA, so it pushes the final decision towards an insourcing solution. The Resource Prioritization Index can help to support the decision in such cases.
4.4.2. Resource Prioritization Index
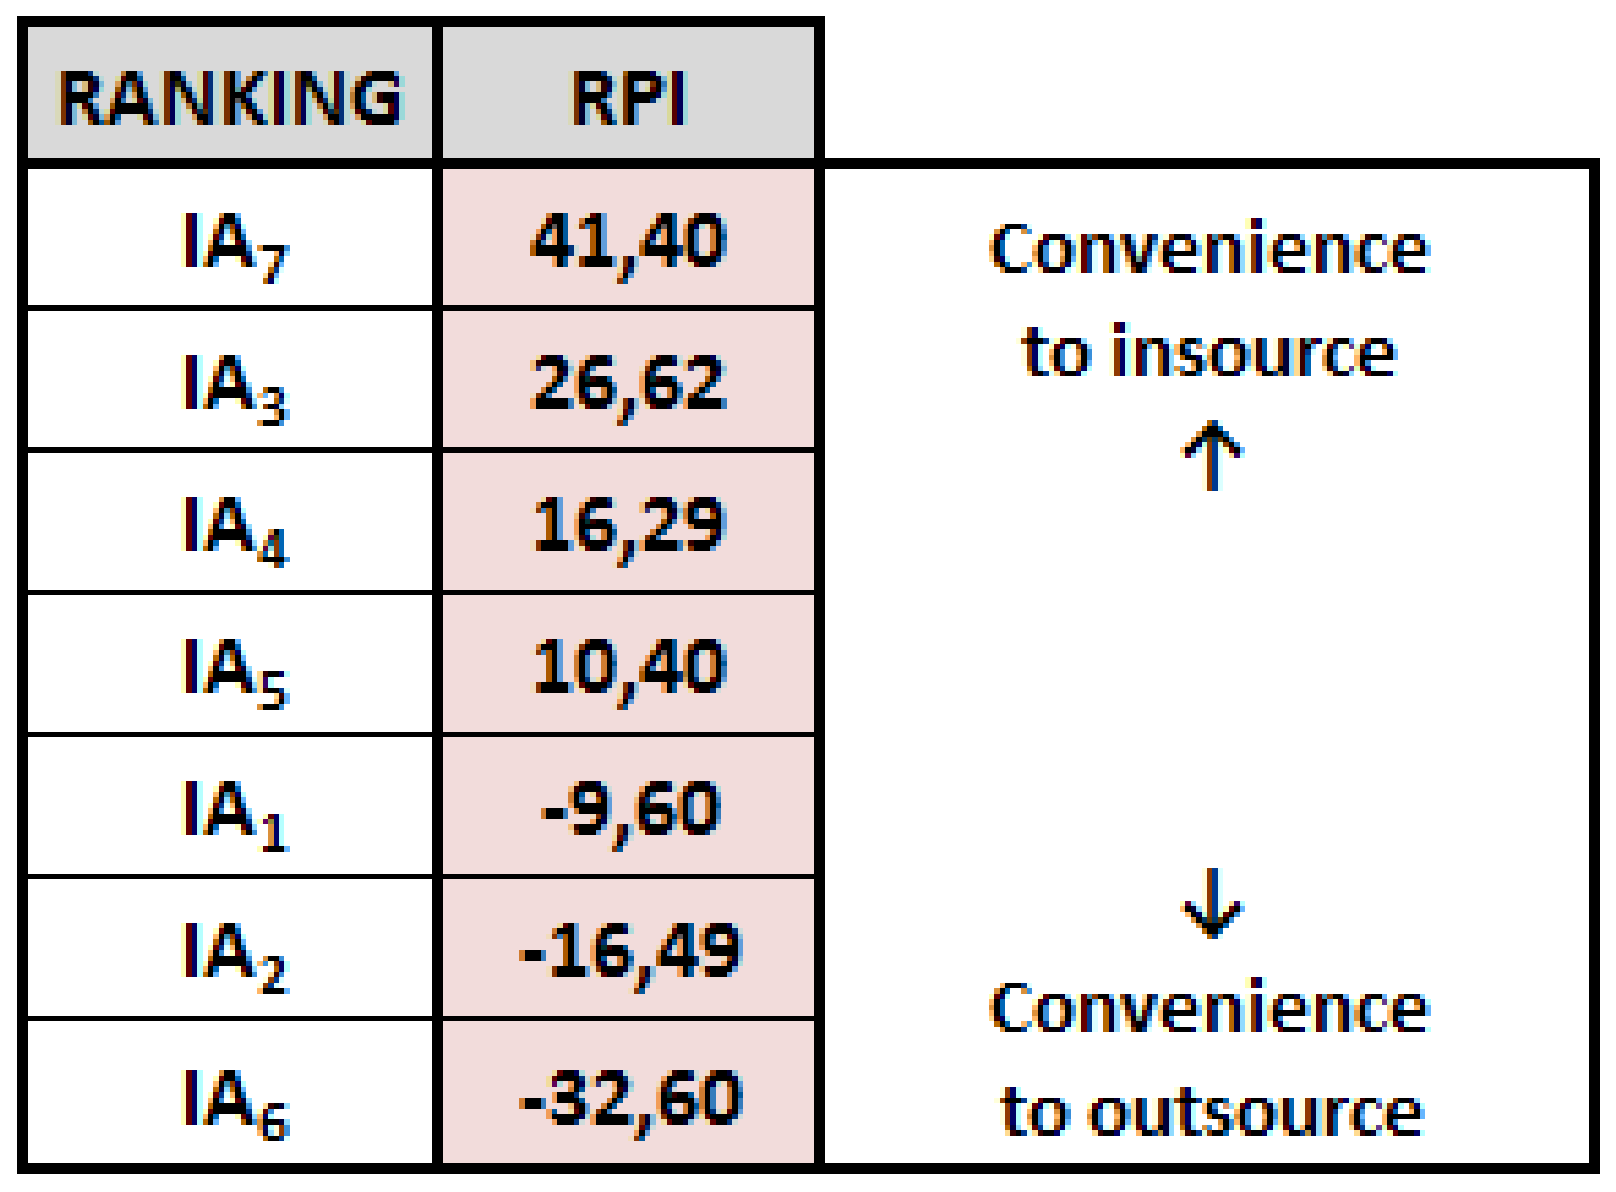
The Resource Prioritization Index (RPI) is a concise indicator, resulting from the figures populating the Scorecard, associated to each IA of the set and which allows to give them a prioritization score and consequently rank them in terms of descending convenience to keep an asset “in-house”. It is based on the algebraic sum of the three deviations between each dimension and their corresponding threshold, as in (14). They have been given an identical 1/3 weight each, so that they can moderately compensate.
At last, after reiterating the application of (14) to every IA of the set, using the resulting numbers it is possible to order the IAs and build a ranking in order to prioritize the intangible resources (example provided in Section 5): the lower the RPI is, the most convenient is to outsource that intangible resource, and vice-versa.
5. Results, Theoretical Findings, Theoretical Contributions and Workflow Outline
In order to validate its usability, the proposed prioritization methodology has been deployed on a numerical example. This calculation section is meant to illustrate the suggested workflow for an effective application. This schematic numerical description can be also helpful as a guideline for implementing this procedure on companies in real life context.
For what concerns the identification of the specific officers that could be in charge of utilizing this tool and taking advantage from the returned figures, of course it depends on the internal organization and governance policy of each company. But, it is possible to identify some key roles. Considering that the matter regarding which resources can be considered to be leveraged internally/externally seriously involves the business model of a company as a whole, surely it could be a useful tool in the hands of the strategy setters (i.e., the board committee) in the first place. Following the decisional hierarchy, the immediate outputs returned by the tool could be a valuable asset also for the business development department, as they can be relevant for identifying the opportunity-cost and the strategic roles of some asset-based activities which generate the revenue model in relationship with their cost structure. Also, in the phase of Business Process (Re)Engineering this could mean a remarkable assist, since it would factor efficacy in addition to efficiency criteria. It is quite uncommon to find, within an organization, a specific Intellectual Capital Officer/function but, if this is the case, they would benefit from the tool as well since it is designed for strategic assets, that most of the time end up being intangible ones. In addition to this, of course, the Resource Allocation Manager could benefit from its constant use, especially for double checking when comparing its results with the cost-based method. Another candidate power user of this tool is the planning & control department, and the officers in charge of management accounting functions that could utilize the deliverables produced by the tool as a criterion to be applied directly in the design and checking of cost/activity centers. About the number of the users, (whether it is targeted for a monolithic or a teamwork usage), it is again a matter of internal policy. However, the tool is open to be utilized by an individual or by a panel of contributors, by the means of several techniques (e.g., Delphi method). Furthermore, this tool could be shared all along the decision-chain above depicted, both top-down and bottom-up, to be used as a protocolled best practice, to detect gap and variations of interpretations upon the analyzed resources, depending on the level of appreciation within the company itself, so that it would collaterally be used as a tool of strategy and vision alignment.
It is divided into sub-paragraphs matching the assessment procedural scheme: the workflow is unfolded in order to help the practitioner to better budget resources and time for that. Some sub-phases are focused on the dialectic interaction between the analyst and the firm’s management via interviews, in order to reckon the knowledge base required as inputs for the workflow. Therefore, in this example, such data will be taken for granted and we will just provide the subsequent hypothetical results. The same will be done with regards to the whole AHP procedure since is it is not the primary focus of the present paper.
The task regarding how the figures populating the model are retrieved should be accomplished by simply interviewing the individuals that have to deal with those entities on a daily base: the management of the company. Indeed, the contribution coming from the “knowledge of the system” held by its experts (the management) is crucial for the assessment of its components. The simulated interview shown here is based on Likert-scale pairwise comparison questions (survey-form template in Appendix A). Last, in case of a panel of interviewees, the consistency of the process will highly benefit from the use of a gathering methodology such as the Delphi method [84].
5.1. Unit-1: Connectedness
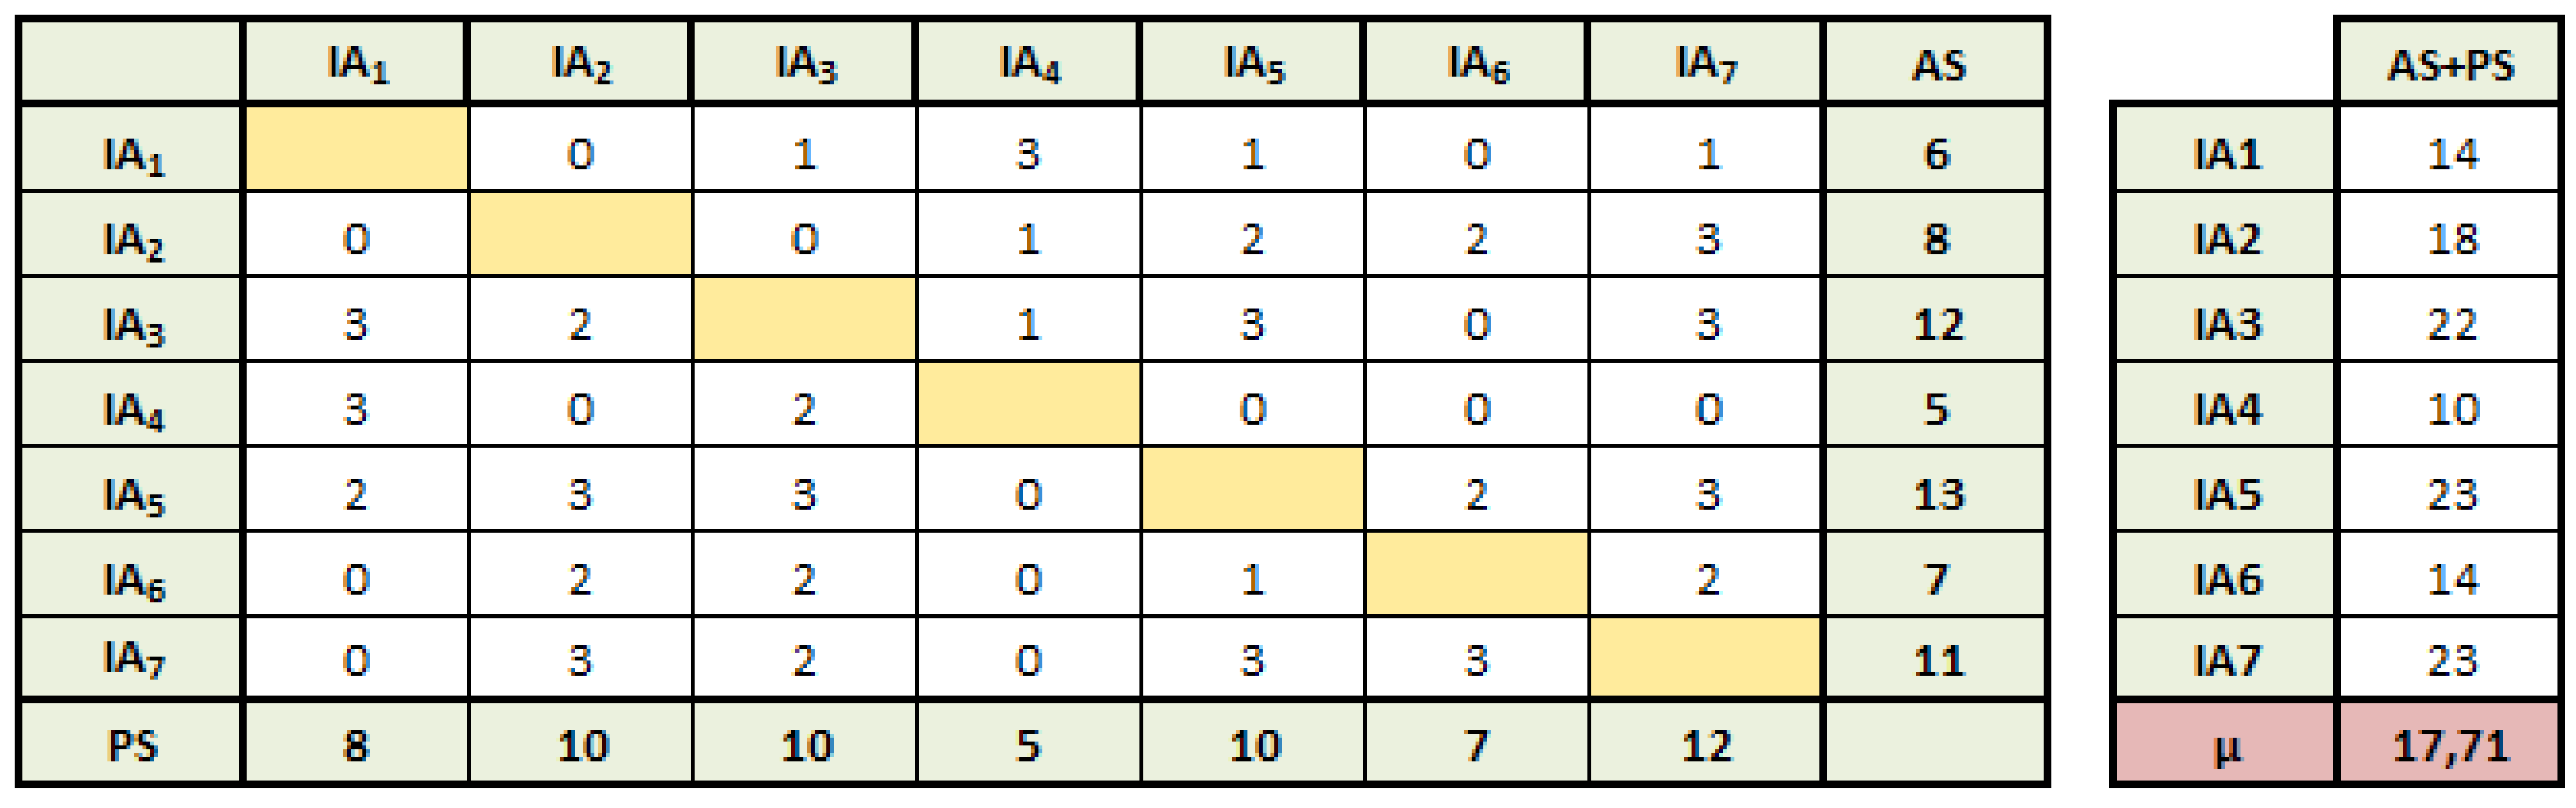
After the simulated interview, the internal cells of the Interaction Matrix are populated and the Active Sum (AS) and the Passive Sum (PS) are computed as follows. The Unit outputs are displayed in the right section of Figure 3, with the “Connectedness” parameter calculated for each IA and the Threshold Value (μ).
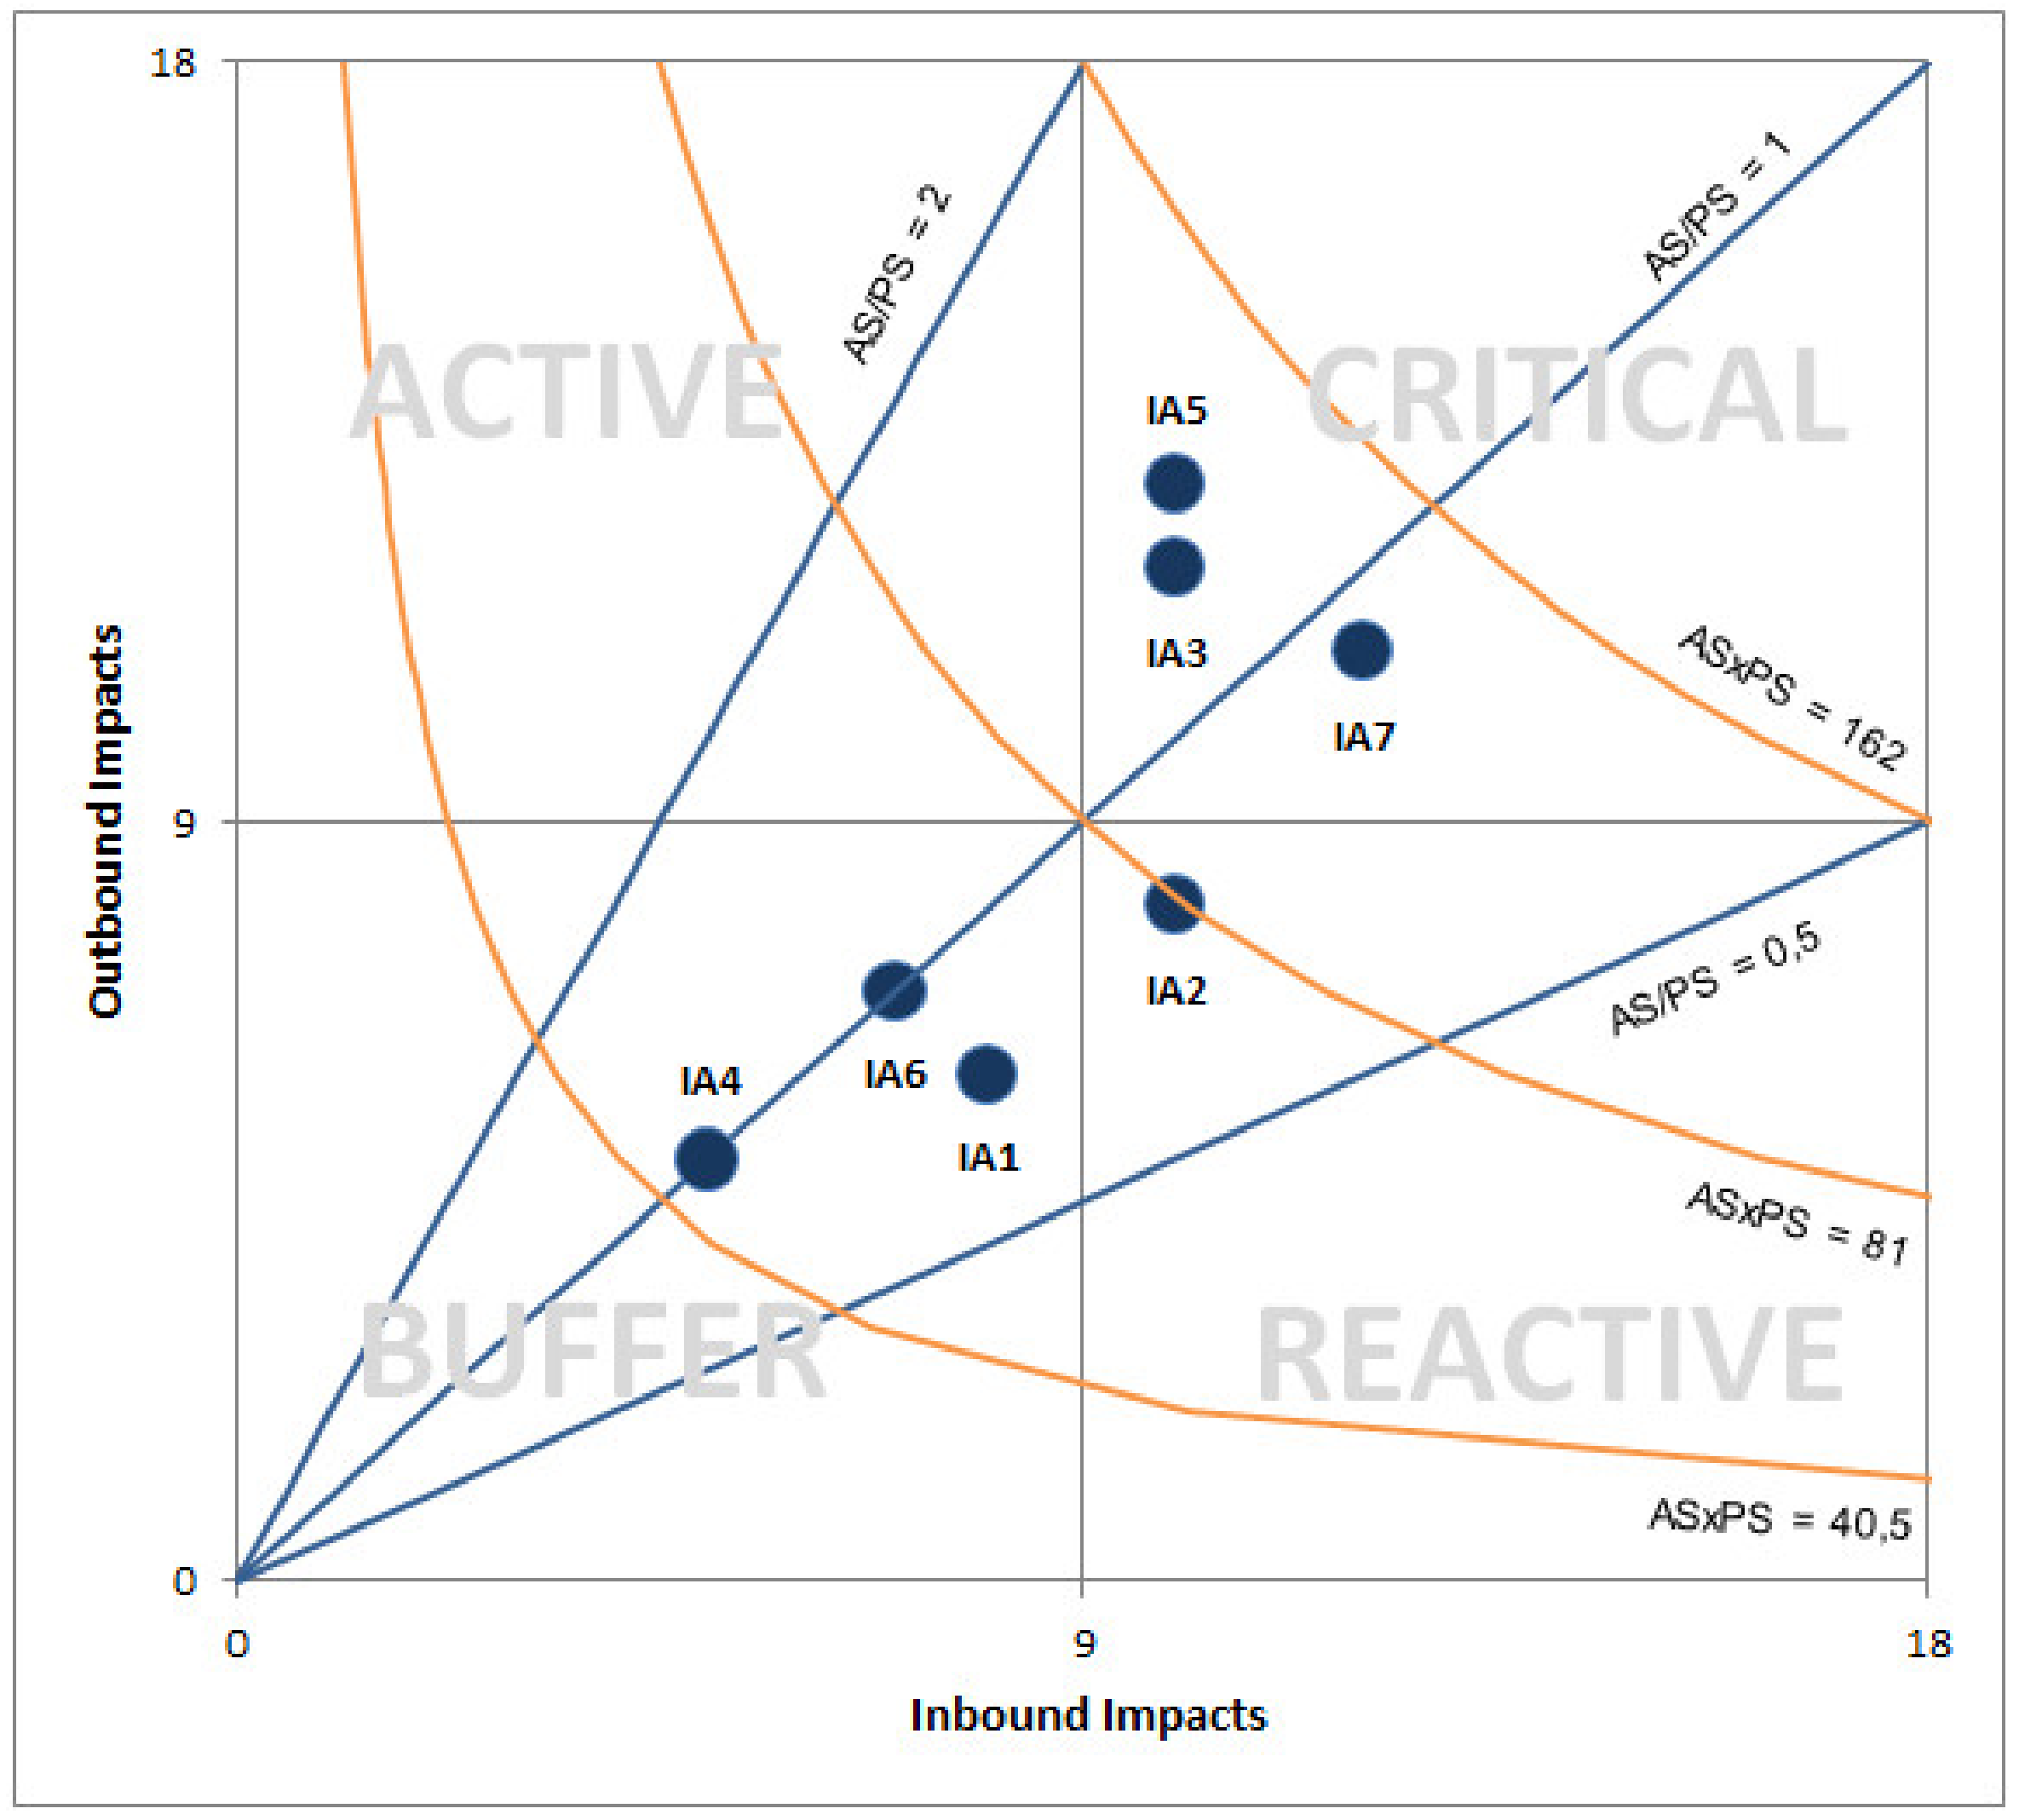
As corollary analytics for this Unit, the impacts were analyzed according to the methodology in Section 4 (Figure 4) and the Cartesian chart was plotted (Figure 5), returning valuable information about the nature of the IAs with regards to their attitude of being connected with the rest of the IA-network. Therefore, it is possible to sort them out into the homogeneous behavior-groups. Assets labelled as result 3, 5, and 7 belong to the “critical” —highly mutually interconnected—area, while 1, 4, and 6 are in the “buffer” one, characterized by minor flow-activity. IA number 2 is officially in the “reactive” quadrant, but it’s closeness to the centre reveals a neutral side-attitude.
5.2. Unit-2: Strategic Value
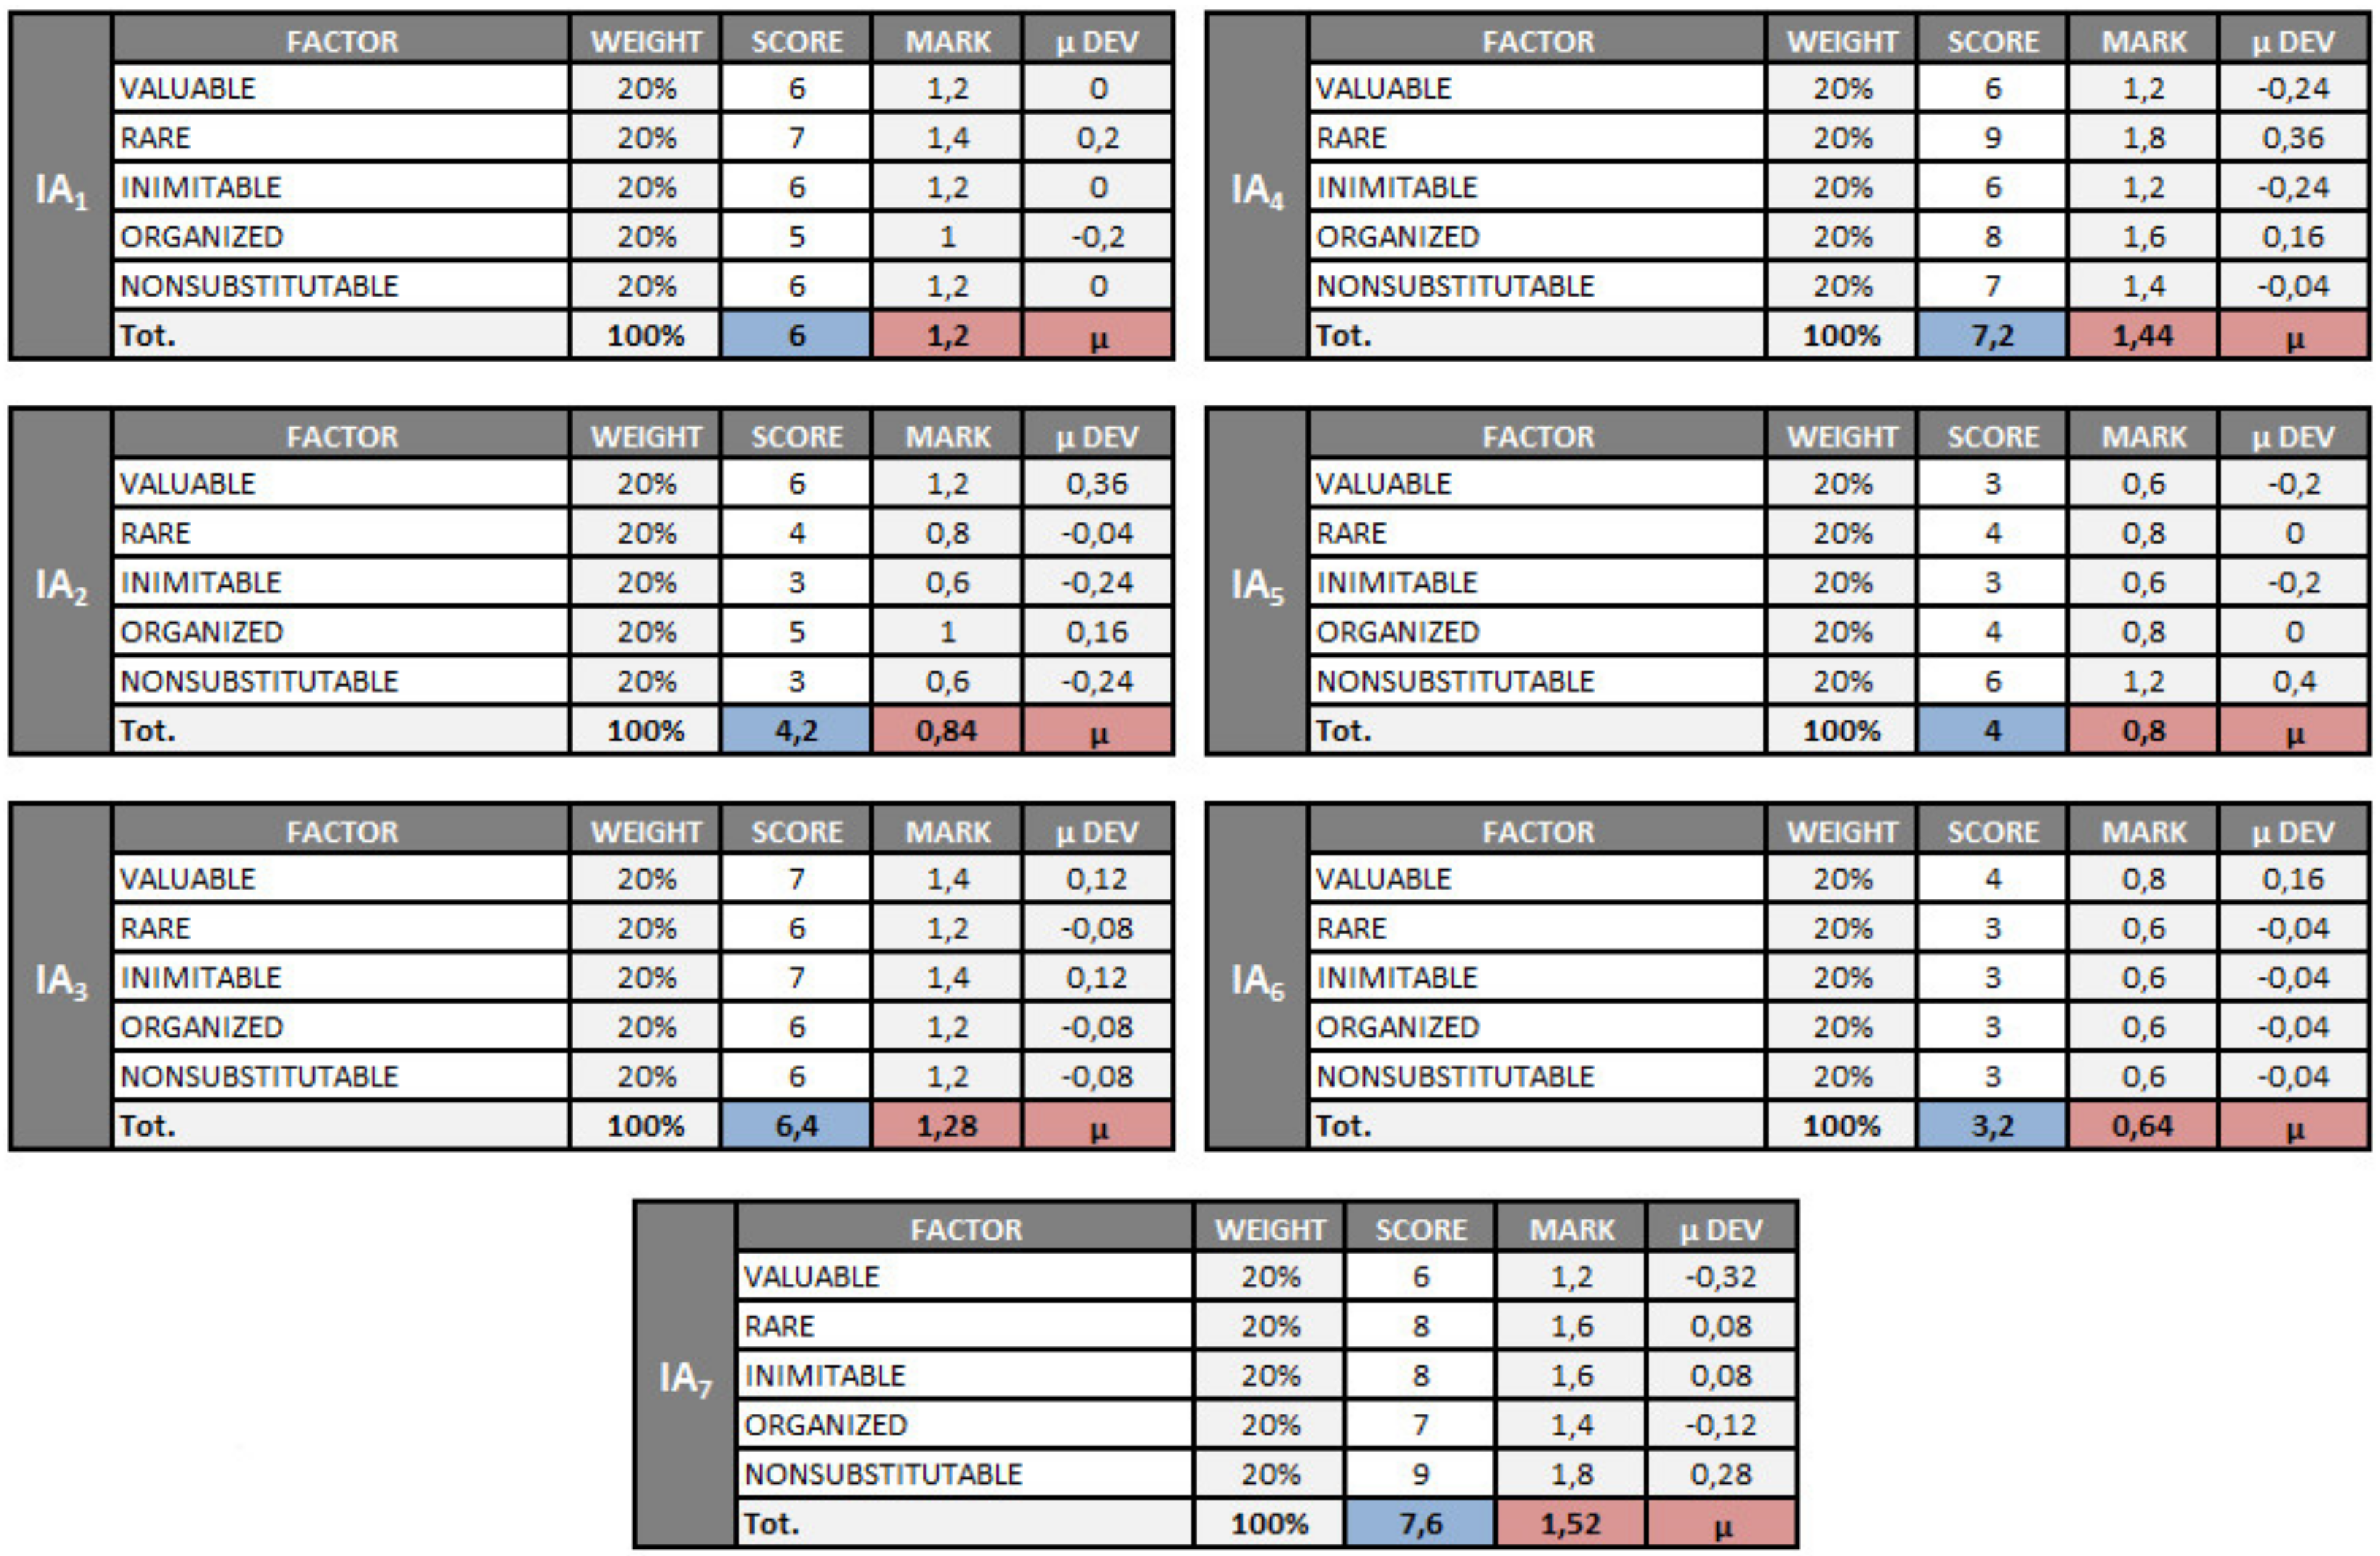
The weighted score-repartition scale of the five Factors was built using a 1/5 weight for each driver. Running the simulated interview, the direct scores were retrieved on the basis of a 1–10 scale. Individual weighted mean values (labelled as “Mark”) from the simulated interview are displayed in Figure 6, where the total “Tot. Score” represents the Strategic Value for each of the seven IAs tested (summarized in Figure 7). Figure 7 comes along with the Eccentricity indicator (labelled “μDev”) calculated as in (8). Assets #7 and #4 outperform the rest of the set, while #6 is the weakest one.
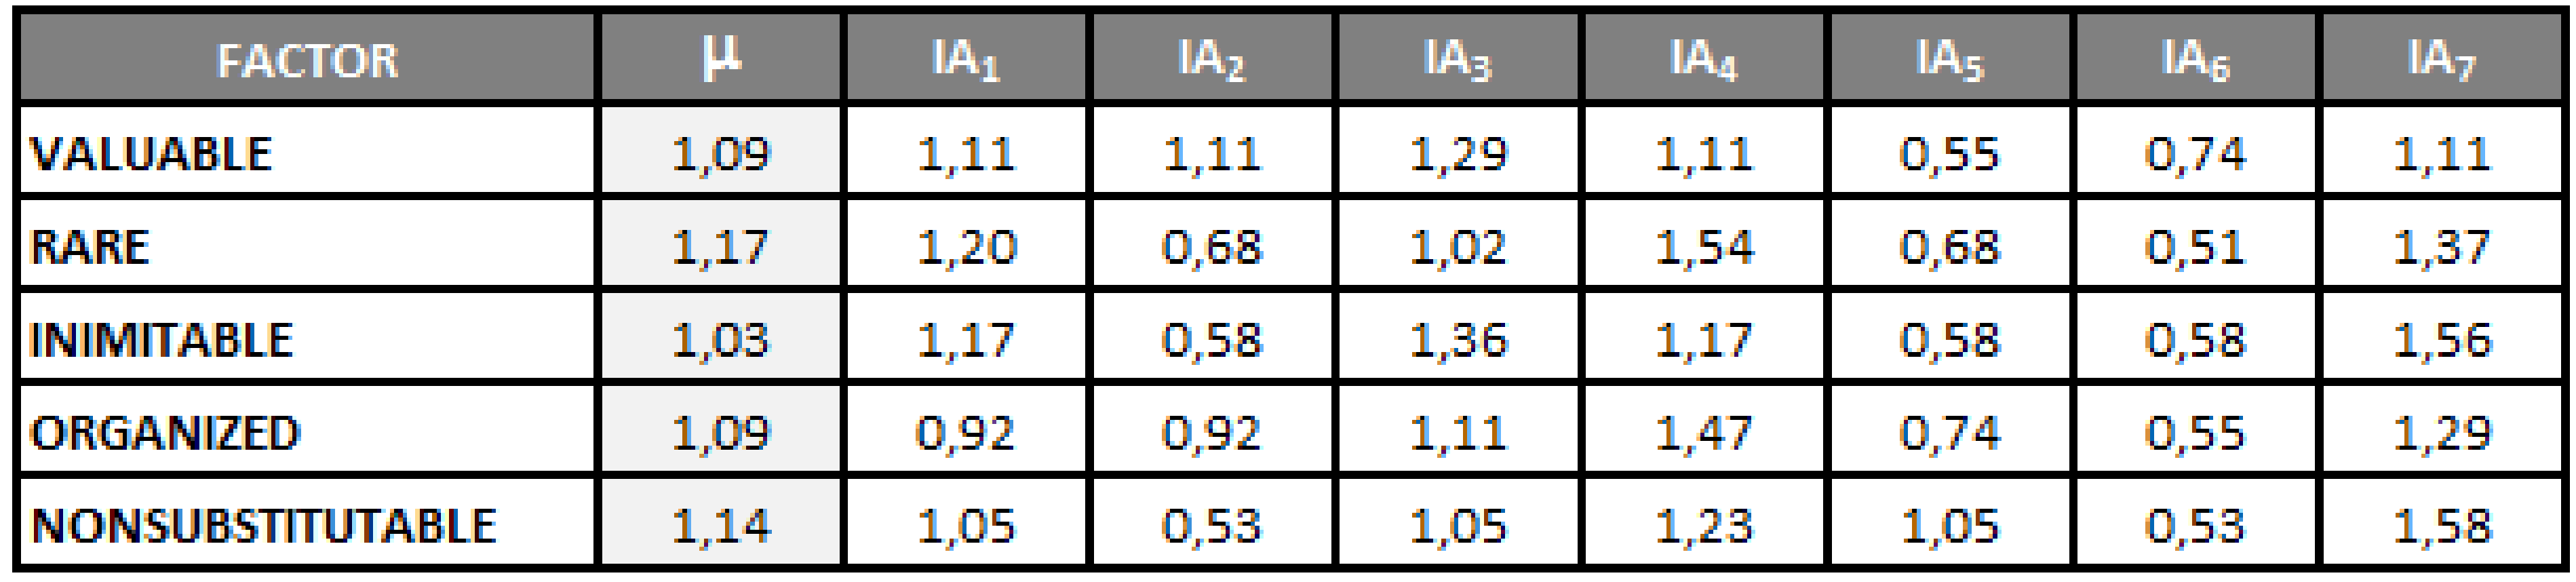
Figure 8 displays, for each IA, the values of the Ranking Indicator, calculated as in (9). In this way, it is possible to have an image of how valuable, rare, inimitable, organized, non-substitutable every IA is, compared to the whole set of intangible resources.
5.3. Unit-3: Magnitude
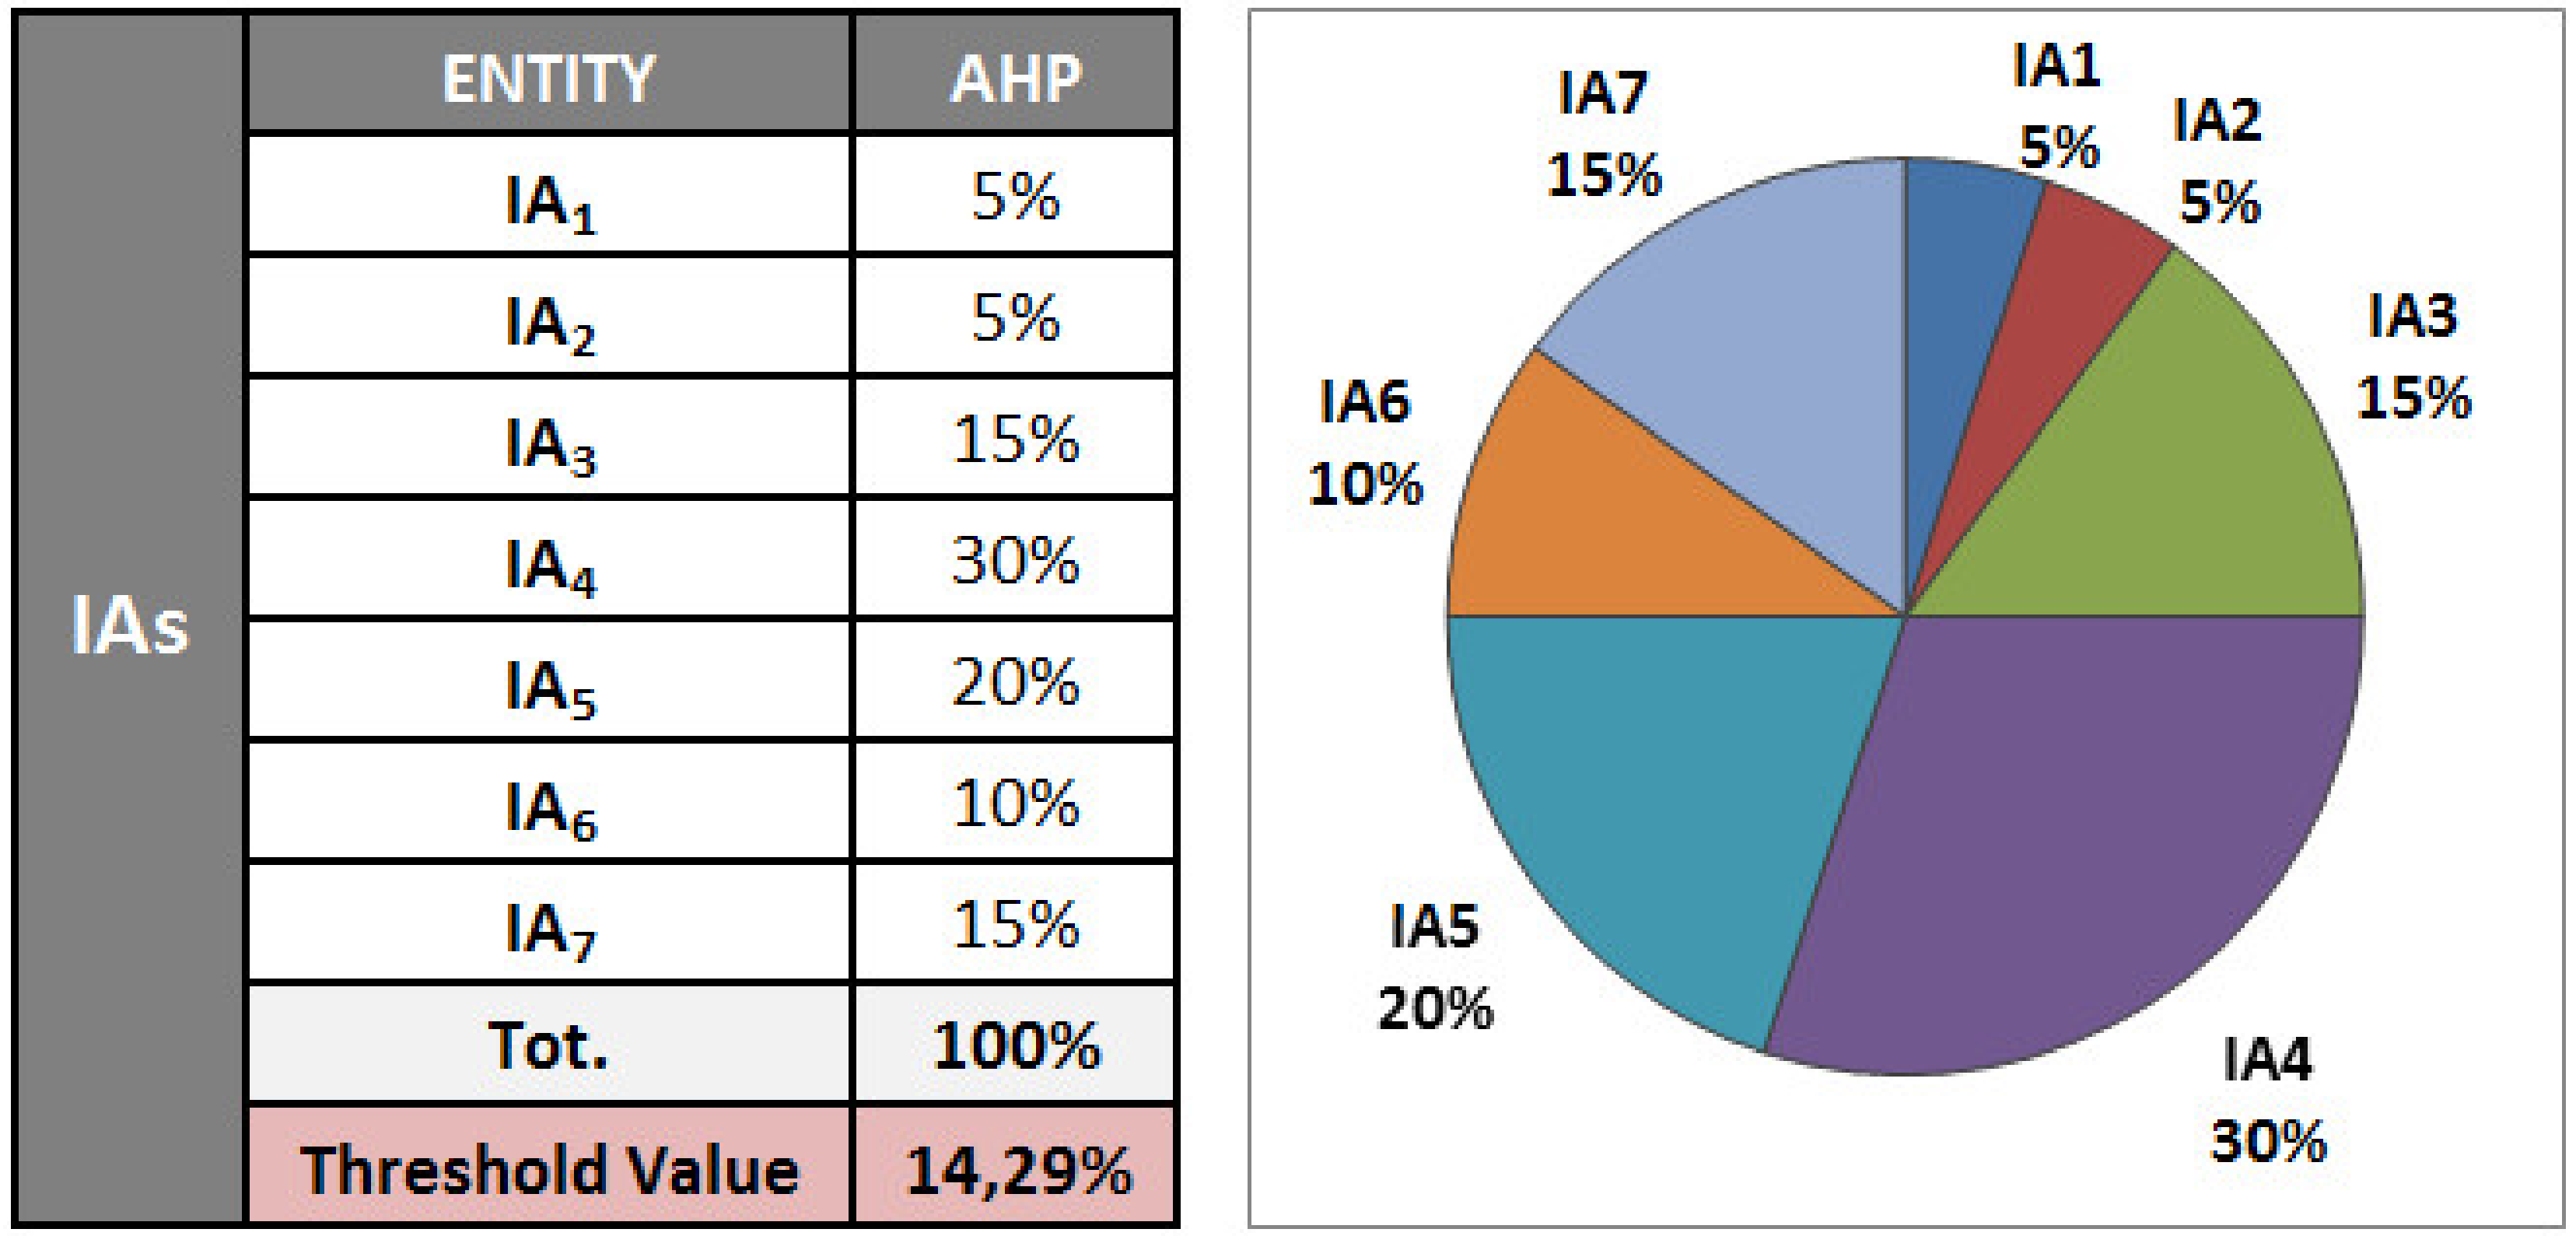
Assuming to obtain the results from the application of the AHP methodology to the interviewed panel (survey-form template in Appendix A), the simulated results—along with the calculated Threshold Value—are displayed in Figure 9 (Magnitude score for each IA is labelled “AHP”) and they will work as the third input component for the Scorecard.
5.4. Resource Prioritization Scorecard, Matrix and Index
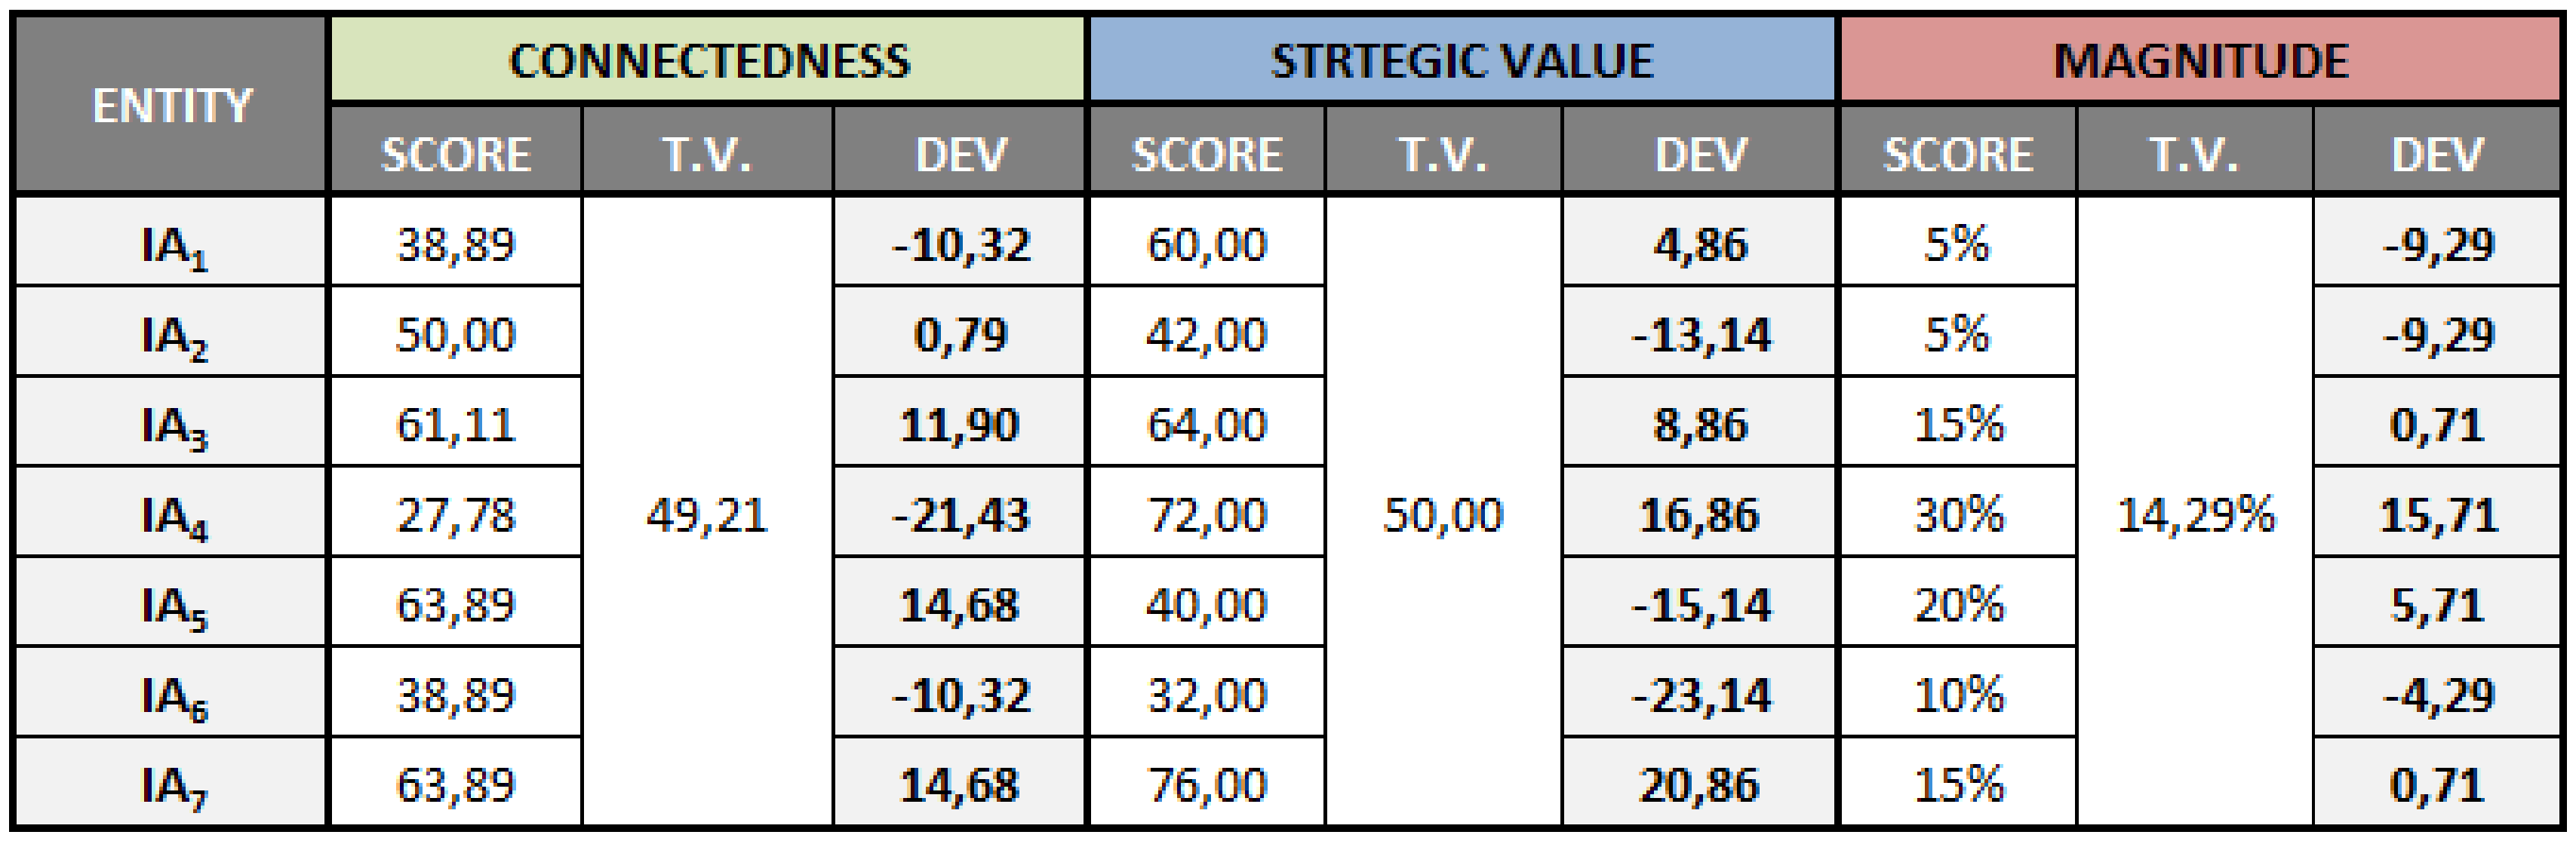
Once calculated the proportion to 100 (in order make them dimensionally comparable), as in (12), the outputs from Unit 1, 2 and 3 are then gathered into the Scorecard (Figure 10). The “Deviation” is calculated as in (13).
From the values resulting from the Scorecard, the Prioritization Matrix can now be plotted (Figure 11), as illustrated in Section 4. By the means of this tool, both the absolute and relative position of each IA can be easily detected, plus providing an instant idea of its relevance within the business process (due to the Magnitude parameter). Assets #3 and #7 are soundly located in the Insource (High-High) quadrant and apparently are the ones which are not supposed to be outsourced. Asset #6 is found in the Outsource (Low-Low) quadrant, therefore it is the first candidate for outsourcing. About asset #1 and #4, the ceteris paribus managerial consideration that could be read at first glance is that their relevant strategic value will be unleashed in the future, so fostering sustainable competitiveness. Therefore, it should be convenient to leverage and invest in them. But this could be done both internally/externally, alternatively. Therefore, a further analysis via is needed to prioritize such assets in terms of buy/make. Asset #5, due to its low level in strategic value but a high score in connectedness, reveals that a successfully outsourcing will not be an easy task for this resource. Indeed, because of the high level of its interconnections, it is soaked into the very fabric of the organization and its detachment and “transplant” into a new business reality could represent a problem and jeopardize the entire (extended) value chain. Asset #2 is a border-liner, so further analysis is required as well.
Such an acid-test is provided by the Resource Prioritization Indicator (RPI). The application of formula (14) returns the following results (Figure 12), which are eventually ranked in descending order of convenience to be kept “in house”, that is, in increasing order of outsourceability.
6. Conclusions
Sustainability requires balance. And sustainable competitive advantages are required for any entity to thrive in any type of business environment. They are based on the creation of a positive, but balanced, value differential. This so determined superior dynamic value-delta can be created through different means: in any case, by a unique blend of factors that is distinctive of every company (i.e.,: resource-based view). In so doing, it always must be grounded on some resources/capabilities dynamic combo to provide a superior or favorable long-term position over competitors. Therefore, also the prioritization policy in make/buy decisions should be seen as an evolving strategy. Aiming for an equilibrium-driven advantage that is able to be sustained by internal strategy-level prioritization and farsighted informed-choices, instead of relying only on monolithic criteria such as the “cost-delta” approach.
Every company, in the knowledge-based economy era, is destined to own and to deal with a growing mass of strategic assets. Maintaining and keeping such resources up-to-date requires economic/financial and organizational efforts at the same time. Therefore, in order to optimize business performance and organizational efficiency, it is necessary to detect (and rank out) which are the assets that can be considered actually strategic, from the ones that can be outsourced/externalized without jeopardizing the criticality of the business model and the value-creation process.
Nevertheless, in literature, both the analysis and the understanding of the intrinsic value of an IA have been not intensely explored so far, from a theoretical and a practical point of view altogether. Furthermore, managers don’t have in their toolbox any “killer-app” which can support them in make/buy decisions on such entities with regards not only to accounting balance, but to strategic alignment as well.
The goal achieved by this research is to analyze and appraise the prioritization of Strategic Assets, and IAs in particular, when an insource/outsource question pops up. In order to achieve that, it is necessary to factor the convergence of what must be considered the three key-dimensions of analysis, that are necessary to characterize the importance of any key-asset: “connectedness”, “strategic value” and “magnitude”.
With this purpose in mind, the role played by strategic assets (and intangible ones in particular) is crucial in the genesis of the intellectual capital, notably in creating sustainable competitive advantages. In fact, such sustainable competitive advantages are composed by company assets/capabilities that are difficult to clone and/or best, but also to manage and maintain for supporting a corresponding sustainable value creation in organizations. Therefore, practical tools (for monitoring, allocating, controlling, managing, etc.) like the one proposed in this paper for handling strategic and knowledge-based assets and, more widely, the portfolio of elements composing the intellectual capital, should be seen as a means to the end of promoting corporate sustainability, by supporting a competitive advantage and creating a form of value, which are sustainable over time.
For that reason, this paper proposes a framework which supports the management of a company in taking informed decisions about the allocation of such entities. This is done by the means of a solution that is designed to capture and drill out the necessary information from interlaced interviews to the management itself. Then, the procedure elaborates and combines such information properly, returning value-added meta-knowledge about the target assets.
The expected value of the proposed framework consists in the innovative way of making different key-aspects converge, providing a decisional tool integrated with visual maps and eventually returning a concise ranking indicator as deliverable output for a set of identified IAs.
As shown in the provided numerical exemplification (that can be used as a guideline for the practitioner), the deployment of the Resource Prioritization Scorecard (RPS) starts from an interview-based audit and proceeds through an analytic process which ends with a decision matrix and a prioritization indicator. This procedure returns rational and quantitative outputs and allows for a ranking of the examined resources.
Known limitations of the present paper are related to the decision of not including a business case where RPS is used in a specific make/buy decision. This choice was made because the aim of this paper was not to deliver a company-specific case-study, but to present a theoretical tool that can be used in a multiverse of situations. The numerical example is provided as an extra-section in addition to the description of the technique in order to complete the paper with a value-added explanation of an ideal workflow for the practitioner. Further research on this topic could embrace a follow-up of this methodology, possibly including a multiple-case study.
This approach could enhance managers’ understanding of the set of strategic resources of their company, returning intel that cannot be disclosed from financial statements. Furthermore, the meta-knowledge embedded in its outputs can be used for a more informed and rational resource allocation and management, investment strategy, and business development.
Author Contributions
Conceptualization, F.M.B. and M.G.; Methodology, F.M.B. and M.G.; Validation, F.M.B., L.C. and M.G.; Formal Analysis, F.M.B.; Investigation, F.M.B. and M.G.; Data Curation, F.M.B.; Writing-Original Draft Preparation, F.M.B. and M.G.; Writing-Review & Editing, F.M.B. and M.G.; Visualization, F.M.B.; Supervision, L.C. and M.G.
Funding
This research received no external funding.
Conflicts of Interest
The authors declare no conflict of interest.
Appendix A
Unit-1: Connectedness
Questions for each IAi (Figure A1.): How does IAi impact on IAj?(horizontal); How does IAi is impacted by IAj?(vertical)
Figure A1.
Pairwise comparison template for Interaction Matrix

Unit-2: Strategic Value
Assessment for each IAi (Figure A2.)
Figure A2.
Strategic value assessment template

- (1)
- Chose a weight for the five strategic Factors for each resource (IAi) to be tested
- (2)
- Provide a score for all of them and calculate the resulting mark
- (3)
- Calculate the weighted mean and the deviation for each Factor
Unit-3: Magnitude
Question for each IAi (Figure A3.): How much is IAi important/relevant/critical compared to IAj?
Figure A3.
Strategic value assessment template.

References
- Chalos, P. Costing, control and strategic analysis in outsourcing decisions. J. Cost Manag. 1995, 8(4), 31–37. [Google Scholar]
- Arend, M. Survey Gauges CIOs’ Outsourcing Acumen. ABA Bank. J. 1992, 84, 86. [Google Scholar]
- Bounfour, A. Is outsourcing of intangibles a real source of competitive advantage? Int. J. Appl. Qual. Manag. 1999, 2, 127–151. [Google Scholar] [CrossRef]
- WCED (World Commission on Environment and Development). Our Common Future; Oxford University Press: Oxford, UK, 1987. [Google Scholar]
- Elkington, J. Cannibals with Forks: The Triple Bottom Line of 21st Century Business; Capstone: Oxford, UK, 1997. [Google Scholar]
- Porter, M.E. Competitive Advantage; The Free Press: New York, NY, USA, 1985; pp. 33–40. [Google Scholar]
- Mouritsen, J. Driving economic growth: Economic value added vs intellectual capital. Manag. Account. Res. 1998, 9, 461–482. [Google Scholar] [CrossRef]
- Petty, R.; Guthrie, J. Intellectual Capital Literature Review: Measurement, Reporting and Management. J. Intellect. Cap. 2000, 1, 155–176. [Google Scholar] [CrossRef]
- Roos, J.; Roos, G.; Dragonetti, N.C.; Edvisson, L. Intellectual Capital: Navigating the New Business Landscape; Macmillan Business: London, UK, 1997. [Google Scholar]
- Chaharbaghi, K. and Lynch, R. Sustainable competitive advantage: Towards a dynamic resource-based strategy. Manag. Decis. 1999, 37, 45–50. [Google Scholar] [CrossRef]
- Grant, R. Toward a knowledge-based theory of the firm. Strateg. Manag. J. 1996, 17, 109–122. [Google Scholar] [CrossRef]
- Grant, R.M. The Resource-Based Theory of Competitive Advantage: Implications for Strategy Formulation. Calif. Manag. Rev. 1991, 33, 114–135. [Google Scholar] [CrossRef]
- Hitt, M.A.; Beamish, P.; Jackson, S.; Mathieu, J. Building theoretical and empirical bridges across levels: Multilevel research in management. Acad. Manag. J. 2007, 50, 1385–1400. [Google Scholar] [CrossRef]
- Spender, J.C.; Grant, R.M. Knowledge and the firm: Overview. Strateg. Manag. J. 1996, 17, 5–9. [Google Scholar] [CrossRef]
- Pablos, P.O.D. Knowledge management projects: State of the art in the Spanish manufacturing industry International. J. Manuf. Technol. Manag. 2003, 14, 297–310. [Google Scholar] [CrossRef]
- Itami, H. Mobilizing Invisible Assets; Harvard University Press: Cambridge, MA, USA, 1987. [Google Scholar]
- McGaughey, S.L. Strategic interventions in intellectual assets flows. Acad. Manag. Rev. 2002, 27, 248–274. [Google Scholar] [CrossRef]
- Barney, J.B. Resources, capabilities, core competencies, invisible assets, and knowledge assets: Label proliferation and theory development in the field of strategic management. In The SMS Blackwell Handbook of Organizational Capabilities; Helfat, C.E., Ed.; Wiley Online Library: New York, NY, USA, 2017; pp. 422–426. [Google Scholar]
- Bontis, N.; Fitz-enz, J. Intellectual capital ROI: A causal map of human capital antecedents and consequents. J. Intellect. Cap. 2002, 3, 223–247. [Google Scholar] [CrossRef]
- Dierickx, I.; Cool, K. Asset Stock Accumulation and Sustainability of Competitive Advantage. Manag. Sci. 1989, 35, 1504–1511. [Google Scholar] [CrossRef]
- Barney, J.B.; Wright, M.; Ketchen, D.J. The resource based view of the firm: Ten years after, 1991. J. Manag. 2001, 27, 625–643. [Google Scholar] [CrossRef]
- Hall, R. The strategic analysis of intangible resources. Strateg. Manag. J. 1992, 13, 135–144. [Google Scholar] [CrossRef]
- Penrose, E.T. The Theory of Growth of the Firm; Basil Blackwell: London, UK, 1959. [Google Scholar]
- Wernerfelt, B. A Resource-based View of the Firm. Strateg. Manag. J. 1984, 5, 171–180. [Google Scholar] [CrossRef]
- Amit, R.; Schoemaker, P.J. Strategic assets and organizational rent. Strateg. Manag. J. 1993, 14, 33–46. [Google Scholar] [CrossRef]
- Conner, K.R.; Prahalad, C.K. A resource-based theory of the firm: Knowledge versus opportunism. Organ. Sci. 1996, 7, 477–501. [Google Scholar] [CrossRef]
- Peteraf, M.A. The cornerstones of competitive advantage: A resource-based view. Strateg. Manag. J. 1993, 14, 179–192. [Google Scholar] [CrossRef]
- Teece, D.J. Explicating dynamic capabilities: The nature and microfoundations of (sustainable) Enterprise performance. Strateg. Manag. J. 2007, 28, 1319–1350. [Google Scholar] [CrossRef]
- Teece, D.J. Dynamic Capabilities and Strategic Management: Organizing for Innovation and Growth; Oxford University Press: Oxford, UK, 2009. [Google Scholar]
- Barrena-Martínez, J.; López-Fernández, M.; Romero-Fernández, P.M. Impact of socially responsible human resources policies on intellectual capital. Intang. Cap. 2016, 12, 549–590. [Google Scholar] [CrossRef]
- Lytras, M.D.; Raghavan, V.; Damiani, E. Big data and data analytics research: From metaphors to value space for collective wisdom in human decision making and smart machines. Int. J. Semant. Web Inf. Syst. 2017, 13, 1–10. [Google Scholar] [CrossRef]
- Collis, D.J.; Montgomery, C.A. Competing on resources: Strategy in the 1990s. Harv. Bus. Rev. 1995, 73, 118–128. [Google Scholar]
- Andreou, A.N.; Bontis, N. A model for resource allocation using operational knowledge assets. Learn. Organ. 2007, 14, 345–374. [Google Scholar] [CrossRef]
- Battagello, F.M.; Cricelli, L.; Grimaldi, M. A 7-Step Framework (7SF) for Gauging Strategic Assets through a Flexible Format. An industrial Case Study Application. Int. J. Manag. Enterp. Dev. 2014, 13, 62–88. [Google Scholar] [CrossRef]
- Barrena-Martinez, J.; López-Fernández, M.; Romero-Fernández, P.M. The link between socially responsible human resource management and intellectual capital. Corp. Soc. Responsib. Environ. Manag. 2019, 26, 71–81. [Google Scholar] [CrossRef]
- Adler, P.; Kwon, S.-W. Social Capital: Prospects for a New Concept. Acad. Manag. Rev. 2002, 27, 17–40. [Google Scholar] [CrossRef]
- Perrini, F. SMEs and CSR theory: Evidence and implications from an Italian perspective. J. Bus. Ethics 2006, 67, 305–316. [Google Scholar] [CrossRef]
- Davenport, T.H.; Prusak, L. Working Knowledge: How Organizations Manage What They Know; Harvard Business School Press: Boston, FL, USA, 1998. [Google Scholar]
- Prahalad, C.K.; Hamel, G. The core competence of the corporation. Harv. Bus. Rev. 1990, 68, 79–91. [Google Scholar]
- Marr, B. Perspectives on Intellectual Capital; Elsevier Inc.: Atlanta, GA, USA, 2005. [Google Scholar]
- Nahapiet, J.; Goshal, S. Social capital, intellectual capital, and the organizational advantage. Acad. Manag. Rev. 1998, 23, 242–266. [Google Scholar] [CrossRef]
- Teece, D.J. Capturing value from knowledge assets: The new economy, markets for know-how, and intangibles assets. Calif. Manag. Rev. 1998, 40, 55–79. [Google Scholar] [CrossRef]
- Massaro, M.; Dumay, J.; Garlatti, A.; Dal Mas, F. Practitioners’ views on intellectual capital and sustainability: From a performance-based to a worth-based perspective. J. Intellect. Cap. 2018, 19, 367–386. [Google Scholar] [CrossRef]
- Quinn, J.B.; Himler, F.B. Strategic outsourcing. Sloan Manag. Rev. 1994, 35, 43–55. [Google Scholar]
- Battagello, F.M.; Cricelli, L.; Grimaldi, M. The quest for unbiased rating of the Intellectual Capital: Value-Based Analytical Detection and Fuzzy-Quantitative Appraisal. Introducing the Intellectual Capital Ontology ANalytics (ICOAN). Int. J. Intell. Enterp. 2014, 2, 118–141. [Google Scholar] [CrossRef]
- Bontis, N. Intellectual capital: An exploratory study that develops measures and models. Manag. Decis. 1998, 36, 63–76. [Google Scholar] [CrossRef]
- Bontis, N.; Keow, W.C.C.; Richardson, S. Intellectual capital and business performance in Malaysian industries. J. Intellect. Cap. 2000, 1, 85–100. [Google Scholar] [CrossRef]
- Bontis, N.; Dragonetti, N.C.; Jacobsen, K.; Roos, G. The knowledge toolbox: A review of the tools available to measure and to manage intangible resources. Eur. Manag. J. 1999, 17, 391–402. [Google Scholar] [CrossRef]
- Bontis, N.; Crossan, M.; Hulland, J. Managing an Organizational Learning System by Aligning Stocks and Flows. J. Manag. Stud. 2002, 39, 437–469. [Google Scholar] [CrossRef]
- Chen, J.; Zhu, Z.; Xie, H.Y. Measuring intellectual capital: A new model and empirical study. J. Intellect. Cap. 2004, 5, 195–212. [Google Scholar] [CrossRef]
- Erden, Z.; Klang, D.; Sydler, R.; von Krogh, G. Knowledge-flows and firm performance. J. Bus. Res. 2014, 67, 2777–2785. [Google Scholar] [CrossRef]
- Sullivan, P.H. Value-Driven Intellectual Capital: How to Convert Intangible Corporate Assets into Market Value; Wiley: New York, NY, USA, 2000; p. 228. [Google Scholar]
- Saaty, T.L.; Vargas, L.G.; Dellmann, K. The allocation of intangible resources: The analytic hierarchy process and linear programming. Socio-Econ. Plan. Sci. 2003, 37, 169–184. [Google Scholar] [CrossRef]
- Adner, R.; Helfat, C.E. Corporate effects and dynamic managerial capabilities. Strateg. Manag. J. 2003, 24, 1011–1025. [Google Scholar] [CrossRef]
- Eisenhardt, K.M.; Martin, J.A. Dynamic capabilities: What are they? Strateg. Manag. J. 2000, 21, 1105–1121. [Google Scholar] [CrossRef]
- Helfat, C.; Finkelstein, S.; Mitchell, W.; Peteraf, M. Dynamic Capabilities: Understanding Strategic Change in Organizations; Blackwell: Oxford, UK, 2007. [Google Scholar]
- Makadok, R. Toward a synthesis of the resource-based and dynamic-capability views of rent creation. Strateg. Manag. J. 2001, 22, 387–401. [Google Scholar] [CrossRef]
- Teece, D.J.; Pisano, G.; Shuen, A. Dynamic capabilities and strategic management. Strateg. Manag. J. 1997, 18, 509–533. [Google Scholar] [CrossRef]
- Edvinsson, L.; Sullivan, P. Developing a model for managing intellectual capital. Eur. Manag. J. 1996, 14, 356–364. [Google Scholar] [CrossRef]
- Gordon, T.J.; Hayward, H. Initial Experiments with the Cross-Impact Matrix Method of Forecasting. Futures 1968, 1, 100–116. [Google Scholar] [CrossRef]
- Weimer-Jehle, W. Cross-impact balances: A system-theoretical approach to cross-impact analysis. Technol. Forecast. Soc. Chang. 2005, 73, 334–361. [Google Scholar] [CrossRef]
- Gordon, T.J. Cross Impact Method; AC/UNV Millennium Project: Washington, DC, USA, 1994. [Google Scholar]
- Nonaka, I.; Takeuchi, H. The Knowledge-Creating Company; Oxford University Press: Oxford, UK, 1995. [Google Scholar]
- Frosini, B.V. Introduzione Alla Statistica; NIS: Rome, Italy, 1995; pp. 115–116. [Google Scholar]
- Godet, M. The Crisis in Forecasting and the Emergence of the Prospective Approach: With Case Studies in Energy and Air Transport; Pergamon Press: New York, NY, USA, 1979. [Google Scholar]
- Vester, F. Urban Systems in Crisis. Understanding and Planning Human Living Spaces: The Biocybernetic Approach; Deutsche Verlags Anstalt: Stuttgart, Germany, 1976. [Google Scholar]
- Vester, F.; Hesler, A.V. Sensitivity Model; Umlandverband Frankfurt: Frankfurt/Main, Germany, 1982. [Google Scholar]
- Cole, A.O. The Influence Matrix Methodology: A Technical Report (Rep. No. LC0506/169); Landcare Research: Palmerston North, New Zealand, 2006. [Google Scholar]
- Barney, J.B. Firm Resources and Sustained Competitive Advantage. J. Manag. 1991, 17, 99–120. [Google Scholar] [CrossRef]
- Cardeal, N.; António, N. Valuable, rare, inimitable resources and organization (VRIO) resources or valuable, rare, inimitable resources (VRI) capabilities: What leads to competitive advantage? Afr. J. Bus. Manag. 2012, 6, 10159–10170. [Google Scholar] [CrossRef]
- Wang, C.L.; Ahmed, P.K. Dynamic capabilities: A review and research agenda. Int. J. Manag. Rev. 2007, 9, 31–51. [Google Scholar] [CrossRef]
- Miller, D.; Shamsie, J. The resource-based view of the firm in two environments: The Hollywood firm studios from 1936 to 1965. Acad. Manag. J. 1996, 39, 519–543. [Google Scholar]
- Conner, K.R. A Historical Comparison of Resource-Based View and Five Schools of Thought within Industrial Organization Economics: Do We Have a New Theory of the Firm? J. Manag. 1991, 17, 121–154. [Google Scholar]
- Mahoney, J.T.; Pandian, J.R. The Resource-Based View Within the Conversation of Strategic Management. Strateg. Manag. J. 1992, 15, 363–380. [Google Scholar] [CrossRef]
- Barney, J.B.; Zajac, E.J. Competitive organizational behavior: Toward an organizationally-based theory of competitive advantage. Strateg. Manag. J. 1994, 15, 5–9. [Google Scholar] [CrossRef]
- Vergne, J.P.; Durand, R. The path of most persistence: An evolutionary perspective on path dependence and dynamic capabilities. Organ. Stud. 2011, 32, 365–382. [Google Scholar] [CrossRef]
- Reed, R.; DeFillipi, R.J. Causal ambiguity, barriers to imitation, and sustainable competitive advantage. Acad. Manag. Rev. 1990, 15, 88–102. [Google Scholar] [CrossRef]
- Wills-Johnson, N. The networked firm: A framework for RBV. J. Manag. Dev. 2008, 27, 214–224. [Google Scholar] [CrossRef]
- Barney, J.B. Strategic Factor Markets: Expectations, Luck and Business Strategy. Manag. Sci. 1986, 32, 1231–1241. [Google Scholar] [CrossRef]
- Pan, S.L.; Tan, B.C.C.; Huang, J.; Poulsen, B. The development paths of non-strategic capabilities. Eur. Manag. J. 2007, 25, 344–358. [Google Scholar] [CrossRef]
- Axtle-Ortiz, M.A. Perceiving the value of intangible assets in context. J. Bus. Res. 2013, 66, 3–417. [Google Scholar] [CrossRef]
- De Bono, E. Parallel Thinking; Viking: London, UK, 1994. [Google Scholar]
- Saaty, T.L. The analytic hierarchy and analytic network measurement processes: Applications to decisions under Risk. Eur. J. Pure Appl. Math. 2008, 1, 122–196. [Google Scholar]
- Chu, H.; Hwang, G. A Delphi-based approach to developing expert systems with the cooperation of multiple experts. Expert Syst. Appl. 2008, 34, 2826–2840. [Google Scholar] [CrossRef]
Figure 1.
The Connectedness Matrix, highlighting behavioural-type quadrants.

Figure 2.
The Resource Prioritization Matrix.

Figure 3.
The Interaction Matrix and Unit-1 outputs.

Figure 4.
Numerical operators applied to the Interaction Matrix.

Figure 5.
The Connectedness Chart.

Figure 6.
Calculating Unit-2 middle-outputs.

Figure 7.
Graphic view of the Strategic Value Eccentricity and Unit-2 calculated outputs.

Figure 8.
Strategic Value—Ranking Indicators.

Figure 9.
Magnitude results from AHP simulation.

Figure 10.
The Resource Prioritization Scorecard.

Figure 11.
The resource prioritization matrix.

Figure 12.
The final ranking of IAs based on the Resource Prioritization Index.


Table 1.
Phase-overview of prioritization procedure.
| Unit | Name | Description | Outputs/Indicators |
|---|---|---|---|
| 1 | Connectedness |
|
|
| 2 | Strategic Value |
|
|
| 3 | Magnitude |
|
|
| Resource Prioritization Scorecard |
|
| |
Table 2.
Numerical operators used for grouping the intangible assets (IAs) into the behavioural types.
Table 2.
Numerical operators used for grouping the intangible assets (IAs) into the behavioural types.
| OPERATOR | FUNCTION |
|---|---|
| AS-PS | Helps discriminate between “buffer/critical” and “active/reactive” IAs with intermediate passive and active sum scores. The closer to zero, the more “critical” or “buffer” an IA tends to be. The higher, the more “active” or “reactive” it tends to be. |
| AS/PS | Sorts out IAs in “active” and “reactive” ones. High quotients indicate a supremacy of outbound impacts, what makes the asset’s behavior “active”. And vice-versa. |
| ASxPS | Identifies whether an IA is “critical” or “buffer”. Higher scores indicate that the asset has both an outbound and inbound activity, so profiling it as “critical”. And vice-versa. |
Table 3.
Strategic Factors required by the Resource-Based View (RBV) and the Dynamic Capabilities (DC) theory.
Table 3.
Strategic Factors required by the Resource-Based View (RBV) and the Dynamic Capabilities (DC) theory.
| Name | Description |
|---|---|
| Valuable |
|
| Rare |
|
| Inimitable |
|
| Non-substitutable |
|
| Organized |
|
Table 4.
Populating the Resource Prioritization Scorecard with formulas from Unit 1, 2, 3.
| ENTITY | CONNECTEDNESS | STRATEGIC VALUE | MAGNITUDE | ||||||
|---|---|---|---|---|---|---|---|---|---|
| SCORE | THRESHOLD | DEVIATION | SCORE | THRESHOLD | DEVIATION | SCORE | THRESHOLD | DEVIATION | |
| IAx | (4) * | (5) * | (4) *—(5) * | (6) * | (7) * | (6) *—(7) * | (10) | (11) | (10)—(11) |
NOTES: * normalized values for Unit-1 and Unit-2, by the means of (12)
© 2019 by the authors. Licensee MDPI, Basel, Switzerland. This article is an open access article distributed under the terms and conditions of the Creative Commons Attribution (CC BY) license (http://creativecommons.org/licenses/by/4.0/).
Share and Cite
MDPI and ACS Style
Battagello, F.M.; Cricelli, L.; Grimaldi, M. Prioritization of Strategic Intangible Assets in Make/Buy Decisions. Sustainability 2019, 11, 1267. https://0-doi-org.brum.beds.ac.uk/10.3390/su11051267
AMA Style
Battagello FM, Cricelli L, Grimaldi M. Prioritization of Strategic Intangible Assets in Make/Buy Decisions. Sustainability. 2019; 11(5):1267. https://0-doi-org.brum.beds.ac.uk/10.3390/su11051267
Chicago/Turabian StyleBattagello, Franco Maria, Livio Cricelli, and Michele Grimaldi. 2019. "Prioritization of Strategic Intangible Assets in Make/Buy Decisions" Sustainability 11, no. 5: 1267. https://0-doi-org.brum.beds.ac.uk/10.3390/su11051267
Note that from the first issue of 2016, this journal uses article numbers instead of page numbers. See further details here.