Characteristics and Forecasting of Municipal Solid Waste Generation in China

School of Management, Wuhan University of Technology, Wuhan 430070, China
*
Author to whom correspondence should be addressed.
Sustainability 2019, 11(5), 1433; https://0-doi-org.brum.beds.ac.uk/10.3390/su11051433
Submission received: 11 February 2019
/
Revised: 25 February 2019
/
Accepted: 5 March 2019
/
Published: 8 March 2019
(This article belongs to the Collection Trends in Municipal Solid Waste Management)
Abstract
:The clear understanding of characteristics and trends of solid waste generation is essential for the optimization of waste collection and treatment systems. Taking 651 cities in China as a sample, this study adopts correlation analysis and the Q-type clustering model to explore the characteristics and general trends of solid waste generation (SWG) of five cities of different scale from 2007 to 2016. The results show that the trends of average amount and the annual per capita SWG are diversified in cities of different scale. The permanent residents and regional GDP have prominent impacts on SWG in large cities, megacities, and super megacities compared to those from small and medium-sized cities. The urban area is highly correlated with the SWG of all cities. Nearly one third of cities are characterized by high population density, high economic growth and low SWG. Furthermore, the factor models are developed to forecast the amount of SWG, which have a descriptive capacity of 96%, 95.4%, 92.6%, and 84.2% for the overall cities, large cities, medium-sized cities and small cities respectively.
1. Introduction
Municipal solid waste (MSW) is one of the main byproducts of urban life. Approximately 3.5 million tons of MSW is generated daily on a global scale [1]. Improper management of MSW would lead to dioxin contamination and other environmental and inhabitant health hazards [2,3,4,5,6,7,8,9]. Chinese cities are facing the serious challenge of MSW management with rapid economic growth and urbanization [10,11]. In 2016, the total delivery amount of municipal solid waste reached 203.62 million tons, an increase of 33.83 percent compared to ten years ago [12]. The disposal of MSW has been the major concern in urban environmental governance. Many laws, regulations, and policies have been formulated in recent years in China, such as Measures for Management of Municipal Solid Waste issued by Ministry of Housing and Urban-rural Development of the People’s Republic of China (MOHURD) in 2007, Environmental Protection Law of the People’s Republic of China revised in 2014, the 13th Five-year Planning for the Construction of Harmless Disposal Facilities for Municipal Solid Waste proposed by the National Development and Reform Commission (NDRC) in 2016, and the State Directory of Dangerous Wastes (edition of 2016) released by the Ministry of Environmental Protection of China (MEP) in 2017. The clear understanding of characteristics and trends of solid waste generation is the base for the estimation of the amount of municipal solid waste generation (MSWG), which is the fundamental step for the design and optimization of waste collection and treatment system in terms of the additional costs and environmental impacts [13,14].
A huge range of researches have analyzed the generation of MSW and the relationship with social [15,16], economic [17,18], demographic [19,20], and geographic factors [9,21]. A number of studies have explored the characteristics of MSWG in China. Xu et al. [22] found that GDP, per capita disposable income, tourist number, urbanization rate, annual average temperature, family characteristics and city scale had direct impact on MSWG in Xiamen. The overall effect of city scale was significantly greater than any other factors. Zhao et al. [23] found that population, regional GDP, land area, per capita disposable income, and per capita emission expenditure affected MSWG. Kong et al. [11] built a spatial and temporal dynamic pattern model to analyze the characteristics of 30 provinces and municipalities in China from 2006 to 2014. Han and Zhang [24] explored the impact of the program of MSW source-separated collection on MSWG in China. Song et al. [25] took Beijing as an example to discuss the social cost of SWG and found that the social cost of the MSWG was huge but the majority was concealed due to lack of specific discharge standard and health risk evaluation on the hazardous pollutants in China. Leaksmy Chhay et al. [26] investigated the influential socioeconomic factors on Chinese MSWG and found that GDP, urban population, energy consumption, and geographical location were significant elements. Some research has noticed the impacts of city scale on MSW. Miriam et. al. [17] found that cities with a population of more than 50,000 in Spain generated greater MSW, while certain socio-economic variables (such as people and possession of cars) reduced MSWG.
A large number of relevant models to predict the amount of MSWG can be broadly classified into the following categories: regression models [27,28,29], material flow model [10,30], grey model [31,32], support vector machine [33], time series models [29] and artificial intelligence models including artificial neural network [34], fuzzy logic [35] and genetic algorithms [26]. Among them, factor models or regression models are the most popular due to their well-developed theory and ability to identify the relationships among different influential factors with SWG [15].
Overall, existing studies have mainly focused on a specific city or region in China, and there is a lack of detailed studies on the trends of the MSWG on the national scale. There is still no relevant research on the characteristics and prediction of SWG in cities of different scale although the relationship between city scale and MSWG has drawn the attention of researchers. This study takes 651 Chinese cities as samples and analyzes the status quo and trend of MSWG in cities of different scale from 2007 to 2016 by transverse and vertical comparisons. Then, correlation analysis and Q-type clustering are conducted to identify the general features of MSWG. Based on the features of SWG in cities of different scale, the factor model is developed to forecast MSWG.
2. Material and Methods
2.1. The Status Quo of SWG in Chinese Cities of Different Scale
There are 660 prefecture-level cities and municipalities in China in 2016. Nine cities are excluded due to unavailable data, so 651 samples are obtained. According to Notice on Adjusting the Standards for Dividing Urban Scale issued by State Council of People’s Republic of China in 2014, the 651 samples are divided into five categories, which are 160 small cities with a permanent population of less than 500,000, 264 medium cities with a permanent population of 500,000 to 1,000,000, 213 large cities with a permanent population of 1,000,000 to 5,000,000, 9 megacities with a permanent population of 5,000,000 to 10,000,000 and 5 super megacities with a permanent population of more than 10,000,000.
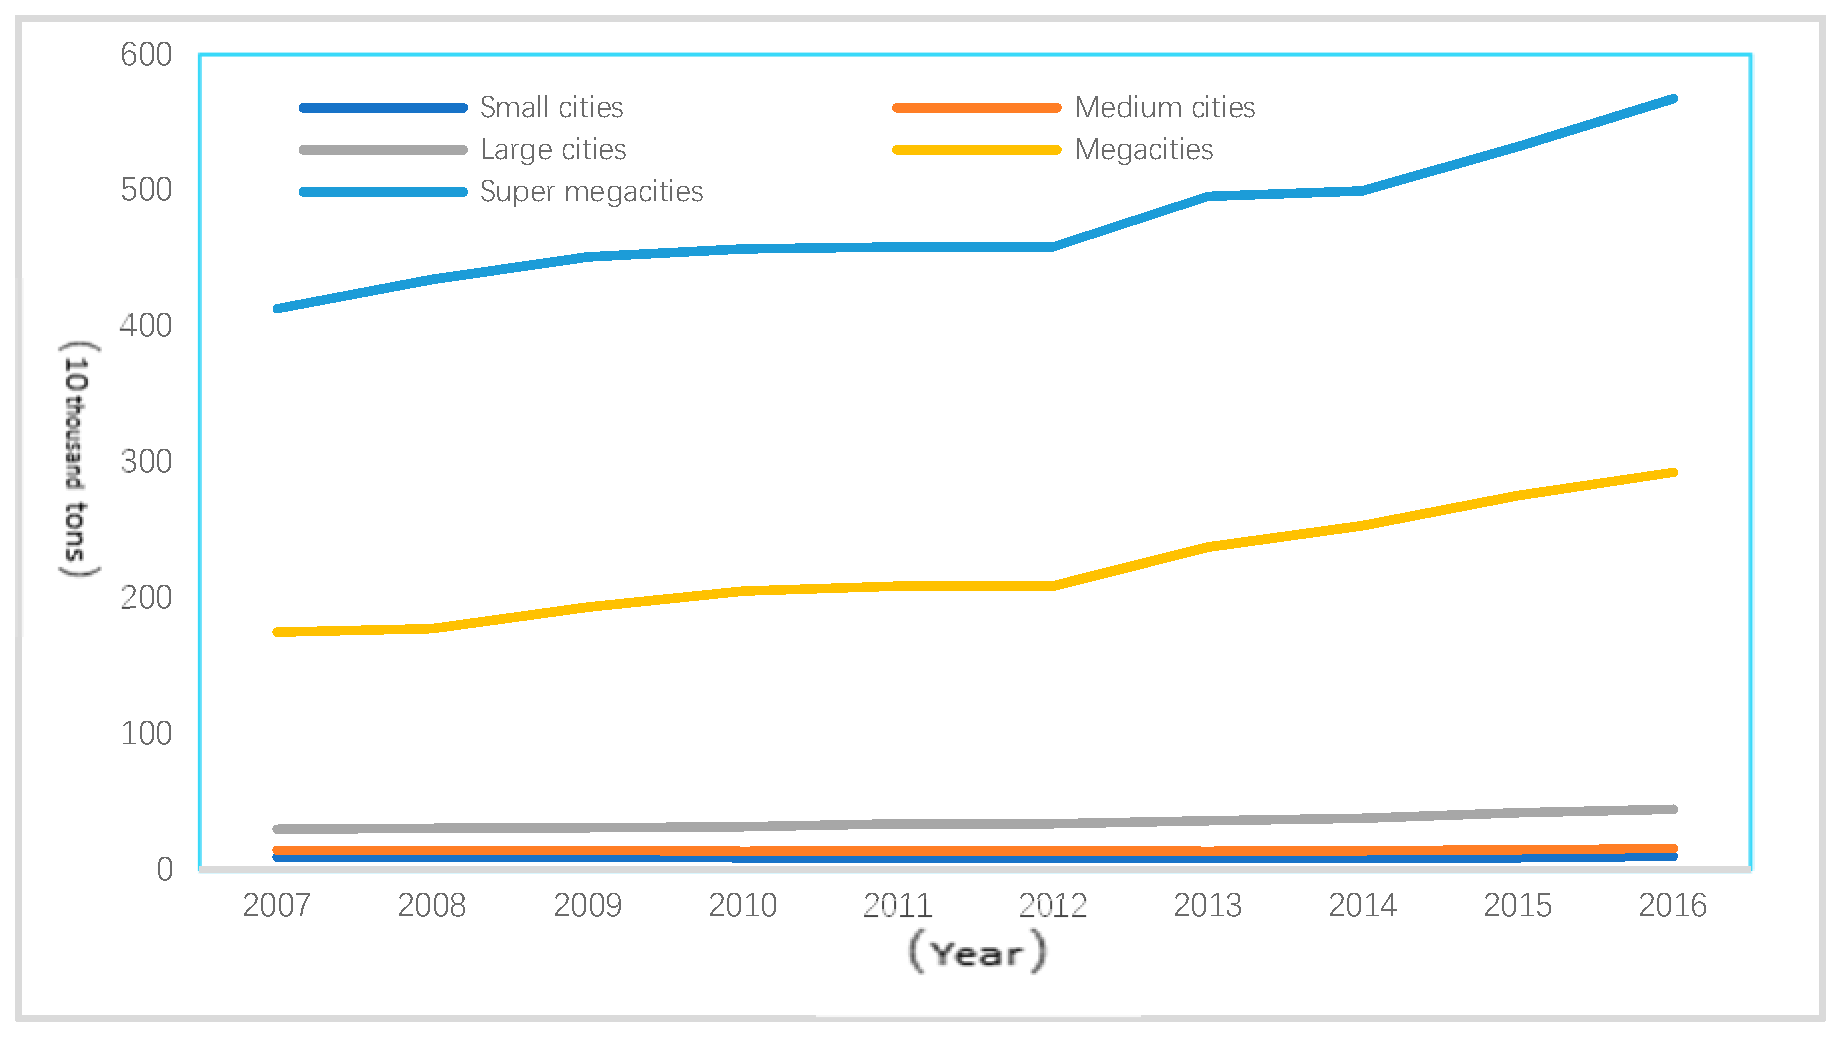
From 2007 to 2016, the amount of SWG has risen for almost all 651 cities. The annual per capita MSWG is fluctuating greatly, which indicates that the rising trend of MSWG in China is full of diversity. The average amount and annual per capita SWG varies considerably for cities of different scale, as shown in Figure 1, Figure 2, and Table 1.
For small cities, the total amount and per capita SWG are increasing during the study period, though the average and total amount remains the lowest among the cities of different scale. The annual per capita SWG is higher than that of medium and large cities. The annual average growth rate and the relative growth rate of per capita SWG are even higher than those in super megacities. The management of SWG in small cities should not be overlooked although its scale is the smallest.
For medium-sized cities, the total amount has surpassed those from megacities and super megacities because the medium-sized cities are the most predominant in China. The average and total amount of SWG has increased slightly over the years. The annual average growth rate and the relative growth rate of SWG and per capita SWG have been the least among the five sizes of cities during the study period. The relative growth rate of per capita SWG is negative in 2016. These trends indicate that the management of SWG in medium-sized cities may be the most effective.
For the 213 large cities, the total amount of SWG has been more than 40 percent of the SWG from all cities during the study period. This indicates that the majority of municipal solid waste in China is generated by large cities. The average growth rate and the relative growth rate of SWG, whether in the average level or annual per capita level, have been second to megacities during the decade. In particular, per capita SWG in 2016 increased significantly, and the growth rate far exceeds that of small cities, medium-sized cities, and megacities. It is very urgent for large cities to curb their rapidly rising trend of total SWG.
For megacities, the average growth rate, relative growth rate, and annual per capita SWG have been the highest during the study period. Obviously, this continuing upward trend endangers the regional environmental carrying capacity and becoming worse due to the huge scale of megacities. More attention should be paid to the management of SWG in megacities, and more forceful measures need to be taken to cut down the amount of SWG.
There are 5 super megacities, including Shanghai, Beijing, Shenzhen, Tianjin, and Chongqing. The total amount of MSWG has increased significantly and been far greater than that from 9 megacities. The annual per capita MSWG fluctuates sharply over the decade. The annual average growth rate and the relative growth rate of SWG, and the average growth rate of per capita SWG are positive during the decade. In 2016, the relative growth rate of per capita SWG is negative compared with ten years ago, which indicates that the annual per capita SWG is in a downward trend, though the average and total amounts are increasing in super megacities.
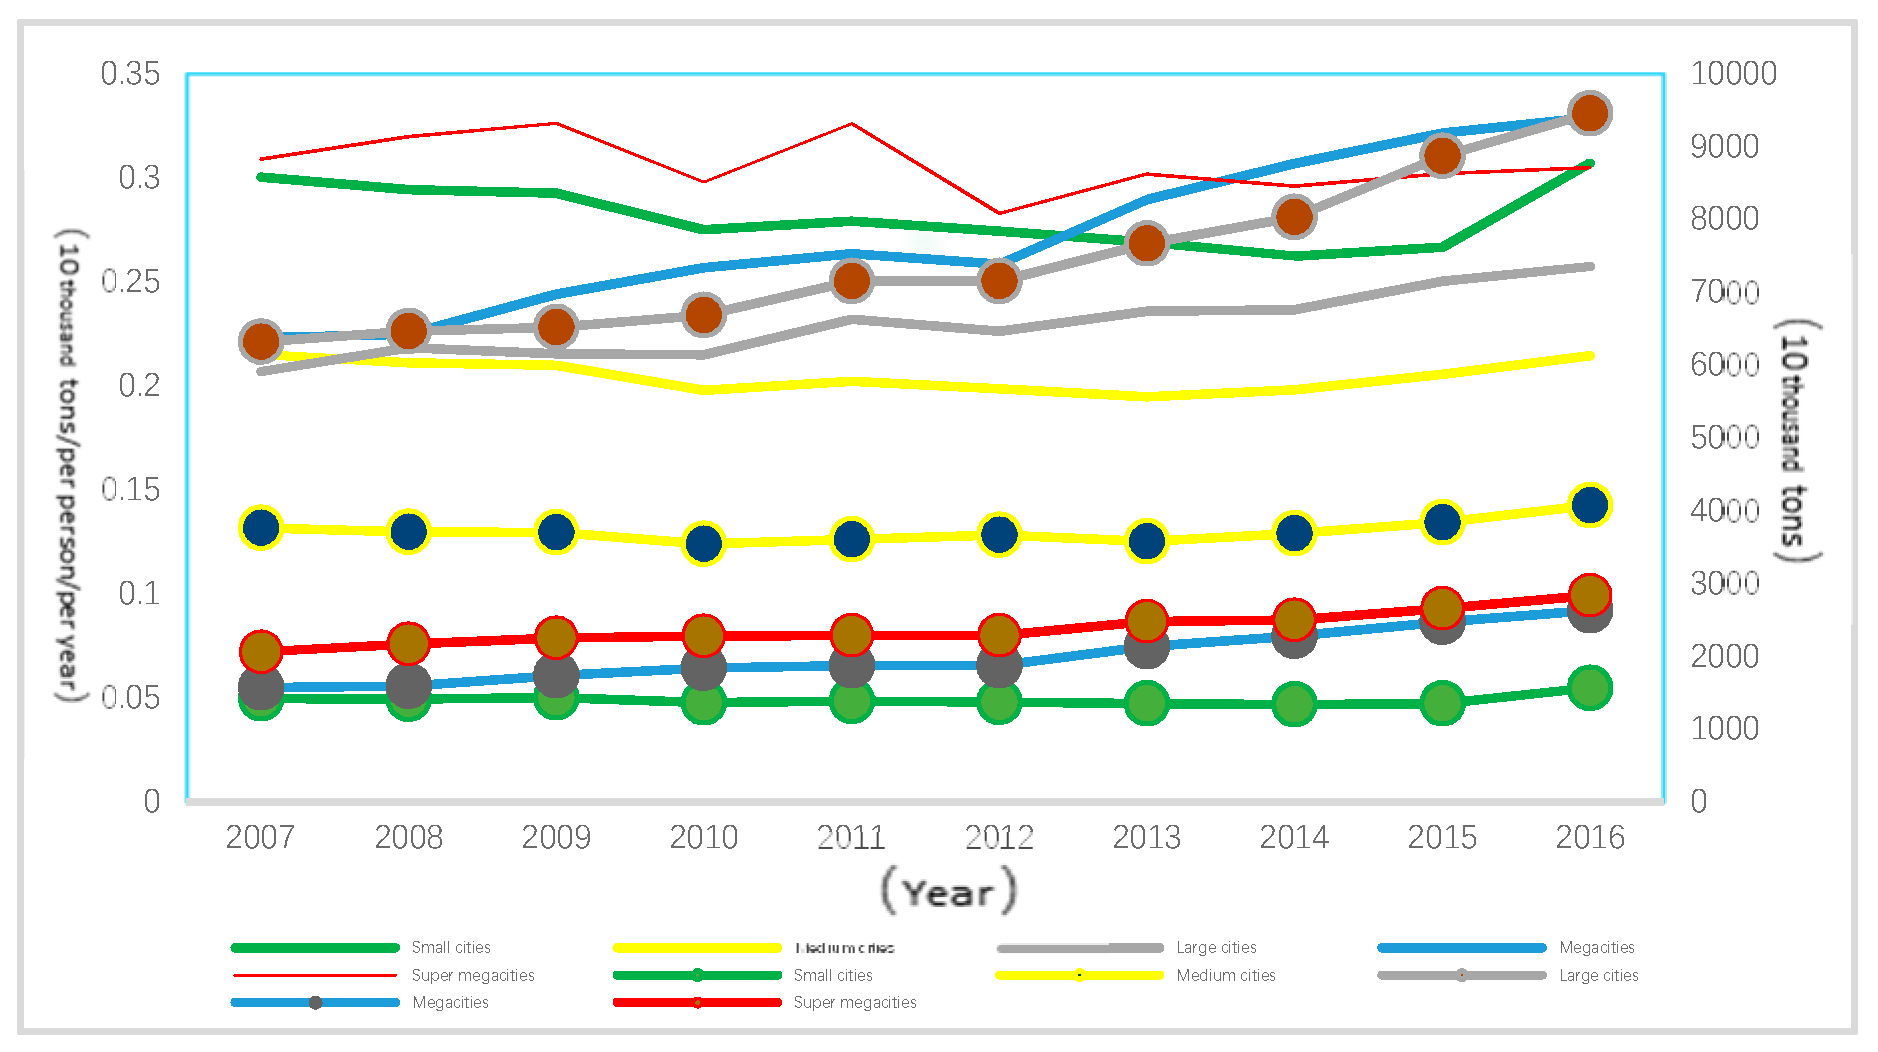
In Figure 1, the average amount of MSWG in cities of different scale is equal to the total amount of MSWG of all cities in this scale divided by the number of cities with the corresponding scale. In Figure 2, the line chart with dot mark reflects the total amount of MSWG of different cities, and the line chart without dot mark reflects the annual per capita of MSWG in cities of different scale. In order to study the dynamic characteristics of MSWG in different scales, the annual per capita MSWG of different scales are calculated by comparing the annual amount of MSWG with the number of permanent residents from 2007 to 2016. The data on MSWG, permanent residents, and urban area are derived from the Chinese Urban and Rural Construction Statistic Yearbooks from 2008 to 2017. Since the data of the amount of MSWG is not available in China, it is replaced by the delivering quantity of MSWG.
2.2. The Characteristics of MSWG
Relationship between MSWG and the Permanent Population, Urban Area and Regional Economic Scale
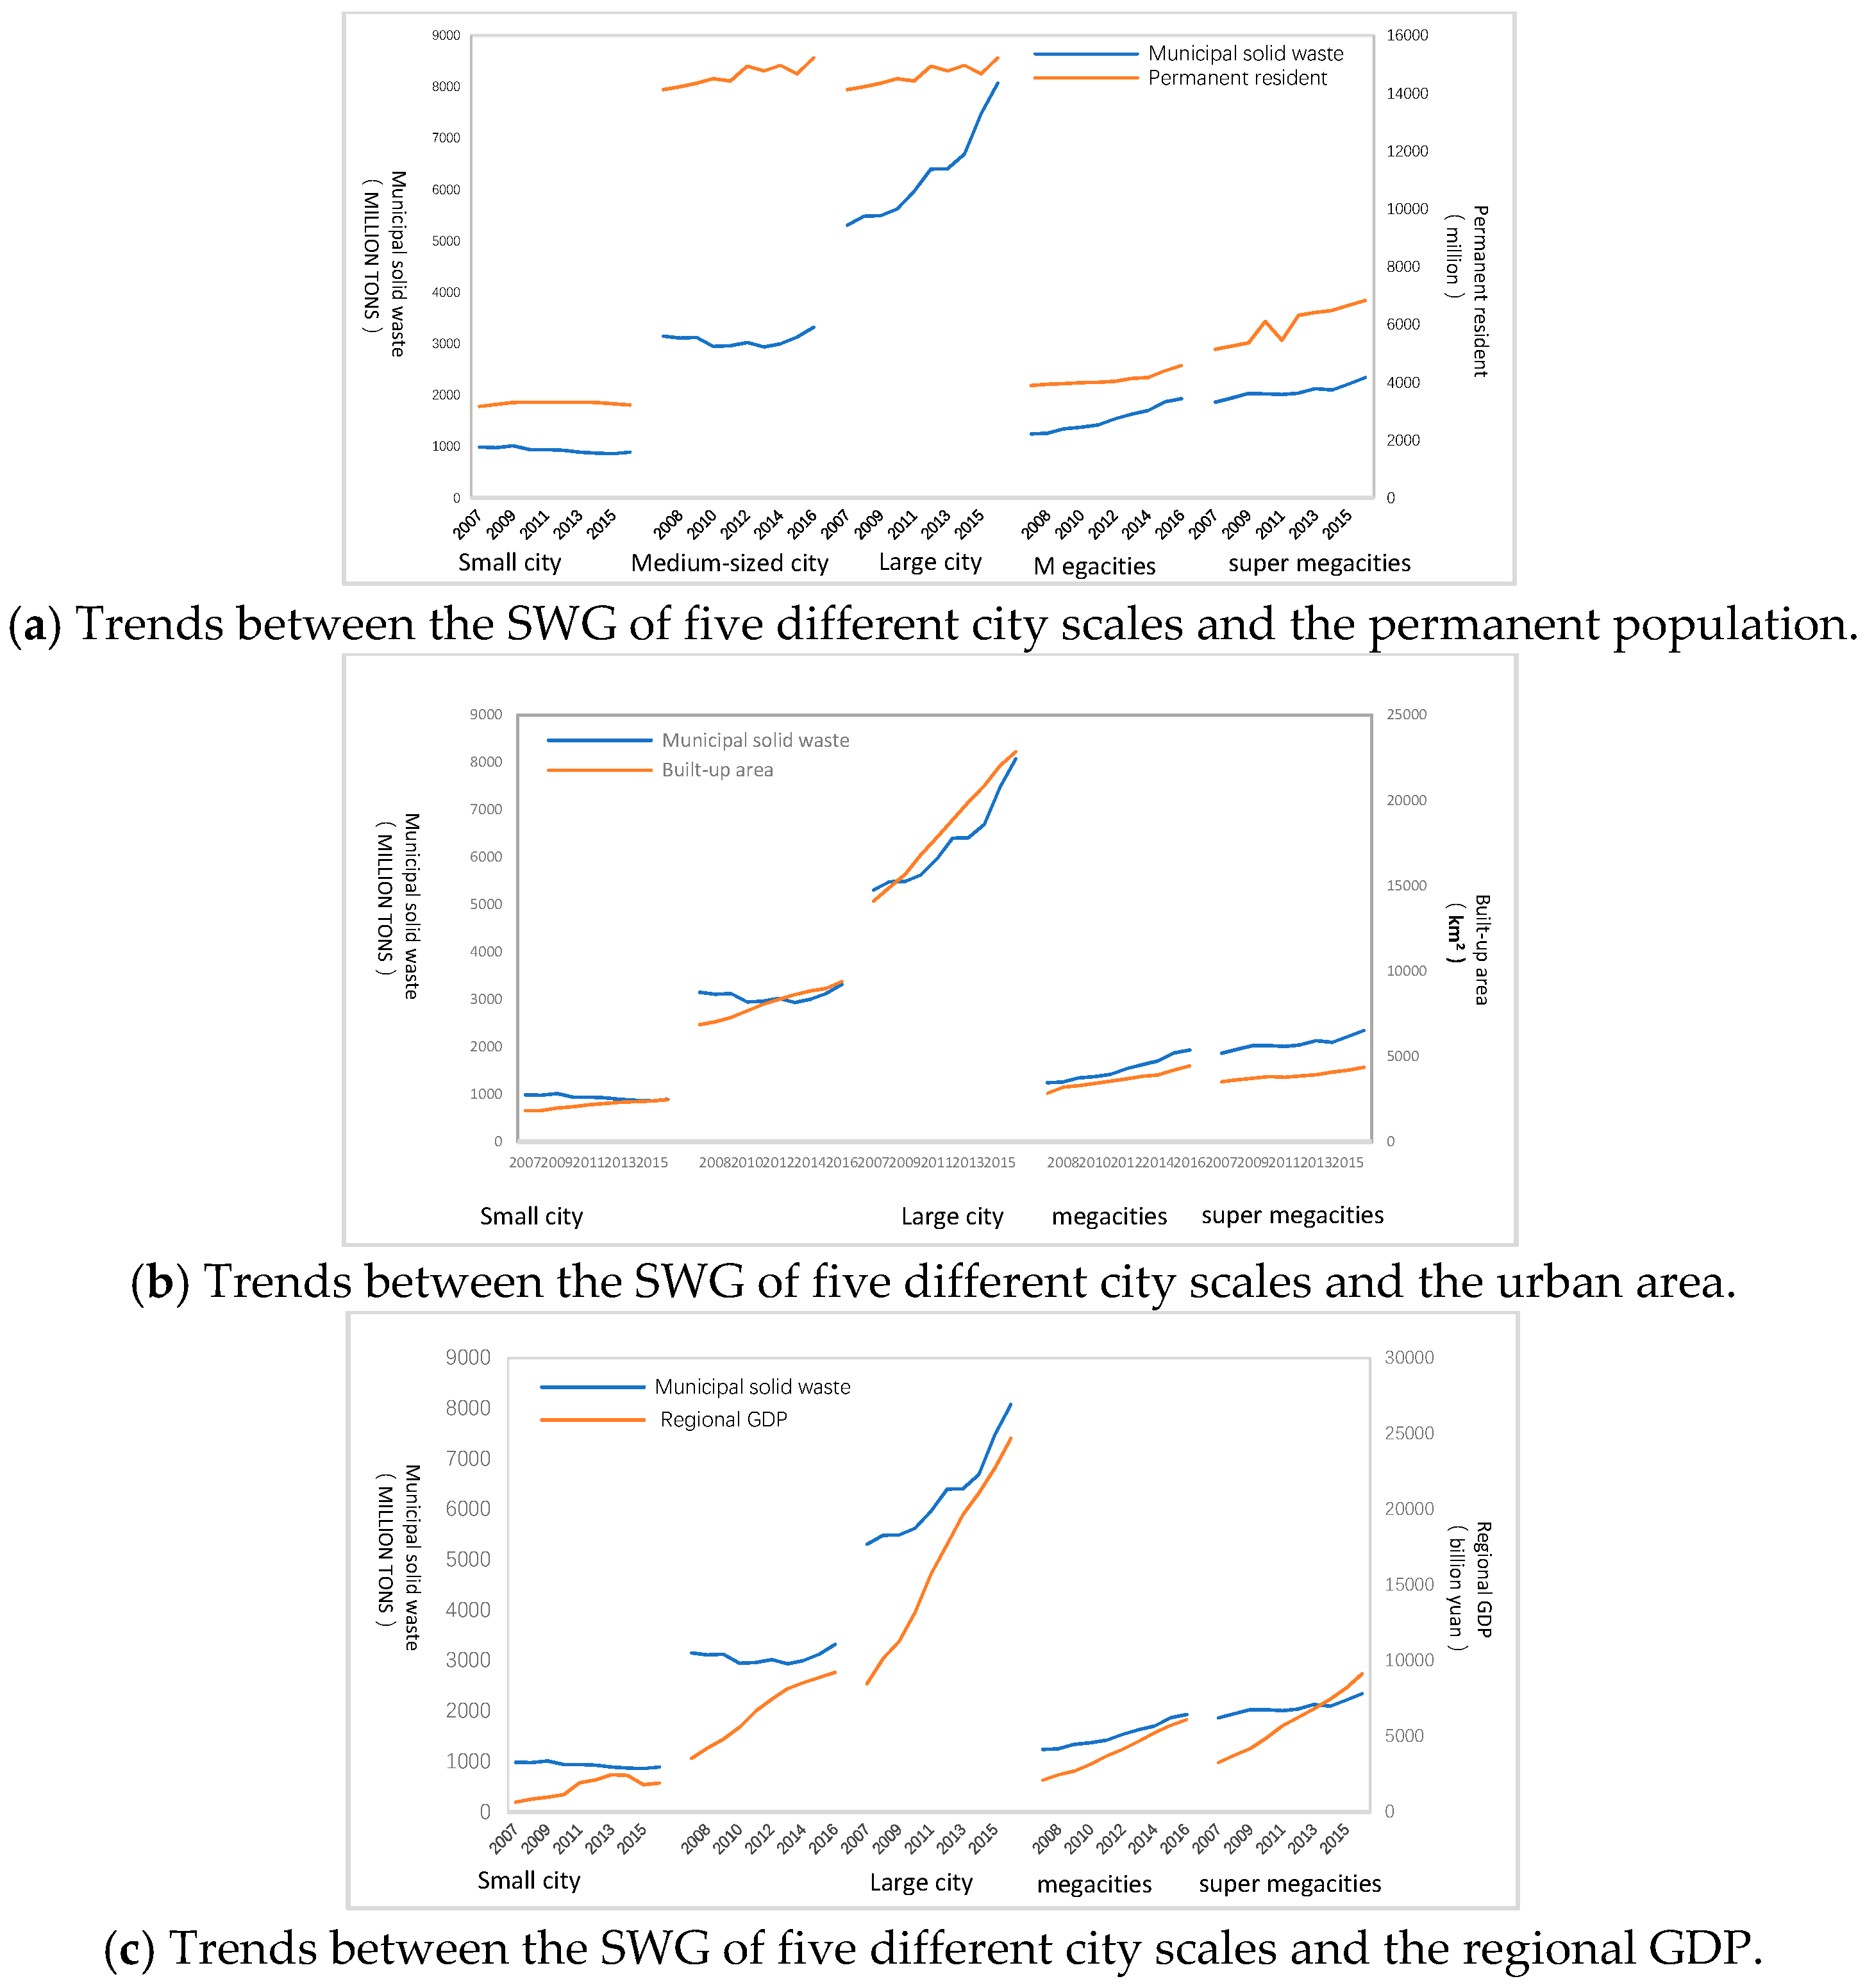
From Figure 3a–c, the trend of MSWG is similar to that of the permanent population and regional GDP, and almost the same as the trend of urban area. These curves indicate that permanent residents, regional GDP, and urban area have significant impacts on MSWG and need to be analyzed further.
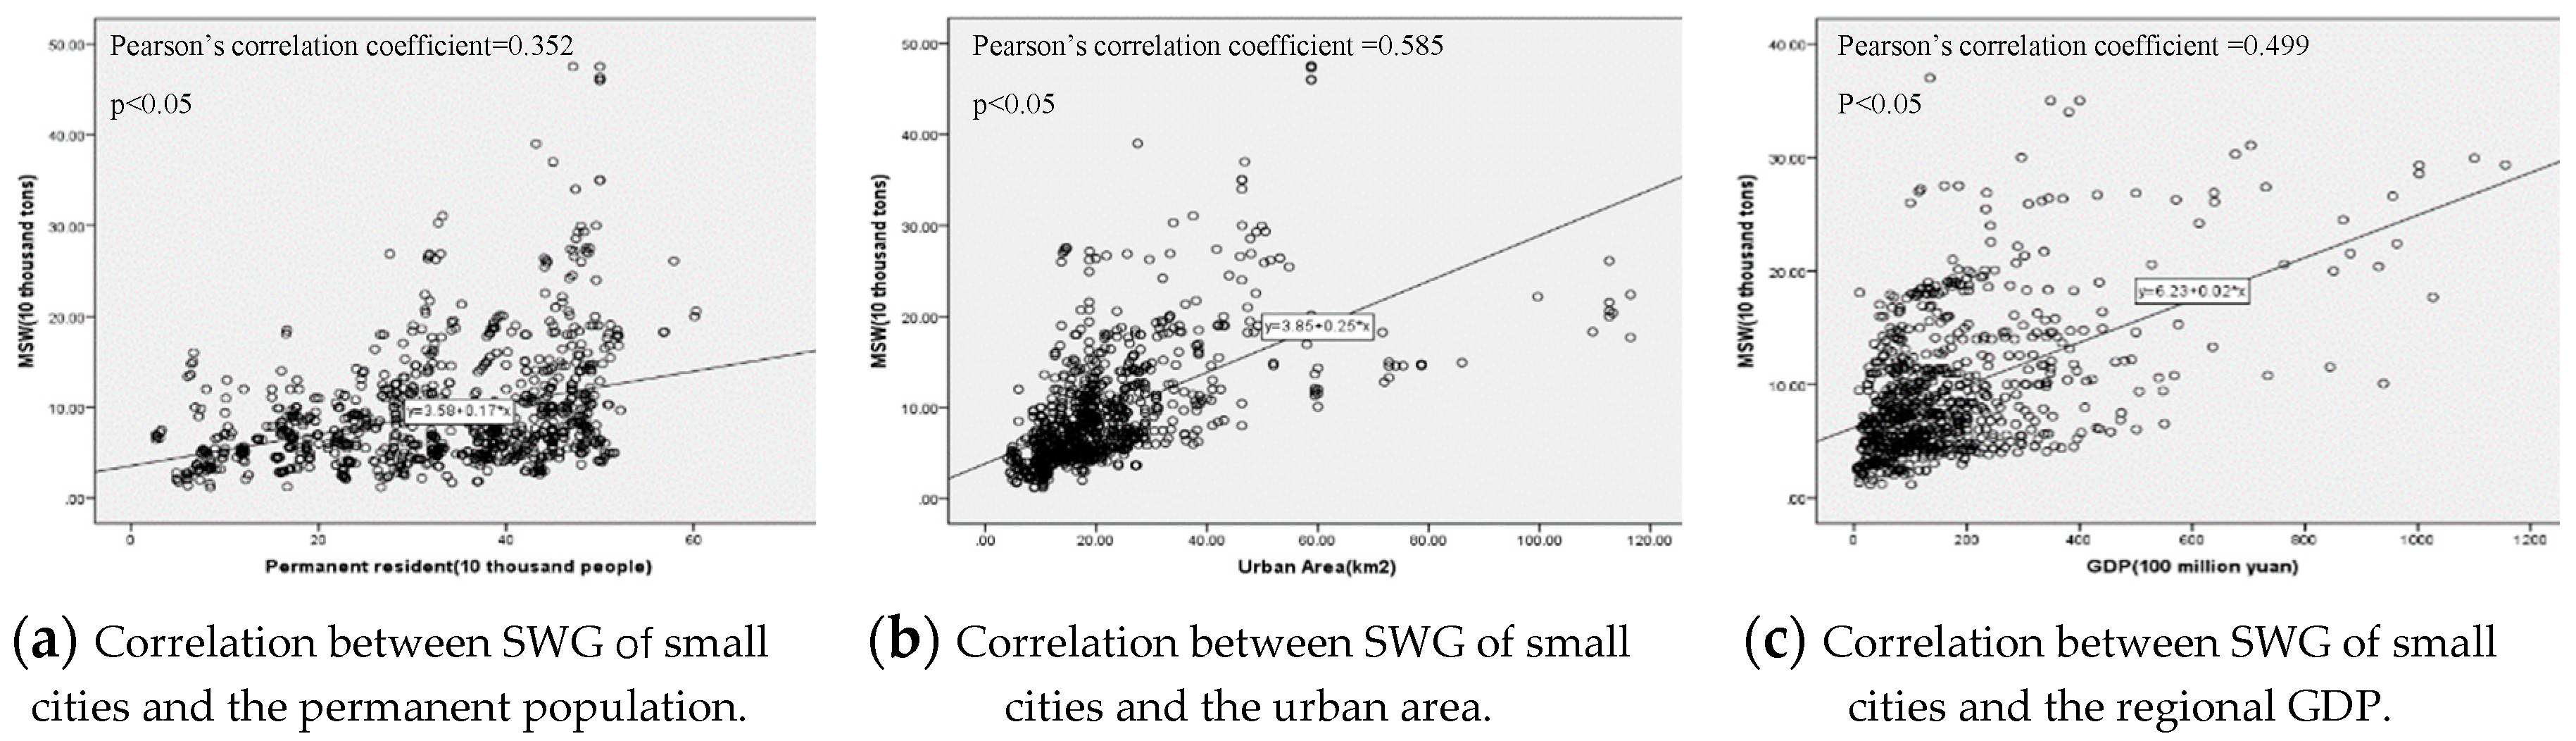
The amount of SWG in small cities is significantly correlated with permanent population, urban area, and regional GDP, as shown in Figure 4a–c. The correlation coefficients between the SWG and permanent residents and regional GDP are 0.352 and 0.499 respectively, while its correlation with the urban area is 0.585. This indicates that for small cities, the impact of urban area on SWG is far greater than that of permanent residents and regional GDP. Small cities should consider the reverse impact of urban land expansion and undergo appropriate planning of urban layout.
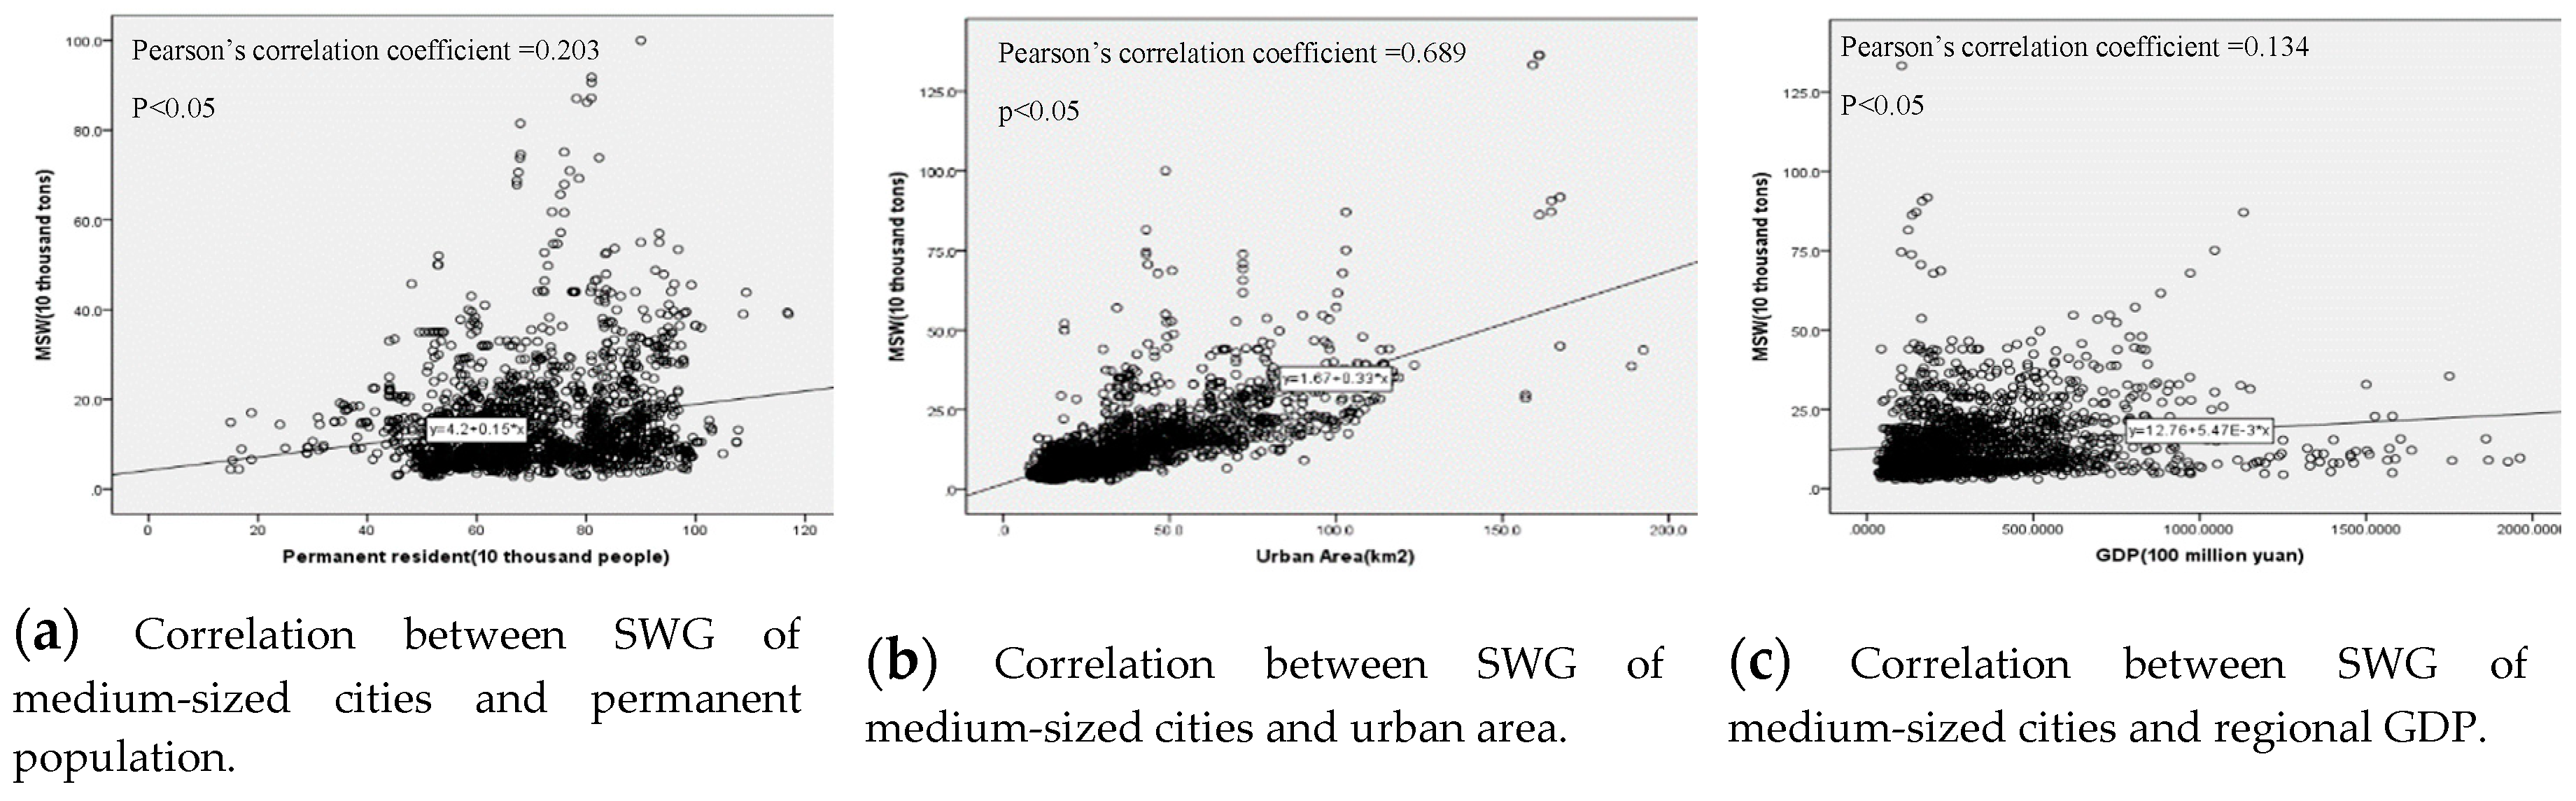
From Figure 5a–c, the amount of SWG in medium-sized cities is significantly correlated with permanent residents, urban area, and regional GDP, but the degree of correlation varies greatly. The correlation coefficient between the SWG and permanent population and regional GDP is very weak, less than 0.25, while the correlation coefficient with the urban area is 0.689, which is relatively strong. Thus, it is necessary for medium-sized cities to adopt compact urban form to reduce land consumption.
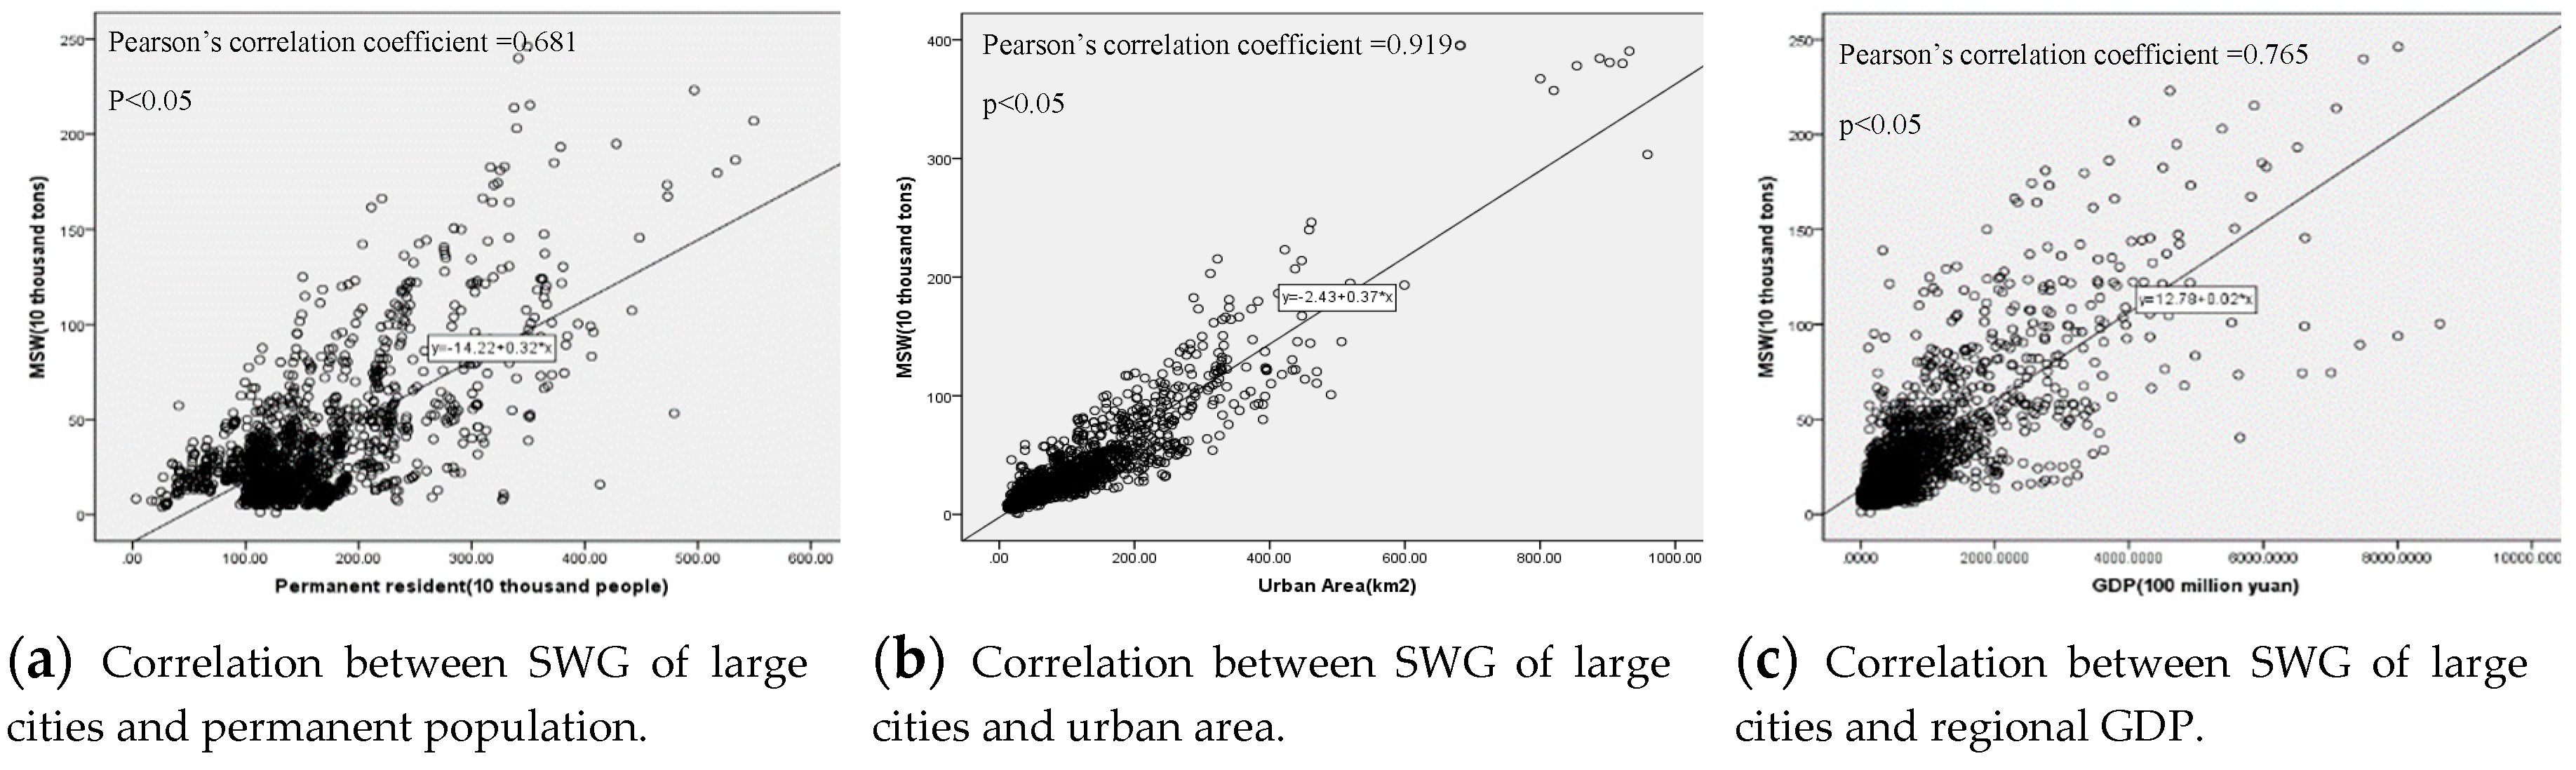
The amount of SWG in large cities is significantly correlated with the permanent population, urban area, and regional GDP, as shown in Figure 6a–c. All correlation coefficients are greater than 0.6. Among them, the correlation with the urban area is 0.919. This indicates that the generation of solid waste in large cities is prominently affected by urban area expansion, economy, and population growth. Large cities need to take comprehensive measures to address the challenge of SWG.
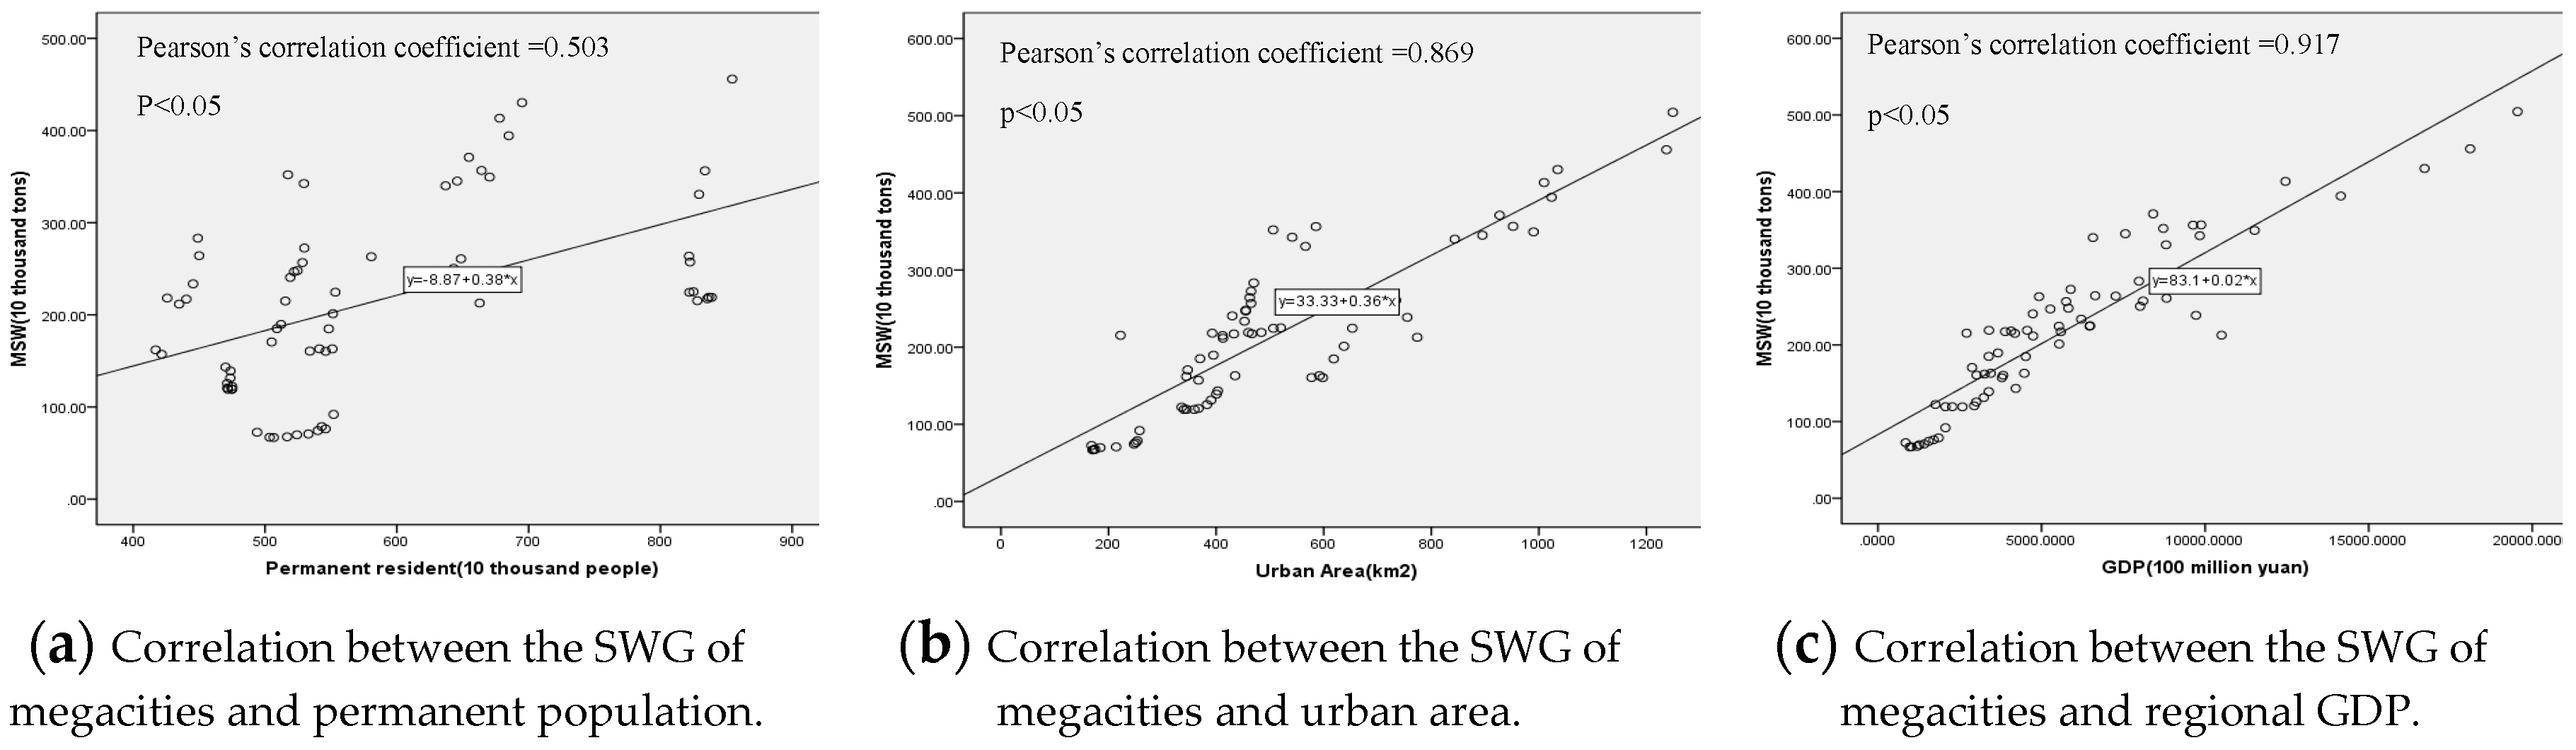
From Figure 7a–c, the SWG is significantly correlated with the permanent population, urban area, and regional GDP, and all the correlation degrees are very high in megacities. The correlation coefficient between the SWG and regional GDP is the greatest at 0.917. Its correlation with the urban area is also greater than 0.8. It shows that economic growth and urban land expansion have major impacts on the rising SWG in megacities. It is essential for megacities to consider smart growth and compact urban models.
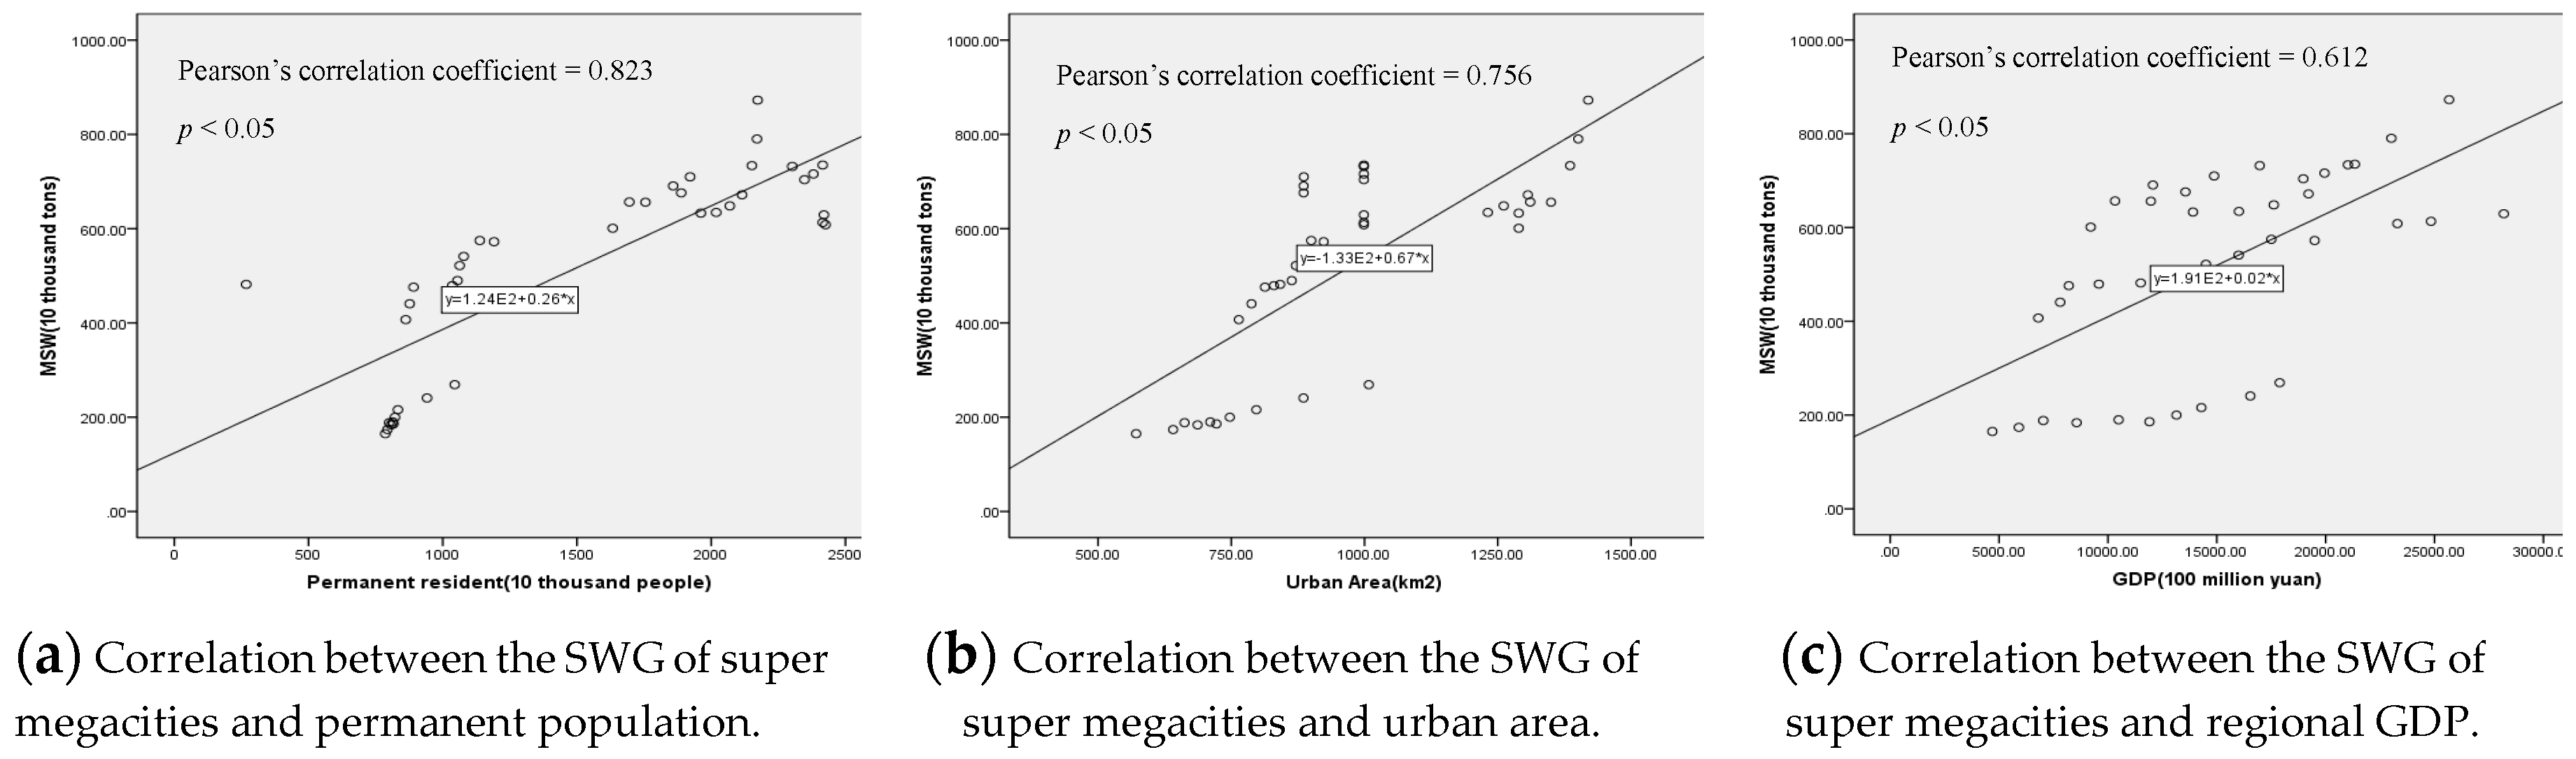
As exhibited in Figure 8a–c, the amount of SWG in super megacities is significantly correlated with the permanent population, urban area, and regional GDP, and all the correlation levels are greater than 0.6. The degree of correlation with the permanent residents is 0.823, and that with the urban area is also greater than 0.7. This shows that population and land expansion are the most influential factors on the growth of SWG. Therefore, it is urgent for super megacities to take more effective measures to relieve the pressure of population and land expansion.
To facilitate the analysis of the characteristics of SWG, Q-type cluster is conducted to identify the similarity among the objects based on the least quadratic sum of deviation. There are two rules in the clustering algorithm. Firstly, the number of clusters is rational and moderate. Secondly, the nonparametric Kruskal–Wallis test is significant. The Q-type clustering is performed as follows [36]:
Firstly, combine any two of n samples into one group and obtain potential groups of n(n − 1)/2. Suppose that n samples are classified into groups of k, ni is the number of the samples in the ith group (i = 1, 2, …, k), xi(j) is the normalization vector of the jth sample in the ith group (j = 1, 2, …, ni), is the average value vector of the ith group, Si is the quadratic sum of the deviation in the ith group, which is calculated according to Formula (1).
Secondly, calculate the quadratic sum of the deviations for the total groups (denoted by S) according to Formula (2), and reclassify based on the least quadratic sum of dispersion in k groups.
Lastly, reuse the above Formula until find the final number of classifications.
SPSS 22.0 software (IBM: Armonk, NY, USA) was used to perform Q-type clustering on per capital MSWG, population density, and per capita GDP in 651 cities in 2016. The population density is a comprehensive index which is the number of permanent urban residents divided by urban built-up area. According to the first rule, the cluster categories are set from 2 to 27, and the Kruskal–Wallis test was performed. When the number of sample clusters is 8, the significance levels of the Kruskal–Wallis test are larger than the critical value of 0.05, as shown in Table 2. Thus, the appropriate number of clusters is 8.
In the initial clustering, Xingtai, Zhengzhou, and Shenzhen are classified into Type VI, Type VII, and Type VIII respectively. The population density of these cities is much higher than other cities. Among them, Xingtai has 6729 people per square kilometer and is the most densely populated city in China. The existence of these extreme values leads to more than 2/3 cities within type III, which is irrational. Thus, Xingtai, Zhengzhou, and Shenzhen are eliminated from the original samples.
The adjusted sample cities are clustered again into eight types and defined according to high or low population density (density), per capita GDP (economy), and per capita MSWG (emission), which are: I “low density, high economy, high emission”, II “high density, high economy, low emission”, III “low density, high economy, low emission”, IV “high density, low Economy, low emission”, V “high density, high economy, high emission “, VI “low density, low economy, low emission, VII “low density, low economy, high emission”, VIII “high density, low economy, high emission”.
From Table 2, the predominant cluster is Type II, formed by 259 cities. This is a desired type, featuring high economic growth, high population density, and low per capita MSWG. Among 259 cities, half are medium-sized cities, such as Yongkang and Suining. The remaining half is nearly all large cities, such as Changchun and Ningbo.
Type VIII is close behind, covering 223 cities. The cities in this cluster have low levels of economic growth, high population density, and high per capita MSWG. The majority of this category is small cities, especially some small western cities such as Yumen and Dunhuang.
The following is Type V, including 111 cities. 55.56 percent of megacities and 26.5 percent of large cities fall in this category, featuring high population density, high economic growth, and high per capita MSWG. The typical cities are Wuhan and Nanyang.
Overall, nearly 70 percent of small cities and one third of medium-sized cities are enclosed in Type VIII with poor economy, high population density, and high per capita SWG. Nearly half of medium-sized and large cities are contained in Type II with high population density, developed economy, and lower per capita SWG. Almost 60 percent of megacities are included in Type V with high population density, developed economy, and high per capita SWG. The distribution of super megacities is scattered throughout Type I, II, IV, and V due to their complicated geographical and socioeconomic features.
2.3. Forecast of MSWG
To support decision making on the management of MSWG, a factor model is established based on the above bivariate exploratory analysis and Q-type cluster results. Suppose the planner of municipal solid management takes decisions during the year n using data from n − 1 year, then the following Equation (3) is built [37].
where a, b1, b2, and b3 are the parameter estimators of the model to be determined. , , and represent the permanent population, urban area and regional economic scale respectively. The data in 2015 is used for model training and the data in 2016 is for model testing.
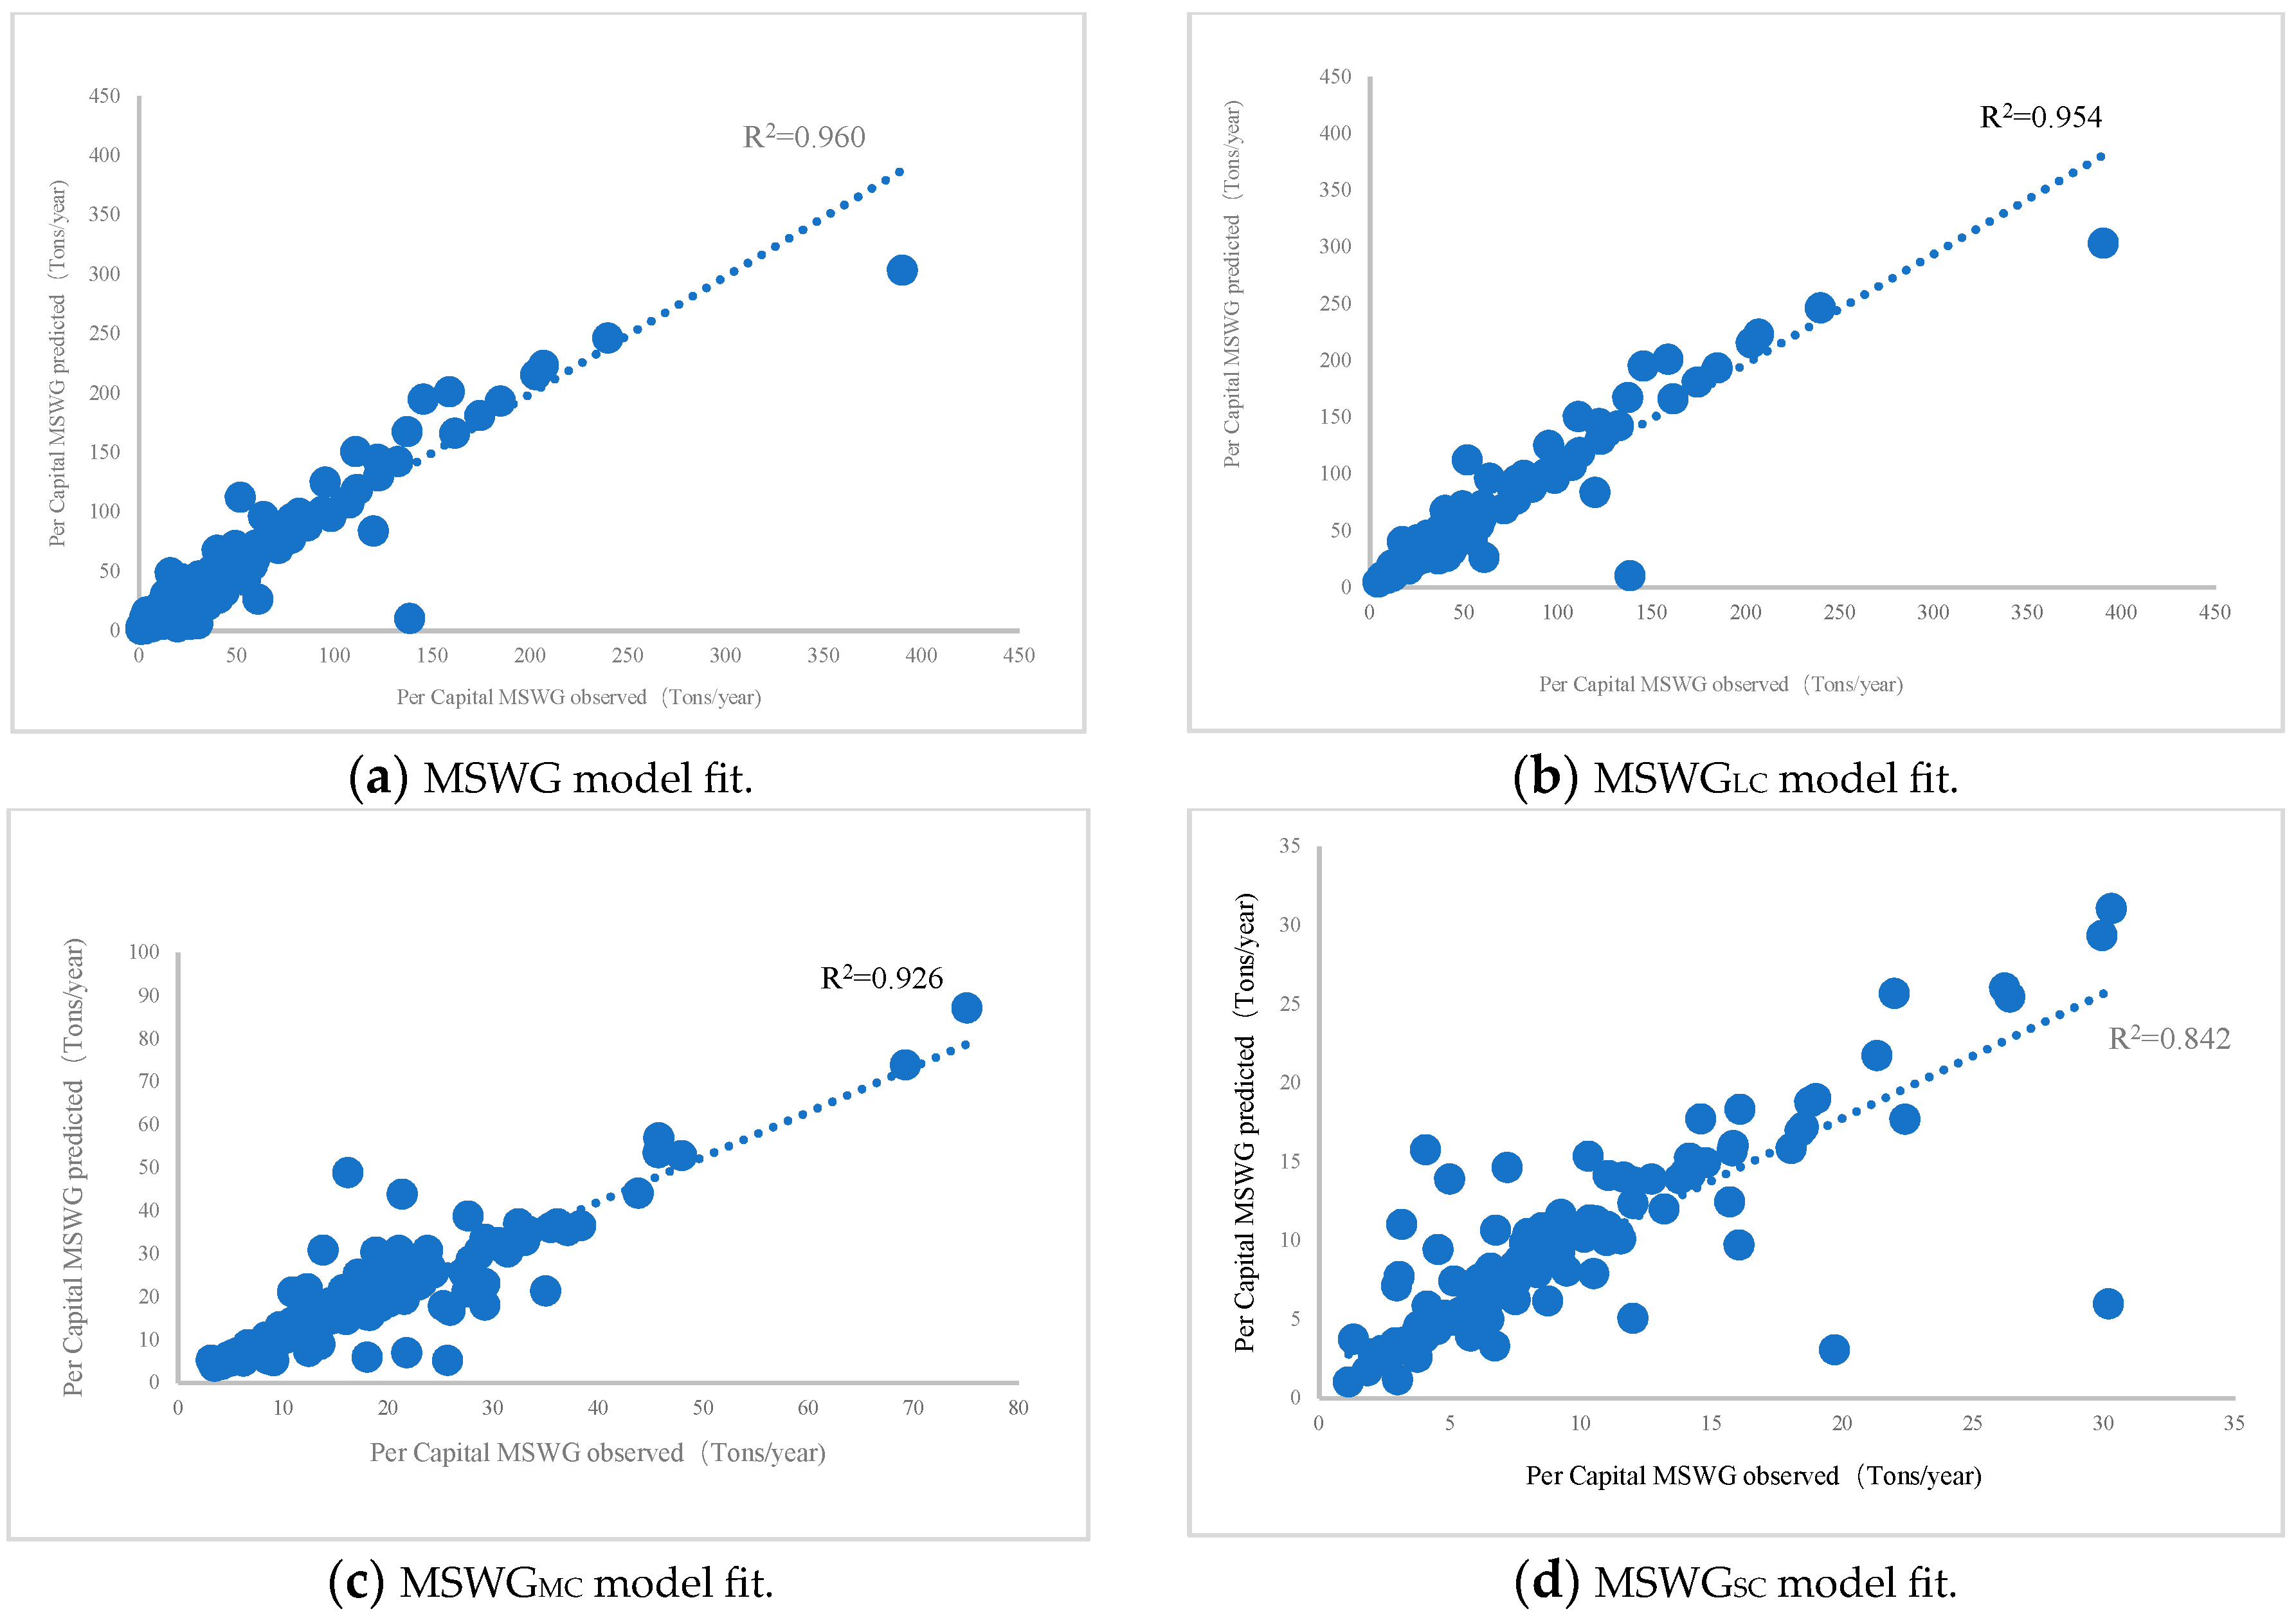
After regression of the data for all cities, Equation (4) is obtained and the main statistical results are exhibited in Table 3. T value and p value show that all explanatory variables included in the model are significant at the 0.05 error level. VIF values are smaller than 10, the threshold value set, indicating non-collinearity problems. The model with the explanatory variables , , and shows the best performance, explaining 96% of the variation of MSWG (Figure 9a). The typified beta coefficients show that urban area () has the highest impact in the model.
Since the numbers of megacities and super megacities are low in the sample, 9 and 5, respectively, no predictions are made on them. From the various tested models, Equations (5)–(7) show the models selected as the best ones for small cities (SC), medium cities (MC) and large cities (LC) respectively.
The explanatory variable POPU isn’t included in the optimal models for medium cities and large cities. It can be seen that for medium-sized cities and large cities, the impact of population on the amount of domestic waste is far less than for small cities. The models for , , and have exceptional explicative capacities, describing up to 95.4%, 92.6%, and 84.2% respectively (Figure 9b–d). All the parameters included in the models are significant at the 5% error level. Other assumptions of a normal residual distribution, homoscedasticity, linearity of the relationship between dependent, and explanatory variables are met in all cases.
3. Conclusions and Discussion
This paper presents a case study on the characteristics and trends of MSWG in China. The conclusion can be drawn that the annual average amount and per capita SWG of cities of different scale are diversified greatly in absolute value and dynamic trends. The total amount of SWG in large cities is the greatest. Especially, the rapid growth trend of SWG is outstanding in large cities recent years. The average growth rate and per capita SWG in megacities has been the greatest during the study period. The annual per capita SWG of super megacities is in a downward trend, although the average amount of SWG are the greatest.
The impacts of permanent population, per capita GDP, and urban area on the amount of SWG vary for different-sized cities. The amount of SWG is affected by the permanent residents and regional GDP to a greater extent for large cities than for small and medium-sized cities. Per capita GDP is the most influential factor of SWG in megacities, while the population and land expansion are the most influential factors for super megacities. The urban area is the common significant element that affects the SWG for cities of every size, with correlation measures above 0.5, and it has the greatest impact on the SWG of large cities, medium-sized cities, and small cities.
Eight well-discriminated clusters of cities have been deduced by Q-type clustering according to high and low population density, per capita GDP, and per capita MSWG in 2016. Overall, the majority of small cities are enclosed in Types VIII with poor economy, high population density, and high per capita SWG. Nearly half of the medium-sized and large cities are contained in Type II with high population density, developed economy, and the lower per capita SWG. Almost 60 percent of megacities are included in Type V with high population density, developed economy, and high per capita MSWG. The distribution of super megacities is scattered throughout Types I, II, IV, and V due to their complicated geographical and socioeconomic features.
Four models are developed to forecast the amount of MSWG for cities overall, small cities (SC), medium cities (MC), and large cities (LC). The overall model has a descriptive capacity of 96%. The other three models also have better descriptive capacity with 84.2%, 92.6%, and 95.4% for small cities, medium cities and large cities respectively. It will be meaningful for urban planners to improve MSWG management by regarding different socio-economic characteristics with a specific model for different-sized cities.
The originality of this paper lies in: (i) Taking 651 Chinese cities as a sample and analyzing the status quo and trend of SWG in five cities of different scale from 2007 to 2016 by transverse and vertical comparisons; (ii) By using correlation analysis and Q-type clustering, the general features of SWG of different-sized cities are identified; and (iii) Based on the features of SWG in cities of different scale, the factor models are developed to forecast the MSWG for all cities, small cities, medium-sized cities, and large cities. The models may be applied to estimate the amount of SWG in different-sized cities to promote the optimization of waste collection and treatment facilities.
Author Contributions
A.P. proposed the conceptualization and main steps of the research, and refined the research results and discussion. L.Y. conducted the empirical analysis by collecting the panel data, and wrote the original draft. Q.Y. supervised the whole process of writing.
Funding
This work was supported by General Project of National Social Science Fund (Grant No. 16BSH072).
Acknowledgments
The authors are very grateful to the editors and reviewers for their valuable comments and suggestions.
Conflicts of Interest
The authors declare no conflict of interest.
References
- Mian, M.; Zeng, X.; Nasry, A.; Al-Hamadani, S.; Meegoda, J.; Ryu, S. Municipal solid waste management in China: A comparative analysis. J. Mater. Cycles Waste Manag. 2017, 19, 1127–1135. [Google Scholar] [CrossRef]
- Rada, E.C.; Passamani, G.; Ragazzi, M.; Torretta, V.; Istrate, I.A.; Cioca, G. Dioxin contamination after a hypothetical accidental fire in baled municipal solid waste storage. Rev. Chim. Buchar. 2018, 69, 997–1001. [Google Scholar]
- Rada, E.C.; Ionescu, G.; Conti, F.; Cioca, U.I.; Torretta, V. Energy from municipal solid waste: Some considerations on emissions and health impact. Calitatea 2018, 19, 118–122. [Google Scholar]
- Khandelwal, H.; Dhar, H.; Thalla, A.K.; Kumar, S. Application of life cycle assessment in municipal solid waste management: A worldwide critical review. J. Cleaner Prod. 2019, 209, 630–654. [Google Scholar] [CrossRef]
- Pandey, P.C.; Sharma, L.K.; Nathawat, M.S. Geospatial strategy for sustainable management of municipal solid waste for growing urban environment. Environ. Monit. Assess. 2012, 184, 2419–2431. [Google Scholar] [CrossRef] [PubMed]
- Cocarta, D.M.; Rada, E.C.; Ragazzi, M.; Badea, A.; Apostol, T. A contribution for a correct vision of health impact from municipal solid waste treatments. Environ. Technol. 2009, 30, 963–968. [Google Scholar] [CrossRef] [PubMed]
- Yukalang, N.; Clarke, B.; Ross, K. Barriers to effective municipal solid waste management in a rapidly urbanizing area in Thailand. Int. J. Environ. Res. Public Health 2017, 14, 1013. [Google Scholar] [CrossRef] [PubMed]
- Giusti, L. A review of waste management practices and their impact on human health. Waste Manag. 2009, 29, 2227–2239. [Google Scholar] [CrossRef] [PubMed]
- Kanchanabhan, T.E.; Selvaraj, S.; Sundaram, V.L.K.; Mohaideen, J.A. Application of geographical information system (GIS) in optimisation of waste collection for Alandur Municipality in South Chennai, India. Int. J. Environ. Waste Manag. 2011, 7, 395–410. [Google Scholar] [CrossRef]
- Zhang, L.; Yuan, Z.; Bi, J.; Huang, L. Estimating future generation of obsolete household appliances in China. Waste Manag. Res. 2012, 30, 1160–1168. [Google Scholar] [CrossRef] [PubMed]
- Kong, L.; Tian, G.; Liu, X. The spatio-temporal dynamic pattern of urban solid waste emission in China. China Environ. Sci. 2017, 37, 1408–1417. [Google Scholar]
- China Urban and Rural Construction Statistical Yearbook 2017. Available online: www.mohurd.gov.cn/xytj/tjzljsxytjgb/ (accessed on 11 February 2019).
- Antonio, G.; María, D.B.; Francisco, J.C.; Míriam, P.; Mar, C. Comparison of different collection systems for sorted household waste in Spain. Waste Manag. 2010, 30, 2430–2439. [Google Scholar]
- Mao, G.; Zhang, Y. Analysis of municipal solid waste treatment status and the feasibility of incineration in China. Urban Dev. Res. 2010, 17, 12–16. [Google Scholar]
- Lebersorger, S.; Beigl, P. Municipal solid waste generation in municipalities: Quantifying impacts of household structure, commercial waste and domestic fuel. Waste Manag. 2011, 31, 1907–1915. [Google Scholar] [CrossRef] [PubMed]
- Al-Khatib, I.A.; Kontogianni, S.; Abu Nabaa, H.; Alshami, N.; Al-Sari’, M.I. Public perception of hazardousness caused by current trends of municipal solid waste management. Waste Manag. 2015, 36, 323–330. [Google Scholar] [CrossRef]
- Miriam, P.; Antonio, G.; Maria, V.I. Factors determining waste generation in Spanish towns and cities. Environ. Monit. Assess. 2015, 187, 4098–4110. [Google Scholar]
- Jamas, T.; Nepal, R. Issues and options in waste management: A social cost-benefit analysis of waste-to-energy in the UK. Resour. Conserv. Recycl. 2010, 54, 1341–1352. [Google Scholar] [CrossRef]
- Seacat, J.D.; Boileau, N. Demographic and community-level predictors of recycling behavior: A statewide, assessment. J. Environ. Psychol. 2018, 56, 12–19. [Google Scholar] [CrossRef]
- De Feo, G.; De Gisi, S. Domestic separation and collection of municipal solid waste: Opinion and awareness of citizens and workers. Sustainability 2010, 2, 1297–1326. [Google Scholar] [CrossRef]
- Vieira, V.; Matheus, D. The impact of socioeconomic factors on municipal solid waste generation in Sao Paulo, Brazil. Waste Manag. Res. 2018, 36, 79–85. [Google Scholar] [CrossRef]
- Xu, L.; Yan, Z.; Cui, S. Path analysis of influencing factors on municipal solid waste generation: A case study of Xiamen City. Acta Scientiae Circumstantiate 2013, 33, 1180–1185. [Google Scholar]
- Zhao, Y.; Ge, X.; Li, X. Factors influencing municipal solid waste generation. Stat. Decis. 2016, 23, 91–94. [Google Scholar]
- Han, H.; Zhang, Z.J. The impact of the policy of municipal solid waste source-separated collection on waste reduction: A case study of China. J. Mater. Cycles Waste Manag. 2017, 19, 382–393. [Google Scholar] [CrossRef]
- Song, G.; Sun, Y. Social cost accounting for municipal solid waste incineration in Beijing. China Popul. Resour. Environ. 2017, 27, 17–27. [Google Scholar]
- Chhay, L.; Reyad, M.A.H.; Suy, R.; Islam, M.R.; Mian, M.M. Municipal solid waste generation in China: Influencing factor analysis and multi-model forecasting. J. Mater. Cycles Waste Manag. 2018, 20, 1761–1770. [Google Scholar] [CrossRef]
- Liu, C.; Wu, X. Factors influencing municipal solid waste generation in China: A multiple statistical analysis study. Waste Manag. Res. 2011, 29, 371–378. [Google Scholar] [PubMed]
- Gintaras, D.; Tomas, R.; Dainius, M. Seasonal variation of municipal solid waste generation and composition in four East European cities. Resour. Conserv. Recycl. 2014, 89, 22–30. [Google Scholar]
- Wei, Y.; Xue, Y.; Yin, J.; Ni, W. Prediction of municipal solid waste generation in China by multiple linear regression method. Int. J. Comput. Appl. 2013, 35, 136–140. [Google Scholar]
- Ha, P.T.; Thomas, S.; Duc, Q.N.; Vinh, H.H.; Trung, H.H.; Jo, D. Material flow analysis for management of waste TVs from households in urban areas of Vietnam. Resour. Conserv. Recycl. 2018, 139, 78–89. [Google Scholar]
- Liu, G.; Yu, J. Gray correlation analysis and prediction models of living refuse generation in Shanghai city. Waste Manag. 2007, 27, 345–351. [Google Scholar] [CrossRef]
- Kang, J.; Guo, L. Analysis on Influencing factors and grey model of municipal domestic waste in Xi’an city. Environ. Sci. Manag. 2011, 12, 51–53. [Google Scholar]
- Abbasi, M.; Abduli, M.A.; Omidvar, B.; Baghvand, A. Forecasting municipal solid waste generation by hybrid support vector machine and partial least square model. Int. J. Environ. Res. 2012, 7, 27–38. [Google Scholar]
- Abbasi, M.; El Hanandeh, A. Forecasting municipal solid waste generation using artificial intelligence modelling approaches. Waste Manag. 2016, 56, 13–22. [Google Scholar] [CrossRef] [PubMed]
- Ghinea, C.; Drăgoi, E.N.; Comăniţă, E.D.; Gavrilescu, M.; Câmpean, T.; Curteanu, S.; Gavrilescu, M. Forecasting municipal solid waste generation using prognostic tools and regression analysis. J. Environ. Manag. 2016, 182, 80–93. [Google Scholar] [CrossRef] [PubMed]
- Yu, J.; Yang, W. Multivariate Statistical Analysis and Application; Zhongshan University Press: Guangzhou, China, 2006. [Google Scholar]
- Oribegarcia, I.; Kamaraesteban, O.; Martin, C.; Ana, M. Identification of influencing municipal characteristics regarding household waste generation and their forecasting ability in Biscay. Waste Manag. 2015, 39, 26–34. [Google Scholar] [CrossRef] [PubMed] [Green Version]
Figure 1.
Average amount of solid waste generation (SWG) in cities of different scale.

Figure 2.
Per capita and total amount of SWG in cities of different scale.

Figure 3.
Trends between SWG of five different city scales and the permanent resident, urban area and GDP. Note: The data on regional GDP are derived from the Easy Professional Superior (EPS) Database.
Figure 3.
Trends between SWG of five different city scales and the permanent resident, urban area and GDP. Note: The data on regional GDP are derived from the Easy Professional Superior (EPS) Database.

Figure 4.
Correlation between SWG of small cities and permanent population, urban area and GDP.

Figure 5.
Correlation between SWG of medium-sized cities and permanent population, urban area and GDP.
Figure 5.
Correlation between SWG of medium-sized cities and permanent population, urban area and GDP.

Figure 6.
Correlation between SWG of large cities and permanent population, urban area and GDP.

Figure 7.
Correlation between SWG of megacities and permanent population, urban area and GDP.

Figure 8.
Correlation between SWG of super megacities and permanent population, urban area and GDP.

Figure 9.
MSWG models fit.


Table 1.
Growth rate and annual per capita SWG in cities of different scale from 2007 to 2016.
| Average Amount | Annual Per Capita MSWG | |||||
|---|---|---|---|---|---|---|
| Average Growth Rate from 2007 to 2016 | Growth Rate in 2016 Relative to 2007 | Average Growth Rate | Growth Rate in 2016 | |||
| MSWG | Permanent Residents | MSWG | Permanent Residents | From 2007 to 2016 | Relative to 2007 | |
| Small cities | 1.12% | 1.45 | 10.53% | 7.6 | 0.39% | 2.23% |
| Medium-sized cities | 0.92% | 1.79 | 8.17% | 8.39 | 0.01% | −0.31% |
| Large cities | 4.63% | 3.7 | 49.60% | 20.27 | 2.51% | 24.39% |
| Megacities | 59.70% | 2.85 | 67.39% | 13.61 | 4.47% | 47.34% |
| Super megacities | 3.64% | 8.13 | 37.46% | 39.34 | 0.09% | −1.35% |
| The whole | 4.27% | 3.86 | 45.17% | 17.44 | 1.38% | 12.60% |
Table 2.
Q-type clustering results.
| Group | Before Adjusting | After Adjusting | Urban Number (After Adjusting) | ||||||
|---|---|---|---|---|---|---|---|---|---|
| Urban Numbers | K–W Test Sig. | Urban Numbers | K–W Test Sig. | Small Cities | Medium-Sized Cities | Large Cities | Megacities | Super Megacities | |
| I | 205 | 1.000 | 6 | 0.900 | - | 2 | 3 | - | 1 |
| II | 18 | 0.993 | 259 | 1.000 | 34 | 122 | 101 | 1 | 1 |
| III | 412 | 1.000 | 7 | 0.953 | 1 | 4 | 4 | 2 | - |
| IV | 1 | - | 24 | 1.000 | 1 | 7 | 15 | - | 1 |
| V | 6 | 1.000 | 111 | 1.000 | 11 | 38 | 56 | 5 | 1 |
| VI | 7 | 0.974 | 7 | 0.966 | 1 | 2 | 4 | - | - |
| VII | 1 | - | 11 | 0.953 | 1 | 4 | 4 | 2 | - |
| VIII | 1 | - | 223 | 1.000 | 111 | 88 | 24 | - | - |
| Total | 651 | - | 648 | - | 160 | 264 | 211 | 9 | 4 |
Table 3.
Factor models with the main characteristics.
| Dependent Variable Model | Explicative Variables | Significance | Collinearity Analysis (VIF) | |||||
|---|---|---|---|---|---|---|---|---|
| Non-Standardized Coefficients | Beta Coefficients | T | p Value | |||||
| MSWG | R2 | 0.921 | Constant | −4.112 | - | −4.528 | 0.000 | - |
| POPU | 0.045 | 0.126 | 4.819 | 0.000 | 8.34 | |||
| F | 2520.017 | UAR | 0.235 | 0.509 | 18.384 | 0.000 | 6.28 | |
| GDP | 0.011 | 0.355 | 11.134 | 0.000 | 5.63 | |||
| MSWGSC | R2 | 0.52 | POPU | 0.092 | 0.199 | 3.327 | 0.001 | 1.63 1.54 1.16 |
| UAR | 0.177 | 0.488 | 7.085 | 0.000 | ||||
| F | 56.336 | GDP | 0.007 | 0.202 | 2.856 | 0.005 | ||
| MSWGMC | R2 | 0.523 | UAR | 0.253 | 0.646 | 14.480 | 0.000 | 1.09 |
| F | 94.884 | GDP | 0.005 | 0.173 | 3.802 | 0.000 | 1.13 | |
| MSWGLC | R2 | 0.874 | UAR | 0.321 | 0.807 | 18.253 | 0.000 | 3.22 |
| F | 480.067 | GDP | 0.006 | 0.157 | 3.482 | 0.001 | 3.36 | |
© 2019 by the authors. Licensee MDPI, Basel, Switzerland. This article is an open access article distributed under the terms and conditions of the Creative Commons Attribution (CC BY) license (http://creativecommons.org/licenses/by/4.0/).
Share and Cite
MDPI and ACS Style
Pan, A.; Yu, L.; Yang, Q. Characteristics and Forecasting of Municipal Solid Waste Generation in China. Sustainability 2019, 11, 1433. https://0-doi-org.brum.beds.ac.uk/10.3390/su11051433
AMA Style
Pan A, Yu L, Yang Q. Characteristics and Forecasting of Municipal Solid Waste Generation in China. Sustainability. 2019; 11(5):1433. https://0-doi-org.brum.beds.ac.uk/10.3390/su11051433
Chicago/Turabian StylePan, Ane, Linxiu Yu, and Qing Yang. 2019. "Characteristics and Forecasting of Municipal Solid Waste Generation in China" Sustainability 11, no. 5: 1433. https://0-doi-org.brum.beds.ac.uk/10.3390/su11051433
Note that from the first issue of 2016, this journal uses article numbers instead of page numbers. See further details here.