Mapping and Assessing Green Infrastructure Connectivity in European City Regions


ILS—Research Institute for Regional and Urban Development, 44135 Dortmund, Germany
*
Author to whom correspondence should be addressed.
Sustainability 2019, 11(6), 1819; https://0-doi-org.brum.beds.ac.uk/10.3390/su11061819
Submission received: 28 February 2019
/
Revised: 25 March 2019
/
Accepted: 25 March 2019
/
Published: 26 March 2019
(This article belongs to the Special Issue Green Infrastructure and Nature-Based Solutions in the Urban and Rural Context)
Abstract
:Urban green infrastructure is becoming an increasingly important concept for sustainable urban planning. In the past, planning practice and research have worked on defining principles and suggesting relevant indicators to promote the concept. While there has been a focus on multifunctionality of green infrastructure elements, the connectivity principle is underrepresented, especially in urban research. Therefore, this paper suggests land use indicators to map and assess the degree of connectivity of open spaces within the urban realm. Empirical results are presented for three European case studies. The relevance of connectivity indicators for urban green infrastructure planning is highlighted and linked to future needs for improving strategic urban planning.
1. Introduction
In planning research, the concept of green infrastructure has gained a lot of attention in the last decade, especially in the context of sustainable urban development [1]. Many authors see great potential for high quality urban green infrastructure (UGI) to deal with a variety of current and future challenges that city regions have to cope with, ranging from stormwater management, climate adaptation, and urban quality of life, to providing healthy neighbourhoods [2]. This range of expectations on the green infrastructure concept is rooted in the generally broad understanding of what “green infrastructure” is or can be.
Like many other authors, we align our understanding of UGI with the European Commission’s definition published in 2013 [3]. Here, green infrastructure comprises a wide range of natural and semi-natural assets that are strategically planned as a network of interlinked elements, including all kinds of green and blue components [4]. For instance, UGI subsumes street trees, pocket parks, and small streams up to big parks, cemeteries, sporting facilities, and lakes within the urban realm. This definition also includes modern vertical green elements, such as green walls or green roofs. In addition, since it is seen as infrastructure, UGI also deals with green links (pathways, cycle tracks) between the several possible hubs of green infrastructure provision [5].
More importantly, the idea of a planning concept for green infrastructure builds on a set of principles that define its specific differences, which diverge from open space or green belt planning. The two most highlighted principles are multifunctionality and connectivity of green infrastructure components [6,7]. Focusing on these two defining elements can define and realize a planning approach.
There is already a rich body of multifunctionality literature in which ecosystem services, supplied by different green elements, are assessed, mapped and measured [8]. This is a very useful input for a planning approach. Due to better information on the correlations between natural assets and ecosystem services, a trade-off between investment decisions can be set up that helps balance positive social, economic and ecological effects throughout a city-region [9,10]. Only by managing a well-balanced distribution of green spaces throughout the city-regional space can a network of built green elements be understood as city-regional green infrastructure [11].
In the literature, analysis of the connectivity principle mainly assesses green infrastructure connectivity for the purpose of providing habitats or giving species the possibility to migrate [12]. This is why many papers on this topic do not specifically deal with urban landscapes. Rather, they concentrate on the urban fringe or rural elements of green infrastructure. Nevertheless, in urban green infrastructure, the idea of connectivity (or accessibility) is equally as important as the multifunctionality principle [4]. There is also a general need for better green infrastructure mapping approaches that acknowledge site-specific characteristics [13].
In addition to these urban green infrastructure connectivity approaches [6,14], this paper suggests a set of spatial indicators that help evaluate the degree of connectivity between elements of urban green infrastructure. The main goal is to be able to assess the degree of overall connections between green areas to be able to answer our research question on how to properly measure different degrees of green infrastructure connectivity in urban spaces. More importantly, the spatially explicit approach will enable urban and regional planning to identify specific action items to improve urban green infrastructure connectivity. Linking back to the green infrastructure principles, a well-connected UGI is a “conditio sine qua non” for a multifunctional network of ecosystem services providing green spaces [15]. A balanced provision of the various ecosystem service benefits cannot be ensured without the network aspect [7]. Even more, high multifunctionality and connectivity quality are needed to reach the goals of sustainable and resilient urban regions. Only well-connected UGI networks provide healthy, accessible environments by using green connections and corridors (by humans and nature), which leads to a wider understanding of green networks versus concentrating on general walkability, for example.
To achieve these goals, we apply a comparative approach to three European city regions. We test a set of connectivity indicators in these regions as contrasting examples of how green infrastructure supply can be characterized and reflected in specific planning environments. In this manner, we address different societal and cultural backgrounds that affect planning practices. In recent planning research, the concept of planning cultures was used to analyse and understand the relationship between cultural imprints and determining the ways planning is done, i.e., beliefs, attitudes, and ideas constituting a set of collective meaning or “web of belief” [16] shared by planning professionals in a certain time and space, and the physical outcomes of planning, i.e., urban patterns reflecting a certain planning philosophy [17]. Understood as “the sum of specific localized planning practices that emerge as a consequence of the interplay of institutional cognitive frames and behavioural patterns of actors involved in planning processes” [18], planning cultures in a given spatial and temporal context can be seen as a major defining element on how the physical setting of urban green infrastructure manifests in the urban realm [19].
Along with the research questions on how to measure spatially explicit connectivity, the subsequent section introduces the indicators developed and the GIS approach followed. Section 3 presents the results for the three European city regions, and then we discuss the interpretation of the results and confront the idea of different planning cultures (Section 4). Section 5 provides reasons for further research and concludes the analysis.
2. Materials and Methods
As discussed in the previous section, the focus of our research is twofold: on the one hand, we want to capture the connectivity of urban green infrastructure, and on the other hand, we are interested in comparing the structure of built UGI of European city regions with respect to their planning context. This has specific requirements on data choice and the creation of indicators.
For spatial data, there is a variety of national, high-quality land use information available; for example, in Germany, it is the official topographic-cartographic information system with a digital landscape model (ATKIS-Basic-DLM). However, this does not help in comparing across national borders, which is why we opted for the European Urban Atlas (EUA), a common reference for European land use analytics [20,21].
Importantly, GIS data are available for a relatively large number of city regions (800 functional urban areas for the most recent year available, 2012) and in reasonably high resolution of 0.25 ha minimum mapping units (see https://land.copernicus.eu/local/urban-atlas/urban-atlas-2012?tab=metadata). We chose three city regions, Greater Manchester, Greater Copenhagen, and the Ruhr Area, which share a long tradition in green infrastructure planning but belong to different planning traditions, i.e., their planning systems and related practices are differentiated by legal and procedural planning principles and by their embeddedness in diverse political, institutional, and cultural backgrounds [22]. We chose case study areas from three distinct “planning families”, to explain the variety of green infrastructure planning in three different societal contexts. With Greater Manchester as a case, we focus on the “British family” with a strong emphasis on case-based decisions that is unique across Europe. Greater Copenhagen is situated within the “Scandinavian family”. Denmark has long been characterized by a planning system that is built on framework control, a clear hierarchy of administrative units and plans, and a comprehensive planning style. Recent reforms have led to abolishing the regional planning level, resulting in a two-tier planning system of strong municipalities and a strong nation state. Following Galland et al. [23], “structural and operational shifts concerning planning tasks and responsibilities within and across different levels of administration, namely: (1) the downward rescaling (regional to municipal) of most planning functions and responsibilities; (2) the abolition of the county level and the revocation of regional (land-use) planning; and (3) the upward rescaling (metropolitan to national) of planning functions associated with Greater Copenhagen”. As part of the “Germanic family”, the Ruhr area case is situated in a mature planning context. The German planning system is characterized by a strong legal framework and decentralized decision-making structure. Here, reform initiatives and substantial shifts concerning the basic patterns of spatial planning are marginal.
The EUA land use classes have a wide range of land use types that link to the relatively broad definition of UGI we suggested earlier. To mirror this understanding, we merged a number of land use classes to cover green and blue spaces (see Table 1). In summary, we combined the classical green urban areas (land use class 14,100) with water elements (40,000 and 50,000) and also more agricultural land uses (21,000 to 33,000).
In addition, since we want to focus on urban green infrastructure, we defined a spatial boundary around settlement areas, labelled “urban influenced area”, characterized by two requirements. First, we only consider settlement areas that are in more dense urban surroundings, areas that are not more than 100 m from the next urban settlement of at least one square kilometre in size. This reflects our understanding of focusing on the “urban” green. Using the 100 m for example ensures that we do not include pure suburban leapfrog developments. In combination with the minimum size we exclude also small settlement areas that have a different characteristic than more urban neighbourhoods. Then, for the fringe between urban and peri-urban areas, we set a 500-metre buffer around dense urban areas to include green infrastructure elements that are linked to the urban rural interface, such as fields and woodlands. The buffer size reflects a commonly used approximation of a 15-min walk [24], which we use to delineate daily activity spaces of urban dwellers.
Using this specification, we define the spatial extent of urban areas where we analyse the green infrastructure supply regarding its connectivity principle. Figure 1 depicts the results of our GIS approach. Here, green and blue spaces are shown separately to follow mapping standards. Nevertheless, in our indicator analysis, they are both treated as UGI. The map showcases our research interest in urban green infrastructure, and our delineation removes the peri-urban and rural settlement areas for all three city regions. It can be argued that from a multifunctionality perspective, relatively huge spaces of woodland, lakes, or agricultural land have significant relevance for recreation, air quality, fresh air corridors, and others [25]. We do not consider this in our approach because we are looking at the supply of connected green spaces for urban dwellers in their everyday life.
Consequently, there needs to be a discussion on how to measure connectivity accordingly. The literature has a huge choice of indicators dealing with green infrastructure supply and demand [26] that goes beyond pure land use metrics [27,28]. Many approaches use comparative methods [12,29,30] and define several indicators, based on provision or accessibility of green infrastructure [31].
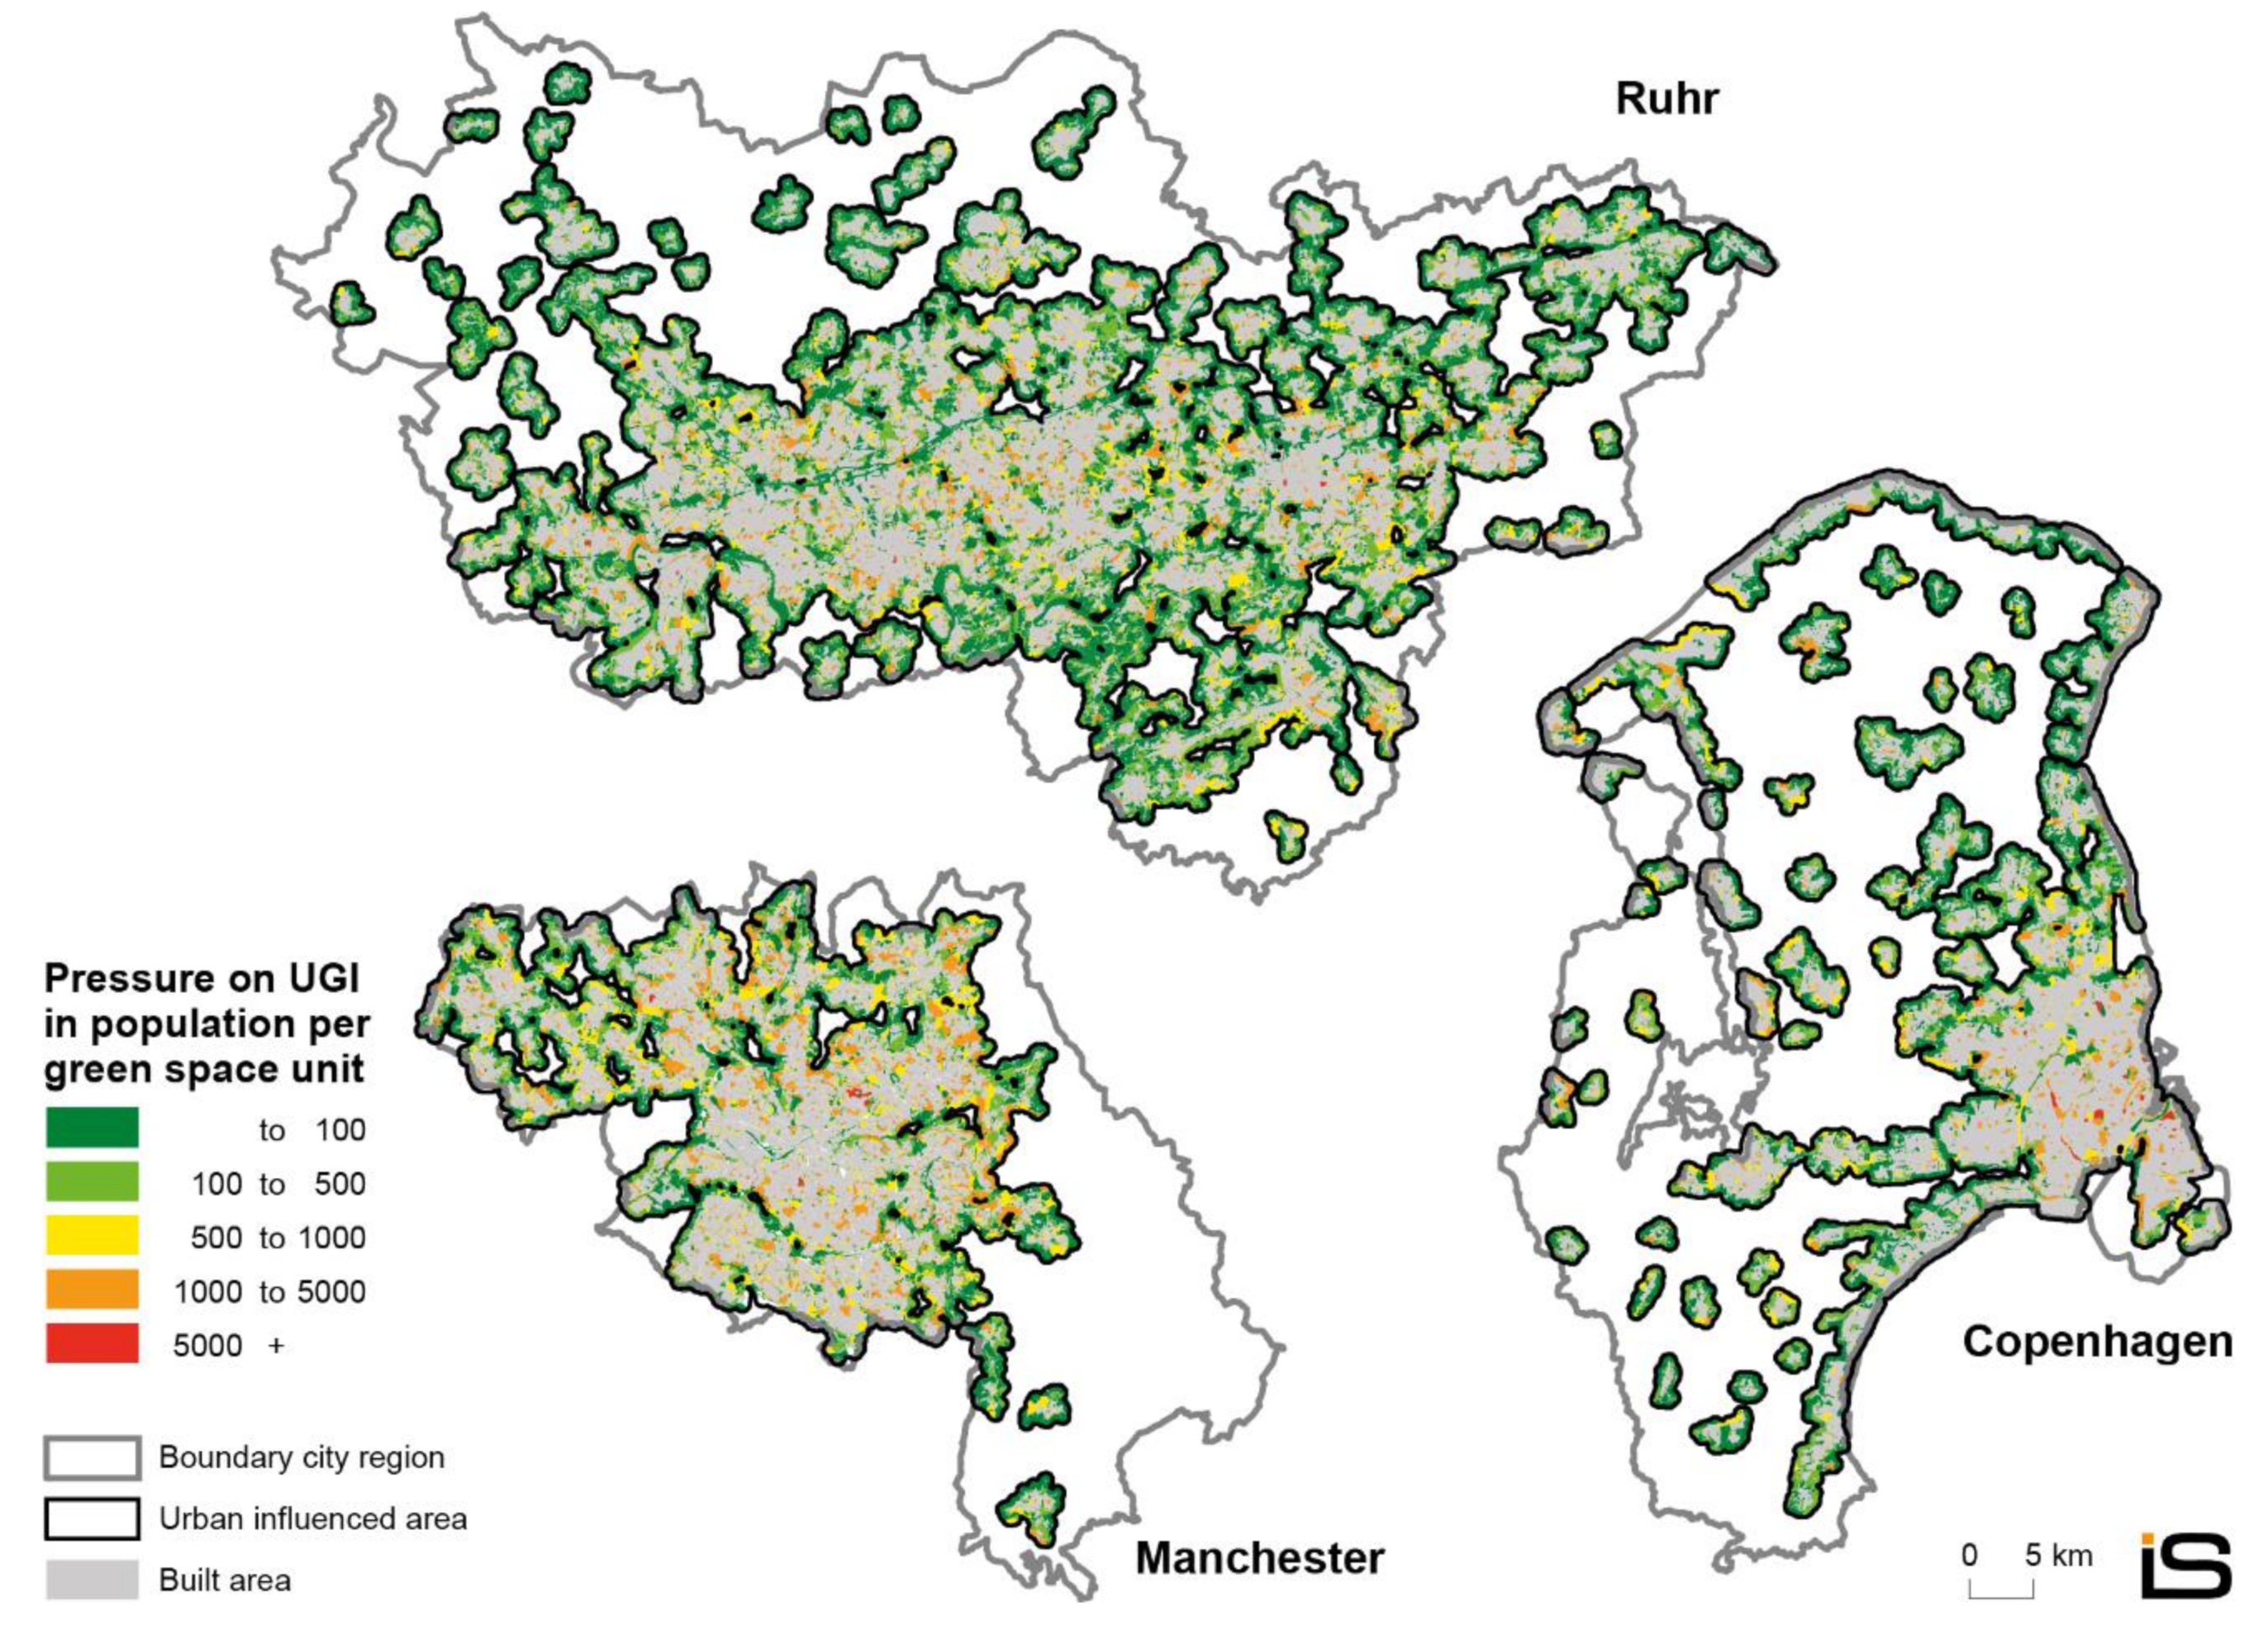
These relevant papers contain several indicators that help understand the difference between pure supply from a user perspective and connected supply from an infrastructure perspective. Several studies currently investigate green infrastructure provision in terms of green space per capita or average distance to the next green space [20,21]. These ideas are linked to planning principles of setting minimum supply thresholds, like Accessible Natural Greenspace Standard (ANGSt) in UK planning [32], and help identify plots of low supply with need for action. These indicators often use similar definitions of UGI and supplement EUA data with small scale census data. In the case of Copenhagen, Manchester, and the Ruhr area, this logic leads to the results shown in Figure 2, where the census grid population data are linked to the nearest available urban green infrastructure element. Thus, we can hypothesize that the redder a green infrastructure component, the more pressure there is in terms of potential demand.
The individual maps show whether there is too little supply in specific areas of a city or not. In the three case studies, we can state that for the more monocentric cities of Copenhagen and Manchester, city centres display a relatively low supply of green compared to a high demand. For the more polycentric Ruhr area, this picture is less obvious, but the tendency is also spottable. These relationships are linked to the general trade-off between compactness and green space availability [20].
Embedded in the above discussion, we want to extend those kinds of approaches by focusing not on the UGI supply for people per se, but looking at the relative distance between green spaces and how those are connected, which is rooted in the understanding of the GI definition’s connectivity pillar [1,7]. For this extended analysis, we suppose two indicators:
- Isolation of green spaces—The first indicator is similar to standard distance measures used in multifunctionality analyses. In contrast, the focus is not on identifying where isolated settlement areas are situated within the urban realm, as is the case for the distance from any settlement area to the nearest green space [21]. In our case, the mapping logic starting point is each green space from which we calculate the distance to the nearest neighbouring green space. By doing so, our indicator highlights areas within urban influenced areas where green space supply is relatively scattered and isolated. More precisely, the isolation is centred around the spatial linkage of one element of green infrastructure to another. In the case of a green space that is far away from the nearest next green space, the indicator is high, and vice versa for plots in which green spaces directly connect to another.Isolation can, therefore, be seen as a spatially explicit version of the proximity metric used in landscape analysis [14]. The motivation is to inform spatial planning in cities and regions not only where settlement areas lack connectivity to green spaces but also to extend the view of UGI to understand where there is a lack of green space connectivity.
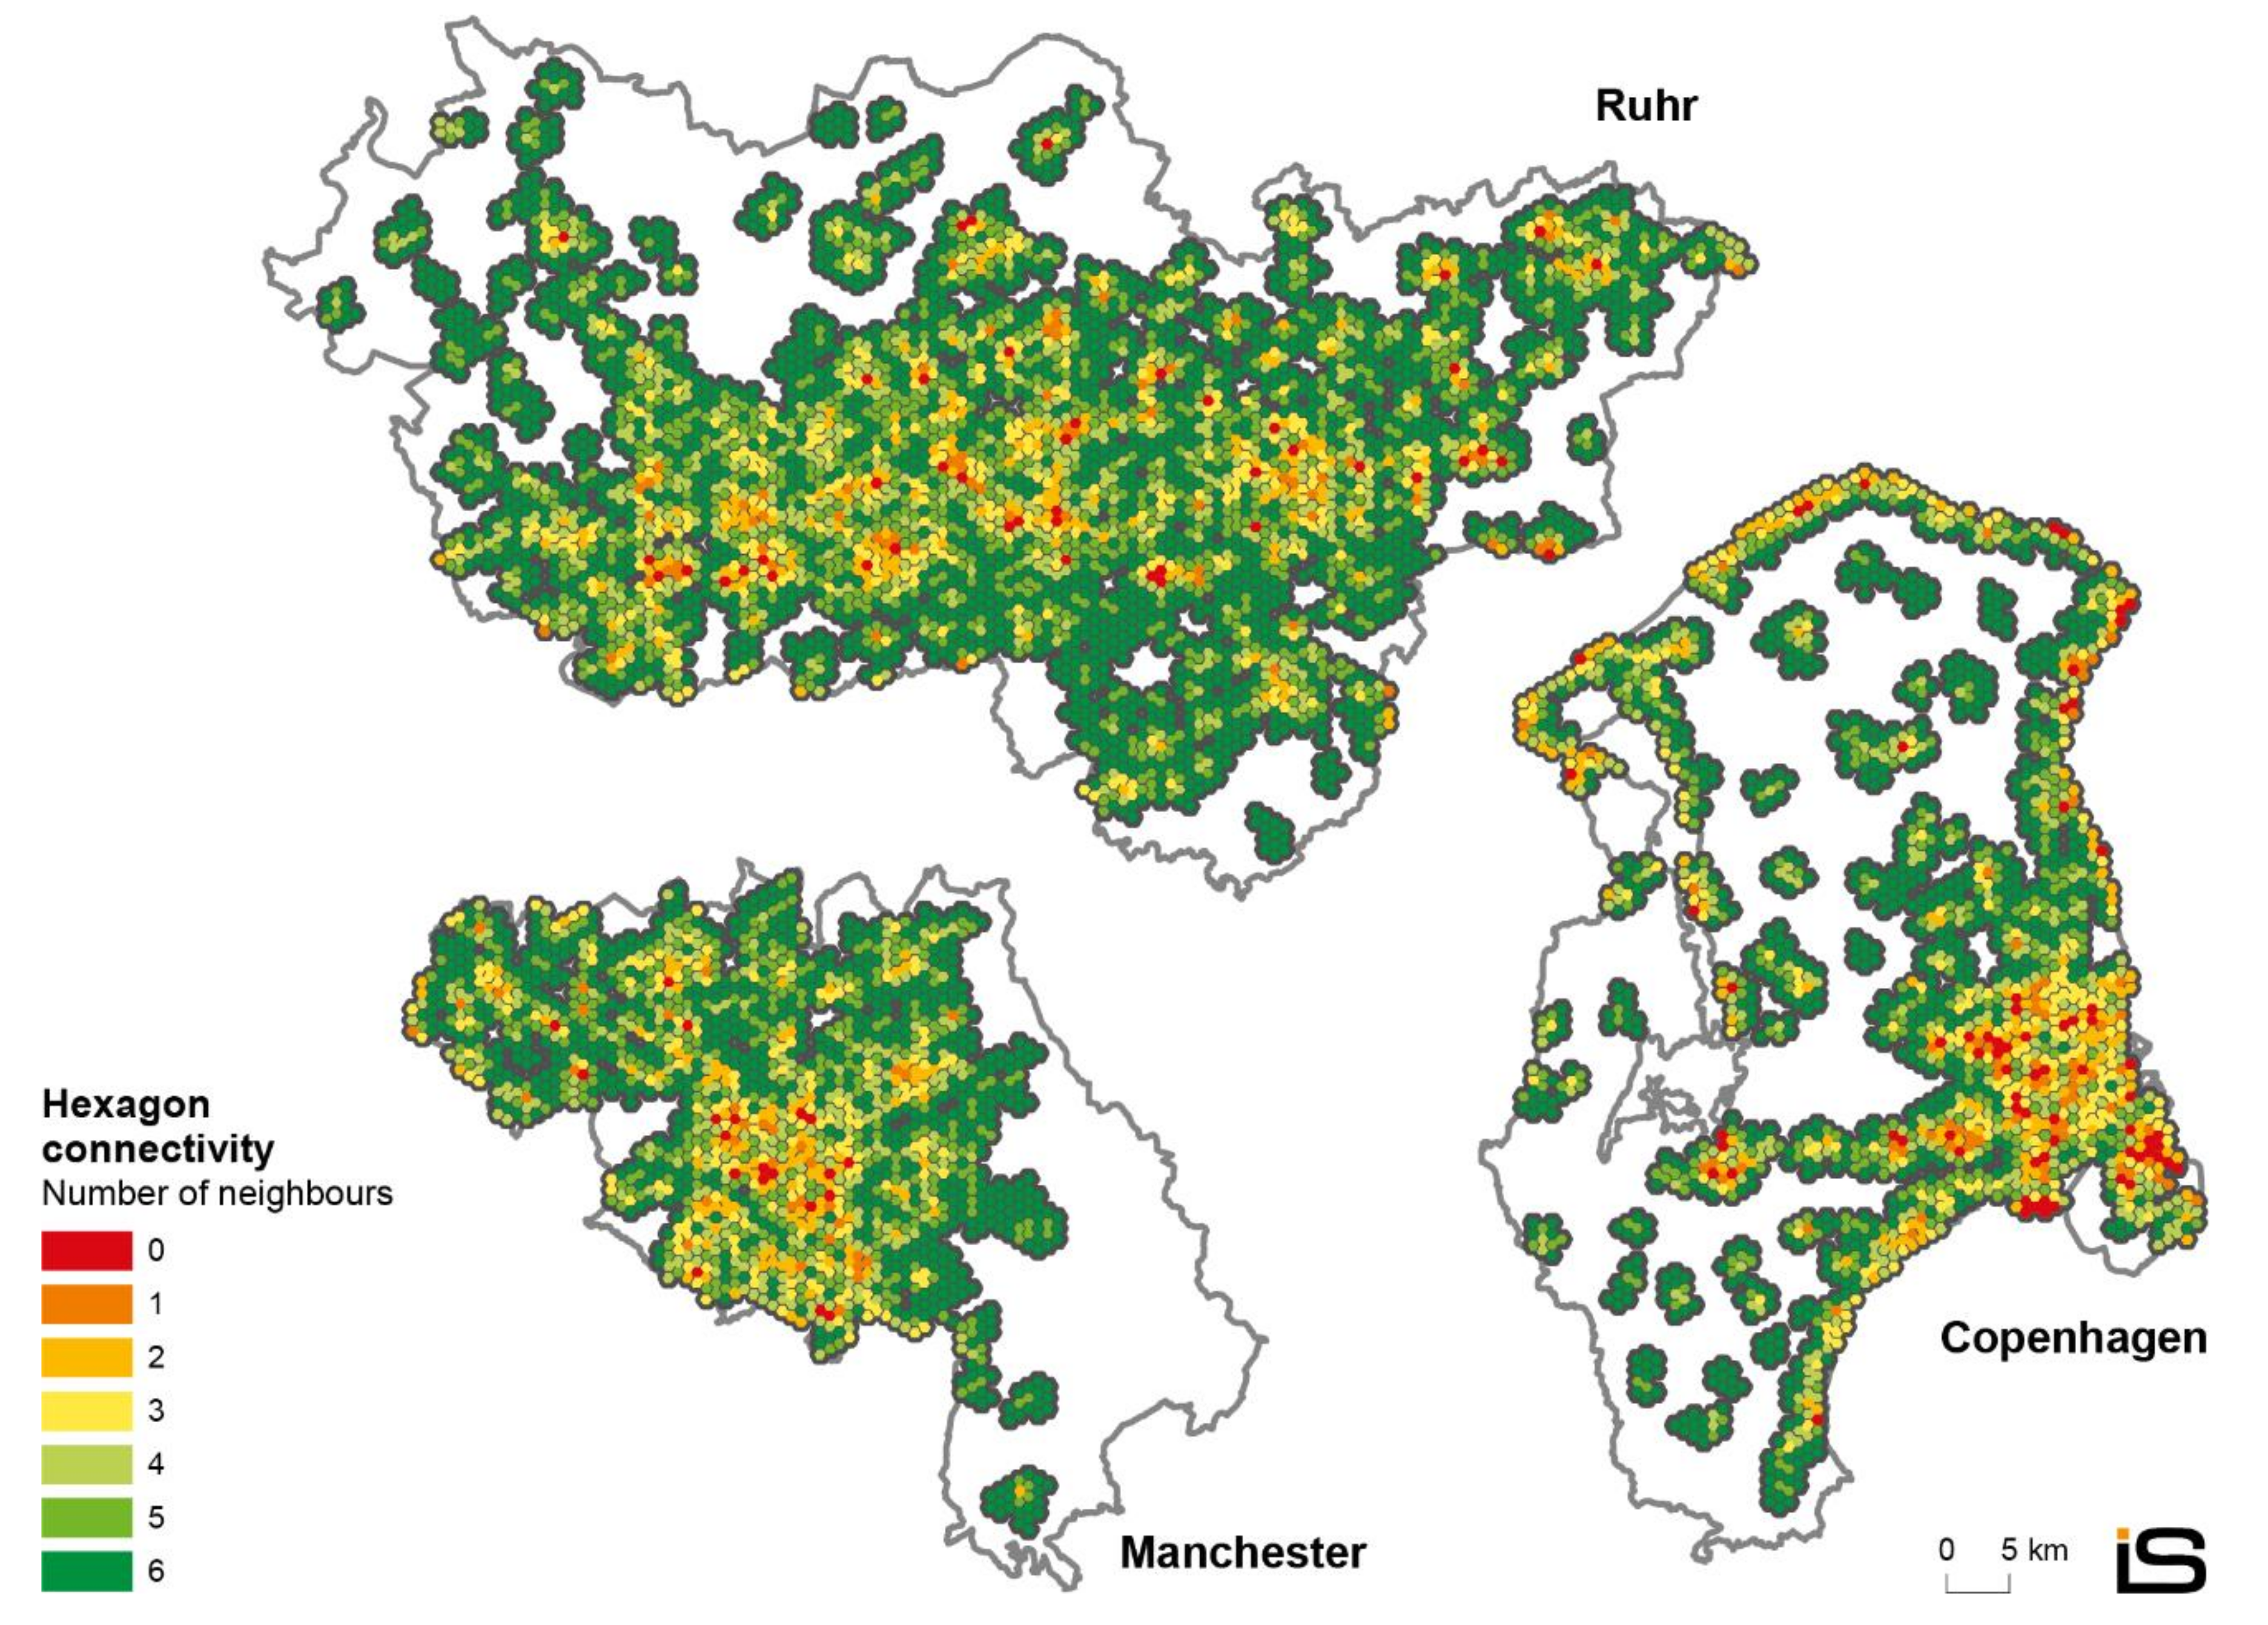
- Connectivity hexagons—The isolation analysis is further deepened by introducing a hexagon grid onto the spatial extension of the urban influenced area. Hexagon grids are very powerful when looking at cell connectivity because they outperform regular rectangular grids in terms of explaining neighbourhood connectivity levels. This is because they cover an entire area of interest but also give information on the number of neighbourhood connections while offering minimum distances between hexagon centres [33].In our UGI connectivity analysis, we construct a hexagon grid with 500-m sides for the three urban-influenced case study areas. For each grid cell, we set the dominating land use class as its cell type, green space or settlement area. For instance, a hexagon in which the dominant land use is commercial areas, will be defined as settlement area. In contrast to this there are green area hexagons, if the dominant land use (over 50% of the hexagon area) is of any of the UGI land use types.
Based on this typology, we count the number of green space neighbours to each centre cell, thus ranging from zero to six possible connections for each hexagon. This allows us to map the degree of connectivity for each case study and display connectivity histograms as a summary indicator.
3. Results
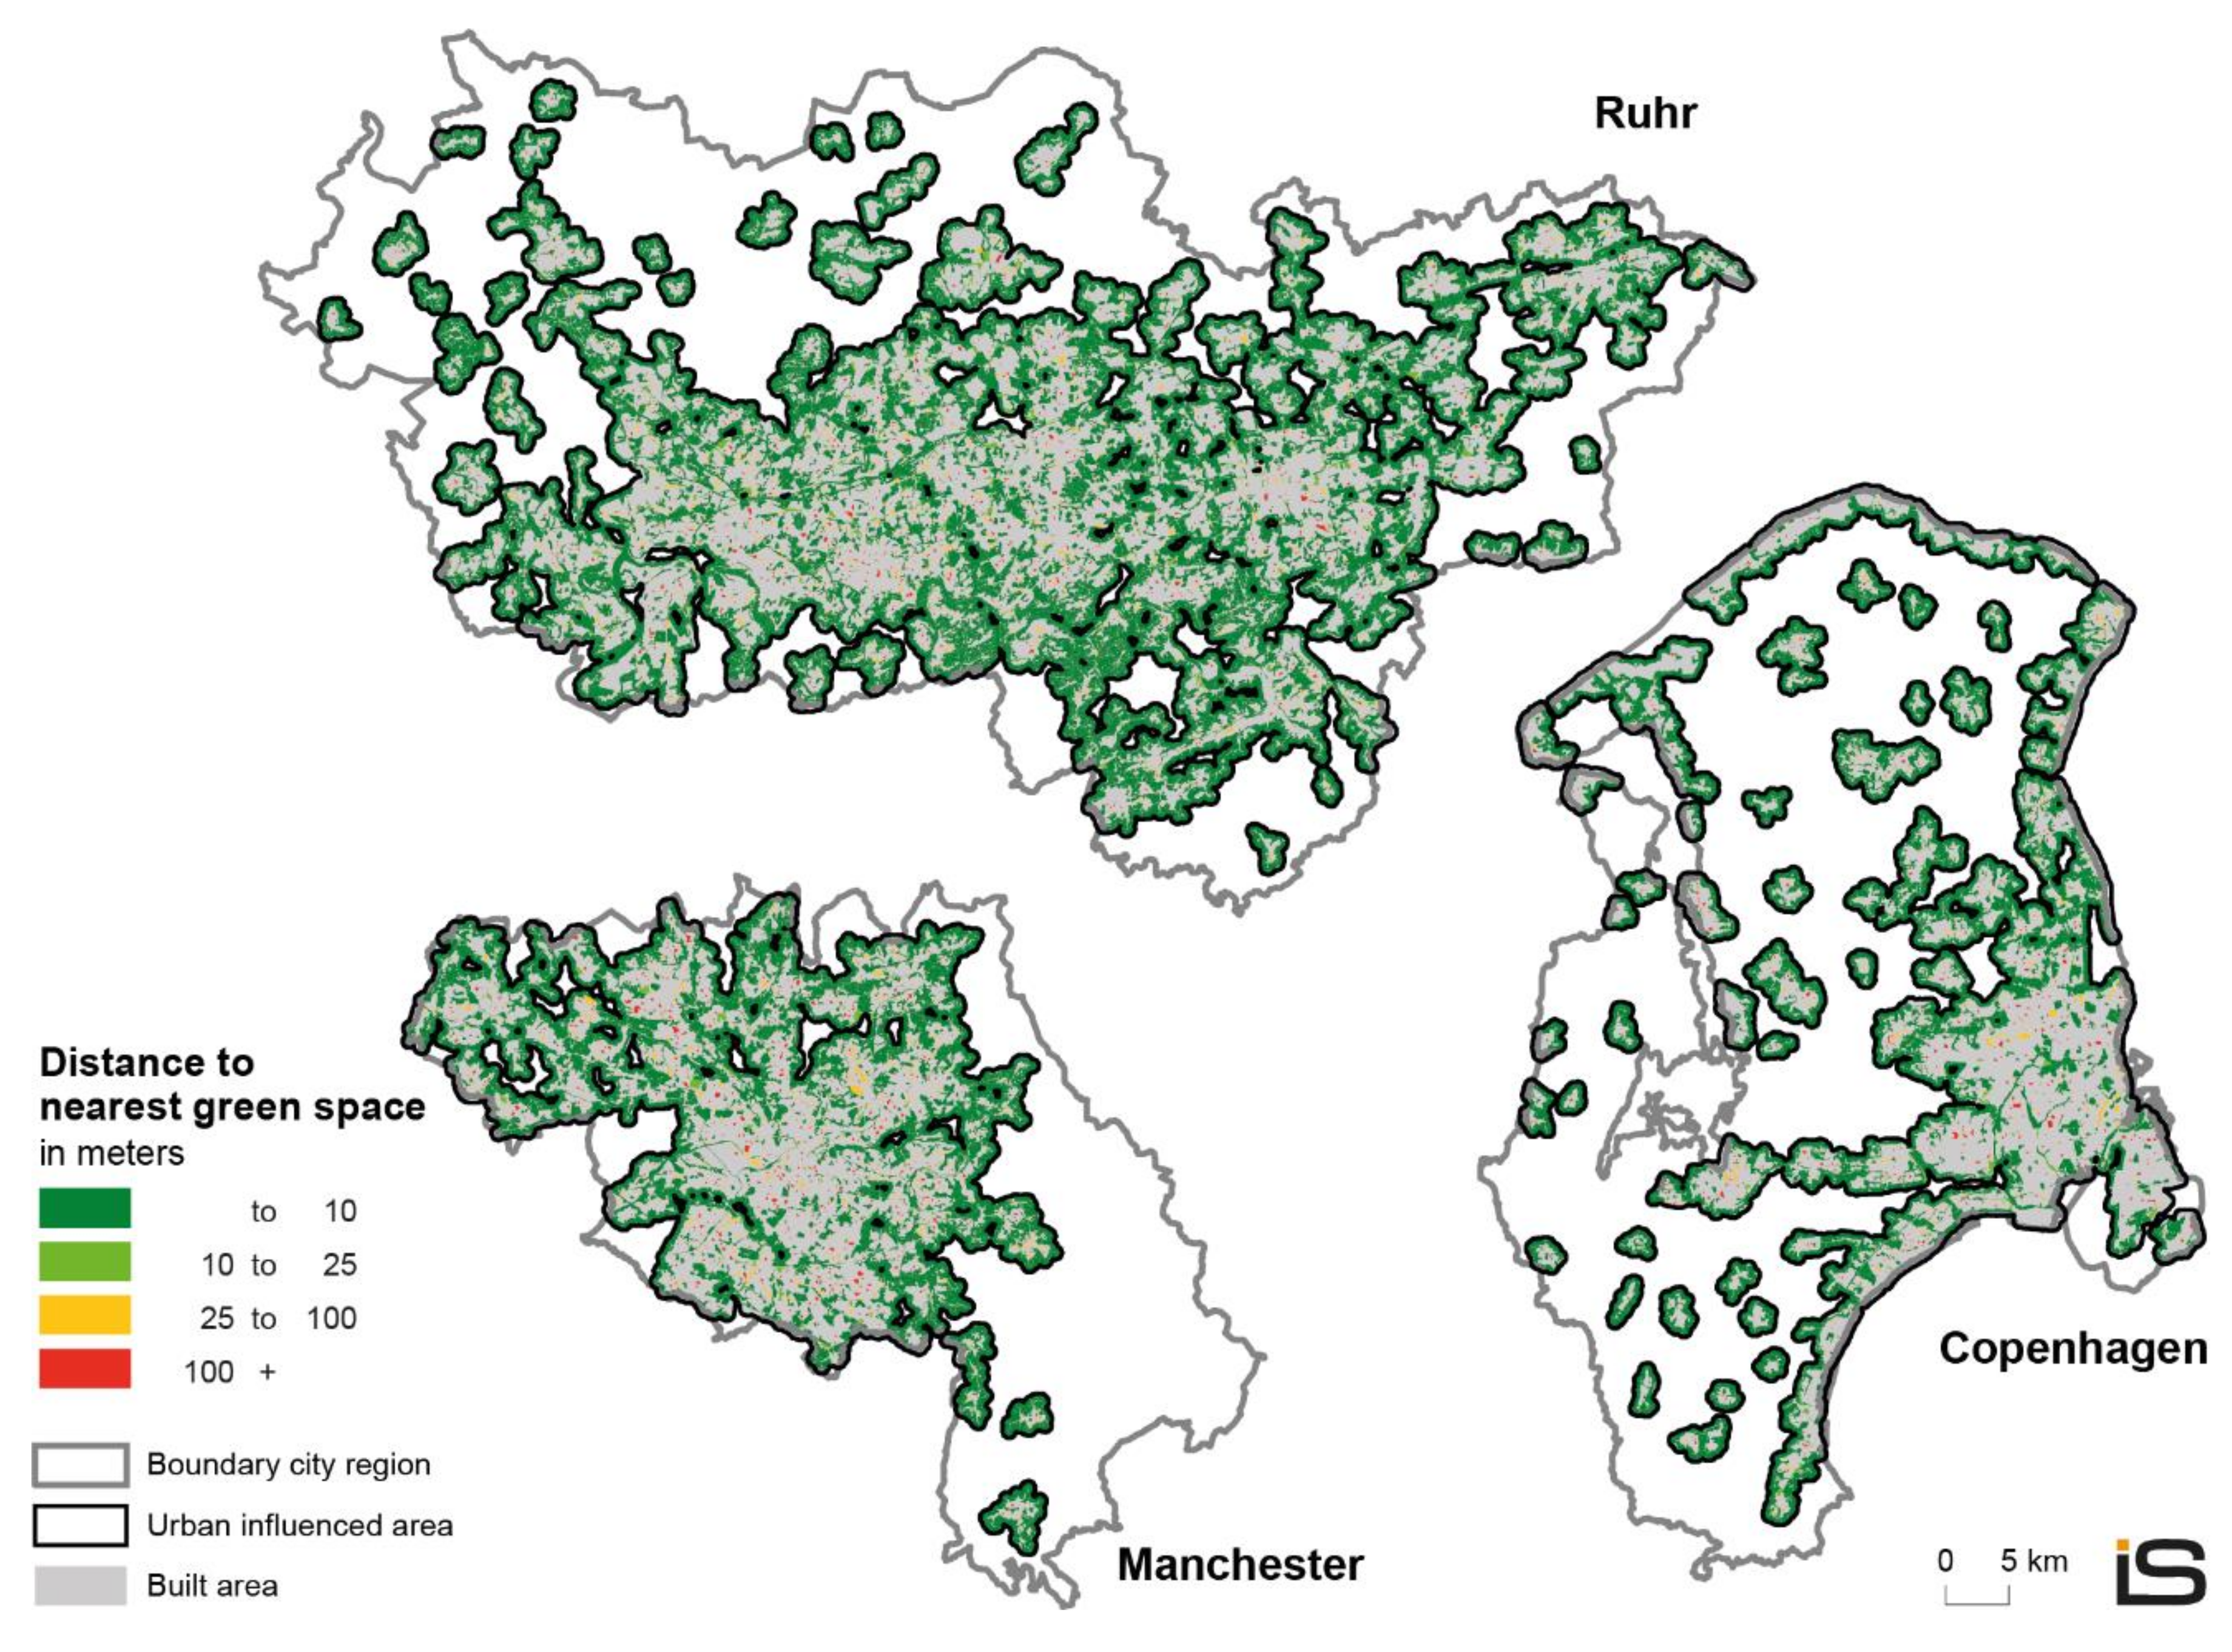
As a first step in understanding the UGI connectivity in our case study regions, we map the isolation indicator results in Figure 3. For each city region, the isolation degree of green open spaces is measured in metric distance.
Figure 3 shows that the similarity to general accessibility indicators is easily recognized (compare Figure 2). Nevertheless, despite repeating the core-periphery accessibility pattern, the view on isolation gives additional impressions of “green islands” within the urban influenced area. Greater Manchester seems to have a less isolated UGI network in the more northern boroughs, while the southwest shows a tendency to have pockets of green spaces that are not well connected. In contrast, Copenhagen’s UGI isolation map shows strong connections within the “fingers”, which are the settlement extensions along the main transport corridors. However, for each central place within the fingers, there is a similar picture of isolation as in the city centre. For the Ruhr area, there tends to be more isolation in the urban cores, but this pattern is altered by the green belt structures between the polycentric urban elements, which weaken the picture of a tendency towards UGI isolation.
An even deeper understanding of UGI connectivity degrees is shown when employing the hexagon connectivity approach, as shown in Figure 4.
Figure 4 clearly shows the potential of connectivity mapping based on neighbourhood relations. In addition to the isolation information, we can identify spots and pockets of weakly connected areas. The isolation interpretation results can be further reasoned in relation to the case studies. For the cases of Copenhagen and Manchester, there are pockets of weakly connected hexagons mainly in the city centres. Remarkably, it is now even more obvious that the “finger” settlements are only richly connected in their fringes and that for Manchester, the south shows significantly less connected hexagons than does the north. For the Ruhr area, more even distribution and intense connectivity are visualized.
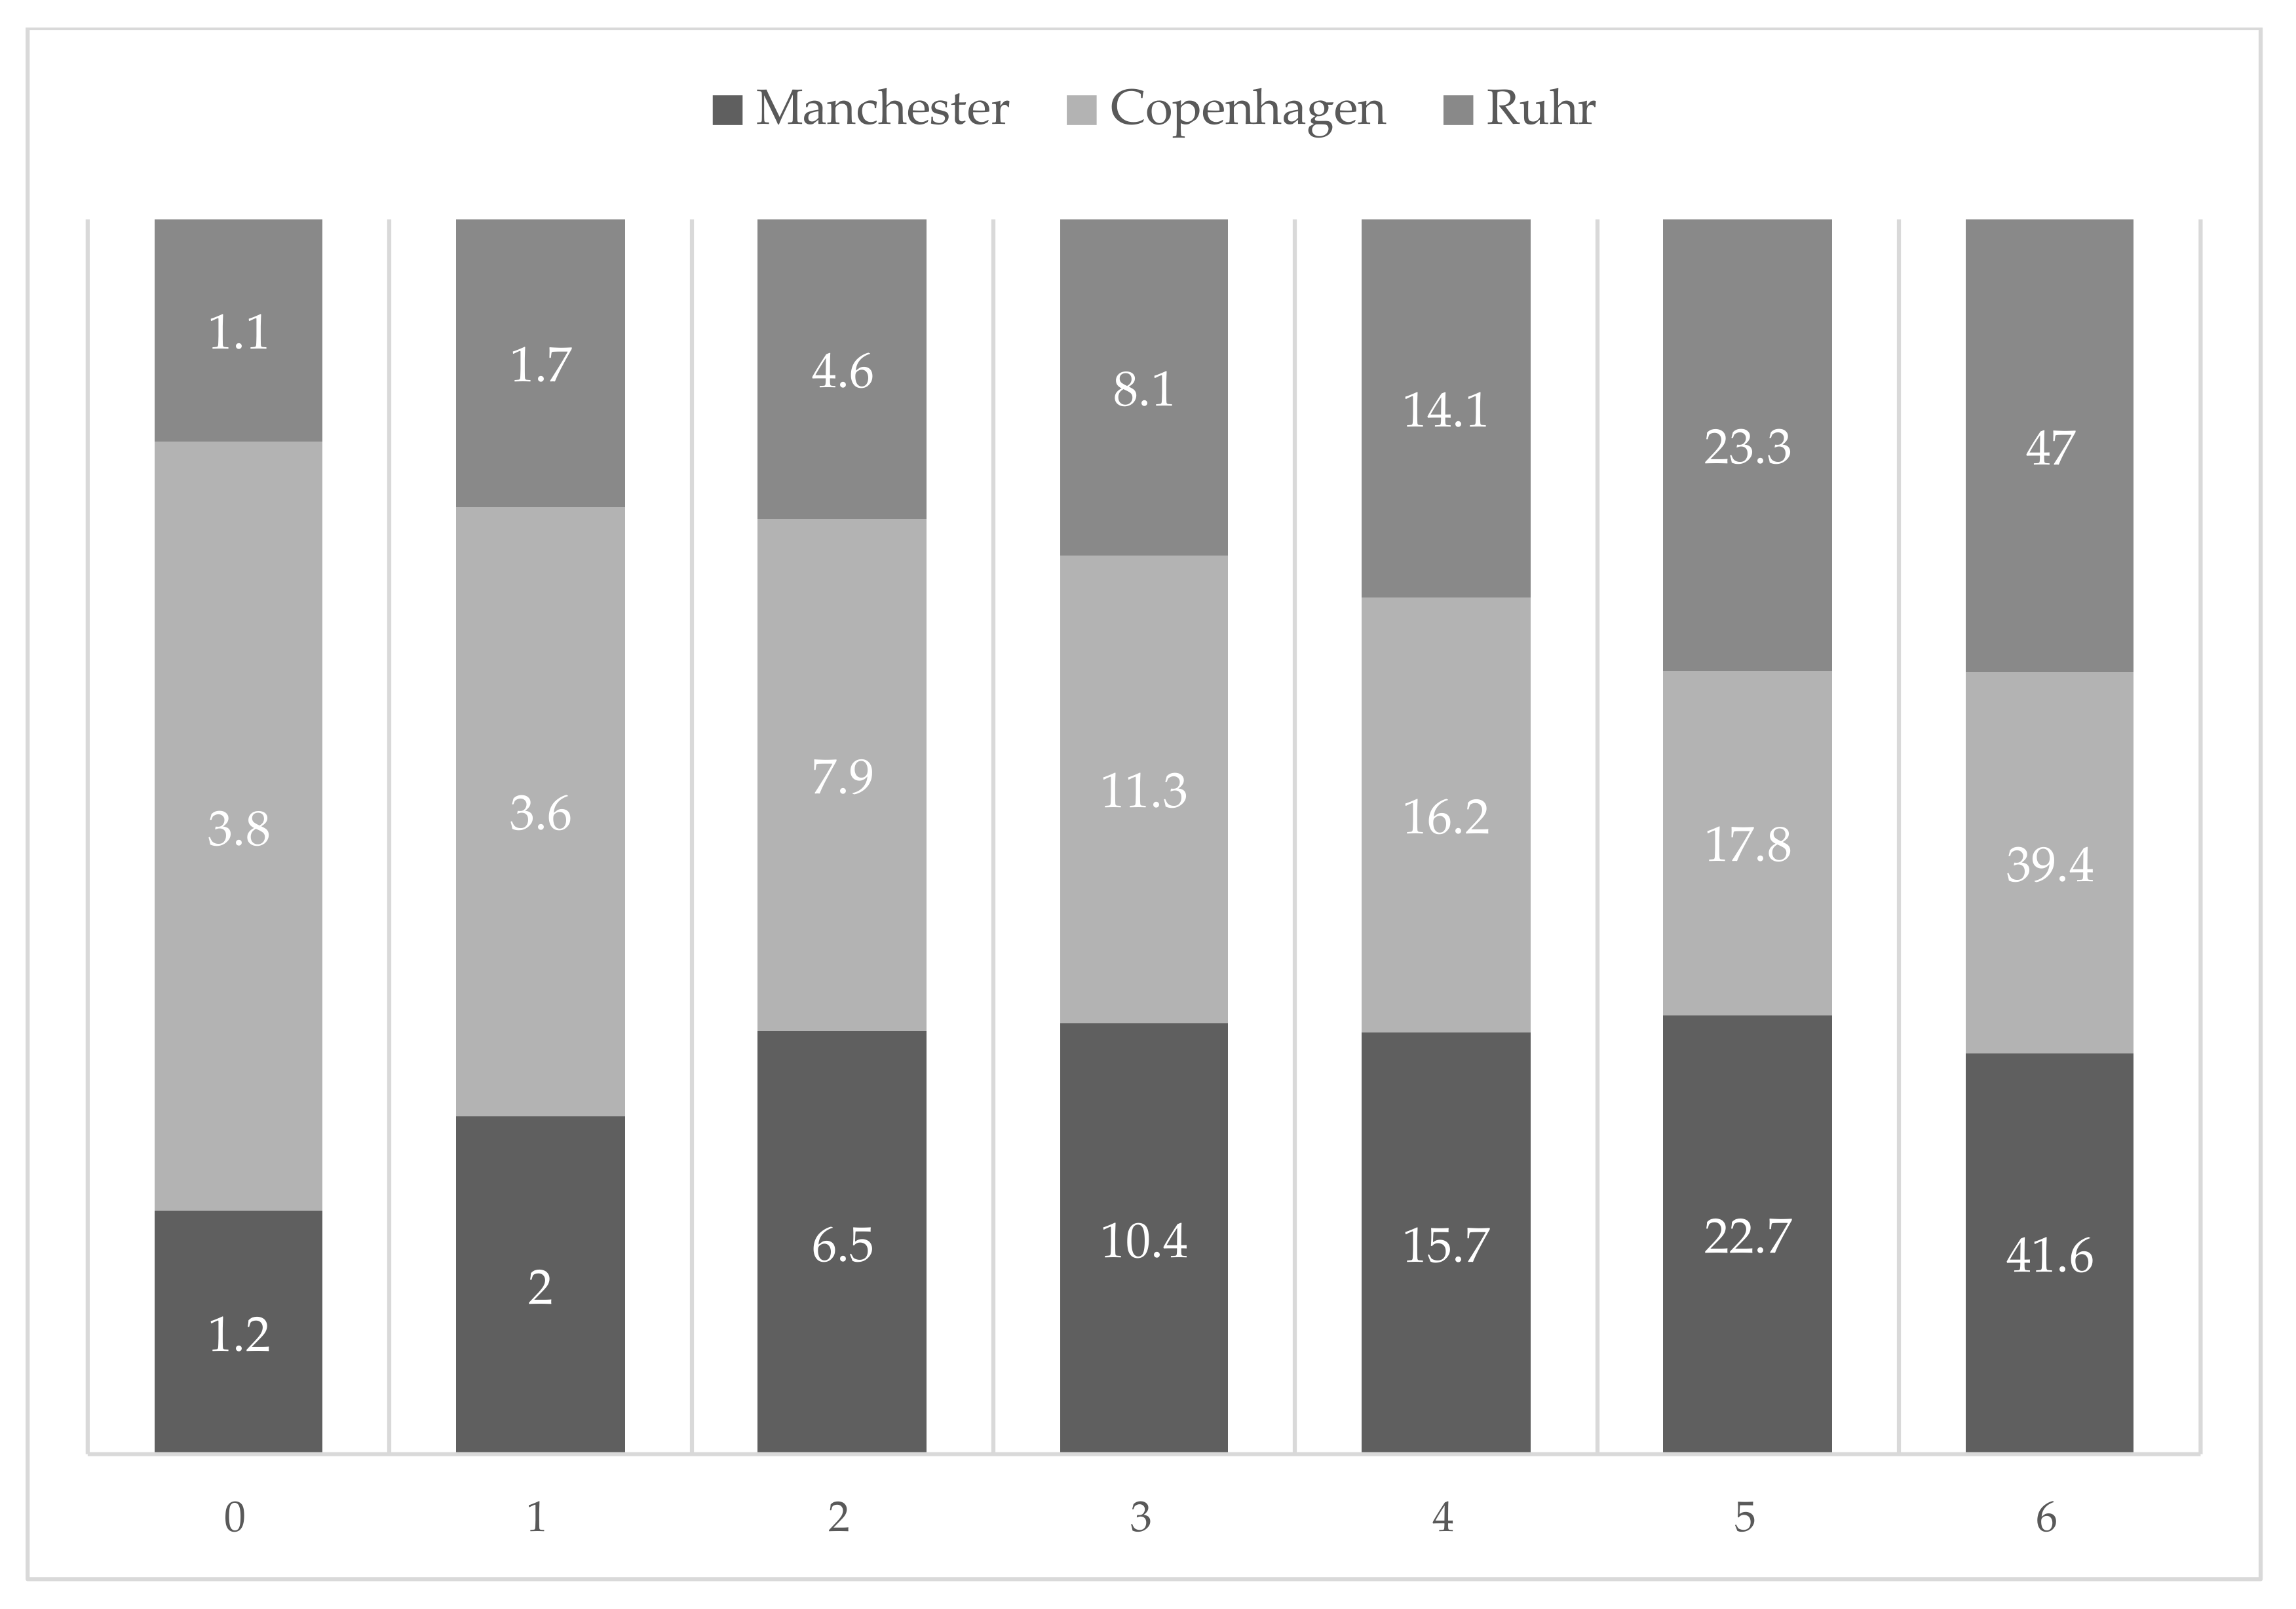
Connectivity frequency distributions help assess the overall relative spatial setting of urban green hexagons, as shown in Figure 5. The bars represent the overall number of hexagons with a specific number of green connections, while the numbers within the bars reflect the individual share of those hexagon cells within each city region.
The map’s overall visual impression is further fostered when interpreting the figure from least to most connected hexagon cells. The relative occurrence of grid cells with a low number of green connections is high for Copenhagen, while we can identify a relatively large share of highly connected cells for the Ruhr area.
4. Discussion
Connectivity indicators help link the comparative view of green infrastructure provision to planning research, i.e., the reasons for differences in green infrastructure connectivity. For the cases depicted here, several variances in UGI connectivity have been highlighted. Importantly, the indicators presented in this paper help to identify weak spots, but explanations are rooted in specific planning cultures, as they are context and path dependent [13]. For Manchester and Copenhagen, a study of planning documents from the last decades reveals that both city regions have a strong planning tradition for green open spaces that is deeply rooted in history [19]. This corresponds well with recent research on different conceptualisations and representations of nature and its place in urban environments [34]. The results presented in Section 3 clearly demonstrate different perceptions of the general relationship between nature and built environment in all three cases. While Manchester and Copenhagen represent cases where a clear division between open land and settlement areas is perceivable, the Ruhr seems to have a long tradition of integrating urban green into the urban fabric. As regards planning traditions as crucial signifiers of place-based planning cultures, the legacy of older planning traditions is obvious. Regarding Manchester and Copenhagen, the connectivity analysis showed that at the fringe of urban influenced areas, there is a more connected net of green spaces while, in central places, there is a clear lack of interconnection between green infrastructure elements. The Ruhr area used greening policies and programmes extensively, especially since the 1980s to change the perception of being a steel and coal mining region with structural economic problems (International Building Exhibition Emscher Park from 1989 to 1999). This is why connectivity shows a more even distribution in the Ruhr regions.
As introduced in Section 2, our cases represent different planning traditions and families across Europe. While these may characterize well the basic characteristics of domestic spatial planning in different nation states (i.e., legal and administrative structures, basic understanding of the role of spatial planning in societies), recent organizational shifts of domestic planning systems might affect green infrastructure planning. This is striking in the Copenhagen case, where institutional reforms in 2007 have led to a two-tier planning system without a regional planning scale with decisive competencies. As green infrastructure and its connectivity is a regional issue, missing regional institutional structures are leading to somehow uncertain perspectives concerning strategic regional infrastructure planning. Manchester is another case where planning professionals are used to shifting institutional architectures, still finding ways of pragmatically deal with green infrastructure from a regional perspective. In the Ruhr, such volatile institutional frameworks are absent. The planning system is mature and stable, thus, clear competencies and regional planning frameworks help implement regional green infrastructure.
Anyhow, data and evidence-based knowledge on green infrastructure connectivity still is not fully integrated in everyday planning practice in all three regions. Local planning cultures and established legacies of spatial planning practices might hinder new concepts, i.e., green infrastructure, and related data dealing with these concepts to travel from discourse to reality. Our cases show that some cities and city-regions are more sensitive to adapt and test innovative concepts (Manchester and the Ruhr), while others are more reluctant to new vocabularies and concepts (Copenhagen).
For conclusions on green infrastructure strategies, connectivity maps and information are crucial for decision-making processes; these often do not clearly address how the principles of the green infrastructure concept should be empowered in planning practice [6]. Information on neighbourhood connections of green spaces can be used to link to functional or structural connectivity understandings, which are used in ecological analysis and focus on animal and human movement [15]. Also, our approach has potential to support planning practices that especially rely on indicators for degrees of connectivity [35]. Small scale judgement on which ecosystem services, for example water runoff and retention capacities, are provided in which spatial context needs to rely on the connectivity of urban green space.
Finally, when it comes to implementing UGI strategies, it is crucially important to link the analytical views on connectivity with those based on the multifunctionality principle. Combining both elements allows us to achieve a more holistic understanding of how a UGI network should look [36]. In particular, when looking at sustainability challenges for urban regions, bridging multifunctionality and connectivity is of utmost importance. A well-structured UGI plan needs to understand where (ecosystem) service areas of demand, supply and connection are located in the urban area [37]. In fact, in many city regions, there is a significant mismatch between supplying and demanding areas in many European city regions [38], so that implementing connectivity focused measures can help closing these gaps. The green infrastructure concept potential can only be exploited by following this integrated approach [39].
5. Conclusions
As this discussion reveals, there is demand for further research on UGI connectivity, in terms of combining different principles into a common concept and in improving the indicator quality. Currently, land use data are becoming available that will further enhance the quality and ability to map green infrastructure in detail. Copernicus (www.copernicus.eu) remote sensing data are very promising in this regard. They allow the use of finer spatial resolutions to analyse green infrastructure elements, which is especially important for detecting green linkages. This will improve the quality of connectivity indicators but also provide the chance to analyse differences and potential effects of private green space on public land use classified as green structures [13]. In addition, for the grid cell indicator, it will be relevant to integrate such measures into existing spatial statistics tools [40], especially in terms of detecting and delineating clustered action points within urban areas.
Author Contributions
Conceptualization has been done by all authors; methodology, K.R., R.S.; validation, all authors; methodology, R.S., K.R.; writing—original draft preparation, all authors; writing—review and editing, all authors; visualization, R.S.; supervision, K.R.
Funding
This research received no external funding.
Acknowledgments
The authors would like to thank Jutta Rönsch and Pamela Sanwald for their support in improving the visual impressions of the presented maps.
Conflicts of Interest
The authors declare no conflicts of interest.
References
- Mell, I.C. Green infrastructure: Reflections on past, present and future praxis. Landsc. Res. 2017, 42, 135–145. [Google Scholar] [CrossRef]
- Fuller, R.A.; Gaston, K.J. The scaling of green space coverage in European cities. Biol. Lett. 2009, 5, 352–355. [Google Scholar] [CrossRef] [PubMed]
- Communication from the Commission to the European Parliament; The Council; The European Economic and Social Committee; The committee of the Regions. Green Infrastructure (GI)—Enhancing Europe’s Natural Capital. Available online: https://eur-lex.europa.eu/legal-content/EN/ALL/?uri=celex:52013DC0249 (accessed on 26 March 2019).
- Hansen, R.; Pauleit, S. From multifunctionality to multiple ecosystem services? A conceptual framework for multifunctionality in green infrastructure planning for urban areas. Ambio 2014, 43, 516–529. [Google Scholar] [CrossRef] [PubMed]
- Dige, G.; Liquete, C.; Kleeschulte, S.; Banko, G. Spatial Analysis of Green Infrastructure in Europe; Publications Office: Luxembourg, 2014. [Google Scholar]
- Grădinaru, S.R.; Hersperger, A.M. Green infrastructure in strategic spatial plans: Evidence from European urban regions. Urban For. Urban Green. 2018, 1–12. [Google Scholar] [CrossRef]
- Lennon, M.; Scott, M. Delivering ecosystems services via spatial planning: Reviewing the possibilities and implications of a green infrastructure approach. Town Plan. Rev. 2014, 85, 563–587. [Google Scholar] [CrossRef]
- Maes, J.; Barbosa, A.; Baranzelli, C.; Zulian, G.; Batista Silva, F.; Vandecasteele, I.; Hiederer, R.; Liquete, C.; Paracchini, M.L.; Mubareka, S.; et al. More green infrastructure is required to maintain ecosystem services under current trends in land-use change in Europe. Landsc. Ecol. 2015, 30, 517–534. [Google Scholar] [CrossRef] [PubMed]
- Demuzere, M.; Orru, K.; Heidrich, O.; Olazabal, E.; Geneletti, D.; Orru, H.; Bhave, A.G.; Mittal, N.; Feliu, E.; Faehnle, M. Mitigating and adapting to climate change: Multi-functional and multi-scale assessment of green urban infrastructure. J. Environ. Manag. 2014, 146, 107–115. [Google Scholar] [CrossRef]
- Voskamp, I.M.; van de Ven, F.H.M. Planning support system for climate adaptation: Composing effective sets of blue-green measures to reduce urban vulnerability to extreme weather events. Build. Environ. 2015, 83, 159–167. [Google Scholar] [CrossRef]
- Mell, I.; Allin, S.; Reimer, M.; Wilker, J. Strategic green infrastructure planning in Germany and the UK: A transnational evaluation of the evolution of urban greening policy and practice. Int. Plan. Stud. 2017, 22, 333–349. [Google Scholar] [CrossRef]
- Liquete, C.; Kleeschulte, S.; Dige, G.; Maes, J.; Grizzetti, B.; Olah, B.; Zulian, G. Mapping green infrastructure based on ecosystem services and ecological networks: A Pan-European case study. Environ. Sci. Policy 2015, 54, 268–280. [Google Scholar] [CrossRef]
- Lindholm, G. The implementation of green infrastructure: Relating a general concept to context and site. Sustainability 2017, 9, 610. [Google Scholar] [CrossRef]
- Lynch, A.J. Is it good to be green? Assessing the ecological results of county green infrastructure planning. J. Plan. Educ. Res. 2015, 36, 90–104. [Google Scholar] [CrossRef]
- Bartesaghi Koc, C.; Osmond, P.; Peters, A. Towards a comprehensive green infrastructure typology: A systematic review of approaches, methods and typologies. Urban Ecosyst. 2017, 20, 15–35. [Google Scholar] [CrossRef]
- Sartorio, F.S.; Thomas, H.; Harris, N. Interpreting planners’ talk about change: An exploratory study. Plan. Theory 2017, 17, 605–627. [Google Scholar] [CrossRef]
- Reimer, M. Planning cultures in transition: Sustainability management and institutional change in spatial planning. Sustainability 2013, 5, 4653–4673. [Google Scholar] [CrossRef]
- Othengrafen, F. The concept of planning culture: Analysing how planners construct practical judgements in a culturised context. Int. J. E Plan. Res. 2014, 3, 1–17. [Google Scholar] [CrossRef]
- Reimer, M.; Rusche, K. Green infrastructure under pressure. A global narrative between regional vision and local implementation. Eur. Plan. Stud. 2019. [Google Scholar] [CrossRef]
- Kabisch, N.; Strohbach, M.; Haase, D.; Kronenberg, J. Urban green space availability in European cities. Ecol. Indic. 2016, 70, 586–596. [Google Scholar] [CrossRef]
- Grunewald, K.; Richter, B.; Meinel, G.; Herold, H.; Syrbe, R.-U. Proposal of indicators regarding the provision and accessibility of green spaces for assessing the ecosystem service “recreation in the city” in Germany. Int. J. Biodivers. Sci. Ecosyst. Serv. Manag. 2017, 13, 26–39. [Google Scholar] [CrossRef]
- Newman, P.; Thornley, A. Urban Planning in Europe: International Competition, National Systems, and Planning Projects; Routledge: London, UK, 1996. [Google Scholar]
- Galland, D.; Sørensen, M.T. Daniel Galland, Michael Tophøj Sørensen—Denmark. DISP Plan. Rev. 2015, 51, 30–31. [Google Scholar] [CrossRef]
- Rusche, K. Ökonomischer Nutzen Grüner Infrastruktur: Mehr Lebensqualität durch Stadtgrün? Ber. Dtsch. Landeskd. 2012, 86, 255–268. [Google Scholar]
- Derkzen, M.L.; van Teeffelen, A.J.A.; Verburg, P.H.; Diamond, S. REVIEW: Quantifying urban ecosystem services based on high-resolution data of urban green space: An assessment for Rotterdam, The Netherlands. J. Appl. Ecol. 2015, 52, 1020–1032. [Google Scholar] [CrossRef]
- Eler, K.; Zeleznikar, S.; Cveji, R.; Pintar, M.; Haase, D.; Kabisch, N.; Strohbach, M.; Annerstedt van den Bosch, M.; Kowarik, I.; Fischer, L.K. Green Surge, Functional Linkages between Urban Green Infrastructure, Biodiversity and Human Well-Being; University of Copenhagen: Copenhagen, Denmark, 2016. Available online: https://greensurge.eu/working-packages/wp3/files/D3.2_final.pdf (accessed on 26 March 2019).
- Geoghegan, J.; Wainger, L.A.; Bockstael, N.E. Spatial landscape indices in a hedonic framework: An ecological economics analysis using GIS. Ecol. Econ. 1997, 23, 251–264. [Google Scholar] [CrossRef]
- Palmer, J.F. Using spatial metrics to predict scenic perception in a changing landscape: Dennis, Massachusetts. Landsc. Urban Plan. 2004, 69, 201–218. [Google Scholar] [CrossRef]
- Poelman, H. A Walk to the Park? Assessing Access to Green Areas in Europe’s Cities; European Commission: Brussels, Belgium, 2018. Available online: https://ec.europa.eu/regional_policy/sources/docgener/work/2018_01_green_urban_area.pdf (accessed on 26. March 2019).
- European Environment Agency. Spatial Analysis of Green Infrastructure in Europe; European Environment Agency: Copenhagen, Denmark, 2014. Available online: https://www.eea.europa.eu/publications/spatial-analysis-of-green-infrastructure (accessed on 26 March 2019).
- Tratalos, J.A.; Haines-Young, R.; Potschin, M.; Fish, R.; Church, A. Cultural ecosystem services in the UK: Lessons on designing indicators to inform management and policy. Ecol. Indic. 2016, 61, 63–73. [Google Scholar] [CrossRef]
- Handley, J.; Pauleit, S.; Slinn, P.; Barber, A.; Baker, M.; Jones, C.; Lindley, S. Accessible Natural Green Space Standards in Towns and Cities, A Review and Toolkit for Their Implementation; English Nature: Manchester, UK, 2013. Available online: publications.naturalengland.org.uk/file/78003 (accessed on 26 March 2019).
- Birch, C.P.D.; Oom, S.P.; Beecham, J.A. Rectangular and hexagonal grids used for observation, experiment and simulation in ecology. Ecol. Model. 2007, 206, 347–359. [Google Scholar] [CrossRef]
- Duvall, P.; Lennon, M.; Scott, M. The ‘natures’ of planning: Evolving conceptualizations of nature as expressed in urban planning theory and practice. Eur. Plan. Stud. 2017, 26, 480–501. [Google Scholar] [CrossRef]
- Maragno, D.; Gaglio, M.; Robbi, M.; Appiotti, F.; Fano, E.A.; Gissi, E. Fine-scale analysis of urban flooding reduction from green infrastructure: An ecosystem services approach for the management of water flows. Ecol. Model. 2018, 386, 1–10. [Google Scholar] [CrossRef]
- Di Marino, M.; Lapintie, K. Exploring the concept of green infrastructure in urban landscape. Experiences from Italy, Canada and Finland. Landsc. Res. 2017, 43, 139–149. [Google Scholar] [CrossRef]
- Syrbe, R.-U.; Walz, U. Spatial indicators for the assessment of ecosystem services: Providing, benefiting and connecting areas and landscape metrics. Ecol. Indic. 2012, 21, 80–88. [Google Scholar] [CrossRef]
- Baró, F.; Haase, D.; Gómez-Baggethun, E.; Frantzeskaki, N. Mismatches between ecosystem services supply and demand in urban areas: A quantitative assessment in five European cities. Ecol. Indic. 2015, 55, 146–158. [Google Scholar] [CrossRef]
- Burkhard, B.; Kroll, F.; Nedkov, S.; Müller, F. Mapping ecosystem service supply, demand and budgets. Ecol. Indic. 2012, 21, 17–29. [Google Scholar] [CrossRef]
- Anselin, L.; Rey, S.J. Modern Spatial Econometrics in Practice: A Guide to GeoDa, GeoDaSpace and PySAL; GeoDa Press: Chicago, IL, USA, 2014. [Google Scholar]
Figure 1.
Case study regions and their urban influenced areas.
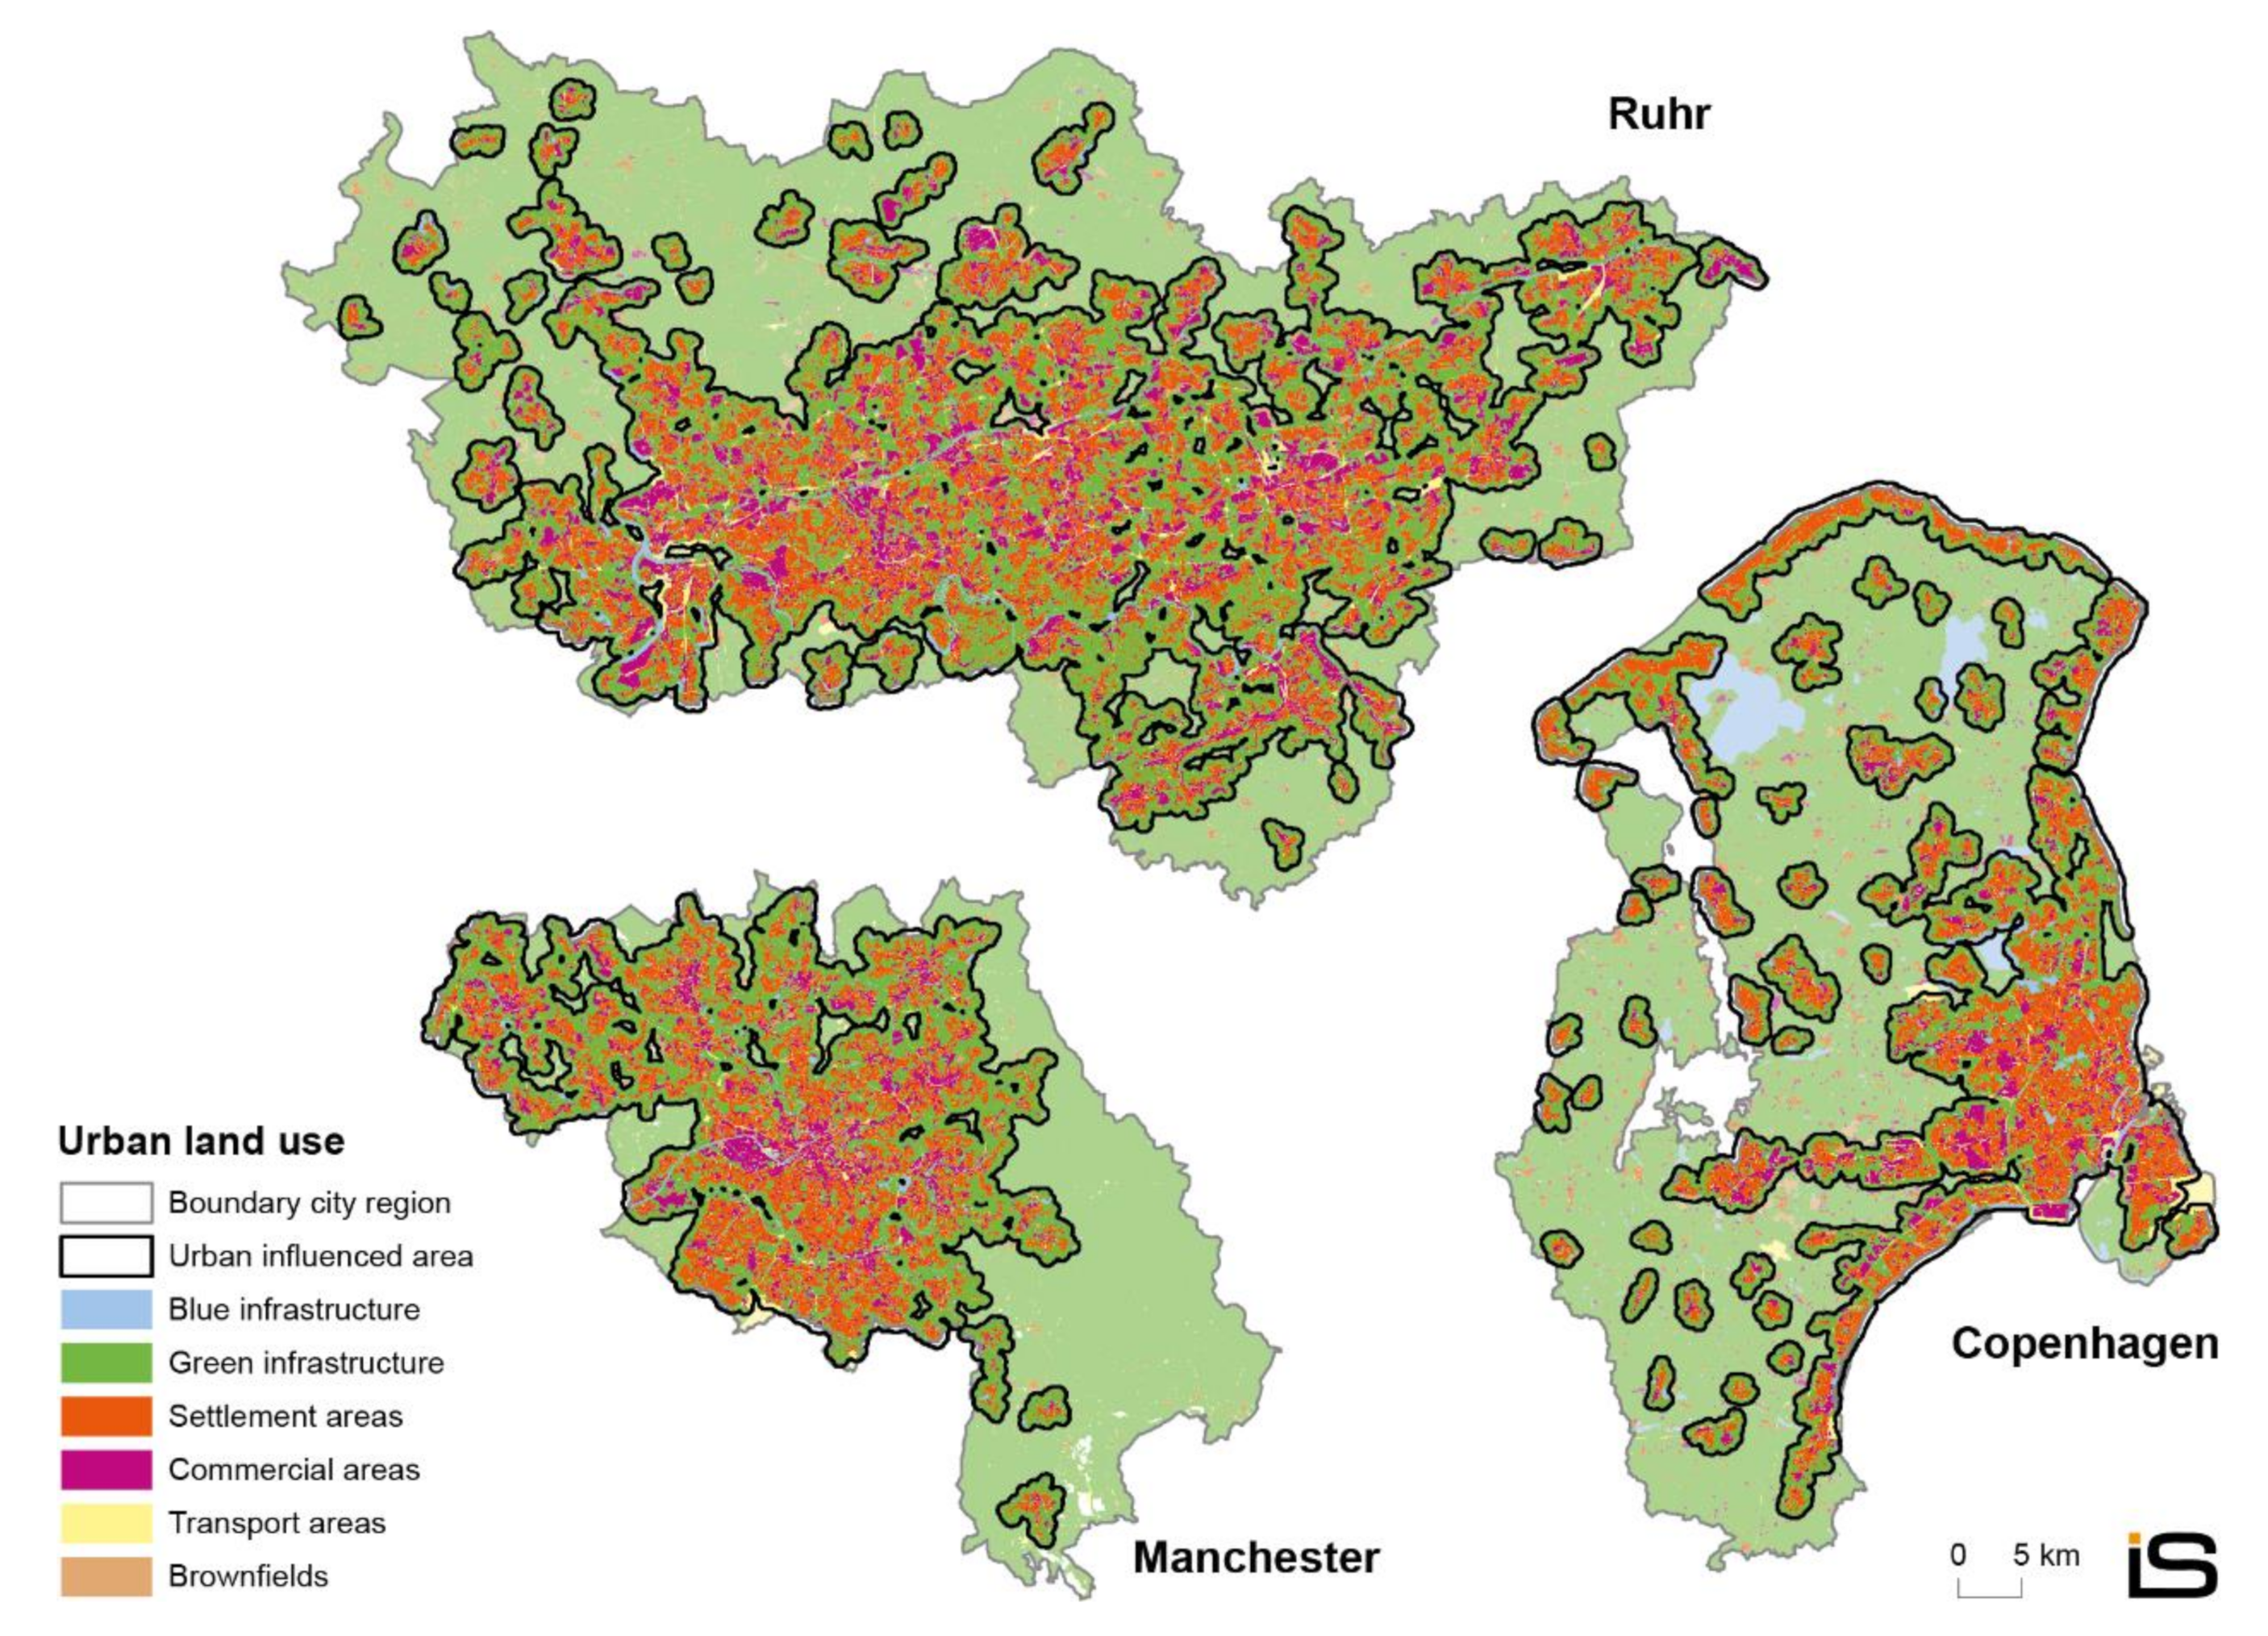
Figure 2.
Pressure on open space.

Figure 3.
Isolation of green infrastructure elements.

Figure 4.
Connectivity of the hexagon grid cells.

Figure 5.
Bar chart of hexagon connectivity distributions.


Table 1.
European Urban Atlas land use classes subsumed under urban green infrastructure.
| Elements of Green Infrastructure | |
|---|---|
| 14,100 | Green urban areas |
| 14,200 | Sports and leisure facilities |
| 21,000 | Arable land (annual crops) |
| 22,000 | Permanent crops (vineyards, fruit trees, olive groves) |
| 23,000 | Pastures |
| 24,000 | Complex and mixed cultivation patterns |
| 25,000 | Orchards at the fringe of urban classes |
| 31,000 | Forests |
| 32,000 | Herbaceous vegetation associations (natural grassland, moors, etc.) |
| 33,000 | Open spaces with little or no vegetation |
| 40,000 | Wetland |
| 50,000 | Water bodies |
© 2019 by the authors. Licensee MDPI, Basel, Switzerland. This article is an open access article distributed under the terms and conditions of the Creative Commons Attribution (CC BY) license (http://creativecommons.org/licenses/by/4.0/).
Share and Cite
MDPI and ACS Style
Rusche, K.; Reimer, M.; Stichmann, R. Mapping and Assessing Green Infrastructure Connectivity in European City Regions. Sustainability 2019, 11, 1819. https://0-doi-org.brum.beds.ac.uk/10.3390/su11061819
AMA Style
Rusche K, Reimer M, Stichmann R. Mapping and Assessing Green Infrastructure Connectivity in European City Regions. Sustainability. 2019; 11(6):1819. https://0-doi-org.brum.beds.ac.uk/10.3390/su11061819
Chicago/Turabian StyleRusche, Karsten, Mario Reimer, and Rico Stichmann. 2019. "Mapping and Assessing Green Infrastructure Connectivity in European City Regions" Sustainability 11, no. 6: 1819. https://0-doi-org.brum.beds.ac.uk/10.3390/su11061819
Note that from the first issue of 2016, this journal uses article numbers instead of page numbers. See further details here.