Article

Nutrient Pollutants in Surface Water—Assessing Trends in Drinking Water Resource Quality for a Regional City in Central Europe

by
Włodzimierz Kanownik
,
Agnieszka Policht-Latawiec
* and
Wioletta Fudała
Department of Land Reclamation and Environmental Development, Faculty of Environmental Engineering and Land Surveying, University of Agriculture in Krakow, Al. Mickiewicza 24-28, 30-059 Kraków, Poland
*
Author to whom correspondence should be addressed.
Sustainability 2019, 11(7), 1988; https://0-doi-org.brum.beds.ac.uk/10.3390/su11071988
Submission received: 10 January 2019 / Revised: 17 March 2019 / Accepted: 26 March 2019 / Published: 3 April 2019
(This article belongs to the Collection Eutrophication and Sustainable Management of Water)

Abstract

:
This paper presents the changes in concentration of seven biogenic indices in the Wisłok River water and determines the water treatment processes required in order to obtain water fit for consumption. The investigations were conducted during 2004–2013, and water samples were collected at a measuring-control point was situated at 67.9 km on the river at the surface water intake for the water supply to the Rzeszów city dwellers. Analysis of the research results allows for the forecasting of technological and organizational changes in the treatment processes of the abstracted water. It was found that only the mean concentration of Kjeldahl nitrogen exceeded the value admissible for class I, which allowed the Wisłok River water to be classified as class II with good potential and determined the water quality category as A2, which indicates the necessity for typical performance physical and chemical treatment. Downward trends in the contents of the tested nutrients occurred during the period of investigation, except for nitrite nitrogen. Statistically significant downward trends were registered for ammonium nitrogen, Kjeldahl nitrogen, total nitrogen and phosphates. The decline in nutrient concentrations in the water of Wisłok is a tangible result of the introduction of new standards of water resource management in the catchment, compliant with the European Union legislation.

1. Introduction

Considerable progress in the area of environment protection has been made since the accession of Poland, along with nine other countries, to the European Union in May 2004. The Framework Water Directive [1] was implemented in the European Union member states, with the main environmental objective being to reach a good water status by 2015. Although not all of the objectives were met, constant efforts are being made to limit the pressure on the environment by introducing numerous requirements for the protection of the environment. Much has been done to restore the purity of surface waters [2,3,4], unfortunately however, their state remains unsatisfactory, although some positive changes in the rationalization of water management are perceivable. Monitoring water quality and pollutant discharges are crucial for developing plans for watershed water management and protection against pollution through establishing the appropriate action plans and controlling their efficiency [5,6,7,8]. Monitoring of point sources of pollution, particularly municipal and industrial sewage discharges from treatment plants with loads below 2000 population equivalents (PE), covers only three pollutant indices (chemical oxygen demand—COD, biochemical oxygen demand—BOD and total suspended solids—TSS), which have proven to be inadequate protective measures for limiting the pollution of water and water-dependent ecosystems [9,10,11,12]. Another important issue is the lack of a modern, informative system regarding water management (water cadastre). Plans for water management in river basins should be supported by a detailed analysis of the anthropogenic effects on the water state and by the economic analysis of water use and protection [13]. This requires a serious analysis of the socio-economic effect of human activity on the water status, in particular, there is a need for a thorough estimation of the volumes of point and non-point source pollution affecting the state of human health [14,15,16]. It should be emphasized that non-point source pollution originating from agriculture plays a significant role in water contamination [17,18], and similarly, pollutants entering waters with surface runoffs caused by meteorological events [19,20,21]. Therefore, hazards caused by non-point source pollution pose a grave problem to the monitoring and estimation of their effects on water quality and are difficult to control [22,23]. Area pollutants, like point source pollutants, contain nutrients and toxic substances [9,24] and exceeding the permissible content of nutrient compounds, particularly nitrates, may render the water unfit for consumption or for economic needs [25,26,27,28,29]. An elevated concentration of nutrients, and the subsequent massive growth of algae and cyanobacteria in water, hinders the water treatment process and increases its cost [30].
Anthropogenic factors imposed on various elements of the natural environment affect water quality [31,32,33]. This is due to intensification of agricultural production, change of land use, transport, industries and insufficient treatment of municipal and industrial sewage. Increasing acidification and pollution of surface waters threatens the organisms living in rivers and water reservoirs [34,35,36,37]. High water pollution may be most frequently observed during dry periods, because of low pollutant dilution [38], and during intensive rainfall, which washes out pollutants from the ground surface [39,40].
This paper aimed to determine the trends in the nutrient content of the Wisłok River, which is the source of water intended to supply the population of Rzeszów city (180 thousand inhabitants), Krosno city (47 thousand inhabitants) and the adjacent districts in the Podkarpackie province. The investigated period covers the years 2004–2013, when significant legal changes occurred relating to the protection of water resources in Poland and connected with the implementation of the EU legislation. Common European water policy, based on a transparent, efficient and coherent legislation framework, aims at better protection of waters and the rational utilization and protection of water resources, according to the principles of sustainable development to satisfy the water needs of people, agriculture and industries. The use of standard data obtained from the Voivodship Inspectorate for Environment Protection and statistical tools allowed for the determination of many-year trends of changes in nutrient concentrations and the assessment of the quality of the water abstracted for public supply of drinking water. The analysis may be used for an initial forecast concerning the required changes of organization and technology for the Wisłok River water treatment.

2. Materials and Methods
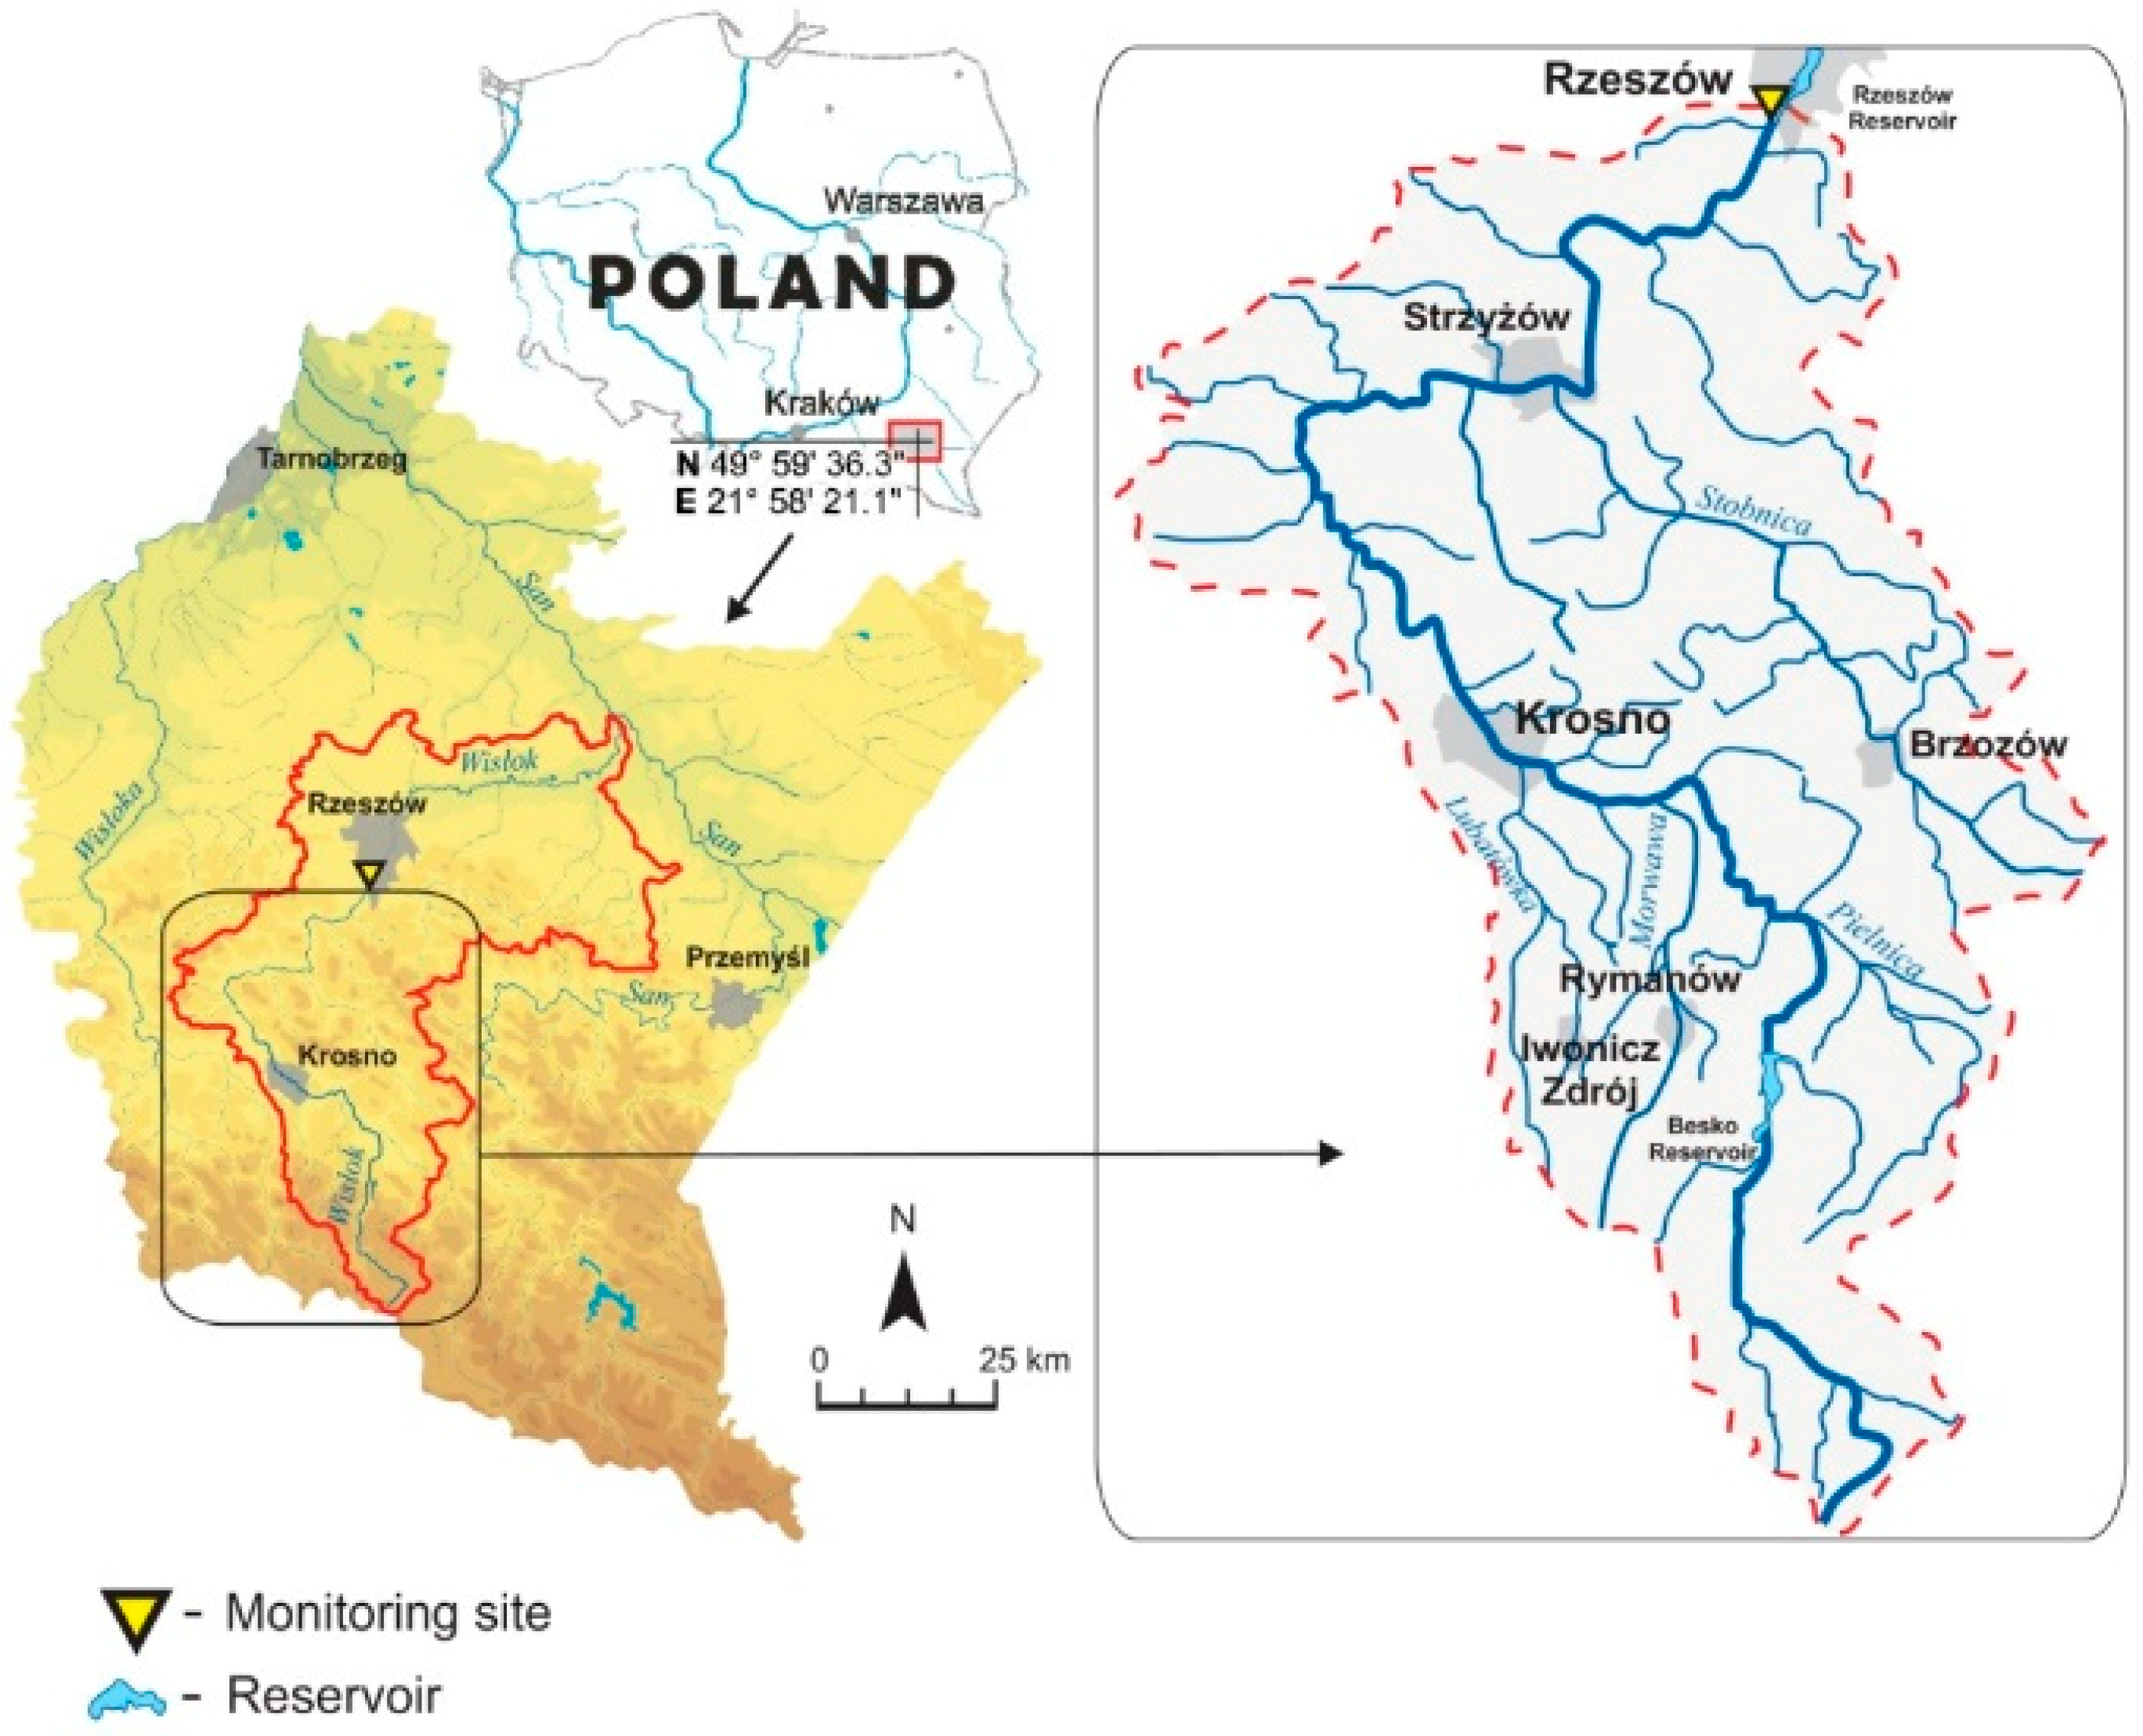
2.1. Study Site

A measuring-control point was situated at 67.9 km on the Wisłok River in the Rzeszów–Zwięczyca quarter, at the mouth of the river to the water reservoir (Figure 1). The biggest municipal surface water intake is located at this point, serving Rzeszów city and some of the adjacent districts in the Wisłok River catchment, located in Zwięczyca and exploited by the Municipal Water and Sewage Company Ltd. in Rzeszów.
Water consumption diminished over the years 2004–2013. In 2004, the total water consumption in Rzeszów was 11.2 hm3, of which 2.2 hm3 were consumed for industrial purposes (excluding agriculture and forestry) and 9.1 hm3 was used for water network exploitation, of which households consumed 6.8 hm3. The amount of consumed water was 43.0 m3 per inhabitant. Total water consumption in 2013 reached 10.3 hm3, of which 0.8 hm3 was consumed for industrial purposes and 7.1 hm3 for water supply system exploitation, of which households consumed 6.8 hm3, which corresponds to 38.8 m3 per inhabitant. Water consumption over the period 2004–2013 also declined in Krosno, the second largest city taking water for its residents from the Wisłok River. In 2013, the total water consumption decreased by 1.4 hm3 in comparison with 2004 (from 4.1 to 2.7 hm3), 1.0 hm3 less water was used for industrial purposes and 0.4 hm3 less for water supply system exploitation. Water consumption by households was the same in both years, reaching 1.4 hm3 [41,42].
The Wisłok River also provides water for municipal–industrial sewage and wastewater from rural areas that are directly discharged into the river water or carried via its tributaries. There are 35 municipal sewage treatment plants located in the Wisłok River catchment. The largest sewage loads are supplied by the municipal treatment plants situated in Rzeszów (184,870 people equivalent (PE), mean daily discharge 35,410 m3) and in Krosno (122,806 PE, mean daily discharge 35,410 m3). Industrial sewage supplied to the Wisłok catchment originates from the biological treatment plants of the Alima–Gerber Company in Rzeszów, Resmlecz Dairy Cooperative in Trzebowisko and from the mechanical–chemical sewage treatment plant of the Śrubex S.A. Screw Factory in Łańcut [43].
The cross-section where the measurement point was located closes the group of uniform parts of upland waters in the Carpathian region (surface water type 10 according to the EU Water Framework Directive) [1]. From its source to the Besko Reservoir, the Wisłok River is a flysch stream (type 12). From the reservoir to Strzyżów village, it has the character of a small flysch river (type 14) and then passes into a uniform part of type 15—the eastern upland river. The Wisłok River is 204.9 km long with an average channel slope of 3.09‰ and originates from the Kanasiówka mountain (823 m above sea level) in the Beskid Niski Mts., by the border with Slovakia (49°20′59″ N 21°57′28″ E). Initially, the Wisłok flows north-west, then it changes its course to the west, subsequently flowing north-east until the San mouth at an altitude of approximately 183 m above sea level (50°12′22″ N 22°31′58″ E). The Wisłok River catchment has an area of 3528.2 km2 and is situated at the altitude of 183–823 m above sea level in the Podkarpackie province. Its largest tributaries are the Morwawa, the Stobnica, the Pielnica, the Mleczka and the Lubatówka (Figure 1).
According to the geographical division of Kondracki [44], the river headwaters are situated in the Beskid Niski Mts. In its upper course, the Wisłok flows through woody mountain areas, whereas the central and lower parts of the catchment, with smaller land slopes, are mainly agricultural areas with a small proportion of industrial activity.
The catchment has a greatly diversified geological substratum; it is situated on the Carpathian flysch composed of layers of conglomerates, sandstones and shales, deposited alternately. Acid brown and leached soils prevail in this area, together with more rare proper brown soils. The shores of the Wisłok River are locally covered by trees and bushes forming riparian forests (Ficario-Ulmetum minoris and Salici-Populetum).

2.2. Scope and Methods of Research

The data used in the paper are the results of monthly analyses of the nutrient content in water samples collected in triplicate from the Wisłok River during the years 2004–2013 at the measurement point located at 67.9 km of the river. Values of pollutant concentrations from the group of indices characterizing nutrient conditions: ammonium nitrogen (NH4–N), total Kjeldahl nitrogen (TKN), nitrite nitrogen (NO2–N), nitrate nitrogen (NO3–N), total nitrogen (TN), phosphates (PO4) and total phosphorus (TP), were assessed in these water samples using the reference methods [45] of the Voivodship Inspectorate for Environment Protection in Rzeszów. Concentrations of NH4 and NO3 ions were computed from the nitrogen forms assessed in the laboratory. The State Environmental Monitoring database was used to conduct a long-term analysis of phosphate concentrations. All available data series from the years 2000–2014 for the analysed area were obtained from The Voivodeship Inspectorate for Environmental Protection in Rzeszów.
Basic descriptive statistics, such as minimum and maximum values, range, arithmetic mean, 95% confidence intervals, median, standard deviation and coefficient of variation were determined for each nutrient indicator. The time trend analysis of nutrient contents for the 10-year period was conducted using a nonparametric Mann–Kendall test with a significance level α = 0.05. This test was selected due to a lack of a normal distribution in the analysed parameters as determined by the Shapiro–Wilk test. Additionally, the observed values were compared with normal values using normal probability plots. The Mann–Kendall test is usually applied for climatic change analyses [46,47,48], hydrological analyses [49,50,51] and water quality analyses [52,53,54]. It relies on the verification of the hypothesis of a lack of any trend in the data on the basis of a nonparametric correlation coefficient. The nonparametric equivalent of the correlation coefficient used in the Mann–Kendall test is the rank correlation coefficient of the {x1, x2, ...xn} data series and the series of their corresponding time points {1, 2, …n}, called the Kendall tau coefficient. The Kendall tau coefficient is based on the difference between the number of compatible (in the same order) and incompatible pairs within the observed data [49]. The nonparametric correlation coefficient in the test is the tau statistic (τ) determined by the following dependence (1):
τ   = S n ( n 1 ) 2
where S is the Mann-Kendall statistics, n is the number of observations, and n (n − 1) is the probable pairs of data. The tau statistic (τ) assumes values within the range [−1;1]. The S Mann-Kendall statistic of the time series is determined on the basis of the following Equation (2):
S   = i = 1   n 1 j   =   i + 1   n   sgn ( x j x i )  
where sgn (xj − xi) is determined by Equation (3):
sgn ( x j x i )   = {   1   for   ( x j x i )   >   0 0   for   ( x j x i )   =   0 1   for   ( x j x i )   <   0
where n is the number of time series elements.
Z   = S sgn ( S ) Var ( S )
On the basis of normalized Z test statistics determined by Equation (4), Var(S) is variance S, determined by Equation (5):
Var ( S )   = n ( n 1 ) ( 2 n   +   5 ) 18
The probability connected with the normalized Z test statistics was computed [47]. Positive values of the statistics gave evidence to the occurrence of a growing trend, whereas negative values testify to the occurrence of a declining trend [55]. A change in the significance level of α = 0.05 was assumed to be a statistically significant (increasing or decreasing) trend. Changes in the analysed trends with time were described using the β slope expressed by Equation (6), i.e., the Theil–Sen estimator computed including all i < j (i = 1, 2, ... n−1 and j = 2, 3, ... n) [56,57]:
β   =   med   x j x i j i
Seasonal variability of nutrient concentrations during the period of investigation was assessed on the basis of mean monthly values in the summer and winter half-year defined as winter (November–April) and summer (May–October). Statistical inference regarding the significance of any differences was conducted using the Mann–Whitney U test at the significance level α = 0.05 to check whether the parameter concentration values differ between the seasons. The measures of location, first quartile (Q1), the second (median) and third (Q3), were computed for each parameter.
Water quality (potential) and its suitability for use as public drinking water were assessed following Annex 5 of the Regulation of the Minister of Environment dated 22 October 2014 [10]. In the case of uniform artificial surface water parts or strong changes in the values, of the quality indices tests, which are components of physicochemical elements, each tested index was ascribed an appropriate class by comparing the mean value of the index obtained from monitoring with the limit value. Class I denotes the maximum potential, class II denotes good potential, whereas a failure to meet the requirements of class II indicates a potential that falls below good.
Usable values of the Wisłok River waters were evaluated by comparing the results of assessments with the limit values according to the Regulation of the Minister of the Environment on the requirements for surface water used for drinking water for people [58]. Three categories of water quality (A1, A2 and A3) were determined for surface waters used for public water systems depending on the limit values of the water quality indices, which due to pollution must be subjected to a standard treatment process in order to obtain water fit for consumption. Category A1 includes waters requiring a simple physical treatment, particularly filtration and disinfection. Category A2 comprises waters needing a typical physical and chemical treatment, especially initial oxidation, coagulation, flocculation, decantation, filtration and disinfection (final chlorination), whereas waters that require a high performance physical and chemical treatment, particularly oxidation, coagulation, flocculation, decantation, filtration, adsorption on active carbon and disinfection (ozonation and final chlorination) are classified as category A3. The category of water quality is determined by comparing measured values of the pollution indices with the limit values determined for the individual indices within each category. The water meets the category (A1 or A2 and A3) limit requirements if the values of the total Kjeldahl nitrogen, phosphates and ammonium do not exceeded the limit in 90% of the samples (only in category A1) or limit values of nitrate and ammonium do not exceed the limit in 95% of the samples (category A2 and A1). Limit values that are exceeded due to intensive rain, snow melting, high air temperatures or floods and other natural disasters are not used for calculating percent values of the samples for nitrates.

3. Results and Discussion
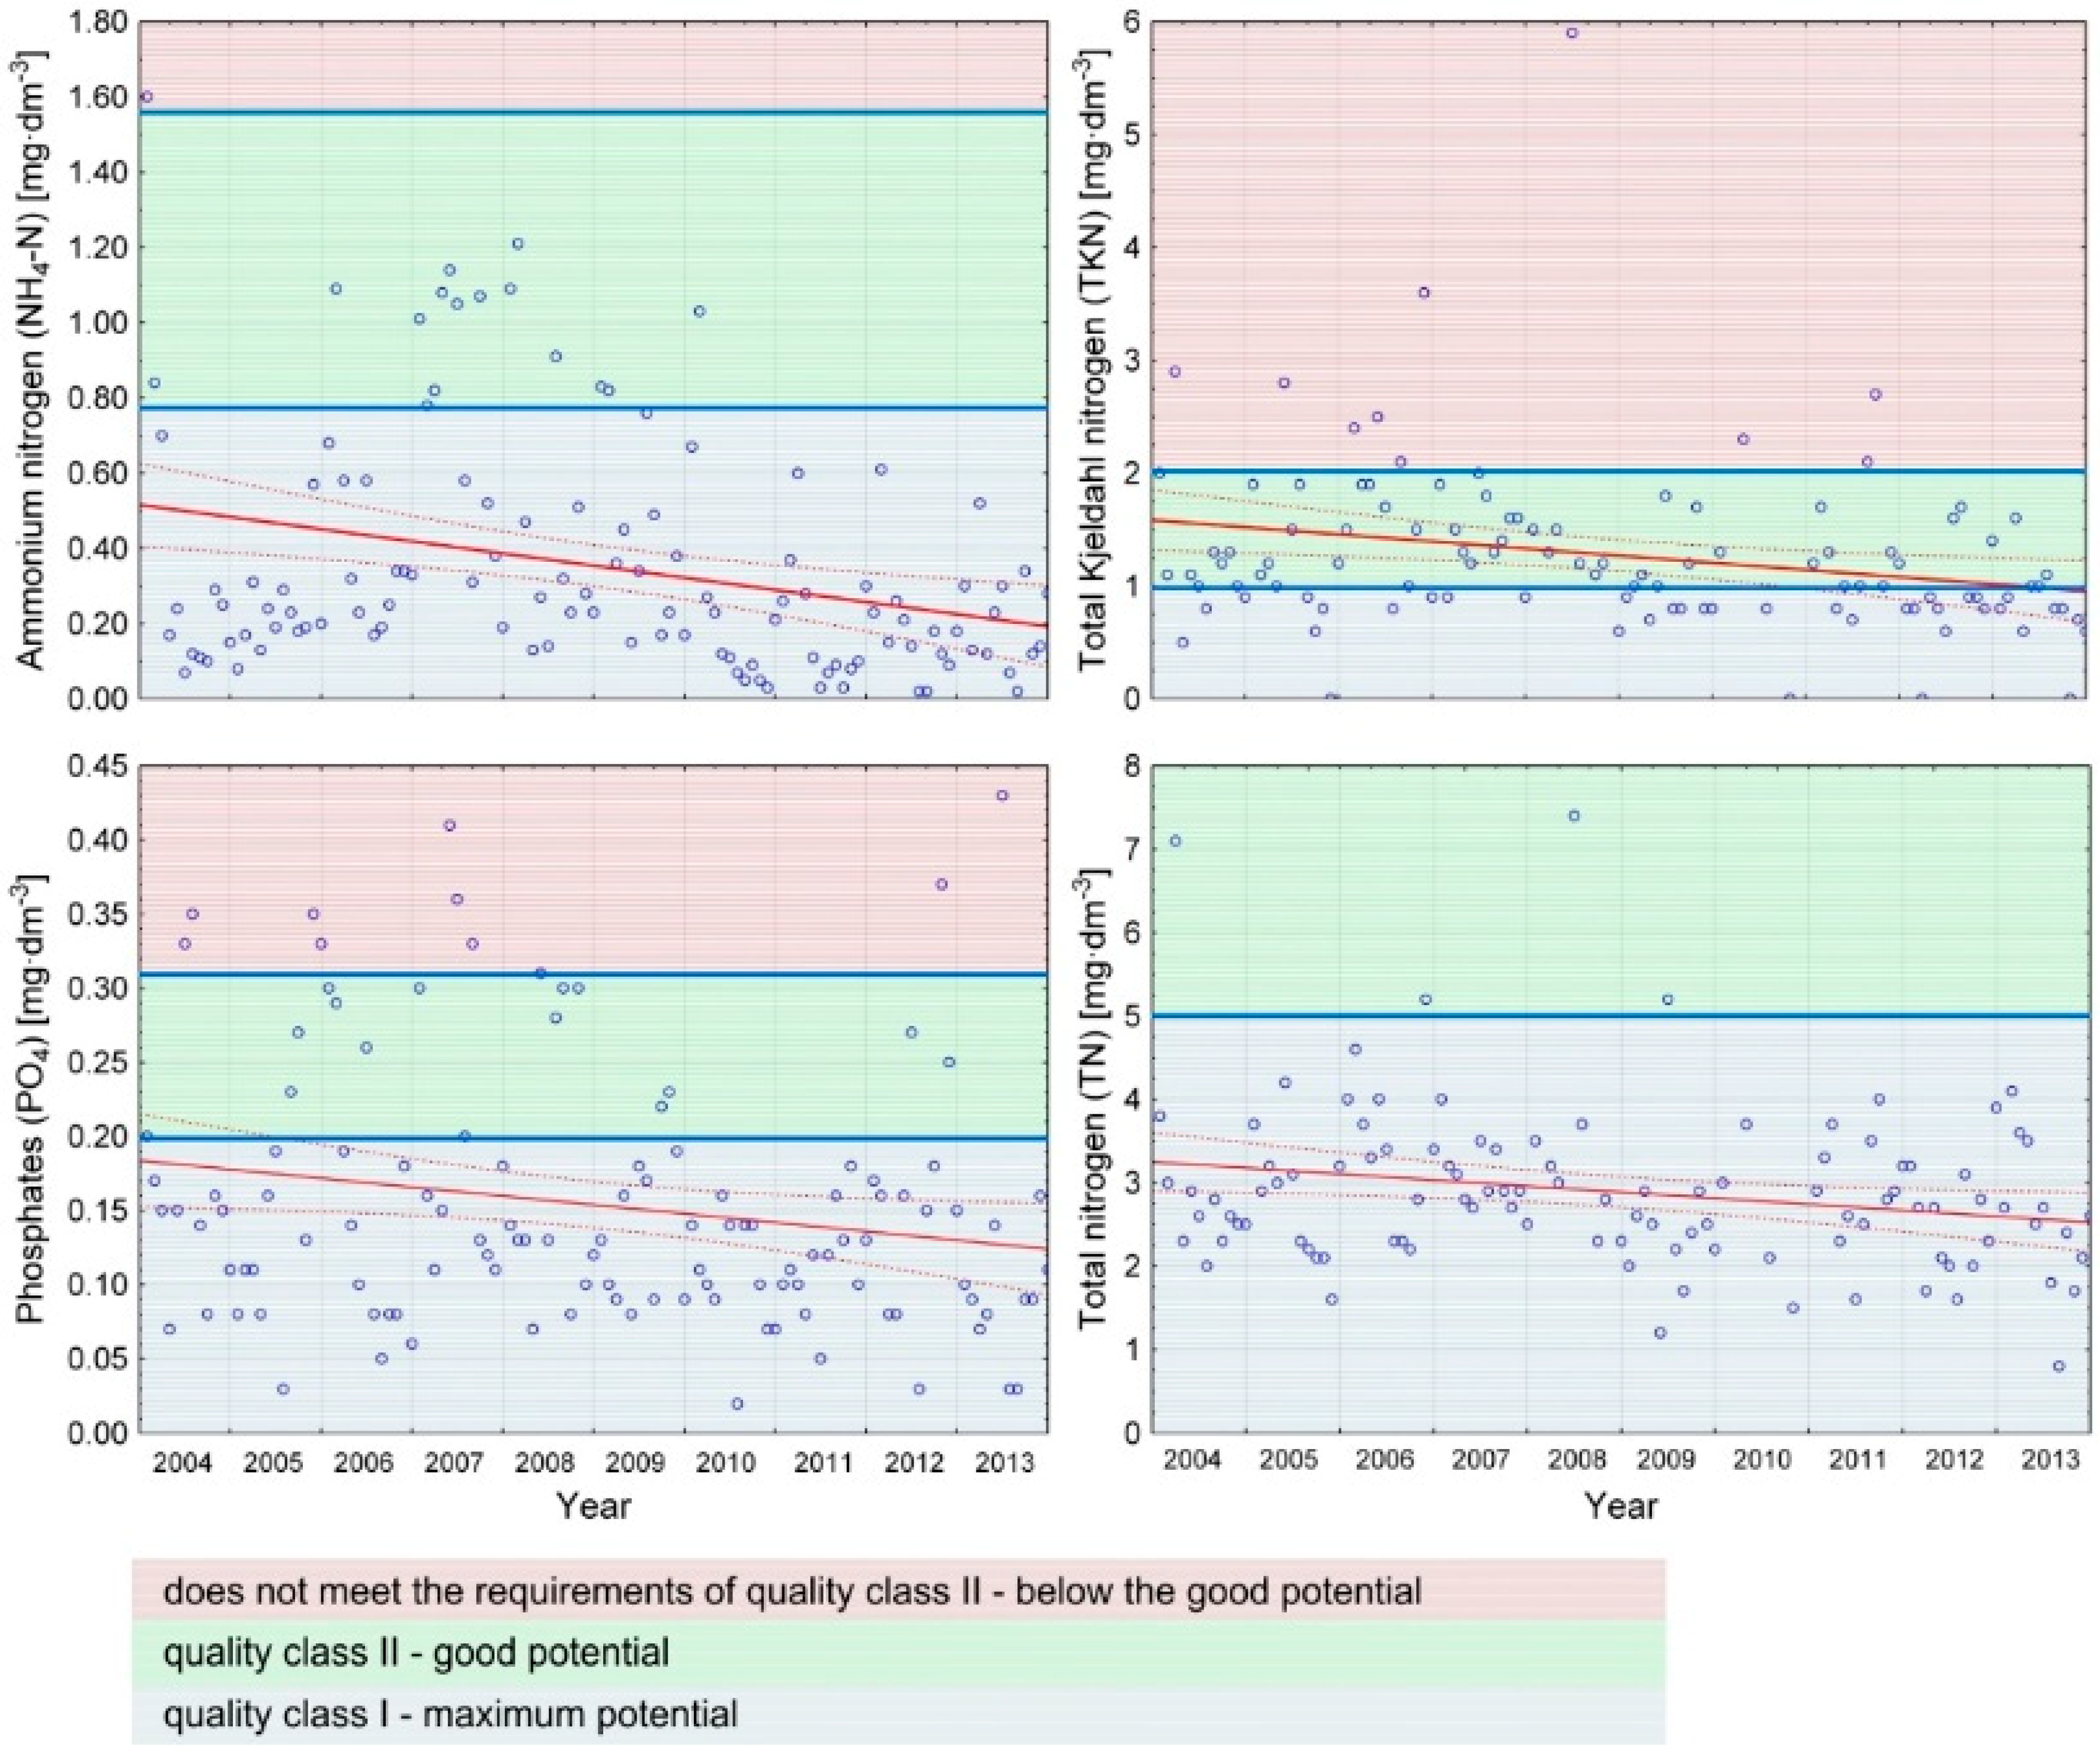
During the period of investigation, the maximum values of the majority of the analysed nutrients were registered in June (TKN, TN, PO4, TP) and July (NO2–N). The highest concentrations (1.60 mg·dm−3) of ammonium nitrogen (NH4–N), which is the indicator of the biochemical breakdown of organic nitrogen compounds, occurred in January, and the highest contents of nitrate nitrogen (NO3–N) were noted in March 2004 (4.20 mg∙dm−3) (Table 1).
A zero value for the total Kjeldahl nitrogen (TKN) was observed in the Wisłok River water four times over the winter period. For ammonium nitrogen (NH4–N), its minimum value, of 0.02 mg·dm−3 (Table 1), was registered three times; in July and August 2012 and in August 2013.

3.1. Trend Analysis

The distribution of the analysed indices was determined using a Shapiro–Wilk test and revealed a lack of a normal distribution at α = 0.001. This was confirmed by a normal probability plot, where the points are not situated along a straight line, but instead form an S-shaped or C-shaped curve (Figure 2).
In Poland, research using similar methodology was conducted by Dąbrowska et al. [8,20] for a submontane Dobromierz drinking water reservoir on the Strzegomka river. In the years 2000–2014, no statistically significant trend was observed for the concentrations of phosphates, TP or TKN, whereas a statistically significant declining trend was registered for TN, NO3–N and HN4–N. Poor quality of the Strzegomka river water is in the first place determined by the concentrations of phosphates and nitrates. Although nitrate nitrogen concentrations reveal here a verified declining trend, they did not decrease below the eutrophication limit of 2.2 mg NO3–N∙dm−3.
During the period from 2004 to 2013, concentrations of ammonium nitrogen (NH4–N) were decreasing in the Wisłok River water by 0.0027 mg·dm−3 per month on average, at an average value of 0.35 mg∙dm−3 for the multi-annual period with a range of changes 1.58 mg·dm−3 (Table 1 and Table 2).
Concentrations of total Kjeldahl nitrogen (TKN) in the water were diminishing on average by 0.0053 mg∙dm−3 per month at an average value of 1.27 mg·dm−3 and a range from 0 to 5.90 mg∙dm−3. The widest range of changes of concentration values was 6.6 mg·dm−3 and at the same time the lowest, at 34%, variation coefficient characterized the total nitrogen (TN). The simple regression slope indicated the highest monthly reduction of this parameter concentration, on average by 0.0061 mg∙dm−3 over the period of investigation (Table 2). In the case of phosphates, the average value for the multi-annual period was 0.15 mg·dm−3 and the range of changes was 0.41 mg∙dm−3. PO4 concentration in the water was decreasing on average by 0.0005 mg·dm−3 per month. Values for the ammonium nitrate (NH4–N) concentrations definitely revealed the highest random variability (variability coefficient of 89%).
The discussed series of concentration values of the analysed parameters for the years 2004–2013 showed statistically significant downward trends (negative values of the Mann–Kendall statistics, as in Smith et al. [56]), were observed for four parameters: ammonium nitrogen (NH4–N), total Kjeldahl nitrogen (TKN), total nitrogen (TN) and phosphates (PO4) (Table 2, Figure 3). A growing, statistically non-significant, trend was in the Wisłok River water only for one parameter, i.e., nitrite nitrogen (NO2–N).

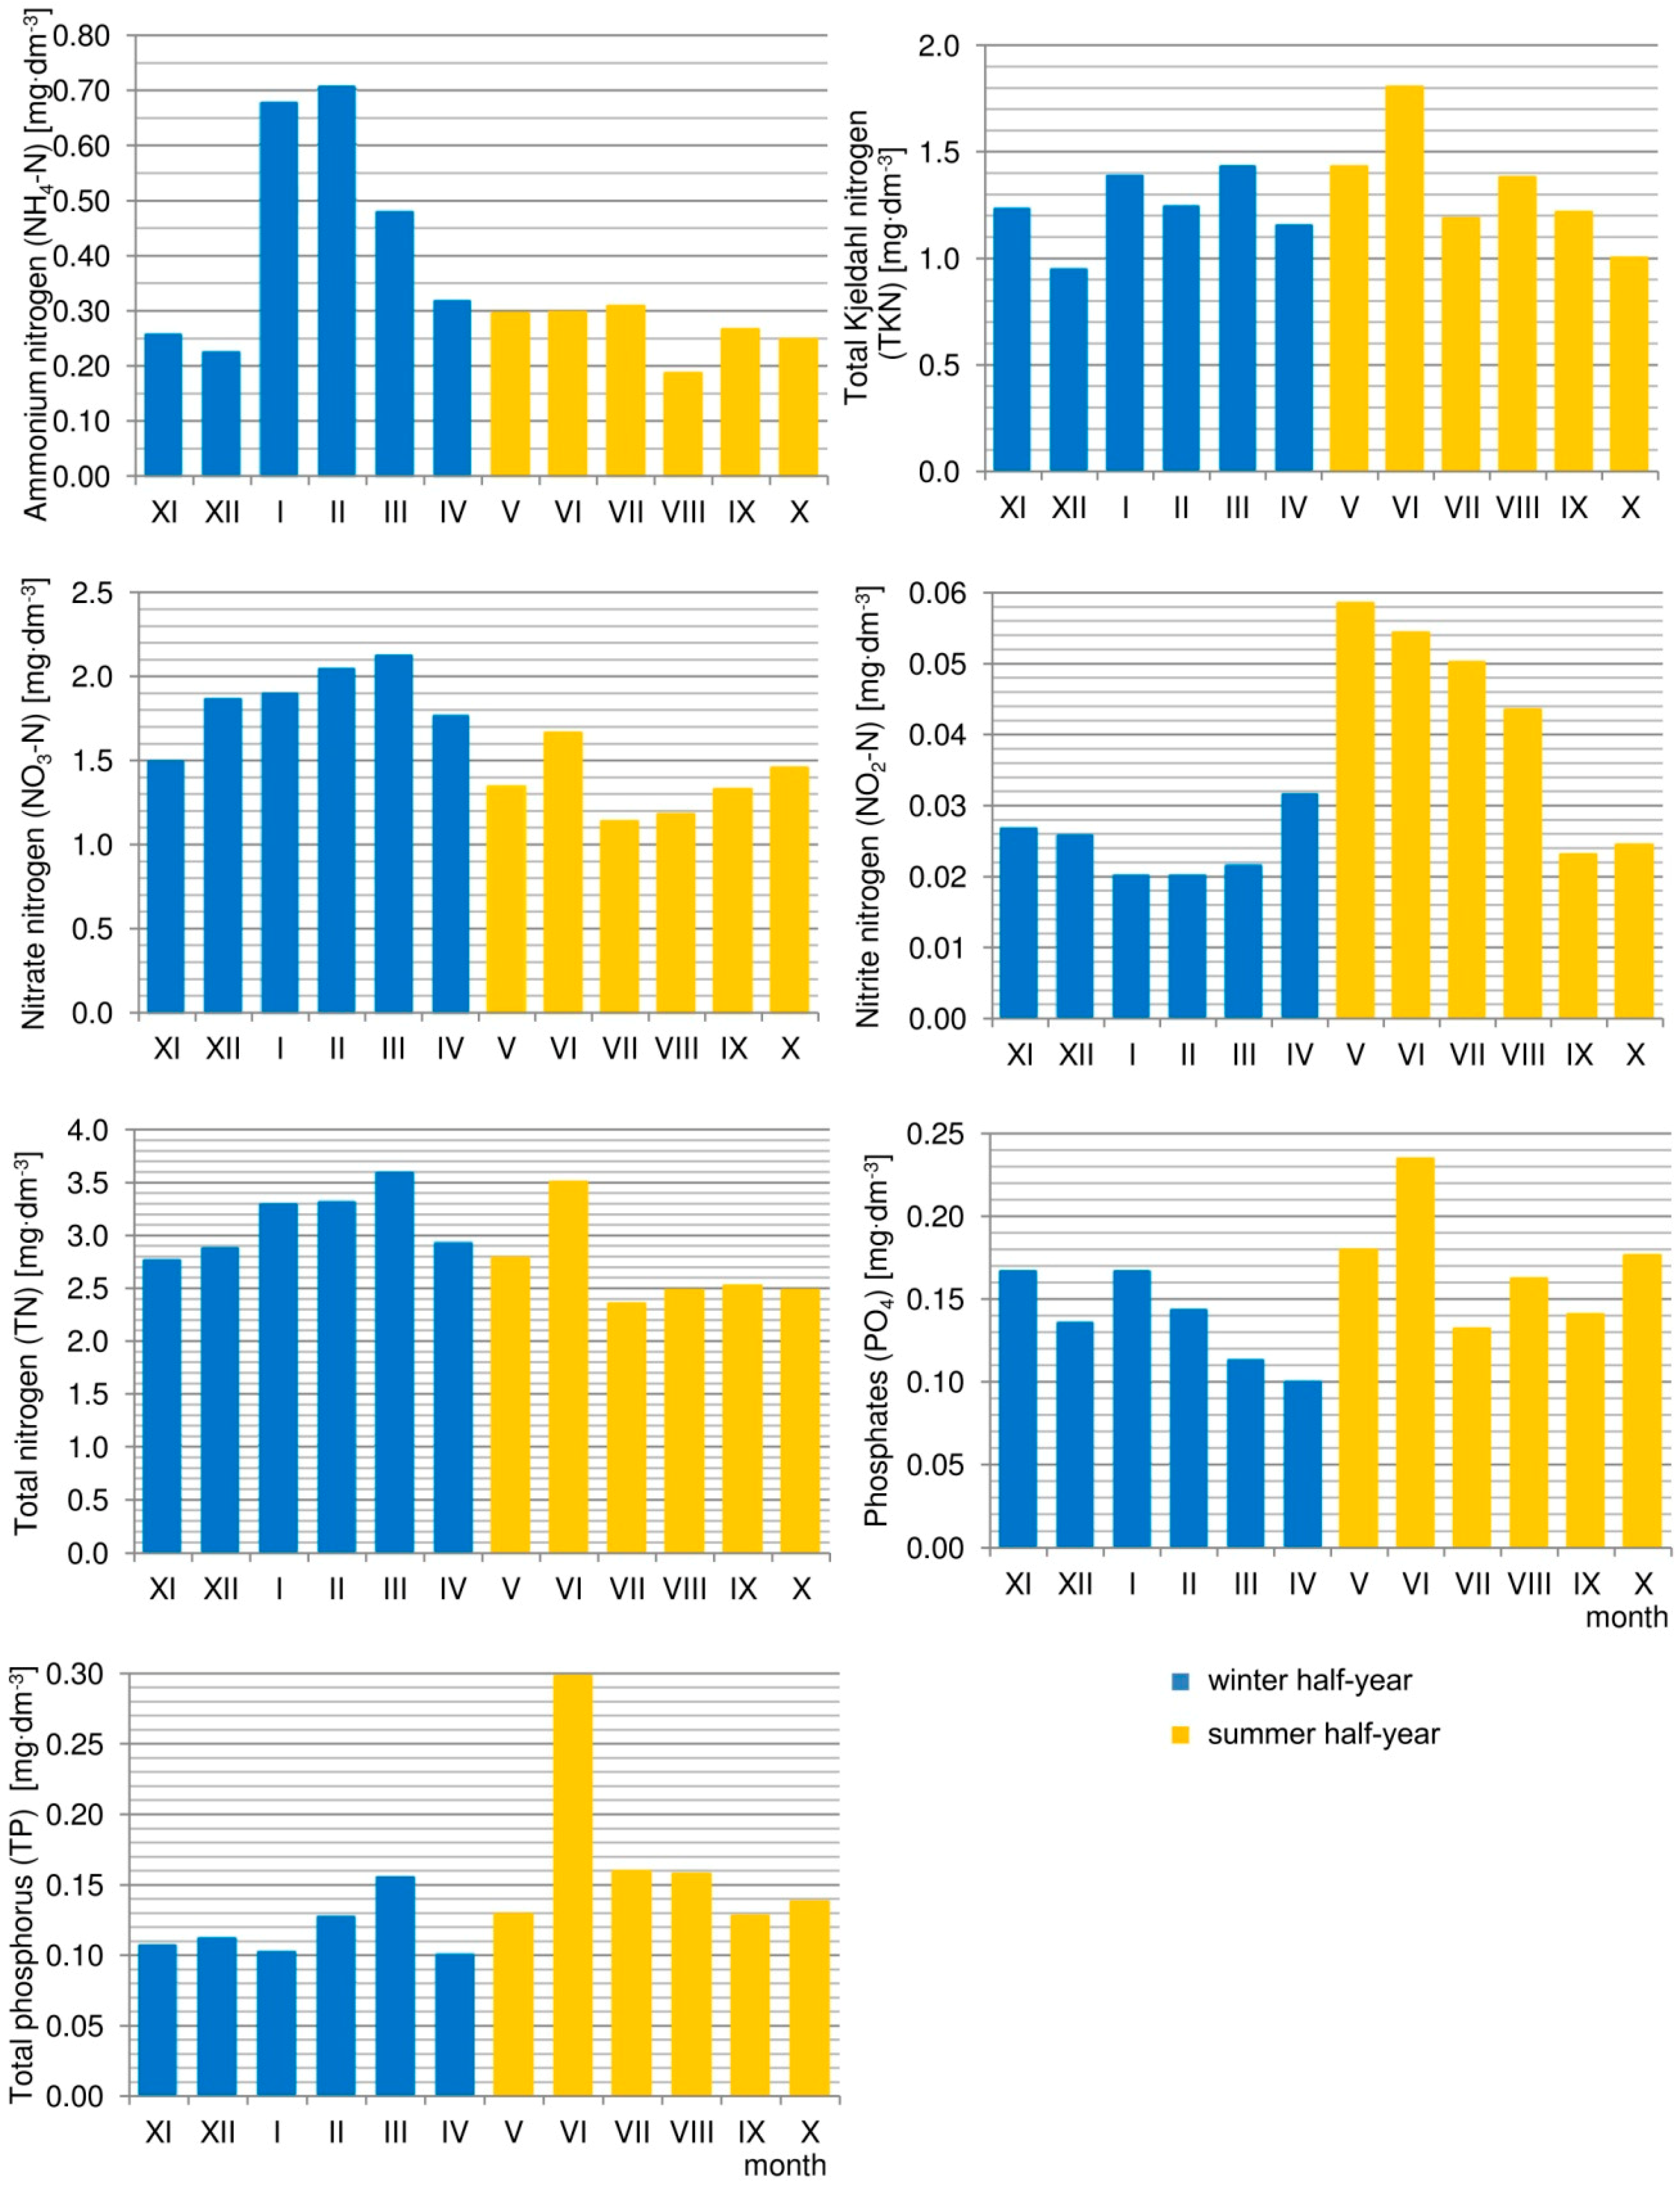
3.2. Concentrations of Analysed Parameters in the Winter and Summer Half-Year

In the summer half-year, the highest mean monthly concentrations of all the phosphorus forms, and a majority of the nitrogen forms, analysed over the whole period of research, occurred in June (Figure 4). The exceptions were ammonium nitrogen (NH4–N) and nitrite nitrogen (NO2–N), whose maximum concentrations were registered in July and May, respectively. For nitrate nitrogen (NO3–N), total nitrogen (TN) and phosphates (PO4), the lowest values occurred in July and in the case of nitrite nitrogen (NO2–N) and total phosphorus (TP), they occurred in September. The lowest mean value for ammonium nitrate (NH4–N) was noted in August and for total Kjeldahl nitrogen (TKN) in October. In the winter half-year, mean monthly values for the investigated period for total Kjeldahl nitrogen, nitrate nitrogen (NO3–N), total nitrogen (TN) and total phosphorus (TP) occurred in March, ammonium nitrogen (NH4–N) in February and nitrite nitrogen (NO2–N) in April. The lowest mean value of phosphate concentration (PO4) (0.17 mg∙dm−3) was registered twice in the winter half-year, in November and January. The lowest monthly concentration of nitrite nitrogen (NO2–N) also occurred twice, in January and February. The minimum concentrations of the analysed phosphorus forms (PO4) were observed in April, nitrate nitrogen (NO3–N) and total nitrogen (TN) in November, while ammonium nitrogen (NH4–N) and total Kjeldahl nitrogen (TKN) in December (Figure 4).
Statistical analysis conducted using the Mann–Whitney U test revealed that the values of most of the analysed parameter concentrations differed significantly between the half-years (Table 3). Statistically significant differences in concentrations between the summer and winter half-year were registered for ammonium nitrogen (NH4–N), nitrite nitrogen (NO2–N), nitrate nitrogen (NO3–N), total nitrogen (TN) and total phosphorus (TP). Statistically significantly higher concentrations of NH4–N, NO3–N and TN were observed in the winter half-year, whereas the same was true for NO2–N and TP in the summer half-year. This is connected with the intensive nitrogen uptake by phytobenthos, algae and macrophytes in the summer period, where the water temperature rises above 5 °C [59].
Higher concentrations, although not statistically proven, were registered in the summer season for phosphates. In both half-year periods, the median value of the total Kjeldahl nitrogen was the same at 1.1 mg·dm−3. In the winter and summer half-year, the first quartile (Q1) for TKN, NO2–N and PO4 concentrations in the Wisłok River water were the same, which shows that in both half-years, 45 out of the 60 analysed concentrations assumed values higher than or equal to TKN–0.8 mg∙dm−3, NO2–N—0.02 mg·dm−3 and PO4—0.09 mg∙dm−3, whereas the other 15 assumed values were not higher than those stated in Table 3.
Mean concentrations of six analysed physicochemical indices allowed us to classify the Wisłok River water as class II, with good potential (Table 4), in compliance with the Regulation of the Minister of Environment [10]. Exceeding a value of 0.26 mg·dm−3 is acceptable for class I only for total Kjeldahl nitrogen (TKN). The other investigated nutrients were within class I limits (Table 4). Comparison of the single assessments with the limit values for individual water quality classes revealed that, in the years 2004–2013, nitrate nitrogen (NO3–N) and total nitrogen (TN) concentrations in over 90% of the analysed samples, and concentrations of ammonium nitrogen (NH4–N), phosphates (PO4) and total phosphorus (TP) in over 80% of samples, classified the analysed water as quality class I (Table 4). Concentrations of total Kjeldahl nitrogen in 44% of the analysed water samples classified the water as class II and in 9.3% of the samples as having potential below good. Concentrations of nitrate nitrogen (NO3–N) and total nitrogen (TN) did not qualify the water as having a potential below good (Table 4).
Assessment of the water suitability for drinking water supply revealed that, among the four analysed indices stated in the Regulation (2002), nitrates (NO3) and phosphates (PO4) qualified the Wisłok River water as category A1, i.e., water demanding a simple physical treatment, particularly filtration and disinfection (Table 5). Considering nitrates (NO3), contents acceptable for category A1 water were not met in 100% of the analysed samples, whereas phosphate concentrations were above the limit for category A1 in 98.3% of samples. Usable values for the water were worsened by the concentrations of ammonium ions (NH4+) and total Kjeldahl nitrogen (TKN). Due to ammonium ion (NH4+) concentrations, the Wisłok River water should be subjected to a typical physical and chemical treatment, appropriate for category A2 water. Kjeldahl nitrogen (TKN) concentrations exceeded the value of 2 mg∙dm−3 acceptable for category A2 in 9.3% of the 120 samples. For this reason, the Wisłok River water may be used for the public supply of drinking water but must be subjected to a typical performance physical and chemical treatments, particularly oxidation, coagulation, flocculation, decantation, filtration, disinfection (final chlorination), appropriate for category A2 (Table 5).
The Wisłok River is a left-bank tributary of the San River, which in turn is a tributary of the Vistula River. The total volume of water used for the national economic needs and human consumption have increased the San River catchment over the years 2004–2013. In 2004, total water consumption in this hydrographic region was 199.4 hm3, of which 113.7 hm3 was used for industrial purposes, 39.1 hm3 for irrigation of agriculture and forestry and for filling and supplementing fish ponds and 46.7 hm3 for exploitation of the water supply system [41]. In 2013, total water consumption reached 224.6 hm3, of which 144.8 hm3 was used by industry. In 2003, water consumption by agriculture and forestry and for water supply system exploitation decreased in comparison with 2004, with values of 33.6 and 46.3 hm3, respectively. The decreasing amount of water used by agriculture and forestry in the San catchment indicated a transformation in the land use in the discussed area, which undoubtedly affected the aquatic environment quality. The resulting lower loads of nitrogen and phosphorus supplied to the environment, both from point sources (such as sewage) [14], surface runoffs [18] and precipitations, might have influenced the diminished concentrations of nutrient pollutants in the Wisłok River water.
The volume of industrial and municipal sewage requiring treatment, which was discharged into the soil in the San catchment over the years 2004–2013, increased from a total of 45.9 to 49.6 hm3. In 2013, the volume of treated sewage was 49.0 hm3 and this was an increase of 5.2 hm3 (43.8 hm3) in comparison with 2004. On the other hand, the volume of untreated sewage discharged into the water or soil decreased over the analysed period. In 2004, the volume of untreated sewage was 2.1 hm3, whereas in 2013 it was 0.6 hm3. In 2004, untreated sewage in the San catchment in the amount of 1.5 hm3 was discharged by the sewage system and 0.6 hm3 was discharged from industrial plants. In 2013 however, the sewage was discharged exclusively from industrial sites (0.6 hm3). The number of cities in the San catchment served by sewage treatment plants with enhanced nutrient removal also increased from 13 to 20 [42].
The water quality in the discussed region improved greatly during the 2003–2014 period following the application of measures connected with water management to limit P and N pollution. The success was due mainly to a better treatment of municipal waste. Over the investigated period total nitrogen concentrations in the Wisłok River were reduced by 17%, ammonium nitrogen by 55%, Kiejdahl nitrogen by 35%, nitrate nitrogen by 7%, anthropogenic phosphorus by 23% and phosphates by 27%. A similar situation was observed in eastern China, where management of water nutrients to prevent eutrophication caused a decline in anthropogenic P in the water by 21.5% [60].

4. Conclusions

A statistically significant decreasing trend of ammonium nitrogen (NH4–N), total Kjeldahl nitrogen (TKN), total nitrogen (TN) and phosphates (PO4) in the Wisłok River water was observed for the years 2003–2014. During the investigated period, the decrease in the nutrient concentration over the period of a year was 0.032 mg·dm−3 for ammonium nitrogen; 0.64 mg∙dm−3 for total Kjeldahl nitrogen; 0.073 mg·dm−3 for total nitrogen and 0.006 mg∙dm−3 for phosphates. A decline in nutrient concentrations may be evidence of a successive stabilization of the water and sewage management systems in the catchment area. A diminished volume of untreated sewage discharged into the water or soil and an increasing volume of treated sewage with enhanced nutrient removal are of key importance for the improvement of the surface water state and for reaching a good state/potential of the water by the year 2027 at the latest, which is the main objective of the Framework Water Directive.
Analysis of seasonality revealed that statistically significantly higher concentrations of ammonium, nitrate and total nitrogen occurred in the winter rather than summer half-year, which was connected with the lower water temperature and negligible nitrogen uptake during this period by phytobenthos, algae and macrophytes.
On the basis of nutrient indices supporting biological elements, it was determined that, during 2004–2013, the Wisłok River water, due to raised concentrations of total Kjeldahl nitrogen, fulfilled the requirements for quality class II surface waters, i.e., good potential. Water quality assessment conducted for the final year of research (2013) allows us to qualify the water as class I, i.e., the maximum potential. The use of Wisłok River water for the public supply of drinking water was restricted over the years 2004–2013 due to the concentrations of Kjeldahl nitrogen and ammonium ions, which classified the water into categories A3 and A2. Decreasing nutrient pollution concentrations during the investigated decade, mainly Kjeldahl nitrogen, since 2012, have allowed us to qualify the Wisłok River water as category A2 (all water samples contained below 2 mg·dm−3 of Kjeldahl nitrogen), which in the future may lead to a lowering of the water treatment costs for drinking water supply to Rzeszów residents.

Author Contributions

Conceptualization, W.K., A.P.-L. and W.F.; Data curation, A.P.-L.; Formal analysis, W.K., A.P.-L. and W.F.; Funding acquisition, A.P.-L.; Investigation, W.K., A.P.-L. and W.F.; Methodology, W.K., A.P.-L. and W.F.; Project administration, A.P.-L.; Resources, A.P.-L.; Supervision, W.K.; Validation, W.K., A.P.-L. and W.F.; Visualization, W.K. and W.F.; Writing–original draft, W.K., A.P.-L. and W.F.; Writing–review & editing, W.K., A.P.-L. and W.F.

Funding

This research was funded by the Department of Land Reclamation and Environmental Development of the University of Agriculture in Krakow.

Conflicts of Interest

The authors declare no conflict of interest.

References and Notes

  1. Directive 2000/60/EC of the European Parliament and of the Council of 23 October 2000 establishing a framework for Community action in the field of water policy. Off. J. Eur. Union 2000, L327, 1–73.
  2. Jarosiewicz, A.; Obolewski, K.; Ożgo, M. Long-Term trends in nutrient concentrations in Polish coastal Rivers. Ocean Coast Manag. 2015, 118, 37–46. [Google Scholar] [CrossRef]
  3. Borek, Ł. Eutrophication Risk of Water in the Manor-Park Channels: Different Ways of Evaluation. Carpathian J. Earth Environ. Sci. 2018, 13, 409–421. [Google Scholar]
  4. Szałkiewicz, E.; Jusik, S.; Grygoruk, M. Status of and Perspectives on River Restoration in Europe: 310,000 Euros per Hectare of Restored River. Sustainability 2018, 10, 129. [Google Scholar] [CrossRef]
  5. Charalampous, N.; Kindou, A.; Vlastos, D.; Tsarpali, V.; Antonopoulou, M.; Konstantinou, I.; Dailianis, S. A multidisciplinary assessment of river surface water quality in areas heavily influenced by human activities. Arch. Environ. Con. Tox. 2015, 69, 208–222. [Google Scholar] [CrossRef] [PubMed]
  6. Cool, G.; Lebel, A.; Sadiq, R.; Rodriguez, M.J. Modelling the regional variability of the probability of high trihalomethane occurrence in municipal drinking water. Environ. Monit. Assess. 2015, 187, 746. [Google Scholar] [CrossRef] [PubMed]
  7. Naveedullah, N.; Hashmi, M.Z.; Shen, C.; Muhammad, N.; Shen, H.; Chen, Y. Water Quality Characterization of the Siling Reservoir (Zhejiang, China) Using Water Quality Index. Clean-Soil Air Water 2016, 44, 553–562. [Google Scholar] [CrossRef]
  8. Dąbrowska, J.; Moryl, A.; Kucharczak-Moryl, E.; Żmuda, R.; Lejcuś, I. Content of nitrogen compounds in the waters of the Strzegomka river above the Dobromierz Reservoir. Acta Sci. Pol. Form. Circumiectus 2016, 15, 57–69. [Google Scholar] [CrossRef]
  9. Kanownik, W.; Kowalik, T.; Bogdał, A.; Ostrowski, K. Quality categories of stream waters included in a small retention program. Pol. J. Environ. Stud. 2013, 22, 159–165. [Google Scholar]
  10. Regulation of the Minister of the Environment dated 22 October 2014 on the method of classification of the state of uniform parts of surface waters and environmental quality standards for priority substances. J. Laws R. Pol. 2014, item 1482.
  11. Capps, K.A.; Bentsen, C.N.; Ramirez, A. Poverty, urbanization, and environmental degradation: Urban streams in the developing world. Freshw. Sci. 2016, 35, 429–435. [Google Scholar] [CrossRef]
  12. Leong, S.S.; Ismail, J.; Denil, N.A.; Sarbini, S.R.; Wasli, W.; Debbie, A. Microbiological and Physicochemical Water Quality Assessments of River Water in an Industrial Region of the Northwest Coast of Borneo. Water 2018, 10, 1648. [Google Scholar] [CrossRef]
  13. Milano, M.; Reynard, E.; Köplin, N.; Weingartner, R. Climatic and anthropogenic changes in Western Switzerland: Impacts on water stress. Sci. Total Environ. 2015, 536, 12–24. [Google Scholar] [CrossRef] [PubMed]
  14. Kanownik, W.; Policht-Latawiec, A.; Gajda, A. Influence of Sitkówka sewage treatment plant on the Bobrza River water quality. J. Water Land Dev. 2017, 34, 153–162. [Google Scholar] [CrossRef] [Green Version]
  15. Eckelman, M.J.; Sherman, J. Environmental impacts of the U.S. health care system and effects on public health. PLoS ONE 2016, 11, e0157014. [Google Scholar] [CrossRef] [PubMed]
  16. Cozzi, S.; Ibáñez, C.; Lazar, L.; Raimbault, P.; Giani, M. Flow Regime and Nutrient-Loading Trends from the Largest South European Watersheds: Implications for the Productivity of Mediterranean and Black Sea’s Coastal Areas. Water 2019, 11, 1. [Google Scholar] [CrossRef]
  17. Green, C.T.; Bekins, B.A.; Kalkhoff, S.J.; Hirsch, R.M.; Liao, L.; Barnes, K.K. Decadal surface water quality trends under variable climate, land use, and hydrogeochemical setting in Iowa, USA. Water Resour. Res. 2014, 50, 2425–2443. [Google Scholar] [CrossRef] [Green Version]
  18. Kowalik, T.; Kanownik, W.; Bogdał, A.; Policht-Latawiec, A. Effect of change of small upland catchment use on surface water quality course. Annu. Set Environ. Prot. 2014, 16, 223–238. [Google Scholar]
  19. Zhang, Q.; Brady, D.C.; Boynton, W.R.; Ball, W.P. Long-term trends of nutrients and sediment from the Nontidal Chesapeake Watershed: An assessment of progress by river and season. J. Am. Water. Resour. 2015, 51, 1534–1555. [Google Scholar] [CrossRef]
  20. Dąbrowska, J.; Lejcuś, K.; Kuśnierz, M.; Czamara, A.; Kamińska, J.; Lejcuś, I. Phosphate dynamics in the drinking water catchment area of the Dobromierz Reservoir. Desalin. Water Treat. 2016, 57, 25600–25609. [Google Scholar] [CrossRef]
  21. Kazak, J.K.; Chruściński, J.; Szewrański, S. The Development of a Novel Decision Support System for the Location of Green Infrastructure for Stormwater Management. Sustainability 2018, 10, 4388. [Google Scholar] [CrossRef]
  22. Policht-Latawiec, A.; Żarnowiec, W.; Majewska, M. The analysis of variability in water quality in the Biala Tarnowska River. Ecol. Eng. 2015, 44, 217–226. [Google Scholar] [CrossRef]
  23. Jiang, B.; Chen, J.; Luo, Q.; Lai, J.; Xu, H.; Wang, Y.; Yu, K. Long-term changes in water quality and eutrophication of China’s Liujiang River. Pol. J. Environ. Stud. 2016, 25, 1033–1043. [Google Scholar] [CrossRef]
  24. Wang, W.; Liu, X.; Wang, Y.; Guo, X.; Lu, S. Analysis of point source pollution and water environmental quality variation trends in the Nansi Lake basin from 2002 to 2012. Environ. Sci. Pollut. R. 2016, 23, 4886–4897. [Google Scholar] [CrossRef] [PubMed]
  25. World Health Organization (WHO). Guidelines for Drinking-Water Quality, 4th ed.; NLM Classification: WA 675; WHO: Geneva, Switzerland, 2011; ISBN 978 92 4 154815 1. [Google Scholar]
  26. Augustyn, Ł.; Kaniuczak, J.; Stanek-Tarkowska, J. Selected physicochemical and chemical properties of surface water of Wisloka for consumption. Ecol. Eng. 2012, 28, 7–19. [Google Scholar]
  27. Adamczyk, W.; Jachimowski, A. Impact of biogenic components on quality and eutrophication of flowing surface waters constituting the source of drinking water for the city of Kraków. Food. Sci. Technol. Qual. 2013, 20, 175–190. [Google Scholar] [CrossRef]
  28. Regulation of the Minister of the Health dated 13 November 2015 on the quality of water intended for human consumption. (Journal of Laws 2015, item 1989).
  29. Tomperi, J.; Juuso, E.; Leiviska, K. Early warning of changing drinking water quality by trend analysis. J. Water Health 2016, 14, 433–442. [Google Scholar] [CrossRef]
  30. Dąbrowska, J.; Bawiec, A.; Pawęska, K.; Kamińska, J.; Stodolak, R. Assessing the Impact of Wastewater Effluent Diversion on Water Quality. Pol. J. Environ. Stud. 2017, 26, 9–16. [Google Scholar] [CrossRef] [Green Version]
  31. Sun, S.; Barraud, S.; Castebrunet, H.; Aubin, J.B.; Marmonier, P. Long-term stormwater quantity and quality analysis using continuous measurements in a French urban catchment. Water Res. 2015, 85, 432–442. [Google Scholar] [CrossRef]
  32. Policht-Latawiec, A.; Kanownik, W.; Jurek, A. The effect of cooling water discharge from the power station on the quality of the Skawinka River water. Carpathian J. Earth Environ. Sci. 2016, 11, 427–435. [Google Scholar]
  33. Szewrański, S.; Chruściński, J.; van Hoof, J.; Kazak, J.K.; Świąder, M.; Tokarczyk-Dorociak, K.; Żmuda, R. Location Intelligence System for the Assessment of Pluvial Flooding Risk and the Identification of Storm Water Pollutant Sources from Roads in Suburbanised Areas. Water 2018, 10, 746. [Google Scholar]
  34. Policht-Latawiec, A.; Kanownik, W.; Konieczna, A. Changes of electrolytic conductivity and concentrations of selected biogens in the Lososina River water in the area of Tymbark town. Acta Sci. Pol. Form. Circumiectus 2015, 14, 175–184. [Google Scholar] [CrossRef]
  35. Rogora, M.; Mosello, R.; Kamburska, L.; Salmaso, N.; Cerasino, L.; Leoni, B.; Garibaldi, L.; Soler, V.; Lepori, F.; Colombo, F.; et al. Recent trends in chloride and sodium concentrations in the deep subalpine lakes (Northern Italy). Environ. Sci. Pollut. R. 2015, 22, 19013–19026. [Google Scholar] [CrossRef] [PubMed] [Green Version]
  36. Robertson, D.M.; Saad, D.A.; Christiansen, D.E.; Lorenz, D.J. Simulated impacts of climate change on phosphorus loading to Lake Michigan. J. Great Lakes Res. 2016, 42, 536–548. [Google Scholar] [CrossRef] [Green Version]
  37. Michalec, B.; Wałęga, A.; Cupak, A.; Strutyński, M. Verification of the musle to determine the amount of suspended sediment. Carpathian J. Earth Environ. Sci. 2017, 12, 235–244. [Google Scholar]
  38. David, A.; Tournoud, M.G.; Perrin, J.L.; Rosain, D.; Rodier, C.; Salles, C.; Bancon-Montigny, C.; Picot, B. Spatial and temporal trends in water quality in a Mediterranean temporary river impacted by sewage effluents. Environ. Monit. Assess. 2013, 185, 2517–2534. [Google Scholar] [CrossRef]
  39. Topa, M.C.; Timofti, M.; Burada, A.; Iticescu, C.; Georgescu, L.P. Danube water quality during and after flood near an urban agglomeration. J. Environ. Prot. Ecol. 2015, 16, 1255–1261. [Google Scholar]
  40. Ou, Y.; Wang, X.; Wang, L.; Rousseau, A.N. Landscape influences on water quality in riparian buffer zone of drinking water source area, Northern China. Environ. Earth Sci. 2016, 75, 114. [Google Scholar] [CrossRef]
  41. Central Statistical Office of Poland. Environment 2005—Statistical Information and Elaboration Warsaw; Central Statistical Office of Poland: Warszawa, Poland, 2005.
  42. Central Statistical Office of Poland. Environment 2014—Statistical information and elaboration Warsaw; Central Statistical Office of Poland: Warszawa, Poland, 2014.
  43. Environmental Report 2008. Assessment of Surface Water Quality in the Wisłok River Catchment in 2004–2007; Report on the State of the Environment in the Podkarpackie Province; Voivodship Inspectorate for Environment Protection Rzeszów: Rzeszów, Poland, 2008.
  44. Kondracki, J. Regional Geography of Poland; Publishing House Warszawa: Warszawa, Poland, 2013; p. 468. [Google Scholar]
  45. Regulation of the Minister of the Environment dated 21 November 2013 on the forms and ways of monitoring uniform parts of surface and ground waters (Journal of Laws 2013, item 1558).
  46. Kaźmierczak, B.; Kotowski, A.; Wdowikowski, M. Trend analysis of annual and seasonal precipitation amounts in the Upper Odra catchment. Annu. Set Environ. Prot. 2014, 36, 49–54. [Google Scholar]
  47. Skowera, B.; Kopcińska, J.; Kołodziejczyk, M.; Kopeć, B. Precipitation deficiencies and excesses during the growing season of winter rape and winter wheat in Poland (1971–2010). Acta Agrophys. 2015, 22, 193–207. [Google Scholar]
  48. Azizzadeh, M.; Javan, K. Analyzing trends in reference evapotranspiration in northwest part of Iran. J. Ecol. Eng. 2015, 16, 1–12. [Google Scholar] [CrossRef]
  49. Maksymiuk, A.; Furmanczyk, K.; Ignar, S.; Krupa, J.; Okruszko, T. Analysis of climatic and hydrologic parameters variability in the Biebrza River basin. Sci. Rev. Eng. Environ. Sci. 2008, 3, 59–68. [Google Scholar]
  50. Rutkowska, A.; Ptak, M. On certain stationary tests for hydrological series. Stud. Geotech. Mech. 2012, 34, 51–63. [Google Scholar] [CrossRef]
  51. Banasik, K.; Hejduk, L.; Hejduk, A.; Kaznowska, E.; Banasik, J.; Byczkowski, A. Long-term variability of runoff from a small catchment in the region of the Kozienice Forest. Sylwan 2013, 157, 578–586. [Google Scholar]
  52. Hirsch, R.M.; Alexander, R.B.; Smith, R.A. Selection of methods for the detection and estimation of trends in water quality. Water Resour. Res. 1991, 27, 803–813. [Google Scholar] [CrossRef]
  53. Chang, H. Spatial analysis of water quality trends in the Han River basin, South Korea. Water. Res. 2008, 42, 3285–3304. [Google Scholar] [CrossRef]
  54. Zeleňáková, M.; Purcz, P.; Oravcová, A. Trends in water quality in Laborec River, Slovakia. Procedia Eng. 2015, 119, 1161–1170. [Google Scholar] [CrossRef]
  55. Hirsch, R.M.; Slack, J.R.; Smith, R.A. Techniques of trend analysis for monthly water quality data. Water Resour. Res. 1982, 18, 107–121. [Google Scholar] [CrossRef]
  56. Smith, R.A.; Alexander, R.B.; Wolman, M.G. Water-Quality Trends in the Nation’s Rivers. Science 1987, 235, 1607–1615. [Google Scholar] [CrossRef] [PubMed]
  57. Rutkowska, A. Statistical methods for trend investigation in hydrological non-seasonal series. Acta Sci. Pol. Form. Circumiectus 2013, 12, 85–94. [Google Scholar]
  58. Regulation of the Minister of the Environment dated 27 November 2002 on the requirements for surface water used for drinking water for people. J. Laws R. Pol. 2002, item 1728J.
  59. Kanownik, W.; Policht-Latawiec, A. Changeability of oxygen and biogenic indices in waters flowing through the areas under various anthropopressure. Pol. J. Environ. Stud. 2015, 24, 1633–1640. [Google Scholar] [CrossRef]
  60. Huang, X.; Chen, H.; Xia, F.; Wang, Z.; Mei, K.; Shang, X.; Liu, Y.; Dahlgren, R.A.; Zhang, M.; Huang, H. Assessment of Long-Term Watershed Management on Reservoir Phosphorus Concentrations and Export Fluxes. Int. J. Environ. Res. Public Health 2018, 15, 2169. [Google Scholar] [CrossRef] [PubMed]
Figure 1. Location of measuring-control point in the Wisłok River’s water catchment.
Sustainability 11 01988 g001
Figure 2. Chart normality indices investigated.
Sustainability 11 01988 g002
Figure 3. The values of the indices in 2004–2013, the trendline, and quality classes of the water.
Sustainability 11 01988 g003
Figure 4. The monthly average concentrations of analysed parameters in the winter and summer half-year in the years 2004–2013.
Sustainability 11 01988 g004
Table 1. Descriptive statistics of the analysed Wisłok River water quality indices concentrations in 2004–2013.
IndicesRange of ValuesArithmetic Mean (mg·dm−3)95% Confidence IntervalMedian (mg·dm−3)
Minimum (mg·dm−3)Maximum (mg·dm−3)
Ammonium nitrogen (NH4-N)0.021.600.350.300.410.24
Total Kjeldahl nitrogen (TKN)0.005.901.271.131.421.10
Nitrite nitrogen (NO2-N)0.000.130.030.030.040.03
Nitrate nitrogen (NO3-N)0.004.201.601.501.701.50
Total nitrogen (TN)0.807.402.892.713.082.80
Phosphates (PO4)0.020.430.150.140.170.13
Total phosphorus (TP)0.000.760.140.120.170.12
Table 2. Variability measures, the slopes of linear trend and rank statistics (tau Kendall statistics) of the changes in the trends in nitrogen and phosphorus concentrations in the Wisłok River water in the years 2004–2013.
IndicesRange of Changes (mg·dm−3)StandardDeviation (mg·dm−3)Variation Coefficient (%)Slope of the Trend (mg·dm−3·month−1)Rank Statistics
of the Trend (Kendall tau)
Test Statistic (Z)Probability Test (p)
Ammonium nitrogen (NH4-N)1.580.3289−0.0027 a−0.197 a−3.18 a0.001
Total Kjeldahl nitrogen (TKN)5.900.7559−0.0053 a−0.233 a−3.57 a<0.001
Nitrite nitrogen (NO2-N)0.130.0268<0.00010.0290.380.70
Nitrate nitrogen (NO3-N)4.200.5635−0.0007−0.002−0.040.97
Total nitrogen (TN)6.600.9834−0.0061 a−0.145 a−2.23 a0.03
Phosphates (PO4)0.410.0957−0.0005 a−0.147 a−2.38 a0.02
Total phosphorus (TP)0.460.1072−0.0007−0.121−1.590.11
Note: a The trend is deemed significant at p < 0.05.
Table 3. Results of the Mann-Whitney U significance test of differences between the values of nitrogen and phosphorus concentrations in the Wisłok River water in the winter and summer half-year.
IndicesMedianQuartileThe Values of Statistics (Z)Probability Test (p)
Q1Q3Q1Q3
WinterSummerWinterSummer
Ammonium nitrogen (NH4-N)0.31 a0.19 a0.190.630.110.303.68 a<0.001
Total Kjeldahl nitrogen (TKN)1.11.10.81.50.81.6−0.450.65
Nitrite nitrogen (NO2-N)0.02 a0.04 a0.020.030.020.06−3.23 a0.001
Nitrate nitrogen (NO3-N)1.8 a1.4 a1.52.01.21.56.33 a<0.001
Total nitrogen (TN)3.0 a2.6 a2.53.52.12.93.32 a<0.001
Phosphates (PO4)0.110.150.090.160.090.23−1.750.08
Total phosphorus (TP)0.10 a0.14 a0.080.130.110.20−3.32 a<0.001
Note: a Statistical significance was assumed as α = 0.05.
Table 4. Percentage of indices in quality classes of the Wisłok River water in 2004–2013.
IndicesLimit Values (mg·dm−3) for Class [10]Frequency of Index Values (% of Samples) in the ClassArithmetic Mean (mg·dm−3) (Water Class)
IIIIIIBGP
Ammonium nitrogen (NH4-N)≤0.78≤1.5687.511.70.80.35 (I)
Total Kjeldahl nitrogen (TKN)≤1≤246.344.49.31.27 (II)
Nitrate nitrogen (NO3-N)≤2.2≤590.89.201.60 (I)
Total nitrogen (TN)≤5≤1096.33.702.89 (I)
Phosphates (PO4)≤0.2≤0.3181.710.87.50.15 (I)
Total phosphorus (TP)≤0.2≤0.487.79.82.50.14 (I)
Note: BGP is below good potential.
Table 5. Usability of water as a source of drinking water.
IndicesPermissible Values (mg·dm−3) for Water Treatment Category [58]Frequency of Index Values (% of Samples) in Normative Rangefor a Given Water Treatment Category
A1A2A3A1A2A3
Ammonium (NH4)0.5 a1.5 b2.0 b73.3 c98.399.2
Total Kjeldahl nitrogen (TKN)1 a2 a3 a46.3 c90.7 c98.1
Nitrates (NO3)50 b50 b50 b100100100
Phosphates (PO4)0.4 a0.7 a0.7 a98.3100100
Notes: a for 90% of samples, b for 95% of samples, c The index value does not meet the requirements for a given water treatment category.

