Relationships between Ecosystem Services and Urbanization in Jiangsu Province, Eastern China


1
Department of Ecology, School of Horticulture and Plant Protection, Yangzhou University, Yangzhou 225009, China
2
Jiangsu Key Laboratory of Agricultural Meteorology, Collaborative Innovation Center on Forecast and Evaluation of Meteorological Disasters, Collaborative Innovation Center of Atmospheric Environment and Equipment Technology, Nanjing University of Information Science and Technology, Nanjing 210044, China
3
Anhui Province Key Lab of Atmospheric Science and Satellite Remote Sensing, Shouxian National Climatological Observatory, Hefei 230031, China
*
Authors to whom correspondence should be addressed.
Sustainability 2019, 11(7), 2073; https://0-doi-org.brum.beds.ac.uk/10.3390/su11072073
Submission received: 27 January 2019
/
Revised: 30 March 2019
/
Accepted: 1 April 2019
/
Published: 8 April 2019
(This article belongs to the Special Issue Urban Remote Sensing: Sustainability of Earth’s Environment, Resources and Ecology)
Abstract
:Ecosystem services are comprehensive and quantitative indicators for describing ecosystem–human interactions. China has experienced rapid urbanization in the past 30 years, which has created a significant impact on regional ecosystem services. However, whether the impact is linear is not clear as yet. In this study, the Jiangsu province, a main body of the Chinese Yangtze River Delta city cluster, was chosen as a case study. Multi-source remotely-sensed geospatial data, including meteorological, land use, vegetation, and socio-economic data, were collected to estimate the total amount of ecosystem services (TESV) and urbanization levels. Subsequently, the relationships between TESV and urbanization indices (i.e., gross domestic product (GDP) per unit area, GPUA; population per unit area, PPUA; and built-up land proportion, BULP) were determined using the Pearson correlation analysis and piecewise linear regression. The primary findings of this study were as follows: (1) There was a distinct spatial pattern in TESV, which gradually increased from west to east with high-value areas located in eastern coastal areas of Jiangsu. Among different land use types, cropland and woodland contributed the most to TESV; (2) The three urbanization indices had spatial patterns, indicating higher urbanization in southern Jiangsu than in central or northern Jiangsu; and (3) Once GPUA and PPUA exceeded threshold values of 3719.55 × 104 yuan/km2 and 744.37 person/km2, respectively, TESV sharply decreased with an increase in these indices. However, the BULP showed a linear and significantly negative relationship with TESV at all values, which indicated that the impacts of economic and population growth on TESV lagged behind that of built-up land expansion. These findings provide a potentially significant reference for decision-makers to rationally enhance regional ecosystem services during rapid urbanization processes.

1. Introduction
It is well known that China has been undergoing a significant and complex urbanization process for the past 30 years [1,2]. A marked result of this process is that large areas of non-construction land have converted to construction land due to increasing urbanization, which has had a negative impact on the structures, processes, and functions of the affected ecosystems [3,4]. Ecological problems, such as urban heat islands, air pollution, and land deterioration, have not been addressed in many highly-urbanized regions nationwide [5], and have restricted the progress of urbanization to some extent. Thus, a comprehensive understanding of the ecological effects of urbanization processes has become a critical research topic in current academic circles worldwide [6,7,8].
Ecological footprint and ecosystem services are two important concepts in ecosystem–human interactions. The former is a common measure of anthropogenic pressure on the socio-environmental system, reflecting the human demand on biologically productive spaces [9], whereas the latter measures the varied benefits that human beings derive from their natural environment. The Millennium Ecosystem Assessment (MA) firstly focused on the linkages between ecosystem services and human well-being [10]. Thus, some scholars considered ecosystem services as a bridge between the natural environment and human-centered sustainable development [7,11]. Ecosystem services are divided by the MA into four categories: provisioning, regulating, cultural, and supporting services. Mass and monetary valuation are two common ways to quantitatively evaluate regional ecosystem services. Costanza et al. [11,12] evaluated global economic values of ecosystem services using equivalence factors per unit area, and indicated that the loss of ecosystem services reached over $US 4.3 trillion/year due to massive land use changes. Considering that this value assessment did not account for ecological processes and functions, some scholars evaluated physical quantities of ecosystem services by linking remotely-sensed data to process-based models, such as carbon sequestration, soil retention, and water retention [13]. Ouyang et al. [14] adopted this method to evaluate national ecosystem services in China, concluding that ecosystem services improved from 2000 to 2010 due to the implementation of a series of ecological engineering projects. Because ecosystem services have the ability to reflect ecosystem status and change, they are usually considered one of the most comprehensive and quantifiable indicators in sustainable development research [15].
Urbanization is an inevitable consequence of social and economic development, and may produce complex impacts on ecosystem services based on varied urbanization levels and factors. Most studies have found that ecosystem services show a negative relationship with urbanization levels [13,16,17]. For example, Li et al. [16] indicated that ecosystem services follow a heterogeneous spatial pattern along an urban-rural gradient in Nanjing under the background of rapid urbanization. Zhang et al. [17] predicted that ecosystem services would decline with continuing urban expansion in the Beijing-Tianjin-Hebei region (BTHR) in the future social-economic scenario. However, some studies have shown different results. Larondelle and Haase [18] reported no typical urban–rural gradient in the provision of urban ecosystem services within four European cities. Zhou et al. [19] pointed out that the amount of ecosystem services in BTHR increased with rapid urbanization from 1996–2014. Wan et al. [20] further found that ecosystem services increase initially but drop later as urbanization processes. These discrepancies may be due to the varied urbanization indices that emerged with the deepening of urbanization research, such as economic urbanization, population urbanization, and land urbanization indices, all of which had varied impacts on ecosystem services [7,21]. Su et al. [21] indicated that population and economic growth had strong negative impacts on ecosystem services in Shanghai, while both had no significant impacts in Fuzhou [22]. Peng et al. [7] indicated that urban land expansion has significant negative impacts on ecosystem services in Beijing. Although these, and many similar studies have revealed that urbanization is one of the most important driving forces for changes in ecosystem services [3,4], it is not clear whether its impacts on these services are linear in the mega-regions. If non-linear impacts exist, their corresponding threshold values are still unclear.
The Jiangsu province is not only an important part of the Yangtze River Delta city cluster but also one of the most prosperous regions in China. It has experienced rapid urbanization over the past 30 years, which has caused a series of ecological problems, e.g., food insecurity, urban heat islands, soil erosion, and water shortages, but few previous studies have reported the relationships between ecosystem services and urbanization indices in this region [23,24]. Thus, the Jiangsu province was chosen for this study. The major objectives of our study were (1) to quantify spatial patterns of ecosystem services using multi-source remotely-sensed geospatial data; and (2) to detect whether the relationship between ecosystem services and urbanization indices is linear or non-linear. The findings of our study will provide a potentially useful resource for sustainable development in the Yangtze River Delta city cluster.
2. Study Area and Data Collection
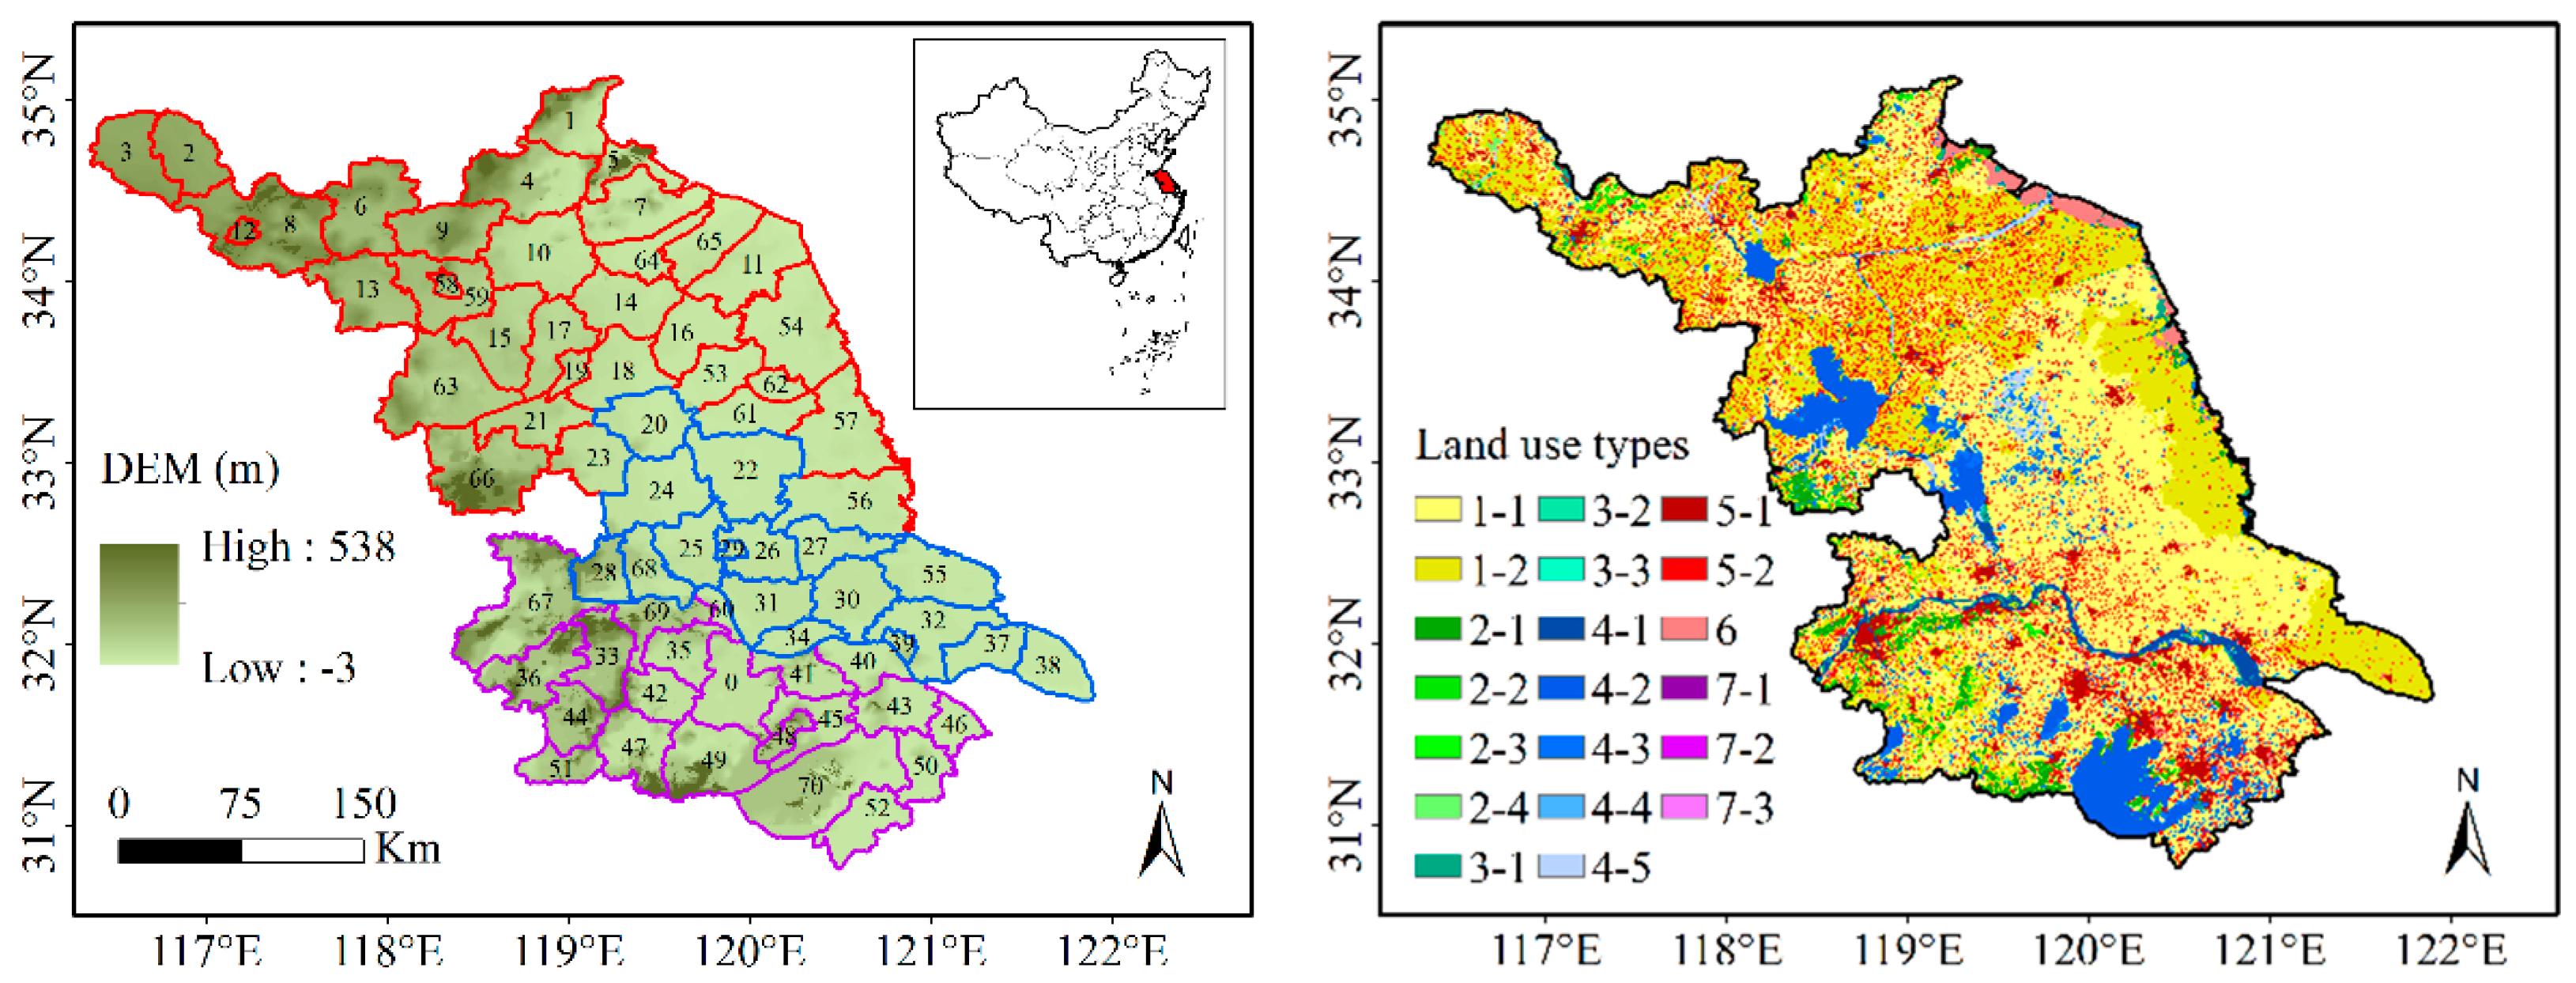
Jiangsu province (30°45′ N–35°20′ N, 116°18′ E–121°57′ E) is located in eastern China. It has 13 major cities and 71 counties in three sub-regions from north to south (Figure 1 and Table S1), a total population of 79.99 million, and an area of 10.72 × 10⁴ km2. The typical topography of Jiangsu is flat, with plains accounting for 68.81% of the total area. Cropland, built-up land, and water area accounted for 66.74%, 16.68%, and 12.42% of the total area of Jiangsu respectively, whereas woodland, grassland, and unused land together accounted for only 4.16% of the total area in 2015 (Figure 1). Jiangsu is known as “a land flowing with milk and honey” with superior natural conditions and abundant agricultural resources. As an important part of the Yangtze River Delta city cluster, Jiangsu has undergone rapid economic and social development. Its gross domestic product (GDP) per capita, synthesized competitiveness, and development index ranked first in all of China by the end of 2014. Additionally, its urbanization rate has reached 63%, far outstripping the national average.
Principal data sources used included (1) gridded meteorological data for 2015 at 1000-m spatial resolution from the National Climate Center (NCC) of China; (2) remotely-sensed geospatial data for land use, GDP, and population for 2015 at 1000-m spatial resolution from http://www.ecosystem.csdb.cn/; (3) NASA Shuttle Radar Topography Mission (SRTM) 90-m digital elevation data from http://srtm.csi.cgiar.org/; (4) the 250-m normalized difference vegetation index (NDVI) and 1000-m evapotranspiration data for 2015 from https://modis-land.gsfc.nasa.gov/vi.html; (5) the 1:1,000,000 soil map and attribute data from http://westdc.westgis.ac.cn/; and (6) statistical data, e.g., grain production and built-up area for the year of 2015, from the Statistical Yearbook of Jiangsu.
3. Methods
3.1. Calculation of Ecosystem Services
During the rapid urbanization process, large areas of non-construction land have converted to construction land, which has caused ecological and social problems in Jiangsu, such as food insecurity, urban heat islands, soil erosion, and water shortages [23]. Thus, we selected food production, carbon sequestration, soil retention, and water retention as indices to evaluate regional ecosystem services because these four indices have been frequently used to reflect ecosystem services [6,7]. Remotely-sensed data linked to different models were used to calculate values of the corresponding ecosystem services at a grid scale. The calculation methods were as follows:
(1) Food production
After collecting grain yield data and NDVI in Jiangsu, the linear relationship between yield and NDVI of cropland was established to allocate the yield to each grid of cropland at a county scale. Detailed calculation steps are shown in previous work [25].
(2) Carbon sequestration
The satellite-based vegetation productivity model, Carnegie-Ames-Stanford Approach (CASA), and the photosynthesis equation were used to calculate values of carbon sequestration in different vegetation types. The calculation formula of the CASA model is as follows:
where APAR(x, t) is the absorbed photosynthetically active radiation in a given location and time, and ε(x, t) is light use efficiency in a given location and time. The gridded climate, NDVI, and vegetation classification data derived from remote sensing were used as the input data to obtain vegetation net primary production (NPP) using the CASA model. For every 1 kg NPP produced, 1.63 kg of CO2 was sequestrated. Detailed calculation steps are shown in previous work [26].
(3) Soil retention
The revised universal soil loss equation (RUSLE) was used to calculate soil retention capacity at a grid scale. The calculation formula of RUSLE model is as follows:
where SC is the soil retention capacity, R is the rainfall erosivity factor, K is the soil erodibility factor, LS is the topographic factor, C is the vegetation cover factor, and P is the conservation practice factor. The gridded precipitation, NDVI, soil attribute data, and digital elevation data derived from remote sensing were used as the input data to obtain soil retention capacity using RUSLE model. Detailed calculation steps are given in previous work [14].
(4) Water retention
The water balance equation was used to calculate water retention capacity at a grid scale. The calculation formula is as follows:
where W is total water retention, Pi is precipitation, Ri is storm runoff, ETi is evapotranspiration, and Ai is the area of the i-th ecosystem. The gridded precipitation, evapotranspiration, and runoff coefficient were used as the input data to obtain water retention capacity using the water balance model. Detailed calculation steps are given in previous work [14].
According to the definition of ecosystem services proposed by Costanza et al. [11], both ecosystem goods and services are together considered as ecosystem services. Thus, the total amount of ecosystem services (TESV) was proposed to reflect the total amount of four types of ecosystem services. Considering the different units of these four types of ecosystem services, a standardized method was used to allocate their original values to range from 0 to 1, and then calculate TESV as
where ESi,j is the original value of ecosystem service i in pixel j, and ESi,min and ESi,max are the lowest and highest values of ecosystem service i, respectively.
3.2. Selection of Urbanization Indices
The degree of urbanization is an important factor to reflect the level of regional socio-economic development. In earlier research, the proportion of urban population was used as the sole indicator to measure urbanization. However, with the expansion of urbanization research, the measurement of urbanization is no longer limited to this single indicator, which encompassed aspects of society and economy, such as economic urbanization, population urbanization, and land urbanization. Following Peng et al. [7] and Wan et al. [20], three common indices were selected for analysis in this study: GDP per unit area (GPUA), population per unit area (PPUA), and built-up land proportion (BULP). Each of these indices reflect a different aspect of urbanization. The gridded GPUA and PPUA data were sourced from http://www.ecosystem.csdb.cn/. Both GPUA and PPUA in a county were allocated to each grid according to the weight of land use types and night lighting data. The BULP was calculated as the proportion of construction land in a county according to the Statistical Yearbook of Jiangsu.
3.3. Analysis of Relationships between Ecosystem Services and Urbanization Indices
The correlations between ecosystem services and urbanization indices were analyzed using Pearson’s test. Detailed calculation steps are described in previous work [27]. In this study, counties in all regions were chosen as the statistical unit to calculate correlations between two variables. The significance level was set at 1%. Considering the differing measurement units of TESV and urbanization indices, each urbanization index was standardized to range from 0 to 1 to calculate the correlations between TESV and each urbanization index.
4. Results
4.1. Spatial Patterns of Ecosystem Services in Jiangsu
Values for the four types of ecosystem services chosen—food production, carbon sequestration, soil retention, and water retention—were calculated for 2015 using the methods described in Section 3.1. These values were then analyzed according to sub-regions and land use types using geostatistical methods.
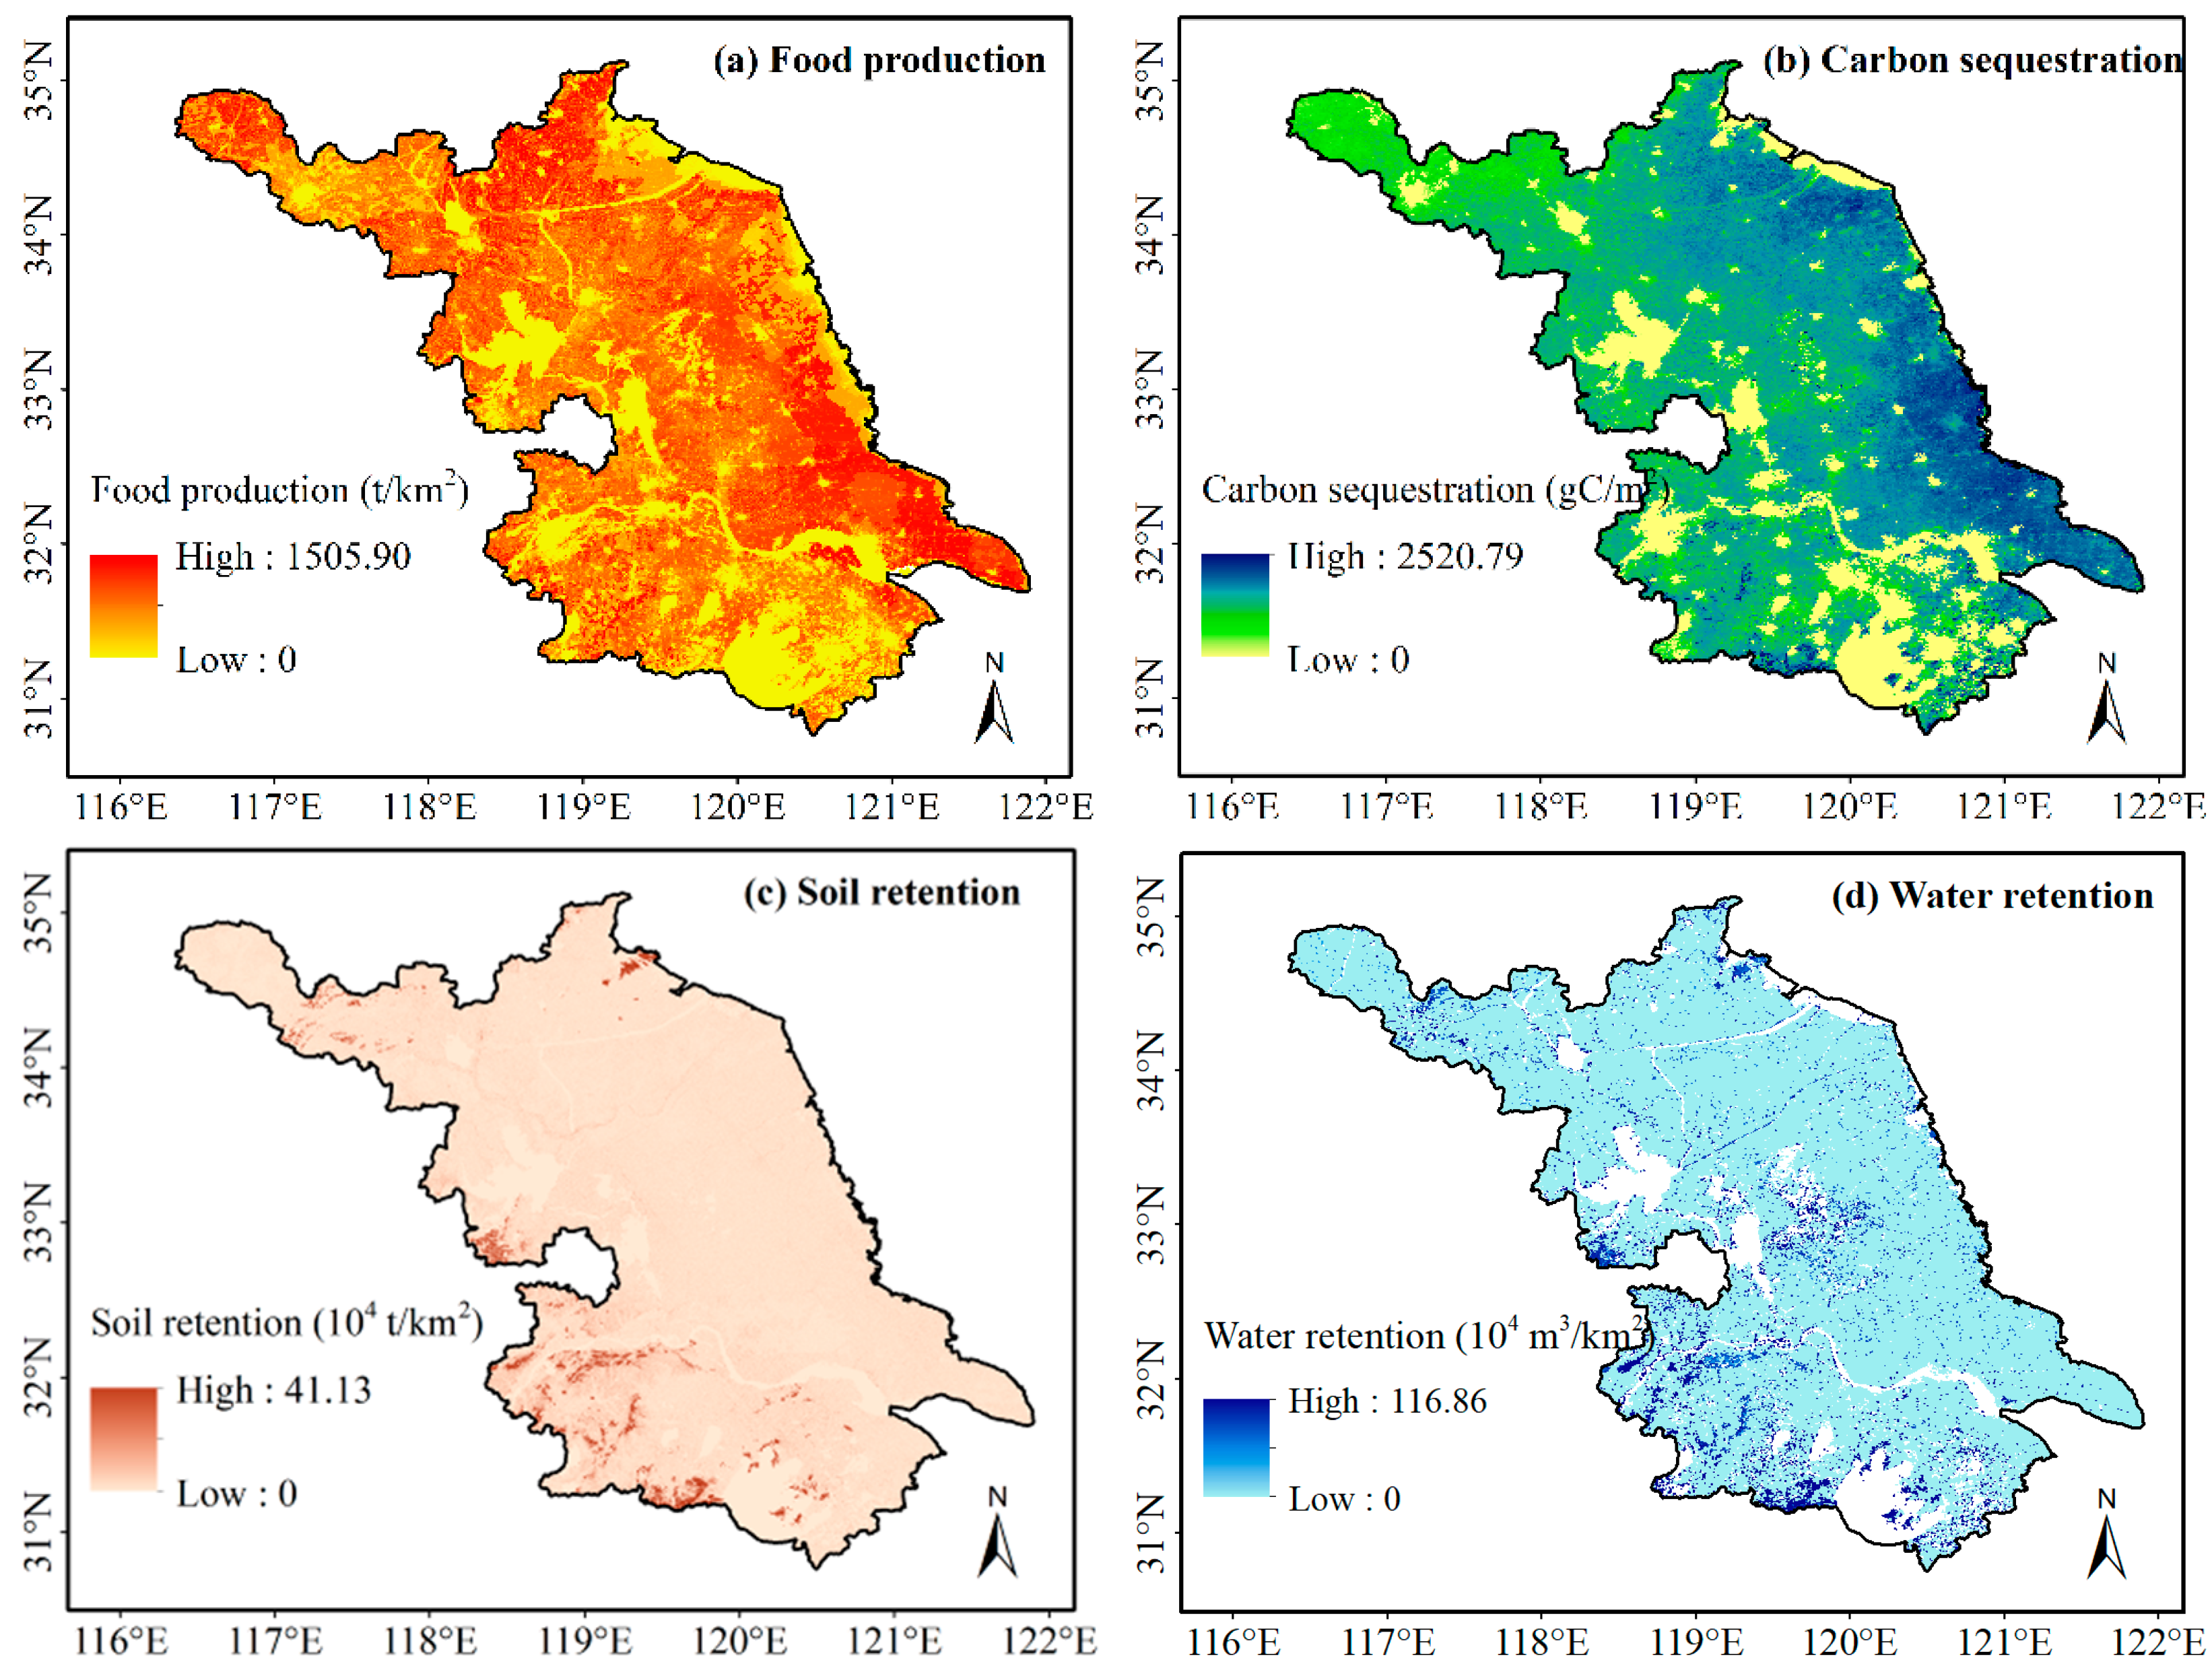
The spatial patterns of these four types of ecosystem services are shown in Figure 2a–d. The values of food production and carbon sequestration ranged from 0 to 1505.90 t/km2 and from 0 to 2520.79 gC/km2, respectively (Figure 2a,b), and gradually increased from west to east with high-value areas located in the eastern coastal area of central Jiangsu, near Haimen, Haian, and Rudong (Table S1). Table 1 shows that the total values of food production and carbon sequestration were highest in northern Jiangsu at 2.37 × 10⁸ t and 2667.21 × 104 tC, respectively, whereas both mean values were highest in central Jiangsu. As shown in Figure 2c–d, the values of soil retention and water retention ranged from 0 to 41.13 × 10⁴ t/km2 and from 0 to 116.86 × 10⁴ m3/km2 in Jiangsu, with high-value areas located in the southwestern area of southern Jiangsu. This was mainly because large areas of woodland are distributed in this region, and they contributed to providing these services [14]. Table 1 shows that the mean and total values of soil retention and water retention were highest in southern Jiangsu, followed by northern Jiangsu, while the lowest values were in central Jiangsu.
The land use map shows that cropland was the largest land use type in Jiangsu (Figure 1). As shown in Table 2, the mean and total values of food production were 6841.63 t/km2 and 4.59 t respectively for cropland. In addition to food production, cropland was also an important contributor to the other three types of ecosystem services. The total values calculated for cropland were 95.17% in carbon sequestration, 54.02% in soil retention, and 19.72% in water retention (Table 2). Total values of woodland for carbon sequestration, soil retention, and water retention were less than cropland values, but greater than the grassland values (Table 2). However, the water area contributed the least to TESV (Table 2).
4.2. Spatial Patterns of TESV in Jiangsu
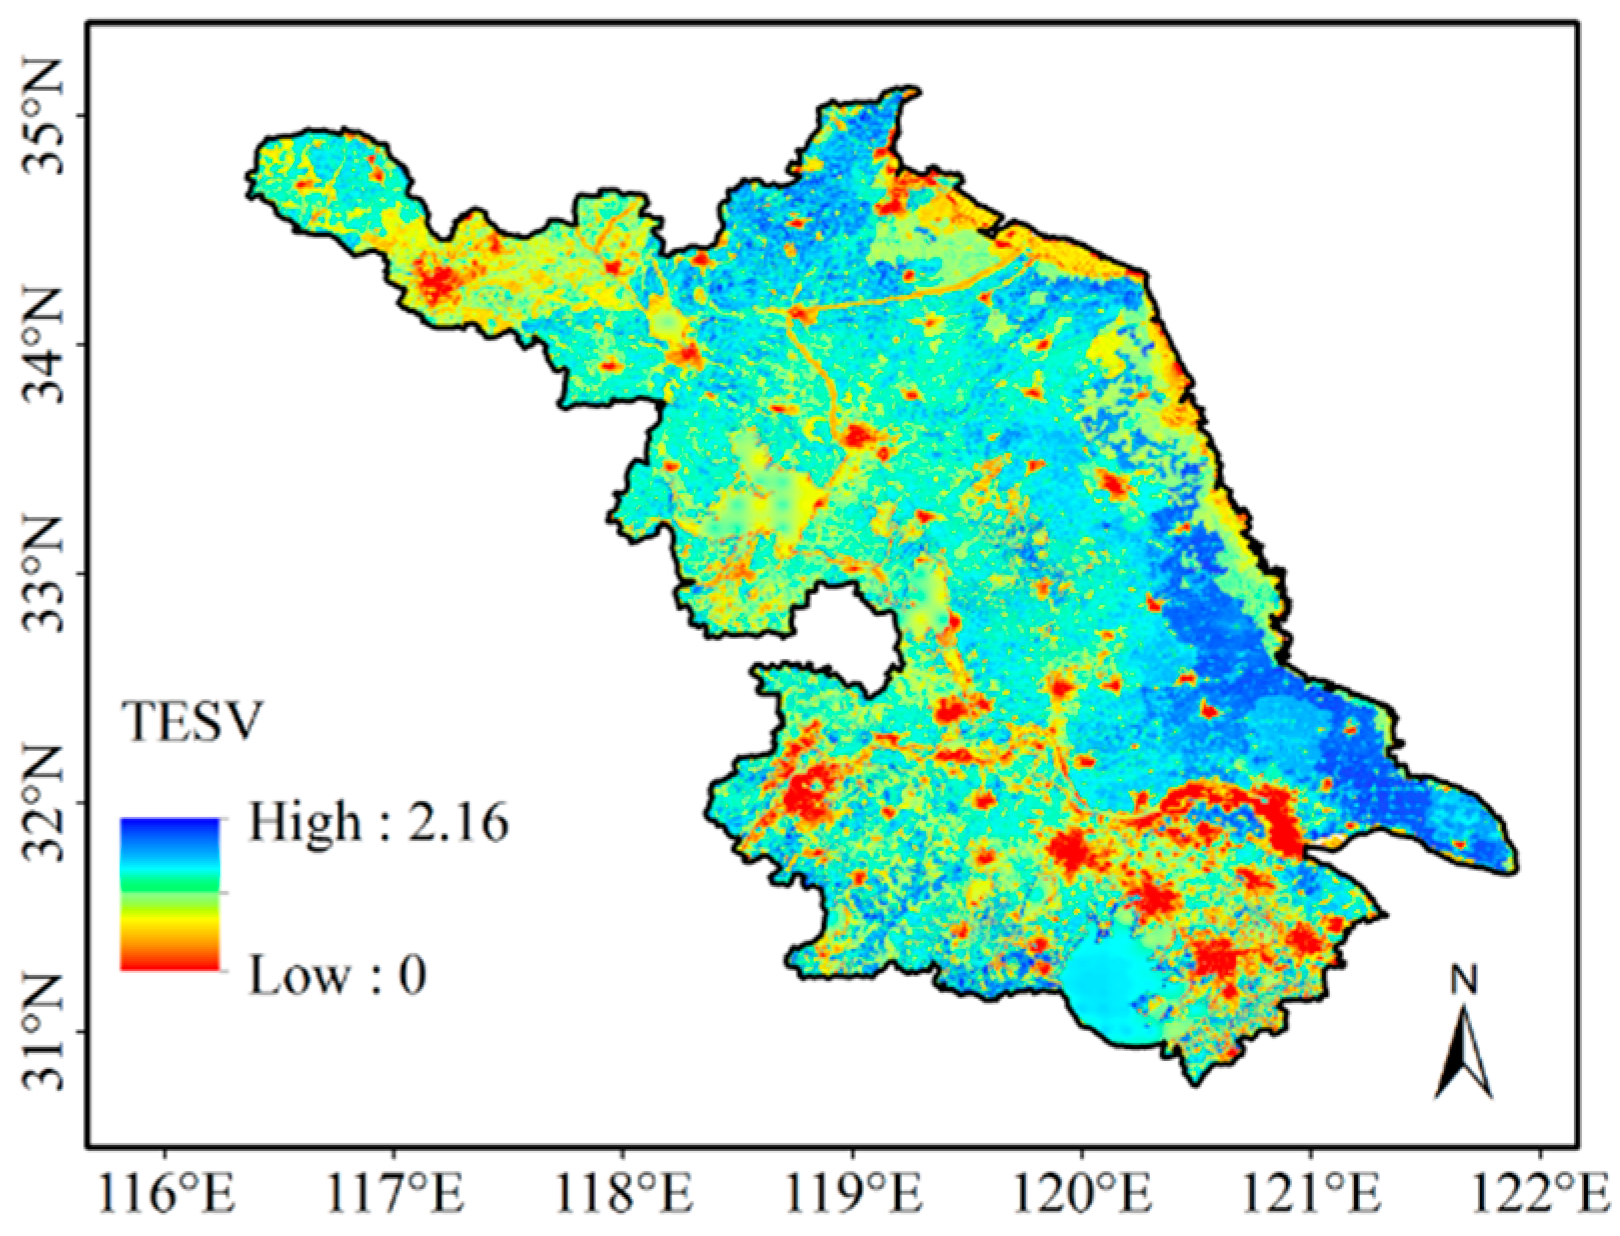
TESV was quantified by calculating standardized values for four types of ecosystem services, and was then analyzed by sub-region using geostatistical methods. The spatial patterns of TESV are shown in Figure 3. TESV ranged from 0 to 2.16, with a mean of 0.77 (Figure 3), and gradually increased from west to east, with high-value areas located in the eastern coastal areas of central Jiangsu, near Haimen, Haian, and Rudong. As for sub-regions, the mean TESV was the highest in central Jiangsu at 0.79, followed by northern Jiangsu at 0.74 (Table 3). In southern Jiangsu, large areas of built-up land were expanded, reducing the area of ecological land and resulting in the lowest TESV in the region at 0.69.
4.3. Spatial Patterns of Urbanization Indices in Jiangsu
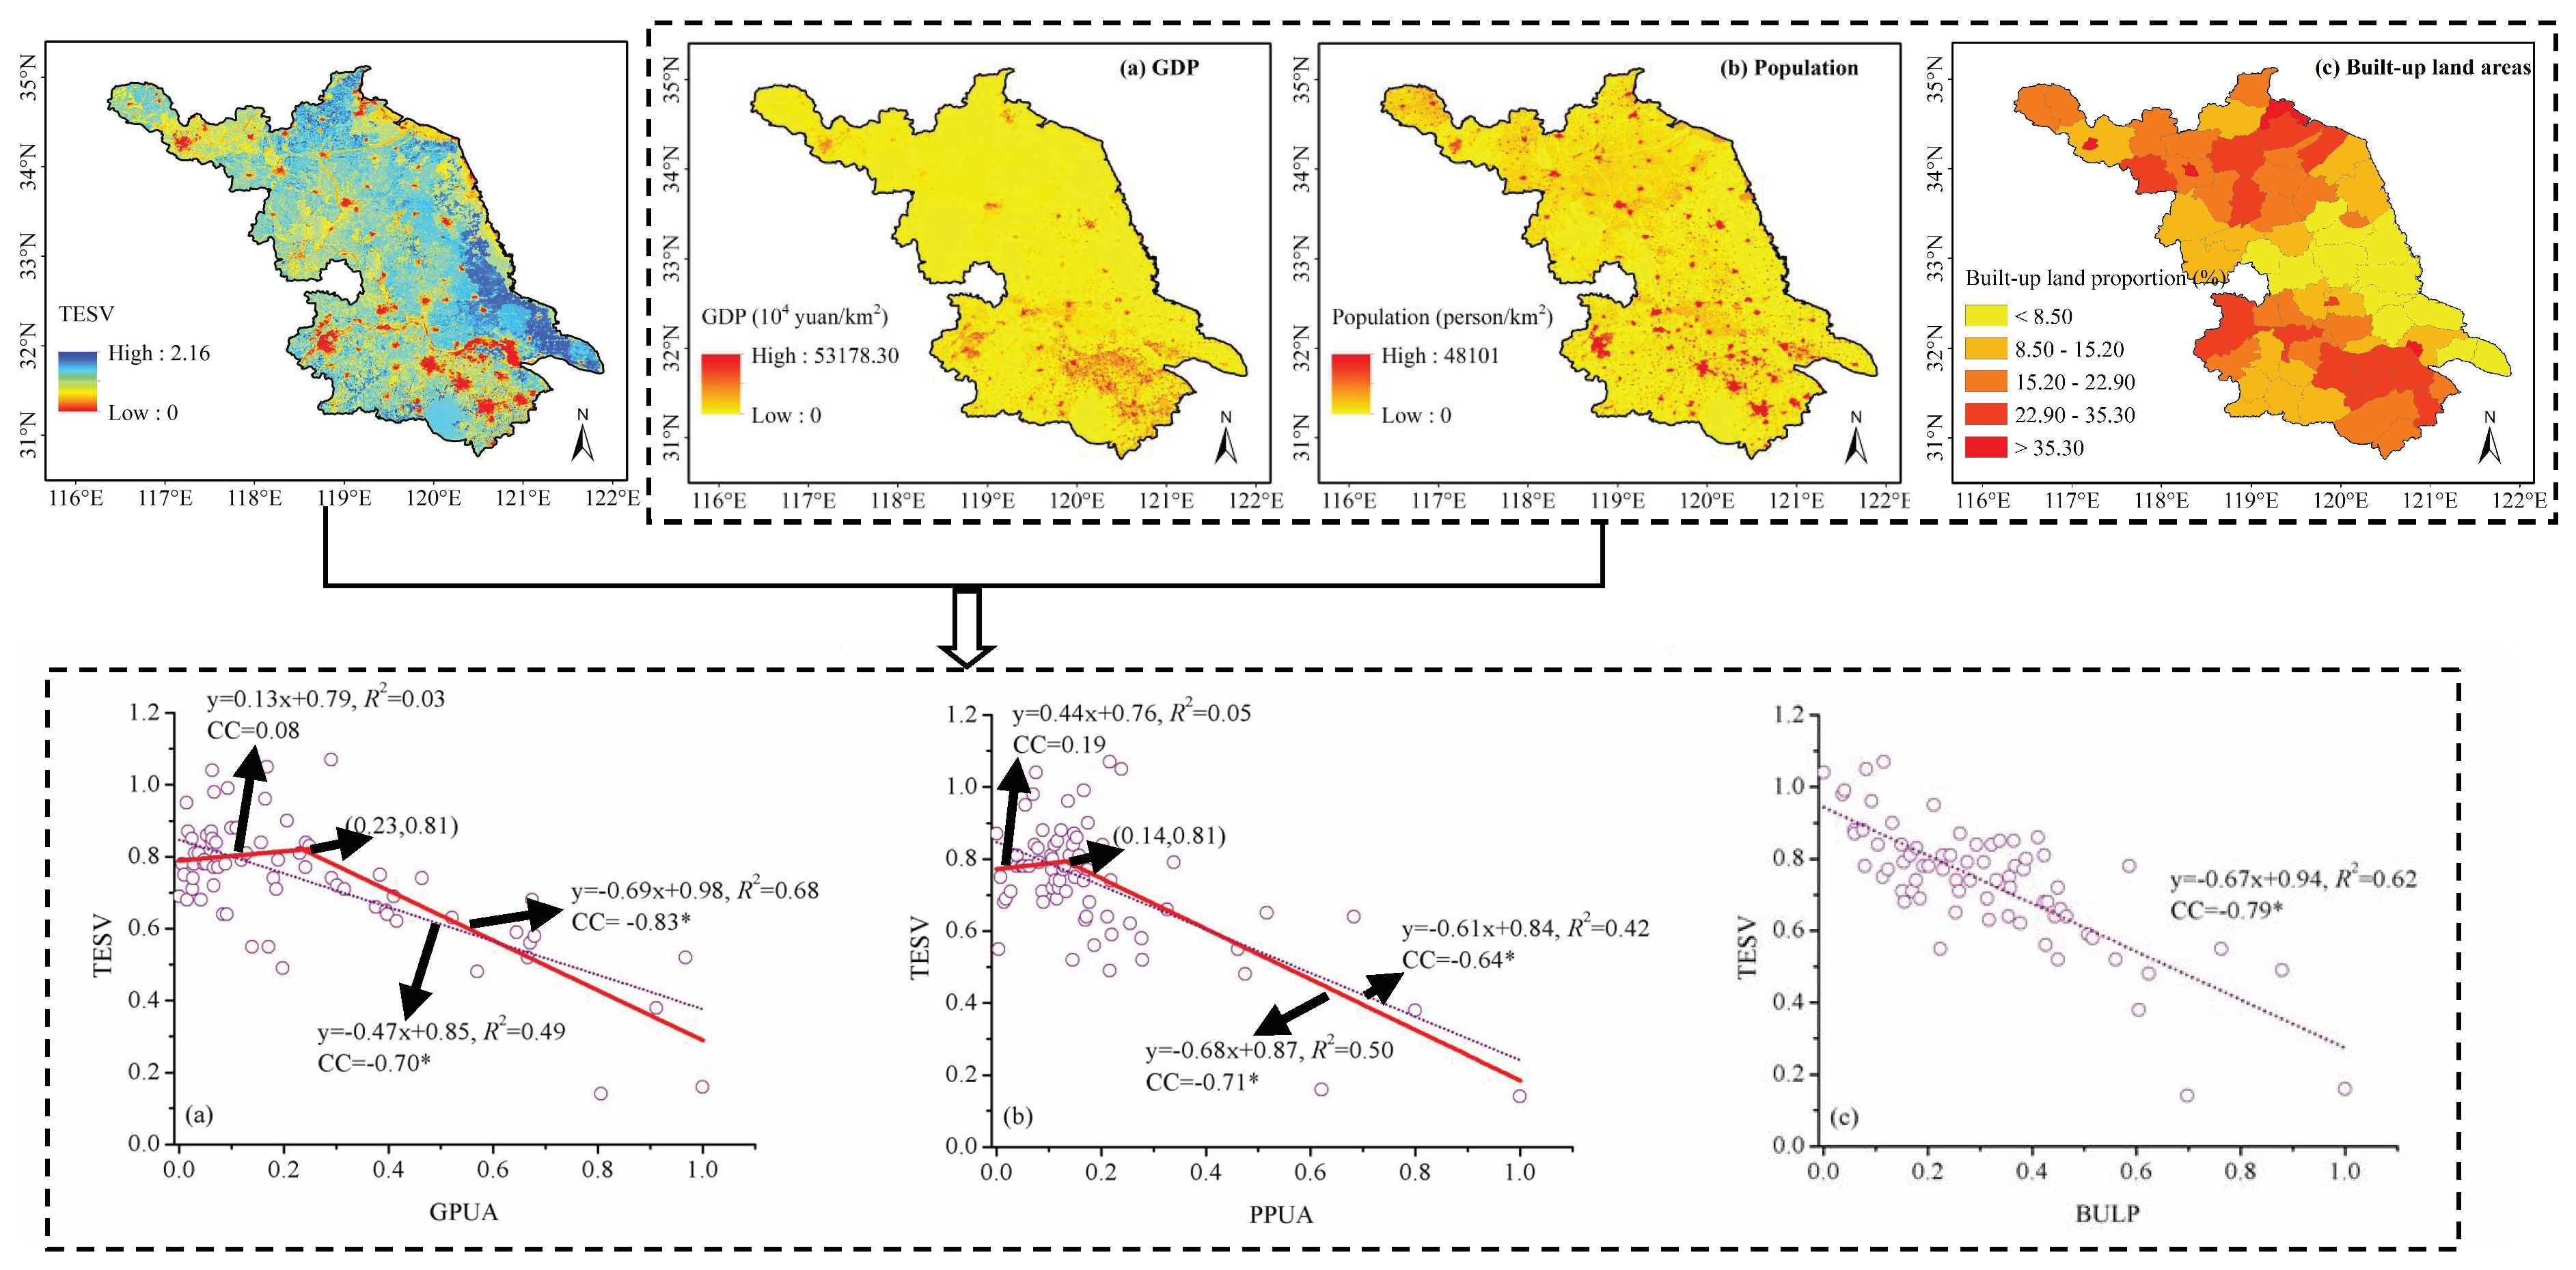
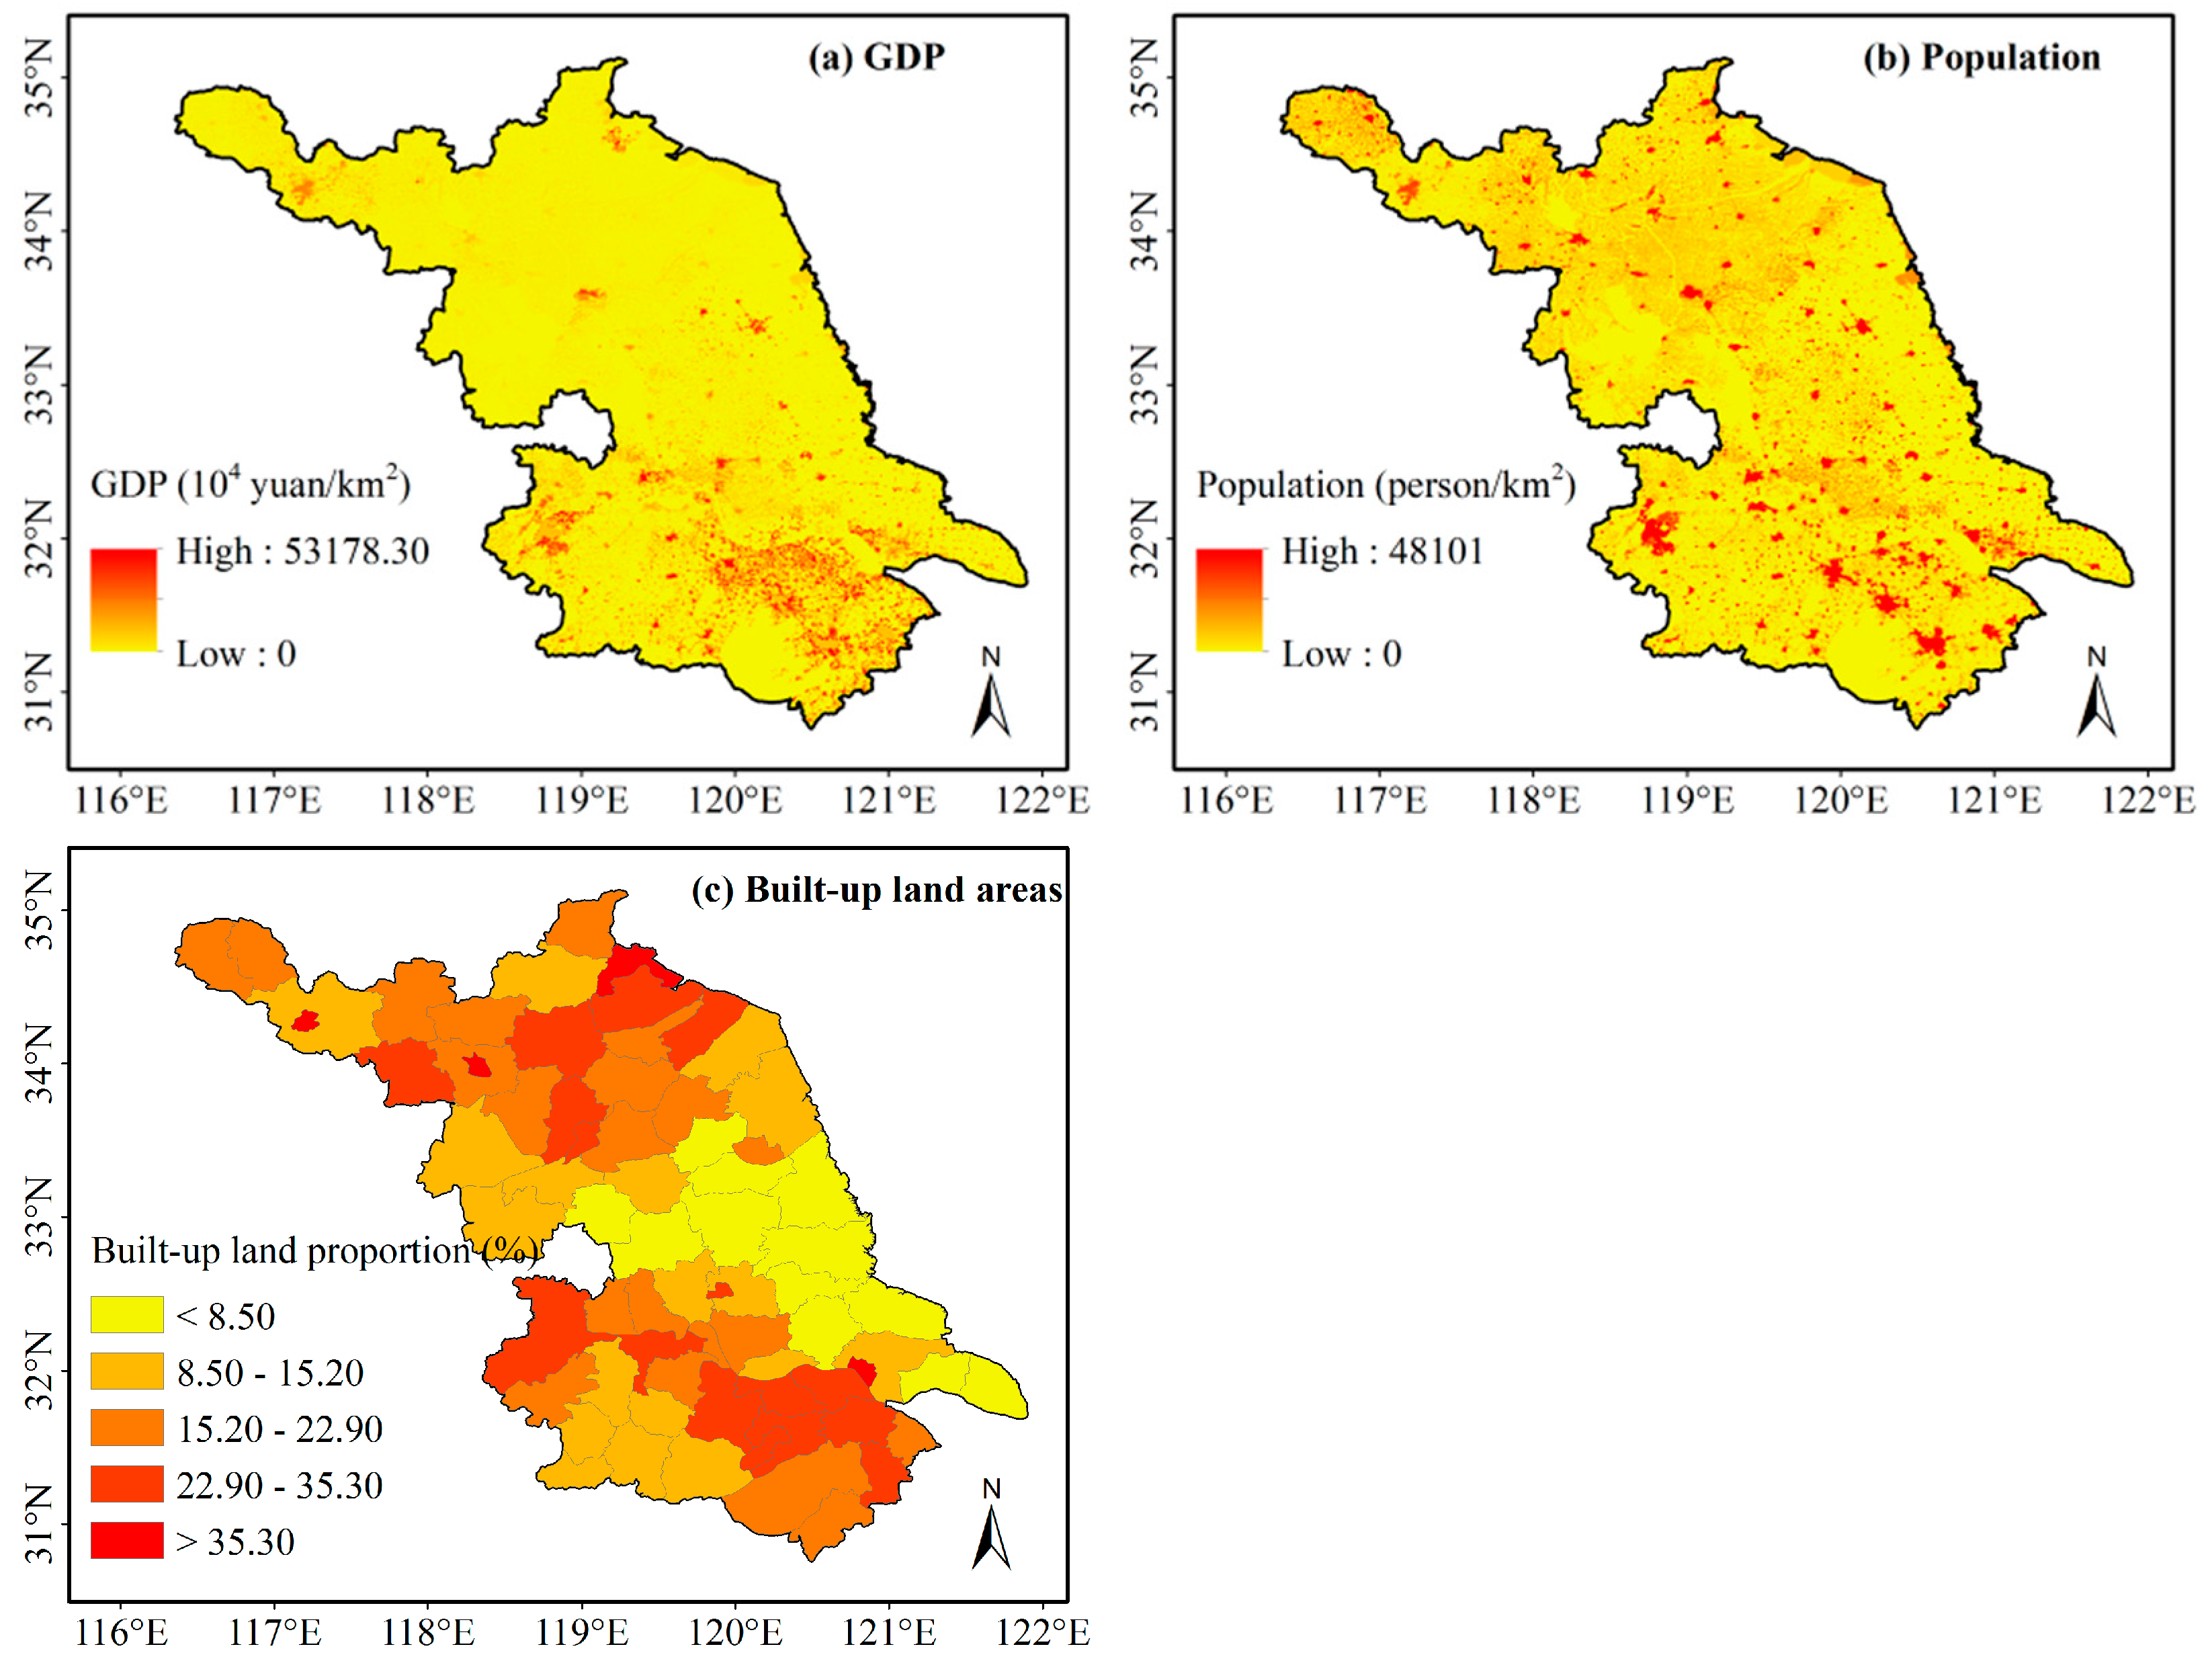
Three urbanization indices for 2015, GPUA, PPUA, and BULP, are shown in Figure 4. These indices were analyzed by sub-region using geostatistical methods. The values of GPUA ranged from 0 to 53,178.30 × 104 yuan/km2, with a mean of 3810.37 × 104 yuan/km2 (Figure 4a), and gradually increased from south to north. The mean values of GPUA were highest in southern Jiangsu, followed by central Jiangsu. The lowest GPUA value was found in northern Jiangsu (Table 4). Many counties in southern Jiangsu, such as Jiangyin, Changshu, and Zhangjiagang, ranked higher among China’s 100 small- and medium-sized cities and 100 county-level cities due to higher GPUA. The values of PPUA ranged from 0 to 48,101 person/km2 with a mean of 900.09 person/km2 (Figure 4b), and showed a similar geographical distribution to that of GPUA. The mean values of PPUA were highest in southern Jiangsu and lowest in northern Jiangsu (Table 4). BULP values ranged from 2.49% to 48.80% with a mean of 17.93% (Figure 4c). The mean values of BULP were highest in southern Jiangsu, followed by northern Jiangsu, and the lowest BULP value was in central Jiangsu (Table 4). These values indicate that urbanization levels in southern Jiangsu were higher than those in central and northern Jiangsu.
4.4. Relationships between TESV and Urbanization indices in Jiangsu
Urbanization levels are generally associated with ecosystem services, and are regarded as a critical factor for regional ecosystem services. Because the three urbanization indices (GPUA, PPUA, and BULP) had different units, we used a standardized method to allocate original values to range from 0 to 1, and determined the relationships between TESV and normalized urbanization indices using the Pearson correlation analysis. Table 5 shows significant negative correlations between TESV and each of the three normalized urbanization indices in Jiangsu. Among the indices, BULP had the highest correlation coefficient with TESV, reaching −0.79, whereas PPUA had the lowest correlation coefficient. The R2 values of the multivariate regression equation were used to indicate the strength of the correlation of the normalized urbanization indices to TESV. As shown in Table 5, the interpretation strength of three urbanization factors to TESV was 0.71 in Jiangsu. Moreover, all three urbanization factors showed negative impacts on TESV. Particularly, BULP had the largest coefficient, which indicates that BULP was a critical factor for TESV in this region.
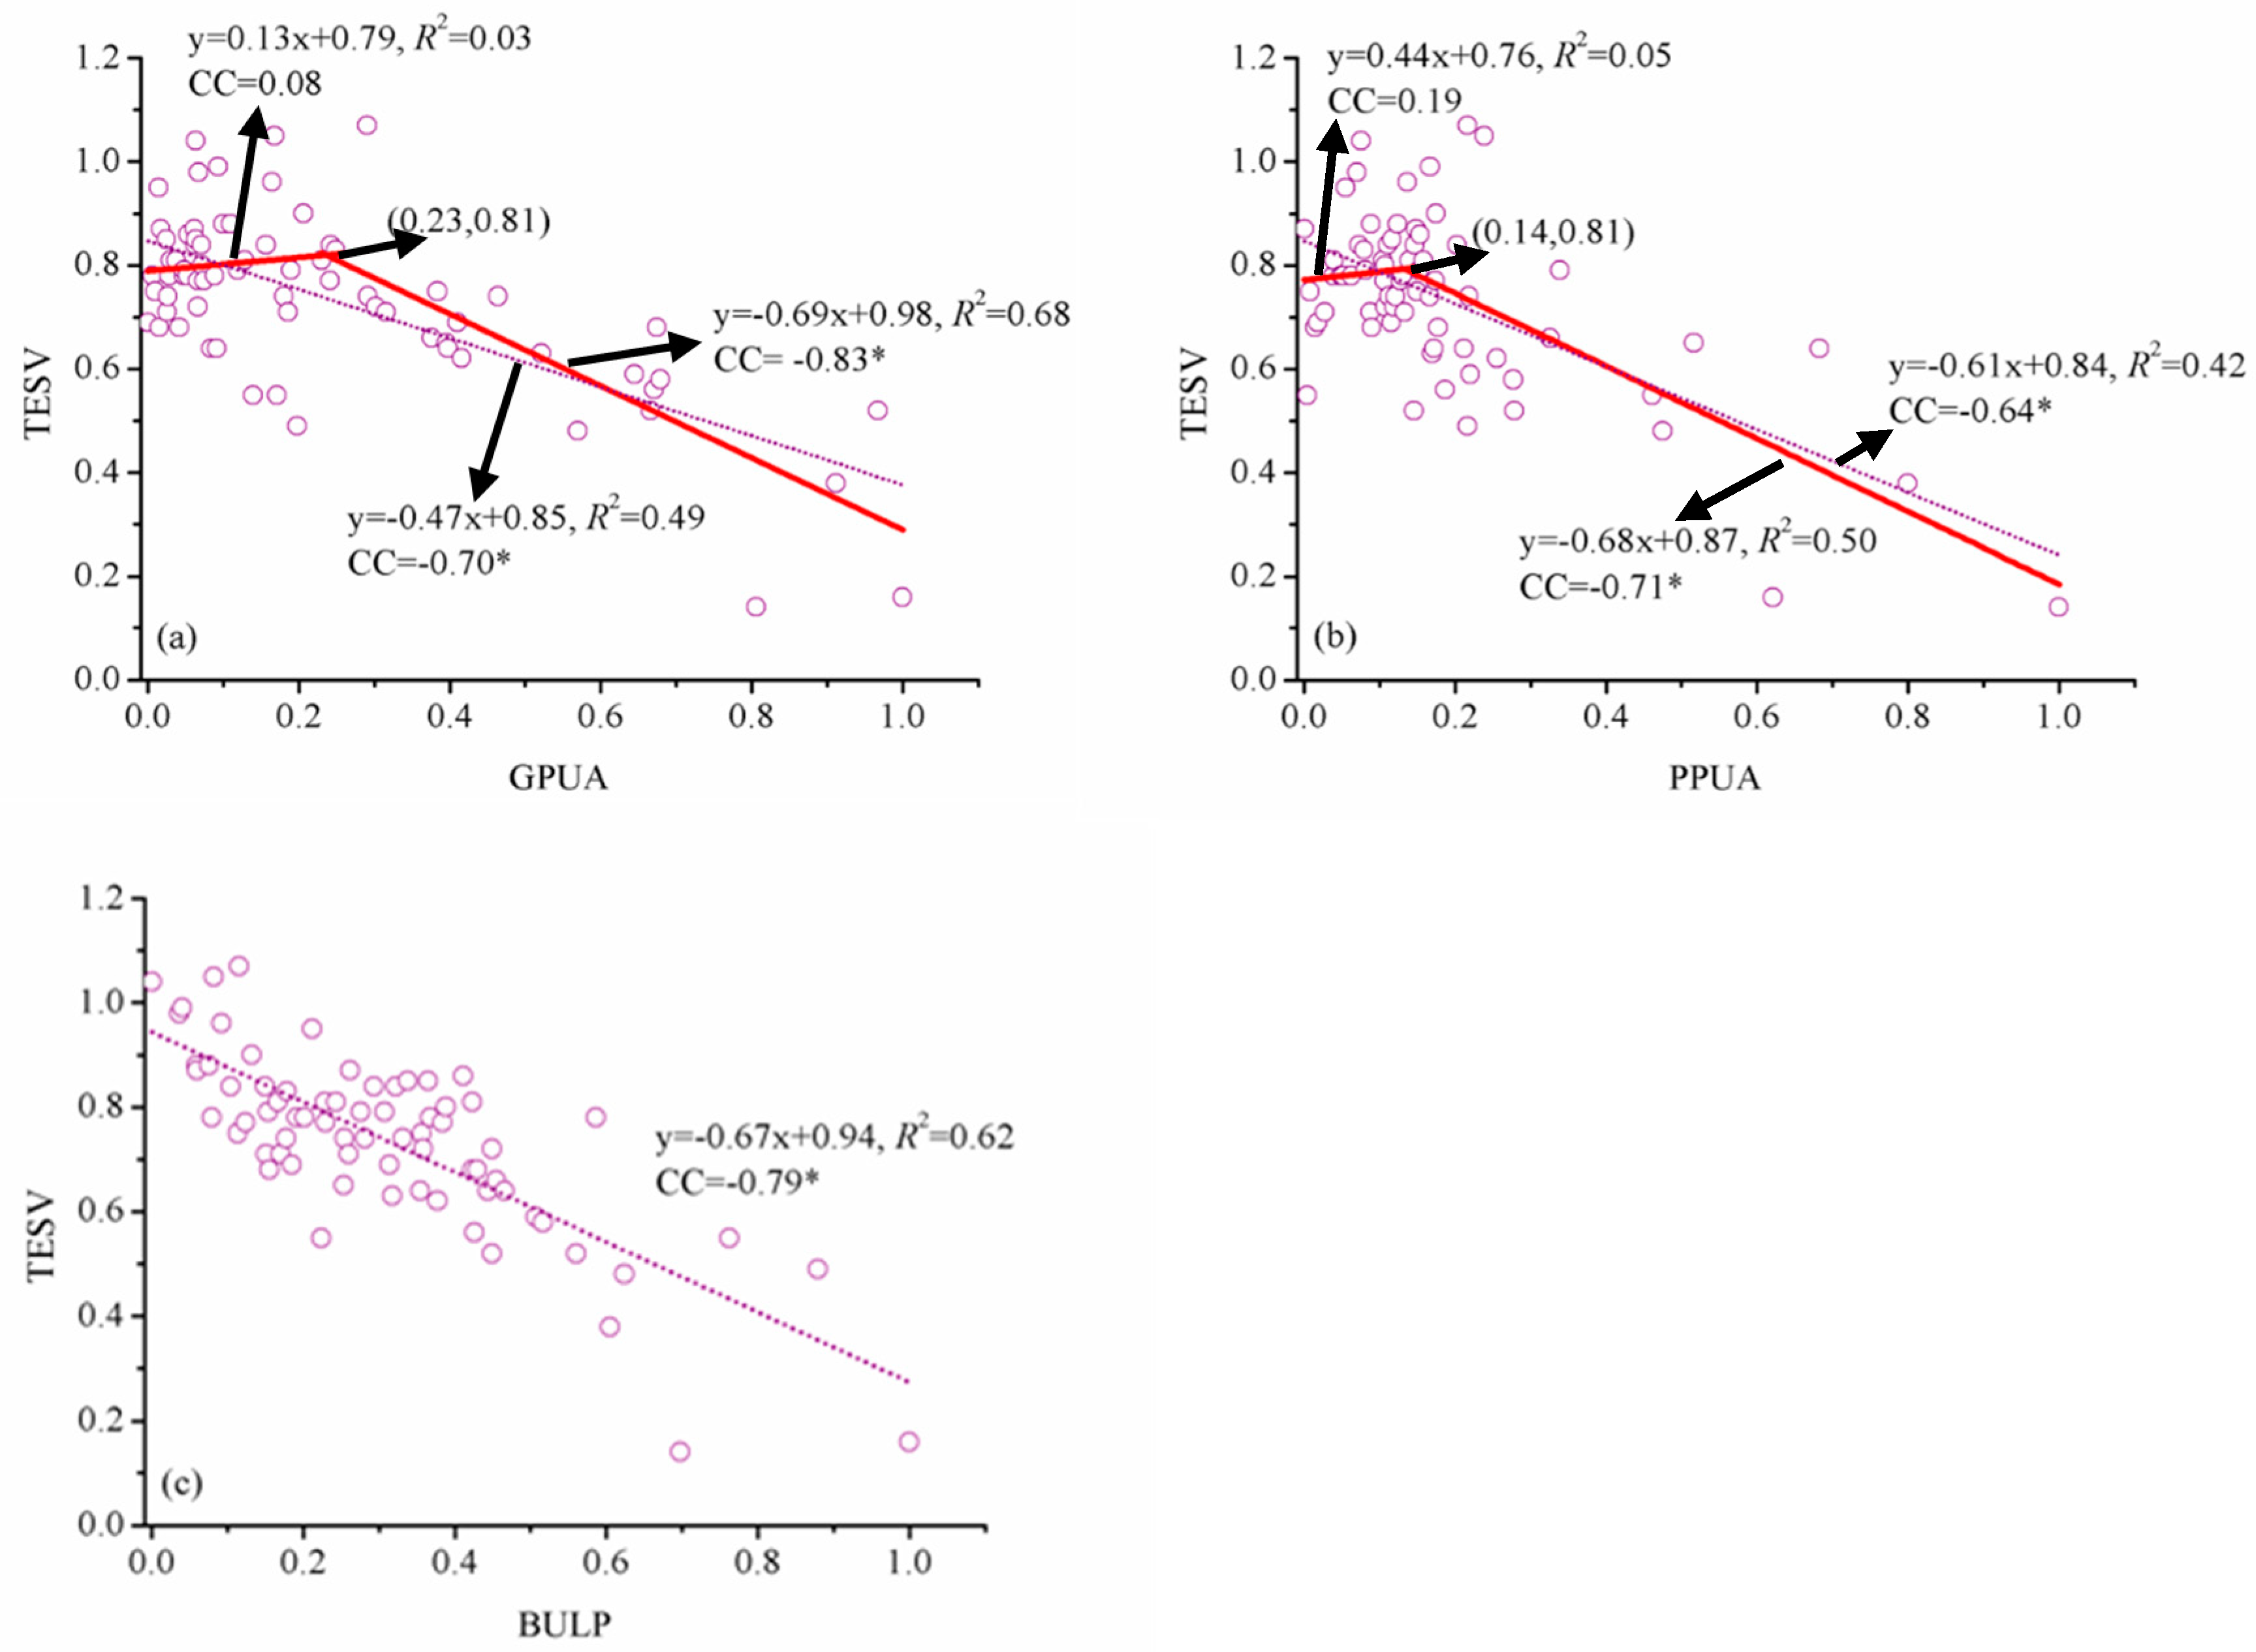
In order to further analyze the relationships between TESV and normalized urbanization indices, the piecewise linear regression method was used in this study (Figure 5). As shown in Figure 5a, non-linear impacts were detected between TESV and normalized GPUA. When normalized GPUA was lower than 0.23 (approximately 3719.55 × 104 yuan/km2), it showed an insignificant positive impact on TESV. However, when normalized GPUA was higher than the threshold value of 0.23, it showed a strong negative impact on TESV. Similar non-linear characteristics were detected between PPUA and TESV (Figure 5b). When normalized PPUA was higher than the threshold value of 0.14 (approximately 744.37 person/km2), it had a strong negative impact on TESV. Normalized BULP had a strong negative impact on TESV without any threshold value (Figure 5c) because built-up land expansion necessitated a large reduction in ecological uses of land, such as cropland, woodland, grassland, etc., which are important contributors to TESV. These results also indicate that the impacts of GDP and population on TESV lagged behind the impact of built-up land expansion [7], which might help to explain the difference in relationships between TESV and three urbanization indices.
5. Discussion
5.1. The Relationships between TESV and Urbanization Indices in Jiangsu
The relationships between ecosystem services and urbanization have recently attracted extensive attention; however, different urbanization indices reflected different aspects of social-economic development and caused different impacts on ecosystem services by region [16,17,18,19,20,21,22]. Our results revealed that three urbanization indices, i.e., economic urbanization, population urbanization, and land urbanization, had significantly negative relationships with TESV in Jiangsu (Table 5), which is consistent with the results of other previous work [4,7,21,28]. An important reason is likely that the rapid conversion of land use caused by urbanization necessitated a large reduction in ecological land, such as cropland, woodland, and grassland. These land use types are important contributors to TESV. Further analysis showed that the impacts of the urbanization indices on TESV varied. For example, TESV had the non-linear relationships with GPUA and PPUA, which showed inverse “U” styles and had corresponding threshold values (Figure 5). At the early stages of population and economic urbanization, ecosystems displayed a certain ability to cope with the adverse impacts caused by human activities; however, these adverse impacts gradually strengthened and finally exceeded the resistance of ecosystems with the continued development of the population and economy. In contrast, TESV showed a significantly linear relationship with BULP. This indicates that the impacts of GDP and population on TESV lagged behind the impact of built-up land expansion (Figure 5). Previous work also supports that the impacts of social-economic development on ecosystem services were driven by built-up land expansion [7,28].
Based on our results, effective management measures should be considered for addressing the conflict between urbanization and maintaining ecosystem services in Jiangsu. On the one hand, unreasonable expansion of built-up land should be strictly restricted. Decision-makers should consider the amount and distribution of built-up land, and optimize land-use structure from the perspective of sustainable development to minimize degradation of ecosystem services. Meanwhile, socio-economic development is also urgently needed. The long-term goal of pursuing a Green GDP, as opposed to extensive economic growth, has become a global consensus. In the short-term, however, we need to maintain and increase TESV in the context of rapid urbanization. For example, widely-distributed cropland had been an important source of food production in Jiangsu. A series of advanced agricultural technologies should be applied in order to increase crop yield in the limited land. Woodlands and grasslands were of great significance in maintaining carbon storage, soil retention, and water retention [19]. To this end, the protection and expansion of these lands with higher ecological value is the most important action for increasing TESV. Additionally, important policies on keeping arable land area above the “red line”, forest protection, and others ecological priorities should be attached more importance in order to protect our ecological land from damage. As indicated by Ouyang et al. [14], improvement of ecosystem services and social-economic development could coexist by designing intelligent and practicable measures, in order to better enhance ecosystem services and human well-being in Jiangsu.
5.2. Limitations and Future Work
In this work, TESV was calculated according to four types of ecosystem services, and then the relationships between TESV and three urbanization indices in Jiangsu were determined. Although the selected methods for evaluating ecosystem services are widely used in many different regions on a global scale [29,30], certain limitations existed in the work, resulting from two main aspects. First, the multi-source data, including meteorological, land use, vegetation, and socio-economic data, were collected from different sources, which could have caused differences in ecosystem service calculations and urbanization levels due to the resolution and accuracy of data. Second, we only focused on the relationships between ecosystem services and urbanization at the county scale, due to data availability. However, some studies have shown that it is difficult to reflect the real impact of urbanization on ecosystem services with data based on administrative division [7]. Thus, future work will ideally rely on systematically collected, long-term, and spatially continuous multi-source data and use process-based evaluation methods to better reveal the threshold response of ecosystem services to urbanization levels on multiple spatiotemporal scales in Jiangsu.
6. Conclusions
An in-depth analysis of the relationships between ecosystem services and urbanization provides a scientific basis for sustainable development in the mega-regions of China. We selected the Jiangsu, a main body of the Chinese Yangtze River Delta city cluster, as our study area and then analyzed these relationships using multi-source data.
Analysis of TESV in this study showed a clear spatial pattern in the whole region, gradually increasing from west to east with high-value areas located in the eastern coastal areas of Jiangsu. The calculated urbanization indices all had significant negative correlations with TESV. BULP, in particular, showed a negative linear relationship with TESV at all values, whereas the relationships of GPUA and PPUA with TESV became apparent at the threshold values of 3719.55 × 104 yuan/km2 and 744.37 person/km2 respectively, above which TESV sharply decreased with increasing GPUA or PPUA. These findings indicate that the impacts of GDP and population on TESV lagged behind the impact of built-up land expansion. Based on these results, some effective management measures, such as restricting unreasonable built-up land expansion and implementing ecological protection policies, should be proposed to address the tension between preserving ecosystem services and urbanization. In the future, we will collect more detailed data to better reveal the threshold response of ecosystem services to urbanization levels on multiple spatiotemporal scales in Jiangsu, which could be used as valuable references for decision-makers in ecological protection and sustainable social-economic development.
Supplementary Materials
The following are available online at https://0-www-mdpi-com.brum.beds.ac.uk/2071-1050/11/7/2073/s1, Table S1: List of each county in different regions of Jiangsu according to Figure 1.
Author Contributions
C.L. and R.W. designed the framework of this research work. F.Z., Y.L. and Y.H. collected and analyzed the data. C.L. proposed the main idea and wrote the manuscript. F.Z. and Y.L. checked the writing.
Funding
This work was funded by National Natural Science Foundation of China (41801013; 31500388), Natural Science Foundation of Jiangsu Province (BK20180939), Strategic Priority Program of the Chinese Academy of Sciences (XDA20030101-02), Outstanding Youth Science Foundation of Jiangsu (BK20170102), Jiangsu Key Laboratory Program of Aro-meteorology of NUIST (JKLAM1802), and the Startup Foundation for introducing Talent of Yangzhou University (137011343).
Acknowledgments
The authors also want to express their gratitude to the editors and the anonymous reviewers for providing valuable comments and suggestions to improve the paper.
Conflicts of Interest
The authors declare no conflict of interest.
References
- Seto, K.C.; Güneralp, B.; Hutyra, L.R. Global forecasts of urban expansion to 2030 and direct impacts on biodiversity and carbon pools. Proc. Natl. Acad. Sci. USA 2012, 109, 16083–16088. [Google Scholar] [CrossRef] [PubMed] [Green Version]
- Gu, C.; Hu, L.; Cook, I.G. China’s urbanization in 1949–2015: Processes and driving forces. Chin. Geogr. Sci. 2017, 27, 847–859. [Google Scholar] [CrossRef]
- Eigenbrod, F.; Bell, V.; Davies, H.; Heinemeyer, A.; Armsworth, P.; Gaston, K. The impact of projected increases in urbanization on ecosystem services. Proc. R. Soc. B 2011, 278, 3201–3208. [Google Scholar] [CrossRef] [Green Version]
- Zhang, Y.; Liu, Y.; Zhang, Y.; Liu, Y.; Zhang, G.; Chen, Y. On the spatial relationship between ecosystem services and urbanization: A case study in Wuhan, China. Sci. Total Environ. 2018, 637–638, 780–790. [Google Scholar] [CrossRef] [PubMed]
- Tao, Y.; Li, F.; Crittenden, J.C.; Lu, Z.; Sun, X. Environmental impacts of China’s urbanization from 2000 to 2010 and management implications. Environ. Manag. 2016, 57, 498–507. [Google Scholar] [CrossRef] [PubMed]
- Grafius, D.R.; Corstanje, R.; Warren, P.H.; Evans, K.L.; Hancock, S.; Harris, J.A. The impact of land use/land cover scale on modelling urban ecosystem services. Landsc. Ecol. 2016, 31, 1509–1522. [Google Scholar] [CrossRef] [Green Version]
- Peng, J.; Tian, L.; Liu, Y.; Zhao, M.; Hu, Y.; Wu, J. Ecosystem services response to urbanization in metropolitan areas: Thresholds identification. Sci. Total Environ. 2017, 607–608, 706–714. [Google Scholar] [CrossRef] [PubMed]
- García-Nieto, A.P.; Geijzendorffer, I.R.; Baró, F.; Roche, P.K.; Bondeau, A.; Cramer, W. Impacts of urbanization around Mediterranean cities: Changes in ecosystem service supply. Ecol. Indic. 2018, 91, 589–606. [Google Scholar] [CrossRef] [Green Version]
- Świąder, M.; Szewrański, S.; Kazak, J.K.; Van Hoof, J.; Lin, D.; Wackernagel, M.; Alves, A. Application of ecological footprint accounting as a part of an integrated assessment of environmental carrying capacity: A case study of the footprint of food of a large city. Resources 2018, 7, 52. [Google Scholar] [CrossRef]
- Millennium Ecosystem Assessment. Ecosystem and Human Well-being: General Synthesis; World Resource Institute: Washington, DC, USA, 2005. [Google Scholar]
- Costanza, R.; D’Arge, R.; De Groot, R.; Farber, S.; Grasso, M.; Hannon, B.; Limburg, K.; Naeem, S.; O’Neilltt, R.; Paruelo, J.; et al. The value of the world’s ecosystem services and natural capital. Nature 1997, 387, 253–260. [Google Scholar] [CrossRef]
- Costanza, R.; de Groot, R.; Sutton, P.; Van der Ploeg, S.; Anderson, S.J.; Kubiszewski, I.; Farber, S.; Turner, R.K. Changes in the global value of ecosystem services. Glob. Environ. Chang. 2014, 26, 152–158. [Google Scholar] [CrossRef]
- Zhou, Z.; Li, J.; Guo, Z.; Li, T. Trade–offs between carbon, water, soil and food in Guanzhong–Tianshui economic region from remotely sensed data. Int. J. Appl. Earth Obs. 2017, 58, 145–156. [Google Scholar] [CrossRef]
- Ouyang, Z.; Zheng, H.; Xiao, Y.; Polasky, S.; Liu, J.; Xu, W.; Wang, Q.; Zhang, L.; Xiao, Y.; Rao, E.; et al. Improvements in ecosystem services from investments in natural capital. Science 2016, 352, 1455. [Google Scholar] [CrossRef]
- De Groot, R.; Alkemade, R.; Braat, L.; Hein, L.; Willemen, L. Challenges in integrating the concept of ecosystem services and values in landscape planning, management and decision making. Ecol. Complex. 2010, 7, 260–272. [Google Scholar] [CrossRef]
- Li, B.; Chen, D.; Wu, S.; Zhou, S.; Wang, T.; Chen, H. Spatio-temporal assessment of urbanization impacts on ecosystem services: Case study of Nanjing City, China. Ecol. Indic. 2016, 71, 416–427. [Google Scholar] [CrossRef]
- Zhang, D.; Huang, Q.; He, C.; Wu, J. Impacts of urban expansion on ecosystem services in the Beijing-Tianjin-Hebei urban agglomeration, China: A scenario analysis based on the shared socioeconomic pathways. Resour. Conserv. Recycl. 2017, 125, 115–130. [Google Scholar] [CrossRef]
- Larondelle, N.; Haase, D. Urban ecosystem services assessment along a rural–urban gradient: A cross–analysis of European cities. Ecol. Indic. 2013, 29, 179–190. [Google Scholar] [CrossRef]
- Zhou, D.; Tian, Y.; Jiang, G. Spatio-temporal investigation of the interactive relationship between urbanization and ecosystem services: Case study of the Jingjinji urban agglomeration, China. Ecol. Indic. 2018, 95, 152–164. [Google Scholar] [CrossRef]
- Wan, L.; Ye, X.; Lee, J.; Lu, X.; Zheng, L.; Wu, K. Effects of urbanization on ecosystem service values in a mineral resource–based city. Habitat Int. 2015, 46, 54–63. [Google Scholar] [CrossRef]
- Su, S.; Li, D.; Hu, Y.; Xiao, R.; Zhang, Y. Spatially non–stationary response of ecosystem service value changes to urbanization in Shanghai, China. Ecol. Indic. 2014, 45, 332–339. [Google Scholar] [CrossRef]
- Hu, X.; Hong, W.; Qiu, R.; Hong, T.; Chen, C.; Wu, C.Z. Geographic variations of ecosystem service intensity in Fuzhou City. Sci. Total Environ. 2015, 512–513, 215–226. [Google Scholar] [CrossRef]
- Xu, C.; Pu, L.; Zhu, M.; Li, J.; Chen, X.; Wang, X.; Xie, X. Ecological security and ecosystem services in response to land use change in the coastal area of Jiangsu, China. Sustainability 2016, 8, 816. [Google Scholar] [CrossRef]
- Liu, Y.; Liu, Y.; Li, J.; Lu, W.; Wei, X.; Sun, C. Evolution of landscape ecological risk at the optimal scale: A case study of the open coastal wetlands in Jiangsu, China. Int. J. Environ. Res. Public Health 2018, 15, 1691. [Google Scholar] [CrossRef]
- Kuri, F.; Murwira, A.; Murwira, K.S.; Masocha, M. Predicting maize yield in Zimbabwe using dry dekads derived from remotely sensed Vegetation Condition Index. Int. J. Appl. Earth Obs. 2014, 33, 39–46. [Google Scholar] [CrossRef]
- Zhu, Q.; Zhao, J.; Zhu, Z.; Zhang, H.; Zhang, Z.; Guo, X.; Bi, Y.; Sun, L. Remotely Sensed Estimation of Net Primary Productivity (NPP) and Its Spatial and Temporal Variations in the Greater Khingan Mountain Region, China. Sustainability 2017, 9, 1213. [Google Scholar] [CrossRef]
- Li, C.; Wang, R.; Ning, H.; Luo, Q. Changes in climate extremes and their impact on wheat yield in Tianshan Mountains region, northwest China. Environ. Earth Sci. 2016, 75, 1228. [Google Scholar] [CrossRef]
- Wang, J.; Zhou, W.; Pickett, S.; Yu, W.; Li, W. A multiscale analysis of urbanization effects on ecosystem services supply in an urban megaregion. Sci. Total Environ. 2019, 662, 824–833. [Google Scholar] [CrossRef]
- Rukundo, E.; Liu, S.; Dong, Y.; Rutebuka, E.; Asamoah, E.F.; Xu, J.; Wu, X. Spatio–temporal dynamics of critical ecosystem services in response to agricultural expansion in Rwanda, East Africa. Ecol. Indic. 2018, 89, 696–705. [Google Scholar] [CrossRef]
- Wang, J.; Peng, J.; Zhao, M.; Liu, Y.; Chen, Y. Significant trade–off for the impact of Grain–for–Green Programme on ecosystem services in North–western Yunnan, China. Sci. Total Environ. 2017, 574, 57–64. [Google Scholar] [CrossRef]
Figure 1.
The location and digital elevation data (left) and the land use map (right) in Jiangsu. Note: The red borders indicate northern Jiangsu, the blue borders indicate central Jiangsu, and the purple borders indicate southern Jiangsu. The number of each border indicates one county shown in Table S1. The land use types include cropland (1-1: paddy land and 1-2: dry land), woodland (2-1: forest, 2-2: shrub, 2-3: woods, and 2-4: others), grassland (3-1: dense grass, 3-2: moderate grass, and 3-3: sparse grass), water area (4-1: stream and rivers, 4-2: lakes, 4-3: reservoir and ponds, 4-4: beach and shore, and 4-5: bottom land), built-up land (5-1: urban built-up, and 5-2: rural settlement) 6: industrial and mining areas, and unused land (7-1: swampland, 7-2: bare soil, and 7-3: bail rock).

Figure 2.
The spatial pattern of ecosystem services in Jiangsu.

Figure 3.
The spatial pattern of total amount of ecosystem services (TESV) in Jiangsu.

Figure 4.
The spatial pattern of urbanization indices in Jiangsu.

Figure 5.
The relationship (a) between TESV and normalized GPUA, (b) between TESV and normalized PPUA, and (c) between TESV and normalized BULP in Jiangsu. Note: the results with an asterisk symbol indicate significant at the 1% level. CC indicates the Pearson correlation coefficient.
Figure 5.
The relationship (a) between TESV and normalized GPUA, (b) between TESV and normalized PPUA, and (c) between TESV and normalized BULP in Jiangsu. Note: the results with an asterisk symbol indicate significant at the 1% level. CC indicates the Pearson correlation coefficient.


Table 1.
The ecosystem services in different regions in Jiangsu.
| Region | Food Production | Carbon Sequestration | Soil Retention | Water Retention | ||||
|---|---|---|---|---|---|---|---|---|
| Mean (t/km2) | Total (108 t) | Mean (gC/km2) | Total (104 tC) | Mean (t/km2) | Total (106 t) | Mean (m3/km2) | Total (106 m3) | |
| Northern Jiangsu | 6881.64 | 2.37 | 514.29 | 2667.21 | 7961.35 | 88.22 | 87,231.15 | 893.97 |
| Central Jiangsu | 7762.89 | 1.28 | 606.63 | 1266.73 | 3768.40 | 26.02 | 125,498.68 | 399.11 |
| Southern Jiangsu | 6538.34 | 0.94 | 561.24 | 1021.96 | 15,217.11 | 112.75 | 198,098.42 | 1520.51 |
Table 2.
The ecosystem services in different land use types in Jiangsu.
| Land Use Type | Food Production | Carbon Sequestration | Soil Retention | Water Retention | ||||
|---|---|---|---|---|---|---|---|---|
| Mean (t/km2) | Total (108 t) | Mean (gC/km2) | Total (104 tC) | Mean (t/km2) | Total (106 t) | Mean (m3/km2) | Total (106 m3) | |
| Cropland | 6841.63 | 4.59 | 697.85 | 4669.07 | 1949.91 | 130.68 | 29,071.84 | 1948.31 |
| Woodland | - | - | 644.14 | 213.08 | 27,234.11 | 90.47 | 217,947.11 | 724.02 |
| Grassland | - | - | 497.59 | 38.86 | 5841.40 | 4.68 | 176,141.15 | 141.27 |
| Water area | - | - | 61.94 | 34.90 | 204.04 | 1.15 | - | - |
Table 3.
The TESV in different regions in Jiangsu.
| Region | Mean TESV |
|---|---|
| Jiangsu | 0.77 |
| Northern Jiangsu | 0.74 |
| Central Jiangsu | 0.79 |
| Southern Jiangsu | 0.69 |
Table 4.
The urbanization indices in different regions in Jiangsu.
| Region | GDP (104 Yuan/km2) | Population (Person/km2) | Built-up Areas Proportion (%) |
|---|---|---|---|
| Jiangsu | 3810.37 | 900.09 | 17.93 |
| Northern Jiangsu | 2159.47 | 799.72 | 18.46 |
| Central Jiangsu | 4179.73 | 875.88 | 13.81 |
| Southern Jiangsu | 6105.63 | 1124.83 | 20.47 |
Table 5.
The Pearson’s correlation coefficients and R2 values of regression equations between TESV and normalized urbanization indices in Jiangsu.
Table 5.
The Pearson’s correlation coefficients and R2 values of regression equations between TESV and normalized urbanization indices in Jiangsu.
| Urbanization Indices | Correlation Coefficient | Regression Equation | R2 |
|---|---|---|---|
| GPUA | −0.70 * | TESV = −0.22 * GPUA − 0.10 * PPUA −0.46 * BULP + 0.95 | 0.71 |
| PPUA | −0.64 * | ||
| BULP | −0.79 * |
Note: the results with an asterisk symbol indicate significant at the 1% level.
© 2019 by the authors. Licensee MDPI, Basel, Switzerland. This article is an open access article distributed under the terms and conditions of the Creative Commons Attribution (CC BY) license (http://creativecommons.org/licenses/by/4.0/).
Share and Cite
MDPI and ACS Style
Li, C.; Wang, R.; Zhang, F.; Luo, Y.; Huang, Y. Relationships between Ecosystem Services and Urbanization in Jiangsu Province, Eastern China. Sustainability 2019, 11, 2073. https://0-doi-org.brum.beds.ac.uk/10.3390/su11072073
AMA Style
Li C, Wang R, Zhang F, Luo Y, Huang Y. Relationships between Ecosystem Services and Urbanization in Jiangsu Province, Eastern China. Sustainability. 2019; 11(7):2073. https://0-doi-org.brum.beds.ac.uk/10.3390/su11072073
Chicago/Turabian StyleLi, Cheng, Ranghui Wang, Fangmin Zhang, Yunjian Luo, and Yong Huang. 2019. "Relationships between Ecosystem Services and Urbanization in Jiangsu Province, Eastern China" Sustainability 11, no. 7: 2073. https://0-doi-org.brum.beds.ac.uk/10.3390/su11072073
Note that from the first issue of 2016, this journal uses article numbers instead of page numbers. See further details here.