The Role of Transparency in Humanitarian Logistics


Department of International Economics & Business, Yeungnam University, 280 Daehak-Ro, Gyeongsan, Gyeongbuk 38541, Korea
*
Author to whom correspondence should be addressed.
Sustainability 2019, 11(7), 2078; https://0-doi-org.brum.beds.ac.uk/10.3390/su11072078
Submission received: 14 February 2019
/
Revised: 3 April 2019
/
Accepted: 3 April 2019
/
Published: 8 April 2019
(This article belongs to the Special Issue Information Sharing on Sustainable and Resilient Supply Chains)
Abstract
:Human suffering has increased in recent years owing to increased intensity ad frequency of disasters. These are expected to further increase in the coming years due to climate change. Although natural disaster risks to humans cannot be completely eliminated, they can be minimized through efficient and effective humanitarian logistics (HL). Considering the importance of HL in reducing the impacts of disasters through fair distribution, this study aims to address the following question: “How can the performance, efficiency and effectiveness of HL be improved through transparency?” The primary data were collected through an online structured questionnaire from the employees participating in relief operations in Pakistan. This specific research model is reflective. Therefore, a covariance-based structure equation model (CB-SEM) based on confirmatory factor analysis (CFA) with SmartPLS software was used. The study tested the items’ reliability, discriminate validity, goodness of fit, and psychometrical soundness of the hypothesized model. The study results indicate that the relationship between predictor variables (disclosure, clarity, accuracy, corporate governance, decision making and accountability) and the response variable (effective HL) is mediated by public trust. Furthermore, the study suggests that public trust plays an imperative role in enhancing the performance, efficiency and effectiveness of HL. In addition, first, the study findings are expected to be beneficial for all stakeholders of disaster risk management, especially for governments, donors and humanitarian organizations (HOs), because they are persistently seeking strategies to assist victims. Second, most importantly, this study raises awareness of the need to carefully evaluate decisions related to the fair distribution of relief items. Third, the structure of this article reveals research gaps and promising areas for further research. This article provides a deeper understanding of transparency in HL using empirical data, which has not been explored before.
1. Introduction
Disasters cause hardship and adversity for people [1], badly disrupt the functioning of a locality, and lead to human, economic, material and environmental losses that are beyond the control of a population’s ability by applying its own resources [2,3]. In the past few decades in developing countries, more than 2 billion people have suffered due to climate-related hazards. Alone in 2010, almost 385 natural disasters worldwide killed more than 297,000 people, affected over 217 million people, and around 123.9 billion USD worth of assets were damaged [4]. Similarly, in the four decades from 1970 to 2010, in South Asian countries alone, 980,000 people died, and another 2.4 million people were seriously affected. Assets worth 105 billion USD were damaged and around 1333 major disasters struck in South Asia [5]. There are hundreds more catastrophes that do not attract as much attention but nevertheless have equally devastating impact. A major threat to South Asian countries is global warming. Pakistan is ranked in the top 10 among the most vulnerable countries to climate-induced disasters. Major natural disasters since independence have caused economic losses worth $29 billion and killed approximately 113,000 people. As estimated, the country requires nearly $40 billion to cope with the adaptation of climate change [6]. Unfortunately, disasters will increase five-fold over the coming 50 years in Pakistan [7,8]. Disasters cause causalities, disabilities and losses of assets that create not merely financial problems for those affected, but also impact them psychologically.
In all stages of a disaster, logistics play a very important role in the success of humanitarian relief. Holguín-Veras et al. [9] stated that humanitarian logistics (HL) is a very extensive field, and therefore it is impossible to fit it into single definition. Rabta et al. [10] reported that HL, the technical term, includes procurement, transportation and relief materials’ warehousing from the origin point to the beneficiaries’ location. For a mixed array of disaster operations, HL is an umbrella term, which covers both response and developmental phases of disasters [8]. HL is one of the central activities in a catastrophe. However, HOs have not yet recognized and defined this fact. It is also noted that particularly relief agencies do not keep in their team a sufficient number of logisticians and also do not provide a proper training to make them effective humanitarian logisticians [1]. This indicates that HL always has a lower priority within humanitarian organizations (HOs), despite being a factor that can determine the success or failure of disaster relief operation (DRO). Even though, the participation and cost of logistics account for almost 80% of relief operation [11]. Hence, efficient disaster relief supply chain (SC) is imperative because logistics serve as a bridge between disaster preparedness and response, between distribution and procurement and between field and headquarters.
The resources shortage and competition for funding raise the significance of transparent HL [12]. Information sharing in logistics leads to an increase of organizational capital and effectiveness and efficiency of DRO [13]. Globally, both profit and nonprofit organizations and firms are under increasing pressure to be more transparent. Donors are the most important stakeholders with the greatest power in HL [14]. They are motivated by the specific purpose of providing funds to the HOs to reduce disaster risk. If the utilization and performance of resources are poor in any organization, the donors can discontinue funding. The donors want to have greater transparency, visibility and accountability [11]. Fair distribution of relief items is a sign of effective HL [15,16]. Effective HL can not only decrease risk, cost and timelines, but can also save lives and reduce suffering. Hence, HL must be fair, fast and safe.
When relief help is a matter of life or death for those afflicted, some people are merely interested in money and are not interested in helping the victims. Furthermore, all HOs want to help those affected by disaster. But unwillingness appears due to a number of reasons, such as corruption and noninterest of the government. Even, some governments hamper international humanitarian organizations (IHOs) from work in order to receive bribes [17]. The involvement of local people in the HL process is also a hurdle in the way of fair distribution. Local influential people influence the humanitarian logistics service providers (HLSP) to control the list of beneficiaries and favor some specific groups [18] in the houses’ allocation [19] and add the name of their own well-wishers to the recipient lists during cash or relief distribution [20]. The elite’s homes are used as a distribution center. Therefore, logisticians are distributing aid items according to the elite’s will instead of the needs of the victims [18]. On the other hand, due to financial shortage [19], and strong competition for funding, some HOs mostly focus on fundraising but not on spending funds efficiently [14]. In addition, HLSPs also offer bribes to the local influential people to remain quiet regarding poor quality of construction and non-distribution of relief items. Moreover, in DRO, distribution of unfair and low-quality products is a common phenomenon. HOs sometimes unload trucks at night so that the public cannot notice the warehouse [19].
The case study of the Philippines Super-Typhoon Haiyan (Yolanda) in November 2013 shows a lack of transparency. As a good example of a lack of transparency and high-profile corruption, in the Haiti earthquake the American Red Cross received half a billion US dollars in donations but built only six houses and falsely claimed to have built houses for 130,000 victims [21]. Furthermore, the flood of 2010 in Pakistan where only 43% eligible households truly got Watan cards [22,23] indicates unfair distribution. Further, the 2008 Wenchuan earthquake in China, the 2015 Nepal earthquake, and the Indian Ocean Tsunami in 2004 demonstrate a lack of transparency. The sex-for-food scandal in 2002 in West Africa is a sign of corruption beyond financial corruption. Hurricane Katrina, and wars in Afghanistan, Iraq [19] and Nepal are all examples of high-profile corruption and a lack of transparency. The range of claims exhibit the risk of increased corruption and a lack of transparency, not only in developing but also in developed countries.
The performance, efficiency and effectiveness of HL cannot be increased as a whole because multiple situations arise depending on the intensity, location and type etc., of the disaster. It is therefore vital that the HLSPs adjust, modify and reconfigure their HL by enhancing their performance, efficiency and effectiveness to the situation arising from these calamitous events. All these aspects lead scholars to think about the problem from various angles with the intention of making small contributions to raise the effectiveness of HL. As noted, other factors that affect the human suffering of survivors in the aftermath of disasters are the unfair distribution of resources due to a lack of transparency. Therefore, the role of incorporating transparency in HL is being realized. Research papers that have focused on transparency in other fields have mainly concentrated on the combination of transparency and trust of stakeholders. Such models proposed by references [24,25,26,27] are formulated to build trust and increase performance. The potential of transparency in HL and their positive impact on HL effectiveness have therefore remained relatively unexplored. Hence, the key objective of this research is to present a full picture of the need for HL transparency and how this can be achieved. More specifically, the aim of the study is to address this question: “How can the performance, efficiency and effectiveness of HL be improved through transparency?” In addition, the state of the existing literature on transparency does not precisely specify how the construct should be conceptualized, how it relates to managing public trust in the organization, or how organizations manage transparency in terms of HL. Therefore, this study has three objectives. First, the literature on transparency is incorporated across academic disciplines to extend a complete understanding of transparency in structural dimensions and components. Second, the actual uses of transparency dimensions and the components mediated by public trust are analyzed. Third, the importance of those determinants in influencing the performance, efficiency and effectiveness of HL is examined. To fulfil these objectives, this research adopts a covariance-based structure equation model (CB-SEM) based on confirmatory factor analysis (CFA) with SmartPLS software was used.
This study argues that effective HL is determined by perceived public trust, whereas public trust occurs through the proposed dimensions and components of transparency. The study findings reveal that transparency enhances performance, efficiency and effectiveness through public trust in the context of HL. Furthermore, the findings contribute to the existing literature in HL and pave the way for further development in DRO. Research gaps are explored, and suggestions are made for future research studies to advance more effective HL operations.
The rest of this article is organized as follows. Section 2 lays out the research theoretical model and hypotheses. Section 3 examines the research methodology. Section 4 details the study analysis and research findings. Section 5 discusses the contributions and scope for future research. Finally, Section 6 presents the study conclusions.
2. Proposed Theoretical Model and Hypothesis
This section presents the proposed theoretical model with its characteristics, as shown in Figure 1.
A key characteristic of a transparent organization is the fair distribution of resources. An organization can achieve a higher level of transparency through the dimensions of transparency, namely, disclosure, clarity and accuracy, and the components of transparency, such as corporate governance, decision making and accountability. All these factors of transparency are briefly explained in forthcoming sections.
2.1. Transparency and Effective Humanitarian Logistics (HL)
Transparency is the sharing of information [25,28]. It is presently attracting the attention of researchers. Corruption cases, misuse, theft, fraud, power abuse, nepotism, favoritism and clientelism have led to an increasing insistence from stakeholders to supply public information [29]. There are numerous areas where transparency has become a buzzword [30]. Transparency can be elucidated from the perspective of agency theory and transaction cost theory [30].
Transparency is not only the publicizing of good information about an organization [31], but what is true inside the organization [25]. In the past, mere passive information was communicated by organizations only on request within their discretion [25]. Currently, due to various financial crises and scandals worldwide, organizations are under pressure from stakeholders, shareholders and regulators to be more transparent [30]. Transparency is a way to achieve accountability and public trust in organizations [26,29,32,33]. It is a roadmap to enhance financial and organizational performance [34], and to drive the effectiveness of the company and extend democratic practice [35]. As an antecedent, transparency impacts positively on public trust. Moreover, both transparency and public trust positively impact on the effectiveness of HL.
2.2. Humanitarian Logistics (HL) Performance, Efficiency and Effectiveness
Nowadays, there is greater demand for higher performance, efficiency and effectiveness in HOs. Efficiency in HL refers to the minimum acceptable level of resources’ utilization of last-mile distribution and victims’ satisfaction. Besides, effectiveness measures the extent of the needs of the affectees, utilization of recourses, flexibility, trust, innovation and disclosure [36]. Along with other factors, ensuring efficient response during DRO requires efficient systems of information sharing [14]. Poor performance may arise because organizations have less ability for constant change and transparency [37]. Transparency can solve problems of inefficiency, corruption and bad performance [38]. It ensures fairer resources distribution and drastically increases the effectiveness of HL [39]. Beneficiaries are concerned regarding the quality and speed of relief, while donors are concerned about the numbers of beneficiaries covered. Nevertheless, HOs’ reputation, on time reporting to donors and donors auditing can be achieved by efficient and effective HL operations. Maon et al. [40] stated that good logistics can reduce cost, enhance effectiveness and raise accountability. Transparency can enable stakeholders to better understand the process of logistics and the value created for them. It can induce honesty, professionalism and sincerity, which in turn enhance public trust along with the willingness to continue and enhance the funds by donors [41].
2.3. Disclosure of Information
Disclosure is the planned effort to provide all lawfully releasable information, in a way that is timely, accurate, balanced and clear. All information, whether positive or negative in nature, should be released, in order to enhance the analysis ability of holding public organizations accountable for their policies, actions, and practices [42]. The term disclosure belongs to the discipline of finance and accounting, whereas the term transparency is more diverse and broader than disclosure [43]. Financial information disclosure is a means to improve transparency and demonstrates to donors a minor level of financial risk. It can increase significantly the flow of current and future funding toward the organization [29]. It reduces the magnitude of periodic surprises about a firm’s performance and reduces stock price volatility [26]. After the financial scandals that have damaged the stakeholders’ trust and increased their demands for organizational transparency, HOs have been issuing codes of corporate governance, regulations and transparent strategies to firms by indicating who, to whom, how and what information should be disclosed within and outside the organization [44]. HOs may be aware that exposing some types of information to stakeholders is suitable as it permits them to make up-to-date decisions. Nevertheless, this information might be naturally threatening to the interests of HOs. The choice of disclosing the information, however, is a decision to do the right thing rather than keeping the information secret, which indicates that an unfair advantage continues to be held. Disclosure evidences the intention of the HOs to establish moral and ethical principles. These principles are associated with sharing information, indicating the honesty of the corporation, which leads to trust and performance [24,45]. Accordingly, the following hypothesis is postulated;
Hypothesis 1(H1).
Public Trust plays a significant role as a mediator in the relationship between disclosure and effective humanitarian logistics. Discloser significantly increases public trust, and in turn, public trust leads to effective humanitarian logistics.
2.4. Clarity of Information
Clarity is the most important dimension of transparency. It can be defined as the degree of comprehensibility and lucidity of information. For information to be considered transparent, it must be clear, interpretable and understandable [24]. For clarity the language and understandability of information is very important. Furthermore, for information clarity, relevance, timelines, appropriateness, completeness and ethical principles must be considered [43]. Nowadays, a lack of clarity has been observed in transparency [42]. Researchers found that a lack of information clarity is a major problem for managers instead of a lack of sharing information. Therefore, to ensure transparency information must be delimited, complete, and understandable. Greater transparency is a sign that information is easily used by the public. Concerning the role of public trust in the relationship between clarity and effective HL, the model indicates that clarity increases public trust, which further leads to effective HL, thus:
Hypothesis 2(H2).
Public trust plays a significant role as a mediator in the relationship between clarity and effective humanitarian logistics. Clarity of information significantly increases public trust. Consequently, public trust further leads to effective humanitarian logistics.
2.5. Accuracy of Information
Accuracy is correct information sharing between sender and receiver. Accuracy is an imperative dimension and cornerstone of transparency in the workplace. The information cannot be considered transparent if it is purposefully biased or unfoundedly contrived. However, this does not mean that information must be fully correct. Nevertheless, rather precise qualifications and expected validity must exist. Accuracy is vital to clarity and disclosure in that it relates to the reliability of information instead of completeness or understandability [24]. Overall, transparency has been theoretically shown to be a function of three managerial factors: disclosure, clarity, and accuracy. Disclosure is enhanced when the information is more relevant and timely as perceived by stakeholders. Clarity is enhanced when stakeholders perceive information as being more understandable. Accuracy is enhanced when stakeholders perceive information as more reliable [24]. All these factors contribute to increasing the levels of transparency by enhancing the confidence of stakeholders in the information quality received from the organization.
Trust requires a mutual relationship. Organizations can’t anticipate trust from stakeholders if they are not ready to trust them beforehand or in return. Concerning the roles of public trust, the model shows that public trust influences the relationship between accuracy and effective HL. The role of accuracy is hypothesized below;
Hypothesis 3(H3).
Public trust plays a significant role as a mediator in the relationship between accuracy and effective humanitarian logistics. Accuracy of information significantly increases public trust. Consequently, public trust further leads to effective humanitarian logistics.
2.6. Corporate Governance
Governance is a unique way in which an organization organizes itself to make decisions, intervene in conflicts and exercise its legal rights [26]. Governance is an imperative part of transparency and accountability of the organization [46]. In fact, corporate governance and transparency are overlapping concepts [35]. Corporate governance gives the structure through which objectives can be defined and achieved while organizational performance is determined [47]. Good corporate governance is efficiently running the organization and properly managing resources. It is delivering higher performance, improving information disclosure, achieving long-term sustainable development [48]. Good corporate governance is offering signs of transparency to hold officers and directors accountable [43]. Furthermore, trusted stakeholders are indicators of good corporate governance [26]. In terms of HL good corporate governance is fulfilling the desire of donors, whilst also taking account of other stakeholders’ interests [49]. Corporate governance mechanisms assure donors that HL will cover enough area through their funds. In the absence of any proper governance system or if it does not properly function, the donors will not provide funds to the organization [27]. Corporate governance is important for enhancing the trust of stakeholders as supported by agency theory [50].
The HL context in terms of corporate governance is largely unexplored and provides a base to support the above arguments. Given the importance of corporate governance in organizations, this study examines whether the practice of corporate governance can enhance the effectiveness of HL mediated by public trust. therefore, it can be hypothesized that:
Hypothesis 4(H4).
Public trust plays a significant role as a mediator in the relationship between corporate governance and effective humanitarian logistics. Corporate governance significantly increases public trust. Consequently, public trust further leads to effective humanitarian logistics.
2.7. Decision Making
The basic rules of understanding transparency are hence that decisions are made according to clearly established procedures and rules, and not via ad hoc processes. De Fine Licht, [38] stated that transparency is per se an empty concept which needs to be filled with decisions in practice. Decision making depends on organizational transparency [35]. It was stated first by Forrester (1961), who reported that delays in passing on information in turn lead to demand amplification in the SC [51]. Therefore, for interested stakeholders, decision making must be open. Public comments and feedback processes deliver a significant vehicle for interested stakeholders to affect decision making, as provided by some sectors [52]. Opening decision making and processing to stakeholders helps to prevent corruption [32]. It improves policy, raises managerial effectiveness, and builds the level of public trust and confidence [29]. Araujo et al. [29] reported to use donors’ funds requires effective use of transparency’s mechanisms in the decision-making process. Transparent decision enhances the quality of checks and balances system [53]. Greater transparency forces the decision makers to behave better, which in turn produces better quality decisions and enhances public trust. However, at least three theories provide some evidence that transparency does not necessarily produce better decisions [38].
It can be argued that transparency needs communication and dialogue with stakeholders and decision makers. Transparent decisions raise the issues of technical efficiency and what is fair, right and good in society as considered by the public. The literature has drawn the relationship between transparency, decision making, public trust, and effectiveness. Hence this relationship has never been measured empirically in the context of HL, which leads to the following hypothesis:
Hypothesis 5(H5).
Public trust plays a significant role as a mediator in the relationship between decision making and effective humanitarian logistics. Transparent decision making significantly increases public trust. Consequently, public trust further leads to effective humanitarian logistics.
2.8. Accountability
Every organization wants to be autonomous, and for that transparency is the first step. Whereas once the organization has the knowledge to be transparent, it is on the way toward accountability, responsibility, and trust [54]. Everett and Friesen, [18] stated that accountability is a problematic concept. Alom, [32] indicated that the basic issue in the mechanism of accountability is answerability, calling those in authority in order to justify their actions. Pike [54] reported that transparency has considered as a natural companion of accountability and pushes organization to be accountable. Likewise, transparency is revealed by Park et al. [25] as a sign for accountability. Furthermore, the absence of transparency and accountability may swiftly turn into blame. It must be noted that accountability is not to be confused with blame and responsibility. Because accountability is not something that can be assigned to an organization. But it is something that organization must own it and discuss the reasons behind the actions and should not be perceived as a negative. In transparent processes, management must be accountable for their, words, actions and decisions. They are expected to justify them before a court of opinion openly [55].
Mcgrath et al. [56] defined, accountability as the obligation of an organization or person to account for its activities, accept responsibility and to release the results in a transparent way. Furthermore, accountability is the state of being liable, accountable or answerable. Also, accountability is a state in which stakeholders know who is responsible for what and may ask them to explain its position.
Parris et al. [31] stated that transparency has the ability to hold organization accountable through verifying the behaviors of employees. Accountability involves the behavior of public actors and refers to organizational arrangement [32]. Bracci [57] reported that there are three primary dimensions of accountability, (i) to whom the organizations are answerable, (ii) the expectation of the performance of organization accountable, (iii) the concerned technology through which the organization is held accountable and the relevant consequences. Similarly, Andreaus et al. [58] stated that the question of accountable to whom, basically deals with stakeholders namely funders, donors, victims, workers, volunteers and the public in the HL context. On the question of accountability, researchers have indicated on issues and drivers in depth by describing and identifying the key areas to which the HOs should be accountable. Andreaus, et al. [58] also highlighted that the combination of agency problems and information asymmetry creates an enhanced demand for accountability.
A large quantity of real time information disclosure to the stake holders might lead to greater accountability [55]. On the other hand, accountability is a key concept in corporate governance [59]. Greater accountability is often assumed to provide more transparency and visibility for an organization’s activity. Hence it enables the unique behavior of an organization and consequently enhances HL performance [60]. Moreover, Jarvis [61] specified that accountability practices in HL serve three key purposes: assurance, control and continuous improvement. Transparent decision making enhances the channels for better accountability, which in turn enhances public trust [38]. Similarly, Pike, [54] indicated that organizational accountability allows others to trust, which in turn leads to performance. The lack of well-developed systems of accountability and transparency in the HL sector also enhances opportunities for fraud that could adversely affect the public trust upon which all charities ultimately depend [62].
However, despite the substantial expansion in the amount and scope of public accountability, HOs’ responsiveness, efficiency, and effectiveness have not significantly improved; therefore, it can be hypothesized that:
Hypothesis 6(H6).
Public trust plays a significant role as a mediator in the relationship between accountability and effective humanitarian logistics. Accountability significantly increases public trust. Consequently, public trust further leads to effective humanitarian logistics.
2.9. Public Trust
The literature on trust is extensive and long-established and has focused on trust for long term relationships. The topic of trust is creating increased interest in organizational and marketing studies. Trust has been operationalized and conceptualized in a variety of ways. However, the key objectives of this section are to provide justification of public trust in the light of existing literature in the context of proposed model. As it is essential in case of HL because HOs are funded by public.
From an organizational perspective, Rawlins [55] has defined public trust as public opinion of one group that another group will be met commitments, honest and will not take advantage of others. In other words, trust is the vulnerability of one-party willingness to another-party based on the confidence that the later party is reliable and honest. Furthermore, Medina & Rufín [26] stated that trust is the principle that one party will perform in a socially responsible way and according to the expectation of other party. Poppo & Schepker [63] has defined public trust as the extent to which the public (stakeholder group) collectively holds an inclination toward an organization. In addition, public trust is based on a positive expectation of the other’s intentions. More specifically, public trust reveals a collective perception toward a single organization.
The key differences between public and personal or organizational trust are: public trust consists of two different groups such as the organization and the public. Whereas, personal or organizational trust is from person to person or from organization to organization. Therefore, it is clear that public trust is different from both personal and organizational trust [63]. On the other, Thomas [64] reported that mutual trust is an element of public trust. Kabra & Ramesh [37] revealed that public and mutual trust is significant for achieving accurate and timely information and develops the information quality in terms of disclosure, accuracy and time lines between the public and organizations.
The trust of one person strongly impacts the trust of the others in that person [55]. Therefore, logisticians cannot expect trust from stakeholders if logisticians are not willing to trust stakeholders first or in return. High level initial trust is inconsistent because scholars have predicted initially low-level trust. The parties make trust choices based on rational benefits and cost. Trust may be high when organization members are barely known to each other [65].
Johnson-George and Swap [66] highlighted that willingness to take risks can be one of the few common characteristics to all trust circumstances. Mayer et al. [67] expressed that trust is not taking risk by itself, but relatively it is enthusiasm and the ability of a party to take risk. Furthermore, Thomas [64] highlighted that trust has an experiential and rational basis. Organization may not calculate risks but can make decisions whom to trust and by way organization entrust them. Poppo and Schepker [63] reported that public trust is critical for the survival of any organization. Parris et al. [31] indicated that trust implies that one is willing to presume the risk that goes alongside with taking action based on the confidence of another. Porter et al. [68] (p. 497) says that “If there is trust, others cannot exploit me”. Similarly, McAllister [69] stated that trust is of the basis of perception that one will find what is anticipated.
The very first step of transparency is public trust. Medina and Rufín, and Parris et al. [26,31] specified that organizational transparency is an antecedent to public trust. Transparency is a way to achieve end accountability and public trust in organization [32,35]. De Fine Lith [38] described that greater transparency will force the decision makers to behave better which in turn produces better quality decisions and leads to enhanced public trust. Because of better decision due to transparency, if the public perceives them as such, definitely, the public will accept the decision and trust the decision makers. Likewise, transparent decision making enhances the channels for better accountability, which in turn enhances public trust. Trust could be maintained with the efforts of transparency that advanced accountability [55]. Similarly, Channuntapipat [70] stated that accountability could be a proxy for public trust.
De Fine Lith [38] highlighted that the accountability and public trust issue become more complex in the case of multiple agents and/or principals because more than one party is involved in the control relationship. Moreover, McAllister [69] indicates that efficiency within complex and uncertain systems is only possible in the presence of mutual trust and adjustment. Similarly, Bradach [71] highlighted, trust is generally used to reduce vulnerability and uncertainty especially when people have limited prior experiences or knowledge.
Demand for transparency decreases when public trust in an organization is increasing because of the perception that the organization is working well. A lack of public trust not only affects HOs but also the behavior of HLSP [1]. Leitch [42] suggested that among other things for trusted relationships and to increase the level of public trust the organization needs to be transparent. Kabra and Ramesh [37] argued that transparency is a fundamental enabler for public trust and the bridge in setting up relation between victims and organizations. Su and Young [41] claimed that transparency increases public trust, competitive advantages and prevent misunderstanding. On the other hand, Baraibar et al. [44] stated that organizations always face a tradeoff between transparency and secrecy that effects their reputation, competitiveness, and performance. Rawlins [55] suggested that HL efforts of transparency require truthful, substantial and useful information in order to restore, maintain and build trust with stakeholders and to hold HL process accountable.
High levels of trust among partners of an SC leads to effectiveness, coordination and better performance of the supply chain [72]. The primary benefit of a transparent organization is public trust [31]. Transparency increases public trust and prevents misunderstanding [41], whereas, without trust, transparency is insufficient [31]. The positive relationship in the SC between trust and performance has been recognized in various industries, such as the automotive, computer, furniture, printing, electrical component and electronic industries [73,74,75].
There is less empirical evidence available as to how transparency really impacts trust. One study presents convincing evidence of a positive relationship between transparency and stakeholders trust [55]. Similarly, the literature provides much empirical is evidence on the linkage between trust and performance [73,74,75,76,77,78,79,80]. Several others studies describe the absence of a significant connection between trust and performance [81]. Still another study [82] finds a negative relationship with performance [76]. Such contrasting literature findings suggest not merely that public trust’s relationship to performance is complex and poorly understood, but also that trust cannot improve outcomes under all circumstances.
These contradictory findings necessitate further investigation and clarification of the transparency and public trust relationship in terms of HL performance. It can be posited that greater HL transparency, including higher disclosure, clarity, accuracy, corporate governance, decision making, and accountability, will develop greater public trust in HL. Therefore, in this study public trust is mediating between transparency and effective HL performance.
Hypothesis 7(H7).
Public trust plays a significant role as a mediator in the relationship between transparency and effective humanitarian logistics. Transparency significantly increases public trust. Consequently, public trust further leads to effective humanitarian logistics.
3. Research Design and Methodology
For this study, survey methodology has been used to empirically investigate the aforementioned relationships of the proposed model. More specifically, the survey methodology is applied to structure and describe the role of transparency in the effectiveness of HL. Based on experiences from previously published works, the survey strategy is an appropriate method. (Saunders, Lewis, et al. 2009) stated that the survey strategy is popular and common in business and management research. It is commonly used to economically collect a large amount of information from a sizeable population [83].
For this study, three types of organizations were selected from Pakistan: HOs working under the umbrella of UN, IHOs and local HOs. quotative data were collected via survey technique using an online questionnaire. An initial approach was made to 281 NGOs found at https://pakngos.com.pk/ngos and https://reliefweb.int/organizations. A cover letter was accompanied with an online questionnaire (link of Google form) and contained a short introduction to the survey purpose. It was sent to the respondents via their email collected from the relevant website of the organization. Also, some of the respondents were contacted through Facebook messenger. To ensure the reliability of the questionnaire, it was reviewed by experts (professors and researchers) in the supply chain management area. The questionnaire was pre-tested several times to ensure that the format, wording, length and sequencing were appropriate based on expert opinion. During each successive pre-test, feedback was obtained from approximately 38 respondents. It helped in refining the enhancement of HL performance through transparency. In each subsequent test, the results reflected the reliability and validity of the construct. Finally, it confirmed that the instrument was ready to be applied in the main survey.
Purposive sampling was deployed to make sure that the targeted respondents were practicing expatriate logisticians for getting eloquent data for analysis. Patton [84] stated that a purposive sampling method was applied as selections were made on the basis of the subjects having particular characteristics. Therefore, in the HL context a single data collection phase was used. The population considered in this research was comprised entirely of personnel engaged in logistics, procurement, storage, distribution, SC activities, or humanitarian work. Moreover, the organizations were selected based on their presence in any DRO. However, their participation in the DRO was further ensured by the introduction section in the questionnaire. The questionnaire (demographic section) confirmed their presence in any DRO. If they were not participating in any DRO, or if the qualification of the respondent was less than secondary school certificate, then their responses were excluded from the study. This was done to ensure the widest possible range of responses and to support the generalizability of the study results.
There is a little consensus on the suggested sample size for the structure equation model (SEM). A “critical sample size” is of 200. Furthermore, any number above 200 is recognized to provide appropriate statistical power for data analysis [85,86,87]. Out of 344 questionnaires sent out, 231 responded to the e-survey. After excluding inappropriate questionnaires, 210 remained as a valid sample for analysis. This low response rate might be due to the target population nature. Those who participated in DRO are mostly mobile and perhaps were not able to respond. Furthermore, some participants probably felt that the information concerning this topic was very sensitive and hence declined to respond. Based on the topic sensitivity, the researcher guaranteed the organizations regarding the confidentiality of the information. Consequently, the names of the organizations and participants will not be revealed. A five-point Likert scale was used. The scale differs from prior studies. Because using coarser scale points (with fewer scale points) is easy for the respondent to read out the scale list completely and to answer on a particular issue as compare to finer scale (those with many scale points) ones [88,89,90]. Furthermore, five- to seven-point scales also increase reliability and validity as compared to coarser ones. However, using further finely point scales will not bring any changes in reliability and validity. On the other hand, data collected with the five-point scale may be “bunched up” at the positive end of the scale due to providing limited options of scale points. In contrast, 10-point scale can decrease this negative skew by permitting for many degrees of positive response. In addition, 10-point scale may also reduce the total mean score rather than five- to seven- points scale [91]. Furthermore, data collected with the 10- point scale rather than the five-point scale helps to minimize the problem of leniency and central tendency [92]. Moreover, Smith et al. [93] reported that using the five-point scale has less stability and consistency as compared to 10-point scale. In short, every scale point has pros and cons, but this is outside the scope of this research.
The CFA measurement model assessment is the first step of SEM. The main purpose of the measurement model evaluation is to state the pattern by which each indicator (measure) loads on a specific dimension and to assure the reliability and validity of the measures and constructs. In this research, different measures were used to test the items’ reliability, discriminate validity and goodness of fit (GoF). R square and adjusted R square were used to estimate Pearson’s coefficients. Cronbach’s alpha and the composite reliability (CR) were applied for convention measures of model reliability. Convergent validity is measured by using average variance extracted (AVE). Discriminant validity was measured through the Fornell–Larcker discriminant validity criterion and Heterotrait-Monotrait Ratio (HTMT). GoF was measured by using SRMR, NFI and RMS_theta. The predictive validity was measured using (Q2) r Stone–Geisser indicator. The variance inflation factor (VIF) was used to estimate multicollinearity. Finally, the psychometrical soundness of the hypothesized model was measured by using T-Test. The proposed measurement model of this study has eight constructs represented by 41 reflective measured parameters (indicators) using the covariance-based SEM (CB-SEM) method. Hence the selection of measurement items was based on a thorough review of the existing literature and evaluated by experts.
4. Analysis and Results
After formulating a conceptual model and constructing applicable indicators based on previous studies, the indicators were revolved into measurable variables. The study investigates how the different aspects of the transparency lead to an assessment of public trust, which in turn leads to effective HL. Based on the collected indicators in the research, the measurement model was formulated by incorporating the indicators into a questionnaire. The qualitative design of research gave information regarding how to construct these indicators. It was essential that the indicators were correctly used with exactly the same meaning by all respondents and that the measures precisely correspond with the research aims (validity). Therefore, each latent variable was illustrated in the questionnaire. For the purpose of research, it was decided to include questions regarding both variables and importance in the questionnaire.
Public trust in HOs for effective HL was found to have an association with demographic characteristics of HLSPs as also found by [1,94,95]. In this study gender, age, qualification, experience and position in the organization and type and function of the organization were used. The data were measured after screening for normality. Likewise, missing and inappropriate data were removed from the dataset as discussed in the sample selection section. The remaining 210 respondents represented 41 measured parameters (indicators) for structural equation modeling.
A two-step approach was used by the SEM. Firstly, CFA was used to construct reliability and validity, as seen in Table 1. Second, after confirming through CFA, multiple fit indexes were used to evaluate SEM. Historically formative models have been the norm in partial least squares (PLS) modeling and reflective models have been the norm in CB-SEM [96]. A path model is reflective if causal arrows in the path diagram go from the latent variable (factor) to the indicator measured variables. A path model is formative if the causal arrows go from the observed indicator measures to the latent variables. CB-SEM/(traditional SEM) has superior statistical technique for reflective models. PLS-SEM is an alternative to CB-SEM, where SEM is based on CFA and PLS regression on principal component analysis (PCA). De Winter & Dodou [97] described that results obtained from CFA and PCA were usually comparable and that there is no basis to propose that either method is more perfect. Importantly, CB-SEM is preferred when the research purpose is confirmatory modeling. This specific research model is reflective. Therefore, traditional SEM/CB-SEM based on CFA with SmartPLS 3 software was used for this study.
The analysis of Table 1, indicates the aspect investigated in the measuring models. Outer model loadings are the focal point in reflective models, denoting the paths from a latent variable to its representative indicator variables. Outer loadings denote the total contribution of the indicator to the description of its latent variable. Each these results are discussed next in detail.
4.1. R Square and R Square Adjusted
The first analysis is the estimation of Pearson’s coefficients R Square (R2). The R2 value evaluates the portion of the variance of the endogenous variables, is explained by the structural model and indicates the adjusted model quality. For the area of the social sciences, (Cohen [98] classified R2 = 2% as having a small effect, R2 = 13% as a medium effect, and R2 = 26% as a large effect [99].
Table 1, reveals that adjusted R square is very close to unadjusted. The R2 and adjusted R2 values are shown for (factors) endogenous latent variables. In the path model this is the most common effect size measure and gives an interpretation similar to that in multiple regressions. In this research, the only endogenous variables were effective HL and public trust. For the endogenous variable effective HL, the R2 and R2 adjusted values are 0.627 and 0.626, respectively (see Figure 2). For public trust, the R2 and R2 adjusted values were 0.749 and 0.742, respectively, indicating that about 63% of the variance in effective HL was explained by the model. Likewise, almost 74% the variance in public trust was explained by the model in the presence of the control variable. The values of R2 and adjusted R2 were higher. Therefore, the values represent a perfect fit of the study model. Furthermore, in this study, there are direct effects on public trust and indirect effects on effective HL mediated by public trust.
4.2. Reliability of the Measurement Model
4.2.1. Cronbach’s Alpha
Cronbach’s alpha is a conventional measure of model reliability, measuring the internal consistency reliability of a construct. However, CR on is recommended as more appropriate because it considers the indicators’ differential weights [100,101], whereas Cronbach’s alpha equally weights the indicators [102]. By rule of thumb commonly, a reliability of 0.60 or higher is suitable for exploratory purposes, 0.70 or higher is suitable and 0.80 or higher is good for confirmatory purposes. Cronbach’s alpha below 0.60 indicates that the indicators construct does not fit well together. Cronbach’s alpha addresses the question of whether the constructs for latent variables show convergent validity and henceforth display reliability [103].
In this study, as shown in Table 1, and Figure 3, the Cronbach’s alpha coefficient for all constructs is higher than 0.70 except for decision making which is 0.69. The model demonstrates a high reliability. The decision-making latent factor falls short of this cut-off. The items used in this research have content validity since the measurement items selection was based on a thorough review of the existing literature and evaluation by experts.
4.2.2. Composite Reliability (CR)
CR is a slightly more lenient internal consistency model reliability criterion. It uses similar cutoffs as for Cronbach’s alpha [102]. In a reflective model, CR is a preferred alternative to Cronbach’s alpha as a test of convergent validity because Cronbach’s alpha can over or, more usually, underestimate scale reliability. CR ranges from zero to one, with one being higher estimated reliability. In an adequate model for exploratory purposes, CR should be equal to or greater than 0.60 [101], 0.07 or higher for an adequate model for confirmatory purpose [96]; and 0.80 or higher is good for confirmatory model [104]. Greater than 0.90 CR shows that the multiple indicators are minor wording differences of each other rather than being representative measures truly of the construct.
As seen in Table 1 and Figure 4, the reliability measure shows good reliability for both the dependent and independent constructs, except for decision making, which shows poor reliability.
CR is also shown by a higher loading of factor of a measurement item on its latent construct. The model had a high CR score as it exceeded the recommended value of 0.7, except for decision making, which was 0.68 and which does not exhibit internal consistency model reliability. Furthermore, there was no very high CR (>0.90), which may indicate that the multiple indicators have no wording similarity. Likewise, the model does not reflect a design problem but is a truly representative measure of the construct.
4.3. Validity of the Measurement Model
Neuman [105] stated that a measure can be reliable but not valid. Nevertheless, it cannot be valid without being reliability. Cronbach’s alpha and CR do not guarantee construct validity. Therefore, convergent and discriminant validity should be considered.
4.3.1. Average Variance Extracted (AVE)
Convergent validity measures the degree to which the scales of the same construct positively correlate with other measures. High factor loadings on the same construct reflect that the observed variables converge. At least all factor loadings must be significant statistically and higher than 0.70. A loading of 0.70 highlights that the construct explains approximately 50%. AVE indicates the average communality for each latent variable in a reflective model. In an adequate model, AVE needs to be greater than 0.5 [101], as well as greater than the cross-loadings. This means that the factors must explain at least half the variance of their respective constructs, and hence that AVE below 0.50 means error variance.
AVE may also be used to form discriminant validity by the Fornell–Larcker criterion. For any latent variable, the AVE square root should be more than its correlation with any other latent variable [106]. For each item, the standardized factor loadings applied in this study on their respective constructs ranged from 0.521 to 0.836. Likewise, the AVE for each construct was greater than 0.50 except for decision making, demonstrating convergent validity. Table 1 and Figure 5, show that the construct elucidates greater than half of the variance of its indicators.
4.3.2. The Fornell–Larcker Discriminant Validity Criterion
The Fornell–Larcker criterion is the most widely applied discriminant validity approach with CB-SEM, whereas Voorhees et al. [107] recommend HTMT.
Discriminant validity assessment by means of the Fornell–Larcker criterion produces divergent results for CB-SEM. In contrast, with values below 0.90, the HTMT criterion indicated that discriminant validity had been met [100]. CB-SEM as the HTMT criterion solely rests on indicator correlations, whose values are independent of the SEM method used [102]. In Table 2, the Fornell–Larcker criterion reveals the useful discriminant validity of the present study data.
4.3.3. Heterotrait-Monotrait Ratio (HTMT)
As noted in SmartPLS documentation, use of the Fornell-Larcker criterion is a conventional method for measuring the discriminant validity of a SEM. This technique has shortcomings. Henseler et al. [100] used simulation studies to reveal that a lack of discriminant validity is better detected by the HTMT ratio they developed.
The HTMT ratio is the geometric mean of the correlations of heterotrait-heteromethod (such as across constructs the correlations of indicators measuring different phenomena) divided by the monotrait-heteromethod correlations average [102]. In a best-fitting model, heterotrait correlations must be smaller than monotrait correlations, i.e., the HTMT ratio must be below 1.0. Henseler et al. [100] (p. 121) argue that if the value of HTMT is below 0.90 between a specified pair of reflective constructs, then discriminant validity has been established. Also, Gold et al. [108] and Teo et al. [109] use the 0.90 cutoff. In contrast Clark [110] and Kline [111] use the more stringent cutoff of 0.85.
As per the above Figure 6, the values of the latent variables were less than 0.85, except for that of decision making, where all the values were less than 0.90 and, therefore, the model has great discriminant validity.
4.4. Goodness of Fit (GoF) of Measurement Model
The next step was to assess the model fit of the SEM. The GoF was also measured for the hypothesized model to estimate its applicability for the prediction [112]. There is no global GoF measure existing in PLS-SEM, unlike CB-SEM, and therefore CB-SEM is perfect for causal models and testing hypotheses. Model GoF reflects how well the specified model among the measured parameters reproduces the covariance matrix.
The model GoF was assessed to compare the proposed model with the observed or actual data. If the relationships are constant with each other, then the model fits may be considered a reliable justification for the hypothesized relationships. Over the past few decades, a minimum of 24 fit indexes have been recommended [113]. For model fit there is presently no universal agreement on which measures should be preferred. Therefore, researchers recommend the use of multiple fit criteria. The various indicators designed for evaluating the model’s GoF of a model are Parsimony Fit Indices, Absolute Fit Indices and Incremental Fit Indices. Parsimony Fit Indices are primarily meant to evaluate fitness in relation to the complexity of a model and are useful in measuring competing models. Parsimony fit indices have not been considered for this study because there is no competing model. For this specific reflective model, the SmartPLS report displays various model fit related to the model quality as shown below.
4.4.1. Standardized Root Mean Square Residual (SRMR)
Absolute fit indices can measure either goodness or badness of fit of the proposed model. SRMR is a measure of the approximate model fit of the research and of the variation between the model-implied correlation matrix and the observed correlation matrix. The SRMR reflects the average magnitude of such variances, with lower SRMR being well fit. Traditionally, a model has good fit when SRMR is below 0.08 [114]. Some scholars use the more lenient cutoff of below 0.10. As seen in the above Table 3, for this study the analysis generated SRMR values of 0.07, which is well within the acceptable value. Therefore, on the Absolute Fit Indices’ parameter the model appeared to give a good fit.
4.4.2. Normed Fit Index (NFI)
One of the first fit measures suggested in the SEM literature is the NFI by Bentler et al. [115]. The NFI values must be between zero and one. The closer the NFI value to one, the better the model fit. NFI values of 0.9 or above mostly represent best fit. The NFI denotes an incremental fit measure. A major disadvantage is that it does not penalize model complexity. The more parameters in the model, the better the NFI result. Due to this disadvantage the value is not expected to be very high. The data set for this study generated an NFI value of 0.68, which is not very high but is well above the threshold level. Therefore, on the Incremental Fit Indices’ perimeter also, the model was presented to be a good fit model.
4.4.3. RMS_theta
The RMS_theta is the root mean squared residual covariance matrix of the outer model residuals [116]. This fit measure is useful merely to evaluate purely reflective models. The RMS_theta assesses the level of correlation with the outer model residuals. It builds on the outer model residuals and denotes the differences between the values of predicted indicator and the observed indicator. The measure must be close to zero to reflect good model fit, because it may imply that correlations are too small (close to zero) between the outer model residuals. RMS_theta with values of 0.12 or below reflect a well-fitting model, and higher values indicating a lack of fit [100].
As shown in Table 4, the value of 0.12 shows a well-fitting model. The fit statistics show that the theoretical model is adequate to fit the data. The overall fit confirms that the relationships among independent variables mediate the variable and that the dependent variable is significant.
The fit statistics show that the theoretical model is acceptable to fit the data. The total fit confirms that the relationships among independent variables mediate the variable and that the dependent variable is significant. CB-SEM performs factor analysis during its execution. The results of CFA are shown in Table 1.
Finally, most GoF measures resulting from the model assessment using CB-SEM meet the recommended guidelines, but only after indicator deletion. For this specific study for measuring GoF, the result was good even though no item was deleted. Specifically, the analysis result in an rms-theta of 0.12 meets the recommended guidelines. Likewise, the SEM is the SRMR at <0.08 and also meets the suggested guidelines. Due to these disadvantages, the NFI was not expected to be very high. The dataset for this study generated an NFI value of 0.68, which is well above the threshold level. Therefore, on the Incremental Fit Indices’ perimeter also, the model presented as a good fit model.
4.5. Multicollinearity in Reflective Models
A rule of thumb is that problematic multicollinearity can be observed when the variance inflation factor (VIF) coefficient is above 4.0 whereas some researchers use 5.0 as a more lenient cut-off. Even reference [117] argued that VIF values <10 indicate an absence of multicollinearity [118]. VIF is the contrary of the tolerance coefficient, for which multicollinearity is marked when tolerance is less than 0.25. This research performed VIF in SmartPLS to check for multicollinearity. The results shown that each indicator has a VIF value <3, which confirms the absence of any multicollinearity issue in the study. There were no issues of multicollinearity between the variables (dependent and independent) which can cause problems in interpreting CFA results. VIF of the indicators are presented in Table 5.
4.6. “Predictive Accuracy” Criteria (Estimation with Blindfolding)
The blindfolding procedure should be used for reflective models. Blindfolding utilizes a cross-validation strategy. It reports cross validated redundancy and communality for constructs as well as indicators calls criteria of “predictive accuracy”. For a reflectively modeled endogenous factor Q2, the cross-validated redundancy is also known as Stone-Geisser Q2, a model fit measure. The Stone–Geisser Indicator (Q2) assesses how closely the model approaches its anticipated position. Values greater than zero must be obtained in this assessment (See Table 6). A perfect model must have Q2 = 1 (which indicates that the model replicates reality—without errors) [99]. There is a Q2 value in the model for each reflectively-modeled endogenous factor. A Q2 value higher than 0 indicates that the model is suitable to predict that factor, a value with a negative or 0 value indicates that the model is irrelevant to the prediction of the given endogenous factor. Cohen [98] reported that 0.02, 0.15 and 0.35 represent a “small” “medium” and “high” effect size, respectively.
For this study, Q2 is 0.30 and 0.35. Therefore, this reflective model has a high degree of predictive relevance with regard to the endogenous factors of public trust and effective HL. The values of Q2 indicate that the model is accurate and that the constructs are important for the general adjustment of the model.
4.7. Psychometrical Soundness of the Measurement Model
CB-SEM performs both CFA and path analysis during its implementation. The results of CFA are shown in Table 1. Although the 41 retained items comprising 8 variables met the reliability and validity requirements, the measurement model parameter estimates must be statistically significant in order to prove the psychometrical soundness. The two popular parameter estimates are T-Statistics (item standardized factor loadings) and squared multiple correlations. For this study T-statistic will be considered using SmartPLS software.
The statistical significance was set at the level of 0.05 alpha (two tailed), and parameters (e.g., item factor loadings) related with t values of ±1.96 or above are statistically significant. Factor loadings of items with t values less than ±1.96 are non-significant statistically.
For this study, in order to test the significance of cited relations, the bootstrapping module was used. Eliminating the four observed variables (indicators) from the proposed model resulted in t test values that were significant for all the assumptions except for one. Table 7, and Figure 7, reveal that all the 37 retained items were loaded significantly on their corresponding constructs in the revised measurement model. As seen in Figure 7, all the values are 1.96 or above except for hypothesis 5 which is non-significant. In all the cases except one the HO was accepted.
4.8. Summary
A two-step approach was used by the SEM. Firstly, CFA was used to construct reliability and validity, as seen in Table 1. Second, after CFA confirmation, multiple fit indexes were used to evaluate SEM. All constructs in the measurement model showed greater reliability and validity except for decision making. After confirming through CFA and SEM, the psychometrical soundness of the measurement model was tested. Student T test was applied to test the seven study hypotheses. The 37 measured variables with eight constructs were taken in combination to develop the structural model. In the initial structural model all factor loadings were significant at p < 0.05, except the relationships between decision making and public trust. Hence a model without the above relationship was found to have a better model fit. The implications of these findings are discussed in the next section in detail.
5. Discussion, Contributions, Practical Implications and Scope for Future Research
HL is growing in maturity and is being progressively investigated. This research has attempted to construct a model for measuring transparency sets of variables with HL. The model, based on previous studies, was verified to be a good fit for measuring the perceptions of multiple dimensions and factors of transparency towards HL. However, some recommendations and considerations can be formulated. One study result is the confirmation that transparency enhances performance, efficiency and effectiveness through public trust in the context of HL. This is an essential finding as it validates the transparency multidimensional view in a manner more rigorously than that of previous studies. The study findings will also enable scholars and practitioners to take a broader view of transparency and public trust in the HL context.
The hypotheses relationships proposed in the structural model between the latent variables were tested through student T test association with P. value. As seen in Figure 7 and Table 7, six of the seven hypothesized relationships between endogenous constructs were accepted. The result demonstrated that the dimensions of transparency, namely disclosure, clarity and accuracy are associated positively with public trust, which in turn is associated with the effective HL. This supports hypotheses H1, H2 and H3. The result shows that corporate governance is positively related to public trust in organization, supporting hypothesis H4. The results suggest that the accountability of an organization positively impacts on the public trust in an organization in the HL context, thus supporting H6. Similarly, the mediating variable (public trust) is positively related to the response variable (effective HL), supporting H7. Finally, the impact of decision making was not found to be significant. Decision making has poor association with public trust in the HL context; hence H5 was not supported.
The study results agree with the previous studies recommendations [24,25,26,29]. Furthermore, the proposed reflective model has a high degree of predictive relevance with regard to the endogenous factors of public trust and effective HL. There were no issues of multicollinearity between the variables, which can cause problems when interpreting CFA results. Overall, decision making is the weakest component to explain public trust. Cronbach’s Alpha and CR showed moderately strong relationships. However, the T-statistic test was not found to be a significant or strong explanatory component for public trust with decision making, possibly due to the indicators of the component. Nevertheless, deleting the four very weak indicators did not enhance the squared multiple correlations of decision making in the SEM model.
5.1. Theoretical Contributions
The study results may contribute in several important ways to the literature. First, the applicability of the proposed theoretical model to the HL field was confirmed. Second, the study findings will help scholars further expand the literature and develop further theories in the field of HL. Third, the literature dimensions of transparency, such as disclosure, clarity and accuracy, and the components of transparency, namely corporate governance, decision making and accountability, have only been, to the best of our knowledge, examined in the literature separately. In contrast, this is the first integrated theoretical model incorporating all these constructs that has been developed and validated empirically. Fourth, transparency should serve as a key tool for considering stakeholder distrust by disclosing the issues that are generally left hidden, thus improving the organization’s responsible management practices, decreasing corruption and creating a sense of accountability and building trust [31]. This study extends these lines and identifies that corporate governance and accountability are imperative components of transparency. A key characteristic of a transparent organization is the fair distribution of resources, which in turn builds public trust and enhances the effectiveness of HL. Together, these dimensions and components of transparency with public trust and effective HL relations could significantly enrich this study approach to both organizational transparency theory and practice and also allow scholars to extend the HL literature by providing a broader view on the value of accountability in managing logistics. Finally, with insights obtained from stakeholder theory or principal agent theory, this study identifies transparency as a key to gain public trust. In contrast, public trust is undermined by corruption reports launched against HOs. They are very sensitive because most organizations get funds from public appeals through donors.
5.2. Practical Implications
This research has four valuable implications. First, the key purpose of this study is to identify the interrelationship between transparency dimensions and components with public trust, which in turn increase HL effectiveness. This mentioned issue is important because transparency in the HL context has a strong impact not only on the well-being of disasters survivors but also on other stakeholders. Second the findings are beneficial for all stakeholders in the management of disaster risk. They might be dealing with similar challenges while constantly seeking strategies to facilitate victims. They can evaluate their competitiveness better based on the factors presented in this study. Third, the research opens new insight into the topic. In short, during relief operations, transparency all the way from the supply funds by donors to the last-mile distribution by logisticians is the basis for fast (considering physical flow of relief items, excluding involved documentations) fair and safe HL. This can boost public trust and enhance the organization’s image. Similarly, Khan [119] reported that foreign direct investment inflow to host countries is prevented by high corruption. Transparency enhances the image of the affected country, by reducing corruption and increasing the speed and fairness of HL. This is the key method for saving more lives. Lastly, nowadays transparency is a key to operate HL and it ranks high on the agenda owing to its huge impacts. Therefore, this study reveals the different aspects of transparency in HL. The planned methodology will serve as a road map to the HSCM to understand the variables that have to be managed to enhance transparency across HL.
5.3. Limitations and Future Research
Although this study has made significant contributions to the literature, the following four potential limitations of this research should be taken into consideration when analyzing the impact of the study findings.
First, since the transparency topic in HL is a comparatively new topic, researchers can benefit from the study findings and may apply them in their future observations. Second, decision making did not show a positive impact on public trust in terms of HL. Although existing theory supports the positive relationship of decision making with trust, future research needs to use a longitudinal design between decision making and public trust in terms of effective HL. It can utilize further variables in order to more completely establish the causal relationship between decision making, intermediate variables and effective HL. Furthermore, future study should also use a larger sample size in order to address the weak relationship of decision making with public trust. Third, the study results are limited to employee perceptions. The generalizability of the results needs to be cross-validated by larger sample size and various organizational/stakeholders’ settings such as donors, government, and victims. Benefits will be obtained by future research exploring other areas affected by similar problems and comparing the steps taken in these situations. Finally, the present study outlines a path for future researchers to investigate empirically the impact of increasing levels of public trust on HL performance more systematically, by treating public trust as a continuous (instead of dichotomous) variable. In addition, this study was based on the results of a questionnaire survey. Further mixed methods will enrich the findings.
6. Conclusions
The research field of HL is relatively new. Effective HL is essential because it will save lives. Further research is merely one possible way to achieve this. Despite the imperative roles played by dimensions and components of transparency and public trust in improving the effectiveness of HL, little systematic investigation has been undertaken to determine the relationship between them. The study’s findings indicate that public trust plays a substantial role as a mediator in the dimensions and components of transparency and enhances the effectiveness of HL. The results show that public trust as a mediator helps explain the process through which transparency influences the performance, efficiency and effectiveness in HL. Specifically, this study indicated that the impact of transparency (sets of variables) on the effectiveness of HL operates through public trust. This research makes a strong contribution to the existing literature by clearly describing the importance of the application of public trust between disclosure, clarity, accuracy, corporate governance and accountability with the performance, efficiency and effectiveness of HL. In addition to some valuable academic contributions, the findings of the present research contribute significantly by providing HOs and all other stakeholders, especially donors, HOs and governments, with guidelines for understanding the important factors that enhance HL performance, efficiency and effectiveness. Such stakeholders are always seeking strategies to help victims, whereas the donors also want to gain high visibility, transparency, and accountability. As HOs attain a higher-level transparency they also will become more trusted. This study provides HOs with guidelines to determine the critical factors for increasing the performance of HOs and also raises the awareness of the need to carefully evaluate decisions related to the fair distribution of relief items. Although the study findings are subject to certain limitations, the resulting recommendations contribute to the related field of research and should encourage future lines of investigation. This research provides a platform for future investigations across a variety of settings to examine thoroughly the roles of public trust in the relationship between the transparency and effectiveness of HL. Lastly, the data analyzed in this study were from a survey of employees of HOs.
Author Contributions
M.K. wrote the paper, designed the survey and conduct the survey and data analysis. H.Y.L. suggested research ideas and contributed to the data analysis and revision of the paper. J.H.B. supervised throughout the study and assisted in conducting the survey and data analysis.
Funding
This research received no external funding.
Conflicts of Interest
The authors declare no conflict of interest.
References
- Bealt, J.; Fernández Barrera, J.C.; Mansouri, S.A. Collaborative relationships between logistics service providers and humanitarian organizations during disaster relief operations. J. Hum. Logist. Supply Chain Manag. 2016, 6, 118–144. [Google Scholar] [CrossRef] [Green Version]
- Galindo, G.; Batta, R. Review of recent developments in OR/MS research in disaster operations management. Eur. J. Oper. Res. 2013, 230, 201–211. [Google Scholar] [CrossRef]
- Ibrahim, S.E.; El Ebrashi, R. How social entrepreneurship can be useful in long-term recovery following disasters. J. Hum. Logist. Supply Chain Manag. 2017, 7, 324–349. [Google Scholar] [CrossRef]
- Vega, D.; Sanchez, R. Identifying Competences and Their Sources in a Not-for-Profit Organization: The Case of A Humanitarian Relief Organization. In Mid-Range Management Theory: Competence Perspectives on Modularity and Dynamic Capabilities; Emerald Publishing Limited: Bingley, UK, 2017; pp. 45–67. [Google Scholar]
- Ahmeda, Z. Disaster risks and disaster management policies and practices in Pakistan: Acritical analysis of Disaster Management Act 2010 of Pakistan. Int. J. Disaster Risk Manag. 2013, 4, 15–20. [Google Scholar] [CrossRef]
- Bari, S. Time to reform disaster risk reduction. The Express Tribune, 25 December 2018. [Google Scholar]
- Thomas, A.S.; Kopczak, L.R. From logistics to supply chain management: The path forward in the humanitarian sector. Fritz Inst. 2005, 15, 1–15. [Google Scholar]
- Kovács, G.; Spens, K.M. Humanitarian logistics in disaster relief operations. Int. J. Phys. Distrib. Logist. Manag. 2007, 37, 99–114. [Google Scholar] [CrossRef]
- Holguín-Veras, J.; Jaller, M.; Van Wassenhove, L.N.; Pérez, N.; Wachtendorf, T. On the unique features of post-disaster humanitarian logistics. J. Oper. Manag. 2012, 30, 494–506. [Google Scholar] [CrossRef]
- Rabta, B.; Wankmüller, C.; Reiner, G. A drone fleet model for last-mile distribution in disaster relief operations. Int. J. Disaster Risk Reduct. 2018, 28, 107–112. [Google Scholar] [CrossRef]
- Nurmala, N.; Nurmala, N.; de Leeuw, S.; de Leeuw, S.; Dullaert, W.; Dullaert, W. Humanitarian–business partnerships in managing humanitarian logistics. Supply Chain Manag. Int. J. 2017, 22, 82–94. [Google Scholar] [CrossRef]
- Larrea, O. Key performance indicators in humanitarian logistics in Colombia. IFAC Proc. Vol. 2013, 46, 211–216. [Google Scholar] [CrossRef]
- Anjomshoae, A.; Hassan, A.; Kunz, N.; Wong, K.Y.; de Leeuw, S. Toward a dynamic balanced scorecard model for humanitarian relief organizations’ performance management. J. Hum. Logist. Supply Chain Manag. 2017, 7, 194–218. [Google Scholar] [CrossRef]
- Burkart, C.; Besiou, M.; Wakolbinger, T. The funding—Humanitarian supply chain interface. Surv. Oper. Res. Manag. Sci. 2016, 21, 31–45. [Google Scholar] [CrossRef]
- Beamon, B.M.; Balcik, B. Performance measurement in humanitarian relief chains. Int. J. Public Sect. Manag. 2008, 21, 4–25. [Google Scholar] [CrossRef] [Green Version]
- Lu, Q.; Goh, M.; De Souza, R. A SCOR framework to measure logistics performance of humanitarian organizations. J. Hum. Logist. Supply Chain Manag. 2016, 6, 222–239. [Google Scholar] [CrossRef]
- Dube, N.; Van der Vaart, T.; Teunter, R.; Van Wassenhove, L. Host government impact on the logistics performance of international humanitarian organisations. J. Oper. Manag. 2016, 47, 44–57. [Google Scholar] [CrossRef]
- Everett, J.; Friesen, C. Humanitarian accountability and performance in the Théâtre de l’Absurde. Crit. Perspect. Acc. 2010, 21, 468–485. [Google Scholar] [CrossRef]
- Maxwell, D.; Walker, P.; Church, C.; Harvey, P.; Savage, K.; Bailey, S.; Hees, R.; Ahlendorf, M.-L. Preventing Corruption in Humanitarian Assistance; Feinstein International Center Research Report; Transparency International: Berlin, Germany, 2008. [Google Scholar]
- Roosli, R.; O’Keefe, P. Post-disaster housing and management in Malaysia: A literature review. Int. J. Disaster Resil. Built Environ. 2013, 4, 168–181. [Google Scholar] [CrossRef]
- Carlson, C.E.; Isihara, P.A.; Sandberg, R.; Boan, D.; Phelps, K.; Lee, K.L.; Diedrichs, D.R.; Cuba, D.; Edman, J.; Gray, M. Introducing PEARL: A Gini-like index and reporting tool for public accountability and equity in disaster response. J. Hum. Logist. Supply Chain Manag. 2016, 6, 202–221. [Google Scholar] [CrossRef]
- Deen, S. Pakistan 2010 floods. Policy gaps in disaster preparedness and response. Int. J. Disaster Risk Reduct. 2015, 12, 341–349. [Google Scholar] [CrossRef]
- Kosec, K.; Mo, C.H. Aspirations and the Role of Social Protection: Evidence from a Natural Disaster in Rural Pakistan; World Development: Washington, DC, USA, 2017. [Google Scholar]
- Schnackenberg, A.K.; Tomlinson, E.C. Organizational transparency: A new perspective on managing trust in organization-stakeholder relationships. J. Manag. 2016, 42, 1784–1810. [Google Scholar] [CrossRef]
- Park, H.; Blenkinsopp, J. The roles of transparency and trust in the relationship between corruption and citizen satisfaction. Int. Rev. Adm. Sci. 2011, 77, 254–274. [Google Scholar] [CrossRef] [Green Version]
- Medina, C.; Rufín, R. Transparency policy and students’ satisfaction and trust. Transform. Gov. Peopleprocess Policy 2015, 9, 309–323. [Google Scholar] [CrossRef]
- Hassan Che Haat, M.; Abdul Rahman, R.; Mahenthiran, S. Corporate governance, transparency and performance of Malaysian companies. Manag. Audit. J. 2008, 23, 744–778. [Google Scholar] [CrossRef] [Green Version]
- Piotrowski, S.J.; Van Ryzin, G.G. Citizen attitudes toward transparency in local government. Am. Rev. Public Adm. 2007, 37, 306–323. [Google Scholar] [CrossRef]
- Araujo, J.F.F.E.D.; Tejedo-Romero, F. Local government transparency index: Determinants of municipalities’ rankings. Int. J. Public Sect. Manag. 2016, 29, 327–347. [Google Scholar] [CrossRef]
- Choi, J.J.; Sami, H. Corporate transparency from the global perspective: A conceptual overview. In Transparency and Governance in a Global World; Emerald Group Publishing Limited: Bingley, UK, 2012; pp. 3–7. [Google Scholar]
- Parris, D.L.; Dapko, J.L.; Arnold, R.W.; Arnold, D. Exploring transparency: A new framework for responsible business management. Manag. Decis. 2016, 54, 222–247. [Google Scholar] [CrossRef]
- Alom, M.M. Proactive transparency and outward accountability of frontline public bureaucracies: An integrated model. Int. J. Prod. Perform. Manag. 2018, 67, 611–628. [Google Scholar] [CrossRef]
- Heald, D.A. Varieties of transparency. In Transparency: The Key to Better Governance?: Proceedings of the British Academy 135; Oxford University Press: Oxford, UK, 2006. [Google Scholar]
- Wehmeier, S.; Raaz, O. Transparency matters: The concept of organizational transparency in the academic discourse. Public Relat. Inq. 2012, 1, 337–366. [Google Scholar] [CrossRef]
- Baraibar-Diez, E.; Odriozola, M.D.; Fernández Sánchez, J.L. A Survey of Transparency: An Intrinsic Aspect of Business Strategy. Bus. Strategy Environ. 2017, 26, 480–489. [Google Scholar] [CrossRef]
- Wadhwa, S.; Mishra, M.; Chan, F.T.; Ducq, Y. Effects of information transparency and cooperation on supply chain performance: A simulation study. Int. J. Prod. Res. 2010, 48, 145–166. [Google Scholar] [CrossRef]
- Kabra, G.; Ramesh, A. Information technology, mutual trust, flexibility, agility, adaptability: Understanding their linkages and impact on humanitarian supply chain management performance. Riskhazards Crisis Public Policy 2016, 7, 79–103. [Google Scholar] [CrossRef]
- De Fine Licht, J. Do we really want to know? The potentially negative effect of transparency in decision making on perceived legitimacy. Scand. Political Stud. 2011, 34, 183–201. [Google Scholar] [CrossRef]
- Yu, L.; Zhang, C.; Yang, H.; Miao, L. Novel methods for resource allocation in humanitarian logistics considering human suffering. Comput. Ind. Eng. 2018, 119, 1–20. [Google Scholar] [CrossRef]
- Maon, F.; Lindgreen, A.; Vanhamme, J. Developing supply chains in disaster relief operations through cross-sector socially oriented collaborations: A theoretical model. Supply Chain Manag. Int. J. 2009, 14, 149–164. [Google Scholar] [CrossRef]
- Su, H.-Y.; Fang, S.-C.; Young, C.-S. Relationship transparency for partnership enhancement: An intellectual capital perspective. J. Bus. Ind. Mark. 2011, 26, 456–468. [Google Scholar] [CrossRef]
- Leitch, S.R. The transparency construct in corporate marketing. Eur. J. Mark. 2017, 51, 1503–1509. [Google Scholar] [CrossRef]
- Danker, M. Understanding stakeholder activism, managing transparency risk. In The Governance of Risk; Emerald Group Publishing Limited: Bingley, UK, 2013; pp. 33–72. [Google Scholar]
- Baraibar-Diez, E.; Odriozola, M.D.; Sánchez, J.L.F. Transparency through European corporate governance codes. Int. J. Discl. Gov. 2016, 13, 244–261. [Google Scholar] [CrossRef]
- Colquitt, J.A.; Scott, B.A.; LePine, J.A. Trust, trustworthiness, and trust propensity: A meta-analytic test of their unique relationships with risk taking and job performance. J. Appl. Psychol. 2007, 92, 909. [Google Scholar] [CrossRef]
- Ramírez, Y.; Tejada, Á. Corporate governance of universities: Improving transparency and accountability. Int. J. Discl. Gov. 2018, 15, 29–39. [Google Scholar] [CrossRef]
- Spanhove, J.; Verhoest, K. Corporate Governance vs. Government Governance: Translation or Adaptation? In Proceedings of the EIASM Workshop on Corporate Governance, Brussels, Belgium, 15–16 Novermber 2007. [Google Scholar]
- Najib Razali, M.; Mohd Adnan, Y. Transparency in Malaysian property companies. Prop. Manag. 2012, 30, 398–415. [Google Scholar] [CrossRef]
- Abdullah Saif Alnasser, S.; Muhammed, J. Introduction to corporate governance from Islamic perspective. Humanomics 2012, 28, 220–231. [Google Scholar] [CrossRef]
- Kyereboah-Coleman, A.; Biekpe, N. The link between corporate governance and performance of the non-traditional export sector: Evidence from Ghana. Corp. Gov. Int. J. Bus. Soc. 2006, 6, 609–623. [Google Scholar] [CrossRef]
- Akkermans, H.; Bogerd, P.; Van Doremalen, J. Travail, transparency and trust: A case study of computer-supported collaborative supply chain planning in high-tech electronics. Eur. J. Oper. Res. 2004, 153, 445–456. [Google Scholar] [CrossRef]
- Lejárraga, I.; Shepherd, B.; van Tongeren, F. 4 Transparency in Nontariff Measures: Effects on Agricultural Trade. In Nontariff Measures with Market Imperfections: Trade and Welfare Implications; Emerald Group Publishing Limited: Bingley, UK, 2013; pp. 99–125. [Google Scholar]
- Wene, C.-O.; Espejo, R. A meaning for transparency in decision processes. In Proceedings of the VALDOR Symposium on Values in Decisions on Risk, Stockholm, Sweden, 13–17 June 1999; pp. 404–421. [Google Scholar]
- Pike, J. What Does It Mean to Be Accountable? Available online: https://metova.com/what-does-it-mean-to-be-accountable/ (accessed on 2 April 2019).
- Rawlins, B.R. Measuring the relationship between organizational transparency and employee trust. 2008. [Google Scholar]
- McGrath, S.K.; Whitty, S.J. Accountability and responsibility defined. Int. J. Manag. Proj. Bus. 2018, 11, 687–707. [Google Scholar] [CrossRef] [Green Version]
- Bracci, E. Accountability and governance in social care: The impact of personalisation. Qual. Res. Acc. Manag. 2014, 11, 111–128. [Google Scholar] [CrossRef]
- Andreaus, M.; Costa, E.; Parker, L.D. Accountability and Social Accounting for Social and Non-Profit Organizations; Emerald Group Publishing: Bingley, UK, 2014. [Google Scholar]
- Soobaroyen, T.; Devi Mahadeo, J. Do corporate governance codes improve board accountability? Evidence from an emerging economy. Qual. Res. Acc. Manag. 2012, 9, 337–362. [Google Scholar] [CrossRef]
- Agyemang, G.; Ryan, B. Accountability and performance management systems within private and public sector organisational change processes. In Managing Reality: Accountability and the Miasma of Private and Public Domains; Emerald Group Publishing Limited: Bingley, UK, 2013; pp. 1–38. [Google Scholar]
- Jarvis, M.D. The black box of bureaucracy: Interrogating accountability in the public service. Aust. J. Public Adm. 2014, 73, 450–466. [Google Scholar] [CrossRef]
- Dellaportas, S.; Langton, J.; West, B. Governance and accountability in Australian charitable organisations: Perceptions from CFOs. Int. J. Acc. Inf. Manag. 2012, 20, 238–254. [Google Scholar] [CrossRef]
- Poppo, L.; Schepker, D.J. Repairing public trust in organizations. Corp. Reput. Rev. 2010, 13, 124–141. [Google Scholar] [CrossRef]
- Thomas, C.W. Maintaining and restoring public trust in government agencies and their employees. Adm. Soc. 1998, 30, 166–193. [Google Scholar] [CrossRef]
- McKnight, D.H.; Cummings, L.L.; Chervany, N.L. Initial trust formation in new organizational relationships. Acad. Manag. Rev. 1998, 23, 473–490. [Google Scholar] [CrossRef]
- Johnson-George, C.; Swap, W.C. Measurement of specific interpersonal trust: Construction and validation of a scale to assess trust in a specific other. J. Personal. Soc. Psychol. 1982, 43, 1306. [Google Scholar] [CrossRef]
- Mayer, R.C.; Davis, J.H.; Schoorman, F.D. An integrative model of organizational trust. Acad. Manag. Rev. 1995, 20, 709–734. [Google Scholar] [CrossRef]
- Porter, L.W.; Lawler, E.E.; Hackman, J.R. Behavior in Organizations; McGraw-Hill: New York, NY, USA, 1975. [Google Scholar]
- McAllister, D.J. Affect-and cognition-based trust as foundations for interpersonal cooperation in organizations. Acad. Manag. J. 1995, 38, 24–59. [Google Scholar]
- Channuntapipat, C. Assurance for service organisations: Contextualising accountability and trust. Manag. Audit. J. 2017, 33, 340–359. [Google Scholar] [CrossRef]
- Bradach, J.L.; Eccles, R.G. Price, authority, and trust: From ideal types to plural forms. Annu. Rev. Sociol. 1989, 15, 97–118. [Google Scholar] [CrossRef]
- Lu, Q.; Goh, M.; de Souza, R. An Empirical Investigation of Swift Trust in Humanitarian Logistics Operations. In The Palgrave Handbook of Humanitarian Logistics and Supply Chain Management; Springer: Berlin/Heidelberg, Germany, 2018; pp. 279–296. [Google Scholar]
- Nooteboom, B.; Berger, H.; Noorderhaven, N.G. Effects of trust and governance on relational risk. Acad. Manag. J. 1997, 40, 308–338. [Google Scholar]
- Sako, M.; Helper, S. Determinants of trust in supplier relations: Evidence from the automotive industry in Japan and the United States. J. Econ. Behav. Organ. 1998, 34, 387–417. [Google Scholar] [CrossRef] [Green Version]
- Dyer, J.H.; Chu, W. The role of trustworthiness in reducing transaction costs and improving performance: Empirical evidence from the United States, Japan, and Korea. Organ. Sci. 2003, 14, 57–68. [Google Scholar] [CrossRef]
- Katsikeas, C.S.; Skarmeas, D.; Bello, D.C. Developing successful trust-based international exchange relationships. J. Int. Bus. Stud. 2009, 40, 132–155. [Google Scholar] [CrossRef]
- Cullen, J.B.; Johnson, J.L.; Sakano, T. Success through commitment and trust: The soft side of strategic alliance management. J. World Bus. 2000, 35, 223–240. [Google Scholar] [CrossRef]
- Allen, M.R.; George, B.A.; Davis, J.H. A model for the role of trust in firm level performance: The case of family businesses. J. Bus. Res. 2018, 84, 34–45. [Google Scholar] [CrossRef]
- Panayides, P.M.; Lun, Y.V. The impact of trust on innovativeness and supply chain performance. Int. J. Prod. Econ. 2009, 122, 35–46. [Google Scholar] [CrossRef]
- Capaldo, A.; Giannoccaro, I. How does trust affect performance in the supply chain? The moderating role of interdependence. Int. J. Prod. Econ. 2015, 166, 36–49. [Google Scholar] [CrossRef]
- Sarkar, M.B.; Echambadi, R.; Cavusgil, S.T.; Aulakh, P.S. The influence of complementarity, compatibility, and relationship capital on alliance performance. J. Acad. Mark. Sci. 2001, 29, 358–373. [Google Scholar] [CrossRef]
- Lyles, M.A.; Sulaiman, M.; Barden, J.Q.; Awang Kechik, A. Factors affecting international joint venture performance: A study of Malaysian joint ventures. J. Asian Bus. 1999, 15, 1–20. [Google Scholar]
- Saunders, M.; Lewis, P.; Thornhill, A. Research Methods for Business Students; Pearson Education: Upper Saddle River, NJ, USA, 2009. [Google Scholar]
- Patton, M.Q. Qualitative Evaluation and Research Methods; Sage Publications, Inc: Newbury Park, CA, USA, 1990. [Google Scholar]
- Hoelter, J.W. The analysis of covariance structures: Goodness-of-fit indices. Sociol. Methods Res. 1983, 11, 325–344. [Google Scholar] [CrossRef]
- Garver, M.S.; Mentzer, J.T. Logistics research methods: Employing structural equation modeling to test for construct validity. J. Bus. Logist. 1999, 20, 33. [Google Scholar]
- Sivo, S.A.; Fan, X.; Witta, E.L.; Willse, J.T. The search for “optimal” cutoff properties: Fit index criteria in structural equation modeling. J. Exp. Educ. 2006, 74, 267–288. [Google Scholar] [CrossRef]
- Nurunnabi, M.; Kamrul Islam, S. Accountability in the Bangladeshi privatized healthcare sector. Int. J. Health Care Qual. Assur. 2012, 25, 625–644. [Google Scholar] [CrossRef]
- Narang, R. Measuring perceived quality of health care services in India. Int. J. Health Care Qual. Assur. 2010, 23, 171–186. [Google Scholar] [CrossRef]
- Elbeck, M. An approach to client satisfaction measurement as an attribute of health service quality. Health Care Manag. Rev. 1987, 12, 47–52. [Google Scholar] [CrossRef]
- Dawes, J. Do data characteristics change according to the number of scale points used? An experiment using 5-point, 7-point and 10-point scales. Int. J. Mark. Res. 2008, 50, 61–104. [Google Scholar] [CrossRef]
- Grussing, P.G.; Valuck, R.J.; Williams, R.G. Development and validation of behaviorally-anchored rating scales for student evaluation of pharmacy instruction. Am. J. Pharm. Educ. 1994, 58, 25–37. [Google Scholar]
- Smith, A.; Graetz, B.; Westerbeek, H. Sport sponsorship, team support and purchase intentions. J. Mark. Commun. 2008, 14, 387–404. [Google Scholar] [CrossRef]
- Oseni, U.A.; Adewale, A.; Zain, N.R.B.M. Customers’ perceptions on the dispute resolution clauses in Islamic finance contracts in Malaysia. Rev. Financ. Econ. 2016, 31, 89–98. [Google Scholar] [CrossRef]
- Owusu-Kwateng, K.; Abdul Hamid, M.; Debrah, B. Disaster relief logistics operation: An insight from Ghana. Int. J. Emerg. Serv. 2017, 6, 4–13. [Google Scholar] [CrossRef]
- Henseler, J.; Ringle, C.M.; Sarstedt, M. Using partial least squares path modeling in advertising research: Basic concepts and recent issues. In Handbook of Research on International Advertising; Edward Elgar: Cheltenham, UK, 2012; p. 252. [Google Scholar]
- De Winter, J.C.; Dodou, D. Common factor analysis versus principal component analysis: A comparison of loadings by means of simulations. Commun. Stat. Simul. Comput. 2016, 45, 299–321. [Google Scholar] [CrossRef]
- Cohen, J. Statistical Power Analysis for the Behavioral Sciences, 2nd ed.; Erlbaum Associates: Hillsdale, NJ, USA, 1988. [Google Scholar]
- Ringle, C.M.; Da Silva, D.; Bido, D.d.S. Modelagem de equações estruturais com utilização do SmartPLS. Rev. Bras. Mark. 2014, 13, 56–73. [Google Scholar]
- Henseler, J.; Ringle, C.M.; Sarstedt, M. A new criterion for assessing discriminant validity in variance-based structural equation modeling. J. Acad. Mark. Sci. 2015, 43, 115–135. [Google Scholar] [CrossRef]
- Chin, W.W. The partial least squares approach to structural equation modeling. Mod. Methods Bus. Res. 1998, 295, 295–336. [Google Scholar]
- Hair, J.F., Jr.; Matthews, L.M.; Matthews, R.L.; Sarstedt, M. PLS-SEM or CB-SEM: Updated guidelines on which method to use. Int. J. Multivar. Data Anal. 2017, 1, 107–123. [Google Scholar] [CrossRef]
- Hair, J.F.; Black, W.C.; Babin, B.J.; Anderson, R.E.; Tatham, R.L. Análise Multivariada de Dados; Bookman Editora: Porto Alegre, Brazilian, 2009. [Google Scholar]
- Daskalakis, S.; Mantas, J. Evaluating the impact of a service-oriented framework for healthcare interoperability. Stud. Health Technol. Inform. 2008, 136, 285. [Google Scholar]
- Neuman, S.P. Generalized scaling of permeabilities: Validation and effect of support scale. Geophys. Res. Lett. 1994, 21, 349–352. [Google Scholar] [CrossRef]
- Fornell, C.; Larcker, D.F. Evaluating structural equation models with unobservable variables and measurement error. J. Mark. Res. 1981, 18, 39–50. [Google Scholar] [CrossRef]
- Voorhees, C.M.; Brady, M.K.; Calantone, R.; Ramirez, E. Discriminant validity testing in marketing: An analysis, causes for concern, and proposed remedies. J. Acad. Mark. Sci. 2016, 44, 119–134. [Google Scholar] [CrossRef]
- Gold, A.H.; Malhotra, A.; Segars, A.H. Knowledge management: An organizational capabilities perspective. J. Manag. Inf. Syst. 2001, 18, 185–214. [Google Scholar] [CrossRef]
- Teo, T.S.; Srivastava, S.C.; Jiang, L. Trust and electronic government success: An empirical study. J. Manag. Inf. Syst. 2008, 25, 99–132. [Google Scholar] [CrossRef]
- Clark Williams, C. Toward a taxonomy of corporate reporting strategies. J. Bus. Commun. 2008, 45, 232–264. [Google Scholar] [CrossRef]
- Kline, R.B. Principles and Practice of Structural Equation Modeling; Guilford Publications: New York, NY, USA, 2015. [Google Scholar]
- Al-Jabri, I.M.; Roztocki, N. Adoption of ERP systems: Does information transparency matter? Telemat. Inform. 2015, 32, 300–310. [Google Scholar] [CrossRef]
- Klem, L. Structural Equation Modeling; American Psychological Association: Washington, DC, USA, 2000. [Google Scholar]
- Hu, L.-T.; Bentler, P.M. Fit indices in covariance structure modeling: Sensitivity to underparameterized model misspecification. Psychol. Methods 1998, 3, 424. [Google Scholar] [CrossRef]
- Bentler, P.M.; Bonett, D.G. Significance tests and goodness of fit in the analysis of covariance structures. Psychol. Bull. 1980, 88, 588. [Google Scholar] [CrossRef]
- Lohmoeller, J.-B. Latent Variable Path Analysis with Partial Least Squares; Physica-Verlag: Heidelberg, Germany, 1989. [Google Scholar]
- Joseph, F.H., Jr.; Black, W.C.; Babin, B.J.; Anderson, R.E. Multivariate Data Analysis; Prentice Hall: Upper Saddle River, NJ, USA, 2010. [Google Scholar]
- Anwar, M.; Zaman Khan, S.; Ali Shah, S.Z. A Study of the Relationship Between Innovation and Performance Among NPOs in Pakistan. J. Soc. Serv. Res. 2018. [Google Scholar] [CrossRef]
- Khan, M.; Lee, H.Y.; Bae, J.H. Inward Foreign Direct Investment: A Case Study of Pakistan. Mediterr. J. Soc. Sci. 2018, 9, 63. [Google Scholar] [CrossRef]
Figure 1.
Model and working hypotheses.

Figure 2.
Pearson’s coefficients with the values of R Square.

Figure 3.
Reliability with the values of Cronbach’s alpha.

Figure 4.
Reliability with the values of the composite reliability.

Figure 5.
Convergent validity with the average variance extracted (AVE) values.

Figure 6.
Validity analysis (heterotrait-monotrait ratio) of the measurement model.

Figure 7.
Testing (T-statistics value).


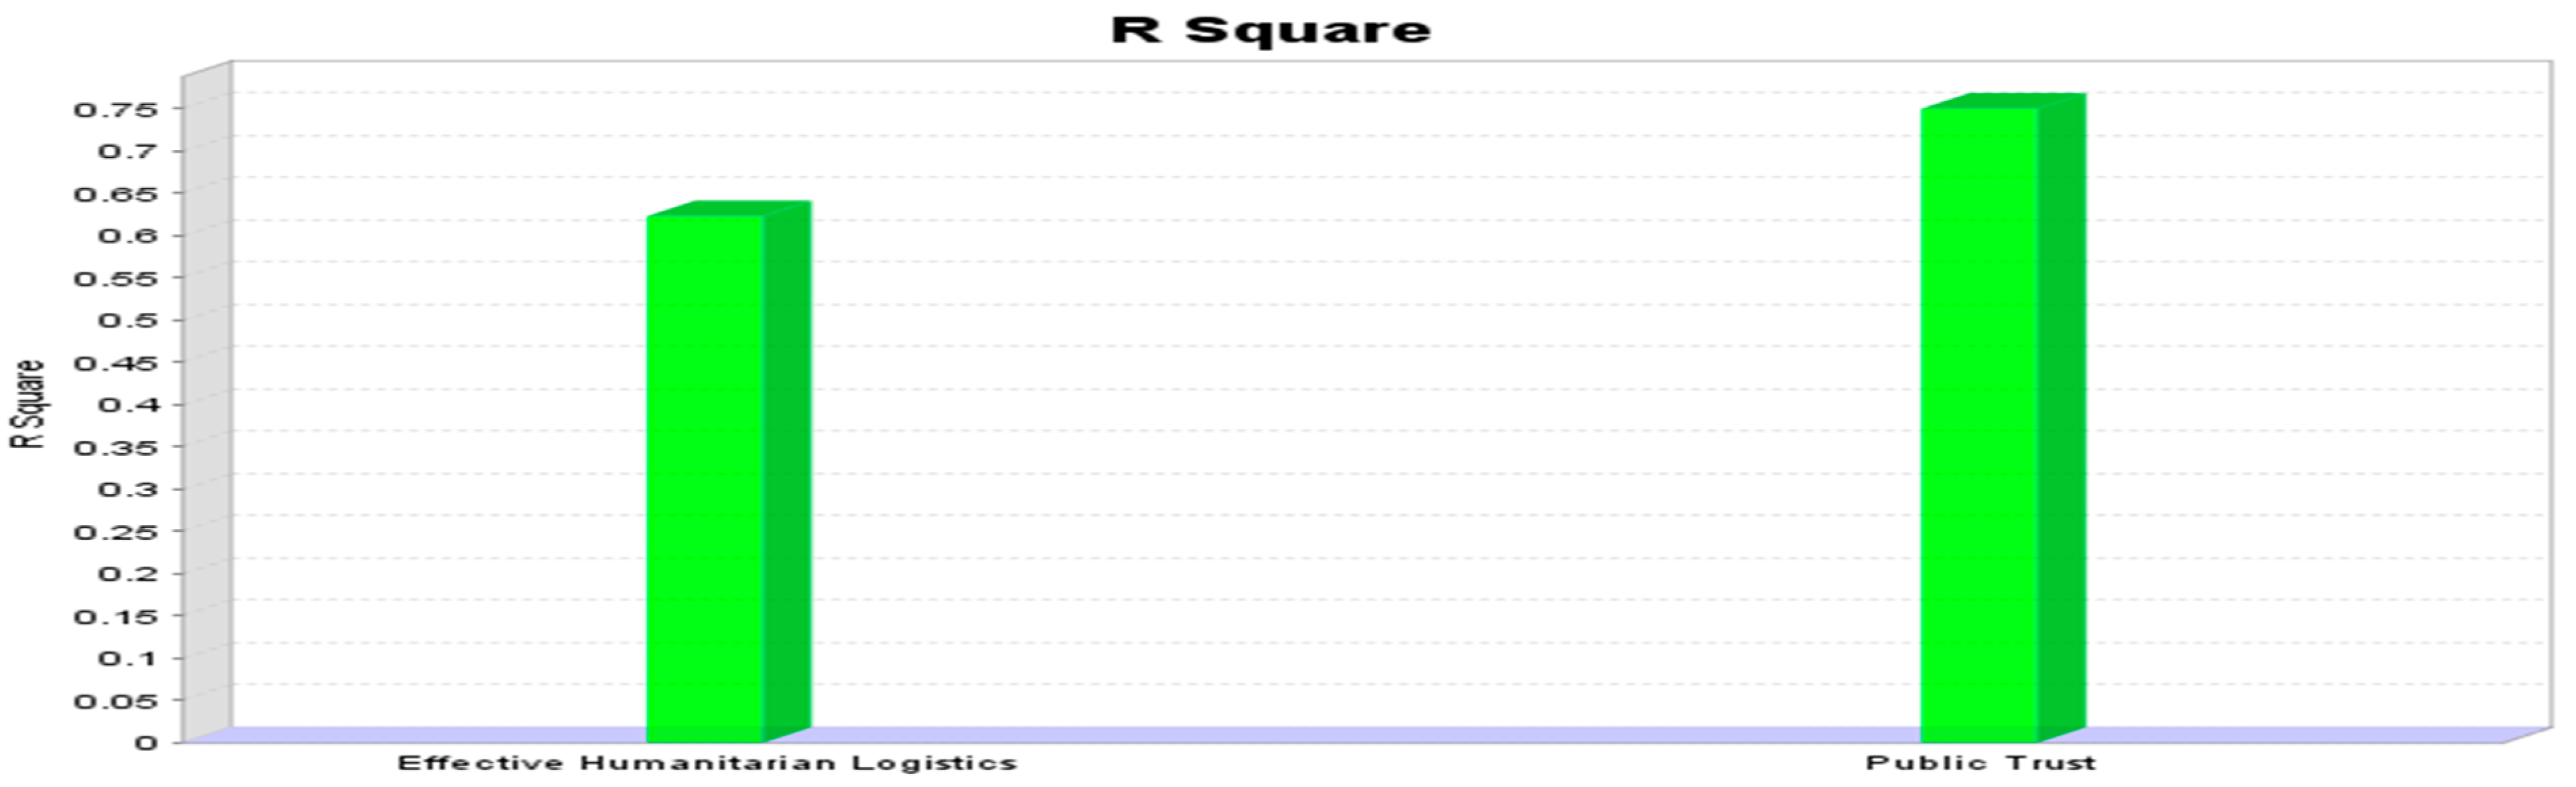
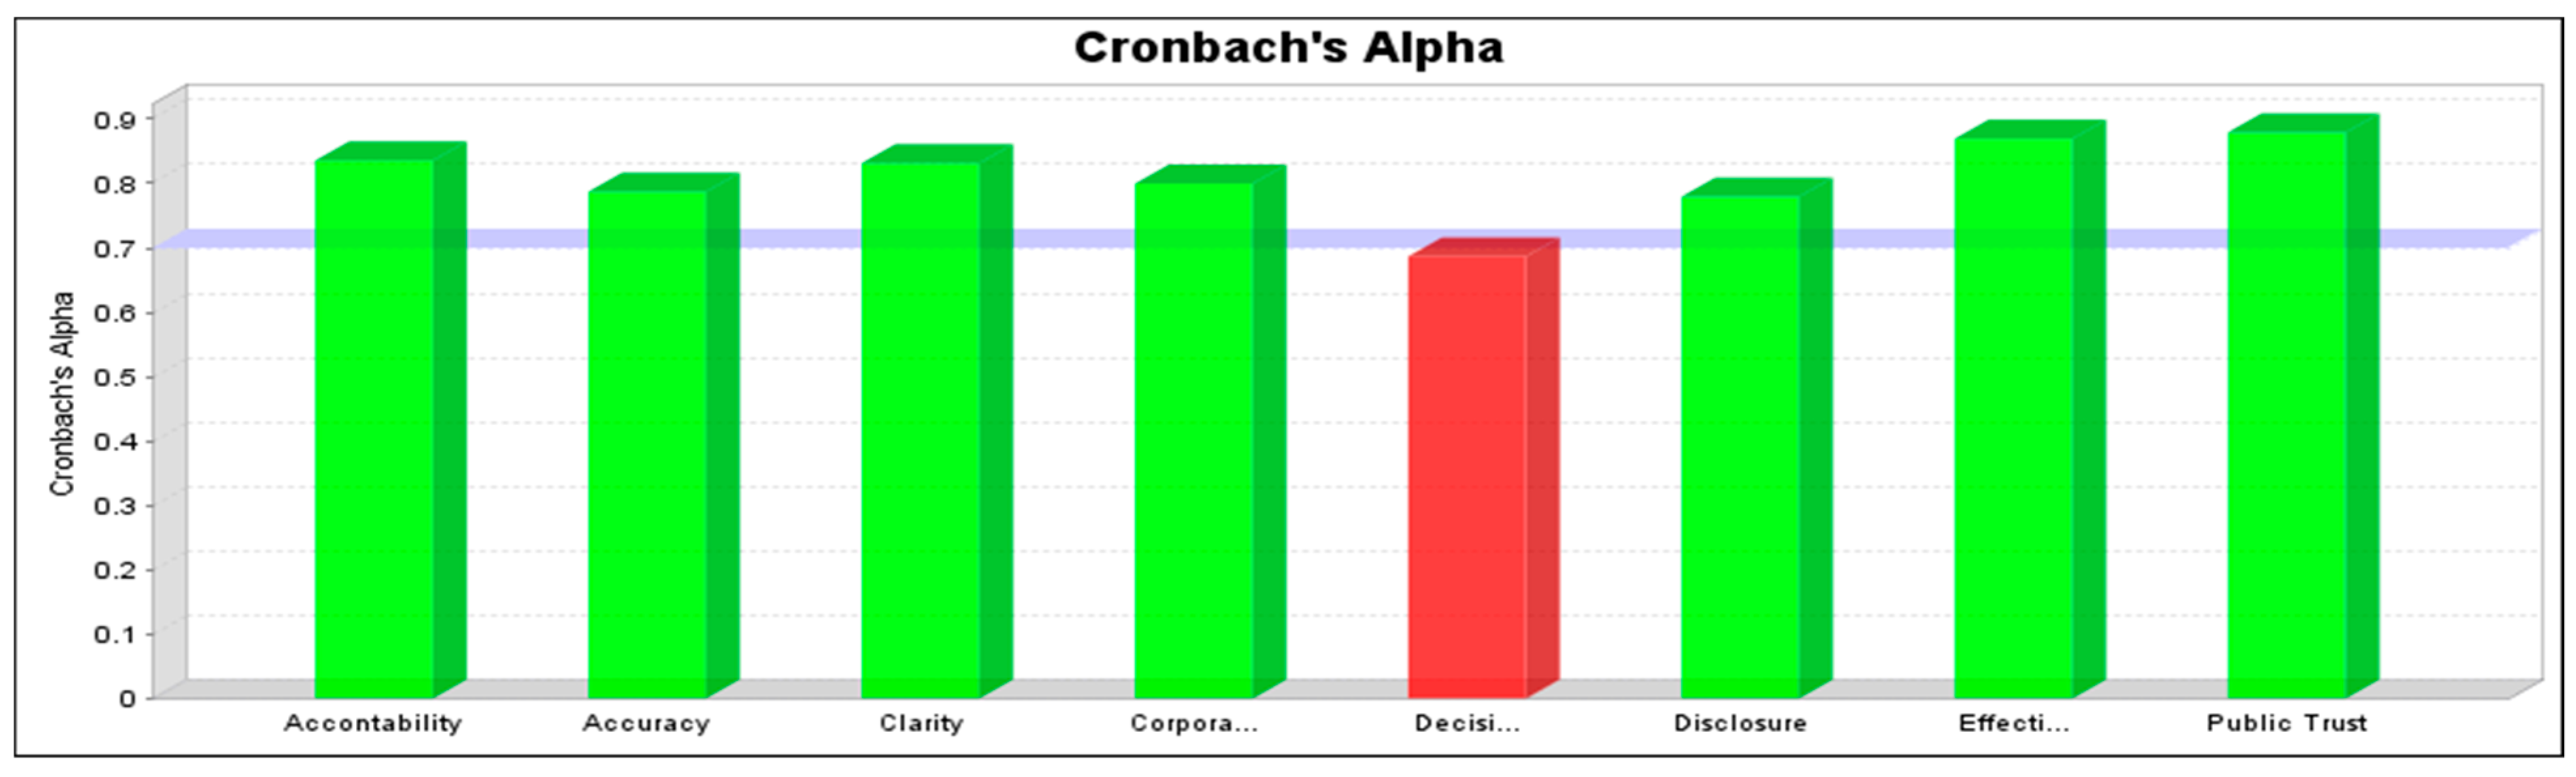
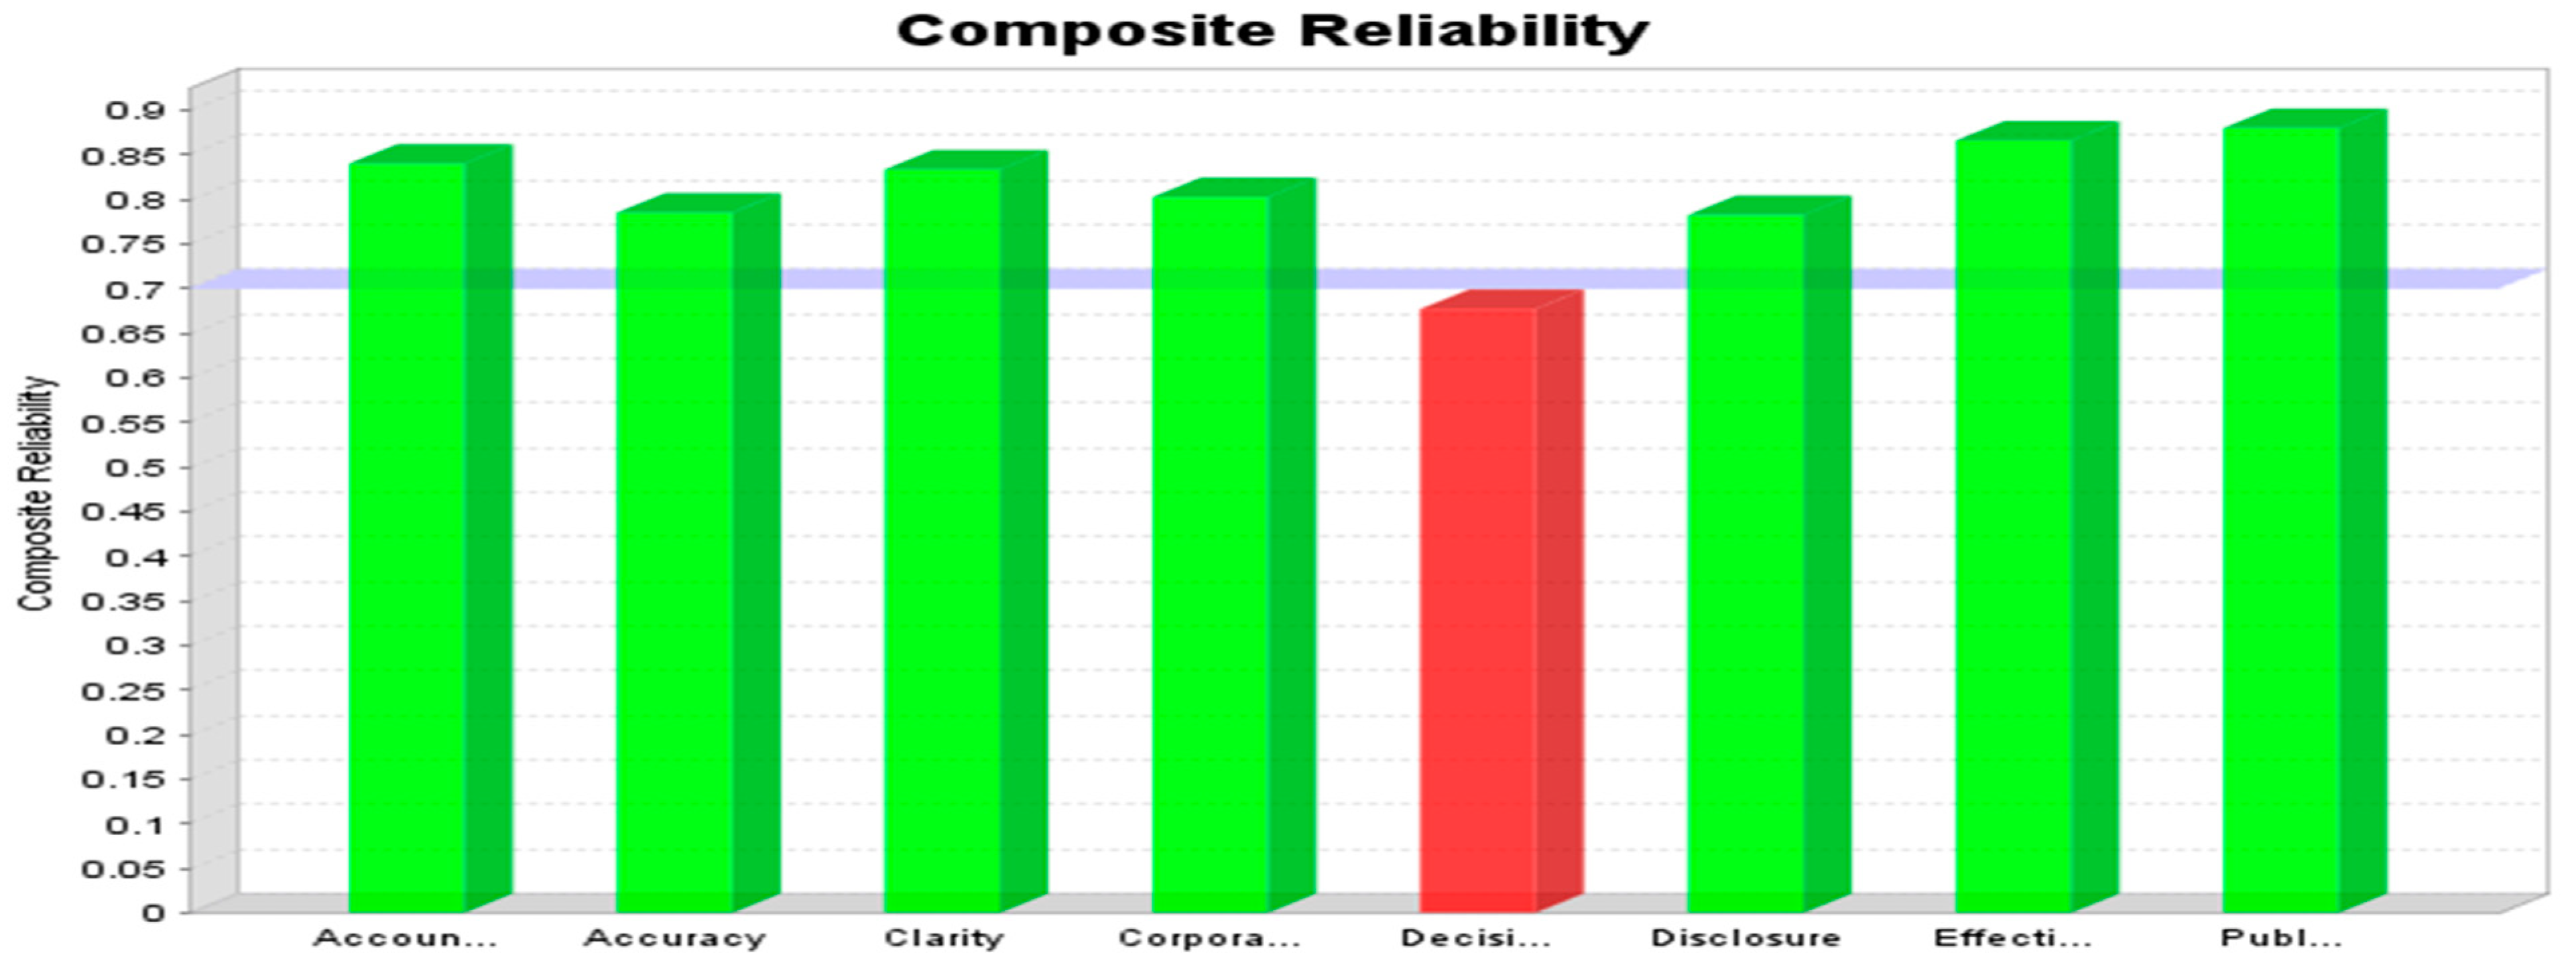
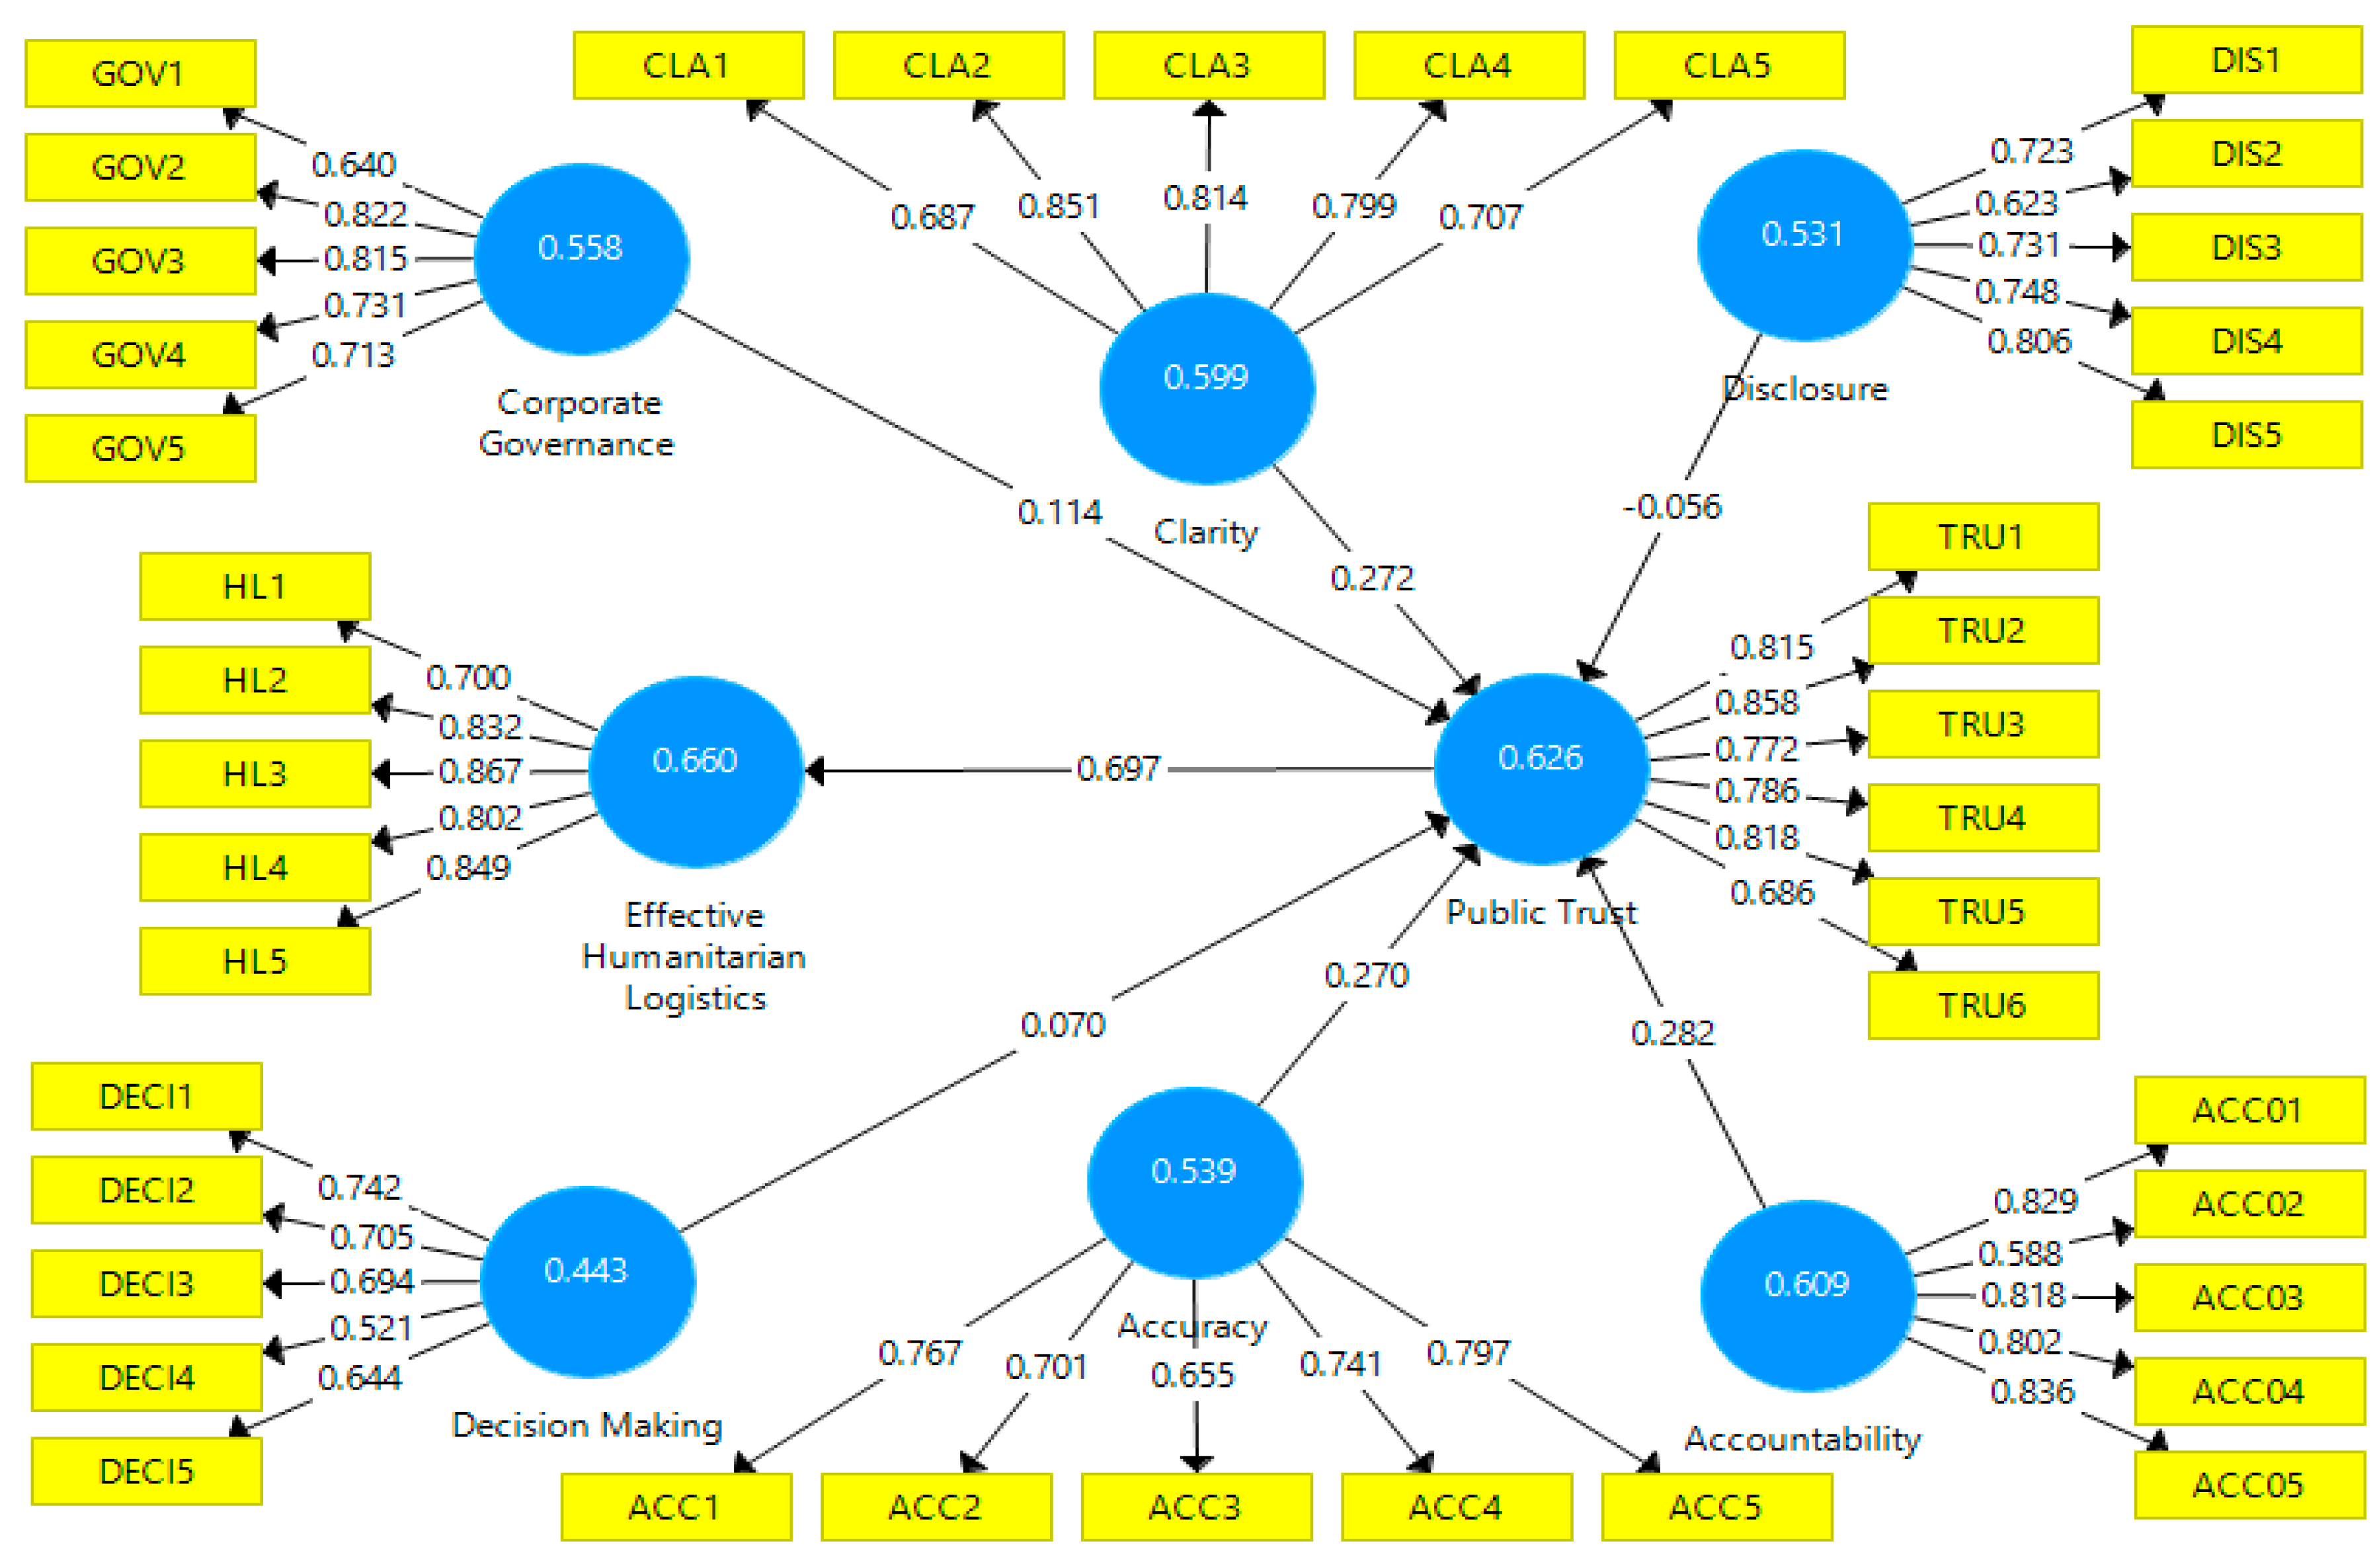
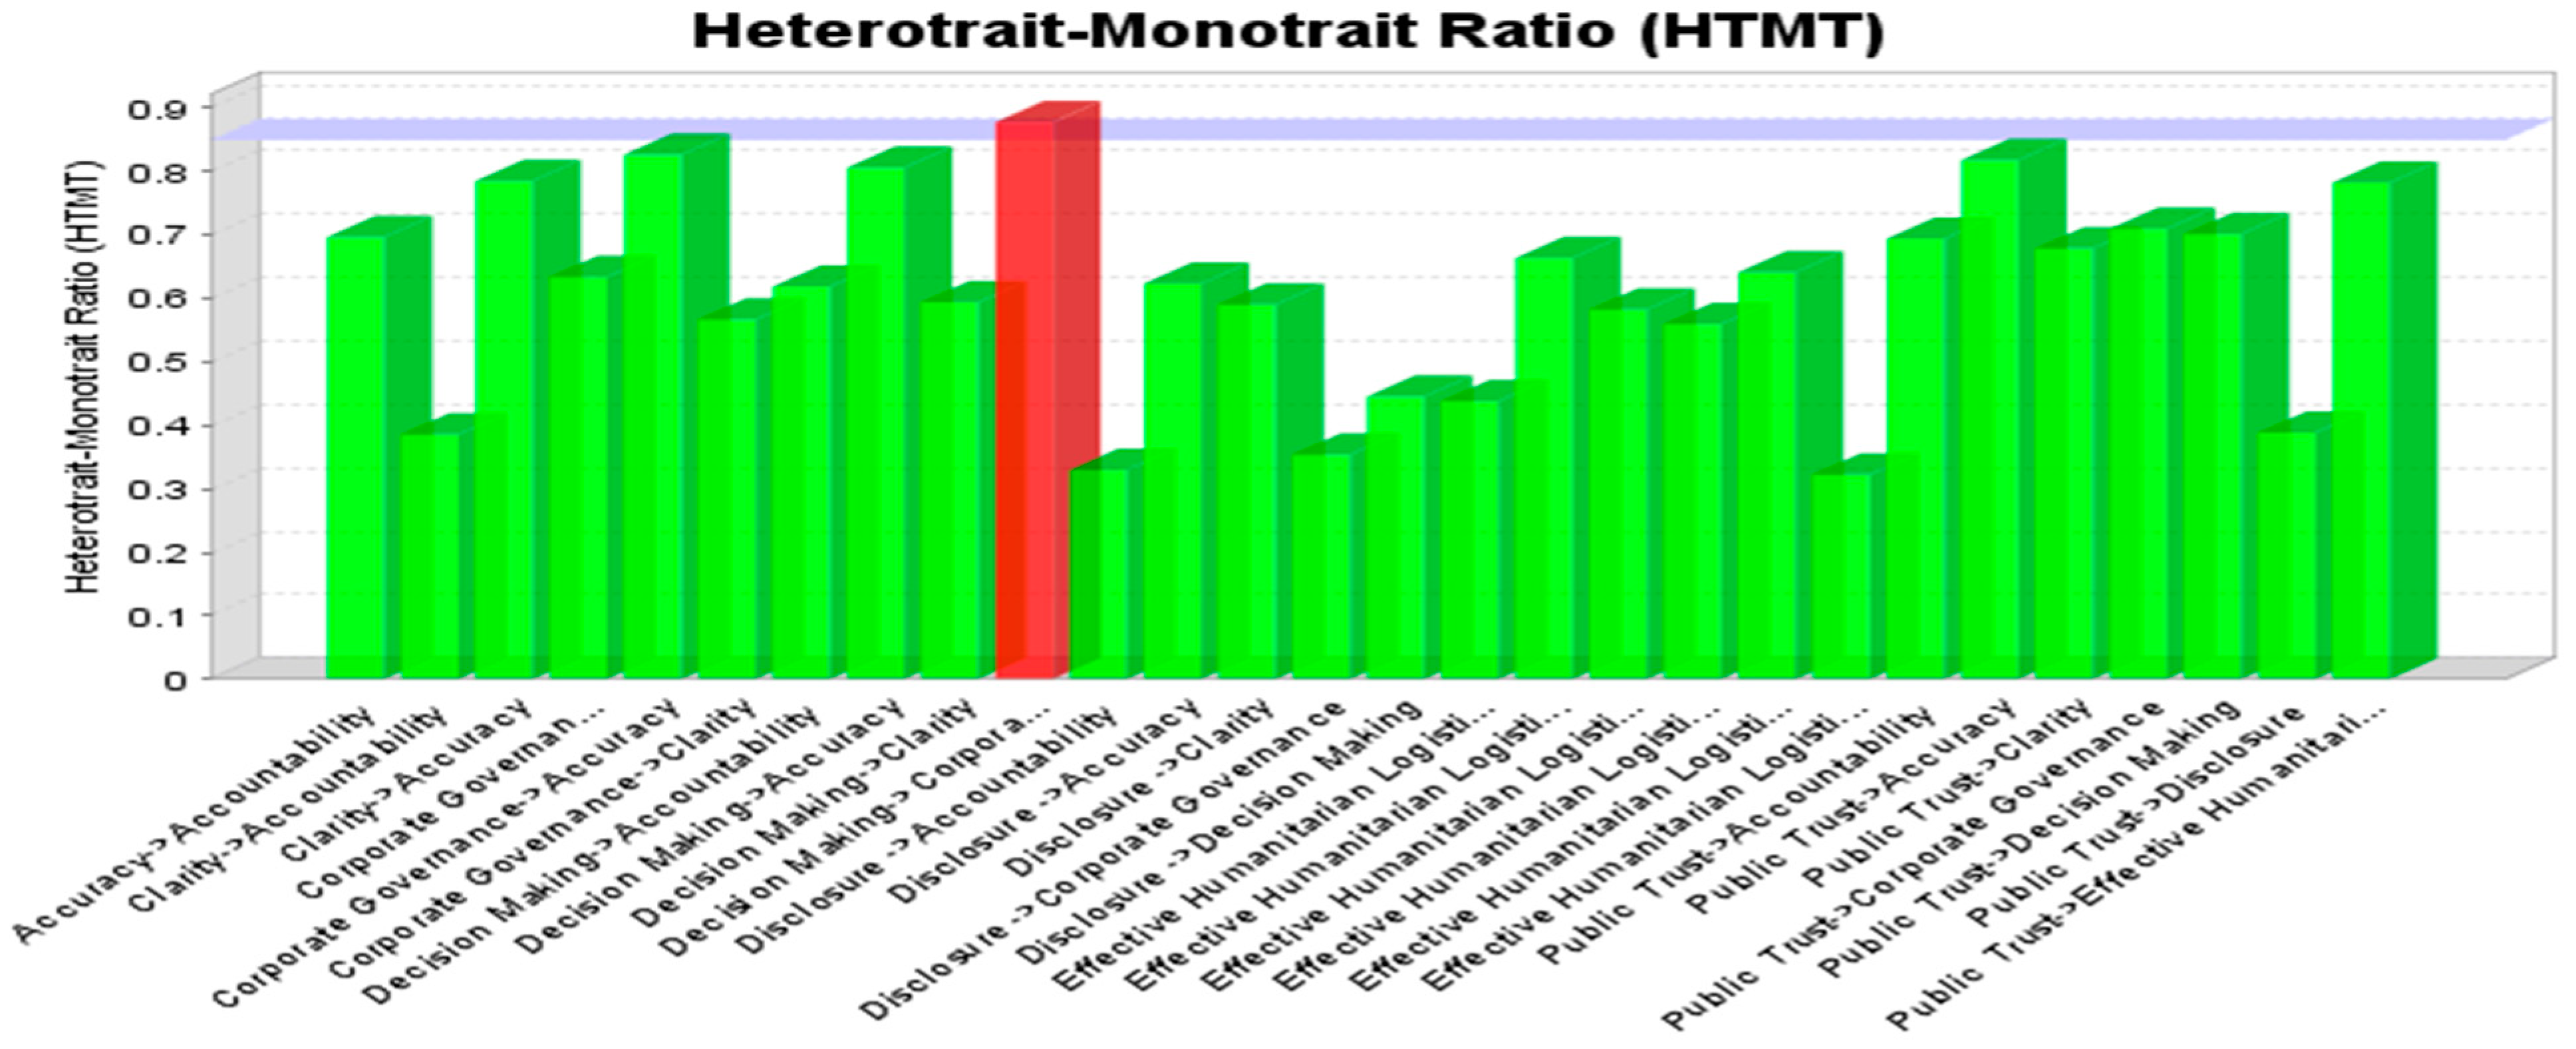
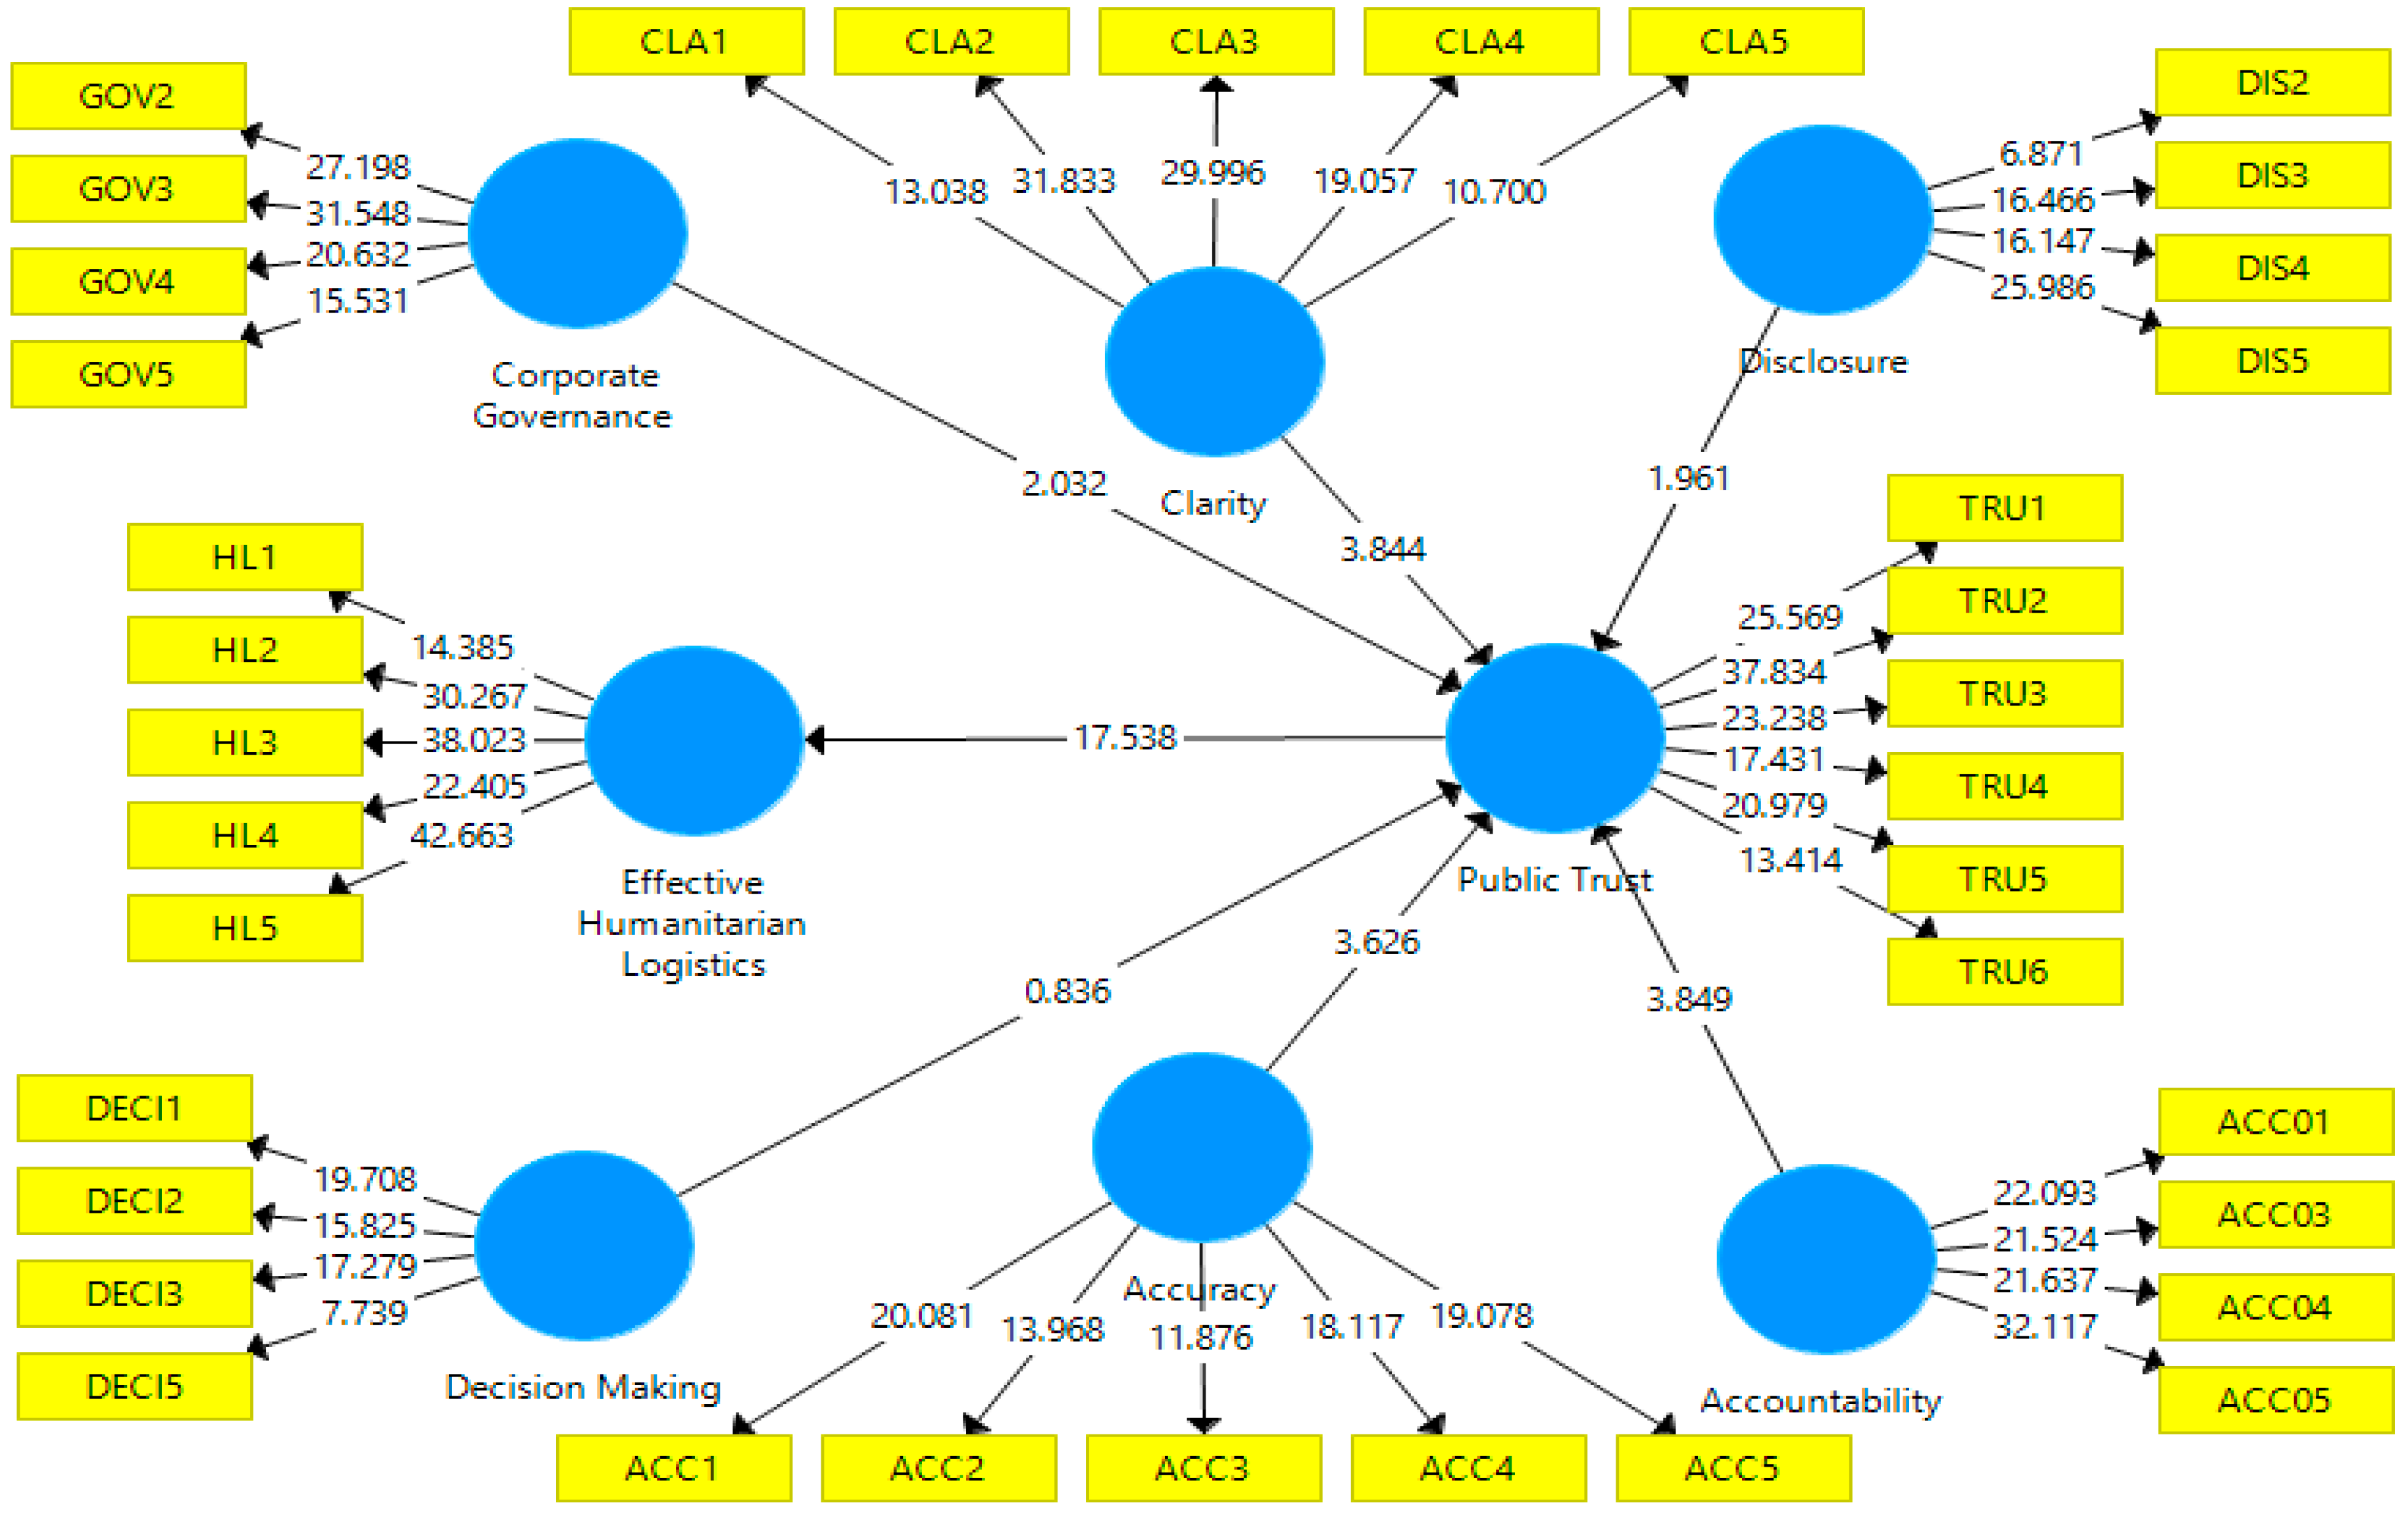
Table 1.
Adjustment quality for the SEM model.
| Construct Reliability and Validity | |||||
|---|---|---|---|---|---|
| R Square | R Square Adjusted | Cronbach’s Alpha | Composite Reliability (CR) | Average Variance Extracted (AVE) | |
| Accountability | 0.84 | 0.84 | 0.61 | ||
| Accuracy | 0.79 | 0.78 | 0.54 | ||
| Clarity | 0.83 | 0.83 | 0.60 | ||
| Corporate Governance | 0.80 | 0.80 | 0.56 | ||
| Decision Making | 0.69 | 0.68 | 0.44 | ||
| Disclosure | 0.78 | 0.77 | 0.53 | ||
| Effective Humanitarian Logistics | 0.63 | 0.63 | 0.87 | 0.87 | 0.66 |
| Public Trust | 0.75 | 0.74 | 0.88 | 0.88 | 0.63 |
Table 2.
Validity Analysis (Fornell-Larcker criterion) of the Measurement Model.
| Accountability | Accuracy | Clarity | Corporate Governance | Decision Making | Disclosure | Effective Humanitarian Logistics | Public Trust | |
|---|---|---|---|---|---|---|---|---|
| Accountabilit | 0.78 | |||||||
| Accuracy | 0.58 | 0.73 | ||||||
| Clarity | 0.33 | 0.64 | 0.77 | |||||
| Corporate Governance | 0.52 | 0.67 | 0.46 | 0.75 | ||||
| Decision Making | 0.47 | 0.62 | 0.47 | 0.66 | 0.67 | |||
| Disclosure | 0.27 | 0.47 | 0.47 | 0.28 | 0.33 | 0.73 | ||
| Effective Humanitarian Logistics | 0.39 | 0.56 | 0.51 | 0.47 | 0.51 | 0.27 | 0.81 | |
| Public Trust | 0.60 | 0.70 | 0.60 | 0.60 | 0.56 | 0.33 | 0.70 | 0.79 |
Table 3.
Normed fit index (NFI) Goodness of Fit of Measurement Model.
| Saturated Model | Estimated Model | |
|---|---|---|
| SRMR | 0.069 | 0.070 |
| NFI | 0.685 | 0.683 |
Table 4.
Theta.
| rms Theta | |
| rms Theta | 0.12 |
Table 5.
Statistics variance inflation factor (VIF) Analyses.
| Outer Variance Inflation Factor (VIF) Value | |||||||||||||||
|---|---|---|---|---|---|---|---|---|---|---|---|---|---|---|---|
| VIF | VIF | VIF | VIF | VIF | VIF | VIF | VIF | ||||||||
| ACC01 | 2.12 | CLA1 | 1.72 | DIS1 | 1.37 | HL1 | 1.48 | ACC1 | 1.53 | DECI1 | 1.47 | GOV1 | 1.31 | TRU1 | 2.29 |
| ACC02 | 1.36 | CLA2 | 2.38 | DIS2 | 1.34 | HL2 | 2.28 | ACC2 | 1.51 | DECI2 | 1.38 | GOV2 | 1.97 | TRU2 | 2.69 |
| ACC03 | 2.01 | CLA3 | 1.82 | DIS3 | 1.72 | HL3 | 2.90 | ACC3 | 1.51 | DECI3 | 1.29 | GOV3 | 1.88 | TRU3 | 1.79 |
| ACC04 | 2.03 | CLA4 | 1.96 | DIS4 | 2.07 | HL4 | 2.33 | ACC4 | 1.51 | DECI4 | 1.49 | GOV4 | 1.45 | TRU4 | 2.14 |
| ACC05 | 2.09 | CLA5 | 1.61 | DIS5 | 1.91 | HL5 | 2.34 | ACC5 | 1.76 | DECI5 | 1.62 | GOV5 | 1.47 | TRU5 | 2.31 |
| TRU6 | 1.49 | ||||||||||||||
Table 6.
The indicators of the predictive validity (Q2) r Stone–Geisser indicator.
| Construct Crossvalidated Redundancy | |||
|---|---|---|---|
| SSO | SSE | Q² (= 1-SSE/SSO) | |
| Accountability | 1050.00 | 1050.00 | |
| Accuracy | 1050.00 | 1050.00 | |
| Clarity | 1050.00 | 1050.00 | |
| Corporate Governance | 1050.00 | 1050.00 | |
| Decision Making | 1050.00 | 1050.00 | |
| Disclosure | 1050.00 | 1050.00 | |
| Effective Humanitarian Logistics | 1050.00 | 739.53 | 0.30 |
| Public Trust | 1260.00 | 818.92 | 0.35 |
Table 7.
The Findings Supportive of the Study Hypotheses.
| Path Coefficients | ||||||
|---|---|---|---|---|---|---|
| Mean, STDEV, T-Values, P-Values | ||||||
| Original Sample | Sample Mean | STDEV | T Statistics | P Values | Supported? | |
| Disclosure ≥ Public Trust (H1) | −0.08 | -0.07 | 0.04 | 1.96 | 0.05 | Yes |
| Clarity ≥ Public Trust (H2) | 0.28 | 0.28 | 0.07 | 3.9 | 0 | Yes |
| Accuracy ≥ Public Trust (H3) | 0.27 | 0.27 | 0.08 | 3.56 | 0 | Yes |
| C-Governance ≥ Public Trust (H4) | 0.15 | 0.15 | 0.07 | 2.22 | 0.03 | Yes |
| Decision Making ≥ Public Trust (H5) | 0.03 | 0.03 | 0.07 | 0.38 | 0.71 | No |
| Accountability ≥ Public Trust (H6) | 0.29 | 0.29 | 0.07 | 4.04 | 0 | yes |
| Public Trust ≥ Effective HL (H7) | 0.7 | 0.7 | 0.04 | 18.05 | 0 | yes |
© 2019 by the authors. Licensee MDPI, Basel, Switzerland. This article is an open access article distributed under the terms and conditions of the Creative Commons Attribution (CC BY) license (http://creativecommons.org/licenses/by/4.0/).
Share and Cite
MDPI and ACS Style
Khan, M.; Lee, H.Y.; Bae, J.H. The Role of Transparency in Humanitarian Logistics. Sustainability 2019, 11, 2078. https://0-doi-org.brum.beds.ac.uk/10.3390/su11072078
AMA Style
Khan M, Lee HY, Bae JH. The Role of Transparency in Humanitarian Logistics. Sustainability. 2019; 11(7):2078. https://0-doi-org.brum.beds.ac.uk/10.3390/su11072078
Chicago/Turabian StyleKhan, Muhammad, Hee Yong Lee, and Jung Han Bae. 2019. "The Role of Transparency in Humanitarian Logistics" Sustainability 11, no. 7: 2078. https://0-doi-org.brum.beds.ac.uk/10.3390/su11072078
Note that from the first issue of 2016, this journal uses article numbers instead of page numbers. See further details here.