Defying the Footprint Oracle: Implications of Country Resource Trends


1
Global Footprint Network, 426 17th Street, Suite 700, Oakland, CA 94612, USA
2
Missouri Botanical Garden, 4344 Shaw Blvd, St. Louis, MO 63110, USA
*
Author to whom correspondence should be addressed.
Sustainability 2019, 11(7), 2164; https://doi.org/10.3390/su11072164
Submission received: 1 February 2019
/
Revised: 3 April 2019
/
Accepted: 4 April 2019
/
Published: 11 April 2019
Abstract
:Mainstream competitiveness and international development analyses pay little attention to the significance of a country’s resource security for its economic performance. This paper challenges this neglect, examining the economic implications of countries resource dynamics, particularly for low-income countries. It explores typologies of resource patterns in the context of those countries’ economic prospects. To begin, the paper explains why it uses Ecological Footprint and biocapacity accounting for its analysis. Data used for the analysis stem from Global Footprint Network’s 2018 edition of its National Footprint and Biocapacity Accounts. Ranging from 1961 to 2014, these accounts are computed from UN data sets. The accounts track, year by year, how much biologically productive space is occupied by people’s consumption and compare this with how much productive space is available. Both demand and availability are expressed in productivity-adjusted hectares, called global hectares. Using this biophysical accounting perspective, the paper predicts countries’ future socio-economic performance. This analysis is then contrasted with a financial assessment of those countries. The juxtaposition reveals a paradox: Financial assessments seem to contradict assessments based on biophysical trends. The paper offers a way to reconcile this paradox, which also elevates the significance of biophysical country assessments for shaping successful economic policies.
1. Introduction: Identifying a Gap in Current National Metrics
Given the strong international consensus on the climate challenge, as expressed in the Paris Agreement, or on the need for sustainable development, as laid out in the UN Sustainable Development Goals, there is a surprising lack of comprehensive national metrics that evaluate a country’s economic performance from an environmental perspective. This is particularly surprising given the century-old debate about the physical constraints for economic expansion, gaining prominence nearly two hundred years ago with Thomas Malthus’ essay on the link between economic performance and population growth [1,2,3,4].
After identifying the contradictions in the literature, this paper explains why measuring material constraints of the human economy needs to focus on biological resources as the economy’s most constrained material factor. The method section then explains why Ecological Footprint and biocapacity accounting is best positioned to measure the biological resource dependence of economies, and how such accounting align with economic events of the past. The results section then shows how these accounts distinguish resource risk-induced development patterns among low-income countries, identifying eight countries that have entered an “ecological poverty trap” and 23 more that are approaching this state.
The discussion contrasts these biophysical findings with the financial performance of countries, pointing to a fundamental paradox as these two views on countries come to seemingly fundamentally opposing conclusions. The discussion offers a perspective that reconciles the paradox. The conclusion identifies how the resource risks can be addressed, should they be accepted as primary drivers of lasting development success.
1.1. The Role of Measuring Countries’ Performances
Apart from financial measures, like GDP, analysts and decision-makers use physical metrics to track countries’ performances. Prominent measures include longevity, unemployment rates, and homicide numbers. Such measures are monitored not only for their absolute levels but also for their change over time. Unfavorable trends of these physical performance measures can generate significant media attention as did, for instance, the Centers for Disease Control and Prevention’s 2017 report documenting a decline in longevity in the US for two years in a row [5]. In fact, the 2018 report that made public a further decline in longevity did not mention that this happened for the third year in a row, possibly to avoid the negative media impact this information would have had for the current US administration [6].
These statistics are prominent because they are relevant both for society (e.g., how long will the country’s pensioners live?) and for individuals (e.g., how long might I live?). Moreover, they can be interpreted easily. For instance, higher unemployment may mean that there is an increase in employees’ risk of losing their job, a reduction in consumer confidence, an increase in businesses ability to hire employees at lower wages, etc.
There is one physical parameter of a country that is becoming ever more critical, yet is barely recognized in current economic assessments of countries: the environment. For example, the World Economic Forum’s annual competitiveness reports evaluate the “set of institutions, policies, and factors that determine a country’s productivity which in turn sets the level of prosperity that the country can achieve”. Over the last years, including in 2018, the reports have used 114 indicators grouped into 12 pillars to evaluate countries. None of these indicators address any environmental, resource or climate aspects. This contradicts their own 2018 risk report, in which CEOs identified seven out of the top 10 risks to be environmentally related [7,8].
In a world where the resource metabolism of the human enterprise is becoming large compared to the ability of the planet’s ecosystems to meet humanity’s demand, it seems reasonable to track the size of human demand compared to what ecosystems renew. This is like the logic of airplanes being equipped with fuel gauges. However, no country has a systematic appraisal of its overall demand compared to its own or the planet’s regeneration rates. They are all “flying without a fuel gauge”.
Symptoms of this overuse, or global overshoot, are becoming increasingly evident: erratic climate change, biodiversity loss, fisheries collapse, and freshwater scarcity. The recognition of global overuse, such as indications that many planetary boundaries have been transgressed [9,10], that ecosystems are under excessive pressure [11], or that the atmospheric carbon limit for a stable climate has been reached, if not exceeded [12], goes beyond academic studies. Addressing this fundamental threat is now also embedded in international agreements, such as the Paris Agreement [13], the Aichi Biodiversity Targets [14], and the Sustainable Development Goals (particularly goal 12 on sustainable production and consumption) [15].
Overuse and erosion of this planet’s natural capital is possible for some time. This erosion of resources is possible as long as natural capital assets exist that can be depleted. There is little doubt that the resulting degradation of the biosphere will undermine the ability for all people to thrive [16]. The question, however, is whether it might also impact countries’ economic performances, and whether it might do this even before it starts to significantly or irreversibly erode the wellbeing of people [17].
The purpose of this paper is to explore these possibilities. It highlights the link between resource security and economic long-term performance. By using a basic biophysical accounting approach to track each country’s resource dependence, it offers a perspective that contrast with typical financial assessments of countries’ performances.
This paper identifies a set of low-income countries where consumption is already strongly limited by inadequate resource access and resource overuse. This study also shows that many additional countries have entered, or are about to enter, this zone. Thus, this paper points out the extent to which financial metrics do not reflect this biophysical reality. This latter recognition could either mean that the resource situation is irrelevant for economic performance, or that financial metrics are blind to the fundamental resource risk countries may be exposed to.
The great likelihood that these resource risks prove to be fundamental is not an argument for fatalism. The reason is that these trends, if recognized as risk, can be avoided. However, this avoidance requires that resource security is considered an integral part of economic development strategies.
To make the case for an active pursuit of resource security, the paper explains first why the most limiting resource aspect is renewable (and not non-renewable) resources, and that, therefore, a country’ resource metabolism needs to be assessed from that perspective. The method section then explains briefly how this metabolism can be measured and, in the results section, compares the time trends for over 30 selected low-income countries. The discussion and conclusion sections draw key lessons for identifying both risks and opportunities to mitigate those risks.
1.2. The Case for Analyzing Countries’ Material Metabolism from a Biological Perspective
When human resource use is discussed in the academic literature, particularly in economics, there is little to no discussion on the topic of identifying the most resources. Robinson et al. [18] typify the general approach by declaring that “the resources we have in mind are especially those that are publicly owned such as oil, gas and other minerals”. Other examples include Sachs and Warner [19], who focus on the value of traded resources (dominated by fossil fuels), and Gylfason [20], who focuses on extractive resources.
However, the emphasis on fossil fuel resources is misplaced. Obviously, these resources, which are a major input to today’s industrial societies, are limited. In 2018, BP suggested that there are more than 50 years of proven oil reserves underground compared to current levels of extraction; 134 years of coal, and 53 years of gas [21]. However, according to the 2014 Intergovernmental Panel on Climate Change (IPCC) assessment, living up to the Paris Agreement’s climate goal of staying under 2 °C warming requires keeping the greenhouse gas concentration in the atmosphere well under 450 ppm CO2 equivalent. Failing to do so would give humanity merely a 66% chance of meeting the 2 °C goal [12]. In contrast, the National Oceanic and Atmospheric Administration (NOAA) reports that in 2017, the atmosphere already reached 493 ppm CO2 equivalent [22].
This demonstrates that no emissions budget is left. This means that the amount of fossil fuel still underground is far less limiting than the planet’s capacity to absorb the CO2 emissions from burning this fuel. To extend the biosphere’s absorption limits, humanity could dedicate more machinery and effort to extracting CO2 from the atmosphere (which is still technologically challenging and lacking a business model), or humanity could dedicate more of the planet’s regenerative capacity to sequestration by building up plant-based biomass that stores carbon. But that in return would limit other uses of the biosphere such as food, timber and fiber production. Further, while shifting away from fossil fuels could reduce CO2 absorption needs, it could also potentially add new biocapacity demands elsewhere for other energy sources. In other words, planetary regeneration is far more limiting to the human enterprise than fossil fuel stocks underground.
Similarly, access to rare earths, i.e., metals and minerals that are critical inputs to specialized industries, are also most limited not by the amount underground, but by mining restrictions or available energy [23]. To loosen mining restrictions would compete with biological uses of the biosphere, while extracting more from current mines would require more energy for deeper mines, or more energy to concentrate more dispersed ores. Energy for the extraction and concentration of these ores, in turn, brings the competition back to the fossil fuel discussion, a primary energy source in current industrial applications, which as discussed above, is mostly constrained by the availability of the planet’s biological regeneration, as also discussed by the authors elsewhere [24].
Biological regeneration essentially boils down to the process of photosynthesis that uses solar power, nutrients, and water to produce plant matter, which, in turn, feeds all other life [25]. Life, including human life, competes for biologically productive areas. These areas represent nature’s ability to renew itself. The ability of ecosystems to constantly renew is called biocapacity, which is enabled by sufficient water, a stable and conducive climate, the availability of nutrients in the soil and in the air, the absence of excessive pollution, and an intact web of life. Therefore, this paper concludes that biocapacity is the most limiting physical factor for the human economy. It is this fundamental capacity to renew plant matter that ultimately limits the resource metabolism of all animal species, including homo sapiens. Analyzing a country’s resource performance and questions of resource security from the perspective of competing uses of regeneration, therefore, becomes the most relevant angle.
2. Methodology Used: Biocapacity Accounting
The focus of this paper is to examine a country’s performance from the perspective of its demand on ecosystem regeneration. Such an examination requires a robust metric. This methods section explains the choice of the accounting metric for this assessment. First, it introduces possible measures, and makes the case why among them, biocapacity accounting, i.e., comparing countries’ respective Ecological Footprints to regions’ or the planet’s biocapacity, is the most appropriate way to capture each country’s overall resource performance and resource security.
Secondly, it demonstrates how Ecological Footprint and biocapacity results can be interpreted in general, using the case of Albania as an example, and showing the diversity of the results, as well as similar patterns among countries with parallel histories—in this case the Southern European countries who were exposed to the 2008 Euro crisis.
This methods section describes the analysis of a country’s resource performance and their developmental success, the core contribution of this paper.
2.1. Options for Measuring Human Demand on Biocapacity
Several metrics exist in the realm of assessing the material dependence of human economies. The primary ones are based on mass flows, greenhouse gases (also expressed in mass), dollars, energy, biomass, land areas, bioproductivity, and planetary boundaries. Only accounting systems are discussed herein, i.e., metrics that are based on clear research questions and, hence, are built on clearly defined, testable aggregation principles. Therefore, this paper excludes indices with arbitrary aggregations, such as the Environmental Performance Index [26], SDG-Index [27], Human Influence Index [28], Biodiversity Intactness Index [29], and others. Such indices, while potentially useful in different contexts, are not viable for comparing human demand against ecosystem regeneration, since they are not based on a sharp research question and reflect their author’s scoring preferences, rather than scientific principles.
The section below evaluates which approach is most relevant and capable for tracking human demand against biological regeneration.
- Kilograms can be used to measure mass flows. Describing mass flows of resources in kilograms seems precise, but the demand on nature per kilogram is vastly different between materials, and sometimes even for the same material. Consider the difference in the demand on nature of removing 1 tonne of water in a relatively wet country like Finland to 1 tonne of water in a relatively dry country like Jordan. Further, when comparing biomass, there can be confusion between wet or dry weight. Material Footprint accounts exclude air and water flows, but even without those flows, considering the killing of one kg of birds equivalent to moving one kg of rocks distorts reality. Also, there are no clear upper limits for mass flows, reducing this approach’s utility for measuring environmental limits. Some publications claim that 8 tonnes of material Footprint per person and per year is a sustainable level [30,31], but this number is based on a declaration, not scientific deduction. For these reasons, assessments based on mass flow are not well suited to compare human demand against regeneration.
- CO2 emissions include carbon dioxide released from burning fossil fuel, producing cement or changing land-use patterns. CO2 equivalents aggregate all gases, including CO2, on the basis of their global warming potential. Human induced emissions of carbon and other greenhouse gases are increasingly tracked given the growing climate impact of these gases given that the concentrations of these gases in the atmosphere is rising. Emissions can be compared to the upper emission limit, which in turn is a function of what temperature increase humanity is willing to tolerate. But even with a temperature limit set by the Paris Agreement of ”holding the increase in the global average temperature to well below 2°C above pre-industrial levels and pursuing efforts to limit the temperature increase to 1.5°C above pre-industrial levels” [13], there is great discrepancy in the literature about how much carbon is left to emit. Some, like NOAA, conclude that humanity is facing a negative budget if humanity wants to achieve the Paris goal [22]. Others, like Figueres et al. [32], estimate a remaining CO2 budget of between 150 and 1050 Gigatons. Given this uncertainty, and the fact that greenhouse gas emissions are not the complete set of competing demands on the biosphere, emissions of CO2 or CO2 equivalents are also not fit to fully answer this question.
- Monetary currencies, such as US dollars or Euros, are useful as an accounting unit for comparing human activities but cannot link human demand to biological regeneration. As the value of dollars can change from year to year due to inflation, accounts can also be expressed in constant dollars. Further, the same financial amount represents dissimilar values to different people. This is recognized by UNDP / United Nation Development Programme’s Human Development Index (HDI): there, the income dimension, one of the index’s three pillars, is therefore measured as the logarithm of people’s financial income. (The other two pillars are longevity and access to basic education [33,34]). Also, the same monetary unit can purchase different amounts of goods in different markets. Monetary amounts can be made comparable by adjusting them according to their purchasing power. This translation is called purchasing power parity [ppp]. Or any currency can be converted into other countries’ local currency, with conversion rates changing daily. Still, with all this variance, monetary units, in local currencies or expressed in US Dollars, can be a useful measure of comparison at the micro scale. For instance, it can reveal social preferences (such as pursued by The Economics of Ecosystems and Biodiversity (TEEB) when comparing project options in their effort to ‘mainstream the values of biodiversity and ecosystem services into decision-making’). However, financial assessments do not compare resource use against regeneration. Moreover, at the macro level, financial metrics become problematic, as dollars reflect market preferences, not ecological necessities or regeneration. The two leading studies that financially value natural capital at a macro scale vastly underestimate the significance of natural capital vis-à-vis other capital assets. They are Changing Wealth of Nations by the World Bank (2011/2018), and Inclusive Wealth Report by UNU (2012/2018). The former study concludes that the value of the planet, as a percentage of humanity’s total assets, only accounts for 9% of humanity’s total wealth. This number is implausibly low given that all wealth depends on natural capital, and there is wide recognition that the planet’s natural capital is overused [35]. These financial valuations do not, therefore, recognize the importance of ecosystem regeneration in meeting humanity’s material demands.
- Energy units can be defined precisely and measured in a lab but are highly ambiguous for describing flows through ecosystems or societies because of entropy cascades. For instance, the sun’s 175,000 TW (or Terawatt) of solar radiation onto Earth generates approximately 70 TW of Net Primary Productivity (NPP) on the land and more if including the NPP of the oceans. Of the land-based NPP, 1/3 or more is used for generating about 1 TW of food calories for people [36]. This energy cascade illustrates the stark difference of 1 TW solar radiation and 1 TW of food. Thus, energy, as common denominator, can lead to confusion. The closest to a consistent energy accounting approach that includes the quality of energy is Odum’s eMergy calculation [37,38]. However, the commonly published conversion factors (‘transformaties’) that translate final use back into solar input are not robust.
- Biomass balances (whether expressed in tonnes of carbon, dry matter, or energy content) as used in Net Primary Production (NPP) assessments, and the complementary Human Appropriation of NPP (HANPP) is very closely related to the question of human demand and regeneration [36]. The challenge is that demand as measured by HANPP cannot be compared with clarity and sharpness to available regeneration, nor can a sustainable level of NPP extraction be clearly defined, let alone measured. Studies that compare the two come up with wide ranges of answers, for definitional reasons, as well as measurement challenges [39]. While NPP assessments are undoubtedly an important tool, particularly to evaluate intensity of biological uses, they have limited power to robustly track demand against regeneration.
- Hectares can be used to compare human demand for productive hectares, to hectares available. Unfortunately, not every hectare represents the same biological productivity: just consider the biological productivity of one hectare of a rocky mountain slope, of a tundra forest, of a tropical rain forest, or of a highly fertile cropland in river basin.
- Global hectares are productivity adjusted hectares. Each unit represents a biologically productive hectare with world average productivity. This equivalence makes the unit convenient for biocapacity accounting [24]. Biocapacity is the biologically productive area that provides ecological services. All human demands on those surfaces that compete for space can therefore be added up. This more agriculturally-based metric is straightforward. It builds on established agronomical practices to measure harvested crops and yields. As productivity changes annually (because of technological innovations, climate change, shifts in management practices, etc.), the global hectare changes accordingly. The sum-total of productivity-adjusted areas representing all of people’s competing demands on nature, then, can be compared against available areas (also expressed in productivity adjusted hectares).
Planetary Boundaries [9,10] identify key physical conditions that are needed to maintain the integrity of the biosphere and the Earth system. This approach identifies nine environmental areas where transgressions could lead to shifts that could irreversibly move the biosphere out of the stable conditions which characterized the Holocene. They are:
- Stable climate
- Intact biodiversity
- Sufficient nutrients (but no overload)
- Protective ozone layer
- Absence of pollutants
- Clean and sufficient fresh water
- Stable and fertile soils
- Absence of acidification in both water and soils
These are the necessary conditions for healthy, productive ecosystems that can maintain their integrity. Hence, they enable the biosphere’s “biocapacity”. For each dimension, the Planetary Boundaries approach employs metrics. These metrics do not measure regeneration, per se, but attempt to identify the distance from “a safe zone”. Also, Planetary Boundaries does not offer an aggregate measure showing the compound effect, or trade-offs among those nine measures. This means that the Planetary Boundaries approach is related and complimentary to the question of how big the human demand is compared to ecosystem regeneration but does not offer a metric to track that relationship with the specificity needed, and if so, only at the planetary level.
In summary, among all the discussed metrics in this section, biocapacity accounting based on “global hectare units” comes closest to comparing human demand against ecosystem regeneration. Therefore, this approach is used in the analytics of this paper.
2.2. How to Measure Human Demand on Biocapacity with Ecological Footprint Accounting
Ecological Footprint accounting is designed to answer how much ecosystem regeneration represented by biologically productive areas is necessary to renew people’s demand for all the competing uses, including food, fiber, timber, accommodation of roads and structures, and waste absorption.
To map human dependence on biocapacity, Ecological Footprint accounting is based on two basic principles:
- Additivity: Given that human life competes for biologically productive surfaces, these surface areas can be added up. The Ecological Footprint (or Footprint), therefore, adds up all human demands on nature that compete for biologically productive space. This means these spaces mutually exclude each other as they provide for biological resources, accommodate urban infrastructure, or absorb excess carbon from fossil fuel burning. (Surfaces that serve multiple human demands are counted only once.) The Footprint then becomes comparable to the available biologically productive space (biocapacity).
- Equivalence: Since not every biologically productive surface area is of equal productivity, areas are scaled proportionally to their biological productivity (for more detail see Wackernagel et al. [24]). Therefore, the measurement unit for Ecological Footprint accounting, global hectares, are biologically productive hectares with world average productivity.
The methodological specifics of this accounting approach, including discussions of potential limitations of the current approach, are explained in detail elsewhere [24,35,40,41,42,43,44]. Both Footprint and biocapacity can be calculated at global, national, local, household, and individual levels. In this paper, all Footprints refer to the consumption Footprint at the country level. This means the presented results reflect what is being consumed in the country (i.e., the production plus the net imports), rather than, for instance, the resources used to generate income which includes products and services produced for export.
2.3. Key Concepts of Biocapacity Accounting at the National Scale
Thanks to the comprehensive UN data sets on agriculture, energy, population etc., it is possible to calculate the overall biocapacity demand (or Footprint) for most countries, back to 1961 [35,42]. All results are available on Global Footprint Network’s open data platform [45].
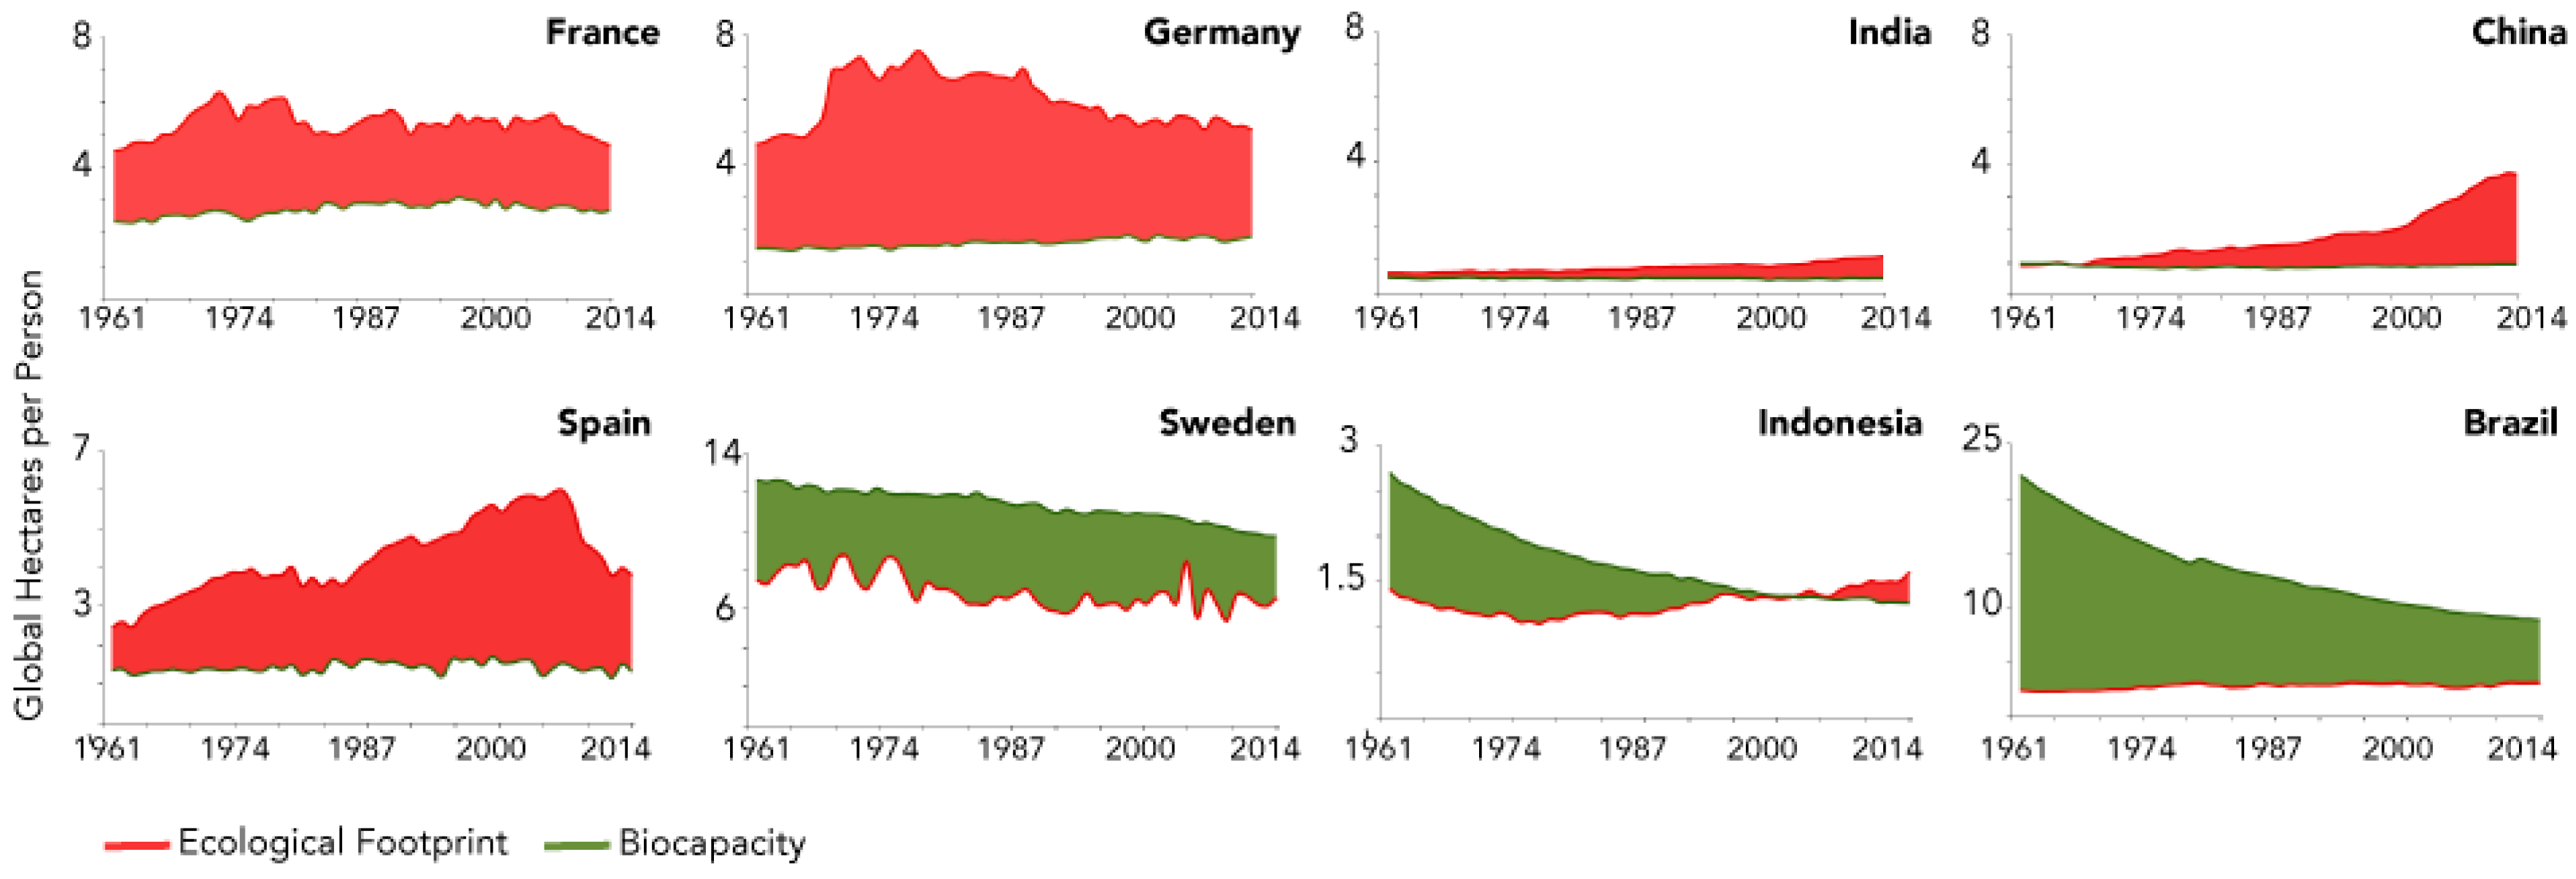
Figure 1 shows a few country examples with time series stretching from 1961 to 2014: In 2018, 2014 was the latest year with complete UN statistics.
The red line indicates the Ecological Footprint per person in global hectares. The green line shows the amount of biocapacity available within the county per person, also expressed in global hectares. If the Ecological Footprint is higher than the biocapacity (or the red line higher than the green line), the country runs an ecological deficit, indicated by a reddish fill. On the other hand, if the country has an ecological reserve, this reserve or the space between the lines would be colored with a greenish fill.
It is possible for countries, as it is with money, to run a Footprint that is larger than the country’s biocapacity. Three mechanisms allow for such a deficit:
- Net-importing biocapacity from elsewhere (this means that the Ecological Footprint embodied in imports exceeds the Ecological Footprint embodied in exports);
- Using the global commons (such as in the case of fishing international waters or emitting greenhouse into the global atmosphere); and
- Overusing one’s own territorial biocapacity (overharvesting forests or fish stocks, etc.).
Obviously, for the world as a whole, only the last option is available, since there is no ‘elsewhere’ that can compensate overuse (the planet is largely materially contained). The overuse of these and other renewable resources is called ‘overshoot’, which occurs, for example, when people:
- Catch more fish than fishing grounds can regenerate, leading fisheries to eventually collapse;
- Harvest more timber than forests can re-grow, and causing deforestation;
- Emit more CO2 than the biosphere can absorb, such that CO2 accumulates in the atmosphere, and then contributes to global warming; or,
Figure 1 illustrates how significantly Ecological Footprint and biocapacity profiles of countries vary. In other words, the risk exposure of countries is highly variable, even though all countries are located on the same planet. For instance, India has a very low per person Ecological Footprint, which is still significantly higher than its own biocapacity. For China, the situation is similar, only that China has been expanding its Ecological Footprint per person far more significantly over the last two decades. Brazil and Sweden are both still running an ecological reserve. In Brazil, that reserve is shrinking more rapidly than in Sweden due to higher population growth rates. Brazil is the world’s biocapacity giant, but with its past population growth, its biocapacity advantage shrank. Indonesia, meanwhile, recently began running an ecological deficit.
Globally, according to these same estimates, human demand now exceeds what the planet’s ecosystems can renew by over 70 percent [35]. This estimate is likely an underestimate, since Ecological Footprint assessments using UN data sets tend to undercount demand (not all demands may be documented in UN statistics). In contrast, biocapacity may be overstated (some overuse such as soil erosion, groundwater depletion, and loss in forest production, due to increased forest fires and pestilence, is not factored into current biocapacity estimate for lack of consistent data).
For humanity as a whole, it is not possible to maintain global overshoot forever. There is only so much natural capital stock to be depleted (this includes filling up sinks, as in the case of carbon accumulation in the atmosphere discussed above).
This means that the temperature goal established in the Paris Agreement requires us to move out of fossil fuel use long before 2050 [32] in addition to finding aggressive ways to remove greenhouse gases from the atmosphere. Eventually, as stocks are depleted or sinks overfilled, reduced biocapacity availability will force humanity to move out of overshoot. The question is only whether humanity leaves overshoot by design or disaster [46].
2.4. Reading Time Trends: The Example of Albania and the Countries Hit by the Euro Crisis
These resource trends reflect countries’ histories, indicating both the challenging and successful times a country has lived through. To illustrate the history hidden in these time series, this section first discusses the Ecological Footprint and biocapacity graphs for Albania (Figure 2), and then illustrates the parallel occurrences among European countries affected by the 2008 Euro crisis (Figure 3).
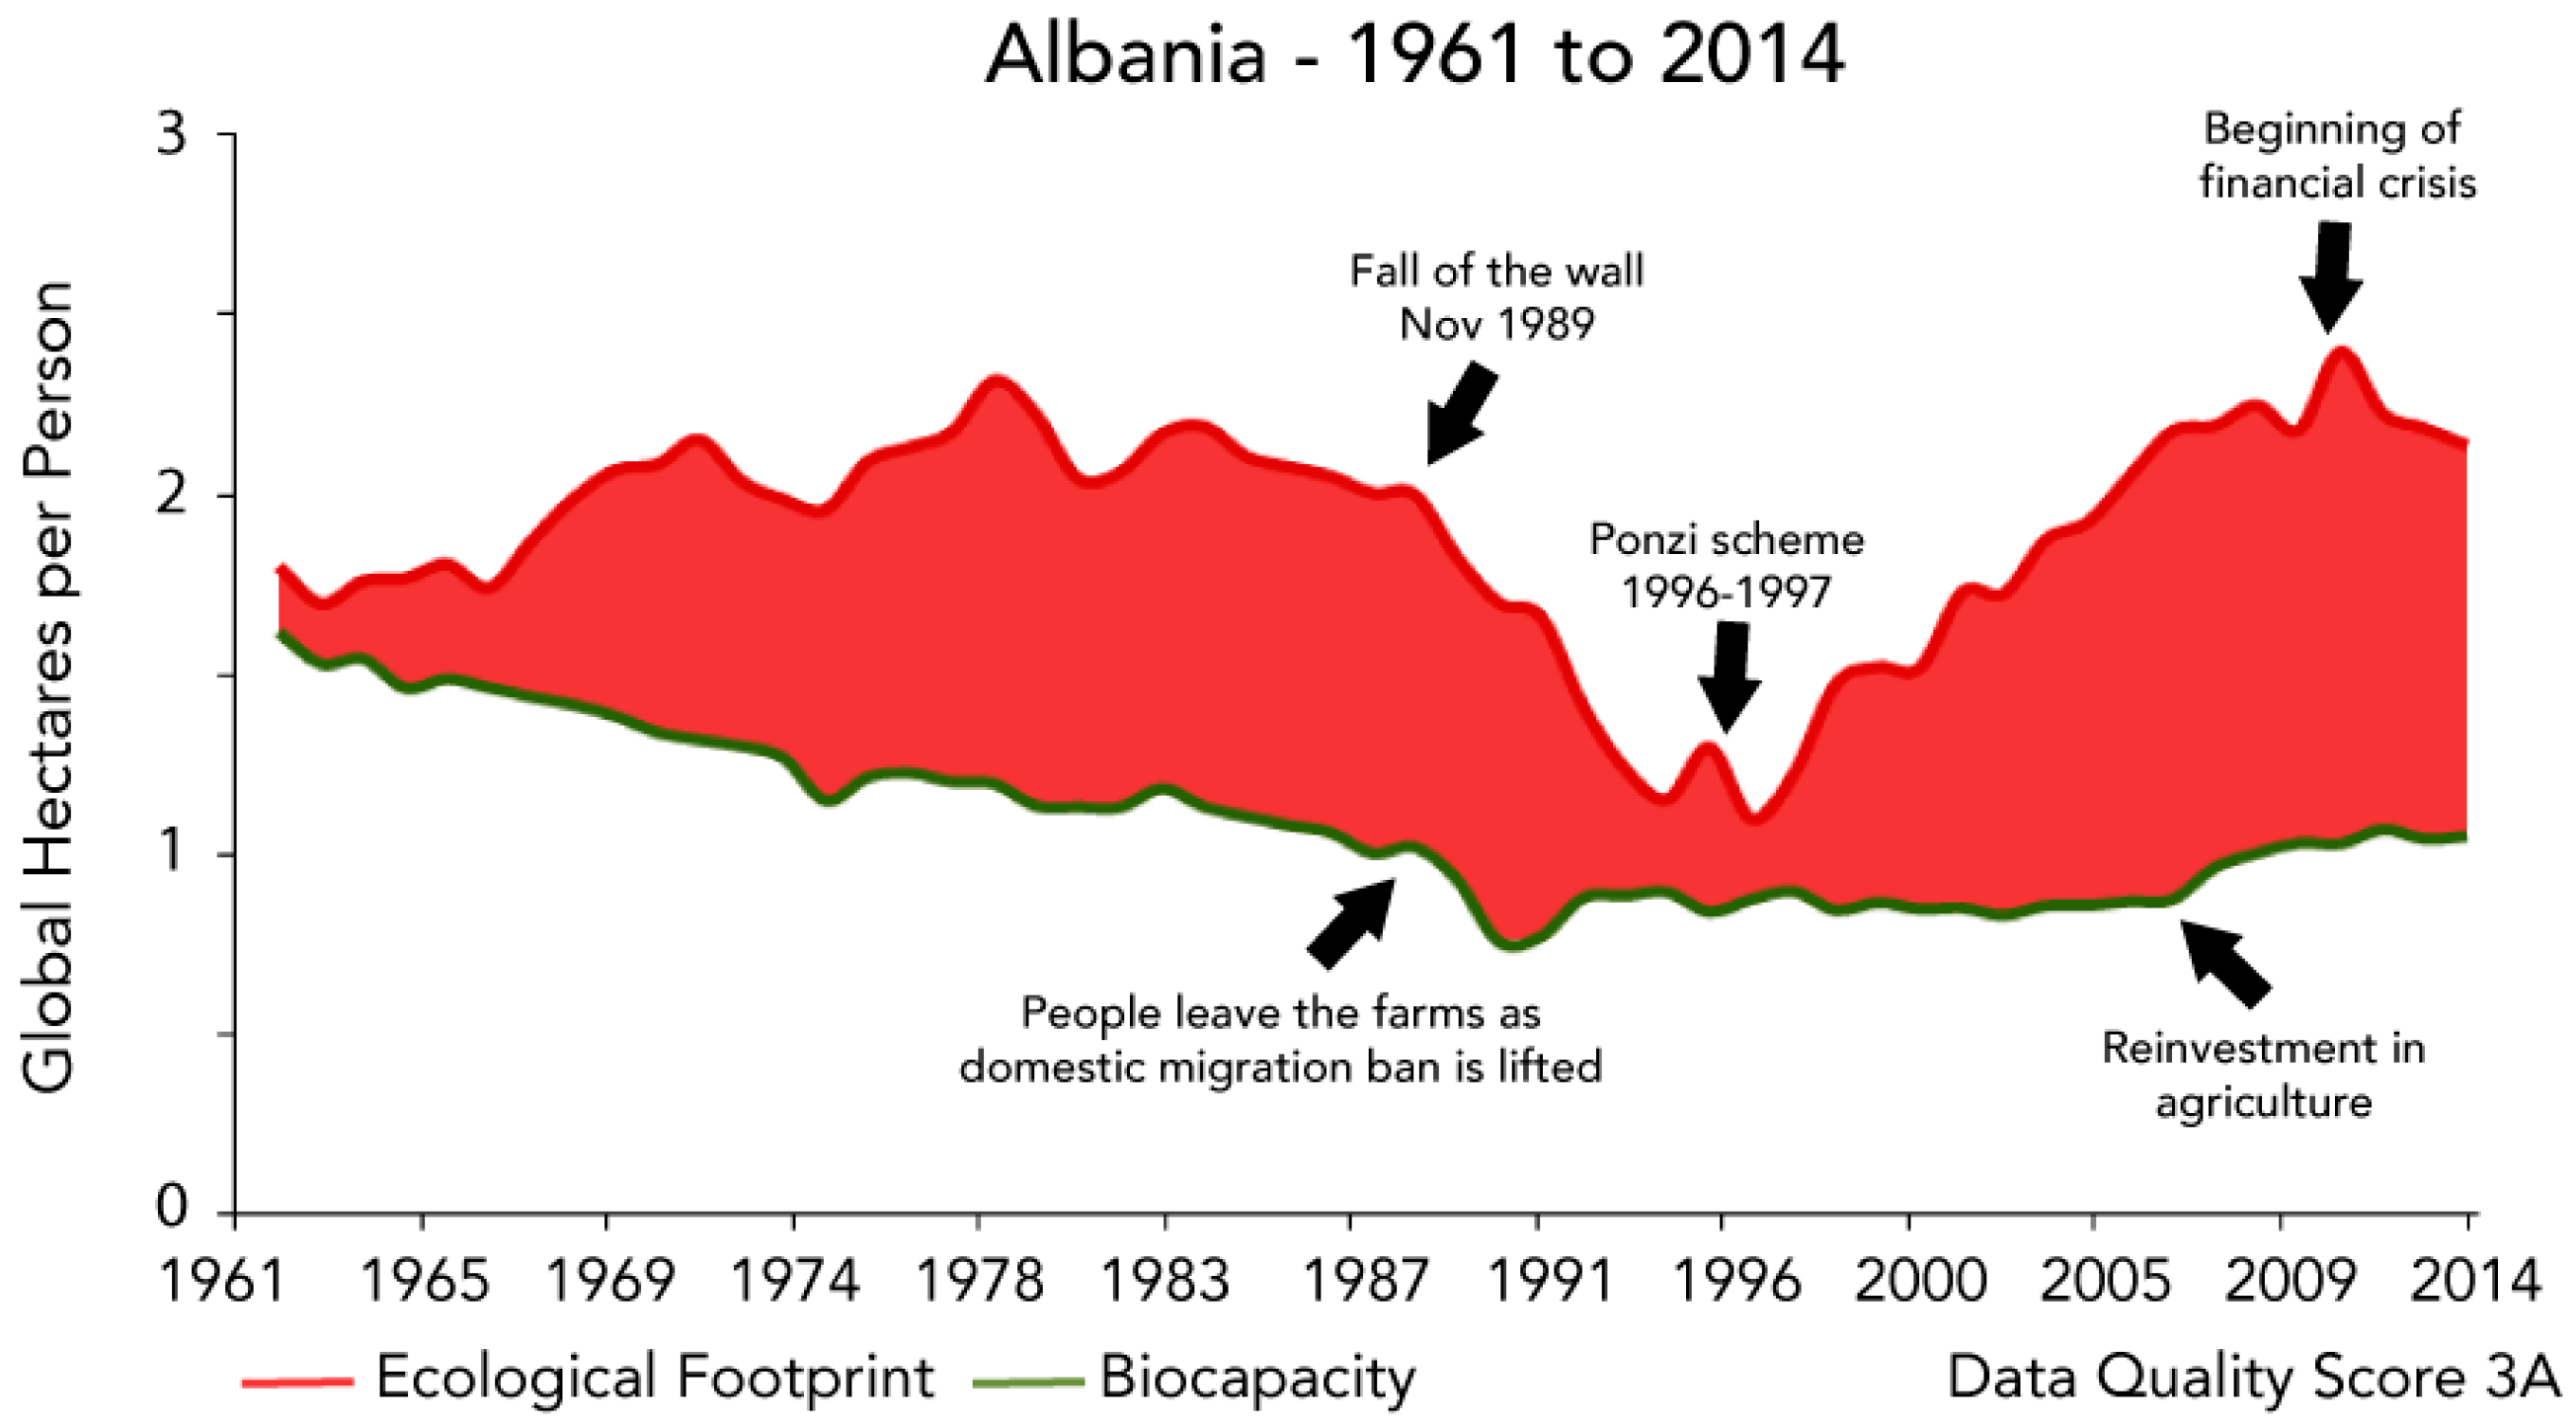
Albania, under communist rule until 1992, was isolationist and economically fragile. Economic isolation and restricted domestic migration limited consumption opportunities for its residents and kept a large percentage of the population working in the agricultural sector. During that communist era, rapid population growth (doubling its population from 1961 to 1990) led to an equally rapid decline in biocapacity per person.
With the fall of the wall in 1989, the economy and Albania’s communist regime crumbled, ending the communist era in 1992. With a lift of the domestic migration ban, Albania’s rural population started to move away, and consequently Albania experienced a marked reduction of productivity in agriculture. However, emigration also led to a slightly declining population, no longer eroding the per-capita biocapacity.
Wide-spread financial Ponzi-schemes that emerged in Albania (1996–1997) briefly increased consumption, but with their collapse led the country to the brink of a civil war. After overcoming this crisis, the country started to recuperate economically. Agriculture benefited from increased investments after 2008. The financial crisis post-2008 slimmed opportunities for Albania, keeping its residents with a per person Ecological Footprint of about half the size of the per person Ecological Footprint in other Western European countries, such as Italy, Great Britain, Germany, or France.
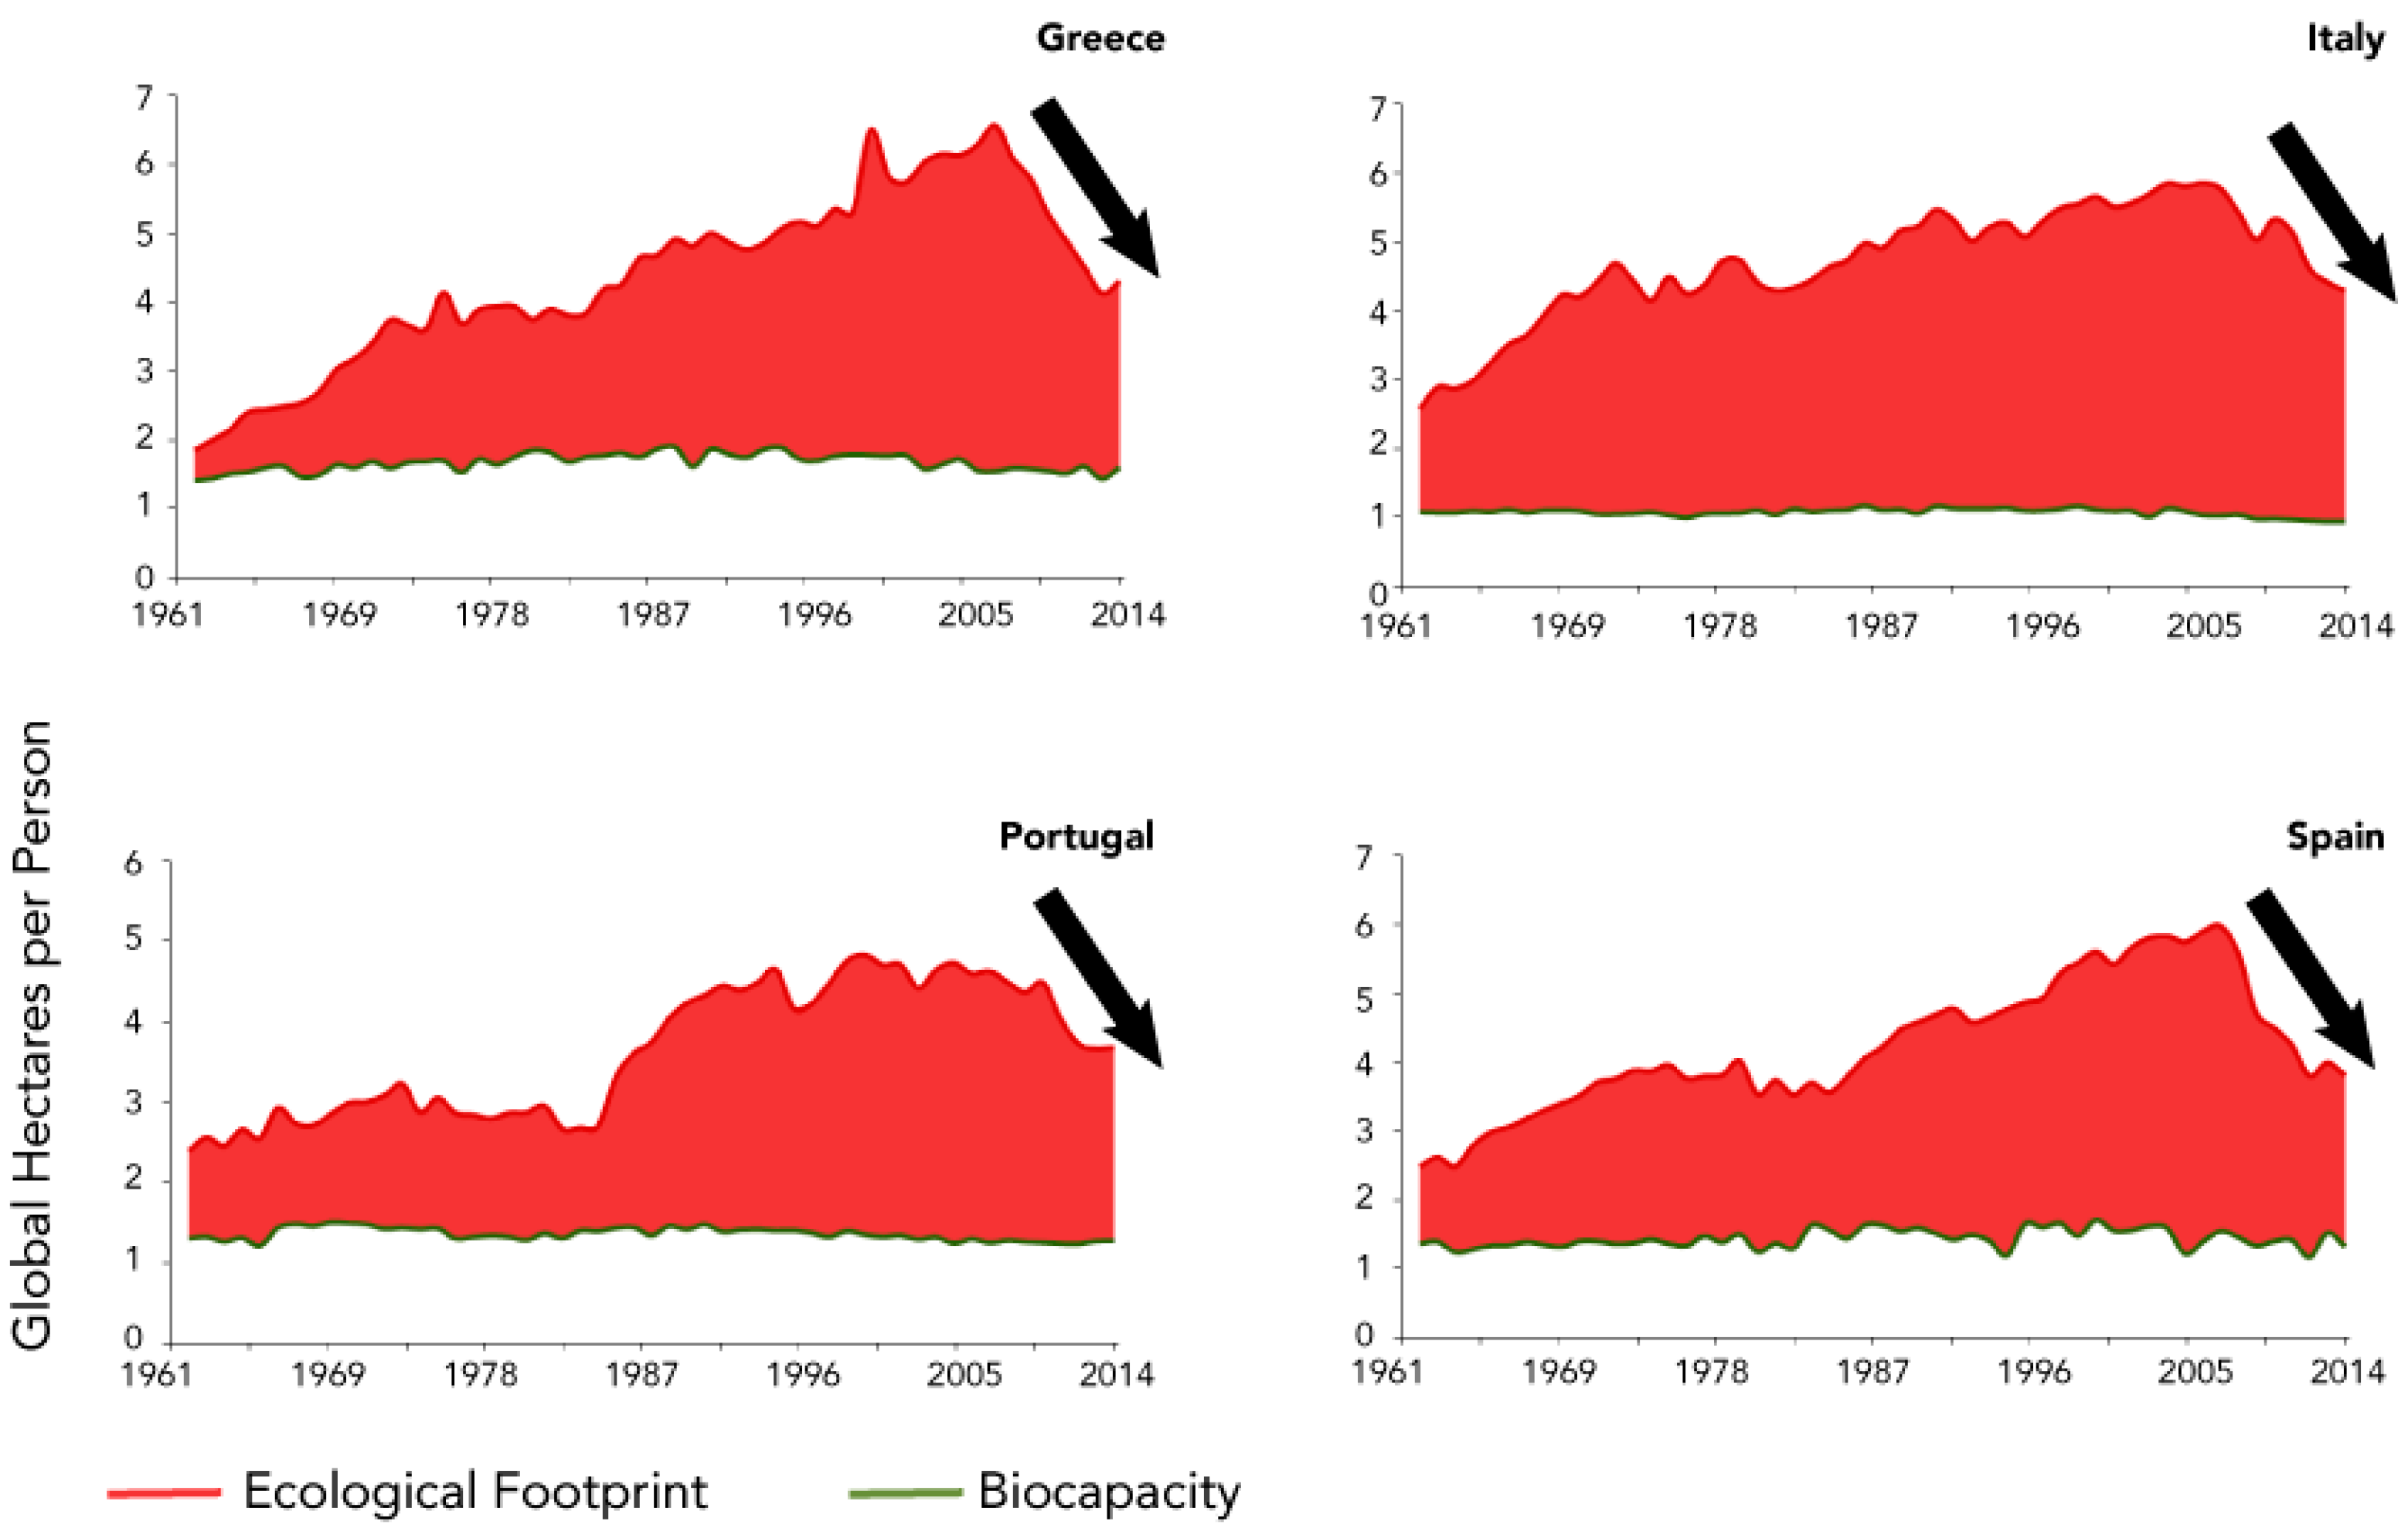
The second example shows similarities among countries with parallel histories. A prominent example is the economic expansion punctuated by a contraction of mostly Southern European countries as they were affected by the 2008 Euro crisis. Greece, Ireland, Italy, Portugal, and Spain were the European countries most forcefully hit by this “Euro crisis”. From the 1980s onwards, these countries were able to expand their transportation and housing infrastructure (and through it its resource demand) with the help of EU structural funds. This possibility was later accelerated by lower transaction costs and cheaper borrowing through the introduction of the Euro in 1999.
However, after the financial crisis (2008), these countries experienced a prolonged physical contraction of their activities, showing sharp, prolonged (tragic and involuntary) reductions in their per person Footprints. The crisis slowed down the material metabolism of these economies considerably. Its households, in aggregate, had to shrink their physical consumption. This involuntary reduction of resource demand can cause hardship for the country’s residents. The better alternative is to reduce Ecological Footprint by design, in ways that enhance human well-being, to avoid exactly these kinds of forced reductions that lead to significant human suffering.
3. Results: The Countries Most Affected by Resource Insecurity
After explaining the rationale for using the National Footprint and Biocapacity Accounts and demonstrating how to read the results, this section shows what they reveal about a country’s resource performance and its development success. This is the “oracle” part of the paper. The “oracle” is questioned and discussed in Section 4. How to “defy this oracle” is outlined in Section 5, the conclusion of the paper.
3.1. Countries in the Ecological Poverty Trap
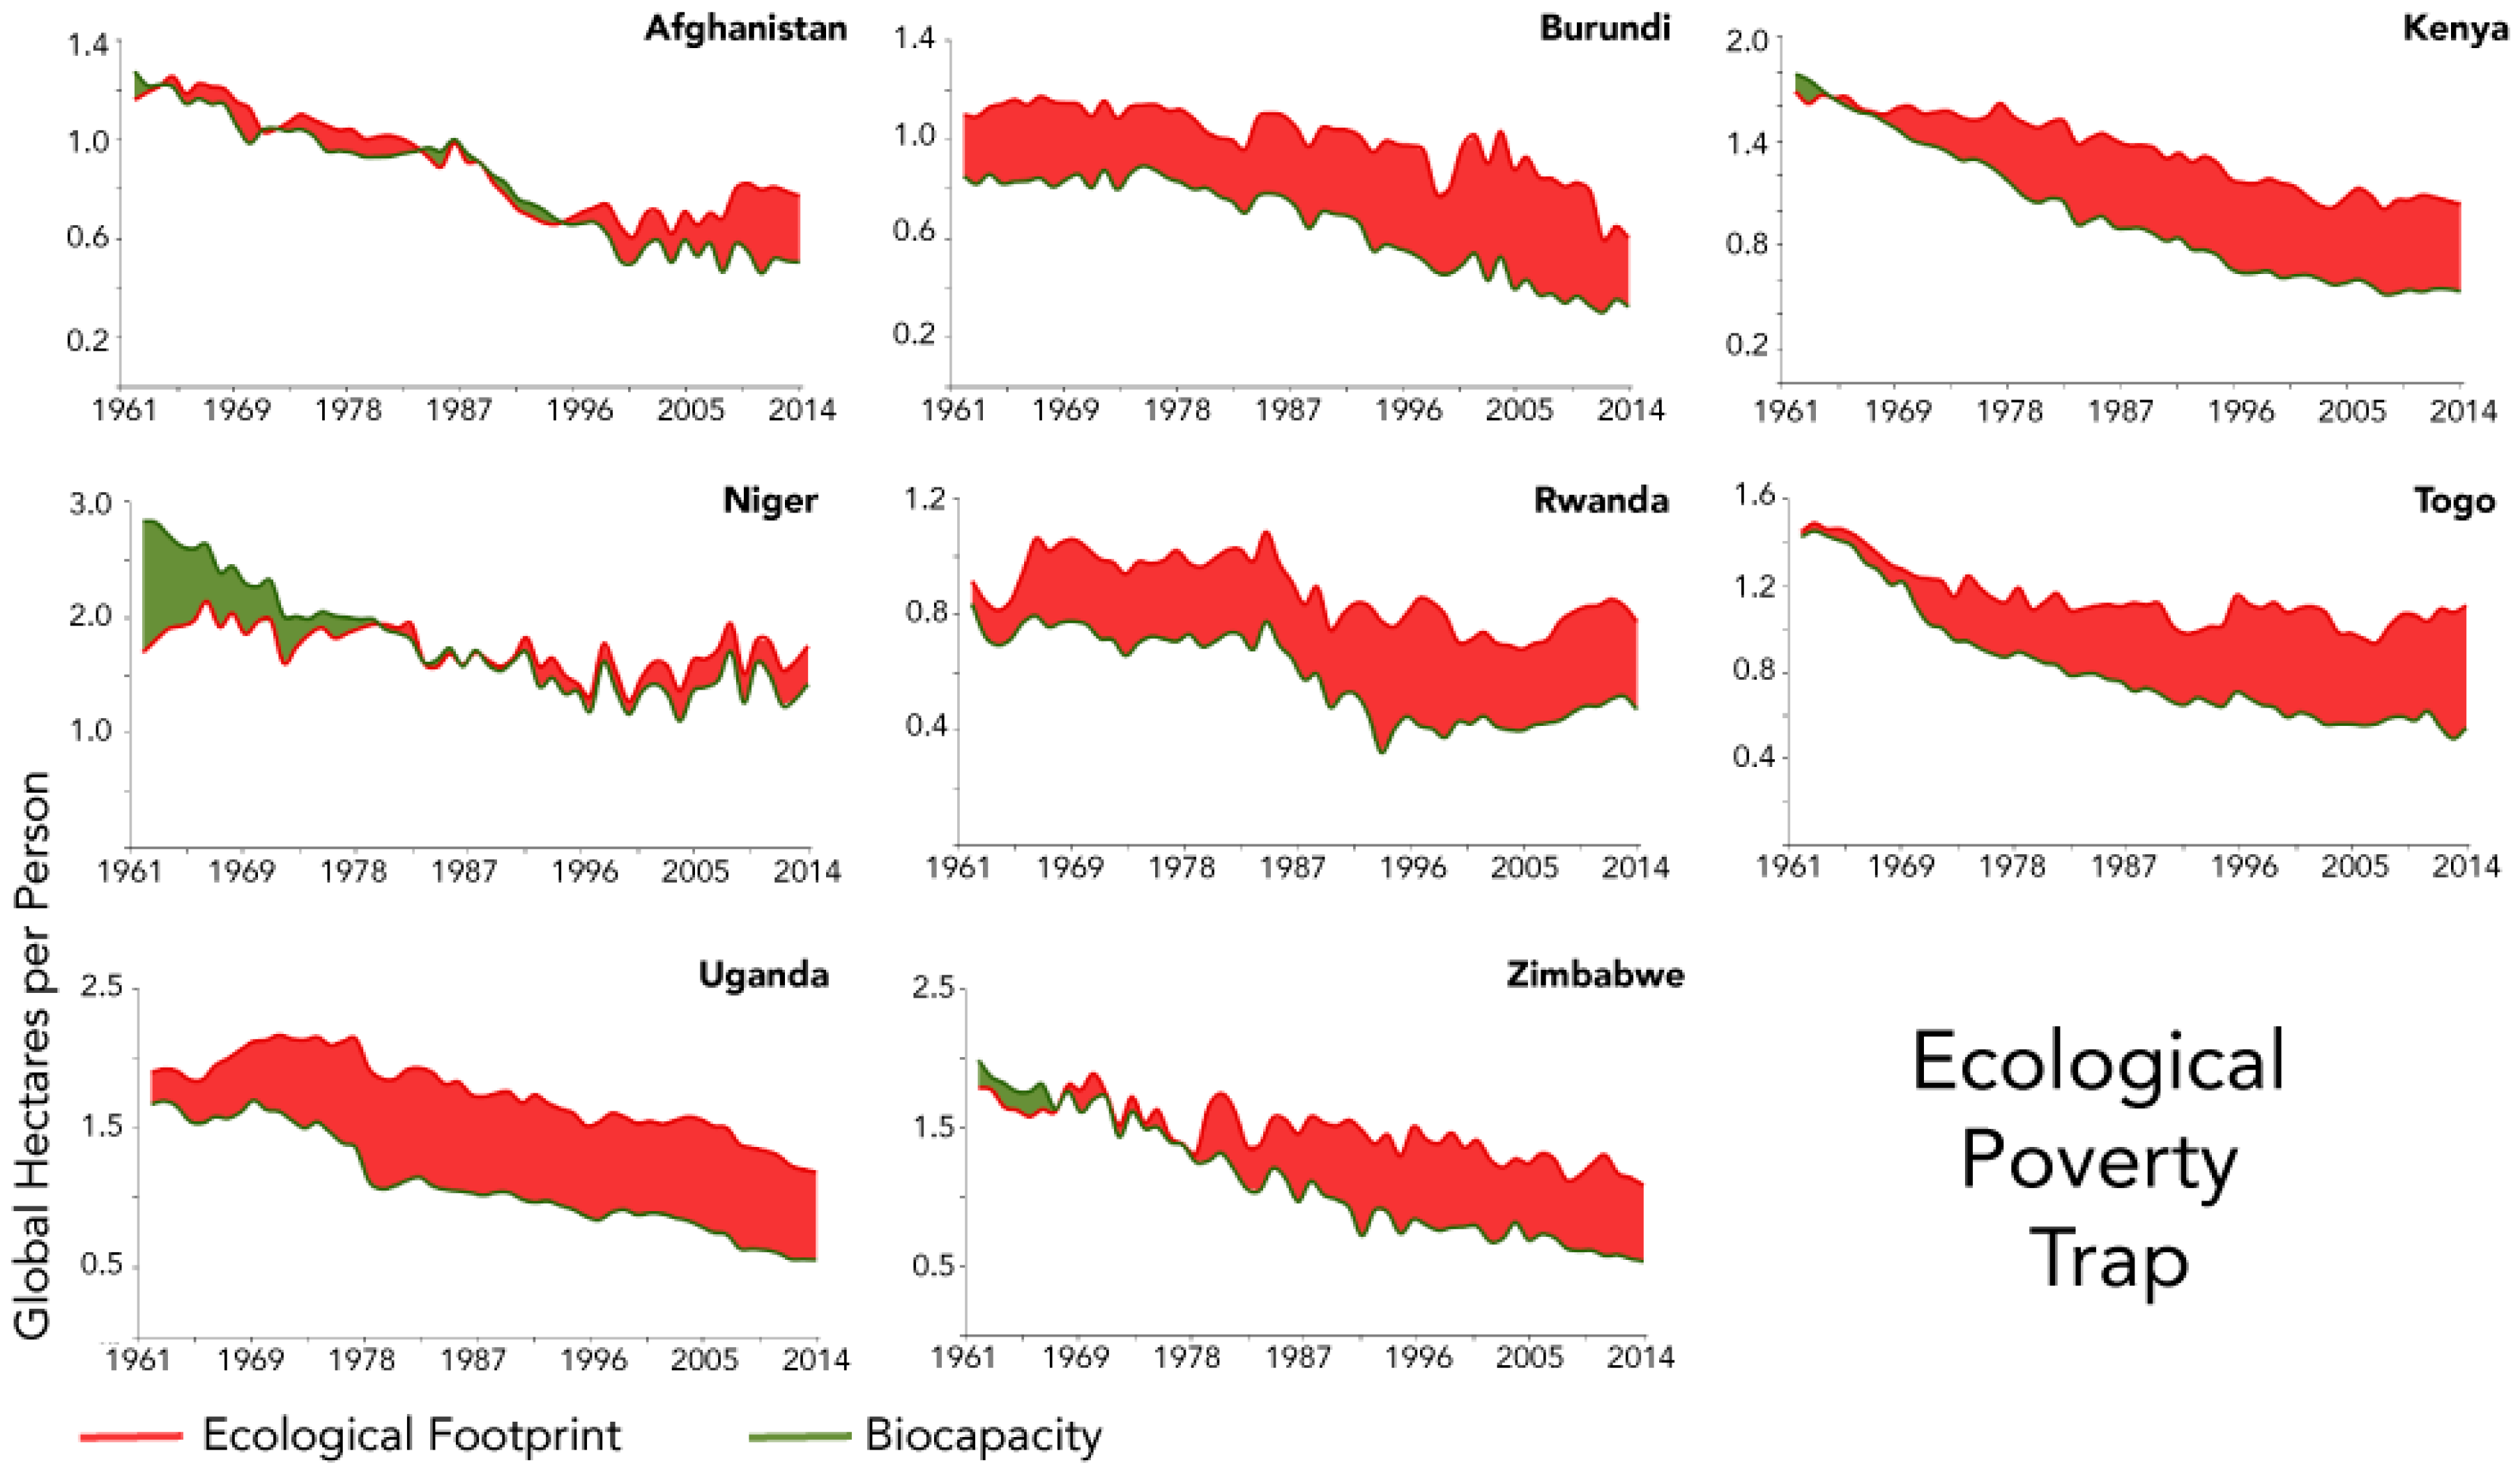
The National Footprint and Biocapacity Accounts, 2018 edition, allow users to identify the countries that have a low and declining per person Ecological Footprint while also running an ecological deficit. In fact, there are hardly any low-Ecological Footprint countries with an ecological deficit and low income, whose Ecological Footprint is not declining. One exception is Haiti, whose Footprint has been slightly boosted by foreign support since the massive earthquake in 2010. Figure 4 presents the eight counties who are in this “Ecological Poverty Trap” category.
The obvious explanation is that for lower income populations, net-importing resources, or even purchasing significant amounts of fossil fuel, becomes prohibitive. As a result, those countries’ Ecological Footprints per person are becoming increasingly constrained by their respective countries’ declining per person biocapacities (the biocapacity declines largely because of increase in the country’s population). The consequence is that per person Footprints are pulled down nearly in parallel to the decline in per capita biocapacity. This occurs at a time when these countries’ Ecological Footprints per person are already at a very low level compared to world average.
These declining per person Ecological Footprints among the countries with the lowest income is tragic. It points to resource availability becoming a limiting factor for human progress for these very countries. Therefore, one can say that these countries are caught in an “ecological poverty trap”. These countries are characterized by a low, but still increasing, Human Development Index, as shown in the table below (Table 1). This result means that the ecological constraints, while affecting the overall resource availability per person, have not yet reversed the most basic achievements captured by the Human Development Index (average of longevity, basic educational achievements, and the logarithm of income).
3.2. Countries at Risk
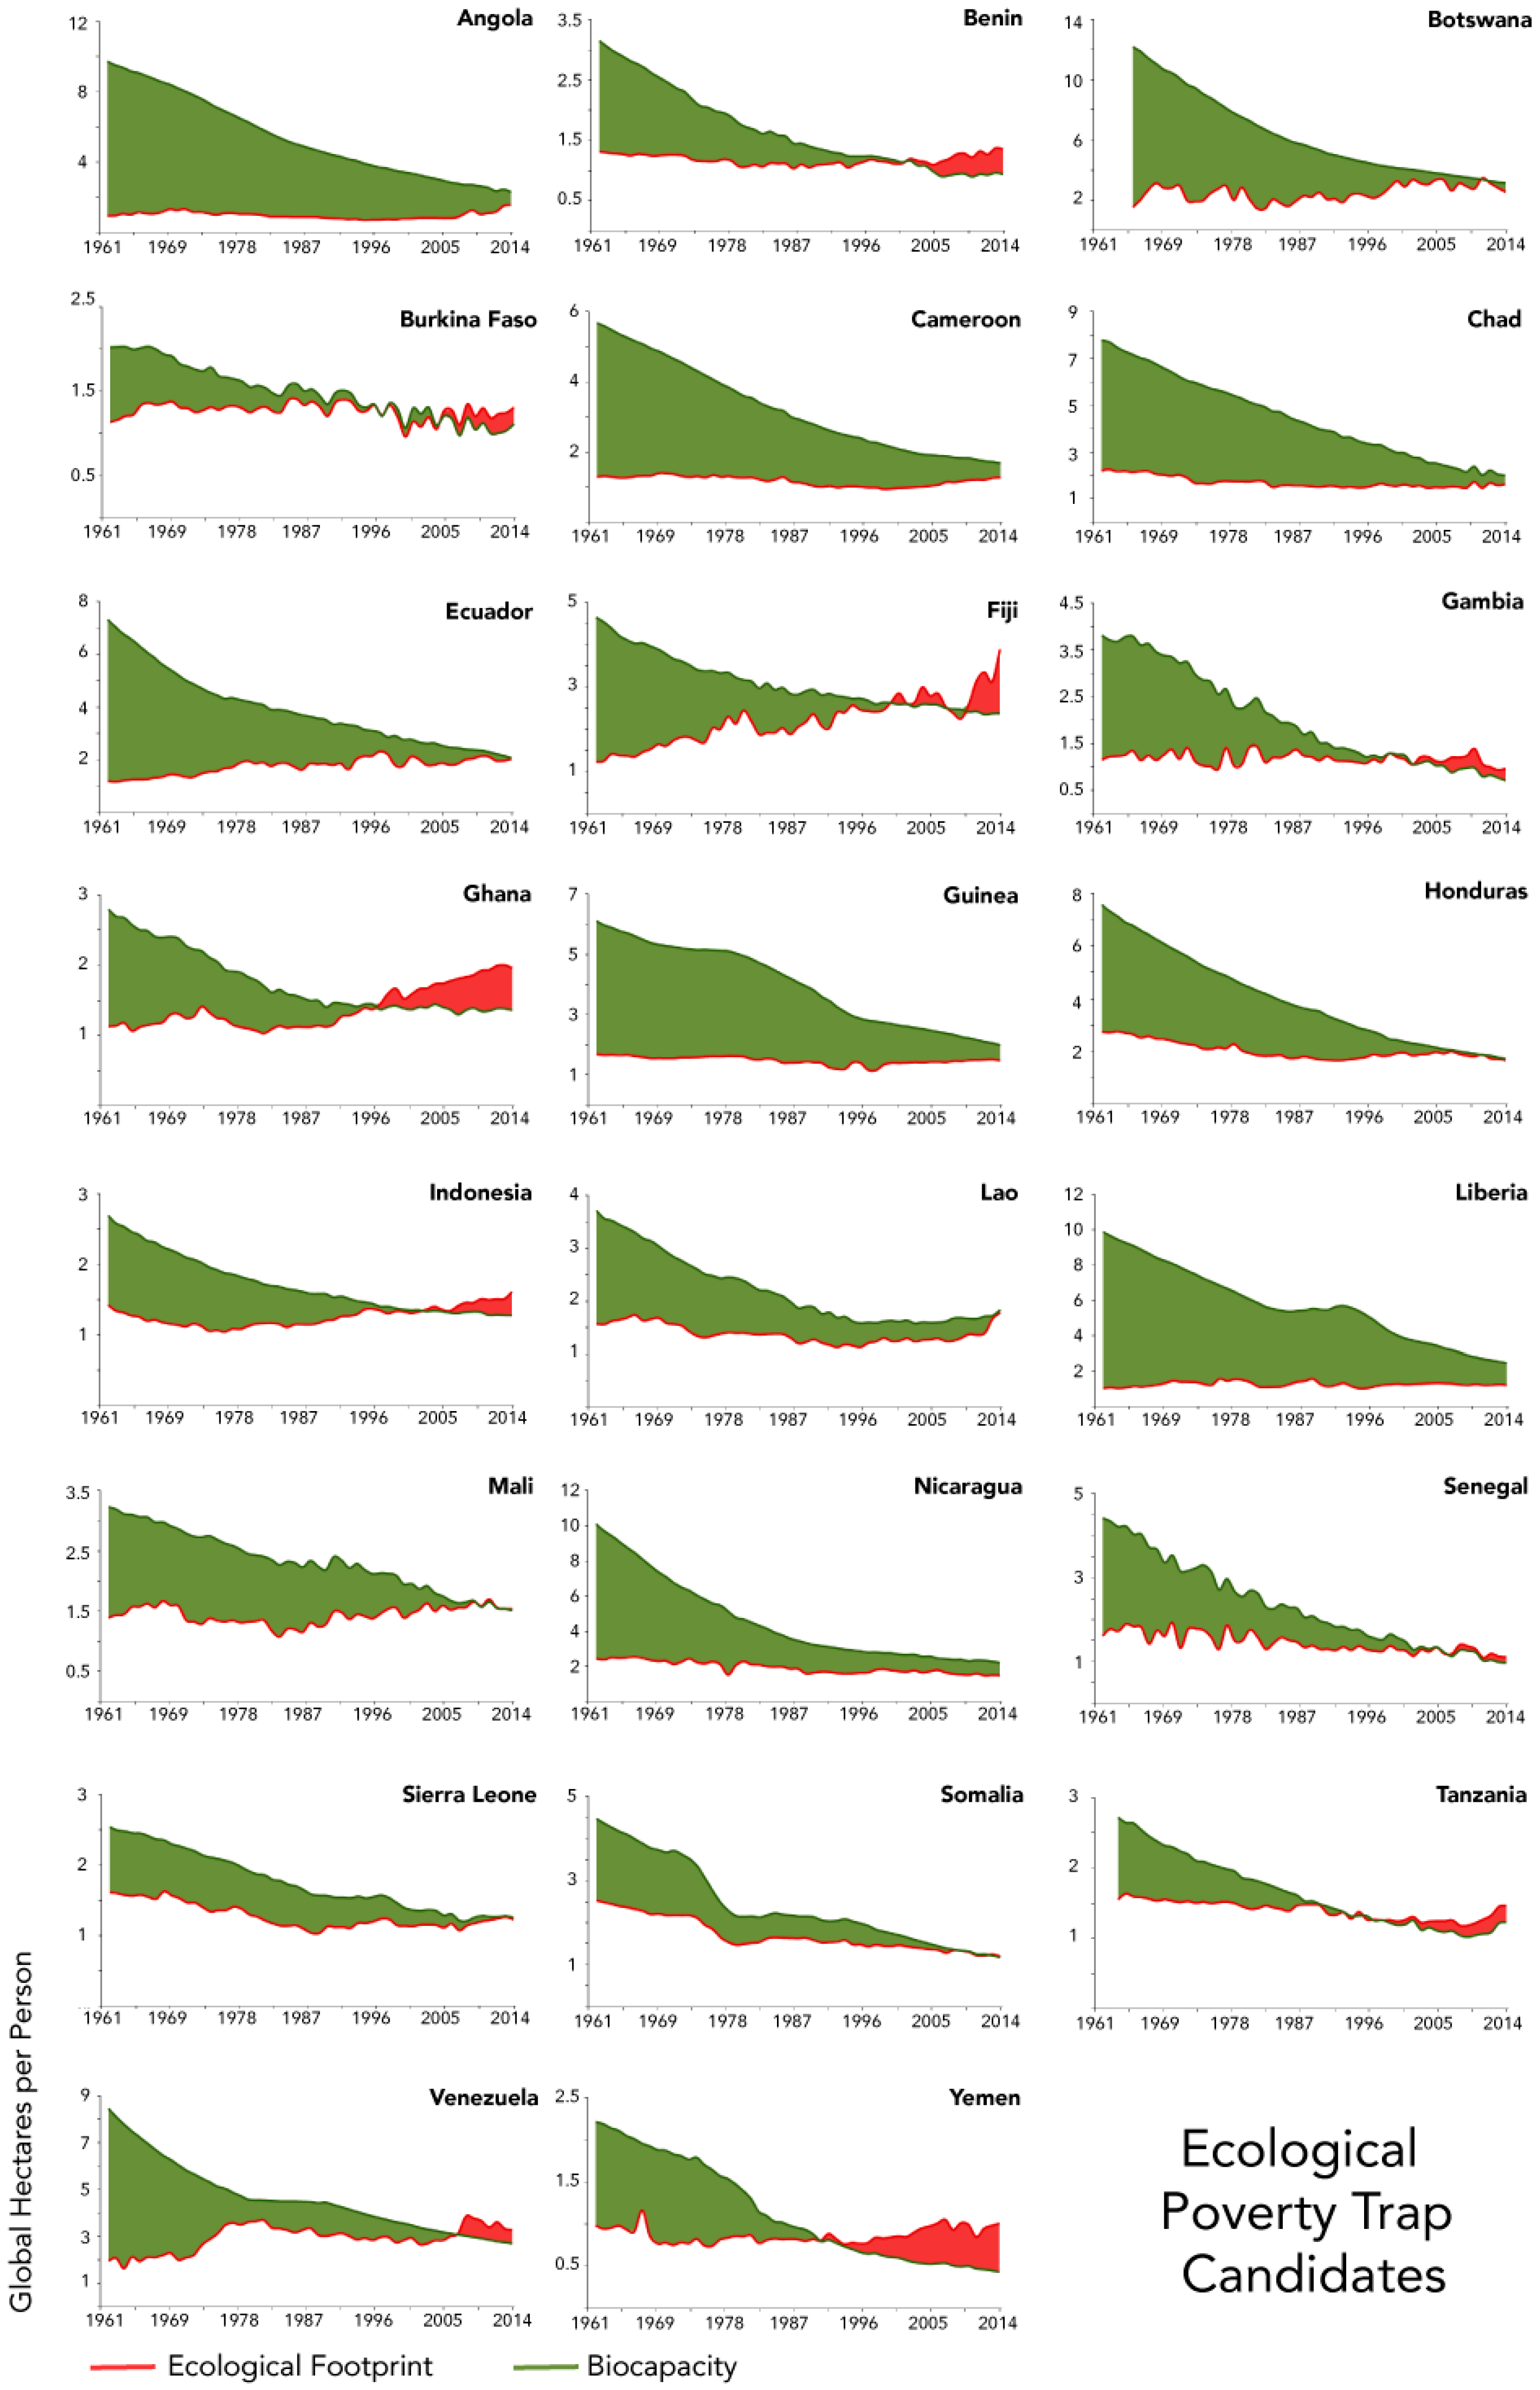
Many countries are just about to enter, or have recently entered an “ecological poverty trap”, characterized by the set of conditions identified above. These include a low per person Ecological Footprint, and a declining and often low per person biocapacity. Many seem to harbor the potential for a decline in their per person Ecological Footprints. These countries are depicted in Figure 5.
Some of these countries, including Angola, Botswana, Cameroon, Chad, Liberia, and Nicaragua, still have an ecological reserve. However, those countries’ biocapacity per person is significantly smaller than per person Ecological Footprints among high-income cities or countries. These are the current (i.e., 2014) biocapacity levels per person of those countries: Angola 2.3 global hectares (gha), Botswana 3.1 gha; Cameroon 1.7 gha; Chad 2.0 gha; Liberia 2.4 gha; and Nicaragua 2.2 gha. In contrast, the European’s (EU 28) Footprint averages 4.7 gha per person. Canada and the US have an average Footprint of over 8 gha per person, and Australia has one of 6.5 gha per person, significantly higher than what is available, per person, in the identified African and central American countries.
In other words, these historical time series from 1961 to 2014 provide insights about those countries’ potential future. The oracle reads: unless these trends shift (which would require very deliberate and forceful interventions as explained in the conclusion), these countries are strong candidates to become ecologically trapped, meaning that their Ecological Footprint per person is likely to irrevocably decline. There may be little financial warning of such a decline, as discussed in the next section.
One surprising candidate is Botswana. The large biocapacity advantage has enabled lucrative opportunities for Botswana’s economy, including a significant beef production industry, but by now their biocapacity reserve has nearly disappeared. Historically, Botswana had several resource advantages, such as a low population density that allows for more crop and grazing capacity per person; this low density also eases land-use conflicts, particularly in the case of mining, which often displaces communities. According to the CIA factbook, “diamond mining fueled much of the economic expansion and currently accounts for one-quarter of GDP, approximately 85% of export earnings, and about one-third of the government’s revenues” [47]. This is not to discount Botswana’s robust governance system, which may have contributed significantly to making Botswana extraordinarily successful in the past decades. Transparency International rates Botswana the highest among all African nations on its “Perceived Corruption Index” (higher means lower corruption). It scores higher than Spain, Poland, the Czech Republic, South Korea, and Costa Rica [48]. However, even with great governance, the locally available biophysical input for the growing economy is shrinking.
The biocapacity advantage of Botswana may have stimulated these positive socio-economic developments. Botswana’s choice to invest the fruit of this development into education and health may have fed this up-ward spiral. Today, Botswana’s level of GDP and HDI stand out among the 55 countries on the African continent. It has a per person GDP in the same range as South Africa and Gabon (the latter of the two also runs a significant biocapacity reserve). Botswana has also achieved the highest HDI in sub-Saharan Africa.
With their significant biocapacity advantage vanishing, the question arises whether this may erode Botswana’s economic opportunities. The country’s high income may allow its economy to access resources from elsewhere for some time—but the global competition for those inputs will inevitably tighten. The resource trends therefore suggest that Botswana’s prosperous age is at risk, if its resource situation is not carefully managed.
4. Discussion: The Stunning Paradox
There is also a potent counter argument that seemingly puts everything outlined in Section 3 into question.
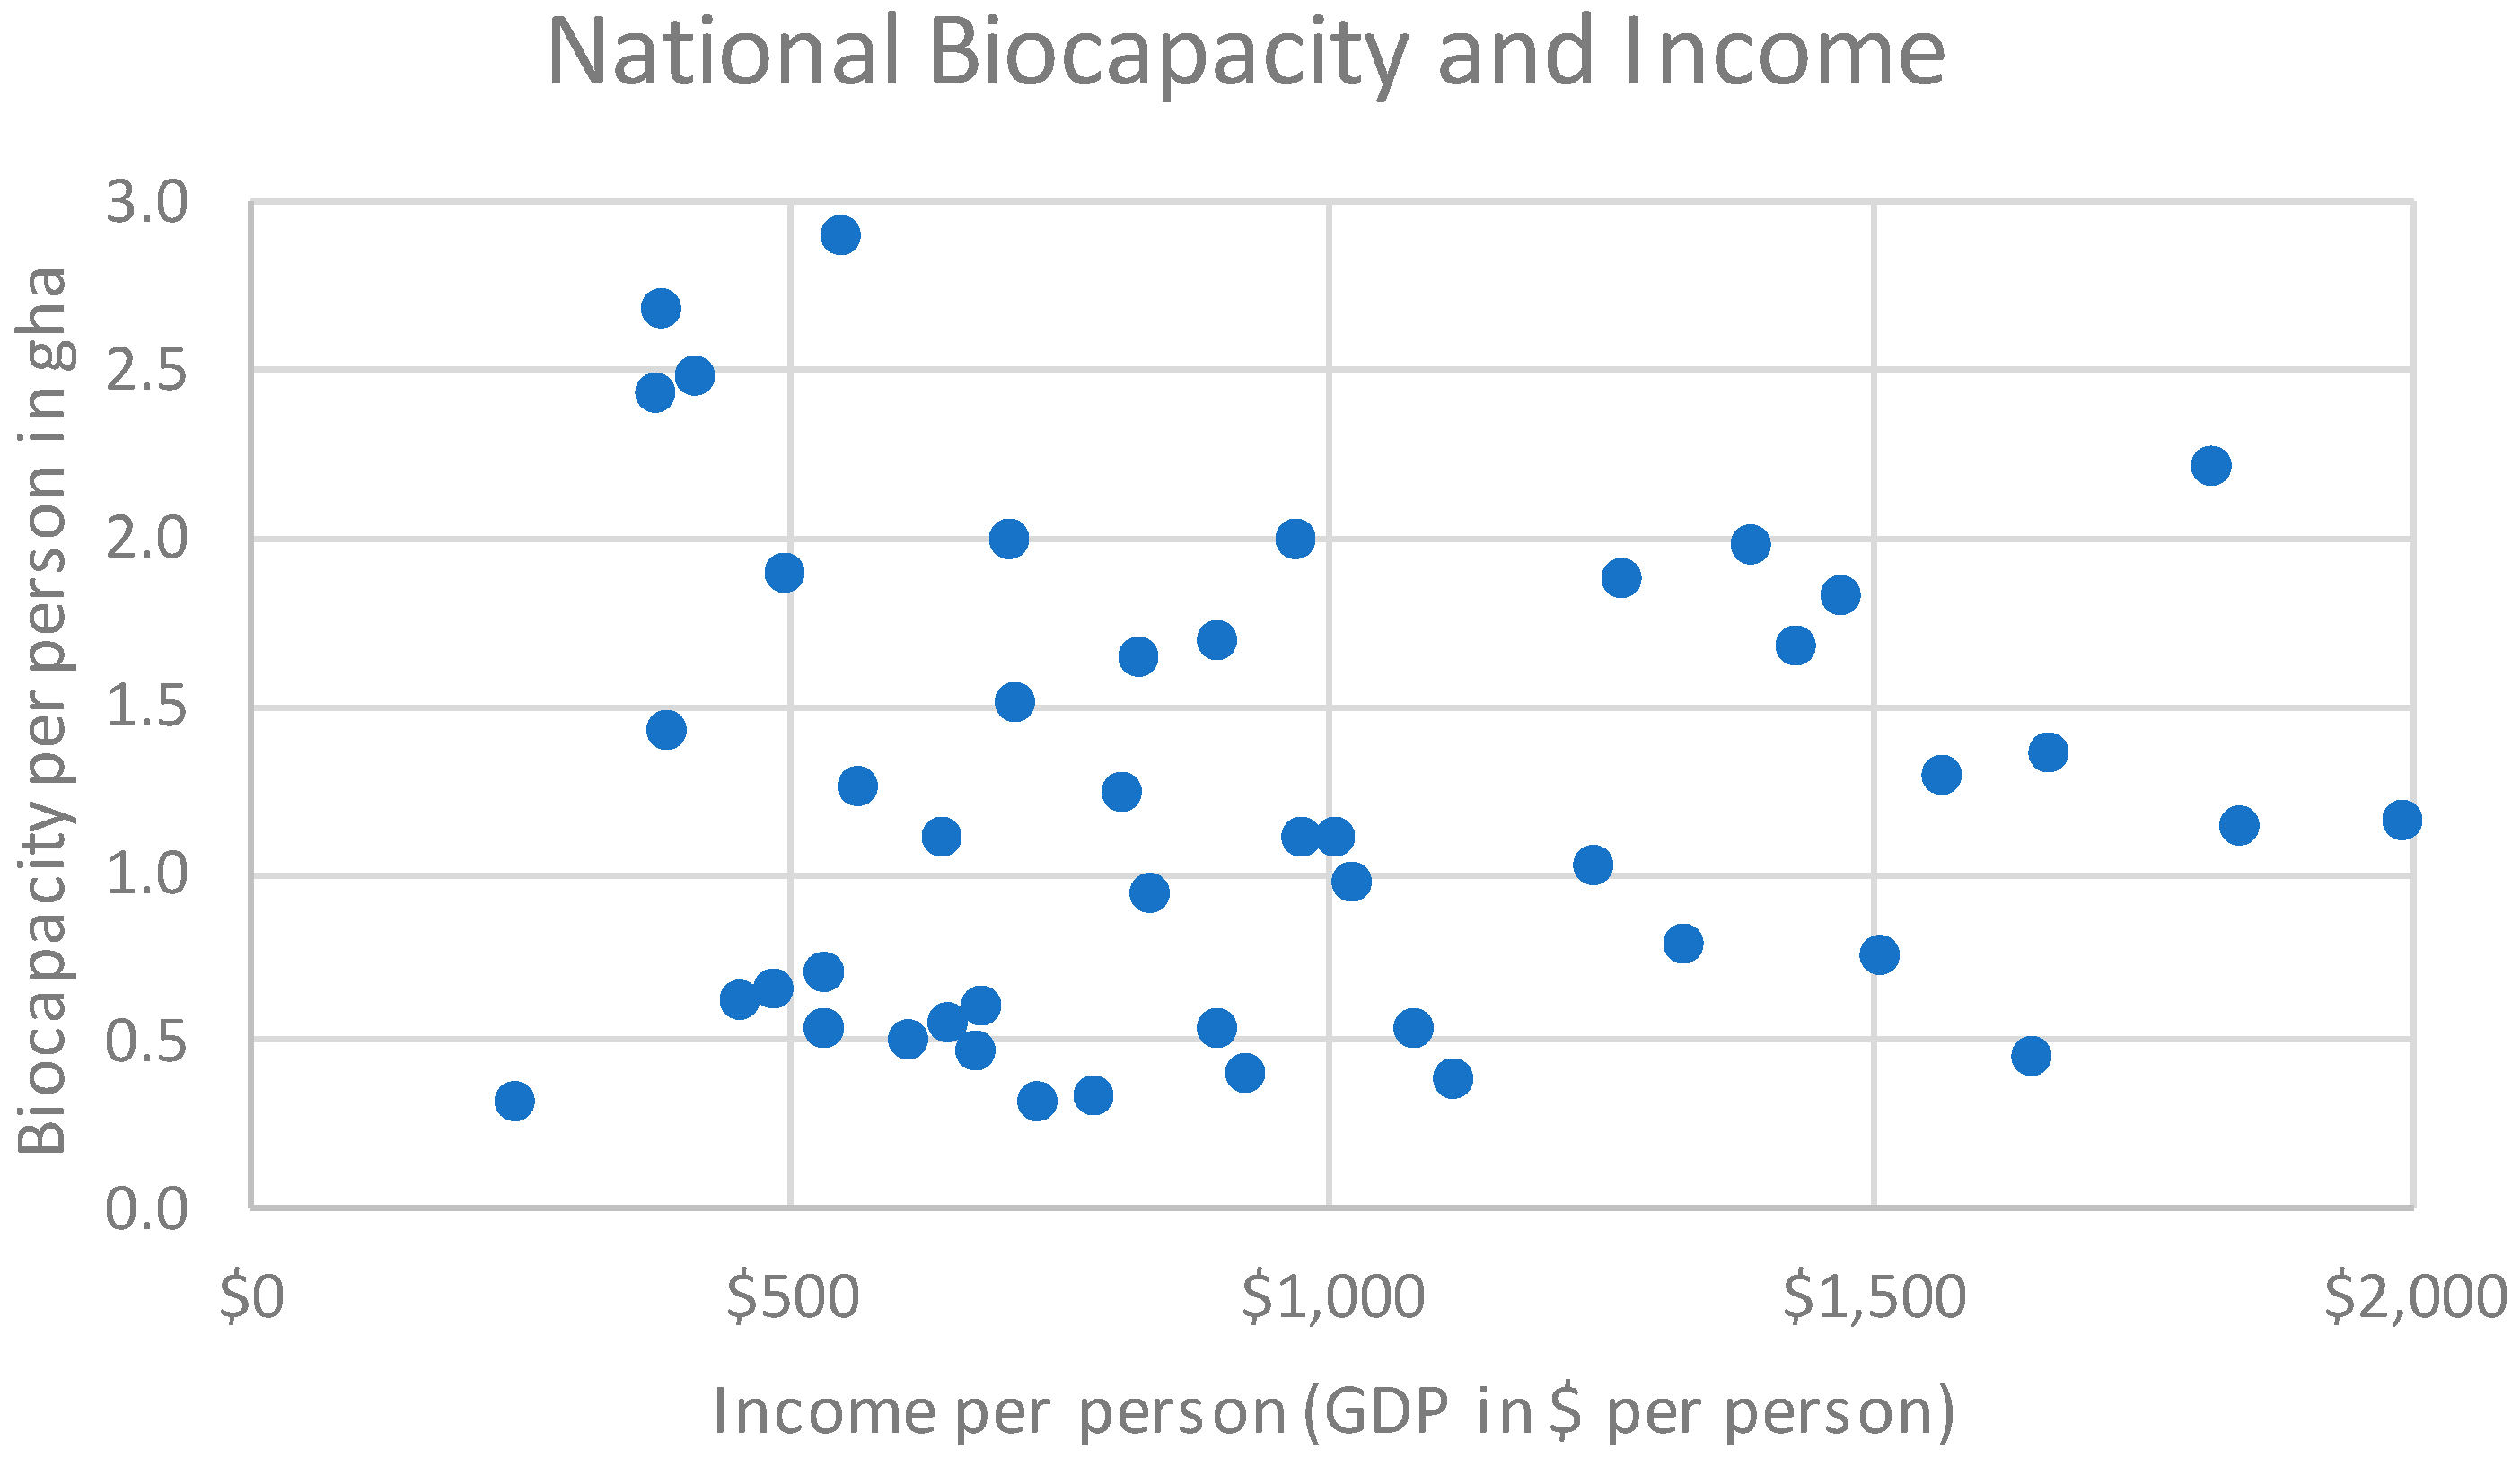
Recognizing that resource access and resource security are essential for economies to run, one may, therefore, hypothesize that biocapacity access and economic activities would be positively correlated. This should be particularly true for the lowest income countries, where a large portion of income is spent on food, and where the agricultural sector, both in population and portion of the country’s GDP, is far larger than in high-income countries. For instance, the agricultural portion of GDP is 44% for Niger, 40% for Burundi, and 34% for Kenya [49].
One could easily assume that, as with farms, particularly among those with a large agricultural share and overall low average income, countries with more biocapacity per person would also able to generate a larger income. Thus, the more formal hypothesis would be: Among low-income countries with a high share in agriculture (both % of jobs and % of GDP), there is a high, positive correlation between: a.) biocapacity per person (i.e., a proxy for farm size) and b.) per person GDP (proxy for average income).
However, analyzing the latest data, it turns out that this hypothesis is false. When plotting countries’ current biocapacities per person against current economic outputs or GDPs per person, it becomes apparent that presently there is no (or an even slightly negative) correlation between the two parameters (Figure 6). In other words, resource availability, or more specifically biocapacity availability, currently has no discernable positive impact on the income generation of countries, even among countries in the lowest income segment, typically characterized by a high agricultural share in GDP. This result is like finding that the size of the farm has no correlation with the economic opportunities of the farm family.
This lack of correlation is a paradox, rather than a contradiction, because both perspectives are true:
- On the one hand, human material demand is ever increasing and now significantly exceeds what the planet can renew. Economies are physical occurrences; to operate, they need to be fed with resource inputs and provided with absorptive capacities for their wastes. Without being able to feed their physical metabolism, economies will not be able to produce adequately. Any life, including human life, inescapably depends on biocapacity.
- On the other hand, over the last decades, biocapacity availability (the most fundamental resource on which the human enterprise depends, as explained above) has not been a determinant of economic success. This holds true even today, when the world community has contractually recognized the overuse of the planet’s biosphere (as evident through the Paris Agreement, the commitments to the SDGs, or the Aichi Targets). And in countries with low per person income and with very large portions of their populations engaged in agricultural activities, biocapacity access has not discernably stimulated income generation.
How can this paradox be reconciled, and what does it mean?
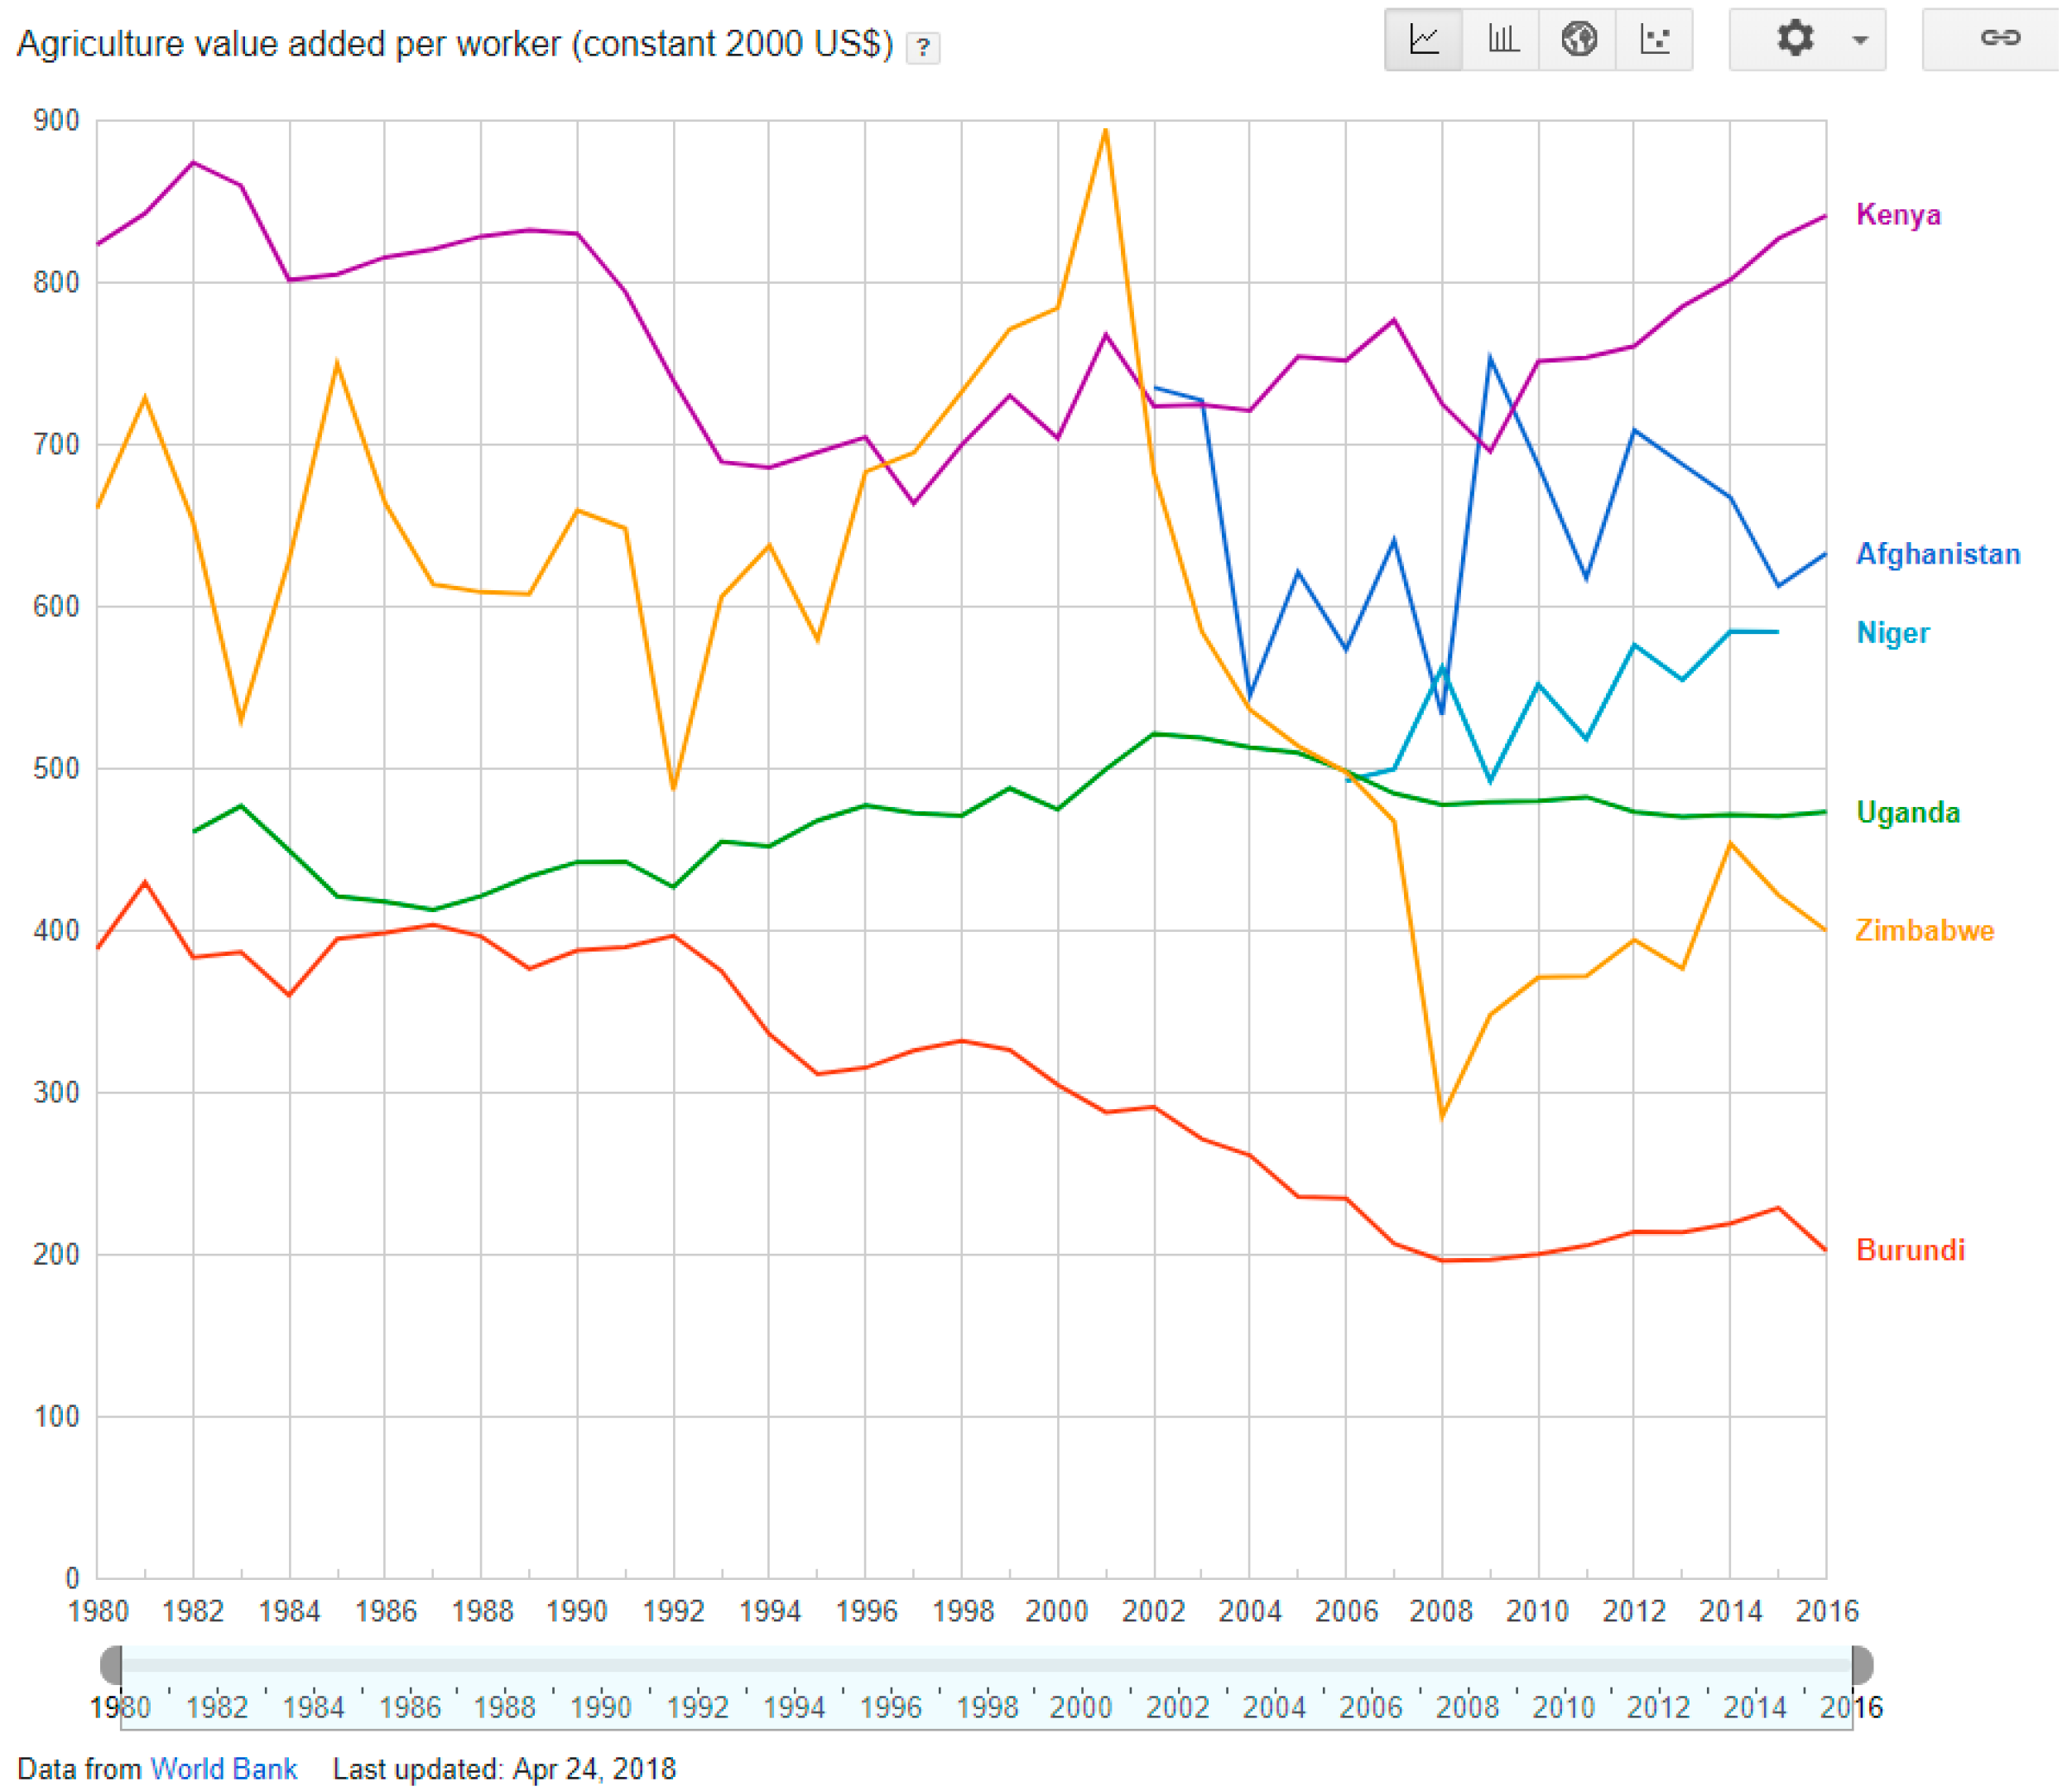
One possible interpretation of this paradox is that the economic bias against the agricultural and forestry sectors has been so tremendous that prices do not reflect the structural significance of biocapacity. The reality is that only very small portions of economic value chains are flowing back to the owners and managers of biocapacity, particularly in the agricultural and forestry sectors (Figure 7 shows the average income per agricultural worker in countries identified as being caught in the poverty trap). It seems that ever increasing and relatively cheap fossil fuel inputs succeeded in making biocapacity constraints surmountable through fossil fuel alternatives. Consequently, biocapacity constraints are economically invisible. Moreover, brands wield power over value chains: those who own the brand facing the consumer seem to capture the largest portion of the value created over the entire value chain. The agoras of cities determine prices and distribution. Cities are the power centers that shape markets.
Cities (and the non-agricultural sectors largely making up city economies) seem to have the economic upper hand no matter what. All value chains build on two initial inputs: natural capital and knowledge/know-how. On the natural capital side of the value chain, the economic system favors those actors closest to the brands. In contrast, the knowledge/know-how side of the value chains (IP, whether patents, software, licensed business models, etc.) is financially recognized and legally protected. Those who hold the IP can capture a good share of the financial benefits the value chain produces. In both the IP and the natural capital case, city economies are favored over rural economies. The financial (and knowledge) capital wins over the natural capital.
Similarly, when analyzing the resource intensity of sectors through Global Footprint Network’s Multi-Regional Input-Output (MRIO) analysis, it becomes evident that the resource intensity in agriculture (i.e., the annual value-add per global hectare used) is typically higher by a factor of 10 than that in the heavy industries [43,52]. One can interpret this as an inefficiency in the agricultural sector, or as a sign of the agricultural sector’s inability to capture a fair share of the value creation within their value chains.
This urban advantage is not an immutable given. In fact, if prices do not adequately reflect physical reality, they do not change this physical reality. Rather these prices discourage economic processes from adapting to new physical realities. The result is blindness of the market, leading to an increased risk for surprising, rapid transitions and disruptions, rather than smooth adaptation. Furthermore, the low prices for the fruits of natural capital incentivize urban economies to further expand and build urban infrastructure that is physically unfit for a resource constrained world. In other words, all the built and the human/social capitals are expanded, without expanding the natural capital, on which the other types of capital depend.
The consequence may be very economically significant: All those built physical assets that depend on substantial amounts of natural capital to operate, i.e., most of the conventional urban physical infrastructure, will decrease in value if this infrastructure no longer has adequate access to the natural capital to power it. Moreover, these infrastructure assets will lose in value at the worst time: when the economy is struggling. As a result, the current disequilibrium between natural and financial capital encourages development patterns that are undermining the sustainability of these very patterns.
Further, as long as our economies use fossil fuels, the products of regenerative natural capital stand in direct competition with fossil fuel for energy, fibers, and materials. For instance, 35% of the fibers in garments and materials are currently biological, rather than synthetic, in origin. In 1960, this amount was 97% [53]. Fossil fuel is radically cheap, particularly considering its quality, energy intensity, and versatility. Consider this: 10 hours of a person working hard on a treadmill corresponds to about 1 kilowatt-hour of mechanical energy. Households can typically buy that amount of versatile electricity for less than 15 cents. In the US, gasoline can currently be purchased at the pump for 10 cents per kilowatt-hour (kWh) of chemical energy. Easy access to fossil fuel has outcompeted the regenerative economy in nearly all domains. However, the tables are turning at least in the energy sector, with increasingly cost competitive solar and wind applications for electricity, and continuous price-drops of such technologies. Nevertheless, the massive use of fossil fuels, for materials and energy continues to seem economically attractive to many actors, even in the face of the Paris Agreement, which would require a rapid phasing out of fossil fuel use.
Given how fundamental natural capital input is to economic activities, and given the physical overuse of natural capital, it seems unlikely that this price imbalance will maintain itself indefinitely. Preparing ourselves for the possibility that this imbalance will not last marks the difference between potentially painful disruptions and smooth transitions.
It is up to each decision-maker to ponder: is humankind now entering an ‘(over)full world,’ a world where human demand is overpowering the regenerative capacity of the planet? Might such a context produce different dynamics than those in an ‘empty world’ in which our decision-making theories have been developed? Are these decision-making approaches still fit for the new world?
A regenerative economy is the only future there is, whether we like it or not. Whether the urban advantage will remain in such an economy is not clear, and urban frailty may increase with even larger urbanization, as to be expected from current trends.
Ultimately, the outcome is a bet. Decision-makers must choose between possibility (a) or (b):
- (a)
- Either we assume that market forces and prices can, with sufficient accuracy, predict the future importance of natural capital and, in response, economic activities will react quickly enough to new resource contexts.
- (b)
- Or, we assume that people (and their economies) are biological beings that are inextricably dependent on natural capital to operate, even if prices seem to indicate a very small dependence on the “production factor” natural capital. The implication of the physical nature of the human enterprise, including the large time-lags inherent in many physical systems to adjust in size (road, energy, and housing infrastructure, and human populations), is that corrections need to be made early, even in absence of price signals.
The authors ultimately consider (b) to be the more probable scenario and, therefore, the more significant force shaping the long-term prospects of our economies.
5. Conclusions: Ways out
If one assumes that physical resource trends, in the context of global climate change and resource constraints, are better predictors of future possibilities than current market signals about the value and significance of natural capital, it is imperative to actively manage one’s country’s (or city’s) resource security.
From this perspective, resource security is an enabler of lasting development, not a sideshow or a luxury. In contrast, the significance of resource security as a key parameter for long-term success, particularly in the development debate and the development literature is largely absent. More problematically, many standard textbooks on development economics pay much more attention to the concept of “resource curse” than a recognition of resource security as a key factor for success [54,55,56,57,58].
Accepting that physical reality matters, and that economies do require material inputs to operate, the shown trends indicate growing risks, most immediately for lower-income countries with low amounts of biocapacity per person.
Current trends do not have to become destiny. The past does not necessarily determine people’s future, if they choose wisely. Our current choices do. Through wise, forward-looking decisions, humanity can turn around natural resource consumption trends while improving the quality of life for all people.
While our planet is finite, human possibilities are not. The transformation to a sustainable, carbon-neutral world will succeed by applying humanity’s greatest strengths: foresight and innovation. The good news is that this transformation is not only technologically possible; it is also economically beneficial and our best chance for a prosperous future.
Four key areas shape our long-term trends most forcefully. All of them are determined by individual and collective choices:
- Cities—How people design and manage cities: Compact, integrated cities are far more efficient than sprawling, segregated settlements. The way our cities are shaped determines heating and cooling needs, transportation, and other key resource consumption drivers. Cities are shifting rapidly. Eighty percent of an even larger world population is expected to live in cities by 2050. This amount translates into a near doubling of urban populations by then. Consequently, city planning and urban development strategies are instrumental to keep society’s overall material demand within what natural capital can renew. Mobility needs and the energy efficiency of housing shapes cities’ long-term resource dependence.
- Energy—How we power ourselves: renewables can replace fossil fuels. Carbon emissions currently make up the biggest share of humanity’s Footprint. Decarbonizing the economy is humanity’s best possible chance to address climate change as it would lower humanity’s Ecological Footprint dramatically.
- Food—How societies produce, distribute, and consume food: local, vegetable-based diets versus industrial animal-based diets. How humanity meets one of everybody’s most basic needs—food—is a powerful way to influence sustainability. Avoiding food waste, sustainable agriculture, and eating lower on the food chain lowers the Ecological Footprint. Currently, food production uses over half of our planet’s biocapacity.
- Population—How many people we are: smaller families with better health and educational outcomes. Being committed to everyone living secure lives in a world of finite resources requires addressing population size and population growth. We owe it to our children. Empowering women, establishing equal rights for all, and providing reliable access to family planning significantly reduces family size and is, therefore, essential for global sustainability. Not only does it lead to smaller families, but also better health and educational outcomes. Maybe, for a full demographic transition, it may also require building at least basic old-age security that lowers the risk of old age impoverishment for those who chose small families. In the lowest income countries, focusing on transforming demographic trends while enabling opportunities by accelerating zero-carbon energy access everywhere, and boosting agricultural productivities among small holders, may be among the most promising core strategies for snowballing human development.
Developing thriving lives for all within the means of our planet is not out of reach. Plenty of solutions exist, in these four major areas, for improving the chances of a sustainable future. All these areas are characterized by enormous inertia: they cannot be shifted rapidly. This means societies can either lock themselves into highly valuable assets or, just as likely, lock themselves into infrastructure traps that severely limit economic possibilities in the long-run.
It is up to the present generation to choose. Given the slow response rate of infrastructure, the time to choose is now.
Author Contributions
Conceptualization, M.W., D.L., L.H. and P.R.; Data curation, D.L., M.E. and L.H.; Formal analysis, M.E.; Funding acquisition, M.W.; Investigation, M.W., D.L., M.E. and L.H.; Methodology, D.L. and L.H.; Writing—Original Draft, M.W.; Writing—Review & Editing, M.W., L.H. and P.R. All authors but P.R. work for Global Footprint Network. P.R. serves as a voluntary advisor to Global Footprint Network. While Global Footprint Network has a mission to help build a world where all can thrive within the means of this one planet, we took care to not have that influence the objectivity of the analysis of this research paper. In fact, the lack of correlation between per person income and per person biocapacity among low-income countries as revealed in Figure 6 surprised the authors.
Funding
This research was enabled by generous grants, including two to support the development of metrics for international development by The Barr Foundation (www.barrfoundation.org) and several to maintain and improve the National Footprint and Biocapacity Accounts by MAVA foundation (www.mava-foundation.org). Additional support came from individual donors to Global Footprint Network. Global Footprint Network and the authors gratefully acknowledge that this study would not have been possible without all this support. Still, none of the grantors influenced the outcome of this study.
Conflicts of Interest
This research and the publication result from the free will and independent choices of its authors. None of the authors received financial incentives to shape the conclusions of this study.
References
- Malthus, T.R. An Essay on the Principle of Population: Or, A View of Its Past and Present Effects on Human Happiness, 4th ed.; J. Johnson: London, UK, 1807; Volume 1. [Google Scholar]
- Meadows, D.H.; Meadows, D.L.; Randers, J.; Behrens, W.W., III. The Limits to Growth: A Report for the Club of Rome’s Project on the Predicament of Mankind; Universe Books: New York, NY, USA, 1972; ISBN 978-0-87663-165-0. [Google Scholar]
- André, C.; Platteau, J.-P. Land relations under unbearable stress: Rwanda caught in the Malthusian trap. J. Econ. Behav. Organ. 1998, 34, 1–47. [Google Scholar] [CrossRef]
- Galor, O.; Weil, D.N. Population, Technology, and Growth: From Malthusian Stagnation to the Demographic Transition and beyond. Am. Econ. Rev. 2000, 90, 806–828. [Google Scholar] [CrossRef]
- Kochanek, K.D.; Murphy, S.L.; Xu, J.; Arias, E. Mortality in the United States, 2016. DHHS Publication; 2017; p. 8. Available online: https://www.cdc.gov/nchs/products/databriefs/db293.htm (accessed on 10 April 2019).
- Murphy, S.L.; Xu, J.; Kochanek, K.D.; Arias, E. Mortality in the United States, 2017. DHHS Publication; 2018; p. 8. Available online: https://www.cdc.gov/nchs/products/databriefs/db328.htm (accessed on 10 April 2019).
- Schwab, K. The Global Competitiveness Report 2017–2018; World Economic Forum: Geneva, Switzerland, 2017; p. 393. [Google Scholar]
- World Economic Forum. The Global Risks Report 2018, 13th ed.; World Economic Forum: Geneva, Switzerland, 2018; p. 80. [Google Scholar]
- Rockström, J.; Steffen, W.; Noone, K.; Persson, Å.; Chapin, F.S., III; Lambin, E.F.; Lenton, T.M.; Scheffer, M.; Folke, C.; Schellnhuber, H.J.; et al. A safe operating space for humanity. Nature 2009, 461, 472–475. [Google Scholar] [CrossRef] [PubMed] [Green Version]
- Steffen, W.; Richardson, K.; Rockström, J.; Cornell, S.E.; Fetzer, I.; Bennett, E.M.; Biggs, R.; Carpenter, S.R.; de Vries, W.; de Wit, C.A.; et al. Planetary boundaries: Guiding human development on a changing planet. Science 2015, 347, 1259855. [Google Scholar] [CrossRef] [PubMed]
- Millennium Ecosystem Assessment. Ecosystems and Human Well-being: Synthesis; Island Press: Washington, DC, USA, 2005. [Google Scholar]
- Intergovernmental Panel on Climate Change. Climate Change 2014: Synthesis Report. Contribution of Working Groups I, II and III to the Fifth Assessment Report of the Intergovernmental Panel on Climate Change; Intergovernmental Panel on Climate Change: Geneva, Switzerland, 2014; p. 151. [Google Scholar]
- UNFCCC Paris Agreement 2015. Available online: https://unfccc.int/sites/default/files/english_paris_agreement.pdf (accessed on 10 April 2019).
- Parties to the Convention on Biological Diversity Indicators for the Strategic Plan for Biodiversity 2011–2020 and the Aichi Biodiversity Targets, Cancun, Mexico, 4–17 December 2016. p. 24. Available online: https://www.cbd.int/sp/targets/ or https://www.cbd.int/doc/decisions/cop-13/cop-13-dec-28-en.pdf (accessed on 10 April 2019).
- United Nations Transforming Our World: The 2030 Agenda for Sustainable Development. 2015. Available online: https://sustainabledevelopment.un.org/post2015/transformingourworld (accessed on 10 April 2019).
- Leaf, A. Potential Health Effects of Global Climatic and Environmental Changes. N. Engl. J. Med. 1989, 321, 1577–1583. [Google Scholar] [CrossRef] [PubMed]
- Raudsepp-Hearne, C.; Peterson, G.D.; Tengö, M.; Bennett, E.M.; Holland, T.; Benessaiah, K.; MacDonald, G.K.; Pfeifer, L. Untangling the Environmentalist’s Paradox: Why Is Human Well-being Increasing as Ecosystem Services Degrade? BioScience 2010, 60, 576–589. [Google Scholar] [CrossRef]
- Robinson, J.A.; Torvik, R.; Verdier, T. Political foundations of the resource curse. J. Dev. Econ. 2006, 79, 447–468. [Google Scholar] [CrossRef] [Green Version]
- Sachs, J.; Warner, A.M. Natural Resources and Economic Development: The curse of natural resources. Eur. Econ. Rev. 2001, 45, 827–838. [Google Scholar] [CrossRef]
- Gylfason, T. Natural resources, education, and economic development. Eur. Econ. Rev. 2001, 45, 847–859. [Google Scholar] [CrossRef] [Green Version]
- BP. BP Statistical Review of World Energy 2018, 67th ed.; BP p.l.c.: London, UK, 2018; p. 56. [Google Scholar]
- Butler, J.H.; Montzka, S.A. The NOAA Annual Greenhouse Gas Index (AGGI); NOAA Earth System Research Laboratory: Boulder, CO, USA, 2018. [Google Scholar]
- Tukker, A. Rare Earth Elements Supply Restrictions: Market Failures, Not Scarcity, Hamper Their Current Use in High-Tech Applications. Environ. Sci. Technol. 2014, 48, 9973–9974. [Google Scholar] [CrossRef] [PubMed]
- Wackernagel, M.; Galli, A.; Hanscom, L.; Lin, D.; Mailhes, L.; Drummond, T. Chapter 16: Ecological Footprint Accounts: Principles. In Routledge Handbook of Sustainability Indictors; Bell, S., Morse, S., Eds.; Routledge International Handbooks; Routledge: Abingdon, UK, 2018; pp. 244–264. [Google Scholar]
- Bar-On, Y.M.; Phillips, R.; Milo, R. The biomass distribution on Earth. Proc. Natl. Acad. Sci. USA 2018, 115, 6506–6511. [Google Scholar] [CrossRef] [PubMed]
- Esty, D.C.; Emerson, J.W. Chapter 5: From crises and gurus to science and metrics: Yale’s Environmental Performance Index and the rise of data-driven policymaking. In Routledge Handbook of Sustainability Indicators; Bell, S., Morse, S., Eds.; Routledge: New York, NY, USA, 2018; pp. 93–102. ISBN 978-1-138-67476-9. [Google Scholar]
- Sachs, J.; Schmidt-Traub, G.; Kroll, C.; Lafortune, G.; Fuller, G. SDG Index and Dashboards Report 2018; Bertelsmann Stiftung and Sustainable Development Solutions Network (SDSN): New York, NY, USA, 2018; p. 476. [Google Scholar]
- Sanderson, E.W.; Jaiteh, M.; Levy, M.A.; Redford, K.H.; Wannebo, A.V.; Woolmer, G. The Human Footprint and the Last of the WildThe human footprint is a global map of human influence on the land surface, which suggests that human beings are stewards of nature, whether we like it or not. BioScience 2002, 52, 891–904. [Google Scholar] [CrossRef]
- Purvis, A.; Newbold, T.; De Palma, A.; Contu, S.; Hill, S.L.L.; Sanchez-Ortiz, K.; Phillips, H.R.P.; Hudson, L.N.; Lysenko, I.; Börger, L.; et al. Chapter Five-Modelling and Projecting the Response of Local Terrestrial Biodiversity Worldwide to Land Use and Related Pressures: The PREDICTS Project. In Advances in Ecological Research; Bohan, D.A., Dumbrell, A.J., Woodward, G., Jackson, M., Eds.; Next Generation Biomonitoring: Part 1; Academic Press: Cambridge, MA, USA, 2018; Volume 58, pp. 201–241. [Google Scholar]
- Lettenmeier, M.; Liedtke, C.; Rohn, H. Eight Tons of Material Footprint—Suggestion for a Resource Cap for Household Consumption in Finland. Resources 2014, 3, 488–515. [Google Scholar] [CrossRef] [Green Version]
- Bringezu, S. Visions of a sustainable resource use. In Sustainable Resource Management: Global Trends, Visions and Policies; Bringezu, S., Bleischwitz, R., Eds.; Routledge: New York, NY, USA, 2017; pp. 155–215. ISBN 978-1-906093-26-6. [Google Scholar]
- Figueres, C.; Schellnhuber, H.J.; Whiteman, G.; Rockström, J.; Hobley, A.; Rahmstorf, S. Three years to safeguard our climate. Nature 2017, 546, 593–595. [Google Scholar] [CrossRef] [PubMed] [Green Version]
- United Nations Development Programme. 2016 Human Development Report: Human Development for Everyone; United Nations Development Programme: New York, NY, USA, 2016. [Google Scholar]
- United Nations Development Programme. Human Development Indices and Indicators: 2018 Statistical Update; United Nations Development Programme: New York, NY, USA, 2018; p. 123. [Google Scholar]
- Lin, D.; Hanscom, L.; Murthy, A.; Galli, A.; Evans, M.; Neill, E.; Mancini, M.S.; Martindill, J.; Medouar, F.-Z.; Huang, S.; et al. Ecological Footprint Accounting for Countries: Updates and Results of the National Footprint Accounts, 2012–2018. Resources 2018, 7, 58. [Google Scholar] [CrossRef]
- Haberl, H.; Erb, K.-H.; Krausmann, F. Global human appropriation of net primary production (HANPP). Encycl. Earth 2013. Available online: https://editors.eol.org/eoearth/wiki/Global_human_appropriation_of_net_primary_production_(HANPP) (accessed on 10 April 2019).
- Odum, H.T. Environmental Accounting: Emergy and Environmental Decision Making; Wiley: Hoboken, NJ, USA, 1996; ISBN 978-0-471-11442-0. [Google Scholar]
- Brown, M.T.; Ulgiati, S. Emergy and Environmental Accounting. In Encyclopedia of Energy; Cleveland, C., Ed.; Elsevier: New York, NY, USA, 2004. [Google Scholar]
- Rojstaczer, S.; Sterling, S.M.; Moore, N.J. Human Appropriation of Photosynthesis Products. Science 2001, 294, 2549–2552. [Google Scholar] [CrossRef] [PubMed]
- Wackernagel, M.; Rees, W. Our Ecological Footprint: Reducing Human Impact on the Earth; New Society Publishers: Gabriola Island, BC, Canada, 1996; ISBN 978-0-86571-312-3. [Google Scholar]
- Wackernagel, M.; Schulz, N.B.; Deumling, D.; Linares, A.C.; Jenkins, M.; Kapos, V.; Monfreda, C.; Loh, J.; Myers, N.; Norgaard, R. Tracking the ecological overshoot of the human economy. Proc. Natl. Acad. Sci. USA 2002, 99, 9266–9271. [Google Scholar] [CrossRef] [PubMed] [Green Version]
- Borucke, M.; Moore, D.; Cranston, G.; Gracey, K.; Iha, K.; Larson, J.; Lazarus, E.; Morales, J.C.; Wackernagel, M.; Galli, A. Accounting for demand and supply of the biosphere’s regenerative capacity: The National Footprint Accounts’ underlying methodology and framework. Ecol. Indic. 2013, 24, 518–533. [Google Scholar] [CrossRef]
- Wackernagel, M.; Galli, A.; Hanscom, L.; Lin, D.; Mailhes, L.; Drummond, T. Chapter 33: Ecological Footprint Accounts: Criticisms and Applications. In Routledge Handbook of Sustainability Indictors; Bell, S., Morse, S., Eds.; Routledge International Handbooks; Routledge: Abingdon, UK, 2018; pp. 521–539. [Google Scholar]
- Wackernagel, M.; Cranston, G.; Morales, J.C.; Galli, A. Ecological Footprint Accounts. In Handbook of Sustainable Development: Second Edition; Atkinson, G., Dietz, S., Neumayer, E., Agarwala, M., Eds.; Edward Elgar Publisher: Cheltenham, UK, 2014; pp. 371–398. ISBN 978-1-78254-469-2. [Google Scholar]
- Global Footprint Network. National Footprint Accounts, 2018 Edition; 2018; Available online: http://data.footprintnetwork.org (accessed on 10 April 2019).
- Victor, P.A. Managing Without Growth: Slower by Design, Not Disaster; Edward Elgar Publishing: Northampton, MA, USA, 2008; ISBN 978-1-84844-299-3. [Google Scholar]
- Central Intelligence Agency Africa: Botswana. Available online: https://www.cia.gov/library/publications/the-world-factbook/geos/bc.html (accessed on 4 January 2019).
- Transparency International Corruption Perceptions Index 2017. Available online: https://www.transparency.org/news/feature/corruption_perceptions_index_2017 (accessed on 4 January 2019).
- World Bank Agriculture, Forestry, and Fishing, Value Added (% of GDP). Available online: https://data.worldbank.org/indicator/NV.AGR.TOTL.ZS (accessed on 1 January 2019).
- World Bank World Development Indicators. Available online: https://datacatalog.worldbank.org/dataset/world-development-indicators (accessed on 2 January 2019).
- Google Public Data Explorer World Development Indicators. Available online: https://www.google.com/publicdata/explore?ds=d5bncppjof8f9_&met_y=ny_gdp_mktp_cd&hl=en&dl=en#!ctype=l&strail=false&bcs=d&nselm=h&met_y=labor_participation_rate&scale_y=lin&ind_y=false&rdim=region&idim=country:BDI:ZWE:UGA:AFG:HTI:KEN:NER&ifdim=region&hl=en_US&dl=en&ind=false (accessed on 4 January 2019).
- Weinzettel, J.; Steen-Olsen, K.; Hertwich, E.G.; Borucke, M.; Galli, A. Ecological footprint of nations: Comparison of process analysis, and standard and hybrid multiregional input–output analysis. Ecol. Econ. 2014, 101, 115–126. [Google Scholar] [CrossRef]
- Anzilotti, E. Food Waste is Going to Take Over the Fashion Industry. Available online: https://www.fastcompany.com/40584274/food-waste-is-going-to-take-over-the-fashion-industry (accessed on 4 January 2019).
- De Janvry, A.; Sadoulet, E. Development Economics: Theory and Practice; Routledge: New York, NY, USA, 2016; ISBN 978-1-317-50425-2. [Google Scholar]
- Roland, G. Development Economics; Pearson Education, Inc.: New York, NY, USA, 2014; ISBN 978-0-321-46448-4. [Google Scholar]
- Taylor, J.E.; Lybbert, T.J. Essentials of Development Economics, 2nd ed.; University of California Press: Oakland, CA, USA, 2015; ISBN 978-0-520-95905-7. [Google Scholar]
- Giugale, M.M. Economic Development: What Everyone Needs to Know, 2nd ed.; Oxford University Press: New York, NY, USA, 2017; ISBN 978-0-19-068841-7. [Google Scholar]
- Collier, P. The Bottom Billion: Why the Poorest Countries are Failing and What Can Be Done About It; Oxford University Press: New York, NY, USA, 2007; ISBN 978-0-19-804254-9. [Google Scholar]
Figure 1.
The biological resource situations of countries vary substantially. Note the scales of the graphs: All country graphs run from 1961 to 2014 (horizontal axis). The upper four countries are on the same vertical axis: 0–7 gha per person. For the bottom four countries, the vertical axes vary: from 0–3 gha per person (Indonesia) to 0–25 gha per person (Brazil). Source: Global Footprint Network [45], Lin et al. [35].

Figure 2.
To illustrate a country’s history embedded in its past resource performance, this figure shows the Ecological Footprint and biocapacity per person evolution for Albania. Source: Global Footprint Network [45], Lin et al. [35].

Figure 3.
Countries in southern Europe affected by the 2008 Euro crisis, leading to significant prolonged contractions, not only financially but also in resource metabolism. Source: Global Footprint Network [45], Lin et al. [35].

Figure 4.
Some countries with low income are also facing significant resource constraints. The ones shown here are in an “ecological poverty trap”. These countries’ populations grow faster than the biological productivity within their borders (including agriculture). As a result, their per person biocapacity declines. Due to low income, they are also not able to compensate the difference through purchases from abroad or through significant use of fossil fuel. As a result, their low per person Ecological Footprint is declining. Source: Global Footprint Network [45], Lin et al. [35].

Figure 5.
These country graphs from 1961 to the present provide insight into the future. They identify the countries next in line to be caught in an ecological poverty trap. Source: Global Footprint Network [45], Lin et al. [35].

Figure 6.
Even for countries in the lower income segment there was no correlation in 2014 between biocapacity per person and income. Note that one country with a GDP per person under 2000 USD per year has a biocapacity larger than 3 gha per person and is not shown on the graph: Central African Republic. With a biocapacity of 7.4 gha per person, Central African Republic reached a GDP of around 300 USD per person. Even without this outlier, the correlation is weak and slightly negative. Source: Global Footprint Network [45], and the World Bank [50].

Figure 7.
Data from the World Bank shows that in half of the countries stuck in an ecological poverty trap, farm income per person is declining. In all those countries, the agricultural income per worker is far below the country average (note: GDP averages out over the entire population, not just the working population). Source: Google Public Data Explorer [51] using World Bank [50].


Table 1.
The Human Development Index (HDI) of countries identified here as being caught in an “ecological poverty trap”, plus Haiti. They all rank low, though the HDI is still on the increase in each one of them. The first four columns show the HDI, and the fifth column the international HDI ranking according to the United Nations Development Programme’s Human Development Report [33,34].
| Country | 2000 | 2005 | 2010 | 2015 | HDI Rank (2015) out of 188 Countries |
|---|---|---|---|---|---|
| Afghanistan | 0.34 | 0.405 | 0.454 | 0.479 | 169 |
| Burundi | 0.268 | 0.290 | 0.385 | 0.404 | 184 |
| Haiti | 0.443 | 0.455 | 0.470 | 0.493 | 163 |
| Kenya | 0.447 | 0.483 | 0.530 | 0.555 | 146 |
| Niger | 0.255 | 0.286 | 0.323 | 0.353 | 187 |
| Rwanda | 0.332 | 0.404 | 0.464 | 0.498 | 159 |
| Uganda | 0.396 | 0.434 | 0.477 | 0.493 | 163 |
| Zimbabwe | 0.427 | 0.408 | 0.452 | 0.516 | 154 |
© 2019 by the authors. Licensee MDPI, Basel, Switzerland. This article is an open access article distributed under the terms and conditions of the Creative Commons Attribution (CC BY) license (http://creativecommons.org/licenses/by/4.0/).
Share and Cite
MDPI and ACS Style
Wackernagel, M.; Lin, D.; Evans, M.; Hanscom, L.; Raven, P. Defying the Footprint Oracle: Implications of Country Resource Trends. Sustainability 2019, 11, 2164. https://0-doi-org.brum.beds.ac.uk/10.3390/su11072164
AMA Style
Wackernagel M, Lin D, Evans M, Hanscom L, Raven P. Defying the Footprint Oracle: Implications of Country Resource Trends. Sustainability. 2019; 11(7):2164. https://0-doi-org.brum.beds.ac.uk/10.3390/su11072164
Chicago/Turabian StyleWackernagel, Mathis, David Lin, Mikel Evans, Laurel Hanscom, and Peter Raven. 2019. "Defying the Footprint Oracle: Implications of Country Resource Trends" Sustainability 11, no. 7: 2164. https://0-doi-org.brum.beds.ac.uk/10.3390/su11072164
Note that from the first issue of 2016, this journal uses article numbers instead of page numbers. See further details here.