Eco-friendly Pressure Drop Dehumidifier: An Experimental and Numerical Analysis


1
Departament of Energy, Universidade da Coruña, Paseo de Ronda, 51, 15011 A Coruña, Spain
2
Department of Mechanical Engineering, Catholic University of Ávila, C/Canteros, s/n, 05005 Avila, Spain
*
Author to whom correspondence should be addressed.
Sustainability 2019, 11(7), 2170; https://0-doi-org.brum.beds.ac.uk/10.3390/su11072170
Submission received: 20 February 2019
/
Revised: 5 April 2019
/
Accepted: 8 April 2019
/
Published: 11 April 2019
(This article belongs to the Special Issue Sustainability in the Built Environment and Climate Change)
Abstract
:The northwest of Spain is defined by very high relative humidity values, with an average relative humidity of 85% throughout the year, which is considered too high by most standards and therefore can be related to various health problems and fungi growth. To reduce the relative humidity level in the indoor environment, different dehumidification technologies are being employed. However, commonly employed cooling based dehumidification systems have a very high energy consumption, from 720 W in residential buildings to 3150 W in industrial buildings. This article aims to show a new method for indoor moist air dehumidification, based on a controlled adiabatic expansion of moist air, similar to the Foehn effect, by means of a nozzle–diffuser system. The main results, based on computational fluid dynamics (CFD) simulations and experimental tests in wind tunnels, show an initial working range of up to 80% relative humidity, with almost ten times reduction in energy consumption compared to the classical mechanical refrigeration dehumidifiers. Moreover, future improvements, such as a Peltier cooling system, which allows a reduction of the temperature in the nozzle throat, improving the condensation process, and a variable inlet area, could potentially improve the working range towards the required 30–60% relative humidity in buildings.
1. Introduction
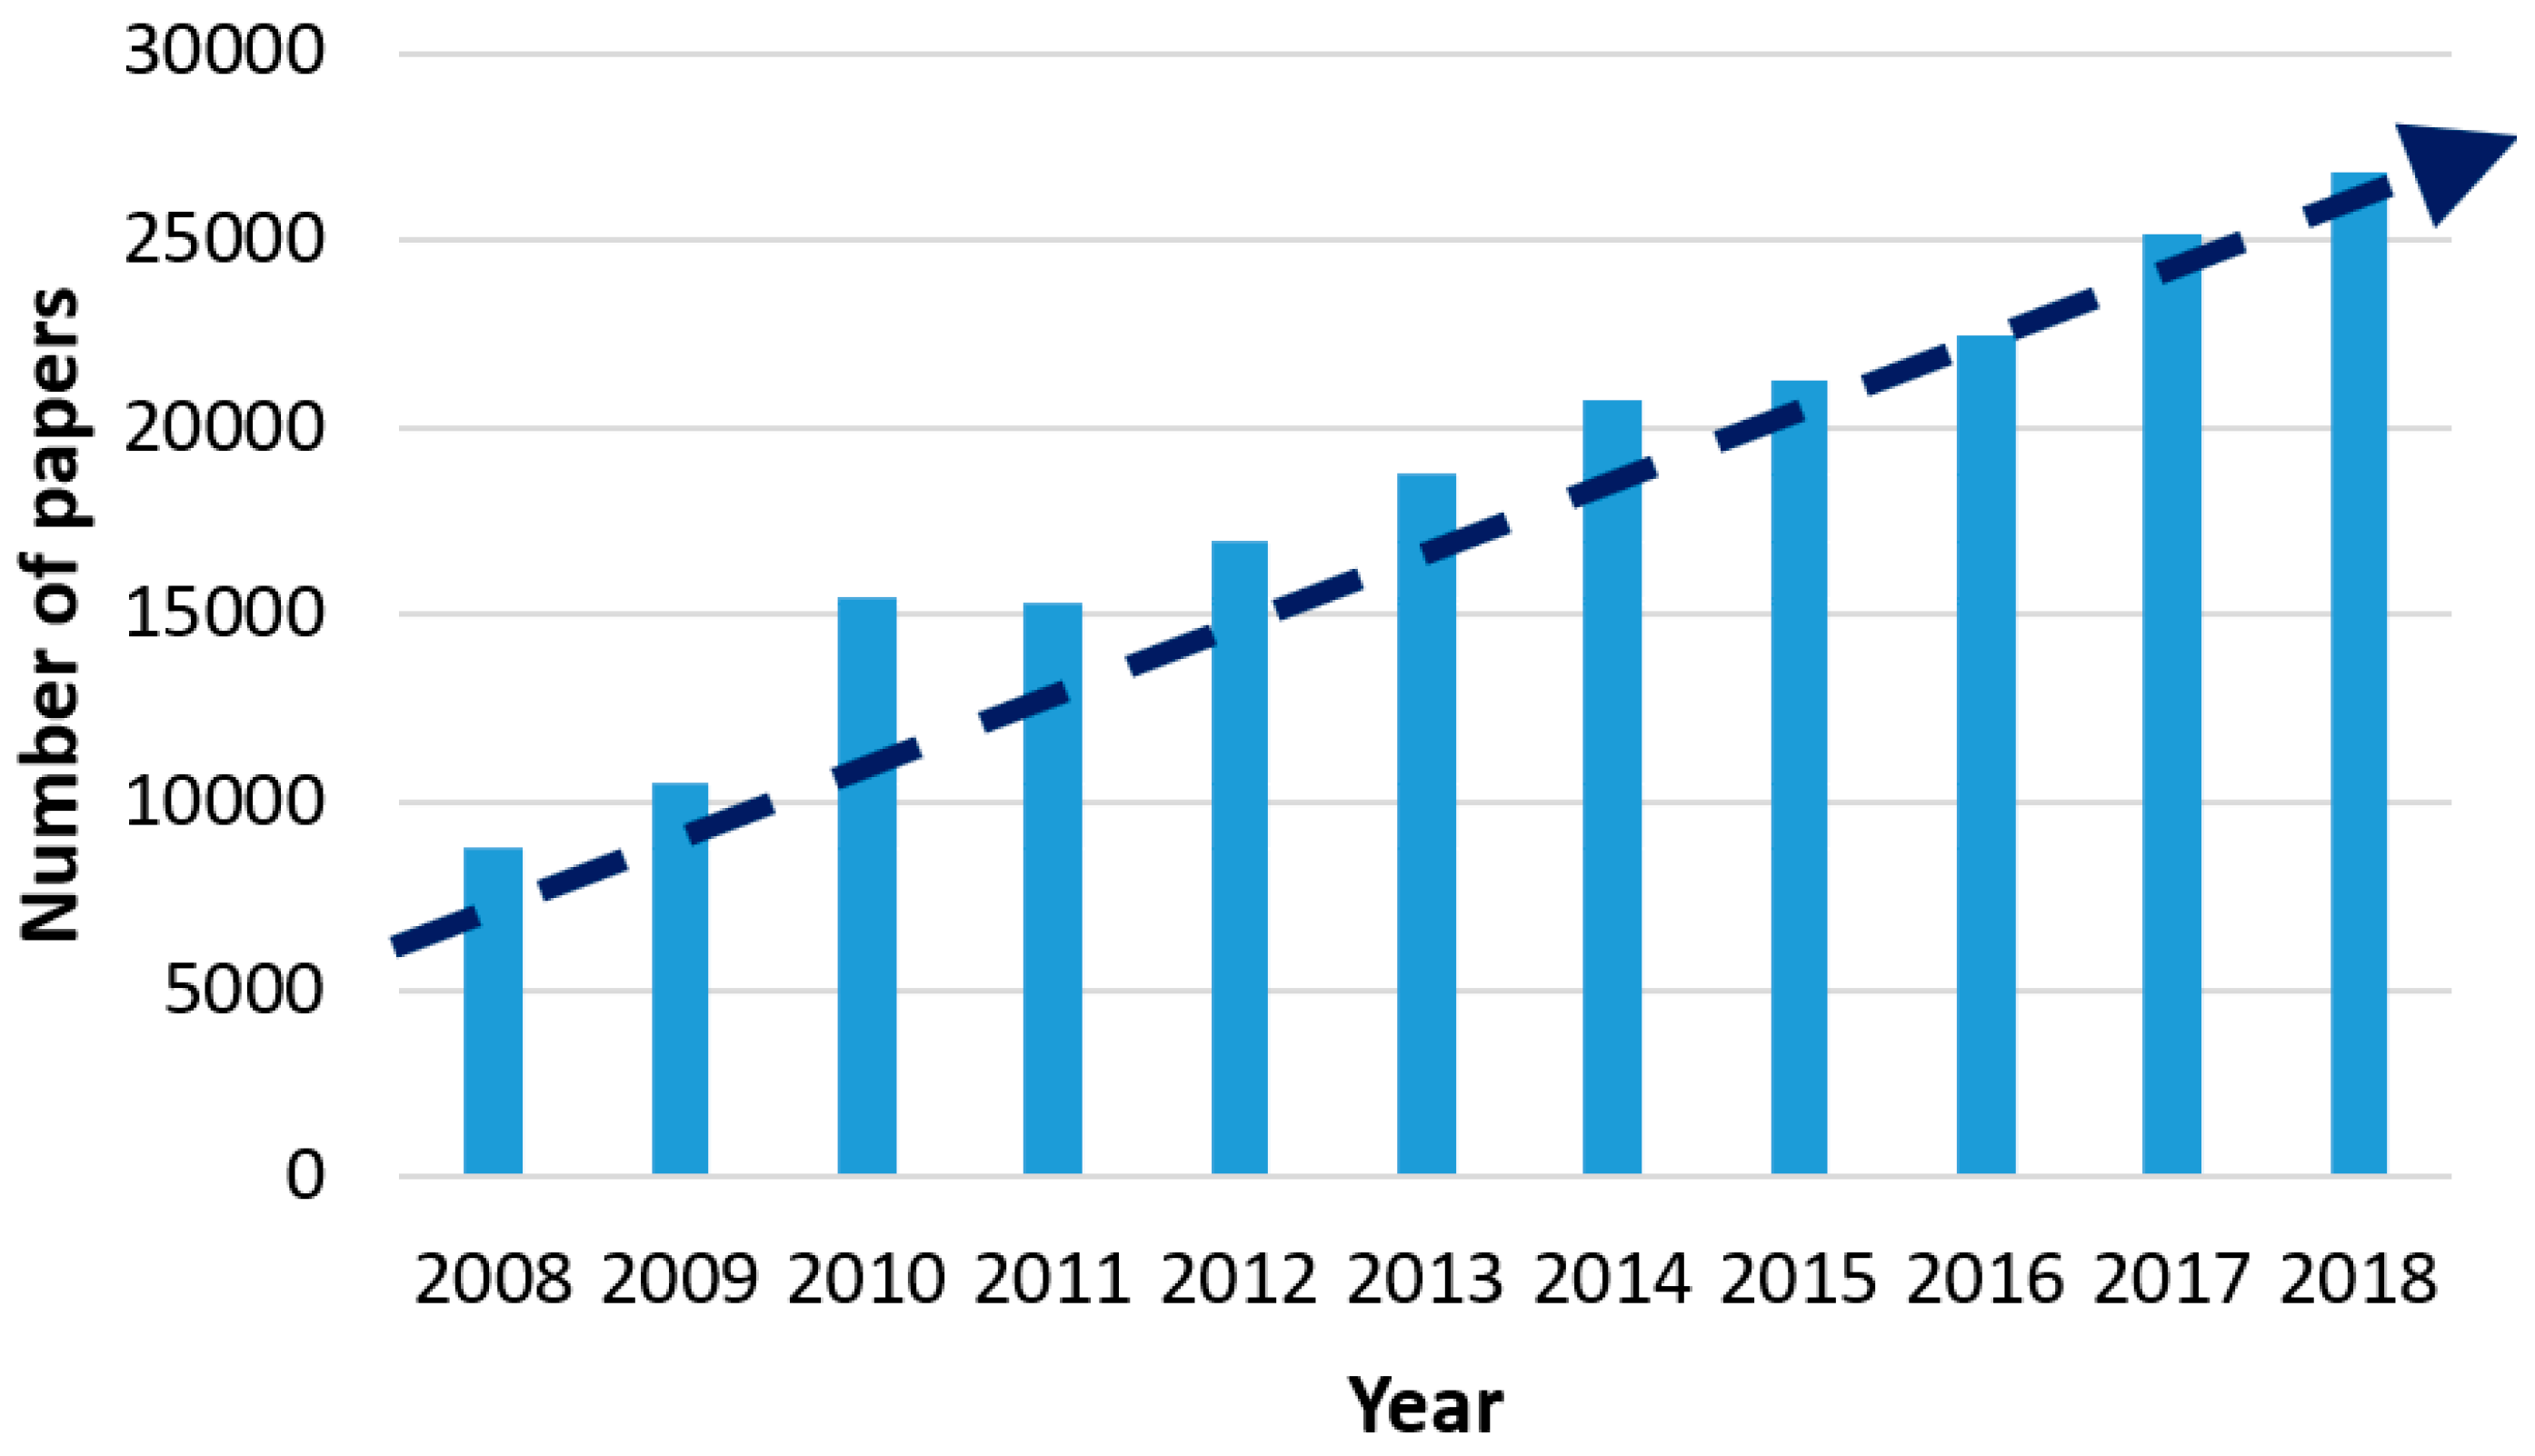
In accordance with the International Energy Agency (IEA) [1], the energy consumption of buildings is one-third of the final energy consumption globally. In particular, this energy consumption can be related to heating, cooling, ventilation and dehumidification systems. Thus, different research studies have been developed in the last few years to reduce this energy consumption. Given the importance of this topic in sustainability, the number of papers related to it is growing (Figure 1).
‘Nearly Zero Energy Buildings’ is the latest project of the European Commission [2], whose aim it is to get energy consumption in private and public buildings down to nearly zero by 2020. In this sense, several recent research studies [3,4,5] have described procedures for optimal retrofitting in old buildings, which will go towards helping with low energy consumption. Some of them are centered on passive methods, such as building thermal inertia [6] and phase-change materials, to control moisture in an indoor ambience, and its effects on thermal comfort, with low energy consumption [7].
The Spanish region of Galicia, in the northwest of Spain, has a very high average annual relative humidity (RH) of 85% throughout the year, and a very low annual average temperature of 10 °C [8], which is similar to the humidity level in some Chinese regions, as well as their related health and air conditioning needs [9]. In this sense, it must be highlighted that the American Society of Heating, Refrigerating, and Air-Conditioning Engineers (ASHARAE) Standard [10] recommends that relative humidity levels inside conditioned spaces are within the range of 30% to 60%, in order to reduce micro-organism development and its related diseases [11].
Taking into account the meteorological conditions, different dehumidification systems are employed to reach relative humidity levels below 60%. In this sense, an initial dehumidifier classification includes cooling-based dehumidification, desiccant dehumidification and the so-called hybrid systems [12,13]. Cooling-based dehumidification is based on cooling the air, with corresponding condensation and dehumidification, and is the most employed dehumidifier system in commercial and residential air conditioning systems. This cooling effect corresponds to heat transfer to an expanding gas from a liquid state, obtained in a close circuit by a compressor with high energy consumption. After that, most dehumidifiers employ a reheat system to increase the air temperature prior to returning it to the indoor environment, which further increases the total energy consumption to the range of 720 W in residential buildings to 3150 W in industrial buildings.
On the other hand, desiccant dehumidifiers create a lower partial vapour pressure on the surface of the desiccant that attracts the water molecules of the surrounding air inside the desiccant material. Once these materials are saturated with water, they need to be regenerated to release the water to another air stream by a heating process. This can be defined as more efficient dehumidification technology because it involves an isenthalpic and adiabatic process, when moist air comes in contact with the desiccant. In particular, a liquid desiccant solution has been identified as the most economical way of dehumidification based on the moist air and desiccant undergoing an adiabatic process with the surrounding environment, which does not need any kind of external energy except during the regenerative process where it employs the so-called reactivation heated air [14]. Furthermore, different types of desiccant dehumidifiers based on this same physical principle have been developed in previous years, such as a liquid spray-tower, solid packed tower, rotating horizontal bed, multiple vertical bed and rotating honeycomb [14].
Finally, when using these two procedures, the dehumidification process efficiency is the highest and is called a hybrid system, such as a refrigeration cycle-rotatory desiccant system [15]. New novel dehumidification technologies are still being developed to improve the efficiency, such as membrane-based technology [16] that dehumidifies without lowering the temperature due to an isothermal process [17] that can be obtained by mechanical or desiccant dehumidifiers.
Despite this, the energy consumption of the dehumidification process is still high and the procedures of the systems are sometimes complex. Taking into account the Foehn effect [18], moist air dehumidification based on a pressure drop was recently revealed as possible [19,20]. The pressure drop can be obtained when moist air pass through a nozzle.
In this way, the present paper aims to define the theoretical design, constructive characteristics and system capability analysis of a new low-energy dehumidification procedure based on a similar effect to that employed in air conditioning systems in concordance with the explained objectives of the IEA. To perform this, as in most recent related studies [21,22], the techniques of computational fluid dynamics (CFD) will be employed, (i) to show a tendency towards moist air condensation due to the expansion process in an experiment in a three-dimensional nozzle, and (ii) to define its energy consumption with respect to standard mechanical dehumidification systems. Furthermore, this original idea will be tested by an initial prototype that will help to define the constructive characteristics of this nozzle, being an initial step in the design of a future validated eco-friendly dehumidifier. Therefore, the objectives of this work are: (i) to define a procedure to develop a nozzle-diffuser system that emulates the Foehn effect in the mountains, (ii) to prototype a nozzle system that validates this, and (iii) to determine, by means of CFD simulations, the feasibility to control indoor relative humidity with a low energy consumption.
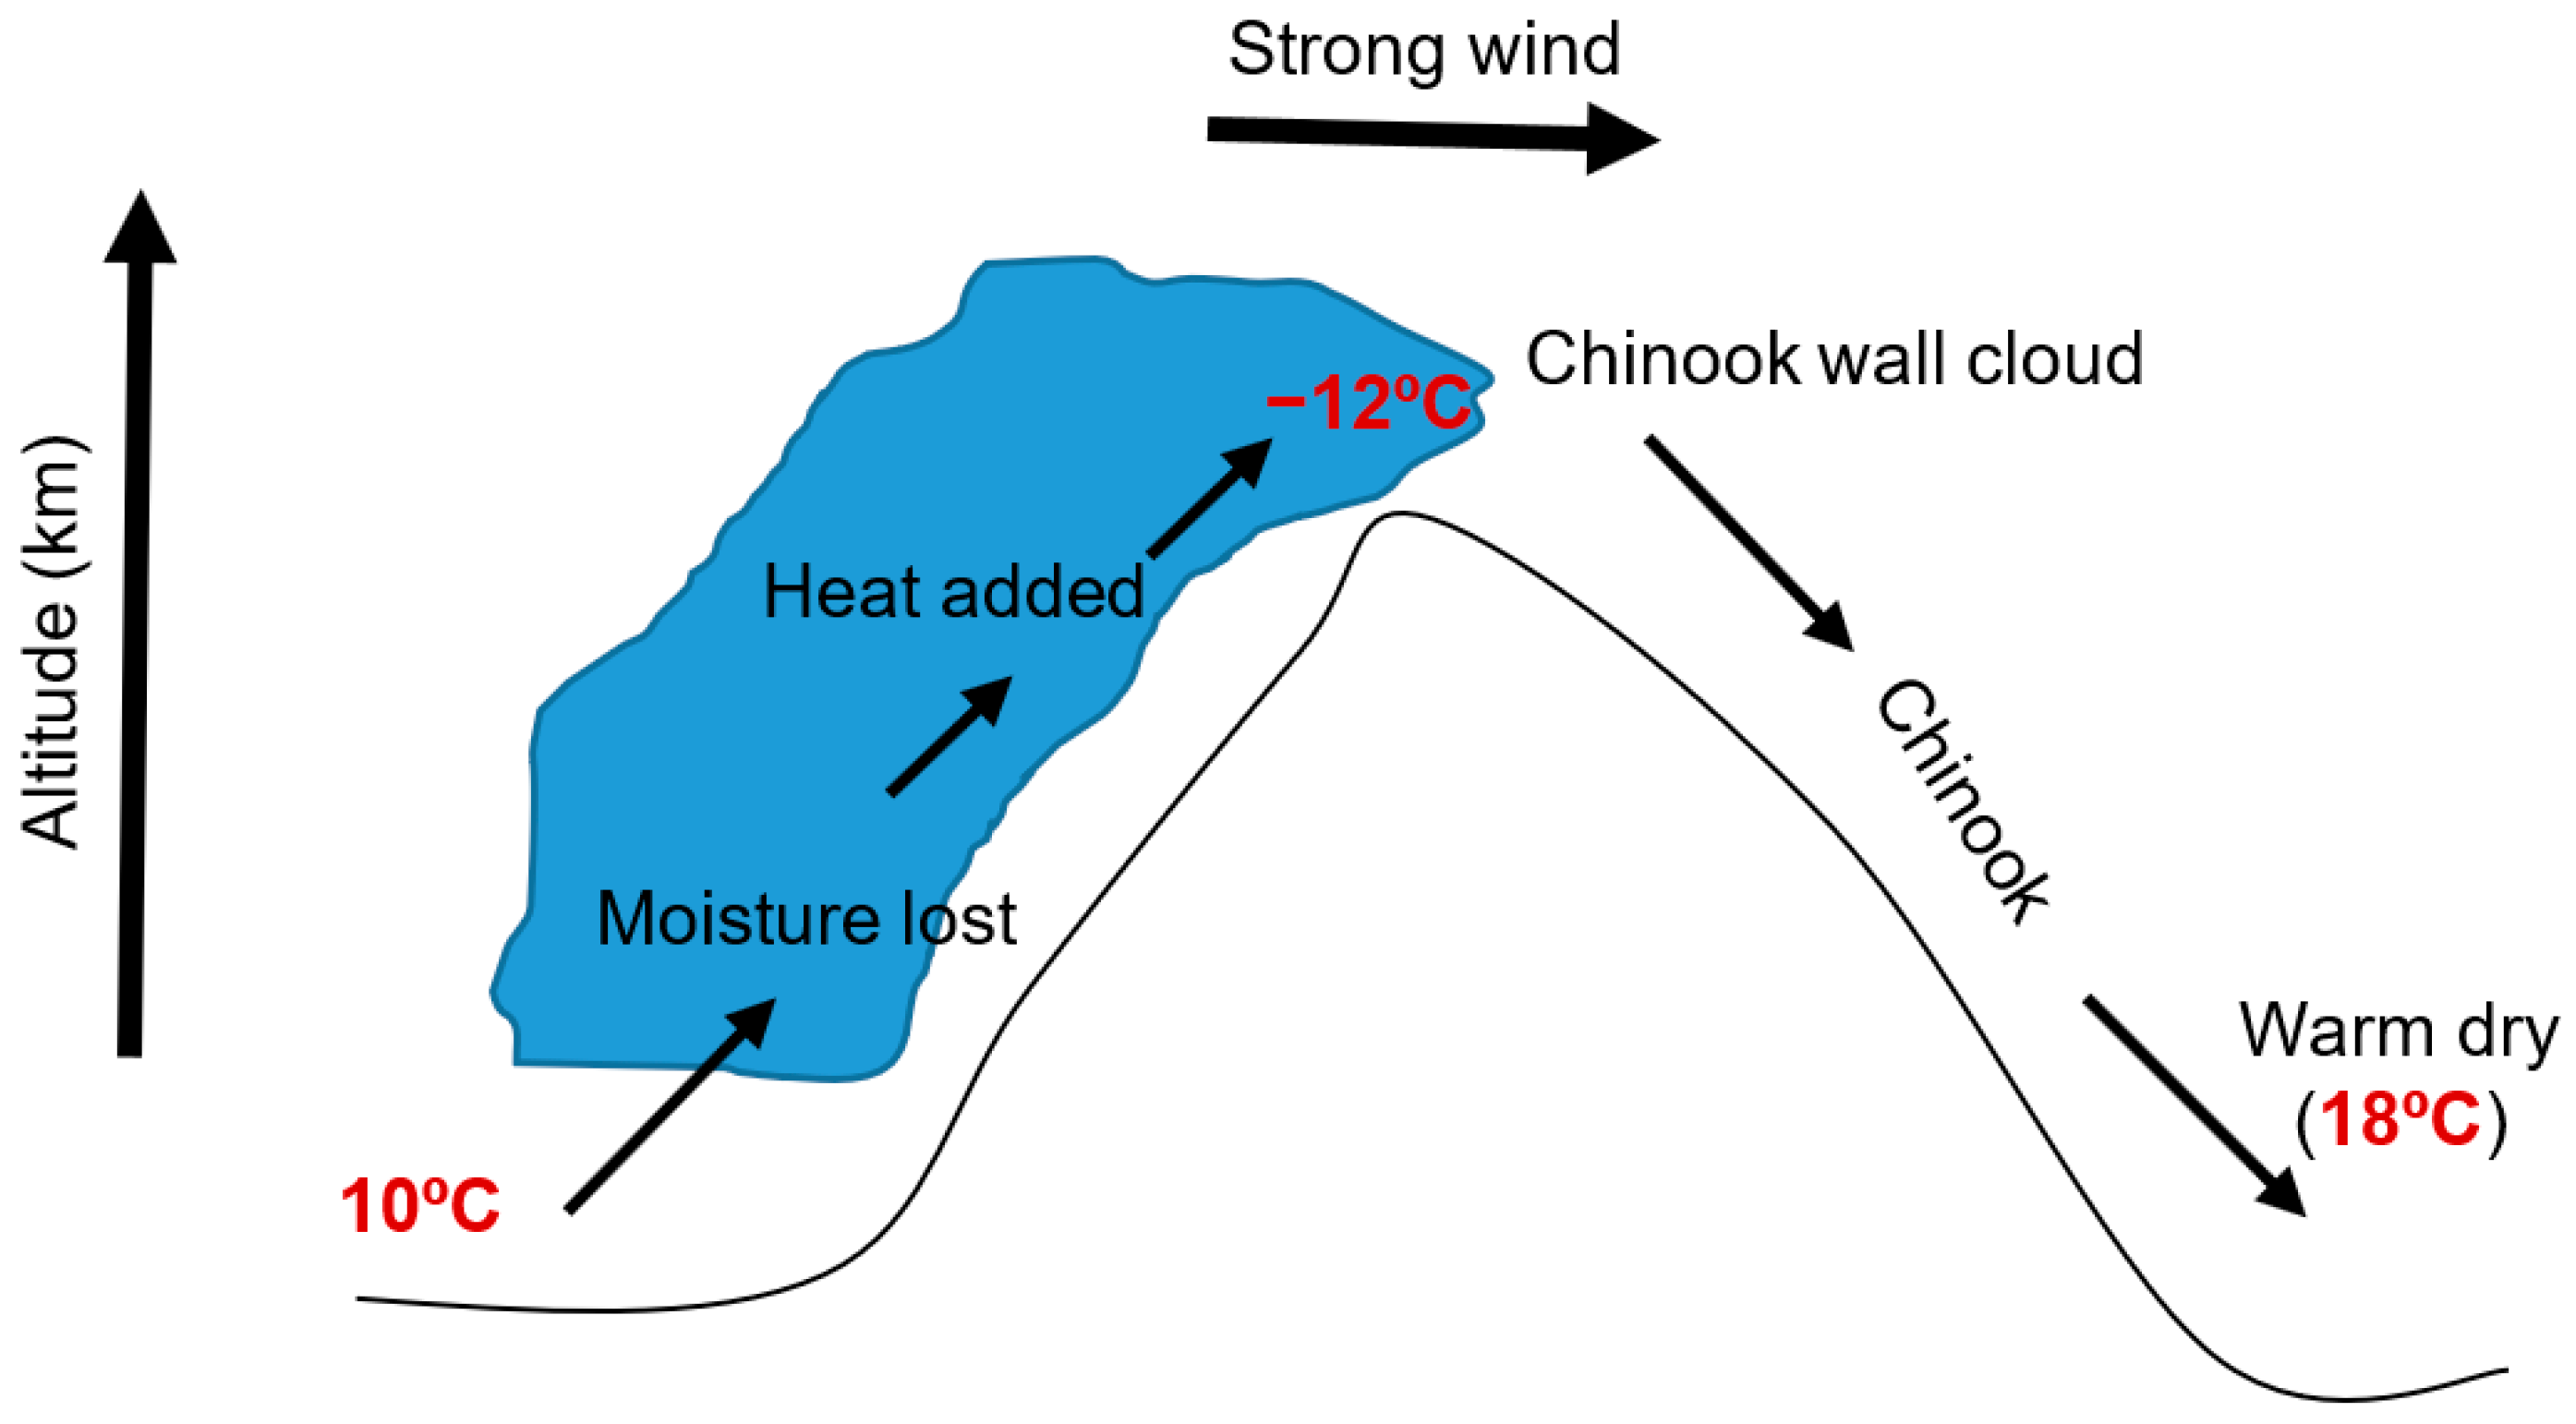
Thus, the present article shows a novel dehumidification technology based on the adiabatic process of a controlled Foehn effect, which may be of interest in the near future due to its low energy consumption when compared with cooling-based systems, and because it does not have the need for regenerative heat to restore the desiccant dehumidifiers. In the natural Foehn effect [18], hot and moist winds climb up mountains, and an adiabatic expansion and cooling process occurs, in accordance with each altitude increment, the water vapour it contains is condensed and precipitation occurs as a consequence. When descending on the other side of the mountain, the mass of air loses its moisture, and hence becomes a dry air that descends rapidly, increasing the atmospheric pressure and, therefore, the temperature (Figure 2).
2. Materials
As previously explained, the origin of this study focuses on the natural Foehn effect (Figure 2) and on the attempt to emulate it in a dehumidifier with the aim of controlling indoor ambience. In this sense, there is a lack of information about how to design a three-dimensional nozzle and only a two-dimensional process is well known in most mechanical fluid works. Furthermore, moist air phase change under a pressure drop is well known, but because the real moist air conditions are not the same in all device sections, the centre line of the flux of the CFD simulation will be considered as a control parameter between the two- and three-dimensional design.
To reach the objectives of the present paper, the following steps were carried out in the methodology employed in this research work: (i) an initial design—and the corresponding testing—of a nozzle in an open loop wind tunnel, and (ii) the final design and simulation of a diffuser that validates the previous (initial) results.
2.1. Software Resources
2.1.1. EES Software
The present article aims to show a moist air dehumidification procedure based on the decrement in the pressing process that it experiences within a nozzle. Despite the fact that it seems an easy-to-understand process, nowadays, few software resources allow us to develop a three-dimensional design of this effect. In this sense, the initial two-dimensional designs were developed with the EES software [23] due to its ease of understanding of the thermodynamic process.
In particular, mass and energy conservation in this internal flux was defined by an adiabatic process to the environment and without any kind of work exchange. As a consequence, the equations that define the expansion process in each point of the nozzle are the following:
where ρ is the moist air density (kg/m3), A is the nozzle area in each point (m2), V is the moist air velocity (m/s), T is the moist air temperature (K), P is the moist air pressure (Pa) and k is the specific heat rate of the process.
2.1.2. CFD Simulations
For this initial study, SolidWorks Flow simulation 2016 was selected [24] due to its capabilities in 3D representation and the simulation processes. SolidWorks Flow simulations employ the Cartesian-based mesh because they do not consider the boundary between body and fluid, employing rectangular cells that can be implemented with tetrahedral cells for improved accuracy. These meshes are generated, beginning at a solid surface, by means of Delaunay triangulation and, after this, the space is meshed by tetrahedral elements. For our particular case study, the obtained default mesh report showed adequate values of skewness (0.120), orthogonal quality (0.95) and aspect ratio (2.6).
Due to the moist air passing section inside the nozzle–diffuser experiments, a clear reduction occurs until the air reaches the throat, where the maximum gradient of velocity and the minimum pressure are reached, and hence, the phase change happens. An increment of mesh definition was proposed to show this process graphically in a clear way. Previously, simulations of this same dehumidifier prototype, with the default mesh, showed that such a mesh is enough to simulate this simple model. Despite this, for the sake of improving the definition in the throat section, a tetrahedral cell was selected.
After that, the Navier–Stokes equations of mass, energy and momentum conservation laws in fluid regions were solved. Furthermore, these equations are improved by the fluid state equations that consider the nature of the fluid, and special models were employed to define real gas volume condensation, vaporization and cavitation [25]. Despite this, the condensed water is not reflected during this very complex process. Finally, it is able to simulate turbulent flow, employing the Favre-averaged Navier–Stokes equations and transport equations for the turbulent kinetic energy and its dissipation rate by the Lam and Bremhorst k-epsilon model [26].
In an initial experiment, an external flow process was considered and the main results showed the need for a diffuser and homogenous conditions in the nozzle inlet in order to reach into the throat. A minimum required velocity of about 120 m/s, or a minimum pressure drop in the throat with respect to the nozzle inlet, which is effectively the same, was required to get moist air condensation.
Once the nozzle–diffuser system was designed, the passage of moist air through the nozzle in an adiabatic expansion process was simulated until moist air condensation in the throat was achieved. For this reason, the boundary conditions selected for our simulations were centered on an internal flow that simulates a ventilator with an air velocity between 1 and 6 m/s, in accordance with the maximum homogeneous air velocity that most commercial fans can offer. At the same time, an inlet relative humidity of 65%, 75%, 85% and 95%, at 293 K and 101,338 Pa, was simulated, in accordance with the previous two-dimensional designs based on the normal inlet conditions of an indoor ambience where this prototype is expected to work. Furthermore, an adiabatic wall was considered during the simulation configuration, based on the information obtained by the Foehn effect, which would help improve the energy exchange between the condensate water and the remaining dry air.
Finally, it must be commented that an inertial separator of drops of water should be placed in the nozzle throat to completely dehumidify the indoor air. As it cannot be simulated in this initial study, it will be tested in a real closed-loop wind tunnel in future works. As a result, in these initial simulations, a reversible process was simulated to identify the best boundary conditions and nozzle designs that would allow us to reach our condensation objective.
2.2. Open Loop Wind Tunnel
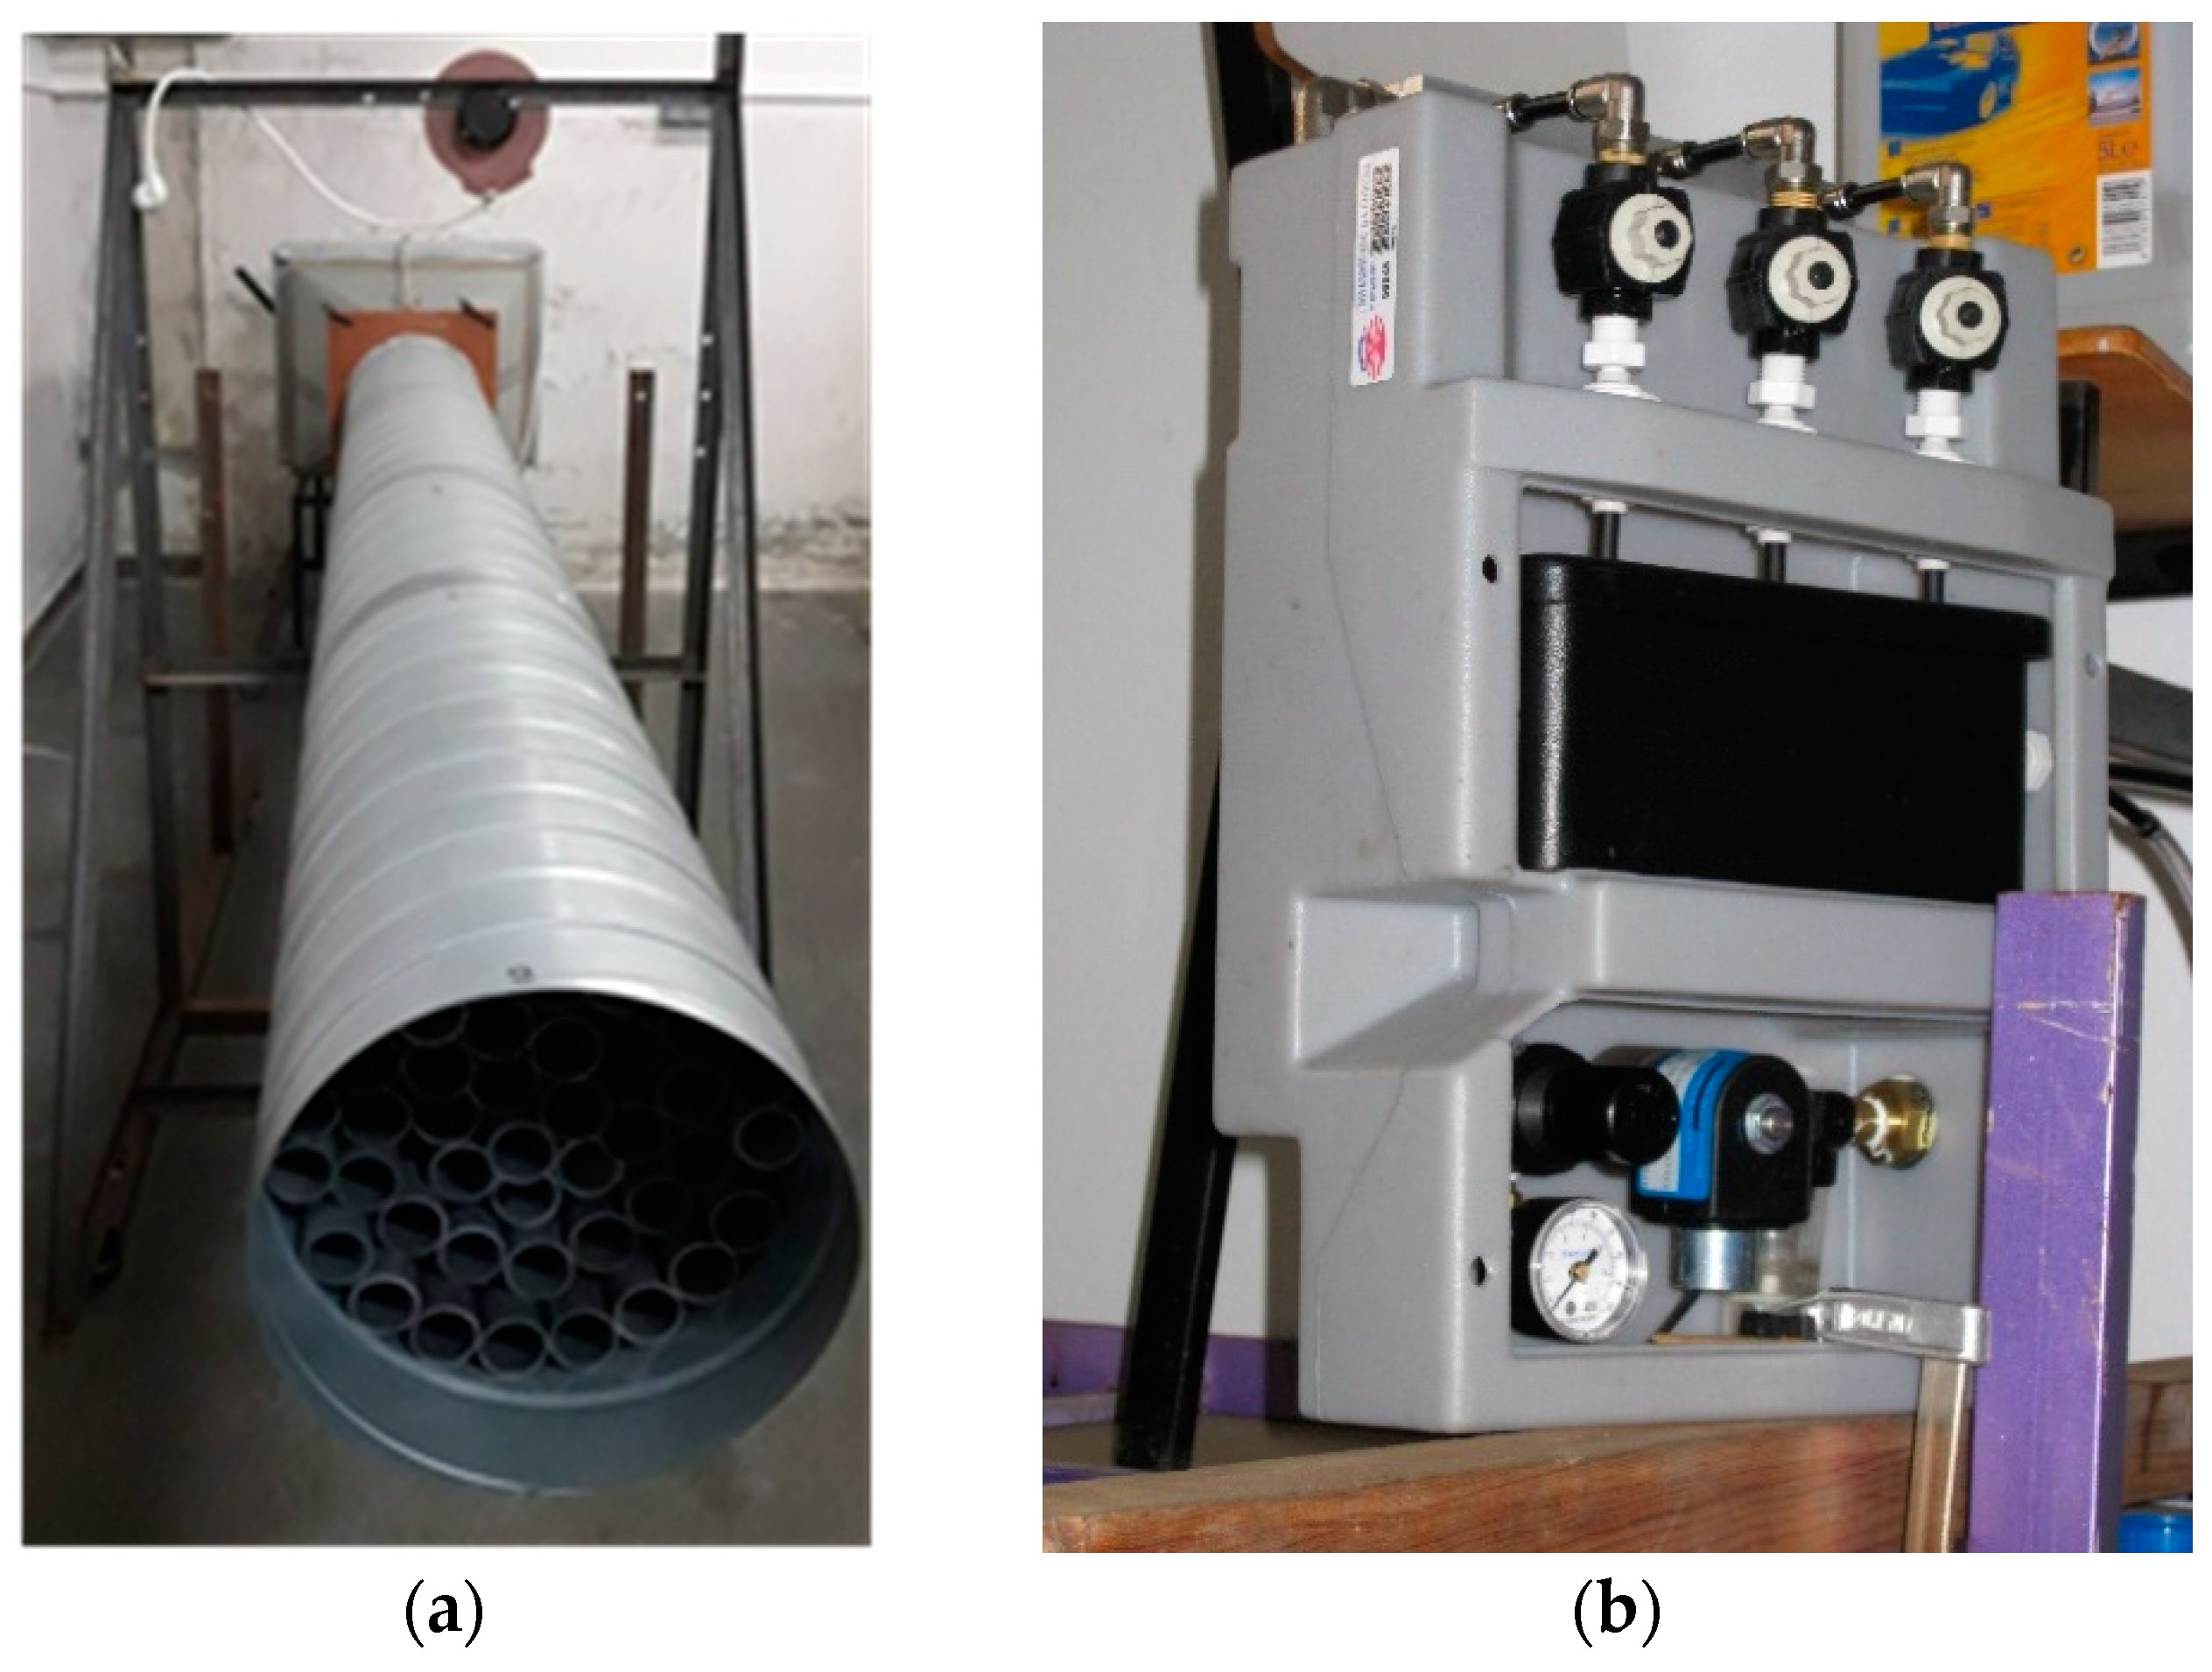
An experimental case study based on three tests of a simple nozzle under different relative humidity conditions was developed to validate the CFD simulation process in an open loop wind tunnel, as shown in Figure 3. This wind tunnel employs a Sodeca HCH ventilator with a 0.70 m diameter and a 0.75 HP that offers a velocity range from 1 to 6 m/s by a variable frequency drive, in accordance with the experimental process needs. The relative humidity needed in the environment for each test condition was obtained by an adiabatic saturator Spraying System Spain S.L. model 45,500, which maintained the temperature in a nearly constant range.
In this test the temperature, relative humidity, and pressure parameters were simultaneously registered by means of three PCE-MSR145 data loggers located in the environment, at the inlet and outlet concentrator sections. These loggers showed a sampling range from 10–65 °C and a precision of 0.1 °C. The relative humidity and the pressure were measured with an accuracy of 0.2% and 2.5 mbar, respectively. At the same time, a KIMO differential pressure manometer, model MP200, was employed with a resolution of 1 Pa. A PCE-009 anemometer was used to record the moist air velocity in the central flow line at the inlet and outlet of the nozzle, with a range from 0.2 to 20 m/s, and a margin of error of 0.1 m/s.
3. Methods
3.1. Nozzle Prototyping and Testing
The initial nozzle design was centred on mass and energy conservation and a constant pressure drop law, as usually defined in most aeronautic studies, and inlet conditions of 5 m/s and a relative humidity from 85% to 95%. Furthermore, an initial circular inlet area of 40 cm and a throat area of 10 cm were selected in accordance with the testing zone dimensions of our wind tunnels.
The two-dimensional nozzle process, calculated with EES software in accordance with the two-dimensional design, is shown in Figure 4. In this figure, the moist air process can be defined in two correlative stages: (i) one with constant specific humidity, which represents the cooling process during the expansion until reaching the dew point temperature, and (ii) a condensation process that occurs once the moist air temperature reaches the dew point temperature near the throat. Finally, in the diffuser, the inverse process will be tested until the internal pressure inside the nozzle–diffuser is restored to the ambience values.
Once the initial nozzle was designed, it was prototyped with an epoxy polymer resin with a superficial treatment to reduce its internal roughness below 10 micrometers, as we can see in Figure 5. After that, it was tested and simulated in an open loop wind tunnel. In particular, in this initial test, three different experiments were performed at a constant inlet temperature of 19 °C, an air velocity of 1.3 m/s and relative humidity values of 52%, 77% and 90%, to validate the simulation results with the sample conditions.
3.2. Nozzle and Diffuser Design
Based on the results obtained in previous works with a simple nozzle [19,20], a diffuser was considered as a very interesting complement for this dehumidifier, allowing the outlet section of the nozzle to not be exposed to the ambient boundary conditions, which implies a nozzle outlet velocity lower than that obtained when a diffuser is placed after the nozzle, and reaching the lowest possible pressure in its throat (Figure 6). In this sense, the diffuser will be centered in a symmetrical nozzle, based on this initial ideal isentropic process, and it will help restore the moist air conditions of the indoor ambience at the diffuser outlet. As a consequence, the nozzle–diffuser length was selected to be 3.18 m in order to better represent the reduced condensation zone inside this element in the CFD simulations. In other words, it is important to note that the distance between the nozzle sections does not exert influence over the velocity obtained and its related pressure drop. Despite this, as previously explained, it is important to define a constant area in the throat section to give more time to let moist air reach condensation.
Finally, it is interesting to highlight that the procedure developed in this study can, once optimised, be employed at lower relative humidity levels and lower inlet velocities, as it is detailed in the next sections.
4. Results
Based on the initial objectives of this study, the results are organized into: (i) experimental results of a nozzle test in a wind tunnel and its simulation validation, and (ii) final nozzle–diffuser prototype simulation and moist air dehumidification analysis in a control volume.
4.1. Experimental Nozzle Results and Simulation Validation
The main results obtained in the inlet and outlet nozzle zones during the sampling process in the open loop wind tunnel are reflected in Table 1 and in the CFD simulations of the third test shown in Figure 7.
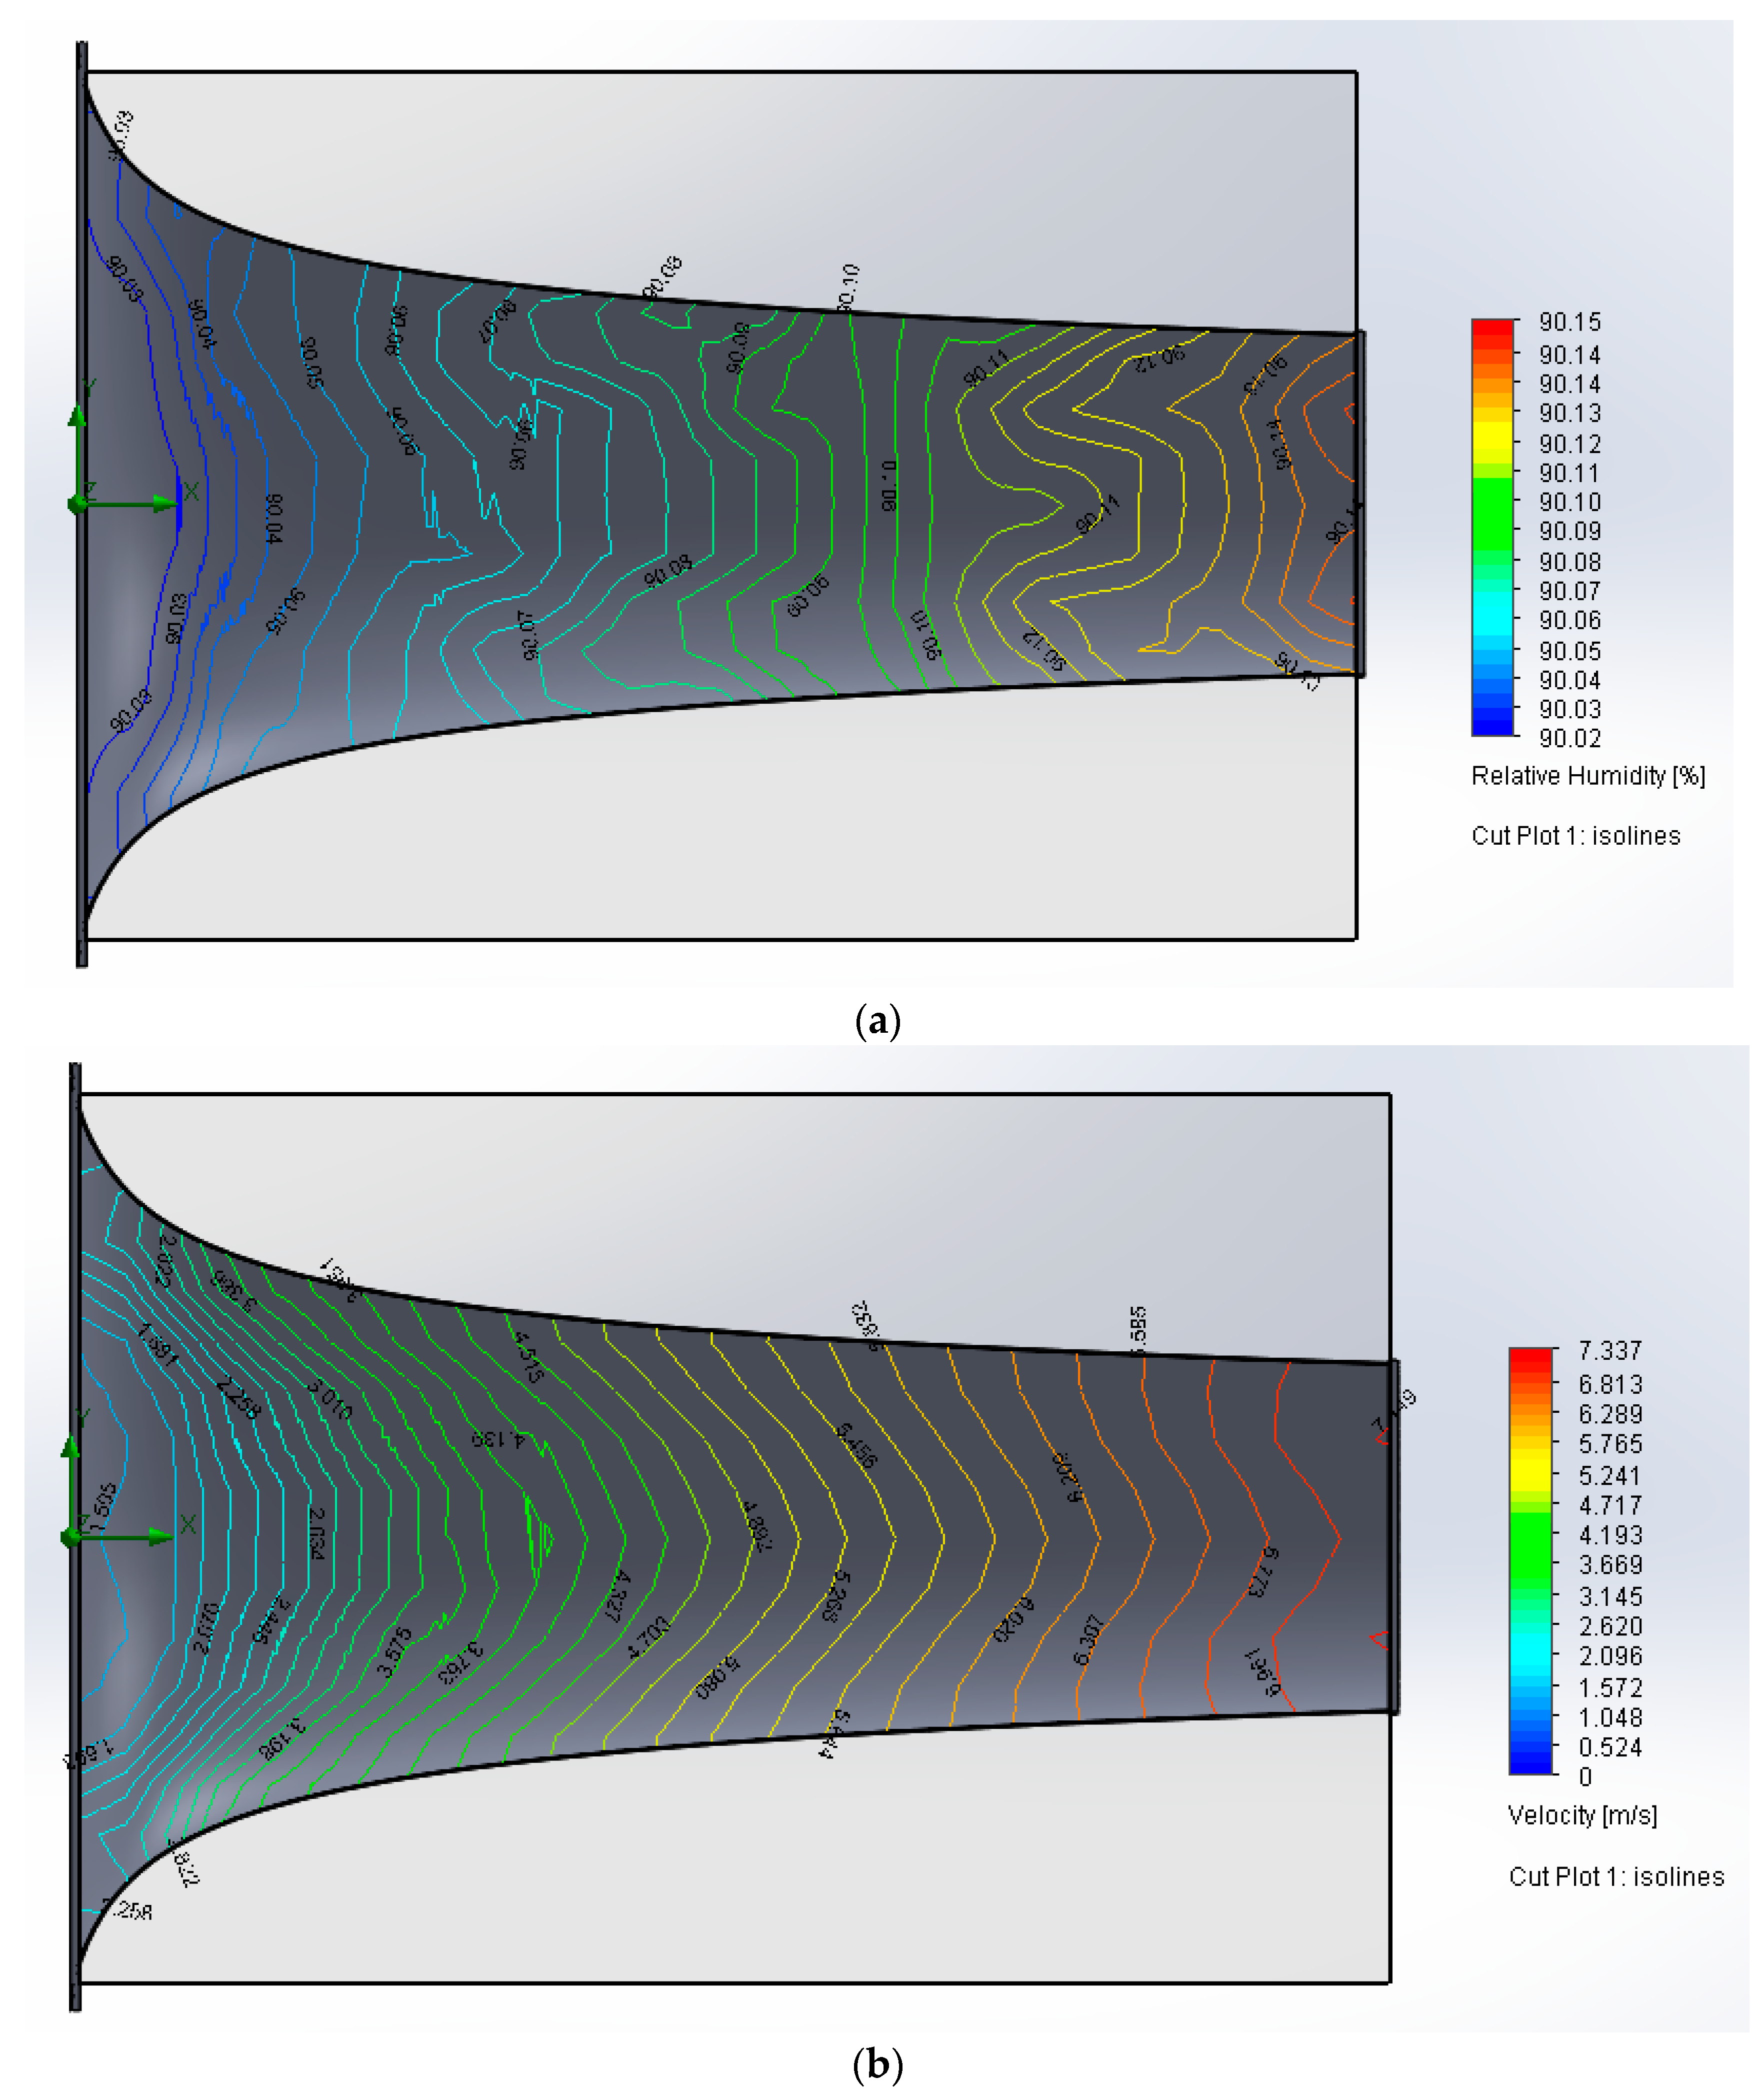
The inlet conditions—consistent with previous research works about this validation procedure [27,28,29]—were the same in the real process than in the simulation, as we can see, for instance, in the third test of Table 1 and in Figure 7, in terms of relative humidity (Figure 7a) and velocity (Figure 7b) distributions, and even in point values in the centre line.
4.2. Nozzle Diffuser Simulation under Internal Flow
Once the nozzle validation test was done, a nozzle–diffuser simulation was developed from 1 to 6 m/s and 65% to 95% relative humidity of indoor ambience, with 6,800,000 nodes, and a calculation process of more than five hours per simulation. Several examples are represented in the Figure 8, Figure 9 and Figure 10.
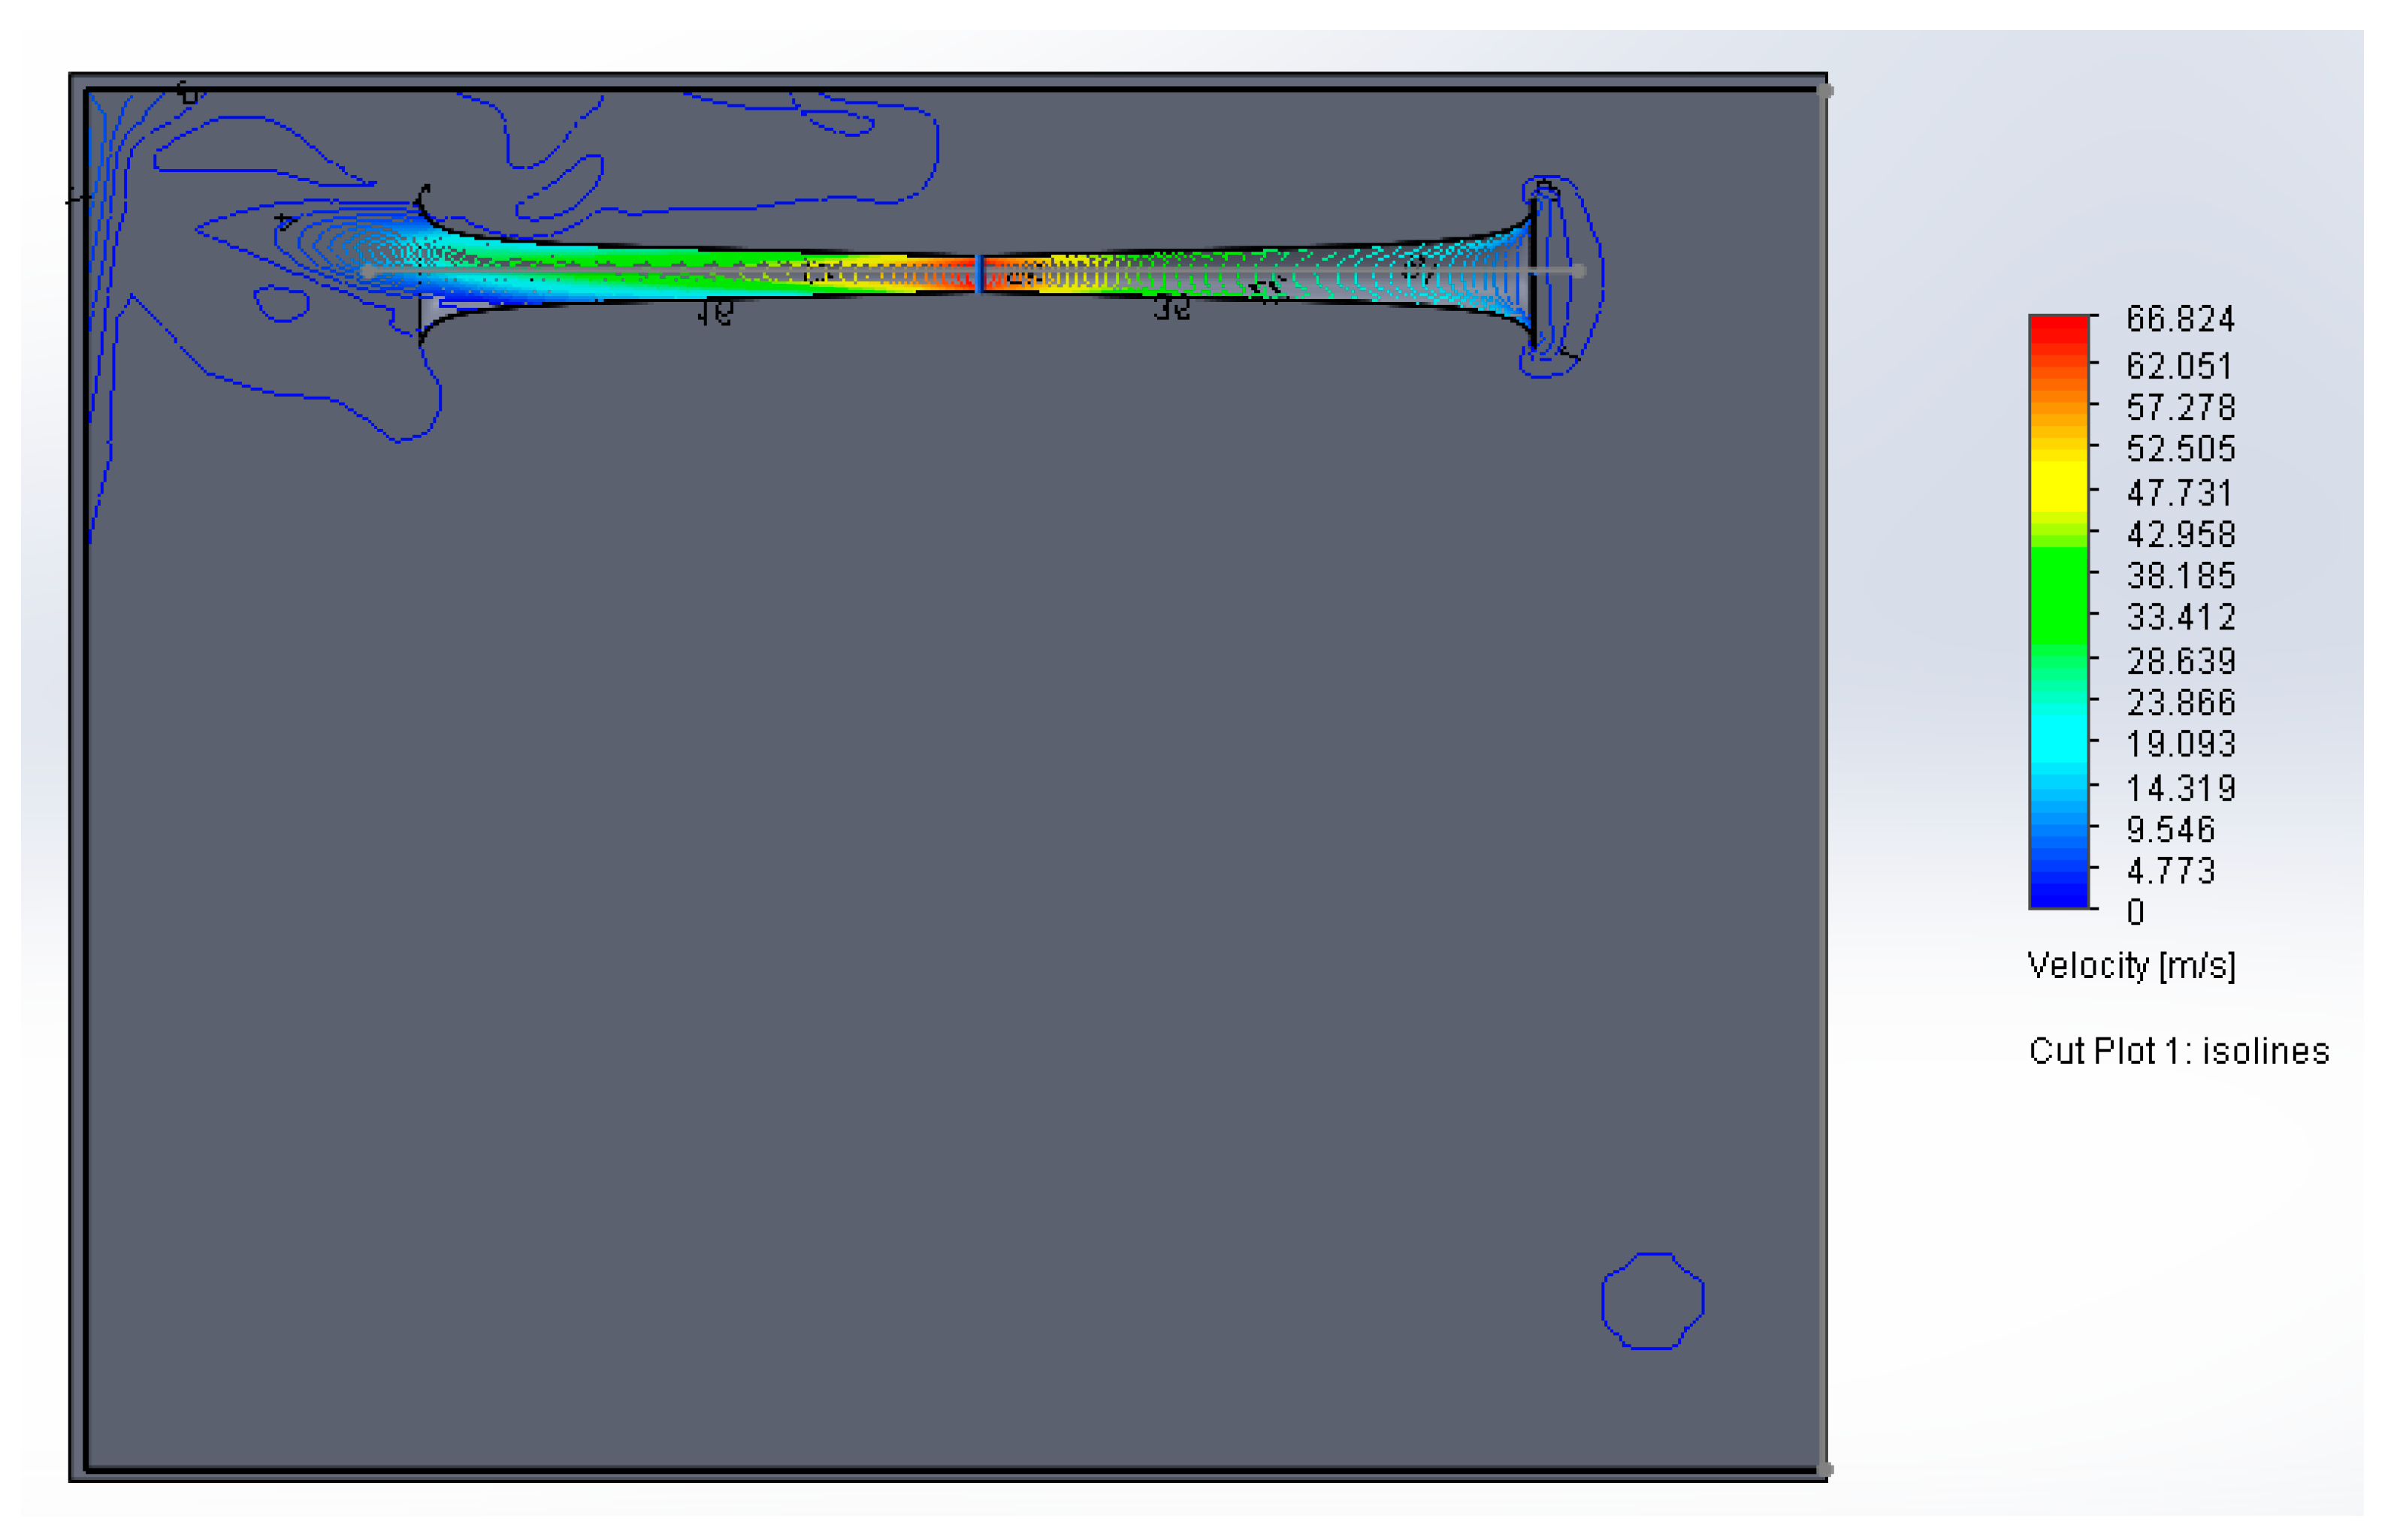
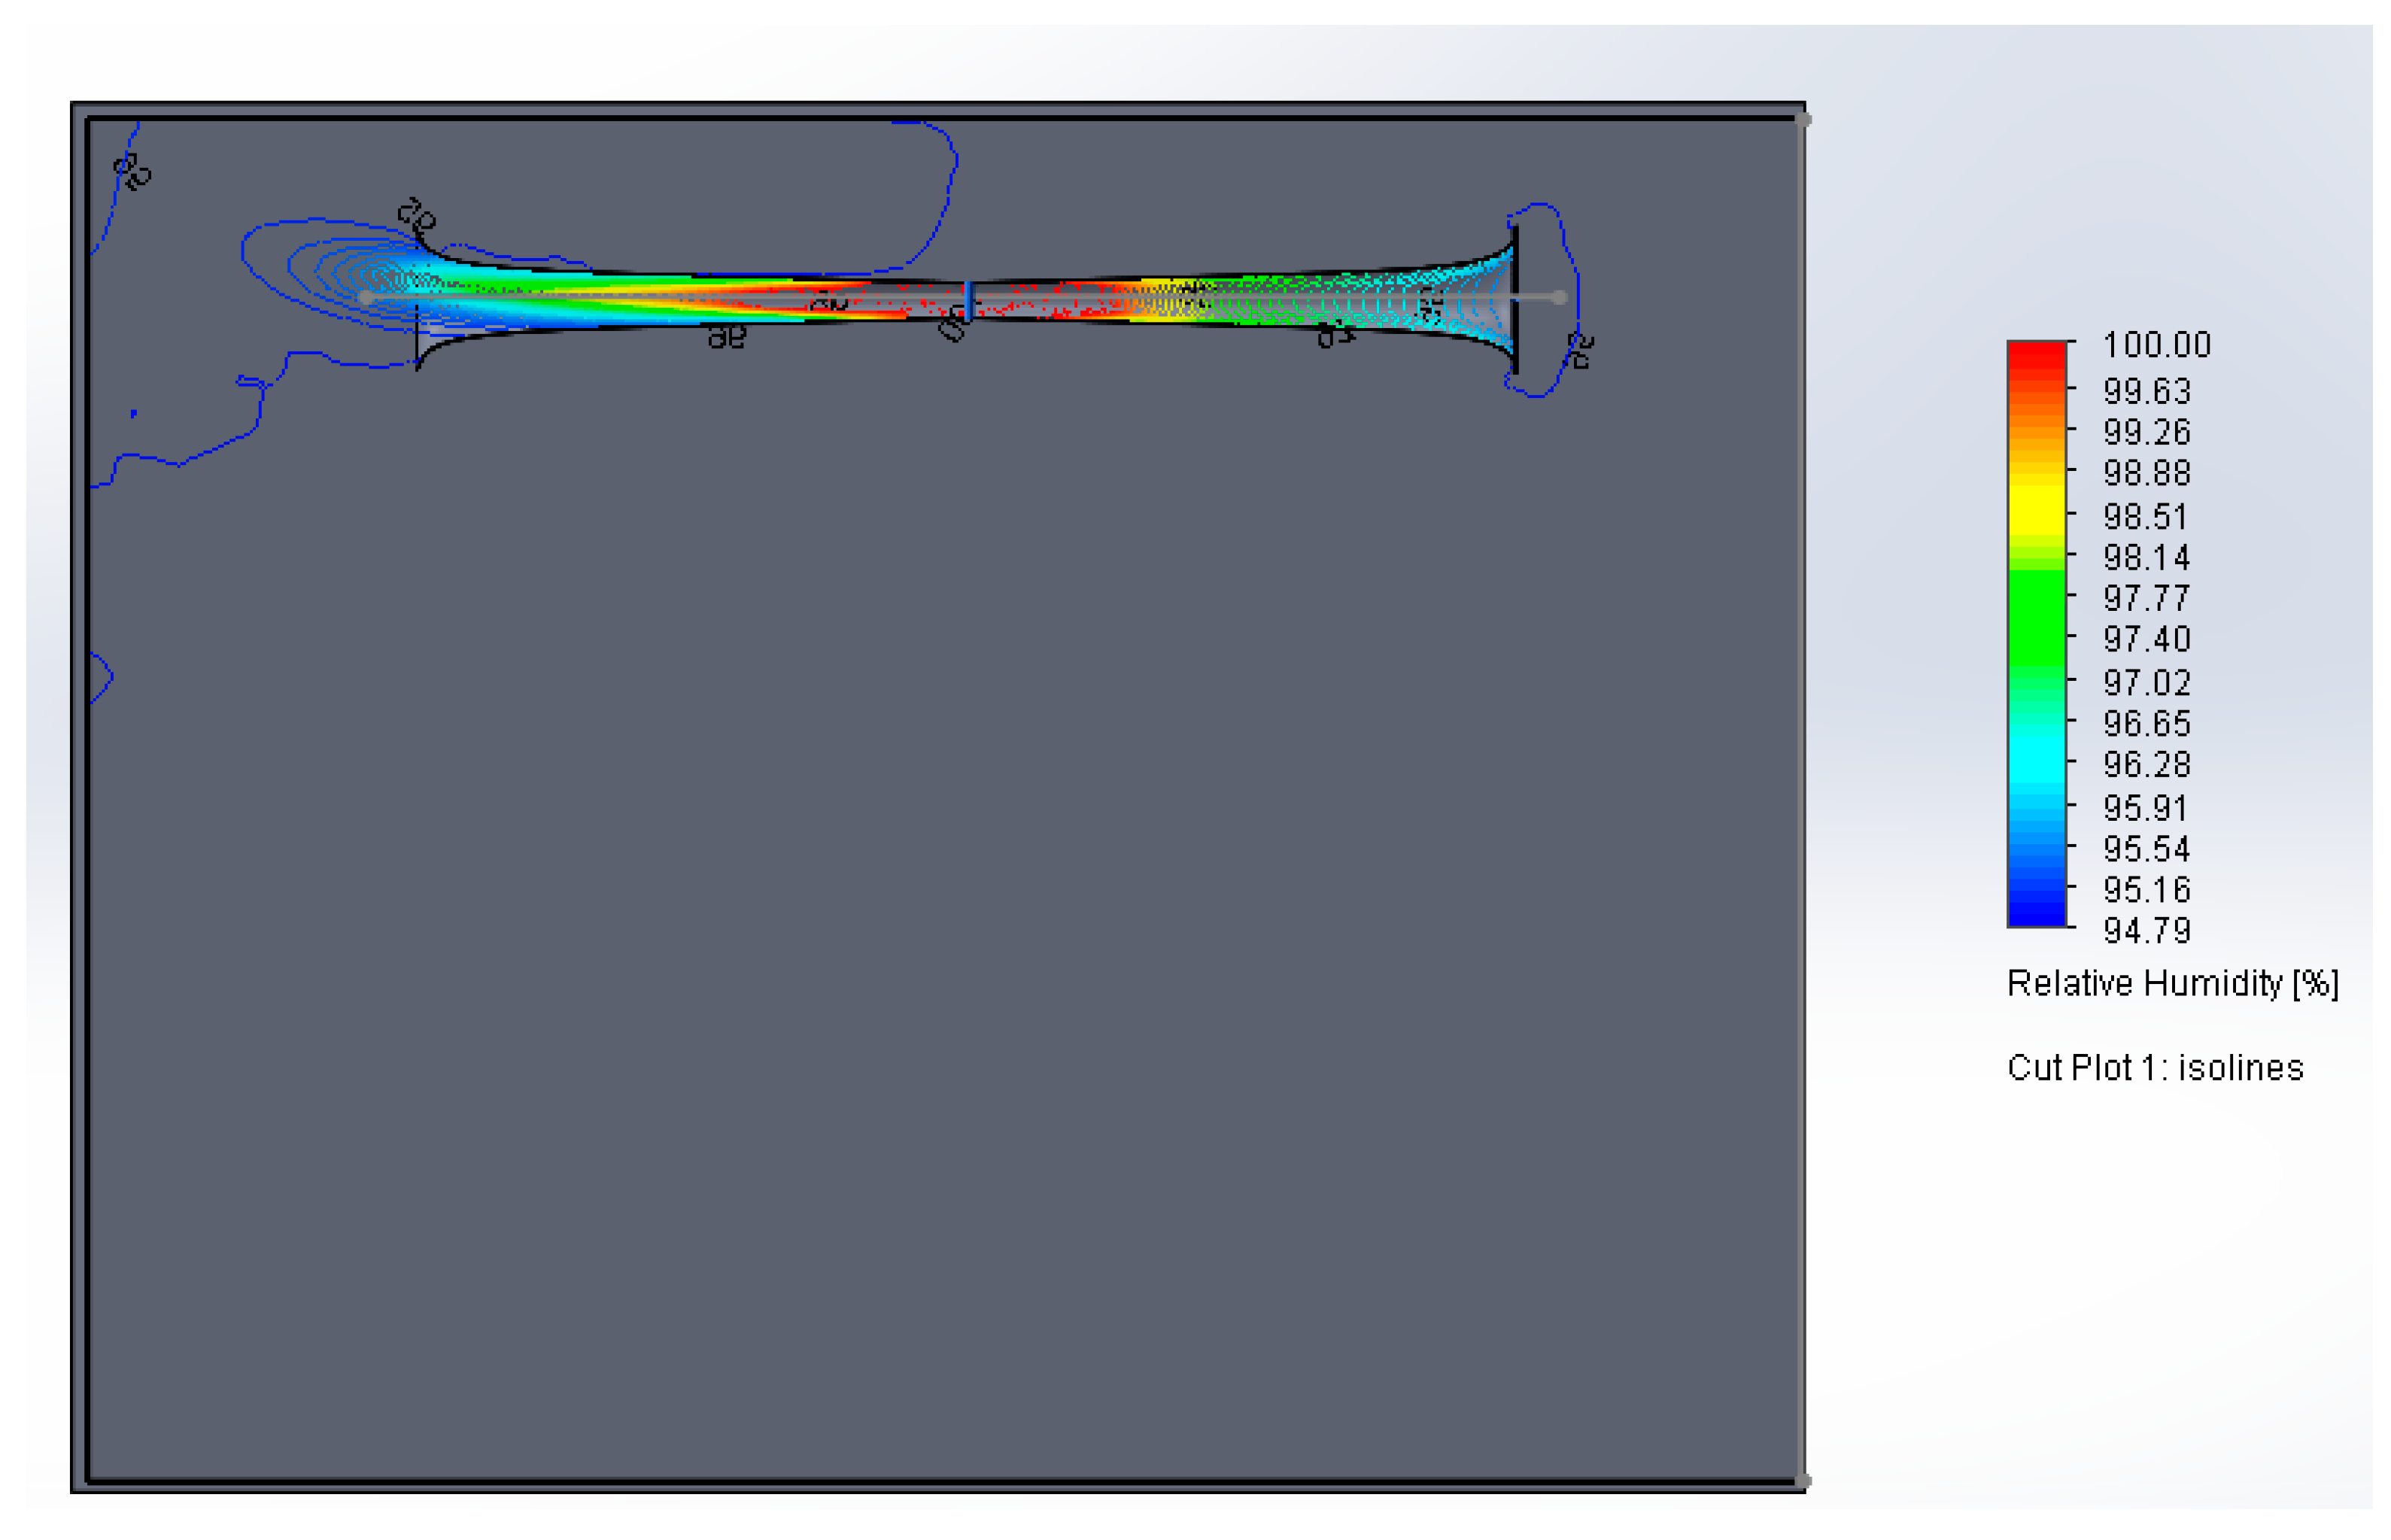
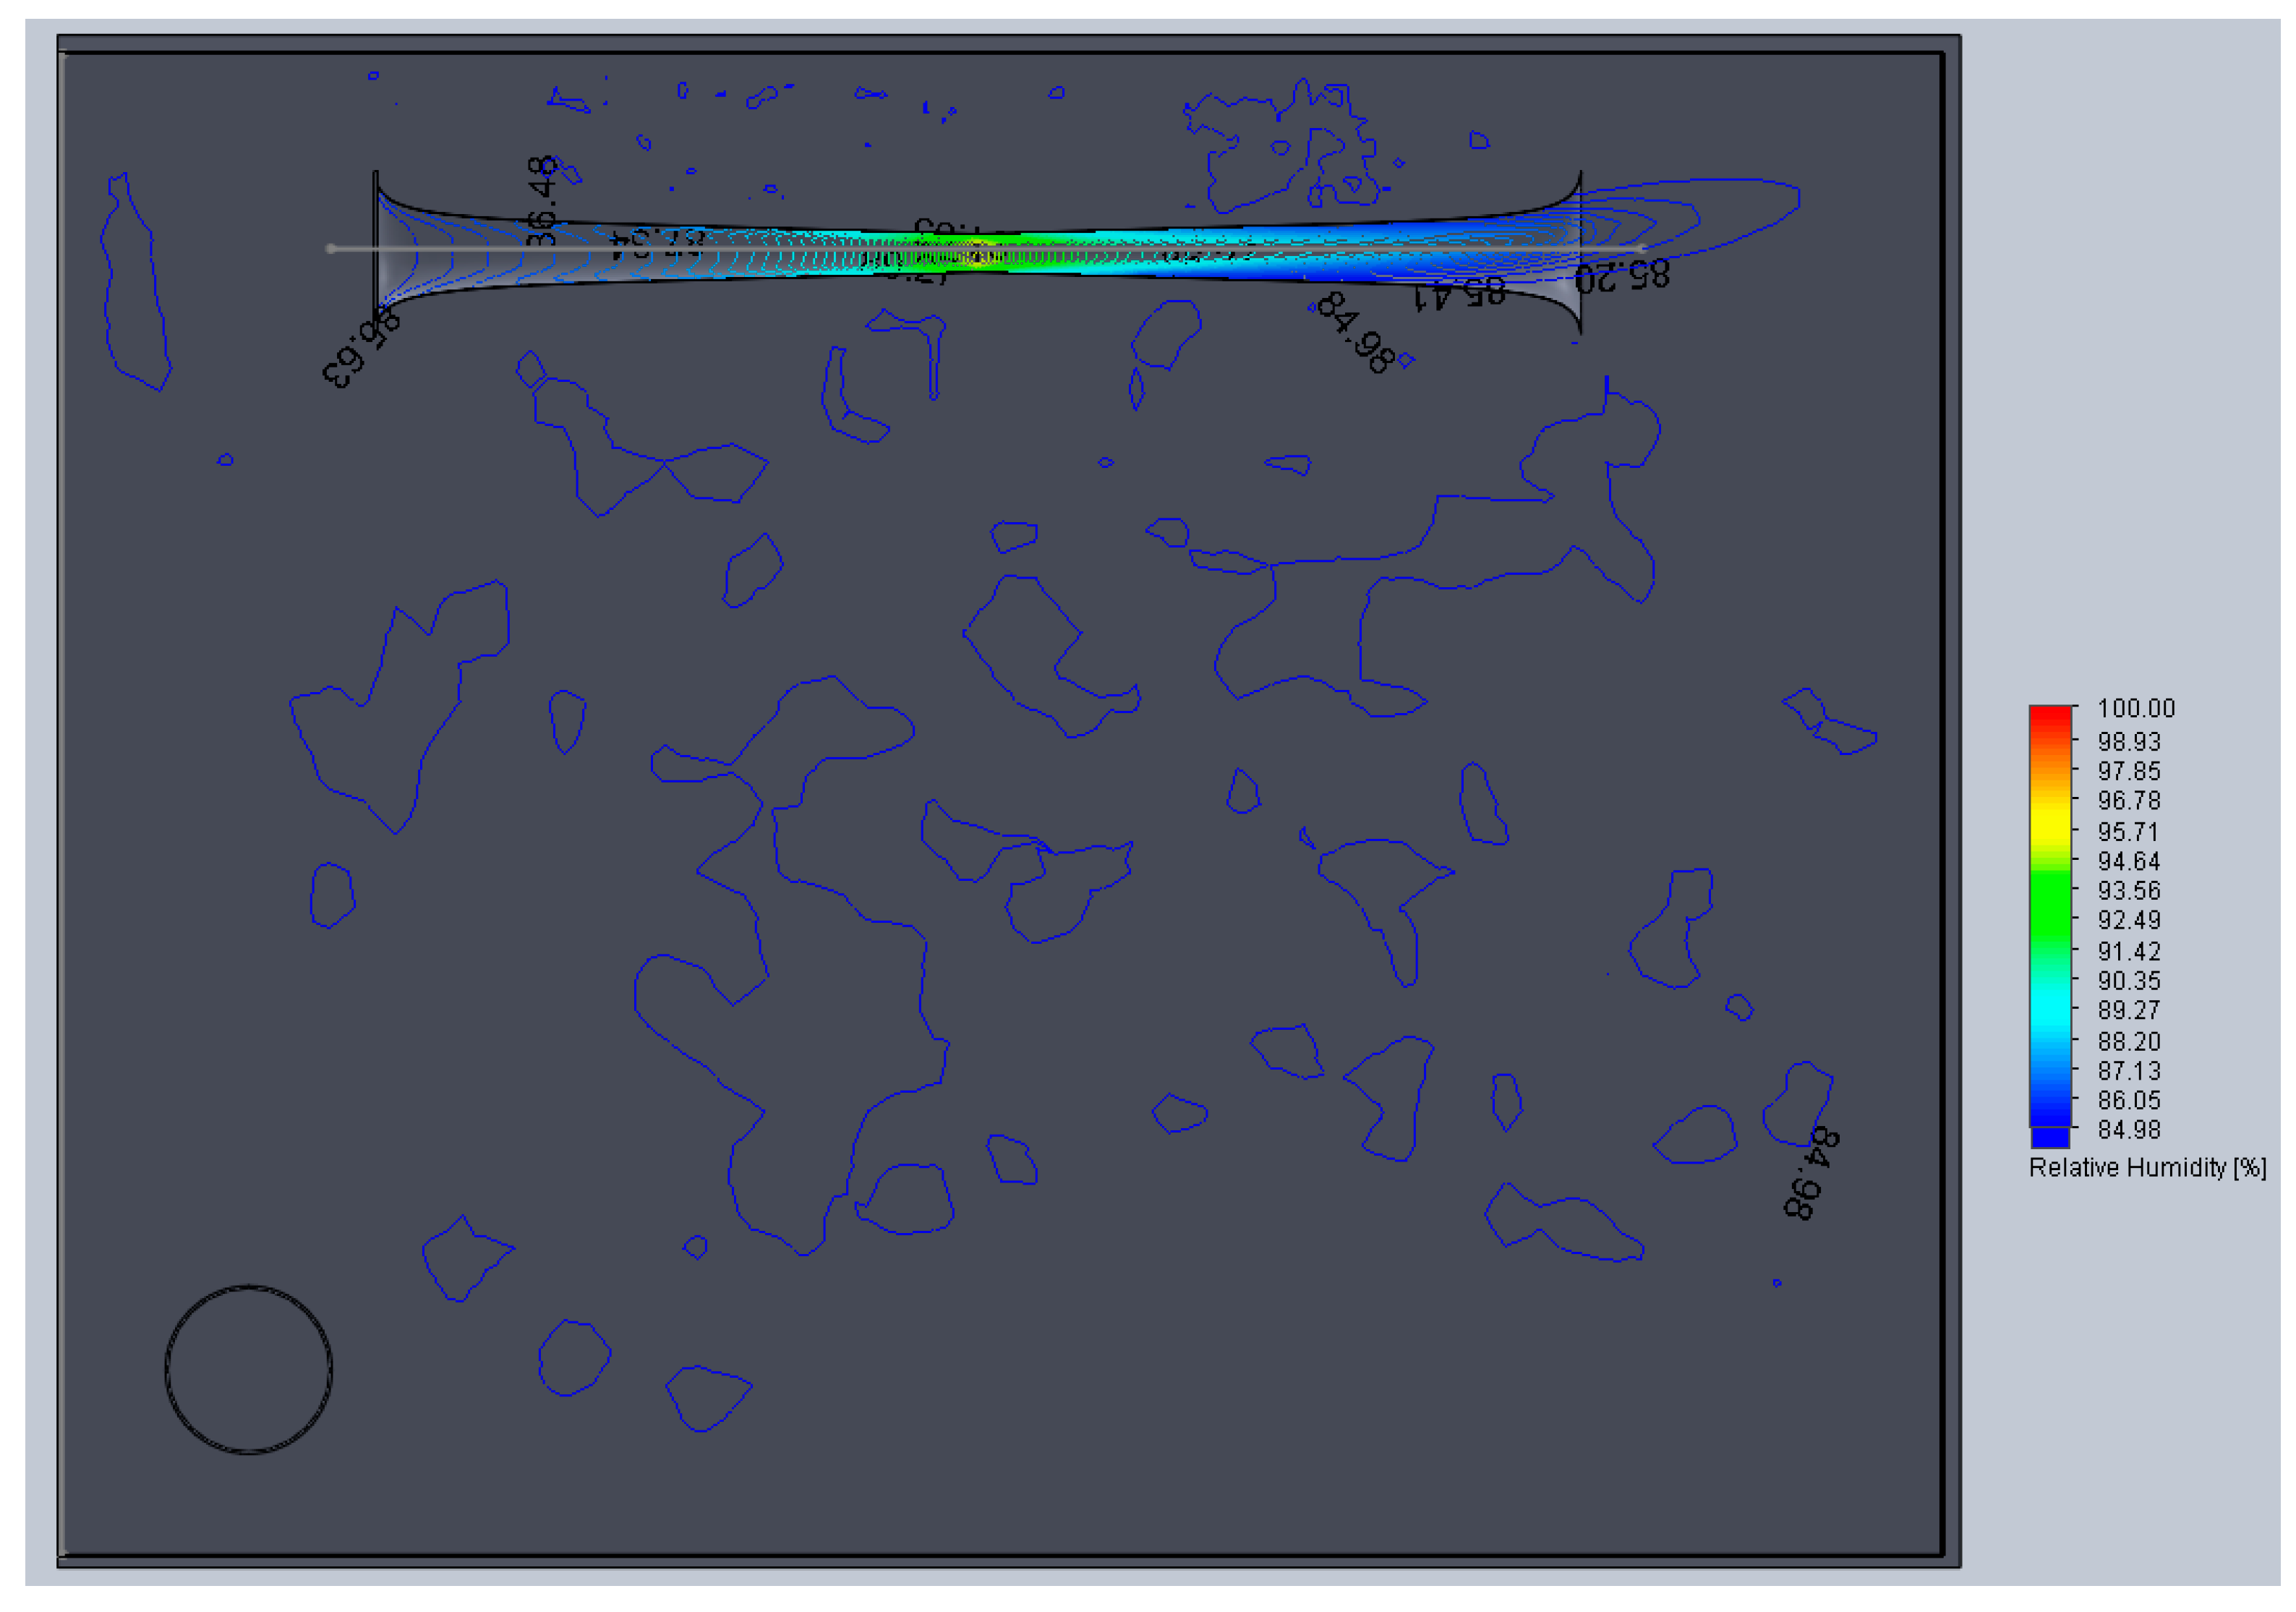
Figure 8 shows the maximum velocity value in the nozzle–diffuser throat for an inlet velocity of 5 m/s and relative humidity of 95%. The maximum relative humidity of 100% and its related moist air condensation are represented in Figure 9. This condensation process will not appear at a lower inlet relative humidity of 85%, as shown in Figure 10.
Finally, an analysis of the effect of the indoor air relative humidity and inlet velocity over the nozzle throat relative humidity values was done. To this end, different simulations of inlet velocities from 1 to 6 m/s and relative humidity values from 85% to 95% were carried out. Furthermore, its centre line values are reflected in Figure 11, Figure 12 and Figure 13, to facilitate its interpretation.
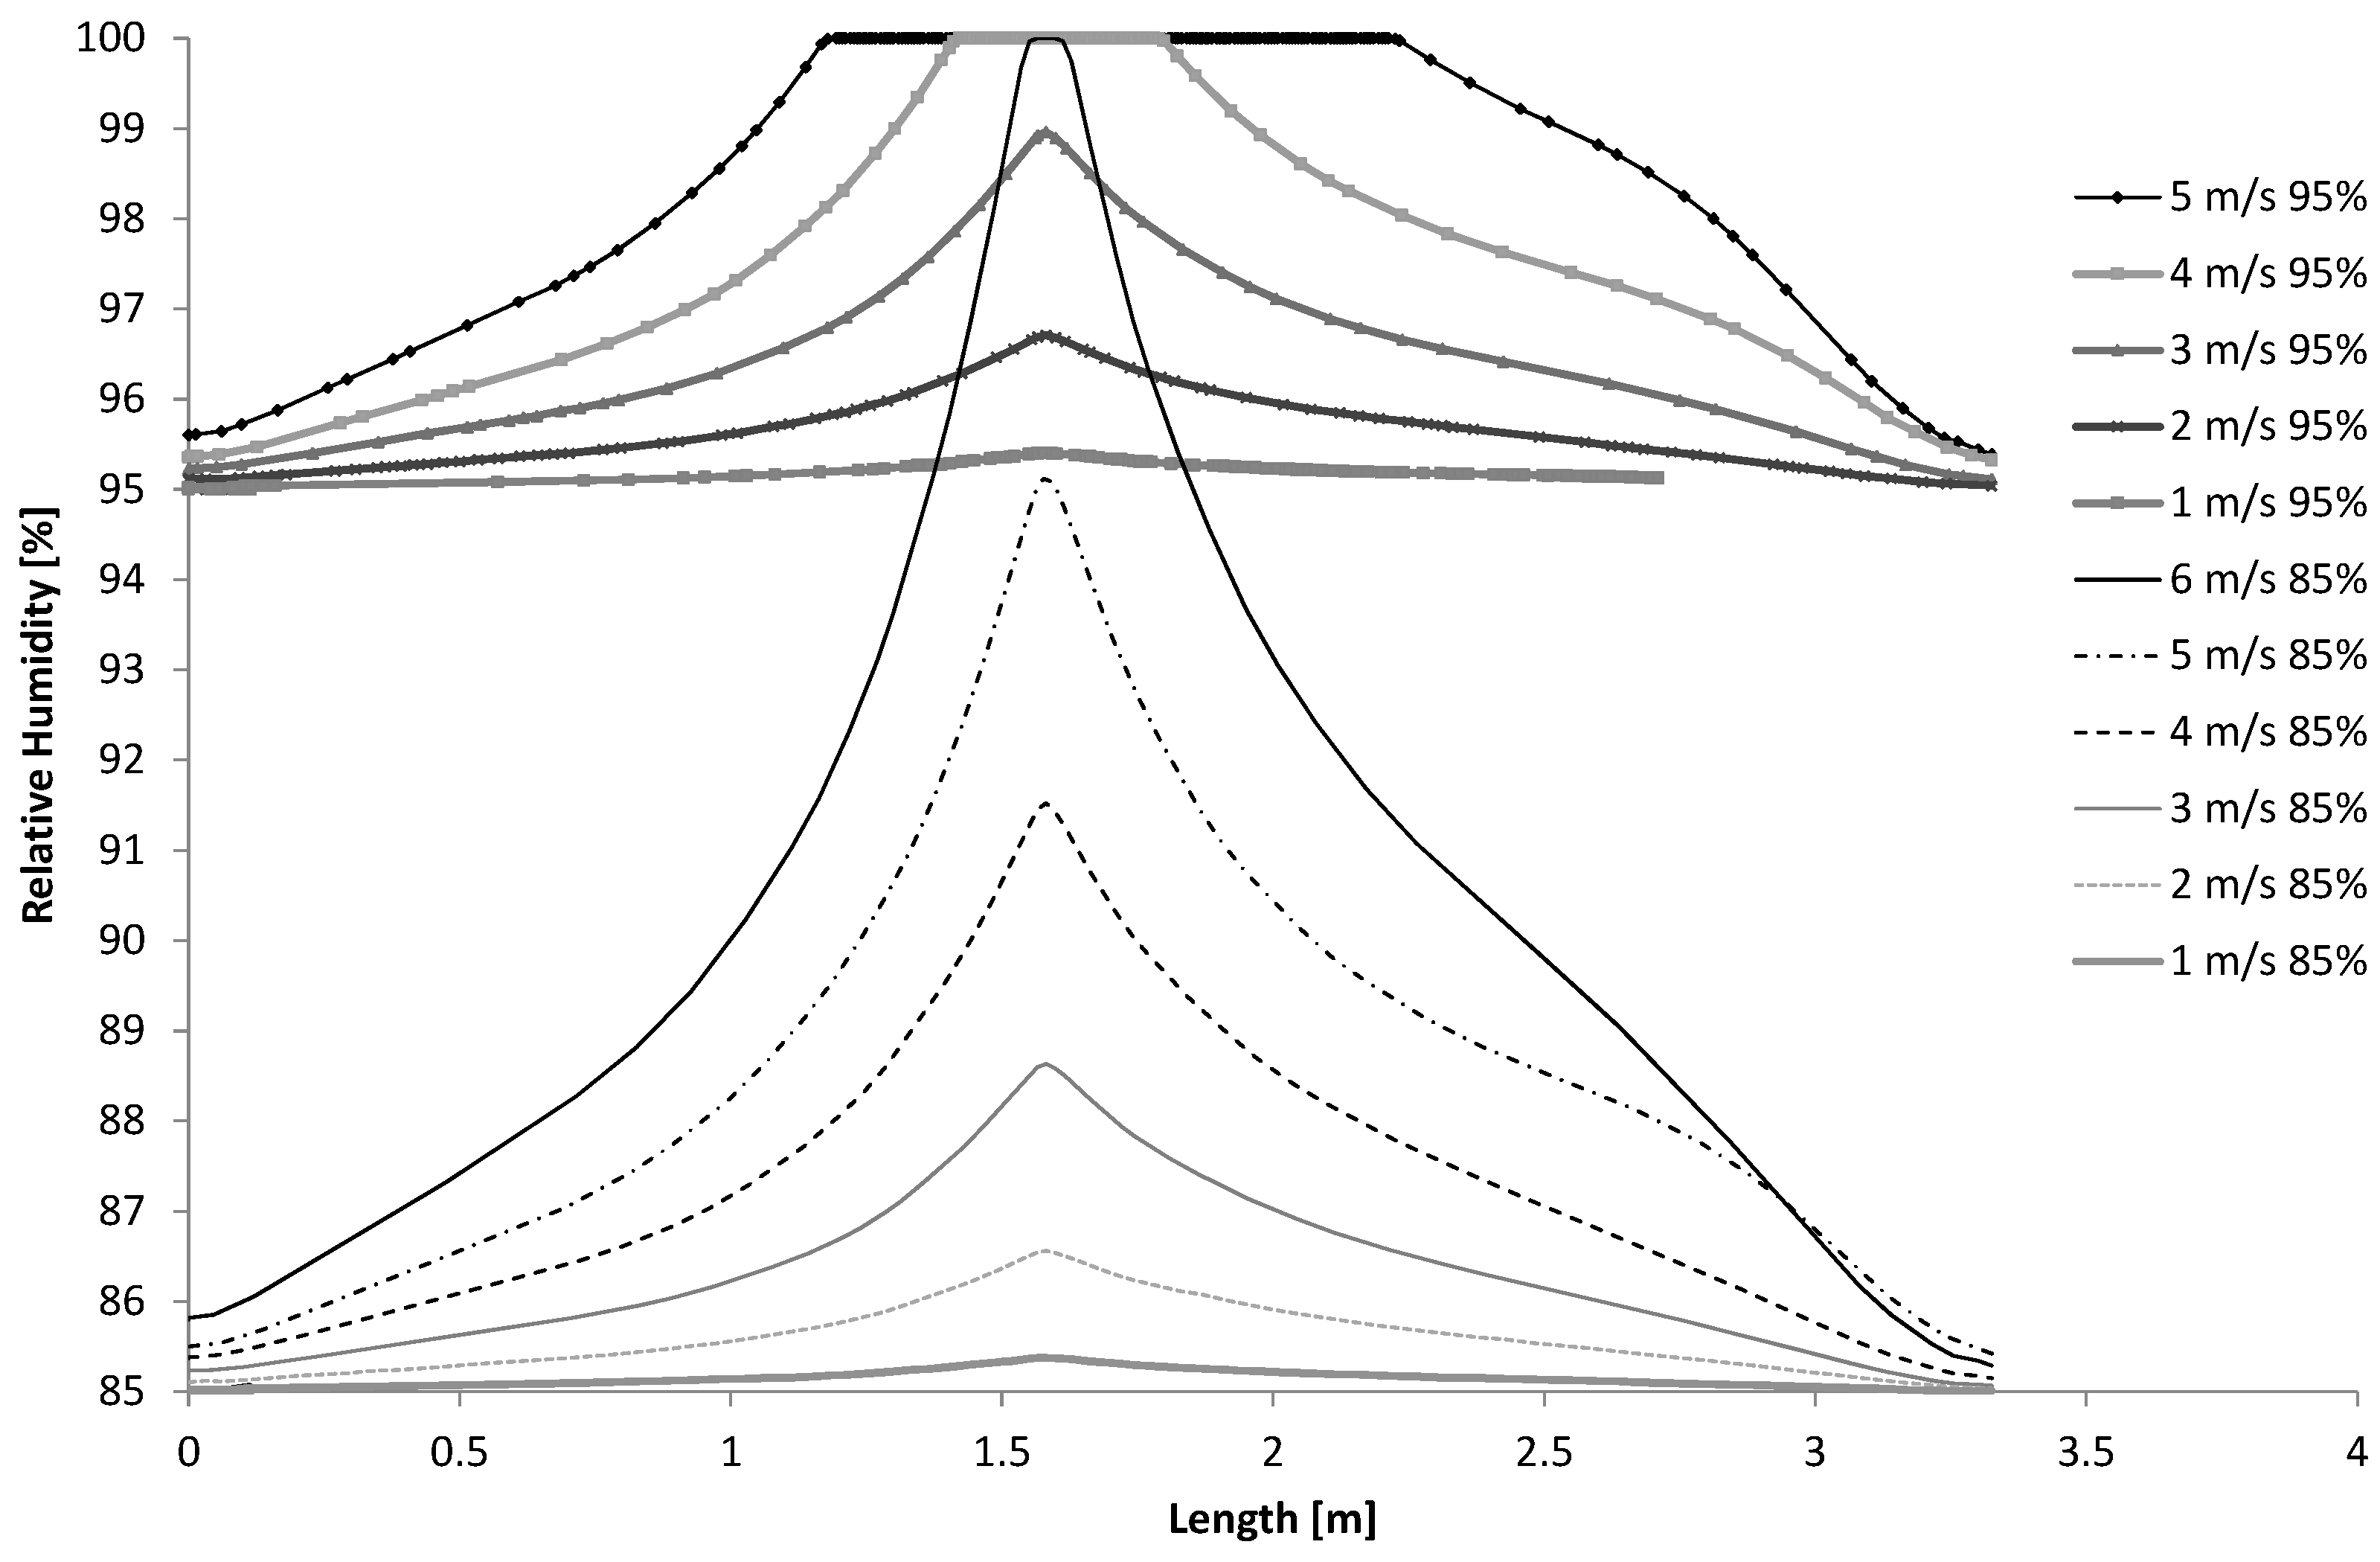
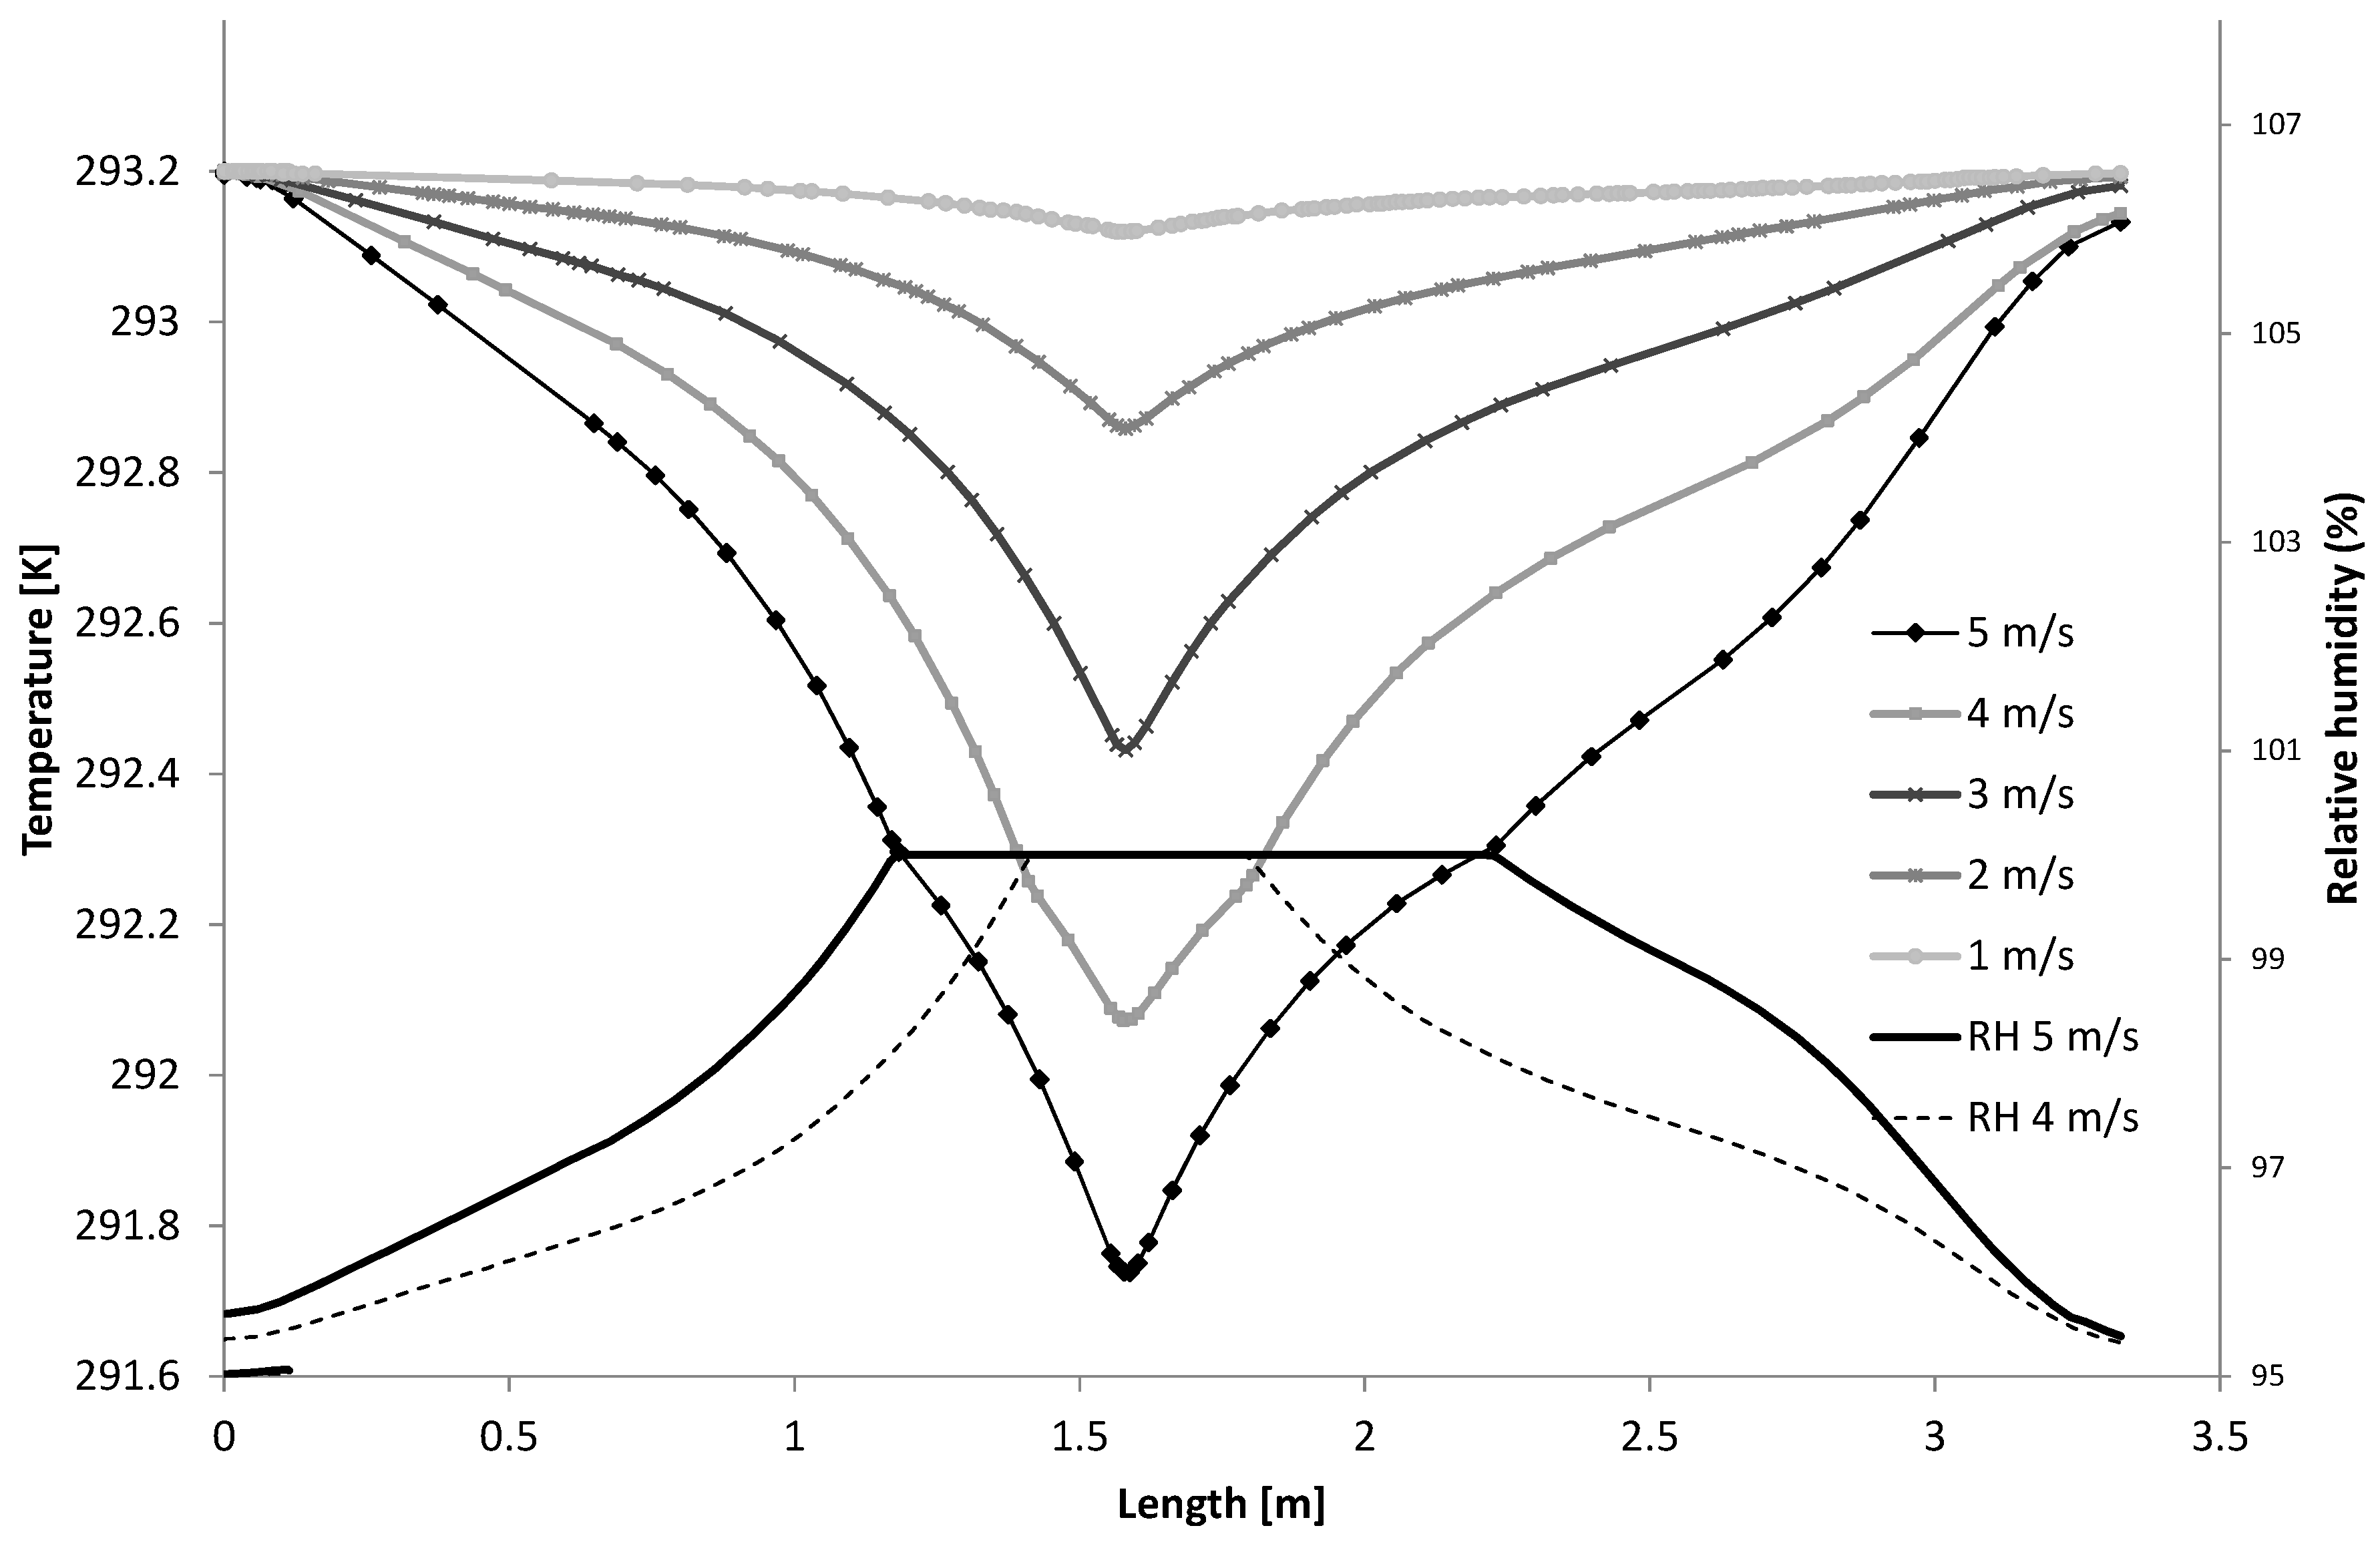
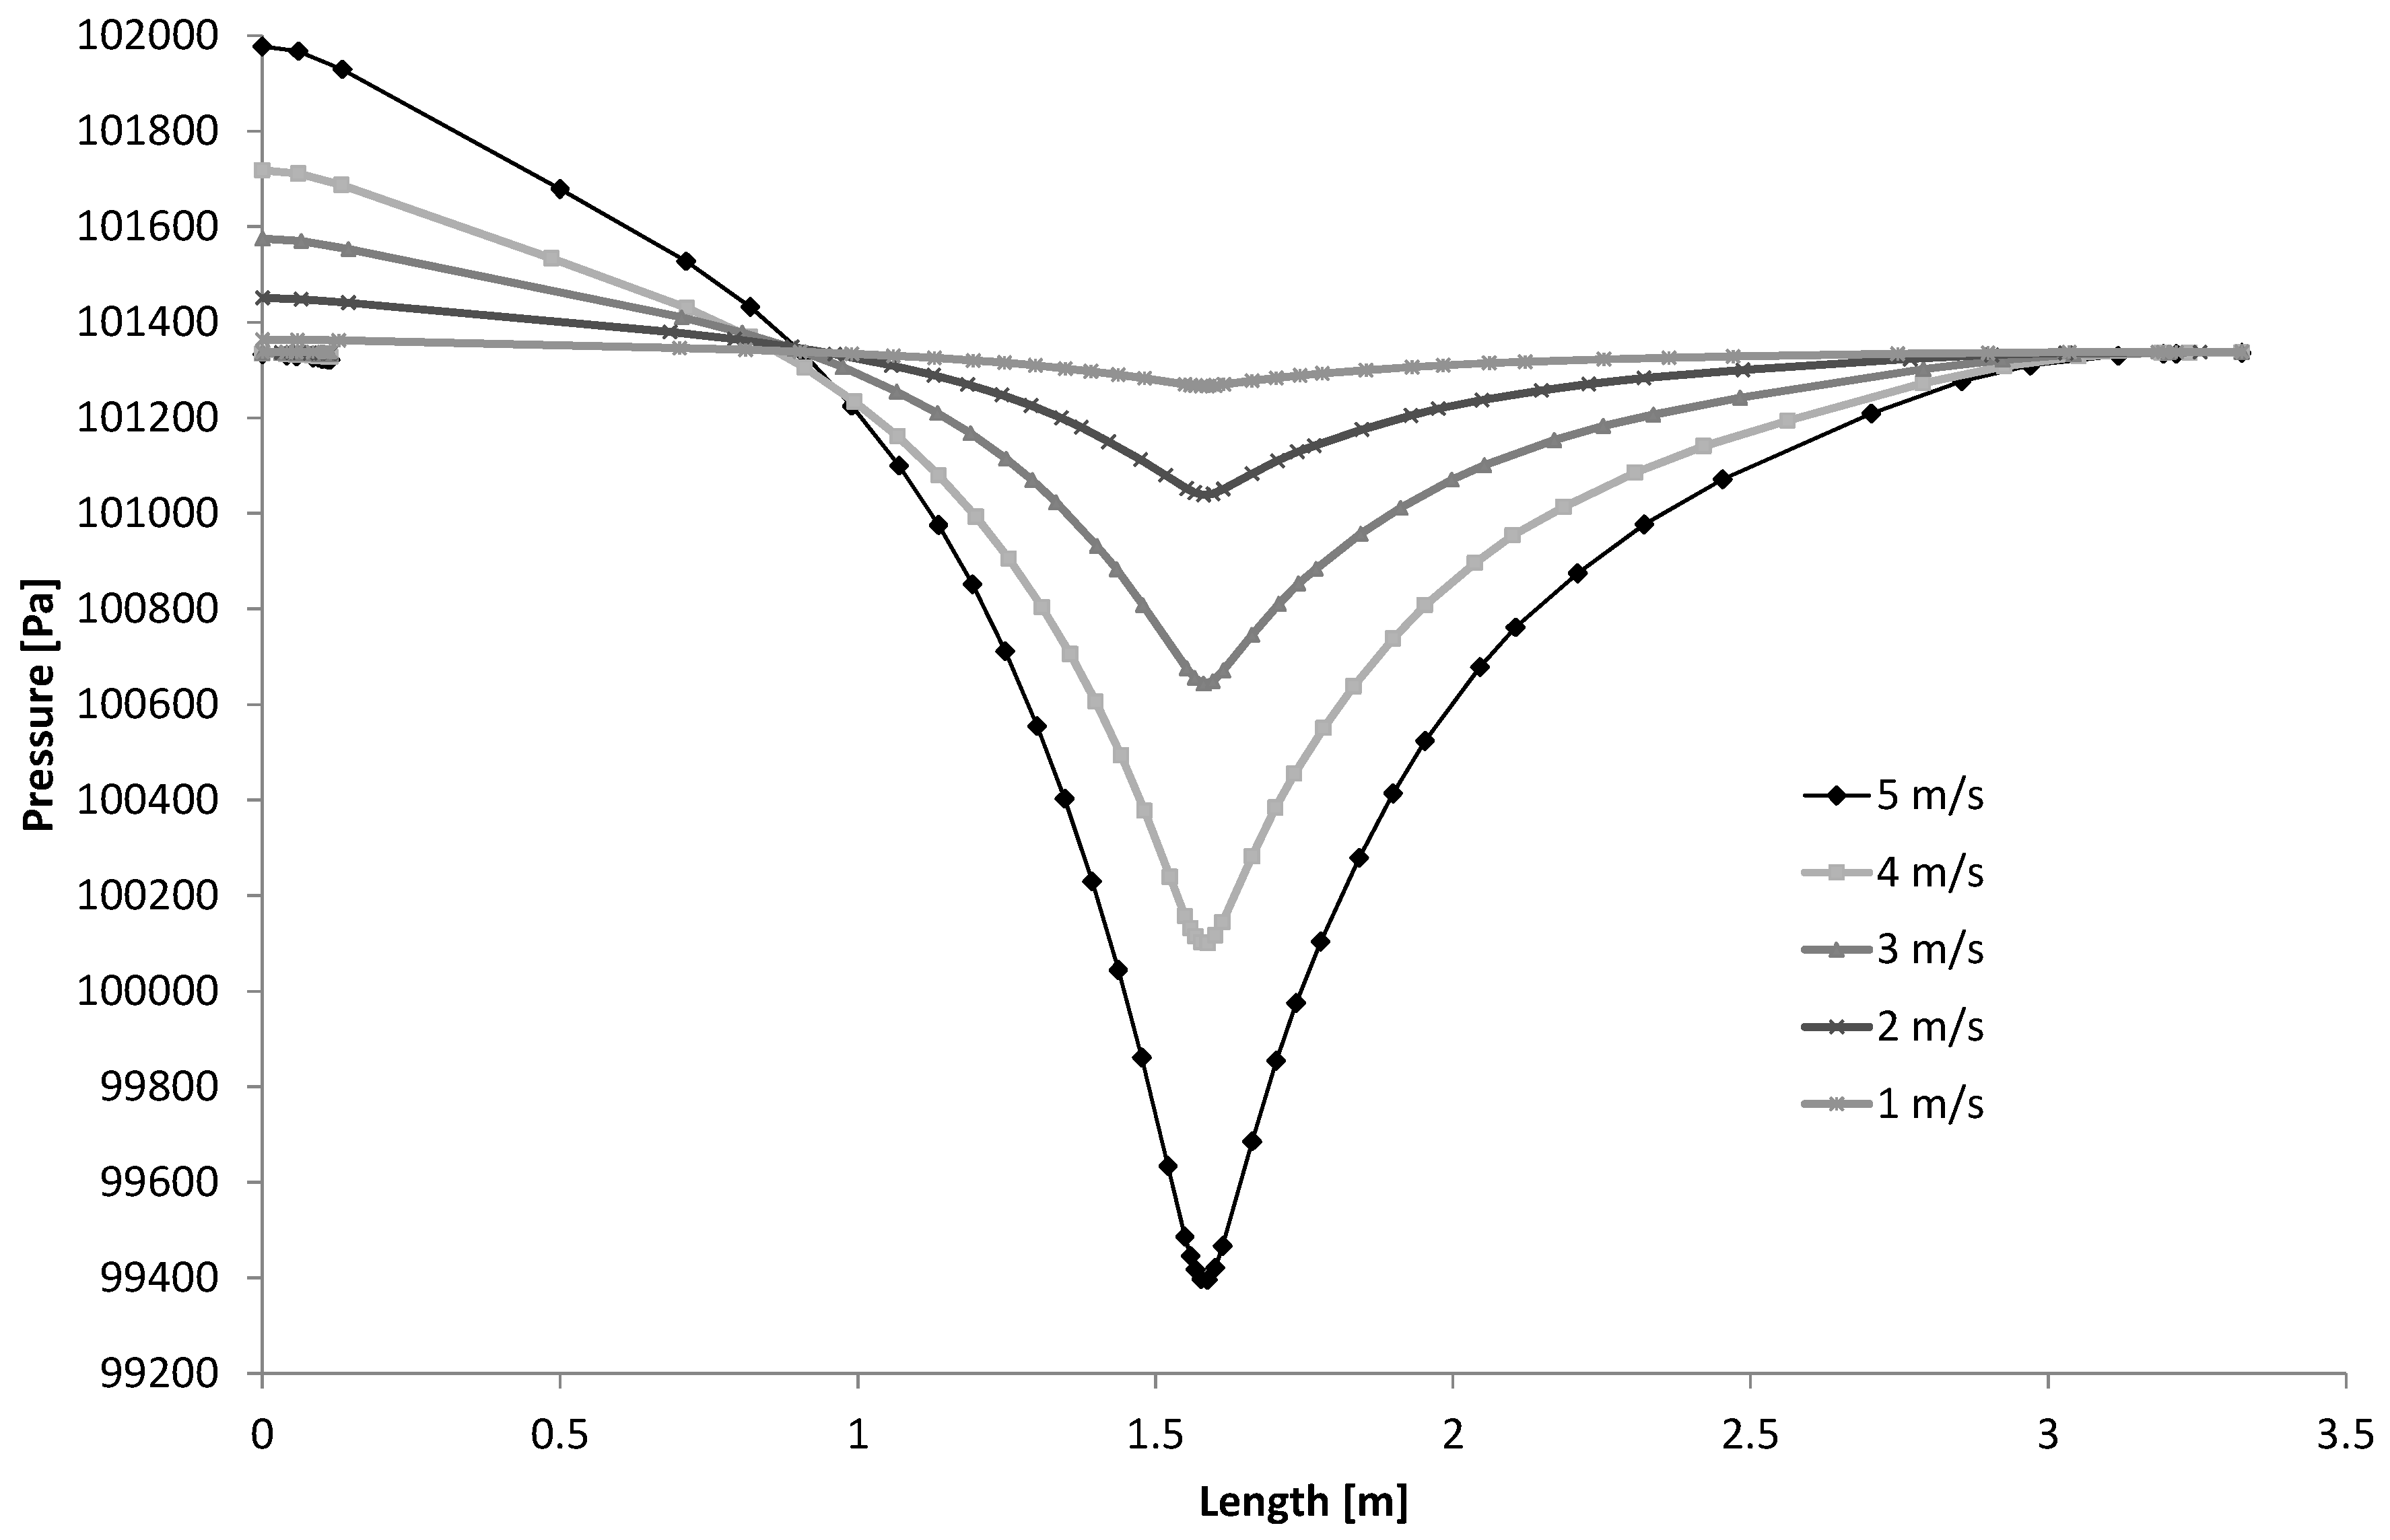
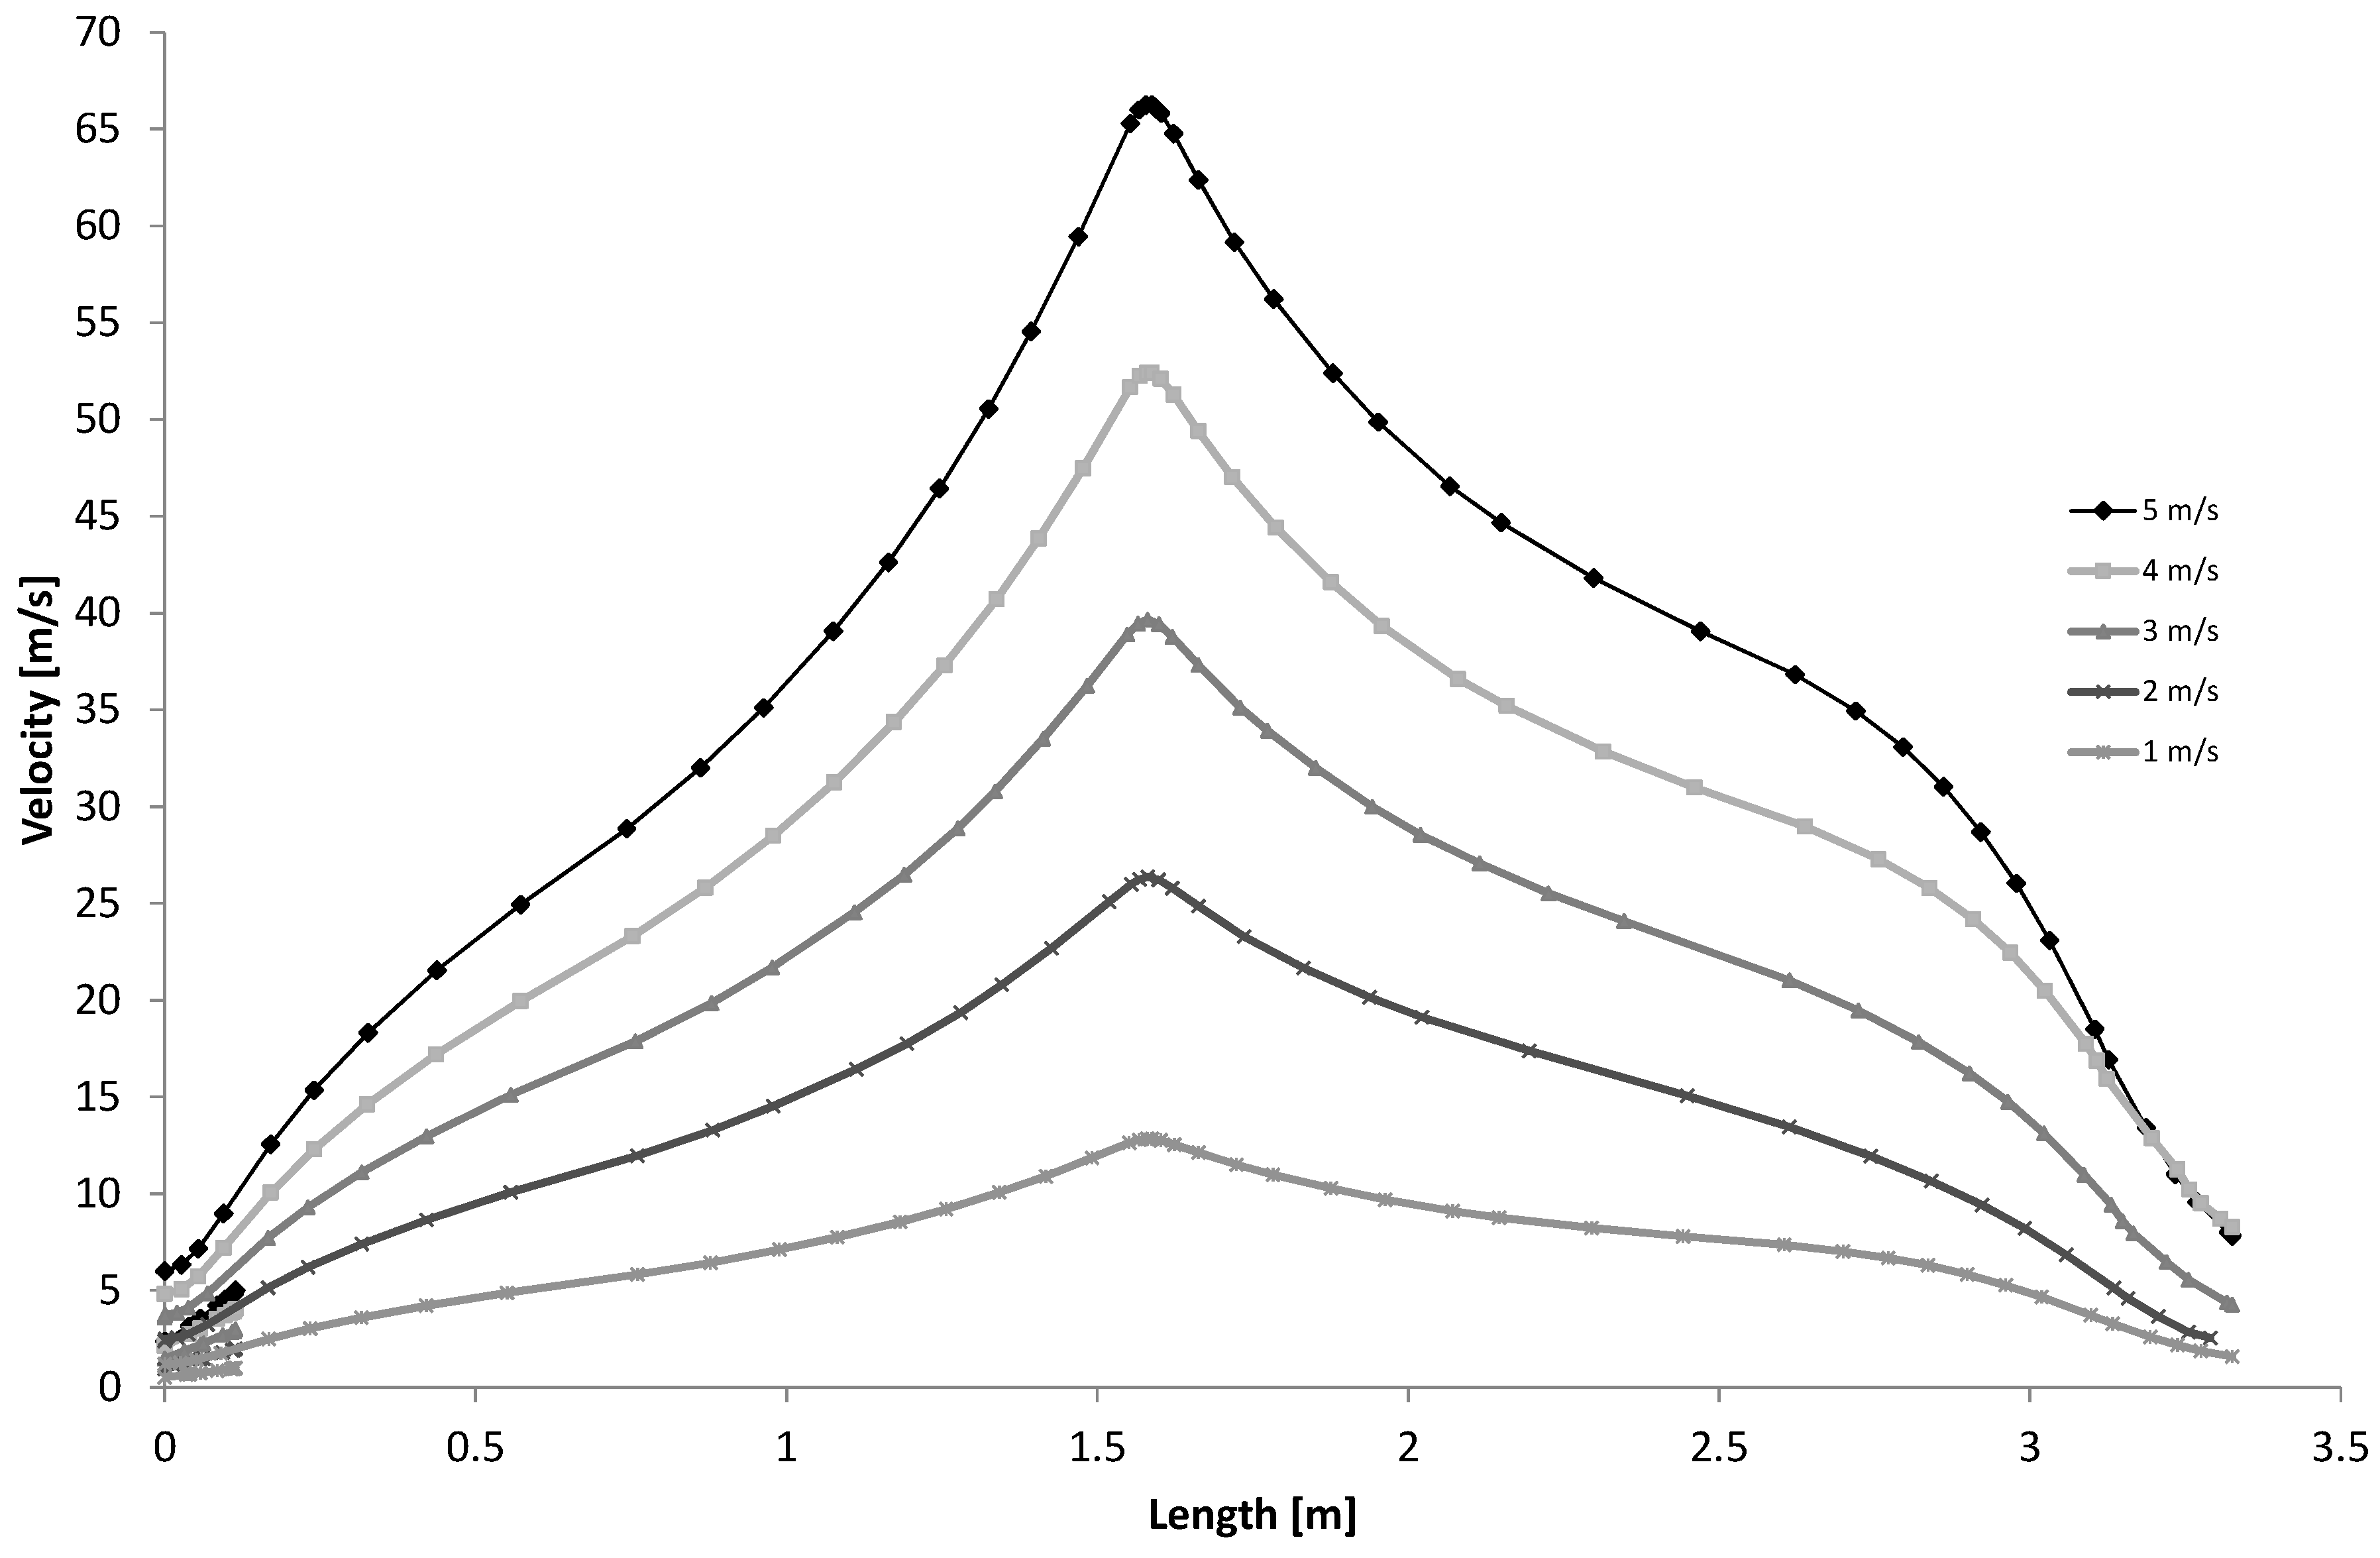
In particular, Figure 11 shows two families of curves corresponding to 85% and 95% of inlet air relative humidity and, for each family of curves, it shows the effect of inlet velocity over relative humidity in the throat (x = 1.554 m). At the same time, Figure 12 shows two families of curves: the effect of inlet air velocity over temperature at 95% of relative humidity and the relative humidity evolution through the nozzle–diffuser system for 4 and 5 m/s. This same effect is expressed as pressure in the centre line in Figure 13. Similarly, to analyse the velocity values inside the nozzle, with and without moist air condensation, and at different inlet velocities and relative humidities, more CFD simulations were done in order to show its centre line values (Figure 14).
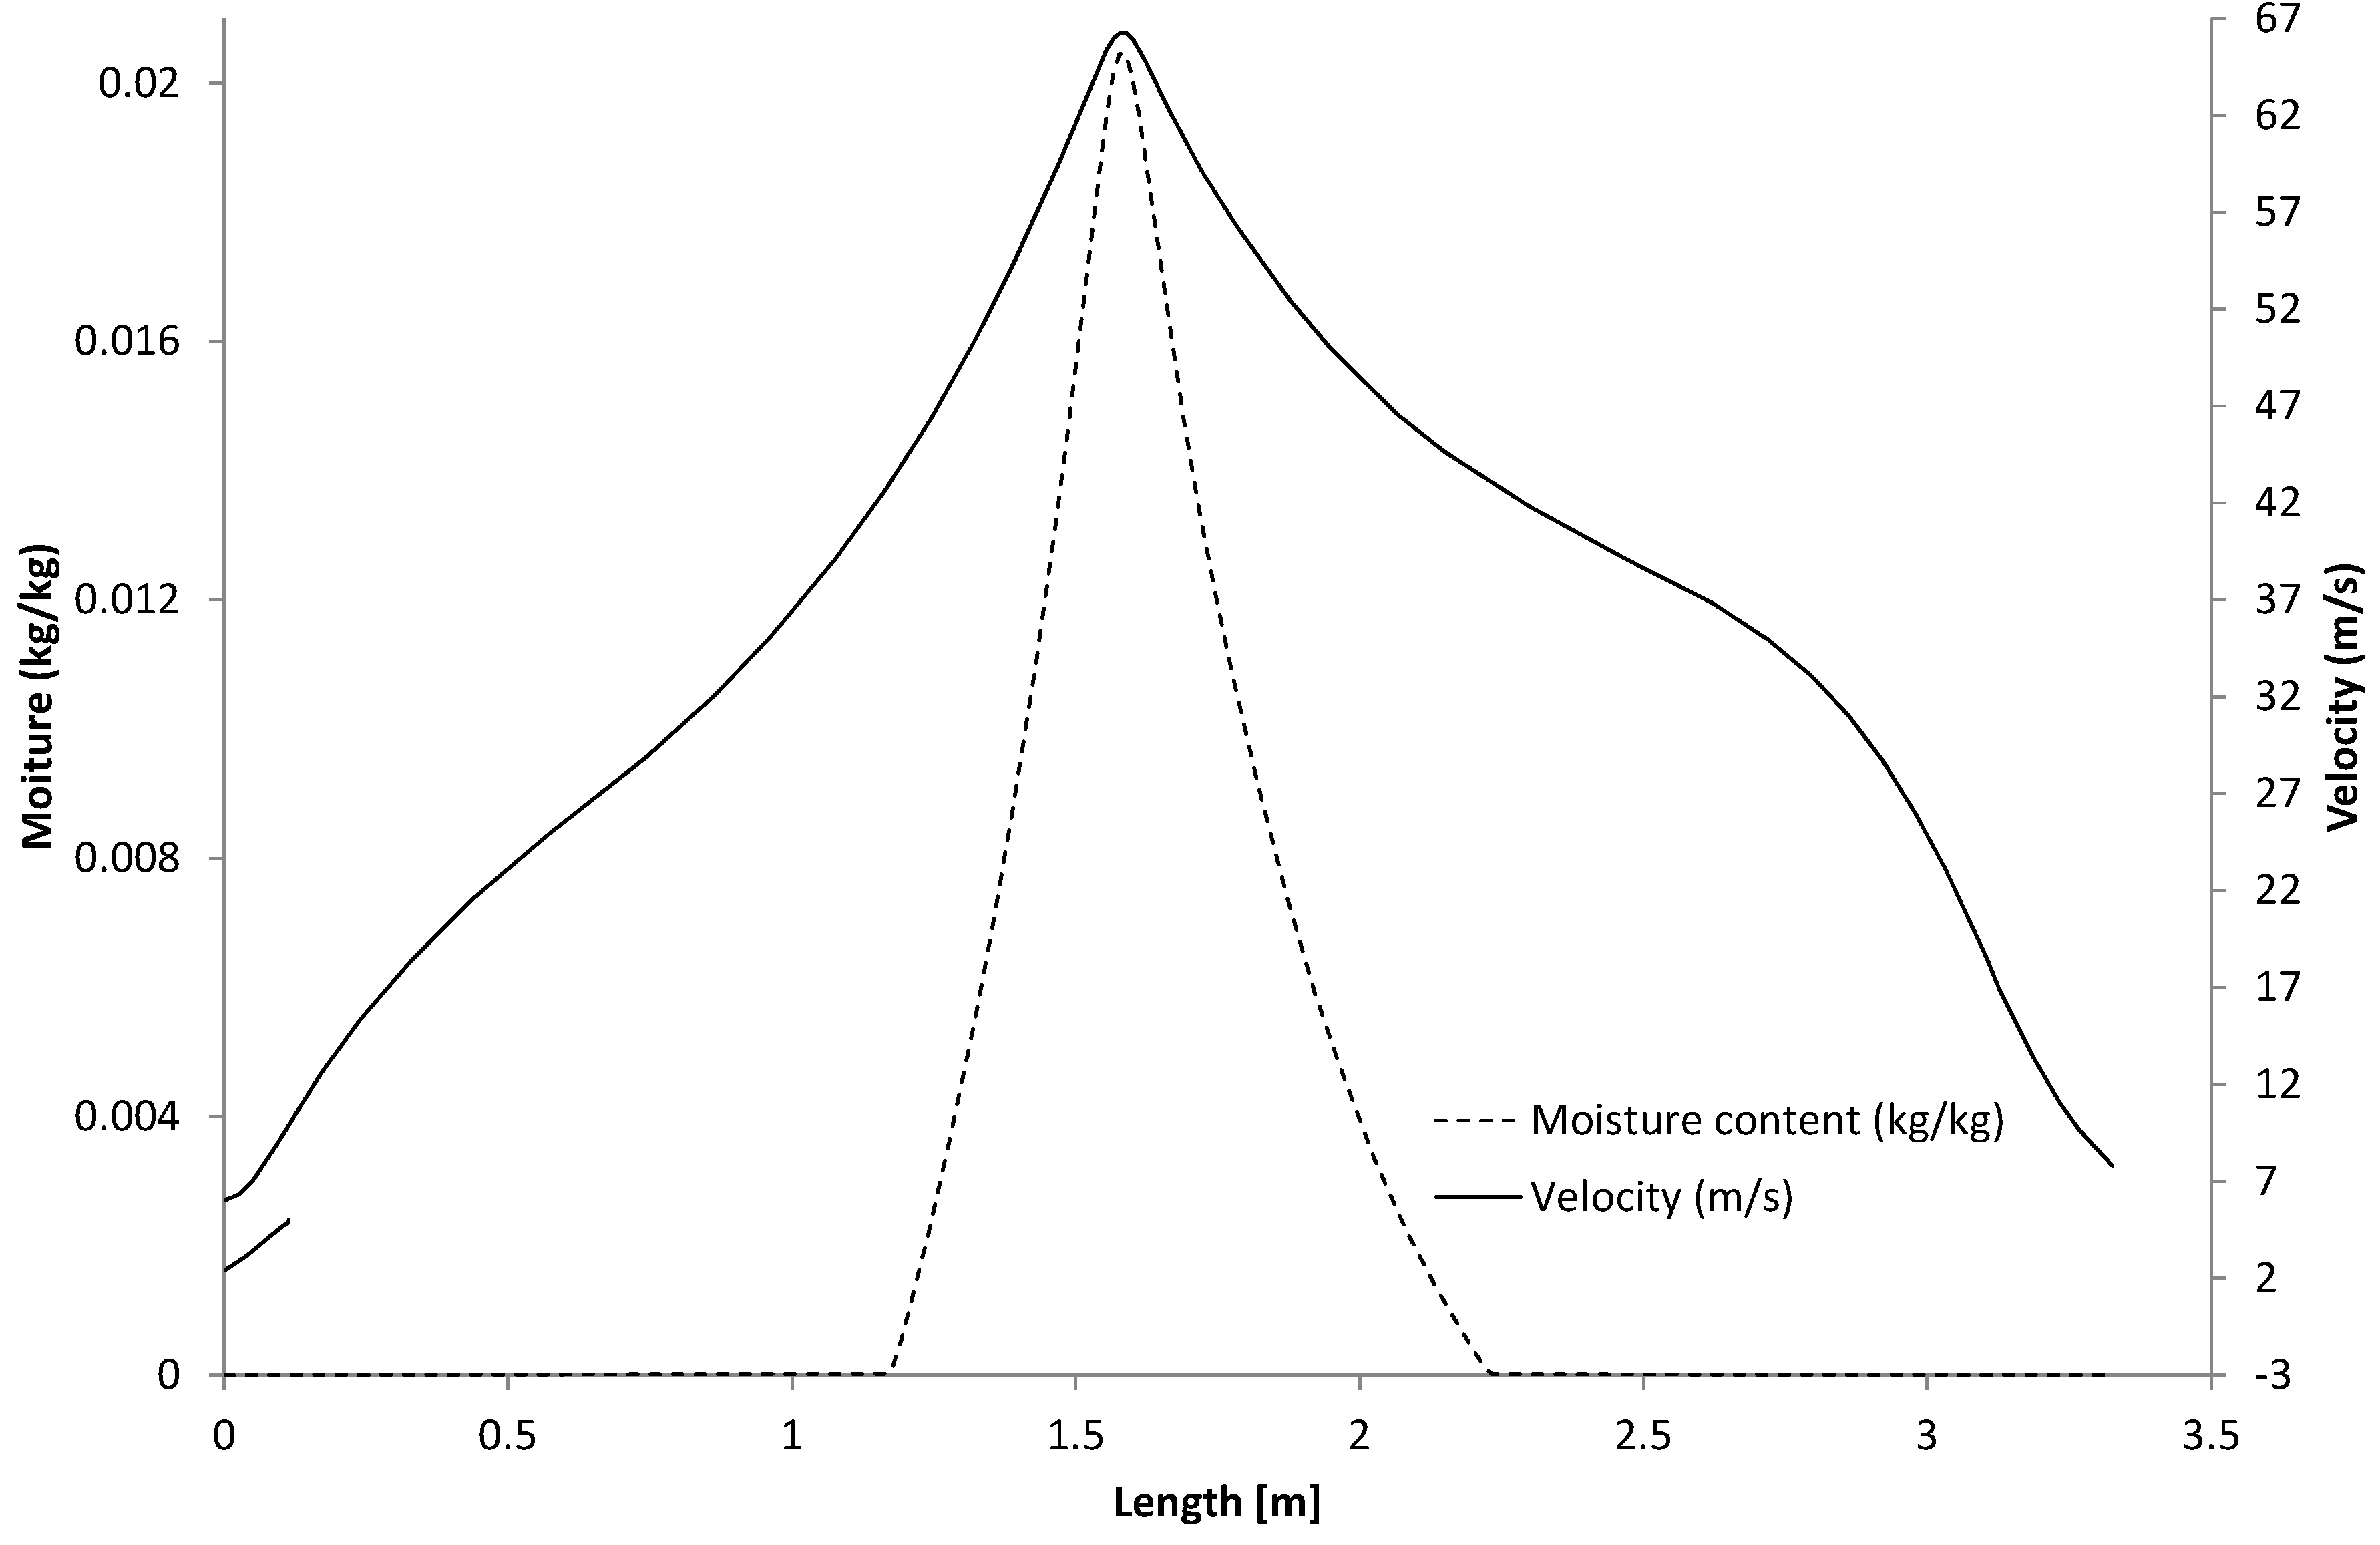
Finally, to identify the relationship between air velocity peaks in the nozzle throat and moisture content, Figure 15 includes moisture content and moist air velocity in the centre line at 5 m/s and a relative humidity of 95%.
5. Discussion
At the outset, to understand this dehumidifier behaviour, a small description of the relationships among moist air thermodynamics variables is necessary. In this sense, during moist air expansion, the specific humidity (w) remains constant and at the same time that the internal pressure drops (p), the partial pressure of vapour (pv) must drop in accordance with Equation (3).
At the same time, partial vapour pressure of the saturation of vapour in moist air (pvsat) can be defined by the temperature if the temperature is over 0 °C, as we can see in Equations (4) and (5).
In accordance with ASHRAE [10], the values of the constants are as follows: C1 = −5674.5359; C2 = 6.3925247; C3 = −9.677843 × 10⁻³; C4 = 6.22115701 × 10⁻⁷; C5 = 2.0747825 × 10⁻⁹; C6 = −9.484024 × 10⁻¹³; C7 = 4.1635019; C8 = −5800.2206; C9 = 1.3914993; C10 = −4.8640239 × 10⁻²; C11 = 4.1764768 × 10⁻⁵; C12 = −1.4452093 × 10⁻⁸; C13 = 6.5459673.
Finally, during the expansion process in the nozzle, when the partial vapour pressure and temperature drop, the partial vapour pressure will be equal to the partial vapour pressure of the saturation value at one moment, and as a consequence, condensation will begin because a relative humidity value of 100% was obtained. Based on the understanding of this process, we analysed the optimal dehumidifier design for an inlet specific humidity and velocity.
As an initial result, it is interesting to highlight that the real sampled data from a simple nozzle is in clear agreement with the simulations in terms of velocity and relative humidity, as shown in Table 1. Despite this, a slight difference in data was obtained. In particular, a tendency to sample lower outlet velocity was noted in respect to the simulation results under high inlet velocity values. This is clearly related to the fact that it is a real process with surface roughness and heat exchange with the environment.
Due to the greatly reduced difference between the sampled and simulated results, we can define the internal flow and simulation considerations as adequate for this kind of research. In this sense, despite the fact that an internal flow with homogenous inlet velocity of 5 m/s and a high relative humidity level of 85% were employed, the nozzle system did not reach an adequate outlet velocity and, as a consequence, the pressure value did not experience enough of a reduction to reach condensation.
This last effect is directly related to the need to converge with the indoor ambience pressure as a boundary condition. In this sense, this situation will be corrected from the nozzle throat when a diffuser is added. Thus, a clear tendency of the inlet moist air to expand until it reaches an adequate velocity of 60 m/s is shown in Figure 8, Figure 9 and Figure 10. At that moment, indoor pressure will be so low that relative humidity will reach 100% and the condensation process will start.
Despite this, under a very high inlet velocity of 5 m/s and a relative humidity of 95%, the maximum velocity inside the nozzle will be about 66 m/s in the throat and the condensation will remain until it is over 60 m/s (Figure 11). In particular, the maximum moisture content per each nozzle area will be about 0.0211 kgWater/kgDry-air. In this sense, it was observed that (i) moist air experiences a cooling process of just more than 1.6 °C, and (ii) the relative humidity will reach condensation in the minimum flow section, as shown in Figure 11 and Figure 12.
The other thermodynamic properties of the moist air in the centre line are represented in Figure 11, Figure 12, Figure 13, Figure 14 and Figure 15, which show the minimum inlet velocity needed to reach condensation (RH = 100%) for an indoor ambient relative humidity of 85% and 95%. For instance, Figure 11 shows that, when the indoor ambience has a moist air relative humidity of 95%, condensation occurs just over 3 m/s of inlet velocity. Despite this, under the previously mentioned conditions, just a punctual condensation will occur, and at 5 m/s, a stable condensation process can be observed. From this, it can be concluded that the higher the inlet velocity, the faster the throat air velocity, which will reach values over 60 m/s and, as a consequence, condensation will occur. Furthermore, more simulations show that condensation will never occur under this inlet velocity range for a relative humidity of 65% and 75%.
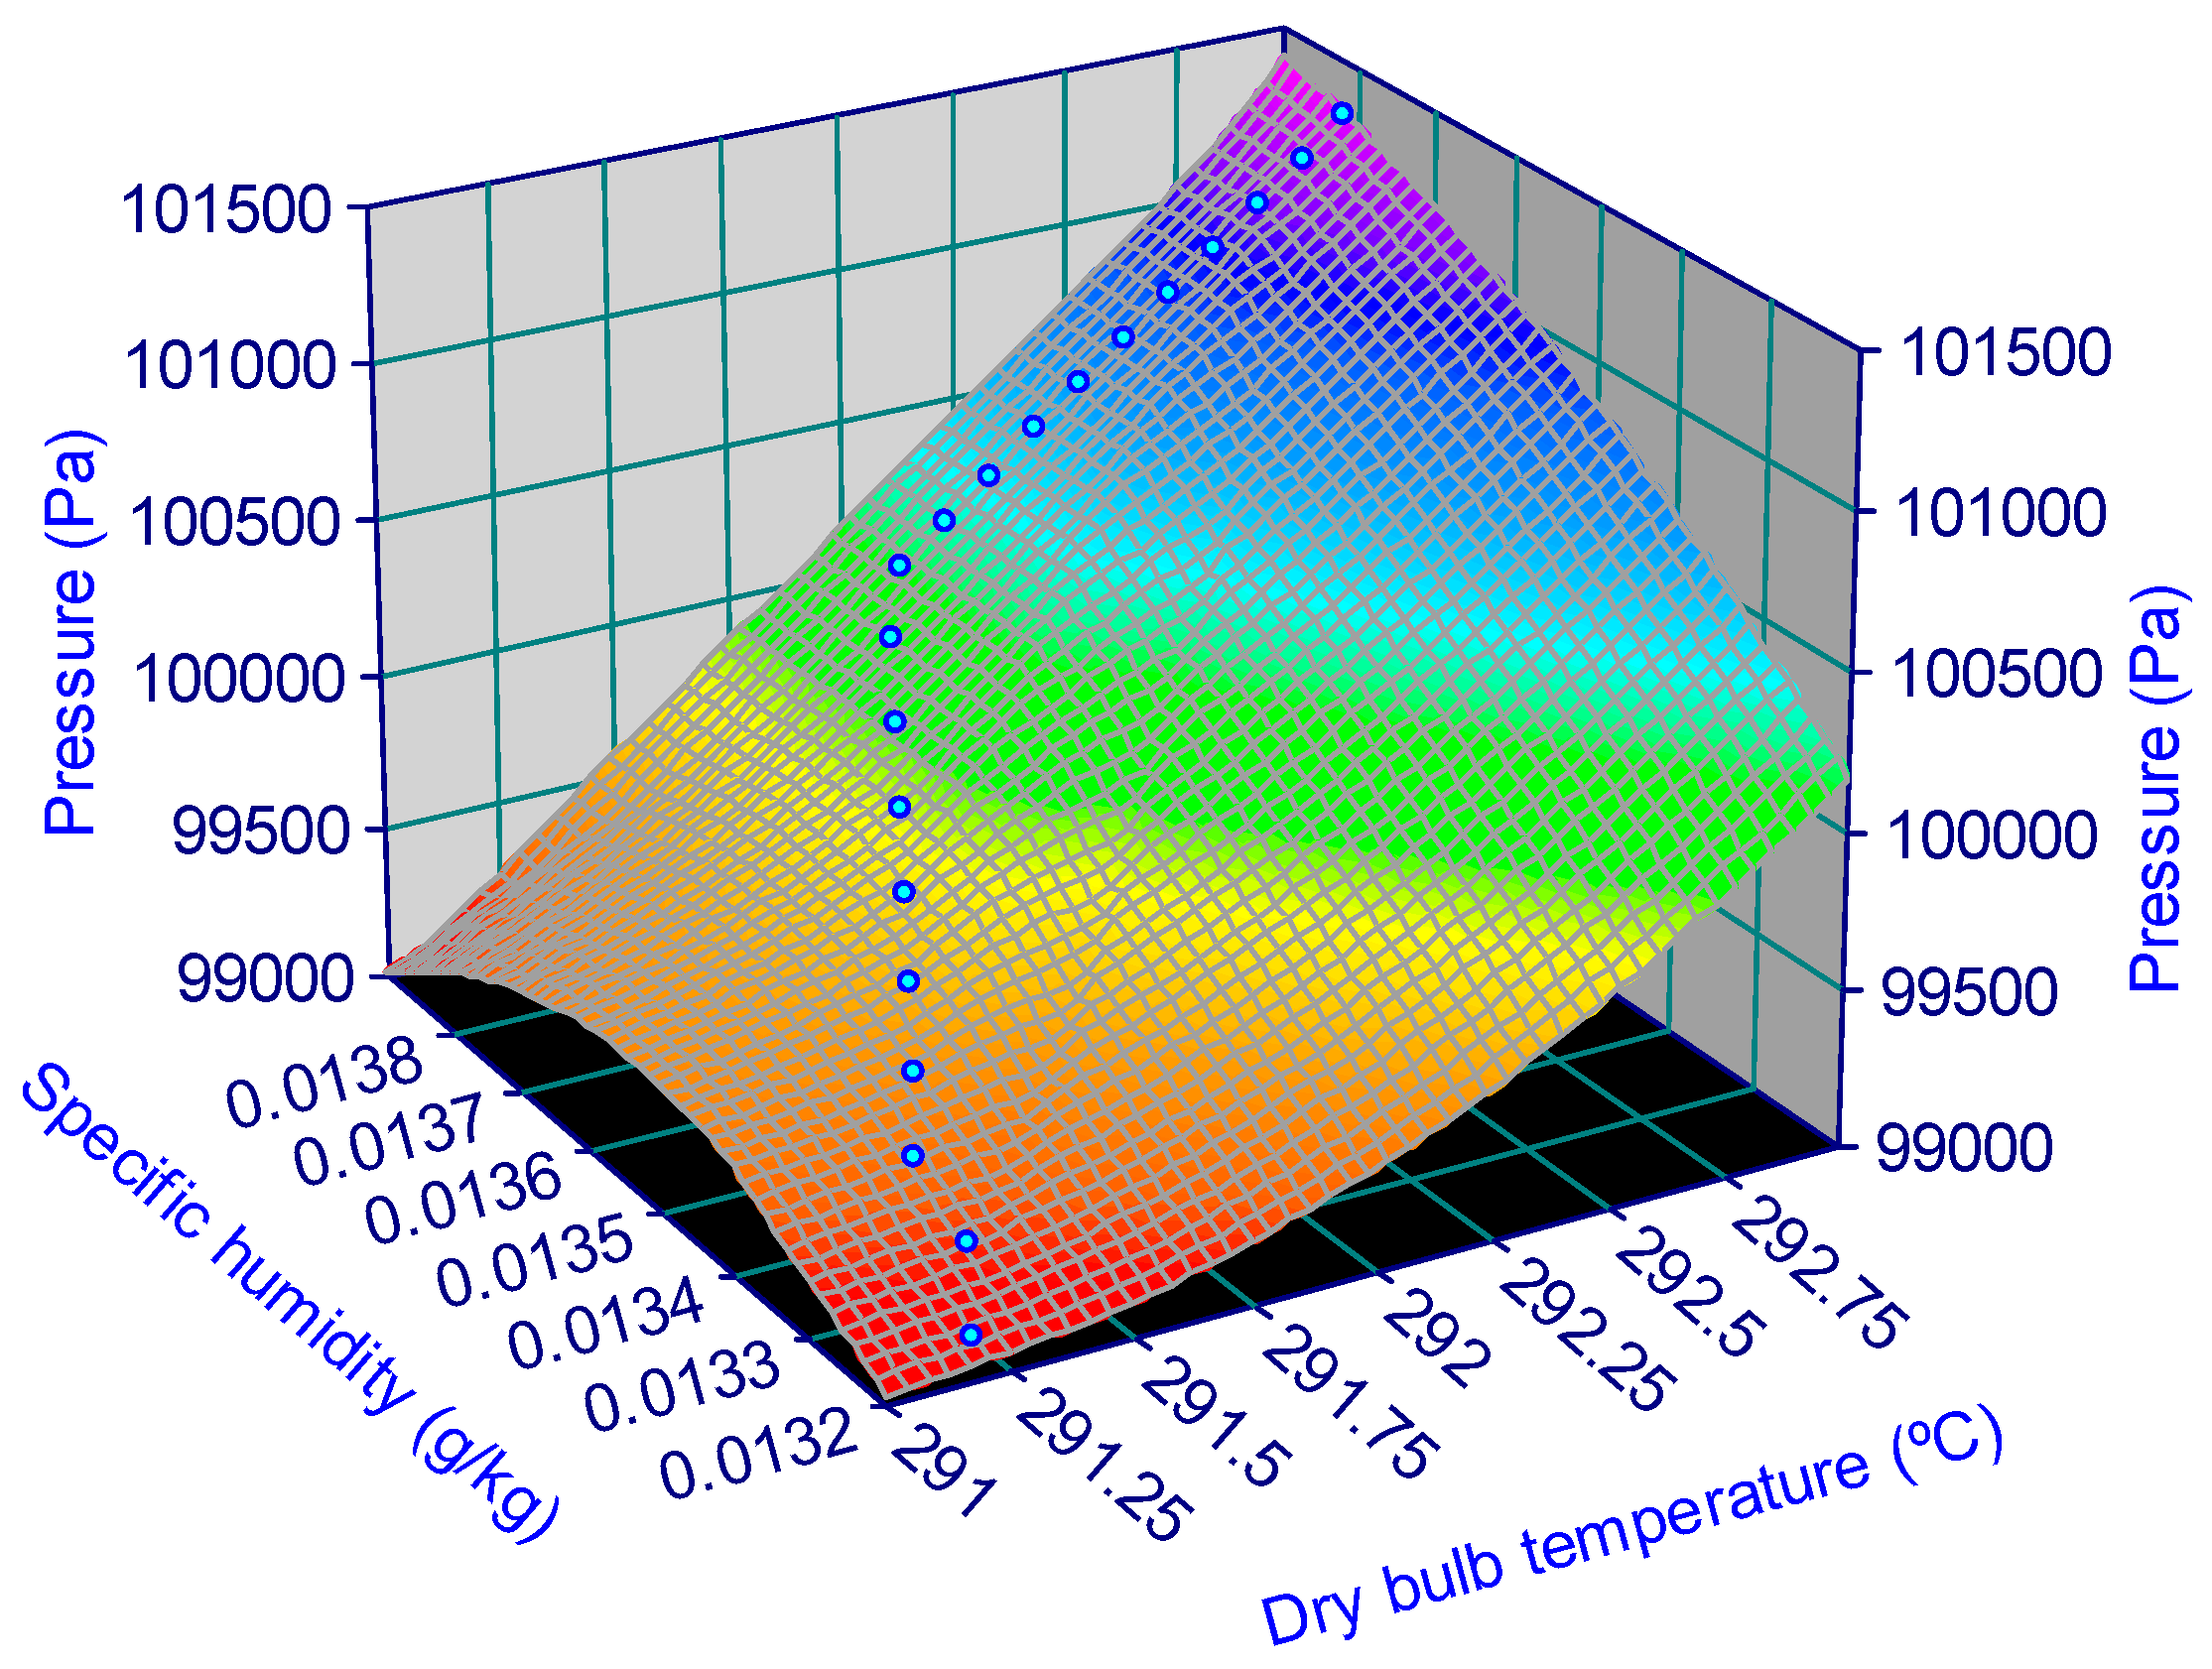
As we can see, Figure 12 shows the temperature evolution for an initial moist air relative humidity of 95% at different inlet velocities. In this sense, it is interesting to note that a partial vapour pressure of saturation is a function of the moist air temperature (Equation (2)). Based on this, we can define the condensation process by a relative humidity of 100%, or by what is the same partial vapour pressure in the equation to a partial vapour pressure of saturation. Figure 13 shows the nozzle length at which condensation occurs simultaneously at different inlet temperatures, with a change in relative humidity values and tendencies when the relative humidity reaches 100%.
From these curves we can visually define the initial place where condensation occurs and its temperature. As a result, it can be concluded that at 292.3 °C and 5 m/s of inlet velocity the condensation will init. Furthermore, at a few tenths of a degree below this temperature, moist air will begin to condense at 4 m/s of inlet velocity (as can be seen in Figure 14).
If we now analyse the effect of the moist air phase change over the throat velocity under different indoor ambient relative humidities (Figure 14), we can conclude that for a humid ambience of 95% and in accordance with the maximum velocity value, obtained at 1.554 m from the inlet, the velocity will experience a maximum peak value during the condensation process, as can be seen in Figure 15. Despite this, a different type of moist air velocity was not obtained from these simulations, with or without condensation, due to the software limitations, as we can see in the same figure.
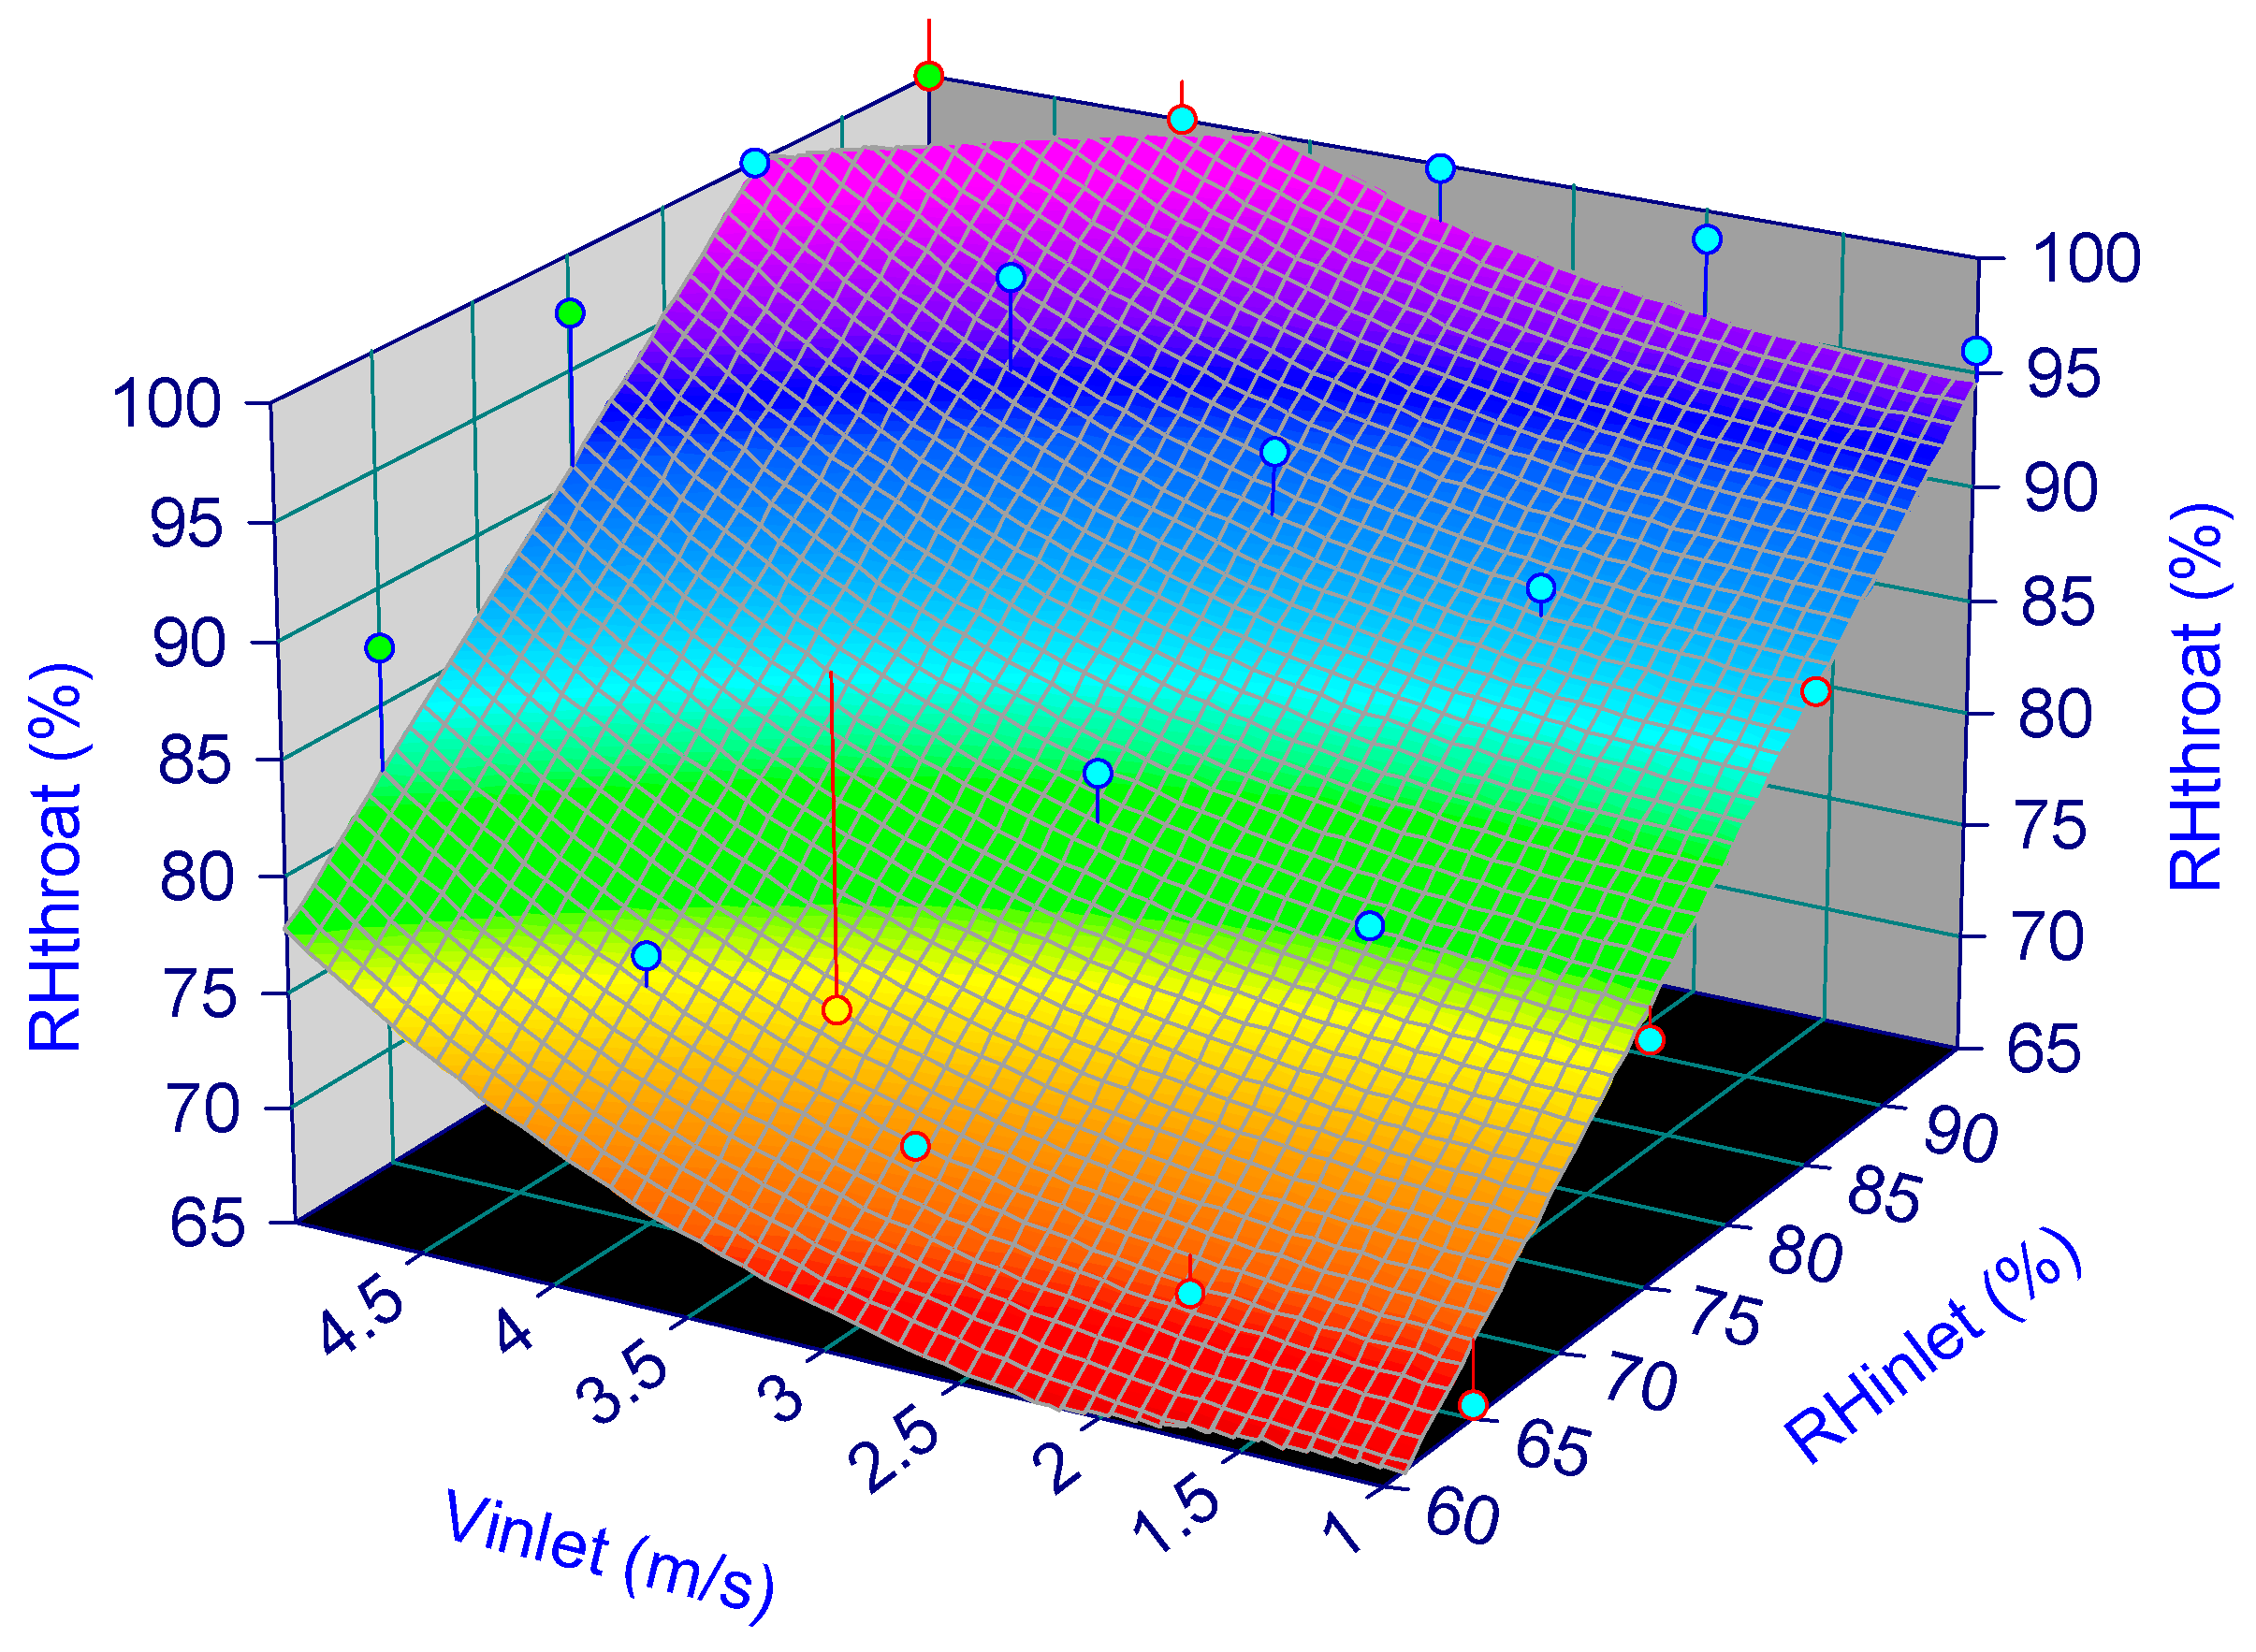
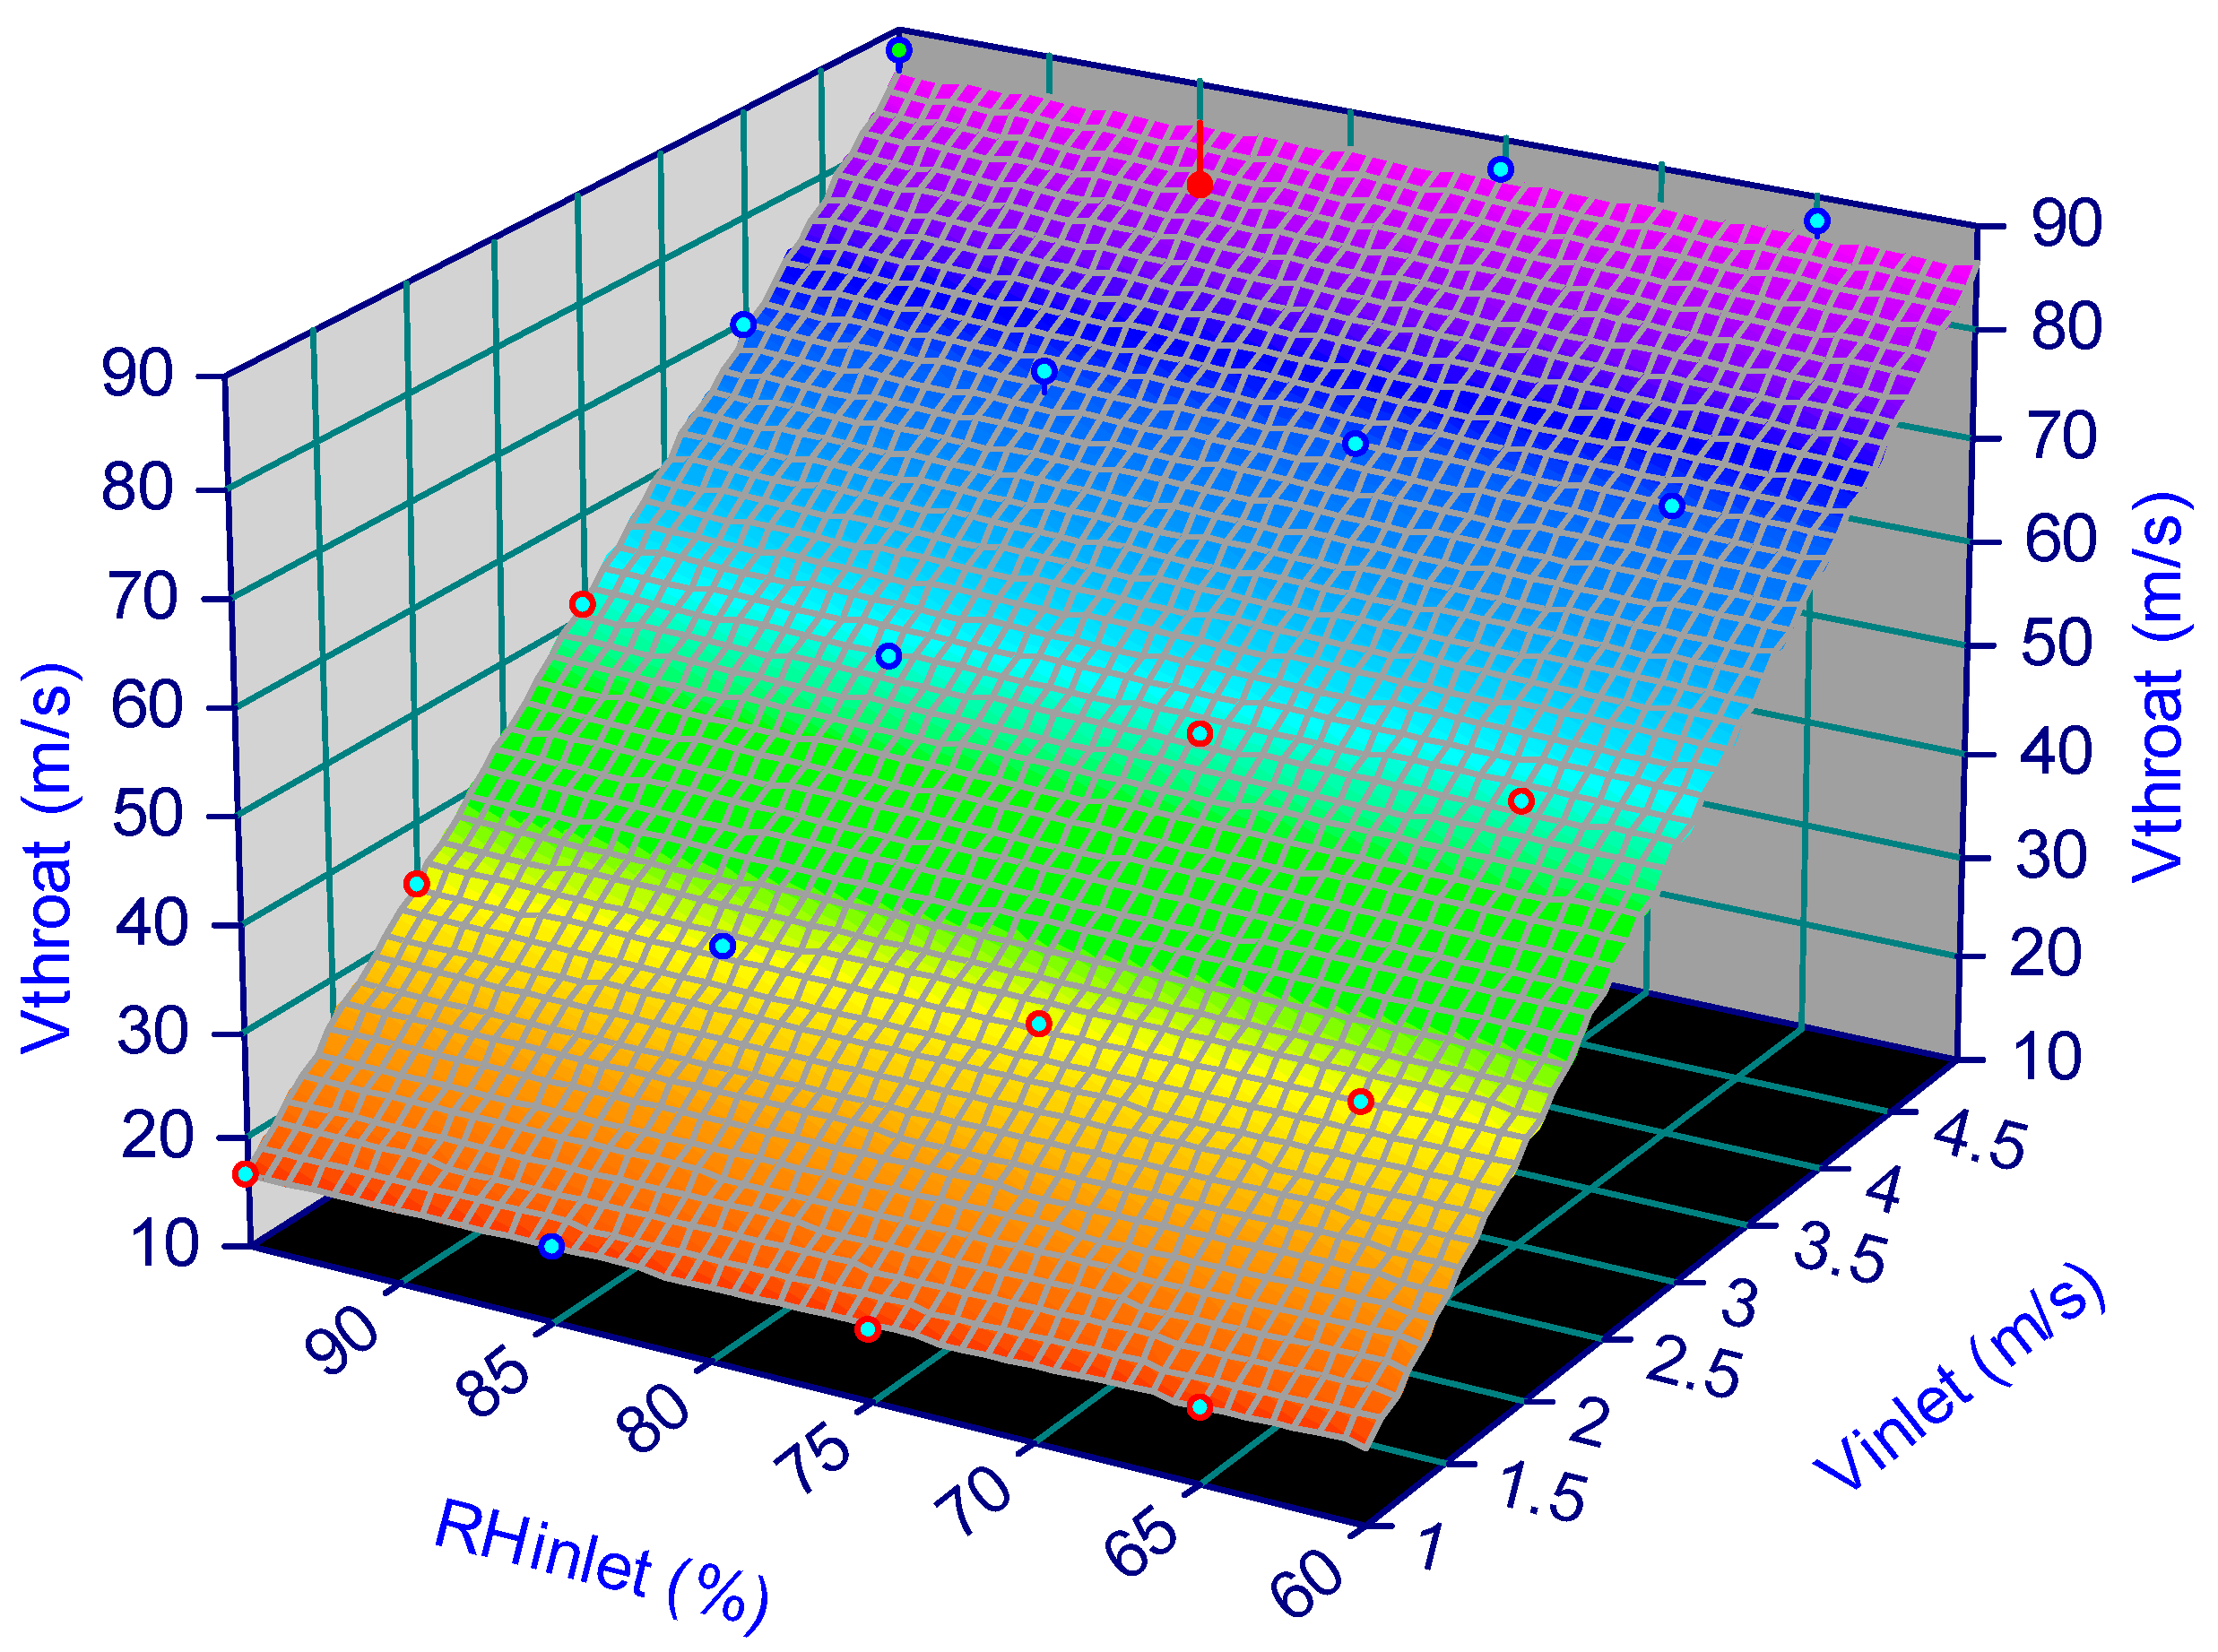
Finally, to get an initial mathematical model of this useful process, a three-dimensional curve fitting by the software Table Curve 3D® was done. This software provided the possible models in order as a function of the determination factor obtained in each case. In particular, the selected models relate the relative humidity and velocity in the nozzle inlet with the relative humidity (RHThroat) and velocity (VelThroat) obtained in the throat (x = 1.554 m), as we can see in Figure 16 and Figure 17 defined by Equations (6) and (7), with a coefficient of determination (R2) of 0.996 and 0.850, respectively.
Once these models show the relationship between indoor ambient relative humidity and velocity and the final condensation process, they can be defined as control systems that, based on these optimization charts, can adjust the ventilator velocity in accordance with the dehumidification level needed for indoor ambience.
To compare the expected energy consumption of this new technology with the classical mechanical refrigerator dehumidifier, commercial ventilators and mechanical dehumidifiers were selected. They were used to compare the energy consumption for every different air flow rate under a constant moist air outlet diameter of 400 mm, as we can see in Table 2.
From Table 2, it can be concluded that the energy consumption of a mechanical dehumidifier can be about ten times the energy needed for a fan employed in the nozzle–diffuser system. As shown in Table 2, to use a fan and a nozzle–diffuser for 2261 m3/h requires 0.2 kW, while an industrial dehumidifier for 2300 m3/h requires 3.150 kW, that is, more than 10 times the power consumption of the system that we propose in this work.
Despite the fact that this is an initial approach, it can clearly be concluded that the mechanical dehumidifier can be replaced by the one proposed for indoor air relative humidity ranges around 85%. In this sense, future research studies must be developed to obtain a variable inlet nozzle area for a maximum inlet velocity of 5 to 6 m/s fixed with commercial ventilators. With this increment in the inlet/outlet nozzle area, an increment in the working range of this dehumidifier will be implemented for relative humidities below 80%, but such an increment will always be limited by the pressure drop obtained as a consequence of the very high velocities that can be obtained inside the nozzle. At the same time, another research study must be developed to analyse what the benefits of a Peltier cooling process in the nozzle throat area could be, in order to improve this condensation process with very low energy consumption.
Finally, in a real nozzle–diffuser system, a moist air separator will be needed and differential pressure drops will appear as functions of the inlet velocity. In this sense, future prototypes of this very complete system must be tested in a close loop wind tunnel.
6. Conclusions
A new procedure for moist air dehumidification is shown in the present paper. Initial results showed that a simple nozzle cannot reach an outlet velocity high enough to reduce the pressure and reach moist air condensation. Despite this, real sample data in an open loop wind tunnel showed a good agreement with CFD simulation.
Based on the expansion and compression process that indoor air can experience within a nozzle diffuser system, a realistic dehumidifier is proposed. In this sense, the main simulations show that, under a limitation of 5 m/s of inlet velocity from commercial ventilators, the dehumidification range can be estimated to be at 80% of relative humidity for the designed system, but with an energy consumption of about ten times lower than that of the mechanical refrigerator system for the same moist air flow rate. Finally, future research studies based on the new inlet/outlet area ratio can allow one to reach lower relative humidity ranges.
Author Contributions
Conceptualization, J.A.O.; methodology, Á.M.C., R.B. and J.A.O.; software, J.A.O.; validation, Á.M.C. and R.B.; formal analysis, Á.M.C., R.B., D.V. and J.A.O.; data curation, Á.M.C., R.B., D.V. and J.A.O.; writing—original draft preparation, J.A.O.; writing—review and editing, J.A.O. and D.V.
Funding
This research was funded by CYPE Ingenieros S.A. in their research project to reduce energy consumption in buildings and its certification, in collaboration with the University of A Coruña (Spain) and the University of Porto (Portugal).
Conflicts of Interest
The authors declare no conflict of interest.
References
- International Energy Agency. Available online: https://www.iea.org/ (accessed on 19 February 2019).
- European Commission. NZEB. Available online: https://ec.europa.eu/energy/en/topics/energy-efficiency/buildings/nearly-zero-energy-buildings (accessed on 19 February 2019).
- Eliopoulou, E.; Mantziou, E. Architectural energy retrofit (AER): An alternative building’s deep energy retrofit strategy. Energy Build. 2017, 150, 239–252. [Google Scholar] [CrossRef]
- Salvalai, G.; Malighetti, L.E.; Luchini, L.; Girola, S. Analysis of different energy conservation strategies on existing school buildings in a Pre-Alpine Region. Energy Build. 2017, 145, 92–106. [Google Scholar] [CrossRef]
- CYPE Software. Available online: http://www.cype.es/ (accessed on 19 February 2019).
- Orosa, J.A.; Oliveira, A.C. A field study on building inertia and its effects on indoor thermal environment. Renew. Energy 2012, 37, 89–96. [Google Scholar] [CrossRef]
- Orosa, J.A.; Oliveira, A.C. Energy saving with passive climate control methods in Spanish office buildings. Energy Build. 2009, 41, 823–828. [Google Scholar] [CrossRef]
- MeteoGalicia. Xunta de Galicia. Available online: http://www.meteogalicia.gal/observacion/informesclima/informesIndex.action?request_locale=es (accessed on 19 February 2019).
- Fan, H.; Shao, S.; Tianb, C. Performance investigation on a multi-unit heat pump for simultaneous temperature and humidity control. Appl. Energy 2014, 883–890. [Google Scholar] [CrossRef]
- ANSI/ASHRAE Standard 62-2010. Ventilation for Acceptable Indoor Air Quality; ASHRAE: Atlanta, GA, USA, 2010. [Google Scholar]
- Orosa, J.A.; Oliveira, A.C. An indoor air perception method to detect fungi growth in flats. Expert Syst. Appl. 2012, 39, 3740–3746. [Google Scholar] [CrossRef]
- Brundrett, G.W. Handbook of Dehumidification Technology; Elsevier Ltd.: Amsterdam, The Netherlands, 1987. [Google Scholar]
- Harriman, L.G. The Dehumidification Handbook, 2nd ed.; Cargocaire Engineering Corporation: Amesbury, MA, USA, 2012; Available online: https://www.matsakis.gr/Munters%20DH%20Handbook.pdf (accessed on 10 April 2019).
- Naik, B.K.; Soni, A.; Kumar, A.; Muthukumar, P.; Somayaji, C. Coupled heat and mass transfer analysis of an adiabatic dehumidifier—Unique approach. Energy Procedia 2016, 90, 305–315. [Google Scholar] [CrossRef]
- Sayegh, M.A.; Hammad, M.; Faraa, Z. Comparison of two methods of improving dehumidification in air conditioning systems: Hybrid system (refrigeration cycle-rotary desiccant) and heat exchanger cycle. Energy Procedia 2011, 6, 759–768. [Google Scholar] [CrossRef]
- Yang, B.; Yuan, W.; Gao, F.; Guo, B. A review of membrane-based air dehumidification. Indoor Built Environ. 2015, 24, 11–26. [Google Scholar] [CrossRef]
- Han, X.; Zhang, X.; Wang, L.; Niu, R. A novel system of the isothermal dehumidification in a room air-conditioner. Energy Build. 2013, 57, 14–19. [Google Scholar] [CrossRef]
- Richner, H.; Hächler, P. Understanding and forecasting Alpine Foehn. In Mountain Weather Research and Forecasting; Chow, F., De Wekker, S., Snyder, B., Eds.; Springer Atmospheric Sciences: Dordrecht, The Netherlands, 2013; pp. 219–260. [Google Scholar]
- Orosa, J.A.; García-Bustelo, E.J.; Oliveira, A.C. An experimental test of low speed wind turbine concentrators. Energy Sources Part A Recovery Util. Environ. Eff. 2012, 34, 1222–1230. [Google Scholar] [CrossRef]
- Orosa, J.A.; García-Bustelo, E.J.; Oliveira, A.C. Realistic solutions for wind power production with climate change. Energy Sources Part A Recovery Util. Environ. Eff. 2012, 34, 912–918. [Google Scholar] [CrossRef]
- Luo, Y.; Chen, Y.; Yang, H.; Wang, Y. Study on an internally-cooled liquid desiccant dehumidifier with CFD model. Appl. Energy 2017, 194, 399–409. [Google Scholar] [CrossRef]
- Li, X.; Liu, S.; Tan, K.K.; Wang, Q.-G.; Cai, W.-J.; Xie, L. Dynamic modeling of a liquid desiccant dehumidifier. Appl. Energy 2016, 180, 435–445. [Google Scholar] [CrossRef]
- Orosa, J.A.; Oliveira, A.C. Engineering Thermodynamics with EES; LAP Lambert Academic Publishing: Saarbrücken, Germany, 2011. [Google Scholar]
- Solid Works Software 2016. Available online: https://www.3ds.com/es/productos-y-servicios/solidworks/ (accessed on 19 February 2019).
- Sobachkin, A.; Dumnov, G. SolidWorks Numerical Basis of CAD embedded CFD. White Paper. 2014. Available online: http://www.solidworks.in/sw/docs/Flow_Basis_of_CAD_Embedded_CFD_Whitepaper.pdf (accessed on 19 February 2019).
- Lam, C.K.G.; Bremhorst, K.A. Modified form of model for predicting wall turbulence. ASME J. Fluids Eng. 1981, 103, 456–460. [Google Scholar] [CrossRef]
- Tafelmeier, S.; Pernigotto, G.; Gasparella, A. Annual performance of sensible and total heat recovery in ventilation systems: Humidity control constraints for European climates. Buildings 2017, 7, 28. [Google Scholar] [CrossRef]
- Kyung-joo, C.; Dong-woo, C. Solar heat gain coefficient analysis of a slim-type double skin window system: Using an experimental and a simulation method. Energies 2018, 11, 115. [Google Scholar] [CrossRef]
- Sun, C.; Luo, L.; Shang, J.; Lu, Z.; Zhu, Y.; Wu, G. Design and numerical analysis of a novel counter-rotating self-adaptable wave energy converter based on CFD technology. Energies 2018, 11, 694. [Google Scholar] [CrossRef]
- Salvador Escoda, S.A. Available online: http://www.salvadorescoda.com/tecnico/index.htm (accessed on 19 November 2017).
- FRAL Dehumidifiers. Available online: http://www.fral.it/en/products/drying (accessed on 19 February 2019).
Figure 1.
Increasing trend of research papers indexed in SCOPUS related to the following keywords in the title or abstract: energy consumption. (Data collected on February 2019).
Figure 1.
Increasing trend of research papers indexed in SCOPUS related to the following keywords in the title or abstract: energy consumption. (Data collected on February 2019).

Figure 2.
The Foehn effect [18].
Figure 2.
The Foehn effect [18].

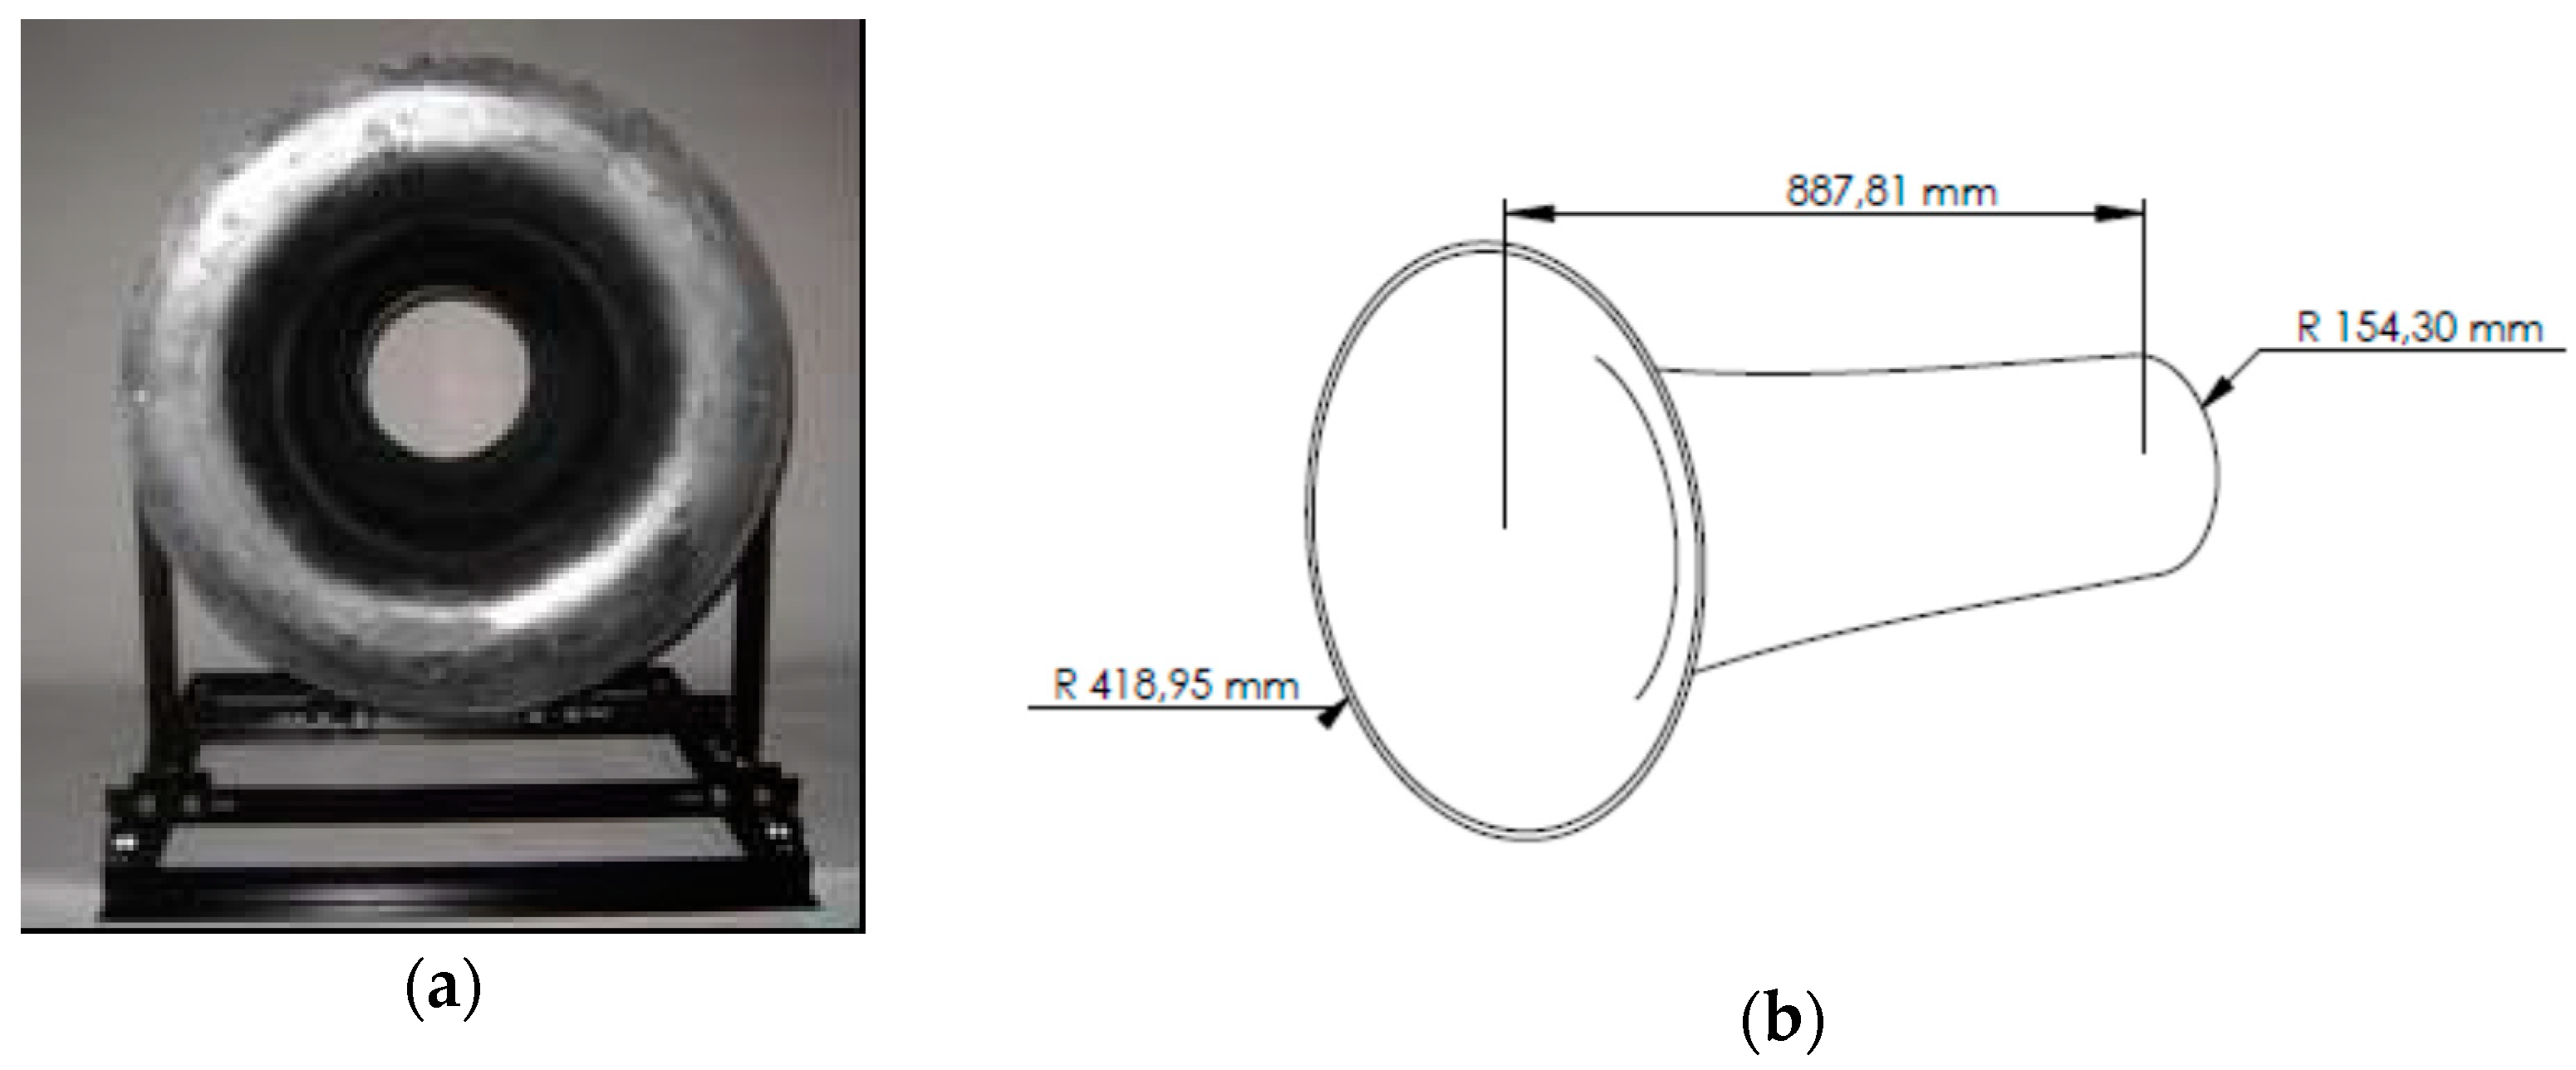
Figure 3.
Experimental case study: (a) open loop wind tunnel; (b) adiabatic saturator.

Figure 4.
The thermodynamic process of moist air within the nozzle.

Figure 5.
Open loop wind tunnel for nozzle test: (a) real view; (b) dimensions scheme.

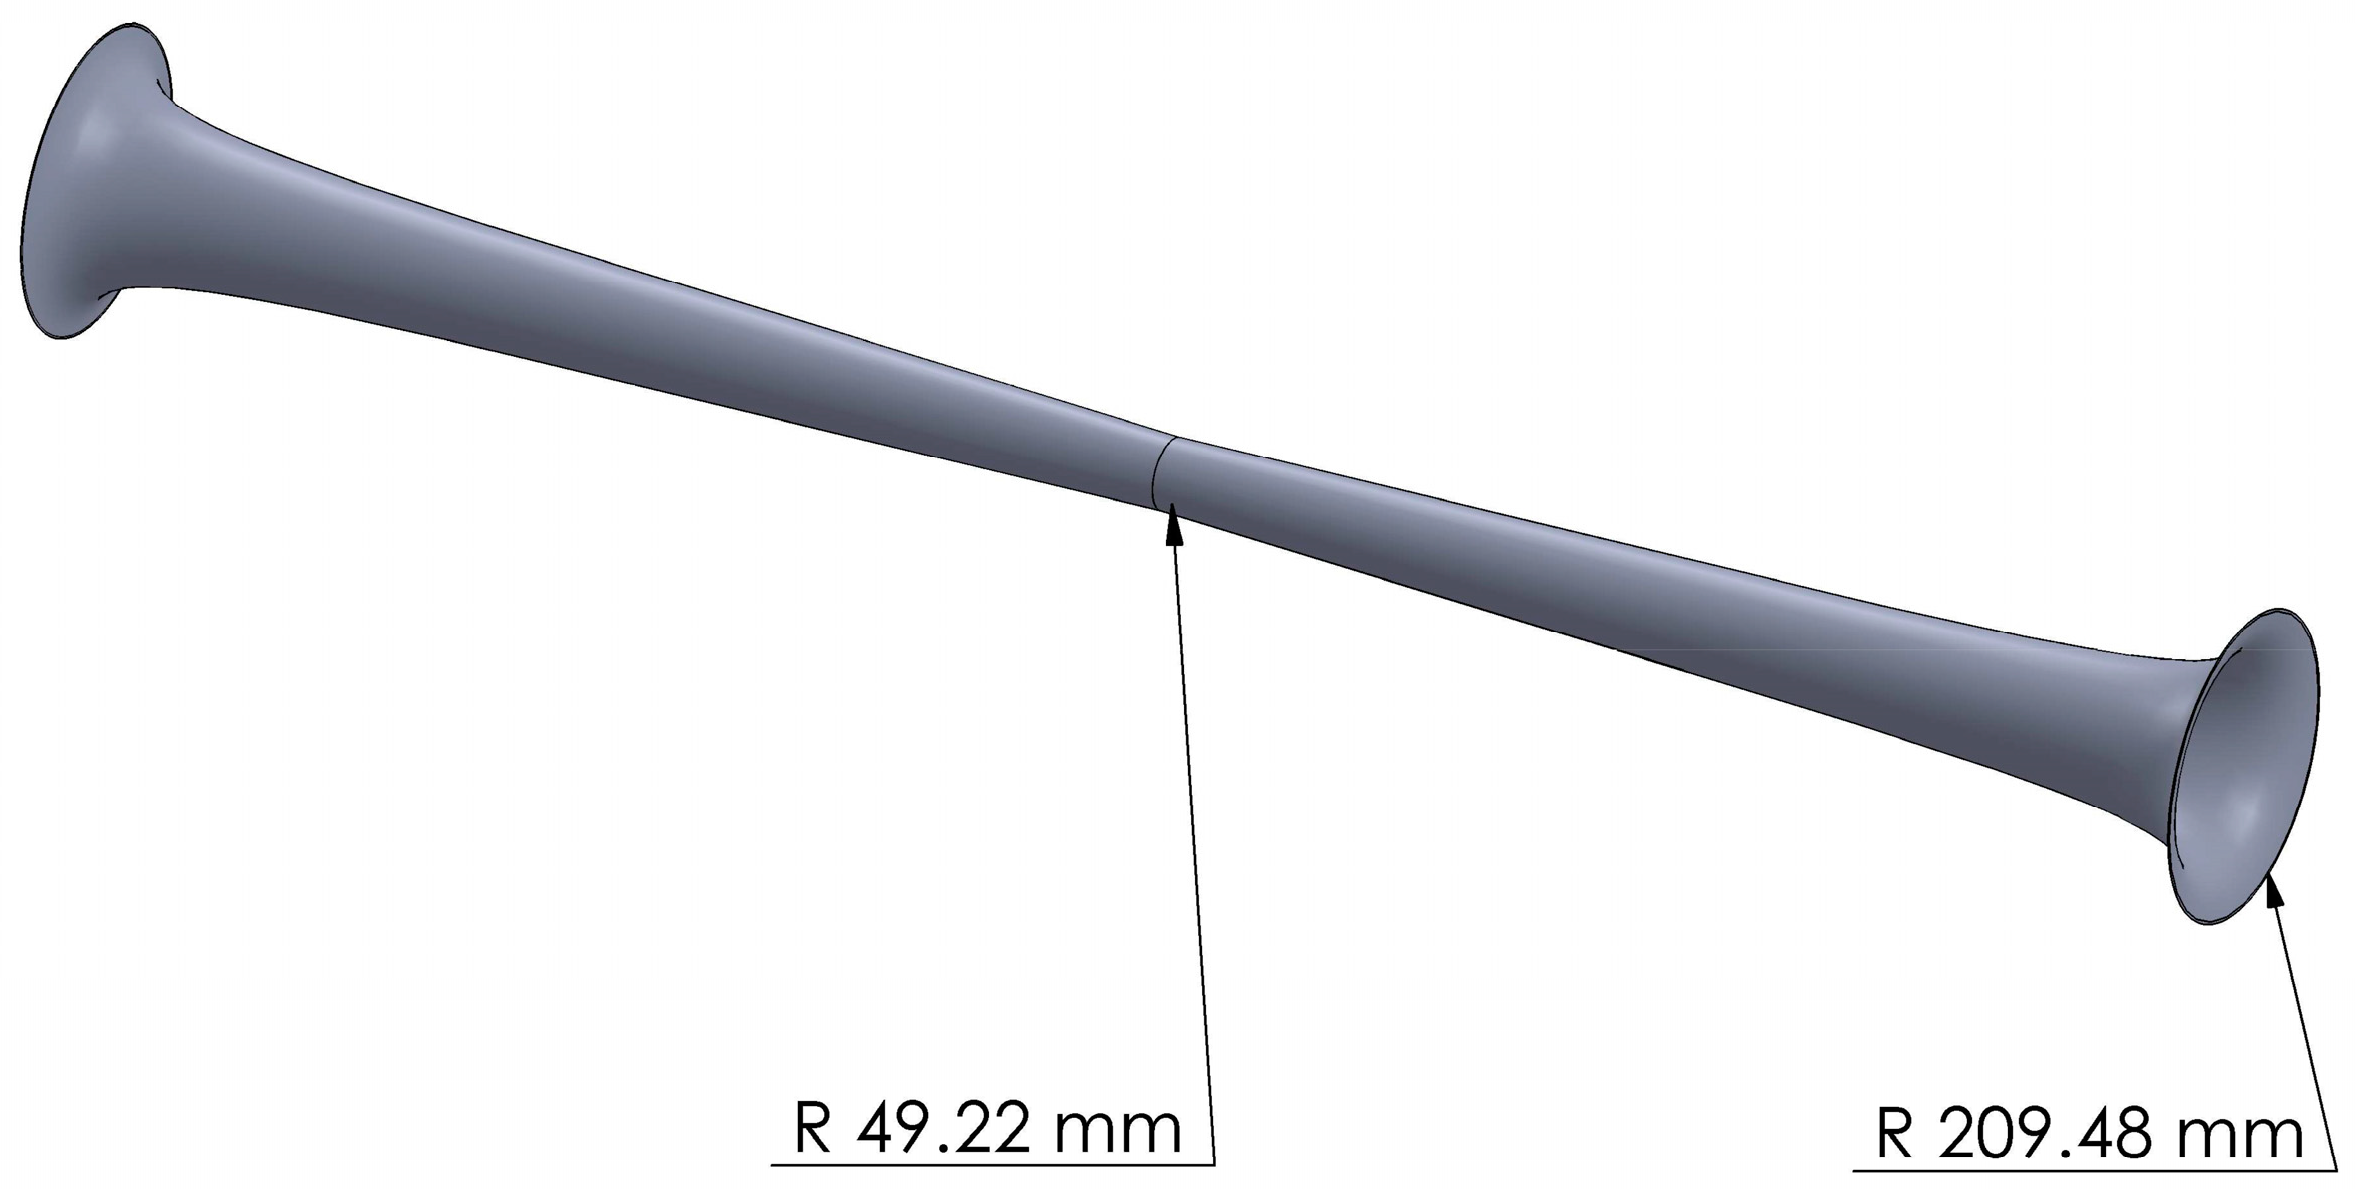
Figure 6.
Nozzle and diffuser to be tested.

Figure 7.
Simulations in the nozzle under internal flow of 1 m/s, 90% relative humidity and 101338 Pa: (a) relative humidity; (b) velocity.
Figure 7.
Simulations in the nozzle under internal flow of 1 m/s, 90% relative humidity and 101338 Pa: (a) relative humidity; (b) velocity.

Figure 8.
Velocity distribution in the nozzle–diffuser at 5 m/s, 101,338 Pa and 95% relative humidity.
Figure 8.
Velocity distribution in the nozzle–diffuser at 5 m/s, 101,338 Pa and 95% relative humidity.

Figure 9.
Relative humidity distribution in the nozzle–diffuser at 5 m/s, 101,338 Pa and 95% relative humidity.
Figure 9.
Relative humidity distribution in the nozzle–diffuser at 5 m/s, 101,338 Pa and 95% relative humidity.

Figure 10.
Relative humidity distribution in the nozzle–diffuser at 5 m/s, 101,338 Pa and 85% relative humidity.
Figure 10.
Relative humidity distribution in the nozzle–diffuser at 5 m/s, 101,338 Pa and 85% relative humidity.

Figure 11.
Effect of inlet air velocity over the condensation process for an ambient relative humidity of 85% and 95%.
Figure 11.
Effect of inlet air velocity over the condensation process for an ambient relative humidity of 85% and 95%.

Figure 12.
Effect of inlet air velocity over temperature for an ambient relative humidity of 95%.

Figure 13.
Effect of inlet air velocity over pressure for an ambient relative humidity of 95%.

Figure 14.
Effect of inlet air velocity over throat velocity for an indoor relative humidity of 95%.
Figure 14.
Effect of inlet air velocity over throat velocity for an indoor relative humidity of 95%.

Figure 15.
Moisture content and moist air velocity in the centre line for an inlet velocity of 5 m/s and 95% relative humidity.
Figure 15.
Moisture content and moist air velocity in the centre line for an inlet velocity of 5 m/s and 95% relative humidity.

Figure 16.
Throat relative humidity versus inlet velocity and relative humidity in a nozzle–diffuser system.
Figure 16.
Throat relative humidity versus inlet velocity and relative humidity in a nozzle–diffuser system.

Figure 17.
Velocity obtained in the throat versus inlet velocity and relative humidity in a nozzle–diffuser system.
Figure 17.
Velocity obtained in the throat versus inlet velocity and relative humidity in a nozzle–diffuser system.


Table 1.
Experimental results in a simple nozzle: T = temperature; Vel = Velocity; RH = relative humidity; PD = Pressure Drop.
Table 1.
Experimental results in a simple nozzle: T = temperature; Vel = Velocity; RH = relative humidity; PD = Pressure Drop.
| Inlet | Outlet Sampled | Outlet Simulated | |||||||
|---|---|---|---|---|---|---|---|---|---|
| Test | T (°C) | Vel (m/s) | RH (%) | Vel (m/s) | RH (%) | PD (Pa) | Vel (m/s) | RH (%) | PD (Pa) |
| 1 | 19.4 | 1.8 | 52 | 10.1 | 52 | 70 | 10.98 | 53 | 59 |
| 2 | 19.0 | 1.2 | 77 | 7.2 | 75 | 31 | 7.33 | 77 | 30 |
| 3 | 19.0 | 1.3 | 90 | 7.1 | 92 | 31 | 7.33 | 91 | 29 |
Table 2.
Energy consumption of the nozzle–diffuser system and mechanical dehumidifiers for different flow rates.
Table 2.
Energy consumption of the nozzle–diffuser system and mechanical dehumidifiers for different flow rates.
| Velocity (m/s) | Flow (m3/h) | Power (kW) | |
|---|---|---|---|
| Extractor S E [30] | 1 m/s | 452.16 | 0.062 |
| Extractor S E [30] | 2 m/s | 904.32 | 0.140 |
| Extractor S E [30] | 3 m/s | 1356.48 | 0.224 |
| Ventilator S E [30] | 4 m/s | 1808.64 | 0.130 |
| Ventilator S E [30] | 5 m/s | 2261.84 | 0.200 |
| Portable Dehumidifier FRAL [31] | - | 550 | 0.720 |
| Industrial Dehumidifier FRAL [31] | - | 600 | 0.800 |
| Industrial Dehumidifier FRAL [31] | - | 1800 | 1.650 |
| Industrial Dehumidifier FRAL [31] | - | 2300 | 3.150 |
| Industrial Dehumidifier FRAL [31] | - | 3500 | 4.550 |
© 2019 by the authors. Licensee MDPI, Basel, Switzerland. This article is an open access article distributed under the terms and conditions of the Creative Commons Attribution (CC BY) license (http://creativecommons.org/licenses/by/4.0/).
Share and Cite
MDPI and ACS Style
Costa, Á.M.; Bouzón, R.; Vergara, D.; Orosa, J.A. Eco-friendly Pressure Drop Dehumidifier: An Experimental and Numerical Analysis. Sustainability 2019, 11, 2170. https://0-doi-org.brum.beds.ac.uk/10.3390/su11072170
AMA Style
Costa ÁM, Bouzón R, Vergara D, Orosa JA. Eco-friendly Pressure Drop Dehumidifier: An Experimental and Numerical Analysis. Sustainability. 2019; 11(7):2170. https://0-doi-org.brum.beds.ac.uk/10.3390/su11072170
Chicago/Turabian StyleCosta, Ángel M., Rebeca Bouzón, Diego Vergara, and José A. Orosa. 2019. "Eco-friendly Pressure Drop Dehumidifier: An Experimental and Numerical Analysis" Sustainability 11, no. 7: 2170. https://0-doi-org.brum.beds.ac.uk/10.3390/su11072170
Note that from the first issue of 2016, this journal uses article numbers instead of page numbers. See further details here.