Comparison of Four Environmental Assessment Tools in Swedish Manufacturing: A Case Study


Abstract
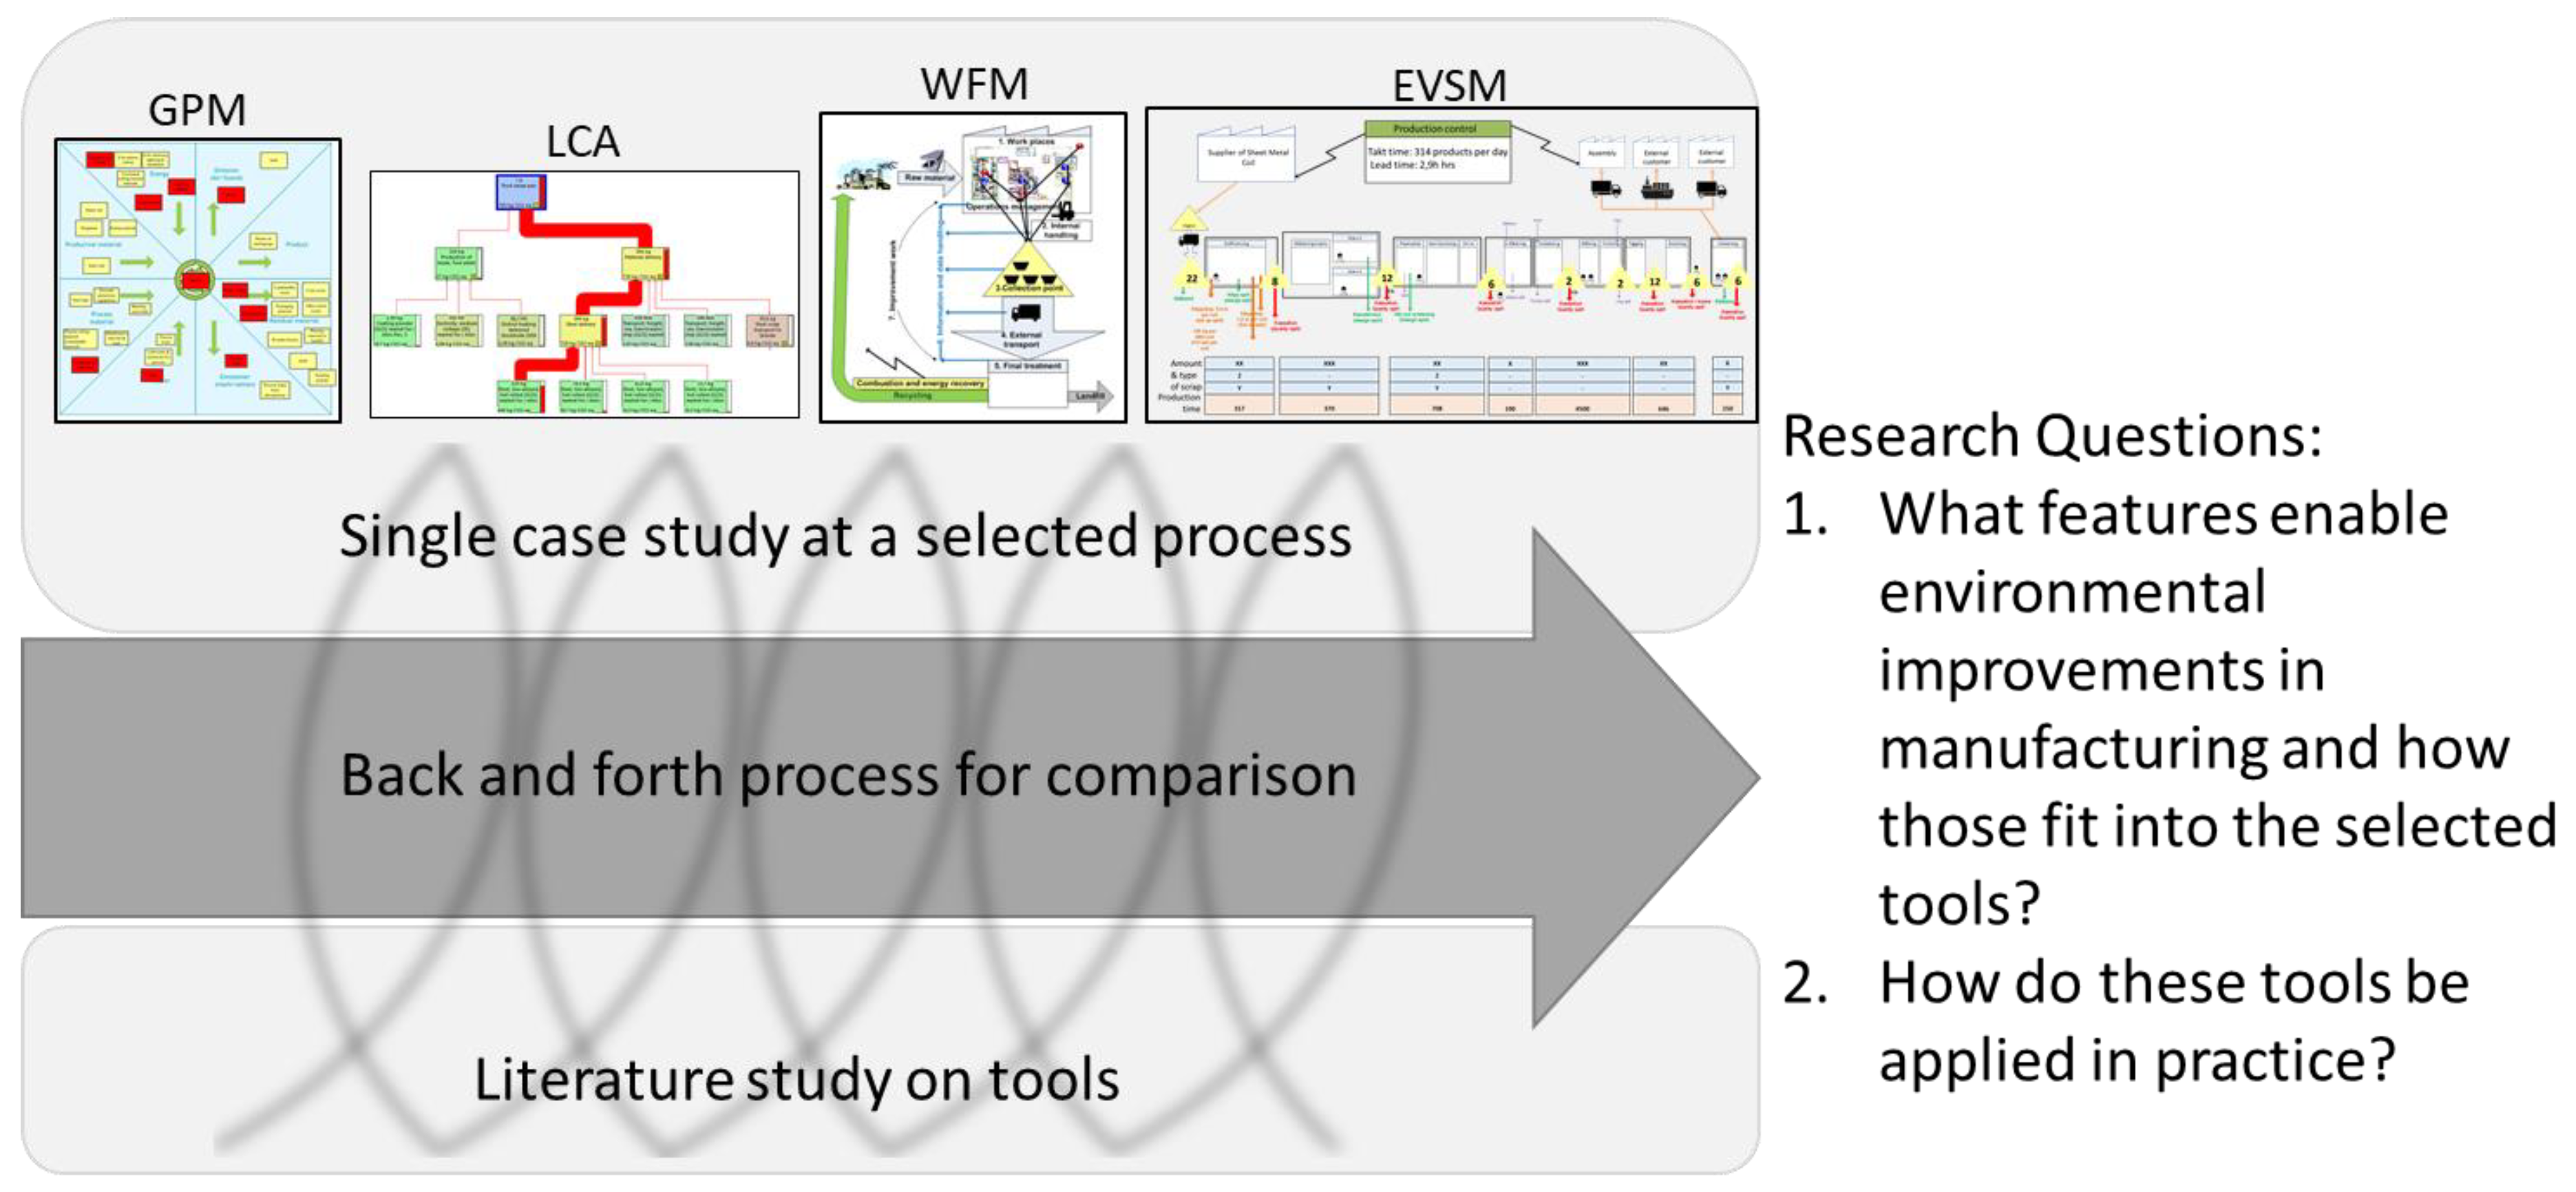
:1. Introduction
2. Theoretical Framework
2.1. Moving from Sustainability Concepts to Practical Tools
2.2. Summary of Included Tools
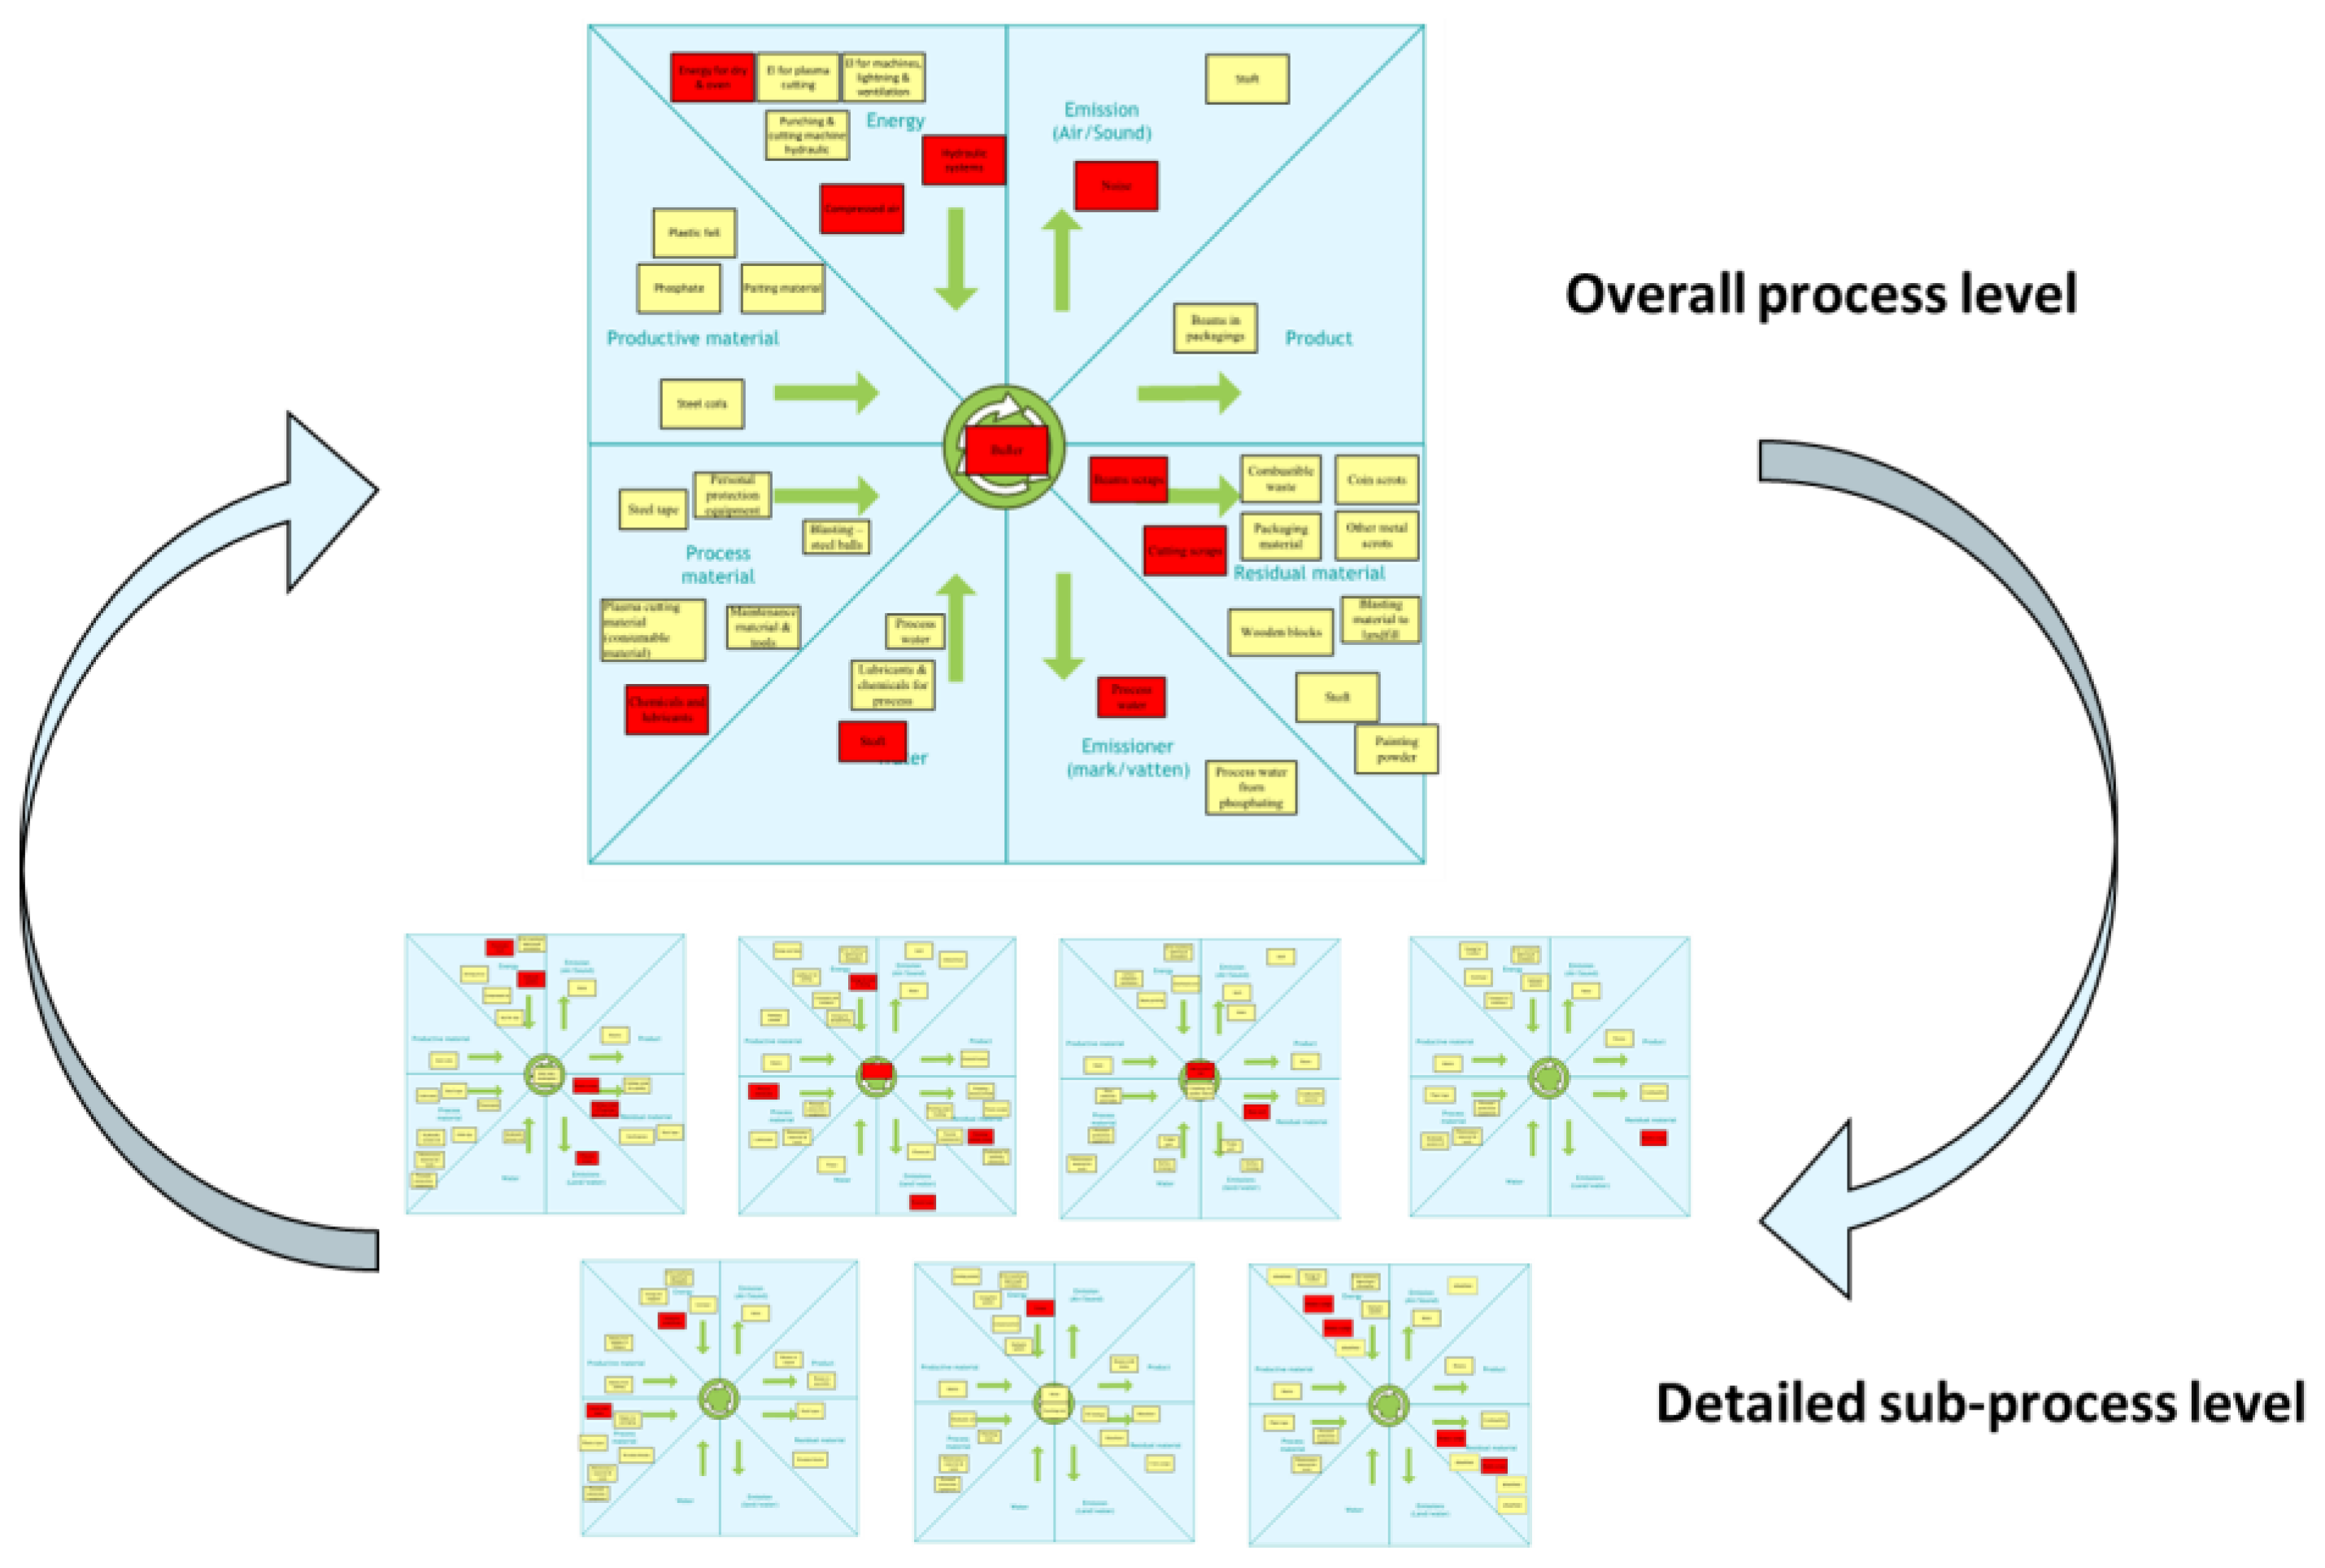
2.2.1. Green Performance Map
2.2.2. Environmental Value Stream Mapping
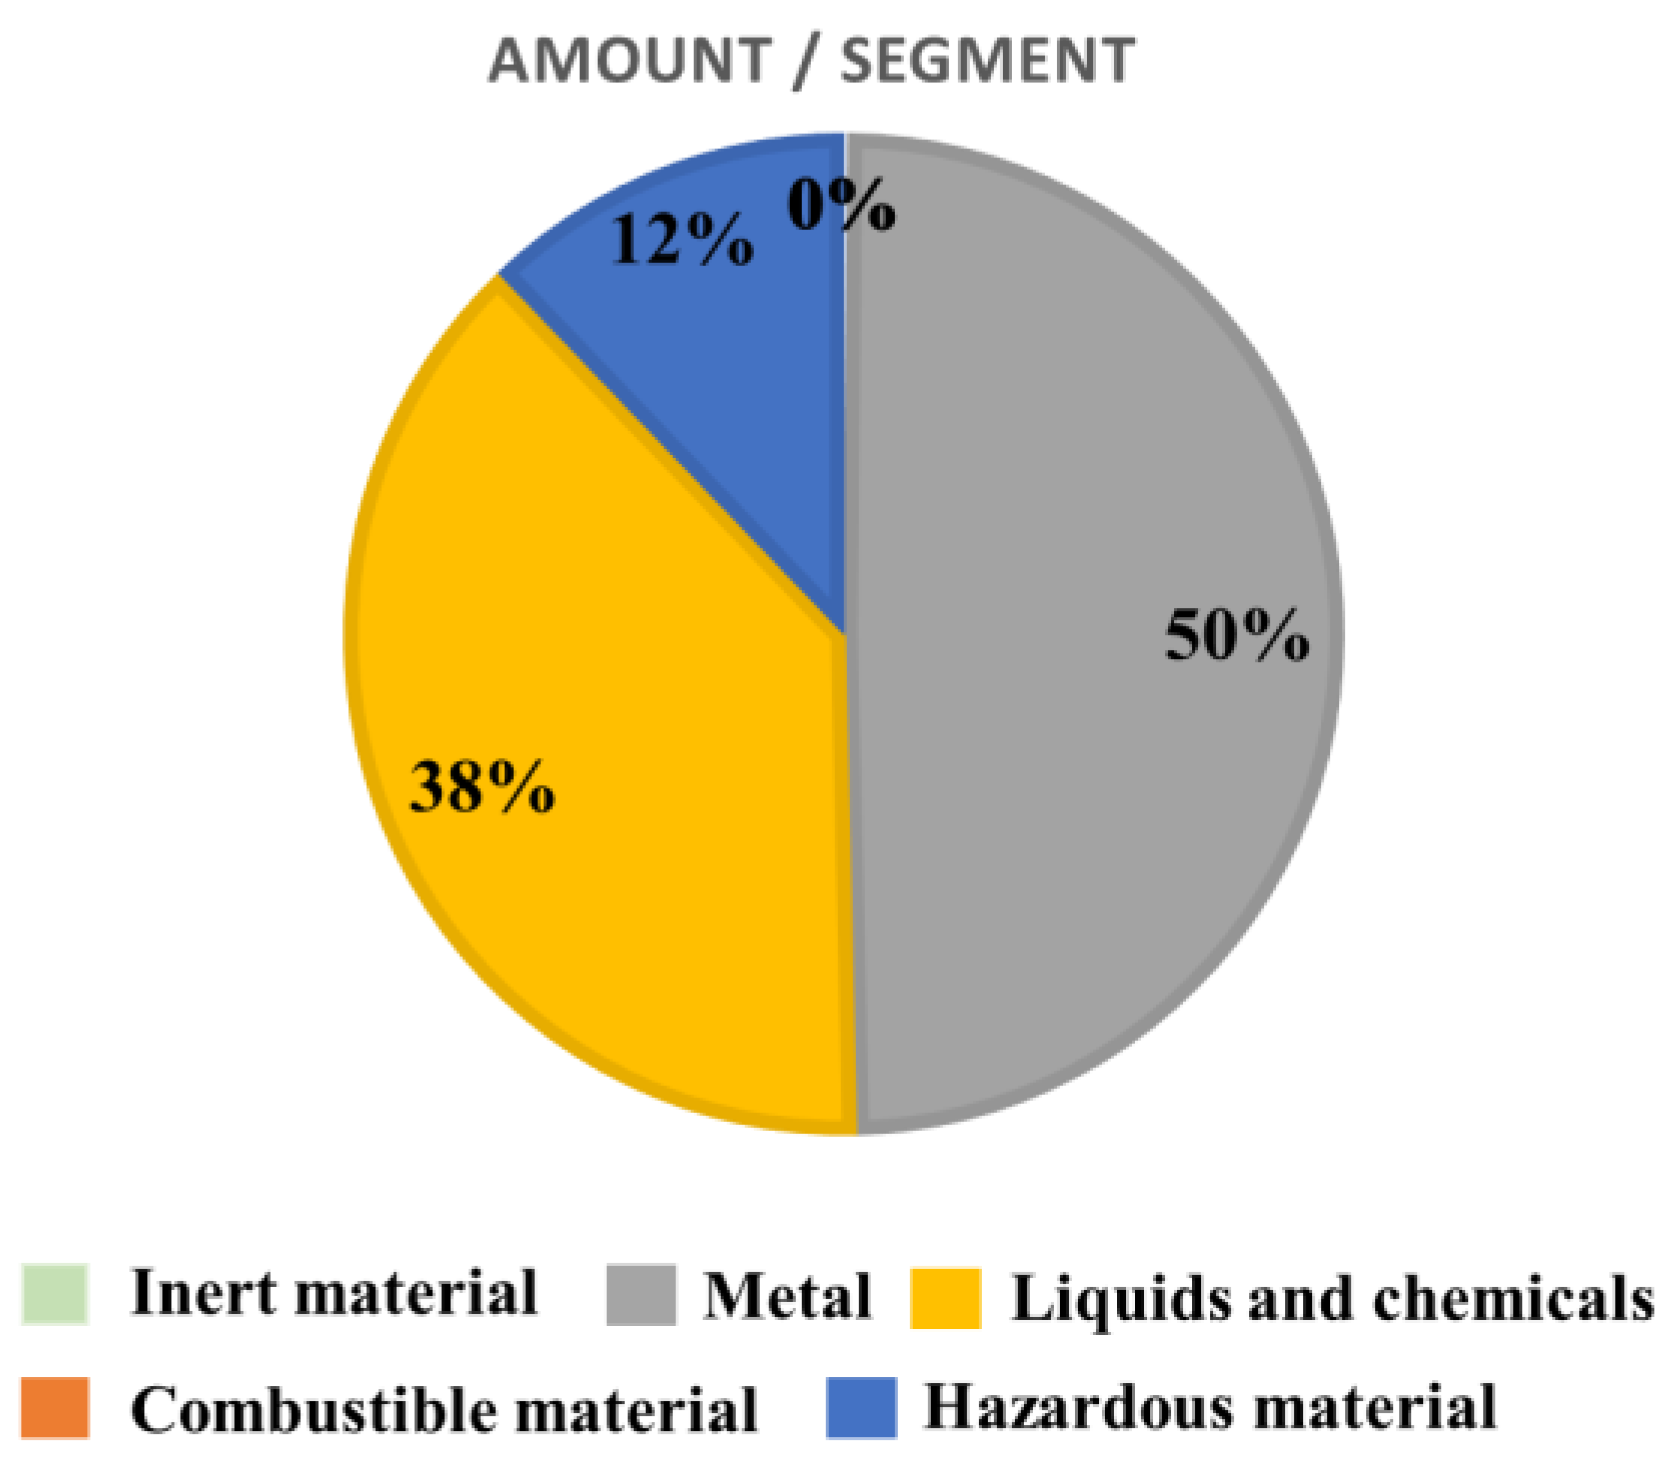
2.2.3. Waste Flow Mapping
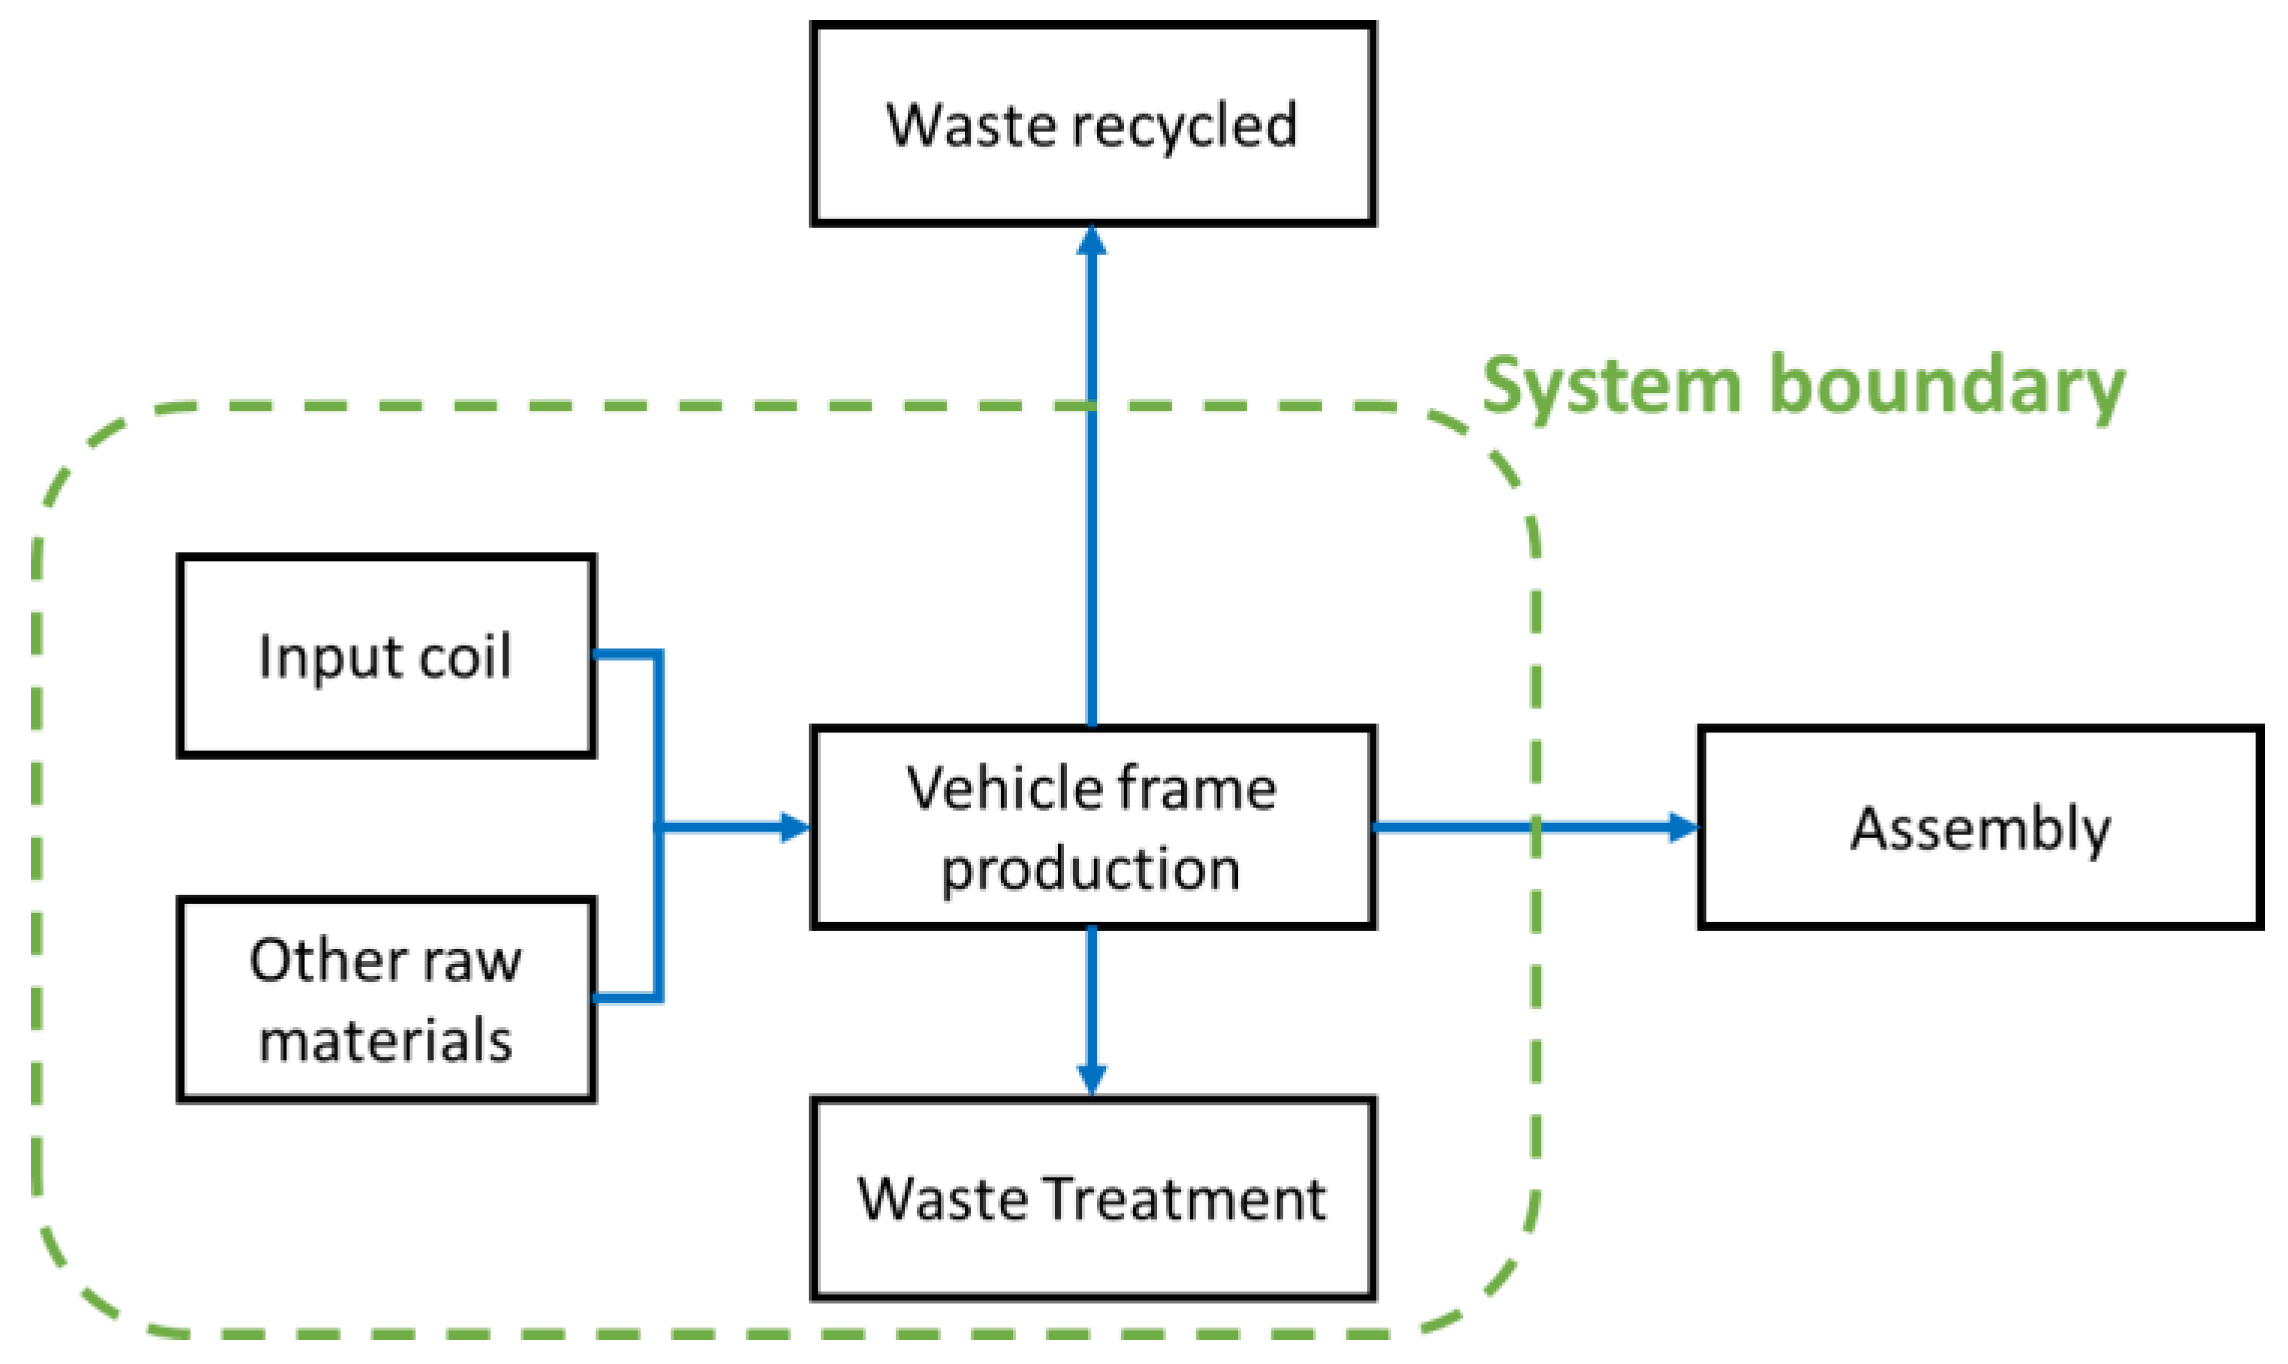
2.2.4. Life Cycle Assessment
3. Materials and Methods
4. Empirical Deployment of Tools
4.1. Green Performance Map
4.2. Environmental Value Stream Mapping
4.3. Waste Flow Mapping
4.4. Life Cycle Assessment
4.5. Comparison on Tool Deployment
5. Case Results and Discussion
5.1. Green Performance Map
- Energy consumption for compressed air, hydraulic systems, painting and heat treatment;
- Hazardous materials, including chemicals and lubricants;
- Processed water from heat treatment, including phosphating and blasting;
- Scrap generation and waste of productive material;
- Noise from punching machines.
5.2. Environmental Value Stream Mapping
5.3. Waste Flow Mapping
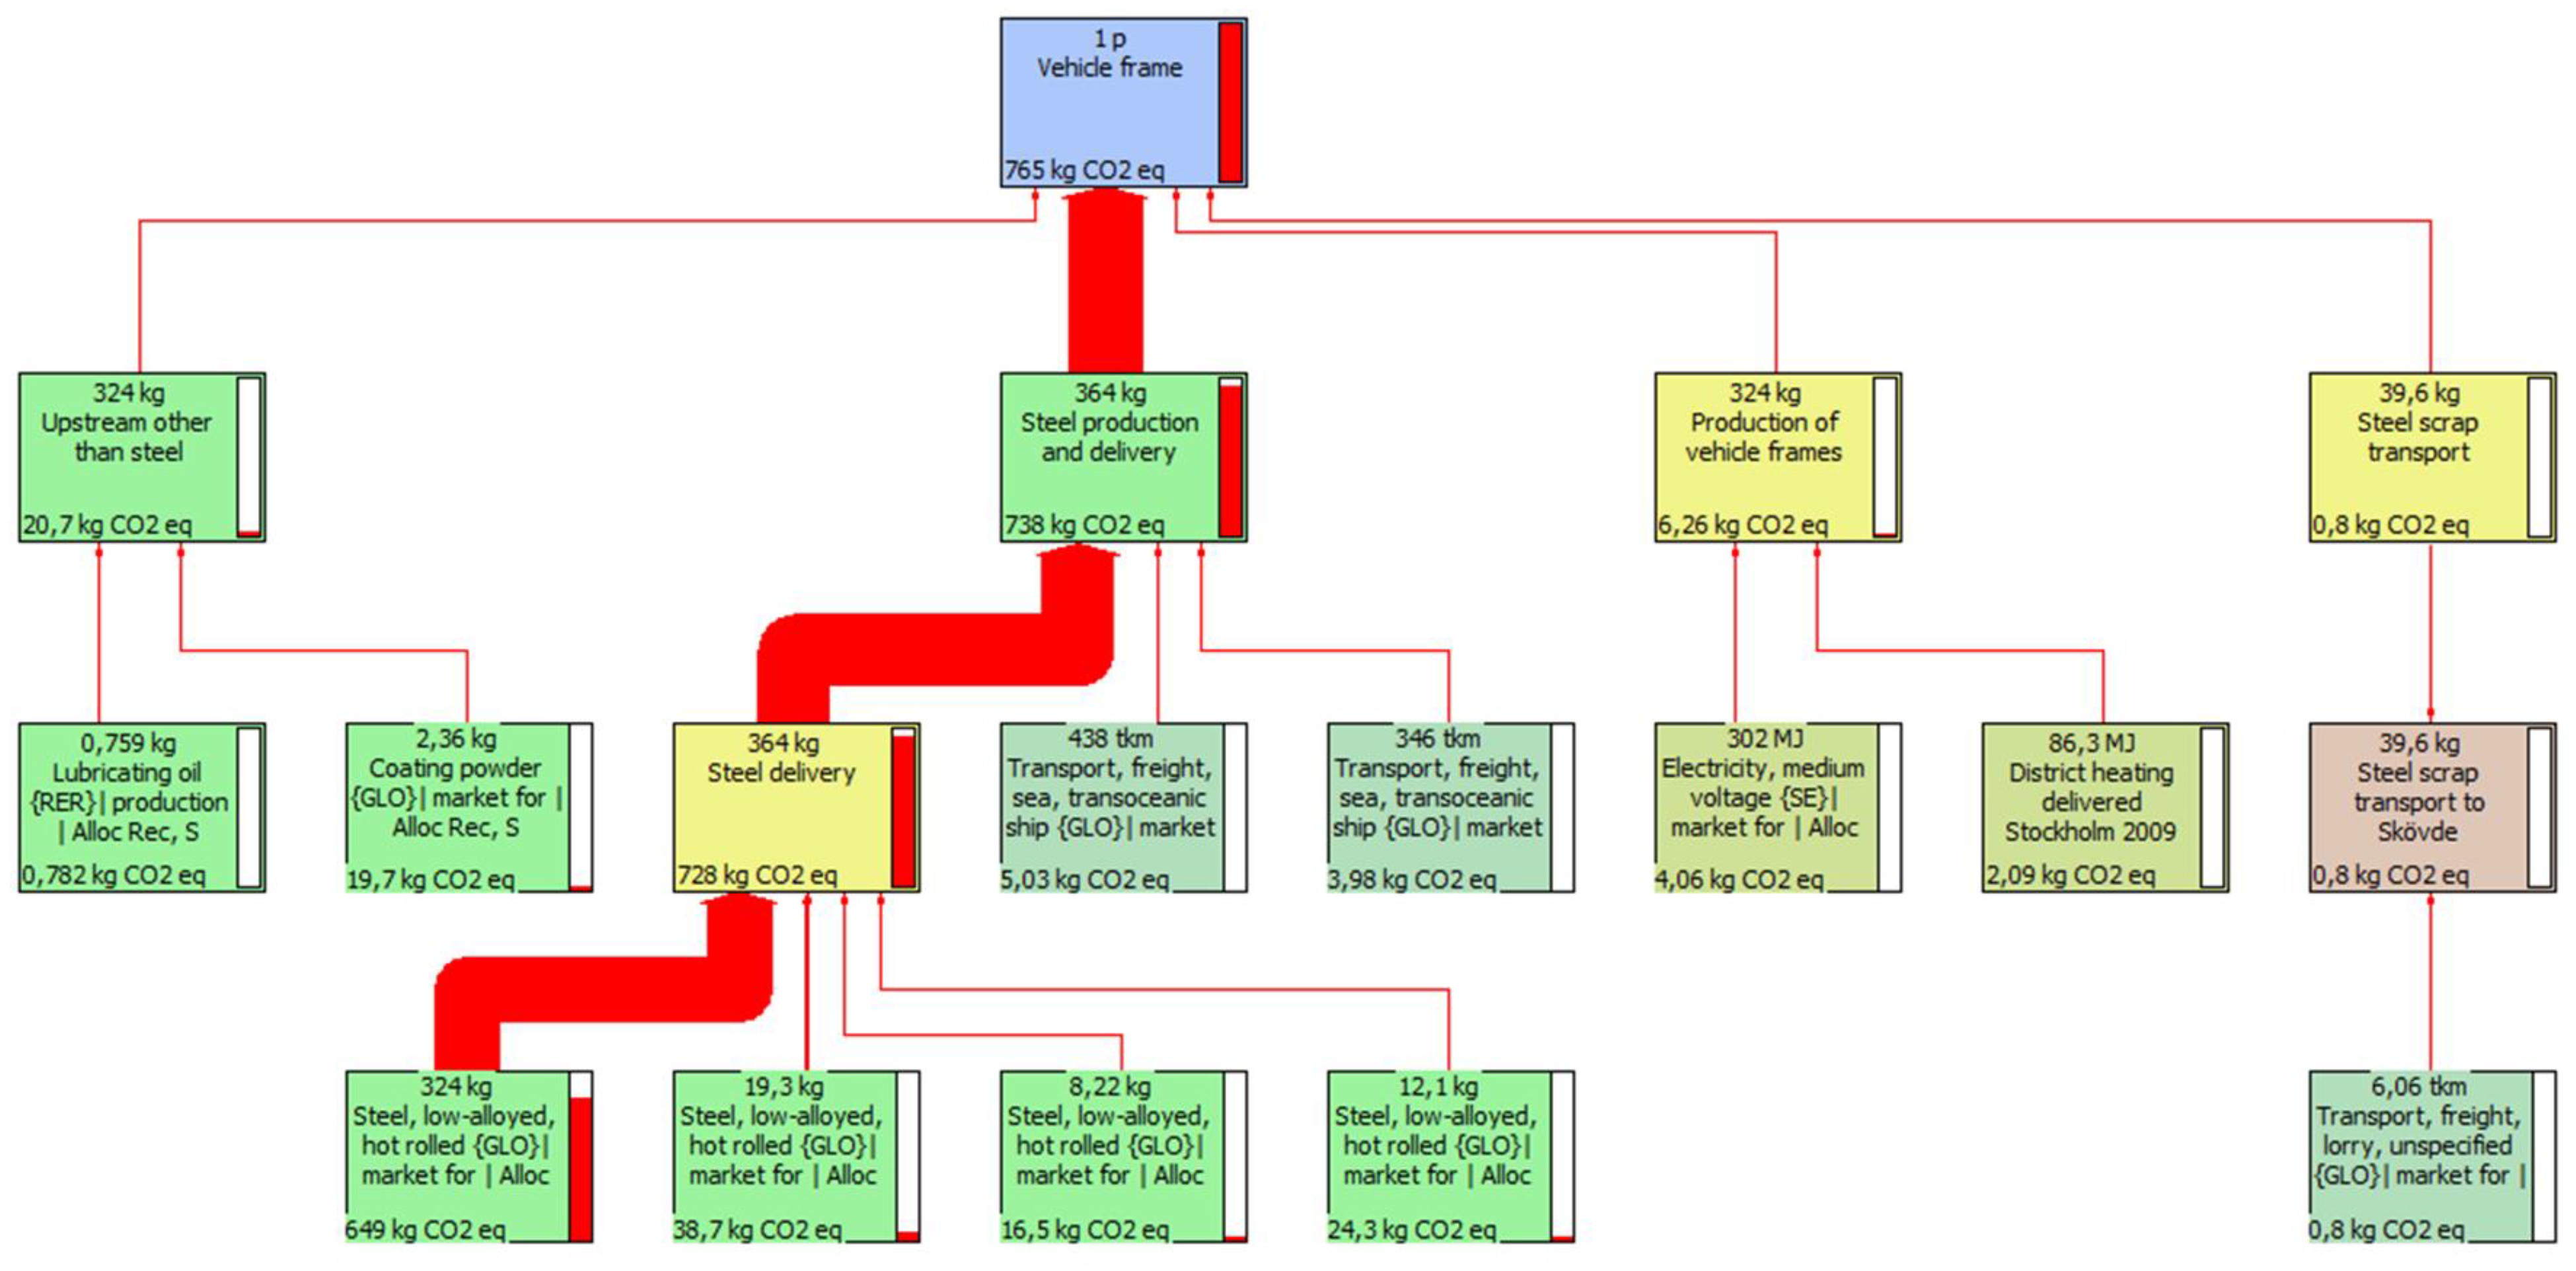
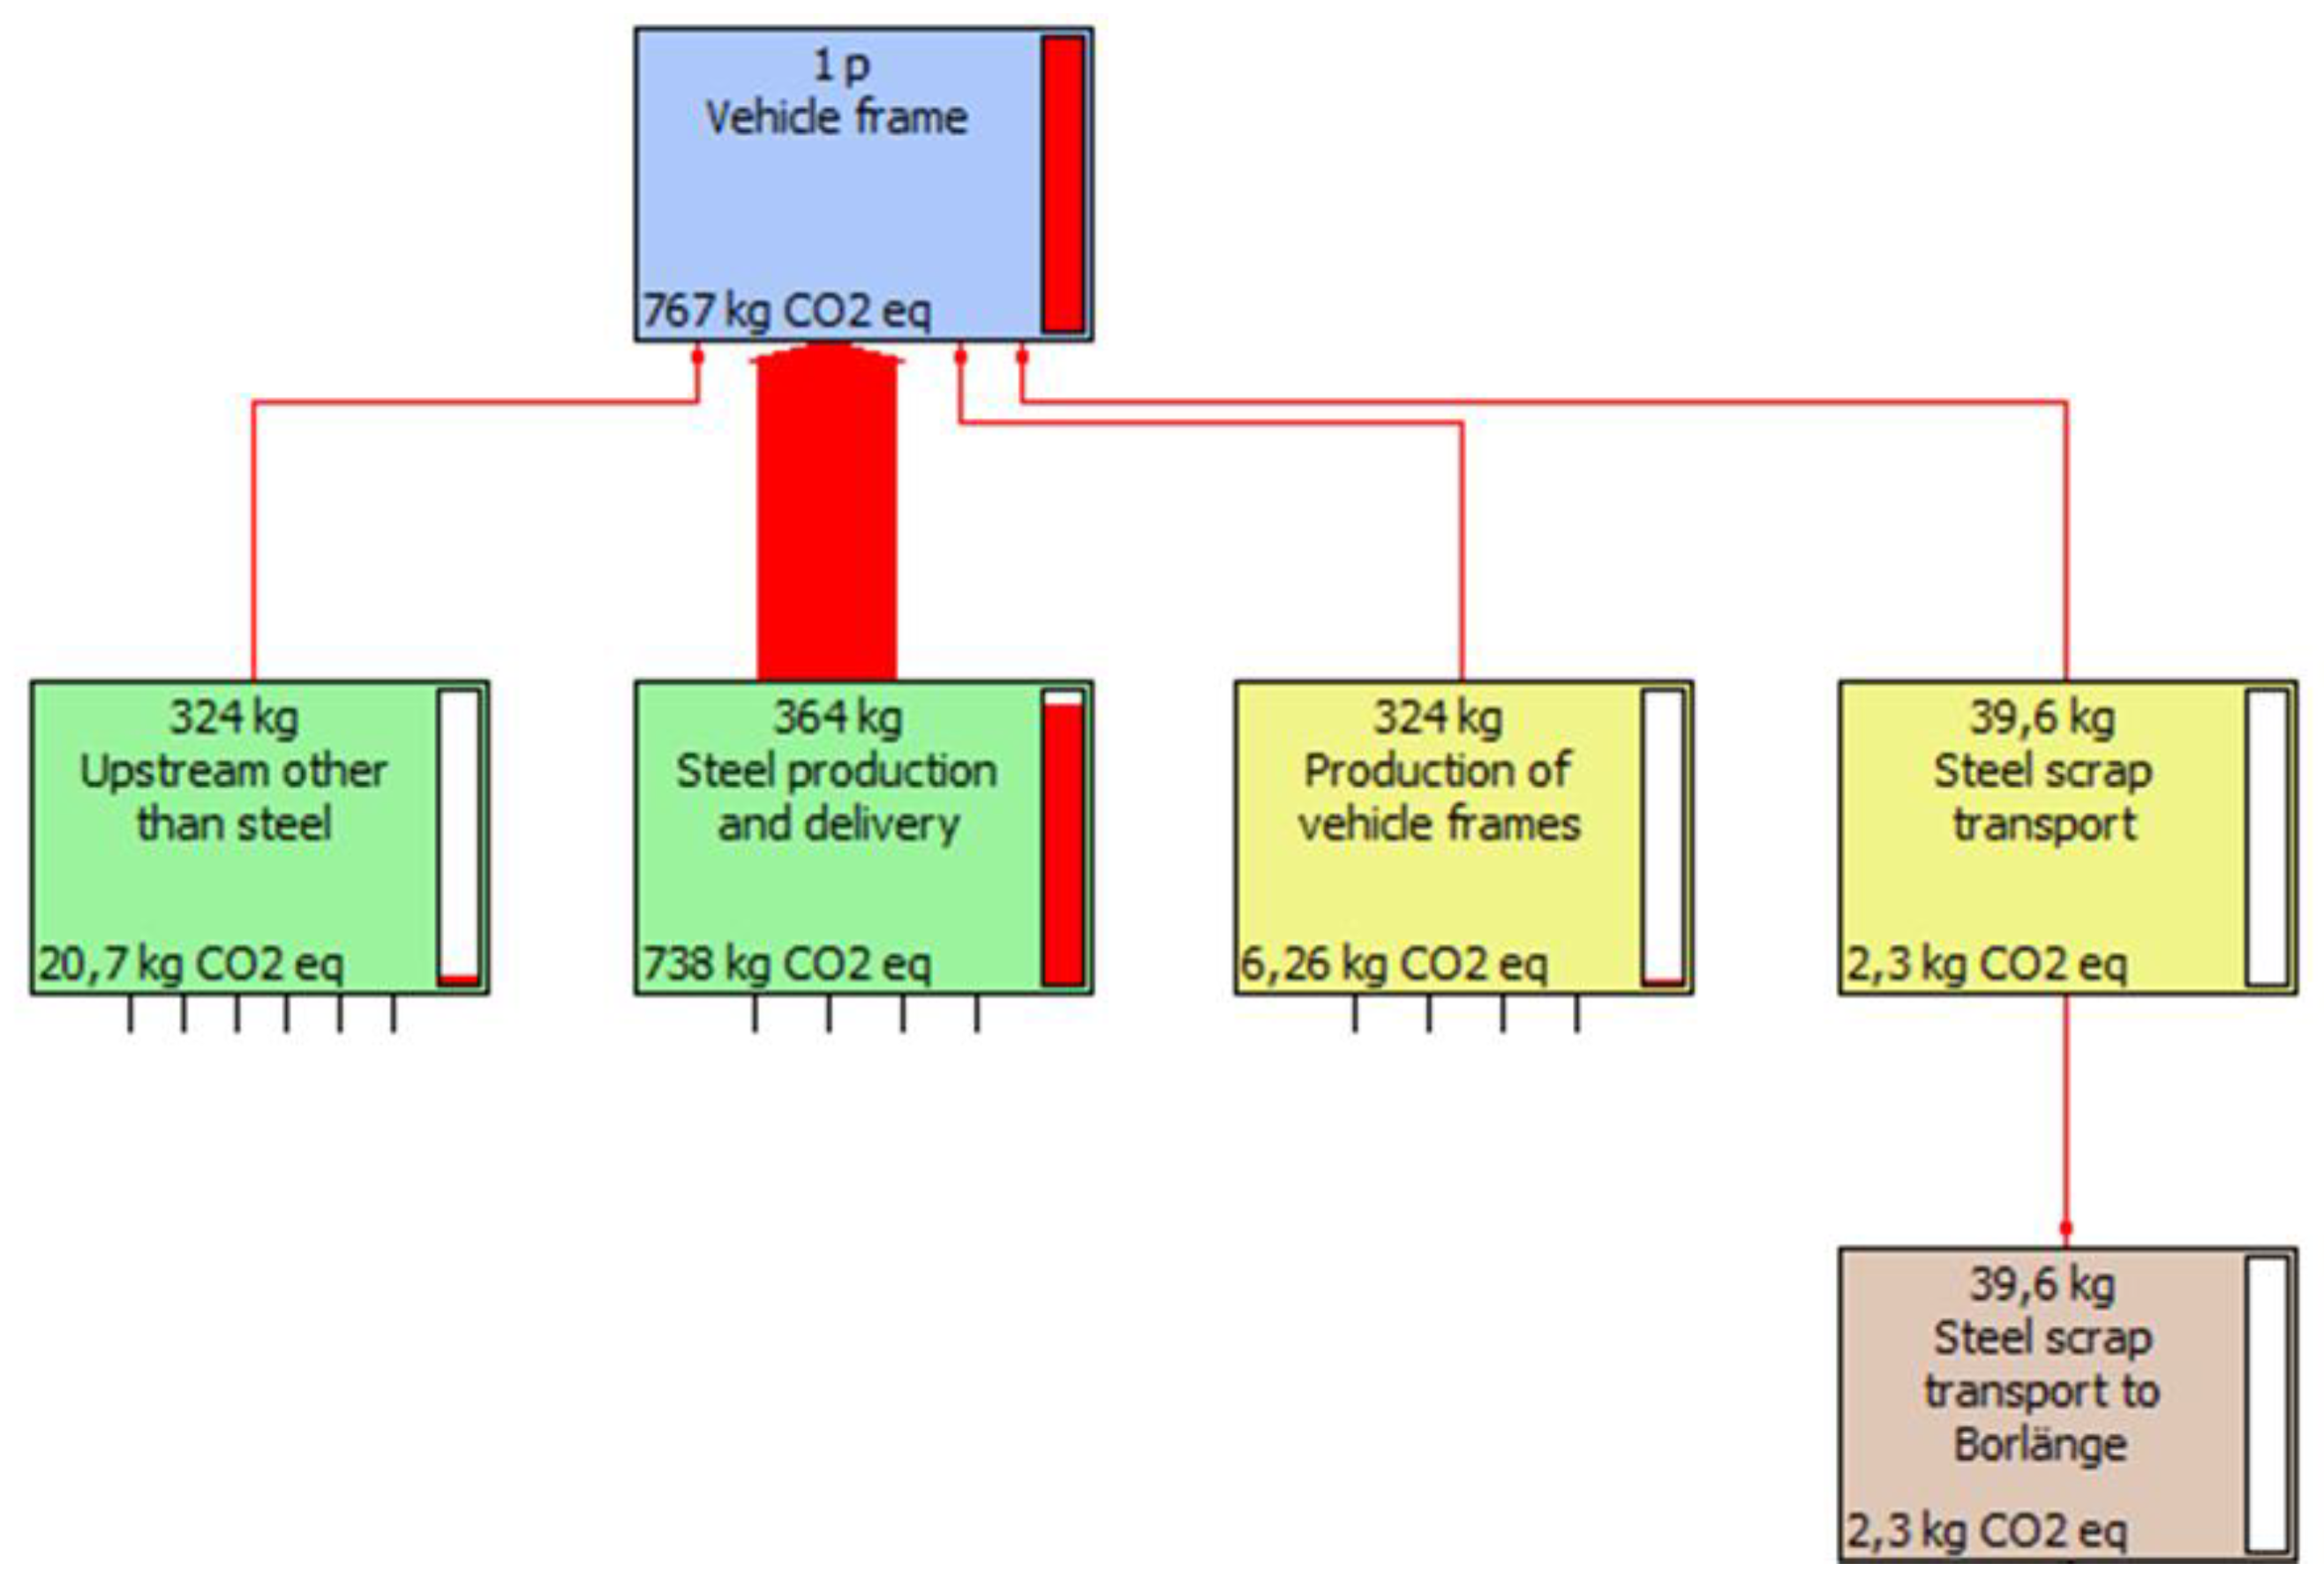
5.4. Life Cycle Assessment
5.5. Cross Comparison
6. Conclusions
- Being hands-on and operational, supporting collaboration and understanding between different internal and external actors;
- Being easy to learn and implement, visualization, time efficiency, continuous improvement and engagement;
- Including root cause analysis, being harmonized with ISO 14001 and supporting the go-to-gemba concept;
- Being goal-oriented, supporting measurements, and being focused on a limited area of influence while supporting systematic work procedures (standardized work)
Supplementary Materials
Author Contributions
Funding
Acknowledgments
Conflicts of Interest
References
- Garetti, M.; Taisch, M. Sustainable manufacturing: Trends and research challenges. Prod. Plan. Control 2011, 23, 83–104. [Google Scholar]
- Veleva, V.; Bailey, J.; Jurczyk, N. Using sustainable production indicators to measure progress in ISO 14001, EHS System and EPA achievement track. Corp. Environ. Strat. 2001, 8, 326–338. [Google Scholar]
- IISD, International Institute for Sustainable Development. Business Strategies for Sustainable Development; The International Institute for Sustainable Development in conjunction with Deloitte & Touche and the World Business Council for Sustainable Development: Winnipeg, MB, Canada, 1992. [Google Scholar]
- Smith, L.; Ball, P. Steps towards sustainable manufacturing through modelling material, energy and waste flows. Int. J. Prod. Econ. 2012, 140, 227–238. [Google Scholar] [Green Version]
- Bey, N.; Hauschild, M.Z.; Mcaloone, T.C. Drivers and barriers for implementation of environmental strategies in manufacturing companies. CIRP Ann. Manuf. Technol. 2013, 62, 43–46. [Google Scholar]
- Kurdve, M.; Zackrisson, M.; Wiktorsson, M.; Harlin, U. Lean and green integration into production system models – experiences from Swedish industry. J. Clean. Prod. 2014, 85, 180–190. [Google Scholar]
- Zokaei, K.; Lovins, H.; Wood, A.; HInes, P. Creating a Lean and Green Business System: Techniques for Improving Profits and Sustainability; CRC Press, Taylor and Francis Group: London, UK, 2013. [Google Scholar]
- Noren, G.; Strömdahl, I. Näringslivets miljöarbete och Sveriges miljömål; SvensktNäringsliv: Stockholm, Sweden, 2007. [Google Scholar]
- Shahbazi, S. Material Efficiency Management in Manufacturing. Licentiate Thesis, Mälardalen University, Västerås, Sweden, 2015. [Google Scholar]
- Cherrafi, A.; Elfezazi, S.; Govindan, K.; Garza-Reyes, J.A.; Benhida, K.; Mokhlis, A. A framework for the integration of Green and Lean Six Sigma for superior sustainability performance. Int. J. Prod. Res. 2017, 55, 4481–4515. [Google Scholar]
- Dües, C.M.; Tan, K.H.; Lim, M. Green as the new Lean: How to use Lean practices as a catalyst to greening your supply chain. J. Clean. Prod. 2013, 40, 93–100. [Google Scholar]
- Shahbazi, S.; Wiktorsson, M.; Kurdve, M.; Jönsson, C.; Bjelkemyr, M. Material efficiency in manufacturing: Swedish evidence on potential, barriers and strategies. J. Clean. Prod. 2016, 127, 438–450. [Google Scholar]
- Lindahl, M. Engineering Designers’ Requirements on Design for Environment Methods and Tools. Ph.D. Thesis, KTH, Stockholm, Sweden, 2005. [Google Scholar]
- Bergendahl, M.N. Stödmetoder och samverkan i produktutveckling (Supporting Methods and Collaboration in Product Development). Ph.D. Thesis, KTH Royal Institute of Technology, Stockholm, Sweden, 1992. [Google Scholar]
- Jönbrink, A.K.; Kristinsdottir, A.R.; Roos, S.; Sundgren, M.; Johansson, E.; Nyström, B.; Nayström, P. Why use ecodesign in the industry 2013? A Survey regarding barriers and opportunities related to ecodesign. In Proceedings of the EcoDesign 2013 International Symposium, Tokyo, Japan, 4–6 December 2013. [Google Scholar]
- Ellinger, A.E.; Daugherty, P.J.; Keller, S.B. The relationship between marketing/logistics interdepartmental integration and performance in US manufacturing firms: An empirical study. J. Bus. Logist. 2000, 21, 1–22. [Google Scholar]
- Iranmanesh, M.; Zailani, S.; Hyun, S.S.; Ali, M.H.; Kim, K. Impact of Lean Manufacturing Practices on Firms’ Sustainable Performance: Lean Culture as a Moderator. Sustainability 2019, 11, 1112. [Google Scholar]
- Wu, L.; Subramanian, N.; Abdulrahman, M.D.; Liu, C.; Lai, K.-H.; Pawar, K.S. The Impact of Integrated Practices of Lean, Green, and Social Management Systems on Firm Sustainability Performance—Evidence from Chinese Fashion Auto-Parts Suppliers. Sustainability 2015, 7, 3838–3858. [Google Scholar] [Green Version]
- Mollenkopf, D.; Stolze, H.; Wendy, H.T.; Ueltschy, M. Green, lean, and global supply chains. Int. J. Phys. Dist. Logist. Manag. 2010, 40, 14–41. [Google Scholar]
- Garza-Reyes, J.A. Lean and green—A systematic review of the state of the art literature. J. Clean. Prod. 2015, 102, 18–29. [Google Scholar]
- Kurdve, M.; Shahbazi, S.; Wendin, M.; Bengtsson, C.; Wiktorsson, M. Waste flow mapping to improve sustainability of waste management: A case study approach. J. Clean. Prod. 2015, 98, 304–315. [Google Scholar]
- Zackrisson, M.; Avellán, L.; Orlenius, J. Life cycle assessment of lithium-ion batteries for plug-in hybrid electric vehicles—Critical issues. J. Clean. Prod. 2014, 18, 1519–1529. [Google Scholar]
- Shahbazi, S.; Wiktorsson, M. Using the Green Performance Map: Towards material efficiency measurement. In Proceedings of the 23th EurOMA Conference, Trondheim, Norway, 17–22 June 2016. [Google Scholar]
- Kurdve, M.; Wiktorsson, M. Green Performance Map: Visualizing Environmental KPI’s; European Operations Management Association (EurOMA): Dublin, Ireland, 2013. [Google Scholar]
- Baumgartner, R.J. Managing Corporate Sustainability and CSR: A Conceptual Framework Combining Values, Strategies and Instruments Contributing to Sustainable Development. Corporate Soc. Responsib. Environ. Manag. 2014, 21, 258–271. [Google Scholar]
- Simpson, D.F.; Power, D.J. Use the supply relationship to develop lean and green suppliers. Supply Chain Manag. Int. J. 2005, 10, 60–68. [Google Scholar]
- Vachon, S.; Klassen, R.D. Environmental management and manufacturing performance: The role of collaboration in the supply chain. Int. J. Prod. Econ. 2008, 111, 299–315. [Google Scholar]
- Faulkner, W.; Badurdeen, F. Sustainable Value Stream Mapping (Sus-VSM): Methodology to visualize and assess manufacturing sustainability performance. J. Clean. Prod. 2014, 85, 8–18. [Google Scholar]
- Benn, S.; TEO, S.T.T.; Martin, A. Employee participation and engagement in working for the environment. Pers. Rev. 2015, 44, 492–510. [Google Scholar] [Green Version]
- Banawi, A.; Bilec, M.M. A framework to improve construction processes: Integrating Lean, Green and Six Sigma. Int. J. Constr. Manag. 2014, 14, 45–55. [Google Scholar]
- Souza, J.P.E.; Alves, J.M. Lean-integrated management system: A model for sustainability improvement. J. Clean. Prod. 2018, 172, 2667–2682. [Google Scholar]
- Puvanasvaran, P.; Tian, R.K.S.; Suresh, V.; Muhamad, M. Lean principles adoption in environmental management system (EMS)-ISO 14001. J. Ind. Eng. Manag. 2012, 5, 406–430. [Google Scholar]
- Seth, D.; Seth, N.; Dhariwal, P. Application of value stream mapping (VSM) for lean and cycle time reduction in complex production environments: A case study. Prod. Plan. Control 2017, 28, 398–419. [Google Scholar]
- Ruben, B.; Viondh, S.; Asokan, P. State of art perspectives of lean and sustainable manufacturing. Int. J. Lean Six Sigma 2018, 10, 234–256. [Google Scholar]
- Mĺkva, M.; Prajová, V.; Yakimovich, B.; Korshunov, A.; Tyurin, I. Standardization—One of the Tools of Continuous Improvement. Procedia Eng. 2016, 149, 329–332. [Google Scholar]
- Bellgran, M.; Höckerdal, K.; Kurdve, M.; Wiktorsson, M. Green Performance Map—Handbook; Mälardalen University: Eskilstuna, Sweden, 2012. [Google Scholar]
- Kurdve, M.; Hanarp, P.; Chen, X.; Qiu, X.; Zhang, Y.; Stahre, J.; Laring, J. Use of Environmental Value Stream Mapping and Environmental Loss Analysis in Lean Manufacturing Work at Volvo; Swedish Production Symposium, SPS11; Swedish Production Symposium: Lund, Sweden, 2011. [Google Scholar]
- Pampanelli, A.B.; Found, P.; Bernardes, A.M. A Lean & Green Model for a production cell. J. Clean. Prod. 2014, 85, 19–30. [Google Scholar]
- Sawhney, R.; Teparakul, P.; Bagchi, A.; Li, X. En-Lean: A framework to align lean and green manufacturing in the metal cutting supply chain. Int. J. Enterprise Netw. Manag. 2007, 1, 238–260. [Google Scholar]
- EPA. Lean and Clean Value Stream Mapping. 2015. Available online: www.epa.gov/e3 (accessed on 15 December 2018).
- Torres, A.S.; Gati, A.M. Environmental Value Stream Mapping (EVSM) as sustainability management tool. In Proceedings of the Portland International Conference on Management of Engineering Technology, PICMET 2009, Portland, OR, USA, 2–6 August 2009; pp. 1689–1698. [Google Scholar]
- Müller, E.; Schillig, R.; Stock, T.; Schmeiler, M. Improvement of Injection Moulding Processes by Using Dual Energy Signatures. Procedia CIRP 2014, 17, 704–709. [Google Scholar] [Green Version]
- Posselt, G.; Fischer, J.; Heinemann, T.; Thiede, S.; Alvandi, S.; Weinert, N.; Kara, S.; Herrmann, C. Extending Energy Value Stream Models by the TBS Dimension—Applied on a Multi Product Process Chain in the Railway Industry. Procedia CIRP 2014, 15, 80–85. [Google Scholar]
- Gunduz, M.; Fahmi Naser, A. Cost Based Value Stream Mapping as a Sustainable Construction Tool for Underground Pipeline Construction Projects. Sustainability 2017, 9, 2184. [Google Scholar] [Green Version]
- Dadashzadeh, M.D.; Wharton, T.J. A value stream approach for greening the IT department. Int. J. Manag. Inf. Syst. 2012, 16, 12. [Google Scholar] [CrossRef]
- Engel, H.W. Ecomapping—A Visual, Simple and Practical Tool to Analyse and Manage the Environmental Performance of Small Companies and Craft Industries; EcoMapping Network: Brussels, Belgium, 2002. [Google Scholar]
- Hogland, W.; Stenis, J. Assessment and system analysis of industrial waste management. Waste Manag. 2000, 20, 537–543. [Google Scholar] [Green Version]
- Muther, R.; Haganas, K. Systematic Handling Analysis; Management and Industrial Research Publications: Kansas City, MO, USA, 2002. [Google Scholar]
- Cheung, W.M.; Leong, J.T.; Vichare, P. Incorporating lean thinking and life cycle assessment to reduce environmental impacts of plastic injection moulded products. J. Clean. Prod. 2017, 167, 759–775. [Google Scholar] [Green Version]
- Zhang, H.; Haapala, K.R. Integrating sustainable manufacturing assessment into decision making for a production work cell. J. Clean. Prod. 2015, 105, 52–63. [Google Scholar]
- Thammaraksa, C.; Wattanawan, A.; Prapaspongsa, T. Corporate environmental assessment of a large jewelry company: From a life cycle assessment to green industry. J. Clean. Prod. 2017, 164, 485–494. [Google Scholar]
- Yin, R.K. Case Study Research: Design and Methods, 5th ed.; SAGE Publications, Inc.: London, UK, 2010. [Google Scholar]
- Saunders, M.; Lewis, P.; Thornhill, A. Research Methods for Business Students; Financial Times Prentice Hall: Upper Saddle River, NJ, USA, 2009. [Google Scholar]
- ISO 14044. Environmental Management—Life Cycle Assessment—Requirements and Guidelines; International Organization for Standardization: Geneva, Switzerland, 2006.
- EPD®, General programme instructions for the international epd® system. Version 3.0. 2017-12-11. Stockholm, Sweden, 2017.


| Tools Applied | Common Level of Use * | Tools with Some Level of Similarity |
|---|---|---|
| LCA | Product level | Chemical Risk Assessment, Eco-strategy Wheel, Energy Mapping |
| WFM | Line/site level | Material Flow Analysis, Logistic Handling, Material Handling Analysis, Material Energy Waste Map |
| GPM | Cell level | Material Flow Cost Accounting, System Boundary Map and Green Impact Matrix |
| EVSM | Line level | Green Big Picture |
| Tools | GPM | EVSM | WFM | LCA |
|---|---|---|---|---|
| Result type | ● Overview of material and energy flows at process and sub-process level ● Qualitative results in the form of environmental aspects for each sub-process | ● Focus on the amount, location and type of scrap ● Overview of the operation ● Information flow regarding production ● Supplier and customer information | ● Total amount of waste ● Cost of waste bins, handling and transport ● Sorting degree of different material fractions ● Categorization, quantification and localization of scrap | ● Quantitative results at the site level in the form of calculated environmental impacts, e.g., climate impacts ● Overview of material and energy flows at the site level ● Transportation and end-of-life information |
| Operation level (site, process, cell) | Overall process and sub-process/cell | Entire process from coil to finished frame | Entire process from coil to finished frame | Entire process from coil to finished frame (cradle-to-gate model from site/process and database data) |
| Environmental aspects included | All flows (mainly those seen on the shop floor) | Specific selected material flows, (in this case metal scrap) | All types of materials and waste, but in this case with a focus on metals | All types of resources, usually with focus on significant environmental impacts |
| Time required for data collection and analysis (this study) | 2–4 h for an expert 30 man-hours of operators’ time | 2–4 h for an expert 20 man-hours of operators/technician’s time | 2 days for an expert 35 man-hours of technician’s time | 5 days for an expert, excluding most data collection 10 man-hours of technician time, in addition to the use of data from other tools |
| End-of-life scenario | Partially included | Not included | Included | Included |
| Software demand (price) | No software | No software needed but e.g., Visio recommended for drawings | No software; Microsoft Excel needed for calculations | LCA software (SimaPro/Gabi/Open LCA) and databases |
| Visualization type | ● provide quick understanding of processes and correlated environmental aspects ● One-page input and output for material and energy flow | ● Process flow and one environmental parameter | ● Ecomap shows waste generation points ● Waste-sorting analysis via pie chart ● Waste-handling logistics via spaghetti diagram | ● System boundary figure showing process flow ● Eco-profile ● Environmental impacts at midpoint or endpoint level in absolute or relative terms ● Software-dependent graphs |
| Guidance documents | Handbook available | Reports by the US-EPA | Handbook available | ISO 14044, ILCD Handbook |
| Ease of learning (knowledge requirements and days) | Easy to learn and implement. Needs ● Workshop leader ● Lean experience ● One-day introduction | Easy to use. Needs ● Workshop leader ● One-week training | Slightly difficult due to variety of tools. Needs ● Environmental manager or similar function ● One to two days | Difficult. Needs ● Expert ● Several days |
| Supporting Go-to-gemba | Takes place at shop floor via walkthroughs | Requires shop floor visit | Requires shop floor visit | Data normally not found at shop floor, but a factory visit is recommended to understand and complement data |
| Employee engagement | Increased engagement in improvement actions on the shop floor | Increased engagement in improvement actions on the shop floor | Increased engagement in improvement actions on the shop floor |
| 2015 | 2016 | |||
|---|---|---|---|---|
| % of Total Scrap | % of Total Material Consumption in Vehicle Frame Production | % of Total Scrap | % of Total Material Consumption in Vehicle Frame Production | |
| Design scrap | 59% | 4.5% | 64% | 5.4% |
| Set-up scrap | 1% | 0.1% | 1% | 0.1% |
| Quality scrap | 40% | 3.1% | 35% | 3% |
| Total | 7.73% | 8.5% | ||
| Focus of the Case Study | GPM | EVSM | WFM | LCA |
|---|---|---|---|---|
| Which sub-process has the most environmental impact? | GPM pinpointed several environmental aspects e.g., scrap generation in metal sheet bending, plasma cutting and k-zone; high energy consumption at hydraulic systems and a pneumatic truck in metal sheet bending; high energy consumption at heat treatment; hazardous ash from blasting and plasma cutting; water waste and chemicals generated from phosphating; and other sustainability issues such as safety risks in surface treatment and high noises from punching machines. However, it was challenging to quantify the environmental aspects and correlating impact. | EVSM concluded that the punching machines produces the greatest number of quality scraps and was thus the most important environmental aspect. However, due to complexity, EVSM did not consider environmental aspects such as noise and water and energy consumption. | According to the WFM, the most scraps are generated from punching machines, plasma cutting, surface treatment, and metal sheet forming. However, quality scraps from the punching machines had the greatest environmental impact. In addition to scrap generation, environmental aspects such as waste segregation, transportation and hazardousness were considered. For instance, 38% of process fluids waste from surface treatment are sent to destruction, which indicates that this process has large environmental impacts and costs. | According to the LCA, from a product life cycle perspective, it was found that steel coil production has by far the greatest environmental impacts (climate impact, eutrophication, acidification and smog). Therefore, scrap generation during production is of large importance. Furthermore, quality and design scraps have greater environmental impacts than energy use in the plant. |
| How much scrap is generated in the vehicle frame production process and in the respective sub-processes and why? | Metal sheet bending, plasma cutting and k-zone produced the most scrap. However, it was challenging to collect quantitative data and determine environmental impacts, and therefore GPM did not correctly prioritize punching machines. GPM also failed to localize the root cause scrap generation points. | The most scraps are generated from punching machine plasma cutting, surface treatment, and metal sheet forming. EVSM localized and quantified scrap generation throughout the process and identified the reason for the scrap generation at sub-process level. | WFM identified that quality scrap from the punching machine has the greatest environmental aspect. The proportion of scrap generation compared to production was also calculated. | Data on all major waste flows were quantified with LCA; first for the whole process output and then based on their relative impact, improvement potentials are sought. It is not unusual to identify hitherto unknown flows during LCA since mass balances are often used to check inputs with outputs. |
| What improvements can be made to move towards circularity, decreasing scrap generation and environmental impact? | GPM identified various environmental aspects and pinpointed their origin in the process but not specifically suggest any improvement. | Quality scrap should be improved with a better inspection and logging system. | Waste segregation potentials should be improved. | The comprehensive LCA could find and prioritize the greatest environmental aspects based on their relative environmental impact. The improvement potential for improved metal recycling could also be quantified but a detailed inventory of the process and sub-processes is needed to point out specific process steps to be modified for better material efficiency. |
© 2019 by the authors. Licensee MDPI, Basel, Switzerland. This article is an open access article distributed under the terms and conditions of the Creative Commons Attribution (CC BY) license (http://creativecommons.org/licenses/by/4.0/).
Share and Cite
Shahbazi, S.; Kurdve, M.; Zackrisson, M.; Jönsson, C.; Kristinsdottir, A.R. Comparison of Four Environmental Assessment Tools in Swedish Manufacturing: A Case Study. Sustainability 2019, 11, 2173. https://0-doi-org.brum.beds.ac.uk/10.3390/su11072173
Shahbazi S, Kurdve M, Zackrisson M, Jönsson C, Kristinsdottir AR. Comparison of Four Environmental Assessment Tools in Swedish Manufacturing: A Case Study. Sustainability. 2019; 11(7):2173. https://0-doi-org.brum.beds.ac.uk/10.3390/su11072173
Chicago/Turabian StyleShahbazi, Sasha, Martin Kurdve, Mats Zackrisson, Christina Jönsson, and Anna Runa Kristinsdottir. 2019. "Comparison of Four Environmental Assessment Tools in Swedish Manufacturing: A Case Study" Sustainability 11, no. 7: 2173. https://0-doi-org.brum.beds.ac.uk/10.3390/su11072173