Changes in Vegetation Greenness in the Upper and Middle Reaches of the Yellow River Basin over 2000–2015


1
Key Laboratory of Ecosystem Network Observation and Modeling, Institute of Geographic Sciences and Natural Resources Research, Chinese Academy of Sciences (CAS), 11A, Datun Road, Chaoyang District, Beijing 100101, China
2
College of Resources and Environment, University of Chinese Academy of Sciences, No. 19A, Yuquan Road, Shijingshan District, Beijing 100049, China
*
Author to whom correspondence should be addressed.
Sustainability 2019, 11(7), 2176; https://0-doi-org.brum.beds.ac.uk/10.3390/su11072176
Submission received: 6 March 2019
/
Revised: 1 April 2019
/
Accepted: 9 April 2019
/
Published: 11 April 2019
(This article belongs to the Section Sustainable Engineering and Science)
Abstract
:The Grain to Green Project (GTGP), a large ecological restoration project aiming to control soil erosion and improve the ecological environment, has been implemented since 1999 and has led to great land use changes with decreased farmland and increased forest and grass, and significant vegetation variations. Understanding vegetation variations for different land use types is important for accessing the present vegetation development and providing scientific guidance for future ecological restoration design and regional sustainable development. With two land use maps and MODIS LAI data, trend analysis, fluctuation analysis, and R/S methods were applied to analyze the vegetation dynamic changes and sustainability for converted land use types from cropland and unconverted types over 2000–2015 in the upper and middle reaches of the Yellow River. The results obtained were as follows: (1) Vegetation greening was remarkable in the entire study region (0.036 yr−1). The increasing rate was higher in wetter conditions with AI < 3 (0.036–0.053 yr−1) than arid regions with AI > 3 (0.012–0.024 yr−1). (2) Vegetation improved faster for converted forestland, shrubland, and grassland than unconverted types under similar drying conditions. Converted shrubland and grassland had a larger relative change than converted forestland. (3) Converted land use types generally exhibited stronger fluctuation than unconverted types with small differences among types. (4) Vegetation exhibited a sustainable increasing trend in the future, which accounted for more than 73.1% of the region, mainly distributed in the middle reach of the Yellow River. Vegetation restoration exerted important influences on vegetation greening and the effect was stronger for converted types than unconverted types.
1. Introduction
Vegetation, one of the key components in terrestrial ecosystems and a critical factor in the soil–vegetation–atmosphere system, has significant influences on regional water and energy cycling [1]. Vegetation plays important roles in soil and water conservation, preventing desertification, and maintaining ecosystem stability [2]. Revegetation is an important method for controlling soil erosion and improving regional ecological environment [3]. The upper and middle reaches of the Yellow River Basin, located in northwest China, are well known for their erodible deep loess, severe soil and water loss, and fragile eco-environment [4]. During the past decades, under the pressure of the rapid development of the economy and population, irrational human activities (e.g., deforestation and farmland expansion) have led to severe eco-environmental problems such as land degradation, natural vegetation deterioration, and soil erosion, which have seriously constrained local sustainable development [5]. To address such problems, the Chinese government have implemented a series of ecological restoration projects since the 1980s including the Three–north Shelterbelt program, the Grain to Green Project (GTGP), and the Natural Forest Conservation Program (NFCP) [6]. In this context, the investigation of the regional spatiotemporal dynamics of vegetation has achieved wide attention [7,8].
Remote sensing provides a rapid and effective way for long-term and large-scale vegetation monitoring. Long time serial remote sensing images are used to reveal vegetation dynamics, detect and forecast variation trends of vegetation [9,10]. In the upper and middle reaches of the Yellow River, remote sensing data (e.g., MODIS NDVI/LAI, AVHRR NDVI, SPOT NDVI, etc.) have been widely used by researchers to investigate the vegetation coverage changes and associated influencing factors (e.g., metrological factors and ecological restoration programs) at multiple temporal (e.g., inter-annual and seasonal scales) and spatial scales (e.g., regional and watershed scales) [11,12,13,14,15]. It has been reported that vegetation activities have enhanced since the 1980s and experienced a stronger improvement, especially after 1999 [7]. Human activities such as the implementation of GTGP is one of the main driving forces of vegetation greening [16,17].
Large-scale ecological rehabilitation has improved the regional vegetation coverage to some extent. In 2008, the tree plantation area in China was ~62 million hectares, ranking first and accounting for ~23% of the total planting area in the world [18]. The GTGP, one of the world’s largest vegetation restoration programs, has been carried out by the Chinese government for approximately two decades up to now. One of its main objects was to return slope cropland (≥25°) by sowing grass seeds and afforestation [19]. From 2002 to 2014, the area of afforestation on former cropland is hectares in China, Li et al. [20] indicated that after the implementation of GTGP, the land use in the middle reaches of the Yellow River showed a one- way change from farmland to forest and grass. Vegetation coverage increased from 31.6% in 1999 to 59.6% in 2013 in the Loess Plateau [21]. However, many studies have recently pointed out some contradicting evidence of the negative effects of large-scale vegetation restoration. Up to 2005, the overall survival rate of newly planted tress was only 24% [22]. Artificially planted trees could grow to only ~ 20% of their normal height in some 30-year plantations (“small but old tree”) [23]. The Chinese government plans to extend the effort of the GTGP by investing another US$9.5 billion in GTGP on the Loess Plateau by 2050 [24] and returning ~2.83 million hectares of cropland to forest and grassland across China by 2020 [21]. Therefore, the assessment of the spatiotemporal dynamics of land use types converted from cropland and with no conversion, is of great importance for the reasonable design of future vegetation restoration programs. However, former studies have generally analyzed the variation differences among vegetation types based on a vegetation map or single land use map [25,26] and studied one special vegetation type based on land use maps in different periods [12]. There still needs to be a comprehensive analysis of vegetation variation differences among various land use patterns (i.e., converted from cropland and unconverted) based on multistage land use maps.
In addition, the growth and development of dryland vegetation are closely associated with regional hydrothermal conditions [27,28]. The annual precipitation in the upper and middle reaches of the Yellow River changes from 800 mm in the southeast semi-humid region to lower than 200 mm in the northwest arid region, resulting in a clear decreasing gradient of vegetation water availability [29]. The sensitivities of the ecosystem responding to human activities and climate changes are increasing with increased dryness in different precipitation gradient zones [30]. Therefore, we regarded dryness as an important factor in studying vegetation dynamics in this study.
The aims of this study were to (1) examine the vegetation dynamics of different land use patterns under different hydrothermal conditions in the upper and middle reaches of the Yellow River Basin over 2000–2015; and (2) to assess the sustainability of vegetation changing in the future. These results are expected to improve the understanding of present vegetation development and provide helpful information for future ecological restoration design and regional sustainable development.
2. Materials and Methods
2.1. Study Area
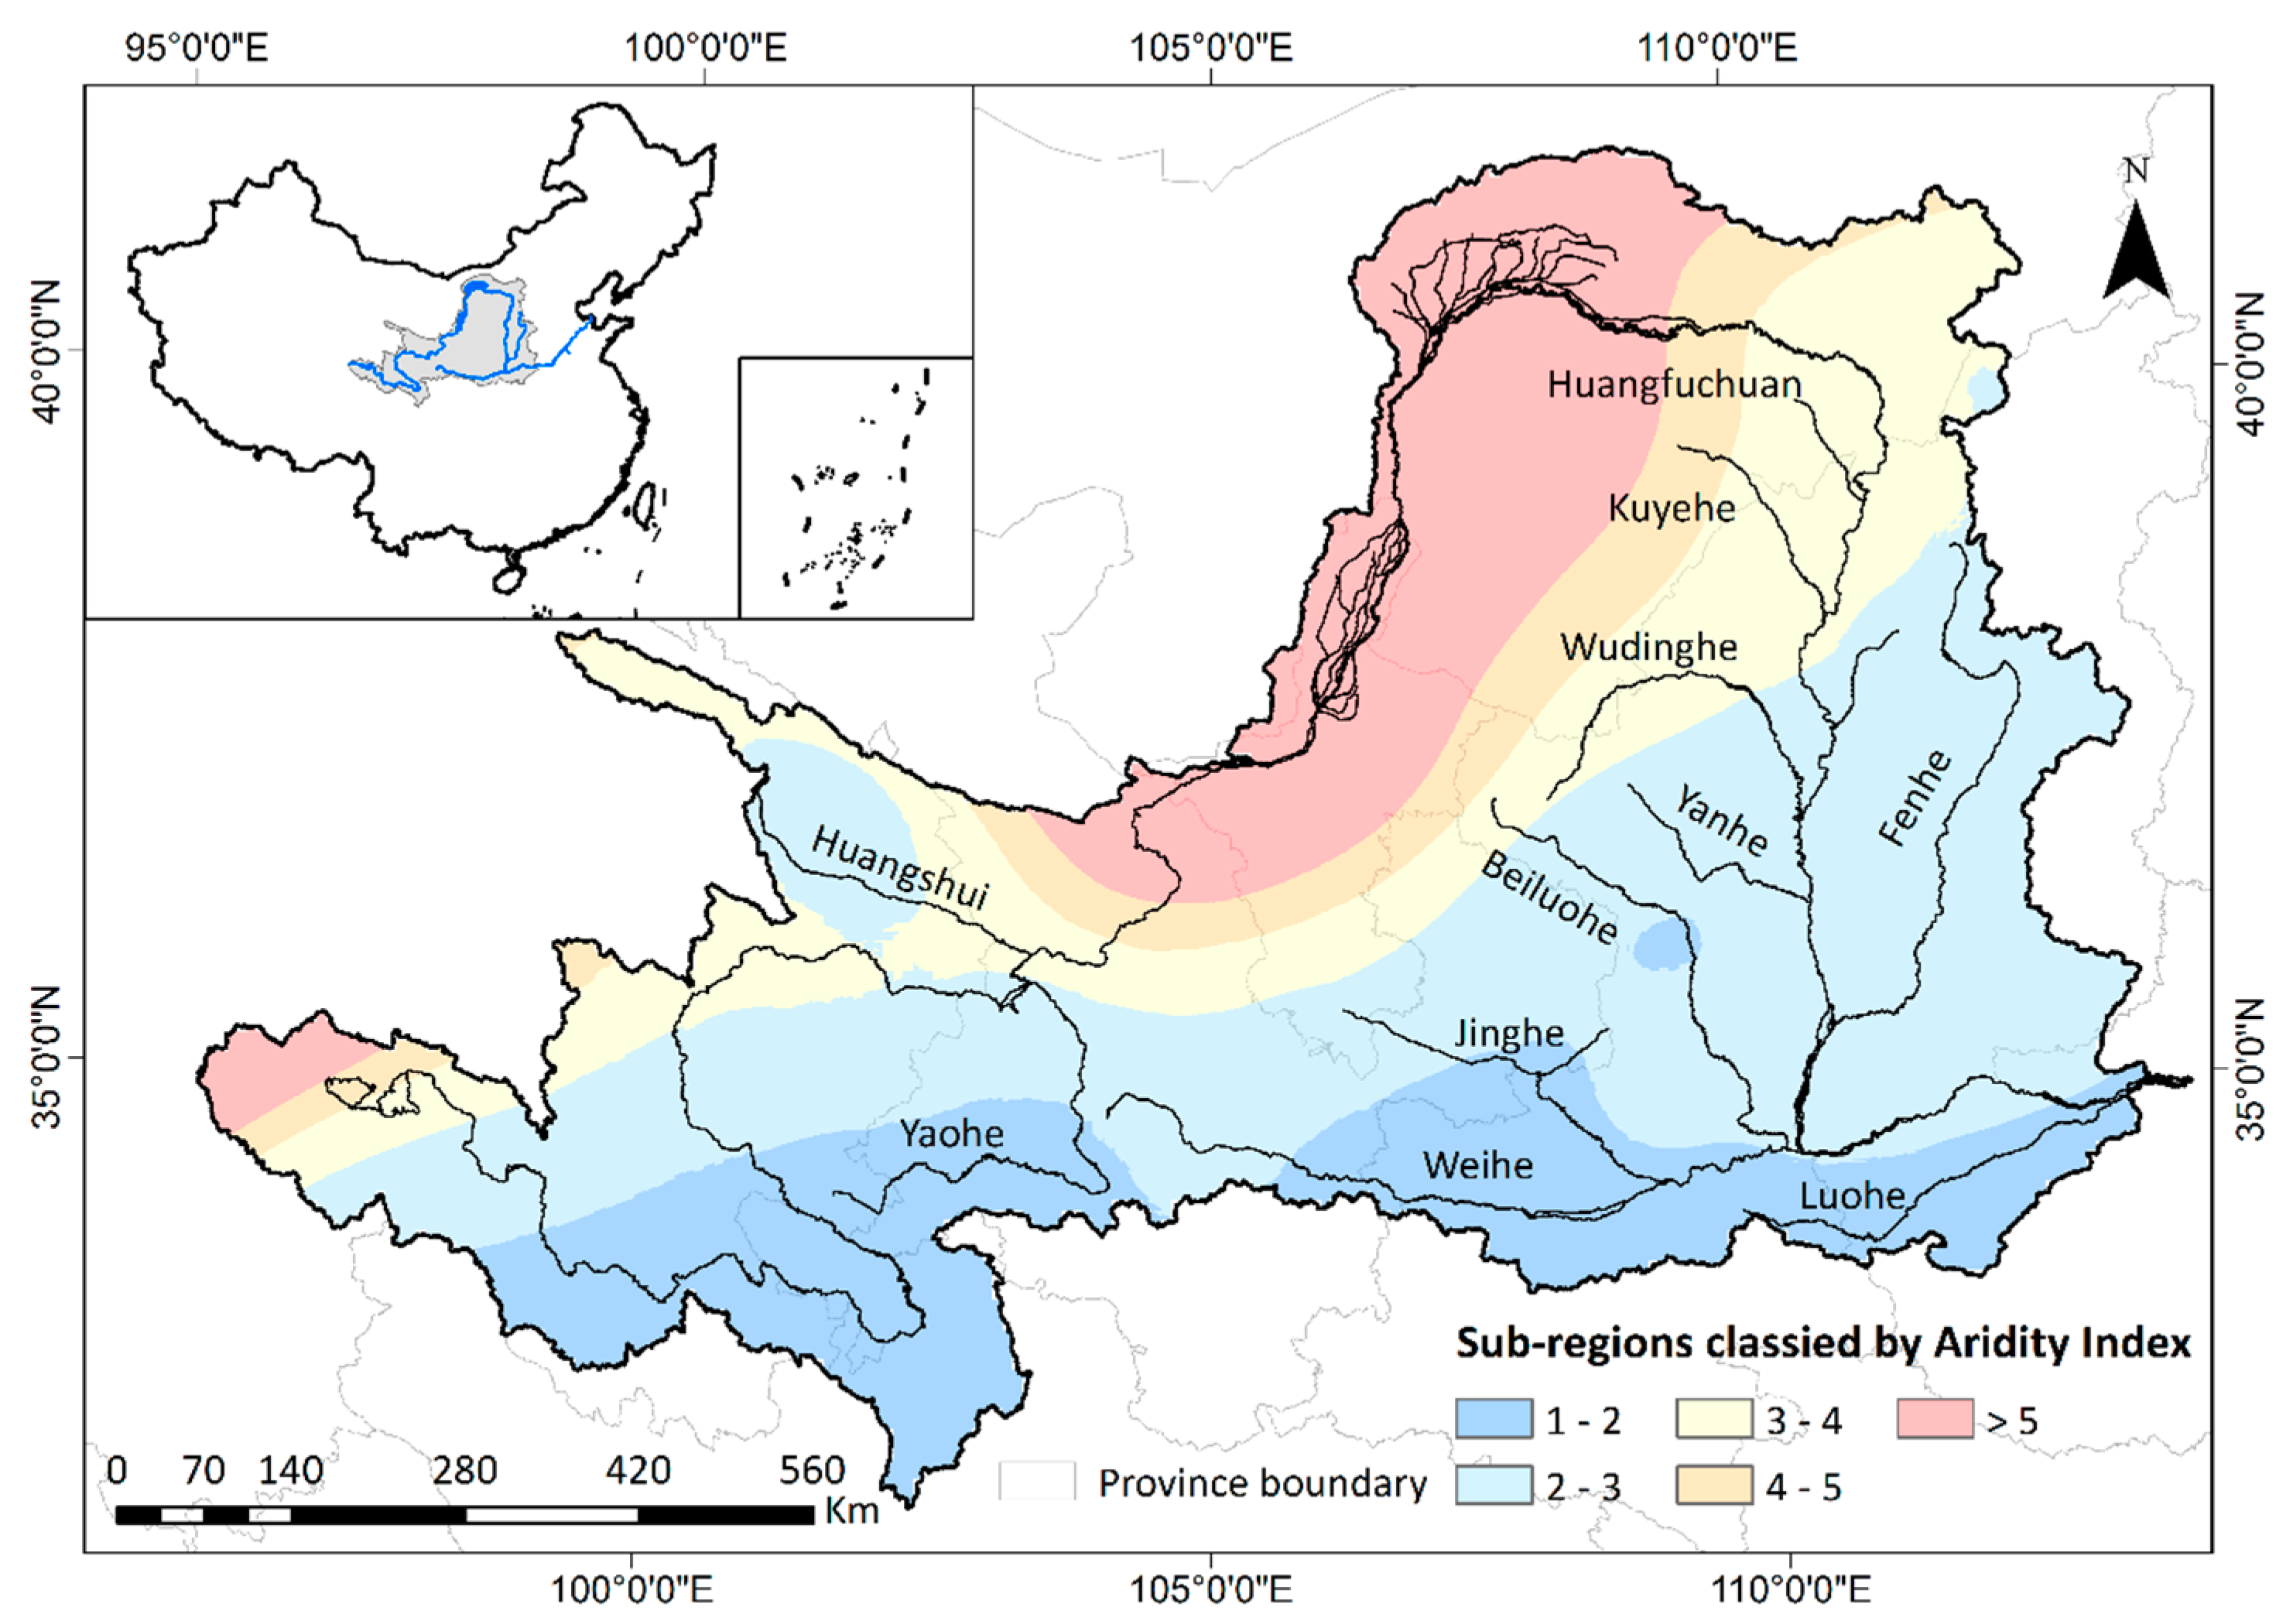
The Yellow River, the second longest river in China, originates from the eastern Qinghai–Tibet plateau, and flows through the northwestern Loess Plateau and Ordos Plateau before debouching in Bohai [31]. The total area of the Yellow River basin is , 91% of which () are the upper and middle reaches (Figure 1). The region is dominated by a continental monsoon climate with dry but cold winters and warm but humid summers [32]. The study region crosses semi-humid, semi-arid, and arid areas from the southeast to northwest with aridity ranging from 1.1 to 15 [32]. The mean annual precipitation shows strong spatial difference with more than 800 mm in the semi-humid region and less than 200 mm in the arid region. The mean annual temperature ranges from °C in the upper reaches to °C in the lower reaches [33].
From southeast to northwest in the study region, vegetation changes from forest, forest-steppe to typical steppe, and desert steppe. Grassland is widely distributed in the study region and accounts for more than 40% of the total area. Cropland occupies nearly a quarter of the total are, which is mainly distributed in the plain and hills and dominated by wheat and maize. Forests are mainly distributed in alpine mountains and middle mountains. Natural forests are dominated by secondary broad-leaved forests, coniferous and broad-leaved mixed forests, and temperate coniferous forests with species such as Betala platyphylla, Populus davidiana, and Quercus mongolicus. The main species of shrubland includes Hippophae rhamnoides, Ostryopsis davidiana, and Spiraea trilobata. During the GTGP, newly planted vegetation includes artificial forest land (e.g., Robinia pseudoacacia, Pinus tabulaeformis, and Platycladus orientalis), shrubland (e.g., Caragana korshinskii and sea buckthorn), and grassland (e.g., Alfalfa).
Over the past decades, unreasonable expansion of cropland and the deterioration of natural vegetation have worsened the local eco-environment [34]. A series of methods including the construction of terraces and silt-arrest dams, banning grazing, and afforestation have been put into force since the 1980s. The GTGP was first practiced experimentally in Shannxi, Gansu, and Sichuan in 1999, and then popularized countrywide since 2002 [35]. After an overall implementation period, the government claimed a transition to a new period which aims at consolidating the formal achievements from 2007 [16]. In 2014, to further relieve the hazards of sandstorms, increase forest resources, and address global change, the government planned to expand the GTGP program.
2.2. Data Resources and Processing
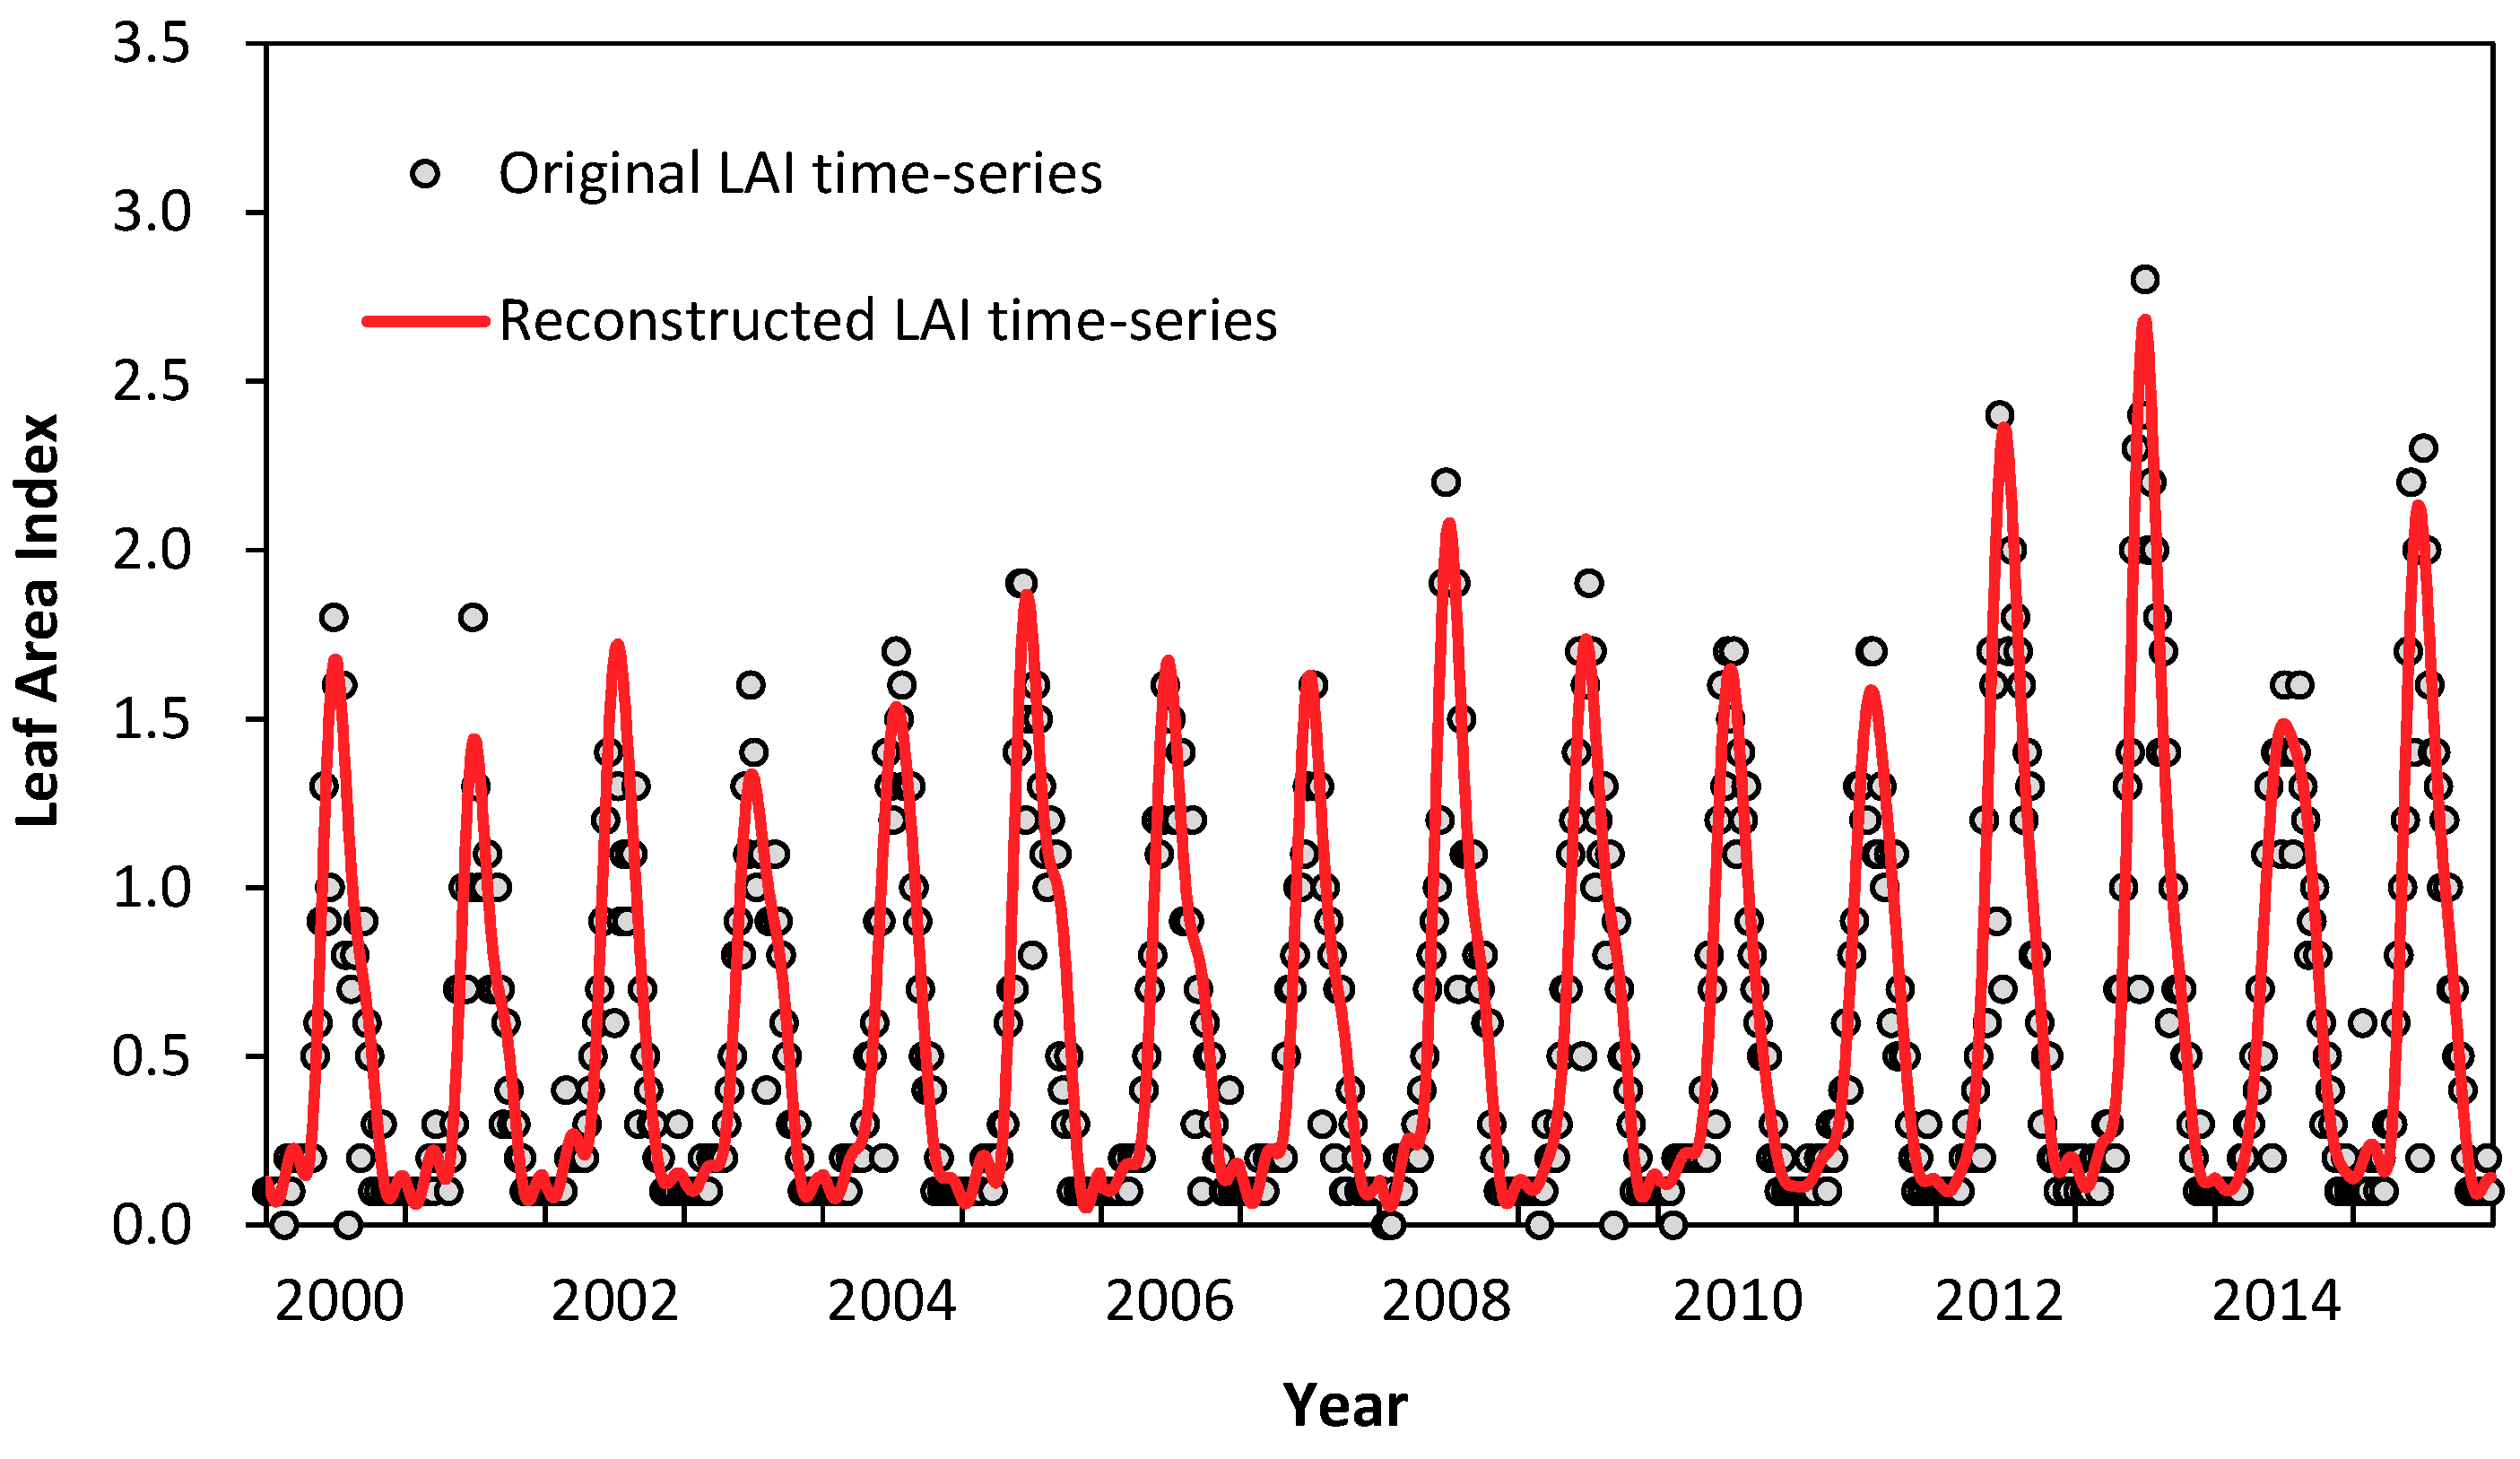
The MODIS Leaf Area Index (LAI) (MOD15A2H) data were derived from the MODIS products website (https://lpdaac.usgs.gov/), providing information of vegetation changes from 2000 to 2015. The spatial and temporal resolutions of data were 500 m and eight days. LAI data were incomplete before February 2000 (six images). Taking the low vegetation cover and little inter-annual variations in winter into consideration, the missing data were supplemented with images on the same days from 2001 [36]. MODIS LAI data were primarily re-projected and extracted using MRT (MODIS Reprojection Tool). In the imaging process, noise signals are inevitable due to the influences of clouds and aerosols [37], which may lead to the inaccurate reflection of the true LAI of terrestrial surfaces. Therefore, the harmonic analysis of time series (HANTS) method was applied to reconstruct the data series. The HANTS method considers only the most important frequency components and is beneficial for removing outliers and obtaining a smooth time series [38]. An example of the reconstruction of a LAI series is shown in Figure 2.
Daily meteorological data of 130 stations within or near the study region during 1980–2015 were collected from the National Meteorological Information Center (http://data.cma.cn/). The data included precipitation, maximum air temperature, minimum air temperature, mean temperature, relative humidity, wind speed, and daylight hours. The daily potential evapotranspiration was calculated according to the FAO Penman–Monteith equation [39]. The daily precipitation and potential evapotranspiration were summed as annual value. Next, ANUSPLIN (version 4.3), a software package for generating hydro-meteorological maps at varying spatial and temporal scales based on the thin–plate smoothing spline method, was applied to interpolate the annual precipitation and potential evapotranspiration to the study region with a spatial resolution of 500 m from 1980 to 2015 [40,41,42]. The multiyear mean aridity index (AI) was calculated by dividing the mean annual potential evapotranspiration to the mean annual precipitation and used to reflect the regional hydrothermal condition [43]. Based on the AI value, the entire study region was divided into five sub-regions with increasing dryness, which were as follows: AI = 1–2, AI = 2–3, AI = 3–4, AI = 4–5 and AI > 5 (Figure 1). AI = 3 was the boundary of the semi-arid and arid region [44,45].
Land use data for the 2000s and 2010s from Zhiyun Ouyang [46] were used to identify the converted types and unconverted types over 2000–2015 based on the periodicity of GTGP. There were eight level I classes and 22 level II classes in the original data. Based on the level II classes, we first reclassified the land use types into seven classes: forestland, shrubland, grassland, cropland, water body, artificial land, and others (bare land and desert). Then, the two land use maps were overlaid in ArcGIS to identify the land use types of interest and their spatial distribution (Figure 3). The interested types consisted of four unconverted land uses (forestland (F), shrubland (S), grassland (G), and cropland (C)) and three converted land uses (cropland → forestland (C → F), cropland → shrubland (C → S) and cropland → grassland (C → G)). Finally, we calculated the percentage of the distribution area in every sub-region and sorted them with ascending dryness for each land use type. The AI sub-regions with an accumulated percentage of approximately 95% were chosen for each land use type to conduct the analysis (Table 1).
2.3. Methods
2.3.1. Maximum LAI Composite
To understand the variation features of vegetation growth, annual maximum leaf area index, reflecting optimal growth status in a year, was extracted using the MVC (maximum value composite) method [47]. The time series of the max leaf area index over 2000–2015 was constructed. The mean values of LAI and vegetation variations for land use types under different AI sub-regions were obtained by the zonal statistics method in ArcGIS [48].
2.3.2. Trend Analysis
The linear regression of LAI and year was constructed for each pixel based on the least square method to analyze the variation trend and magnitude of vegetation LAI over the study temporal domain [5]. The slope of regression was calculated using the following equation:
where is the length of the study period (n = 16 years in the study); is the year number; and is the LAI value at Positive and negative represented an increasing and decreasing trend, respectively. The significance of the trend was tested by the Student-t method. A value lower than 0.5 indicated a significant trend.
calculated from Equation (1) is the absolute change rate (1/yr) of LAI and is directly influenced by vegetation type and regional wetness. Therefore, the relative change rate (, %/yr), defined as the ratio of to mean value of LAI series, was also calculated for comparisons among land use types in different hydrothermal conditions.
2.3.3. Fluctuation Analysis
The variation coefficient (), a normalized measure of dispersion of a time series which eliminates the influence of unit and mean difference, is widely used to obtain fluctuation features. Low indicates that the LAI series is close to the mean, while high indicates that the series disperse at a large range [49]. The calculation is
where, is the serial number; is the LAI value at year ; and is the mean value of the LAI series. The higher the , the stronger the fluctuation and weak stability.
2.3.4. R/S Method and Hurst Index
Rescaled range analysis (R/S) is an effective way to quantificationally predict the dynamics of future trend. The Hurst index is widely applied to examine whether the long-term series variation is continuous or random. The calculation of the Hurst index, according to Liu et al. [50] is as follows:
Given the LAI time series {LAI(t)}, t = 1, 2, …, n, the mean sequence of the series can be defined as follows:
Then, the cumulated deviation can be computed as follows:
The range sequence was set up as follows:
The standard deviation sequence was calculated as follows:
For the equation , the existence of a relationship expressed as indicates that the analyzed time series has a Hurst phenomenon. Taking log on both sides of the relationship formula as , the Hurst Index () was then fitted by the least square method.
The future trends of the LAI series were examined according to the H value. There are three forms: represents an opposite trend of future change while suggests that future change is consistent with the past trend. The closer the H is to 1, the stronger the consistent continuity [51]. means a random time series.
3. Results
3.1. The Spatial Distribution of Mean Vegetation LAI
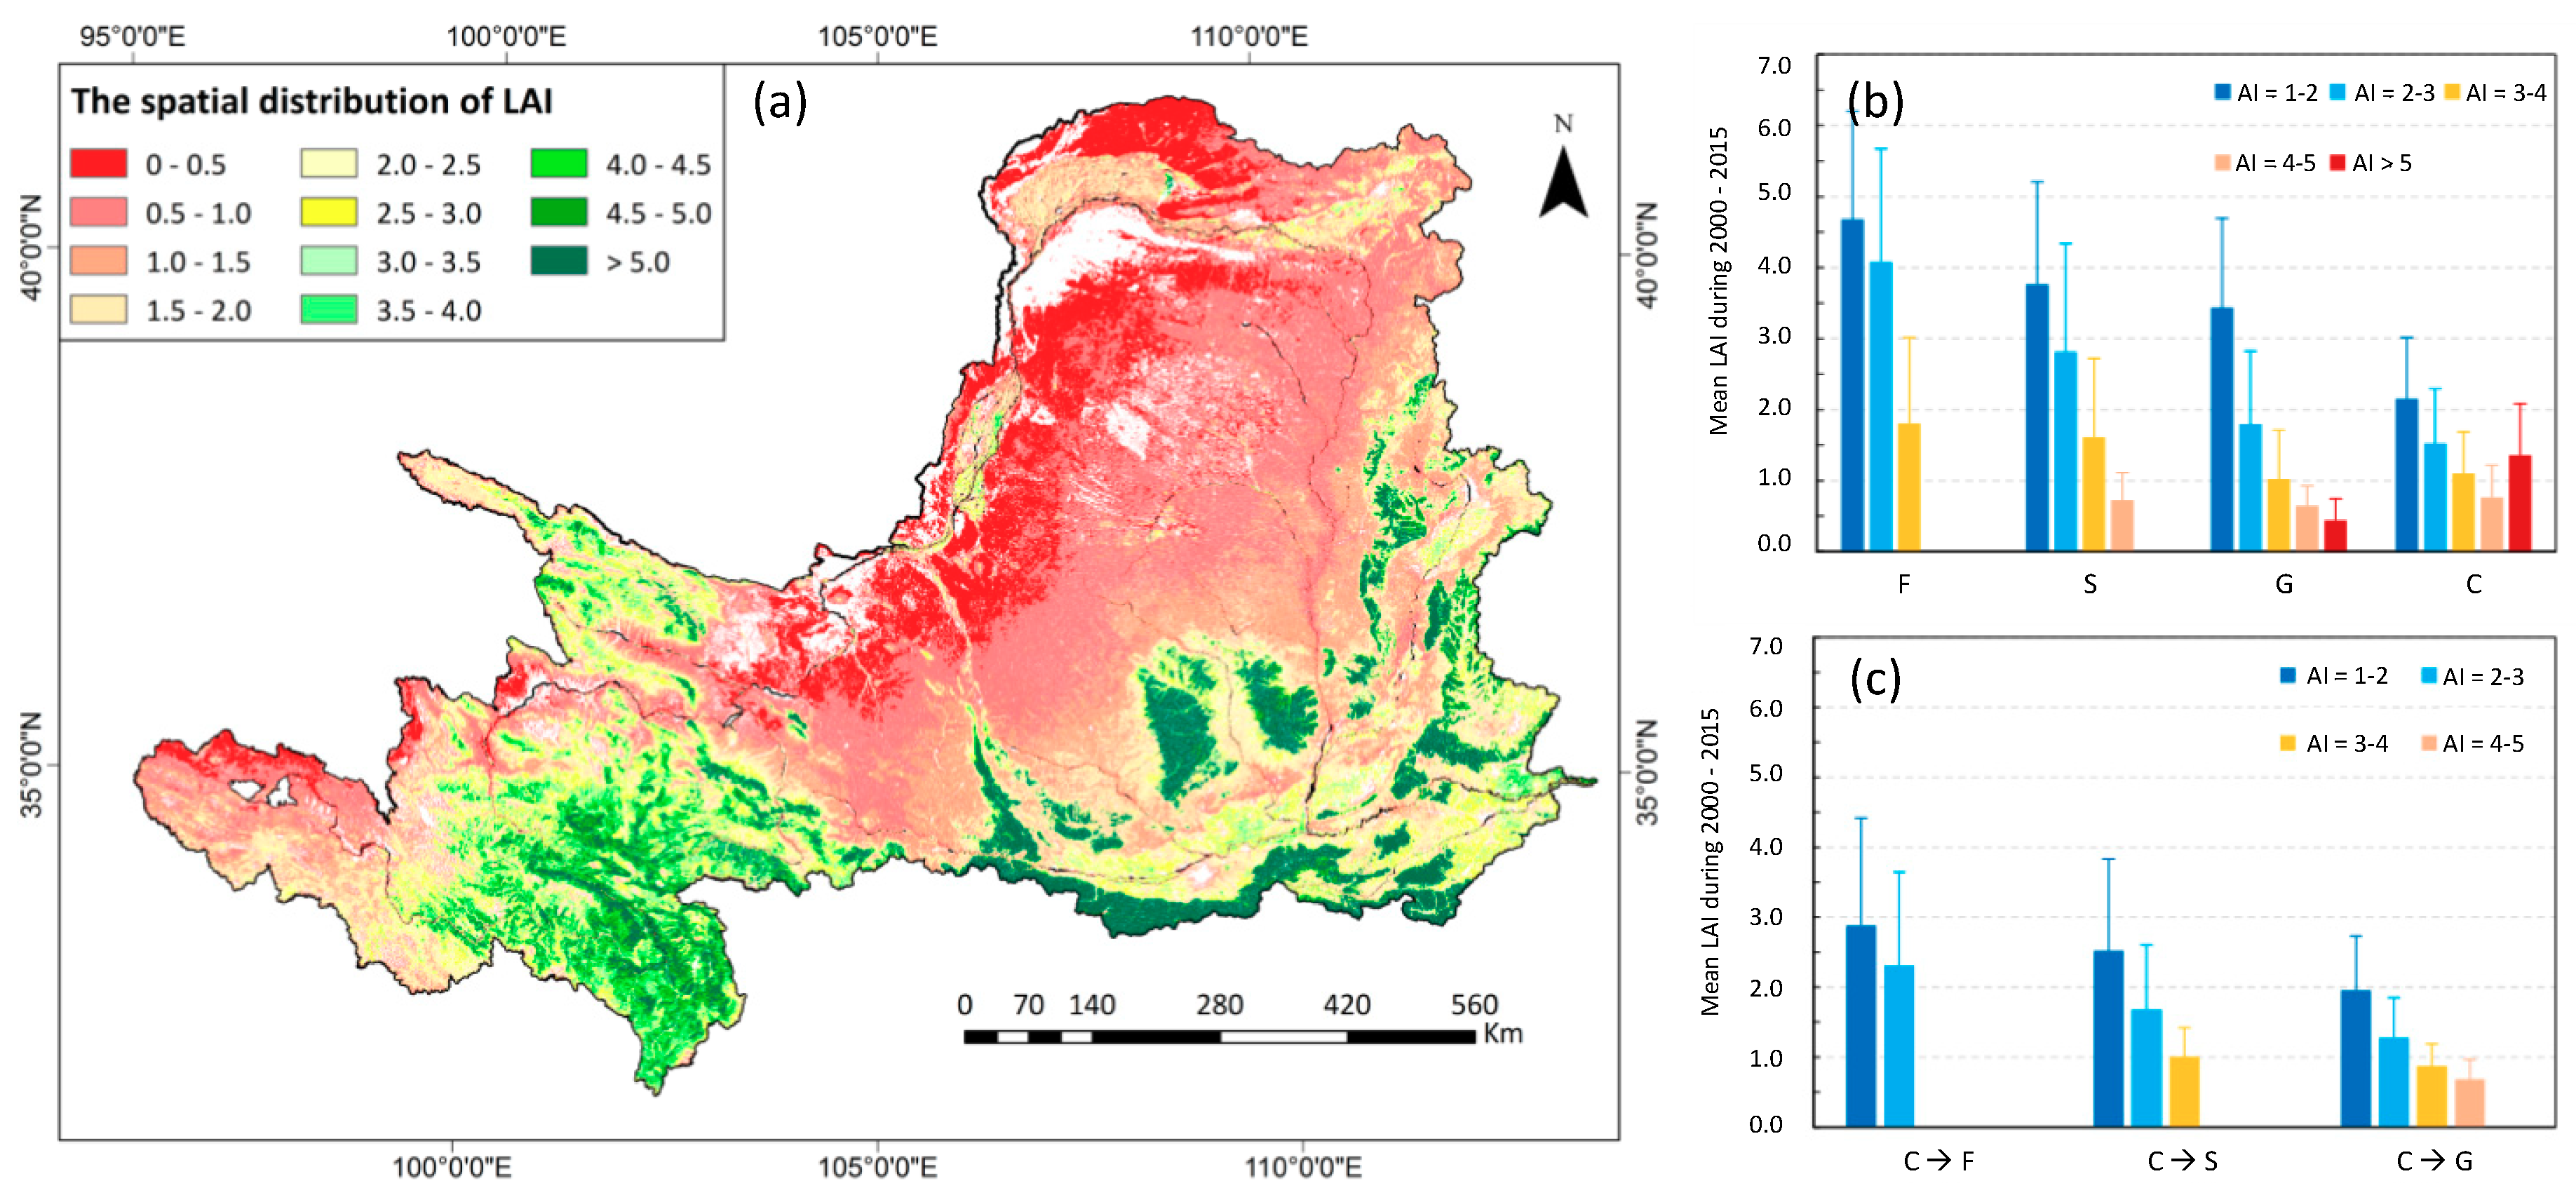
Figure 4 shows the spatial distribution of the mean LAI during the period 2000–2015. The annual mean LAI in the upper and middle reaches of the Yellow River ranged from 0.1 to 7.1. Due to the climate conditions, the vegetation LAI followed a decreasing trend from southeast to northwest in the study region. High LAI values (LAI > 5.0) were mainly in mountain areas such as Ziwuling, Qinling, Lvliangshan, and Liupanshan, where forestland and shrubland are widely distributed. In addition, the LAI value was quite high (LAI > 3.0) in the southern area of the source region of the Yellow River where meadows dominated. In the west and north region, the LAI was generally lower than 3.0, which occupied more than 65% of the total area.
The mean LAI value for different land use patterns is shown in Figure 4b,c. Generally, the mean LAI values ranked as forestland > shrubland > grassland for both unconverted types and converted types. For a specific land use type, the mean LAI decreased with increasing local aridity except for cropland in the AI > 5 sub-region. In comparison with cropland, LAI of C→G is lower under similar hydrothermal conditions, converted to grass (C → G) resulted in lower LAI in all AI sub-regions while converted to forestland and shrubland (C → F and C → S) resulted in higher LAI except for C → S in sub-region with AI = 3–4 (Table 2). Compared with corresponding unconverted types in the same AI sub-regions, converted types generally had lower LAI values. Except for C → G in regions with an AI = 4–5, the LAI of converted forestland, shrubland, and grassland could only reach 56%–62%, 59%–67%, and 56%–85% of the unconverted forestland, shrubland, and grassland, respectively (Table 3).
3.2. Vegetation Spatiotemporal Variations
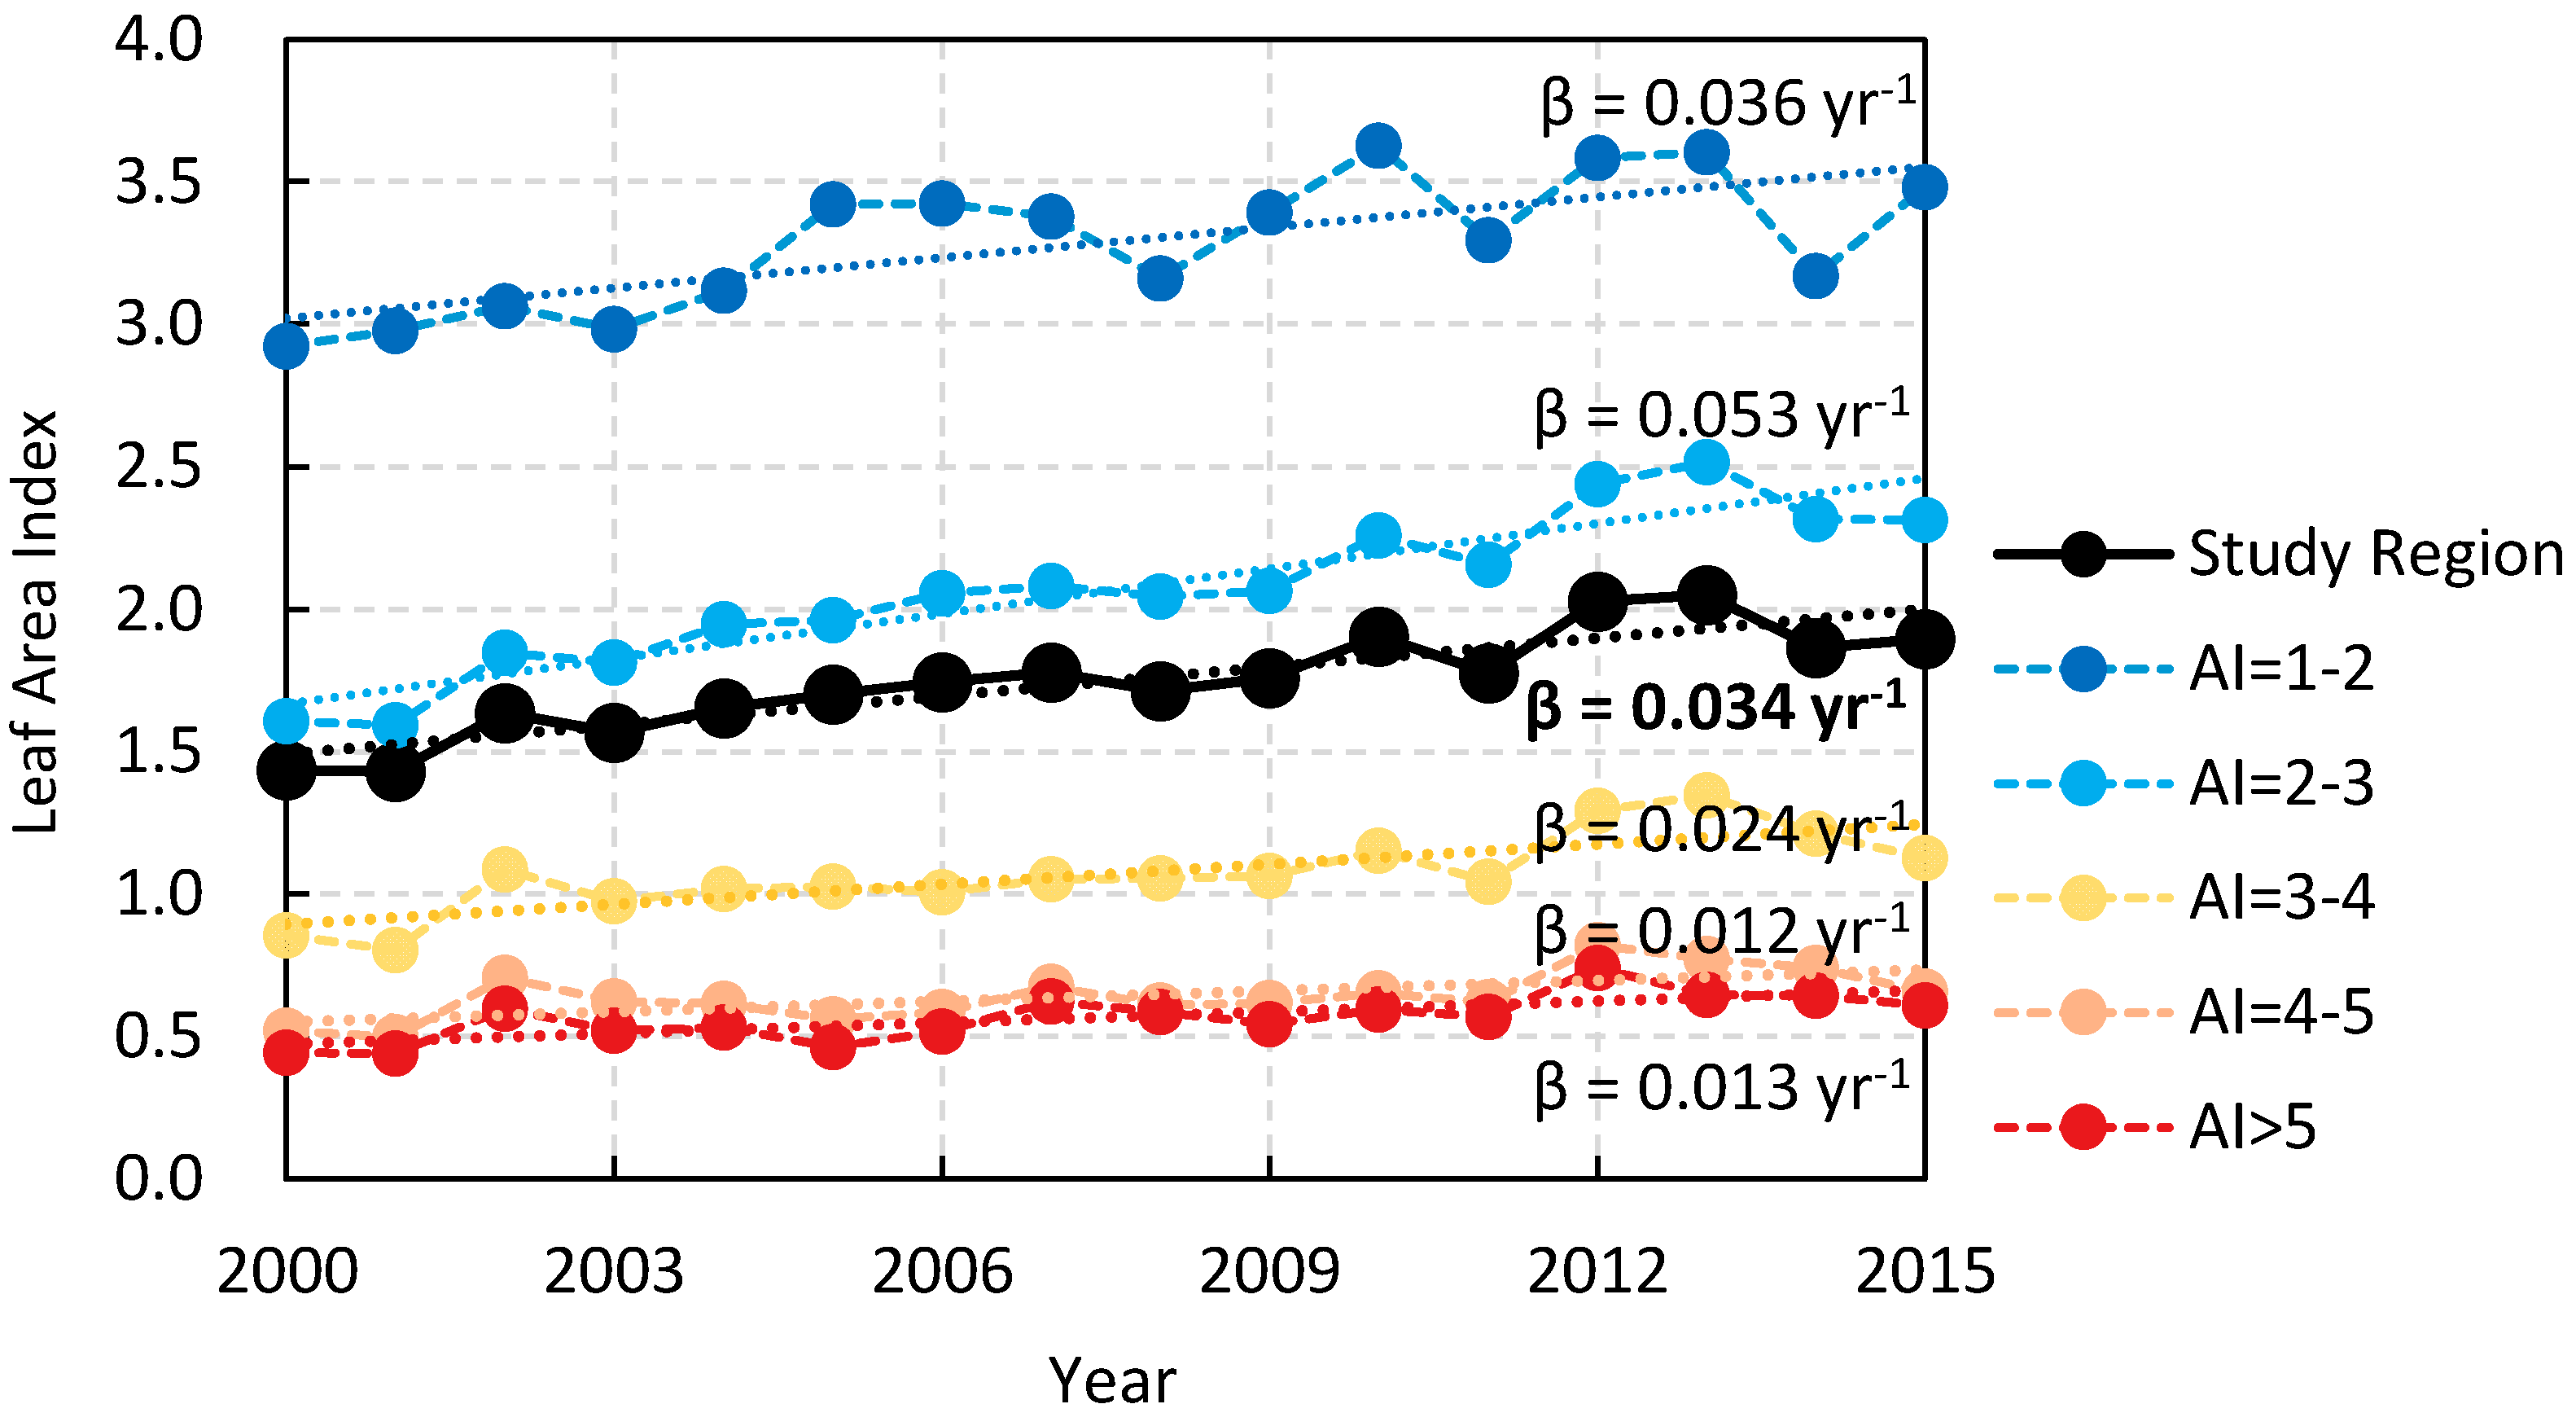
The vegetation LAI exhibited an overall uptrend over 2000–2015 in the entire study region (0.034 yr−1, P < 0.01). The increase occurred in all drying conditions but with different rates. Generally, vegetation increased with higher speeds in wetter sub-regions (AI < 3, ) than those under drier circumstances (AI > 3, ) (Figure 5). In the sub-region with AI = 2–3, vegetation changed at a largest rate (), which was approximately 4.5 times that of the rate in the slowest changed sub-region (AI = 4–5).
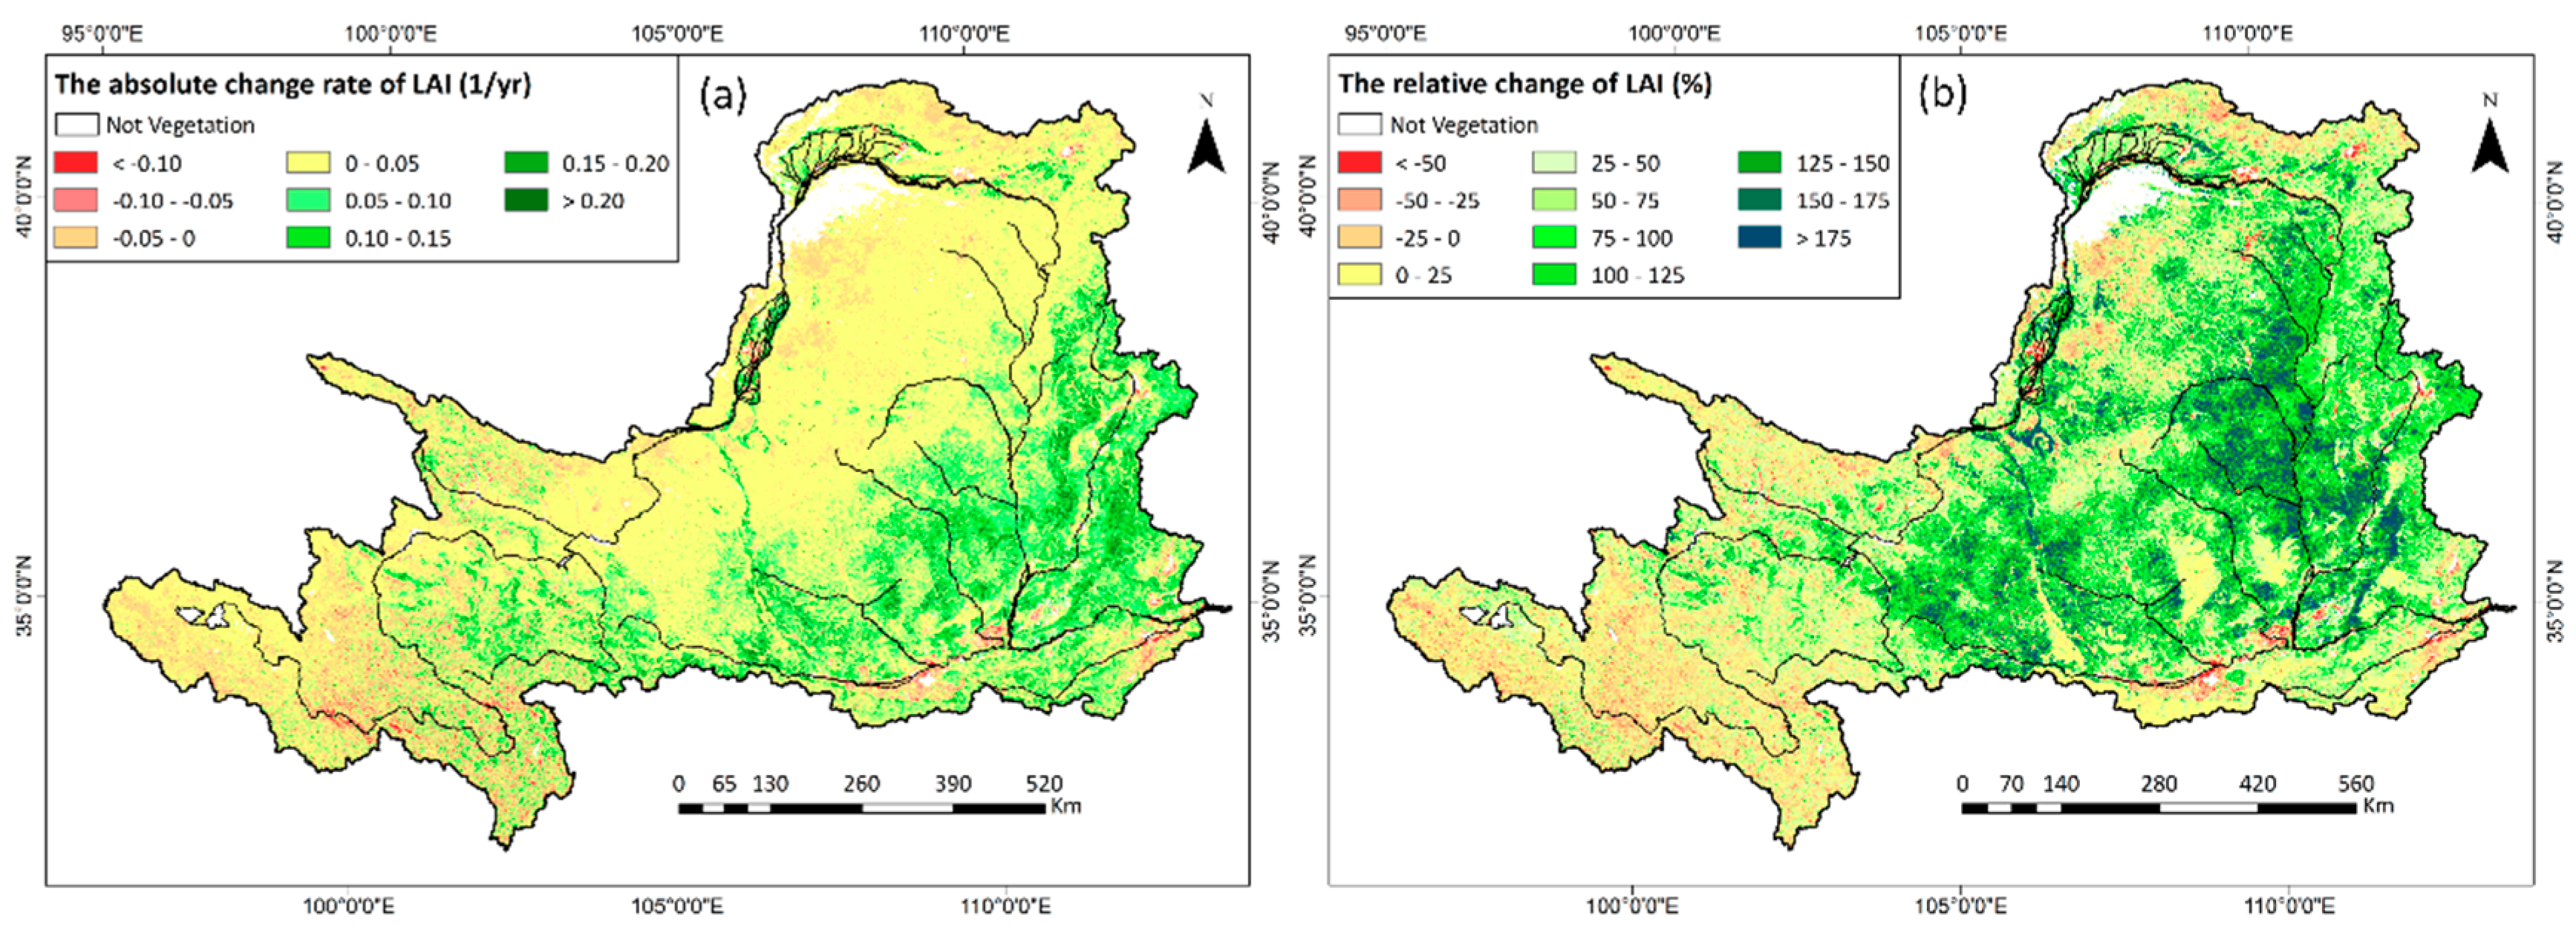
In the study region, the vegetation greening (p < 0.05) area accounted for 78.9% of the total, and was mainly distributed throughout Toudaoguai to Longmen, which are located in the middle part. Meanwhile, the browning trend (mostly insignificant with p > 0.05) was distributed sporadically in the source region of the Yellow River, Huangshui Basin in the western part and downstream of the Weihe and Luohe Basins in the southeastern part (Figure 6). The absolute changing rate of the LAI decreased from southeast to northwest (Figure 6a). In the Fenhe, Yanhe, Beiluohe, and Weihe watersheds with an annual precipitation larger than 450 mm, the vegetation increased at rates ranging from 0.05 yr−1 to 0.15 yr−1 due to the good growth conditions and cluster of forest and shrub. While in the northwestern part such as the Wudinghe, Kuyehe, Huangfuchuan watersheds, vegetation improved at much lower rates, lower than 0.05 yr−1. Compared to the absolute change rate, relative change over 2000–2015, which eliminated the effect of mean growth status, showed a relatively different spatial pattern (Figure 6b). Over 2000–2015, the vegetation generally increased more than 50% in the middle reaches of the Yellow River. Vegetation LAI in several regions even doubled, mainly distributed in Huangfuchuan, Kuyehe, Wudinghe, Yanhe, the middle and down reaches of Fenhe, and the upper reach of the Weihe and Jinghe watersheds. Meanwhile in mountain regions such as Ziwuling, Liupanshan, and Qinling, the relative change was lower than 25%. The relative decrease of LAI was between 0–50% in the upper reach of the Yellow River and 0–25% in the Luohe Basin and lower reach of the Weihe watershed.
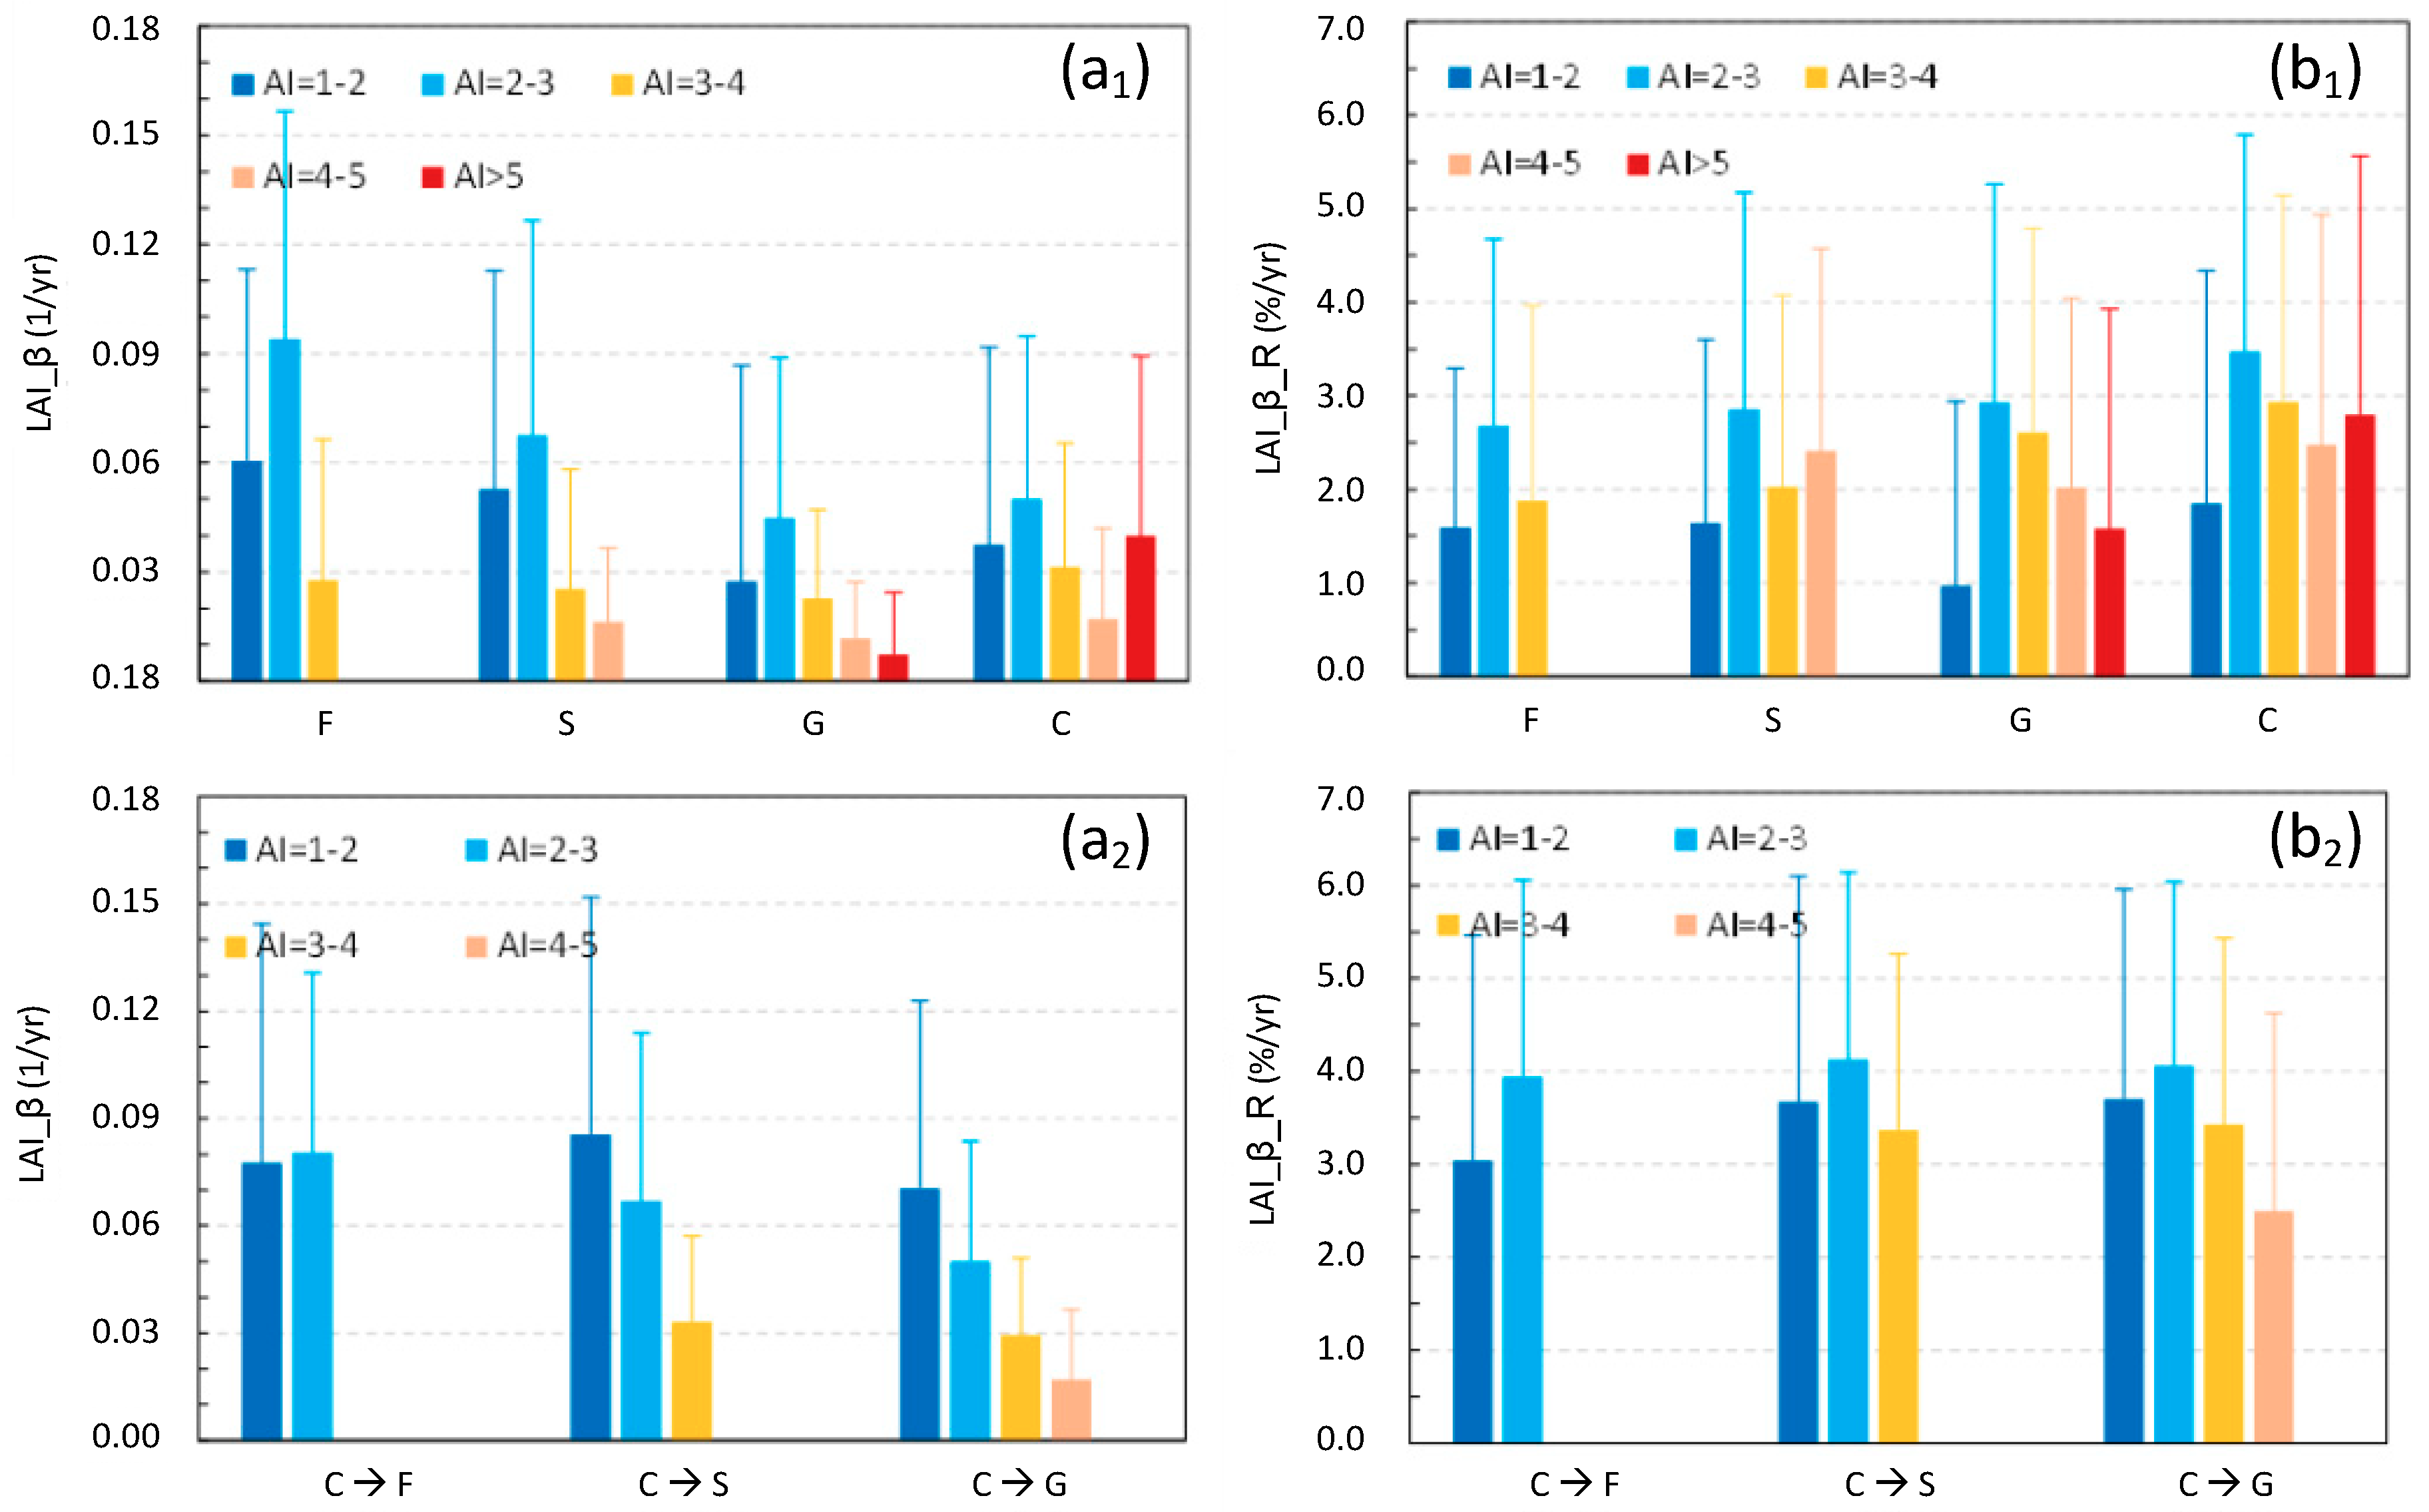
The LAI change rates for different land use types are displayed in Table 4. The absolute change rate for both the converted types and unconverted types showed a trend as forestland > shrubland > grassland. However, in terms of the relative change rate, cropland improved the most, followed by shrubland, and forestland and grassland increased the slightest among the unconverted types. For the converted types, the LAI changed the greatest for C → S, followed by C → G and C → F. Generally, C → F, C → S, and C → G had larger changing rates (both and ) than C, S, and G, respectively.
For a specific land use type, the and generally increased first, and then declined with decreasing dryness, and reached its summit in the AI = 2–3 sub-region, except for cropland, which had a great increase in AI > 5 sub-region. The absolute LAI change rate in arid sub-regions (AI > 3) was significantly lower than that in the semi-arid and semi-humid region (AI < 3). The relative change rate was larger in the arid sub-region than that in wetter sub-region with AI = 1–2 for unconverted types, indicating a larger growth potential. An opposite feature was found for converted types in terms of the relative changing rate, which was larger in the AI = 1–2 sub-region than in the sub-regions with AI > 3 (Figure 7).
3.3. The Fluctuation of Vegetation LAI
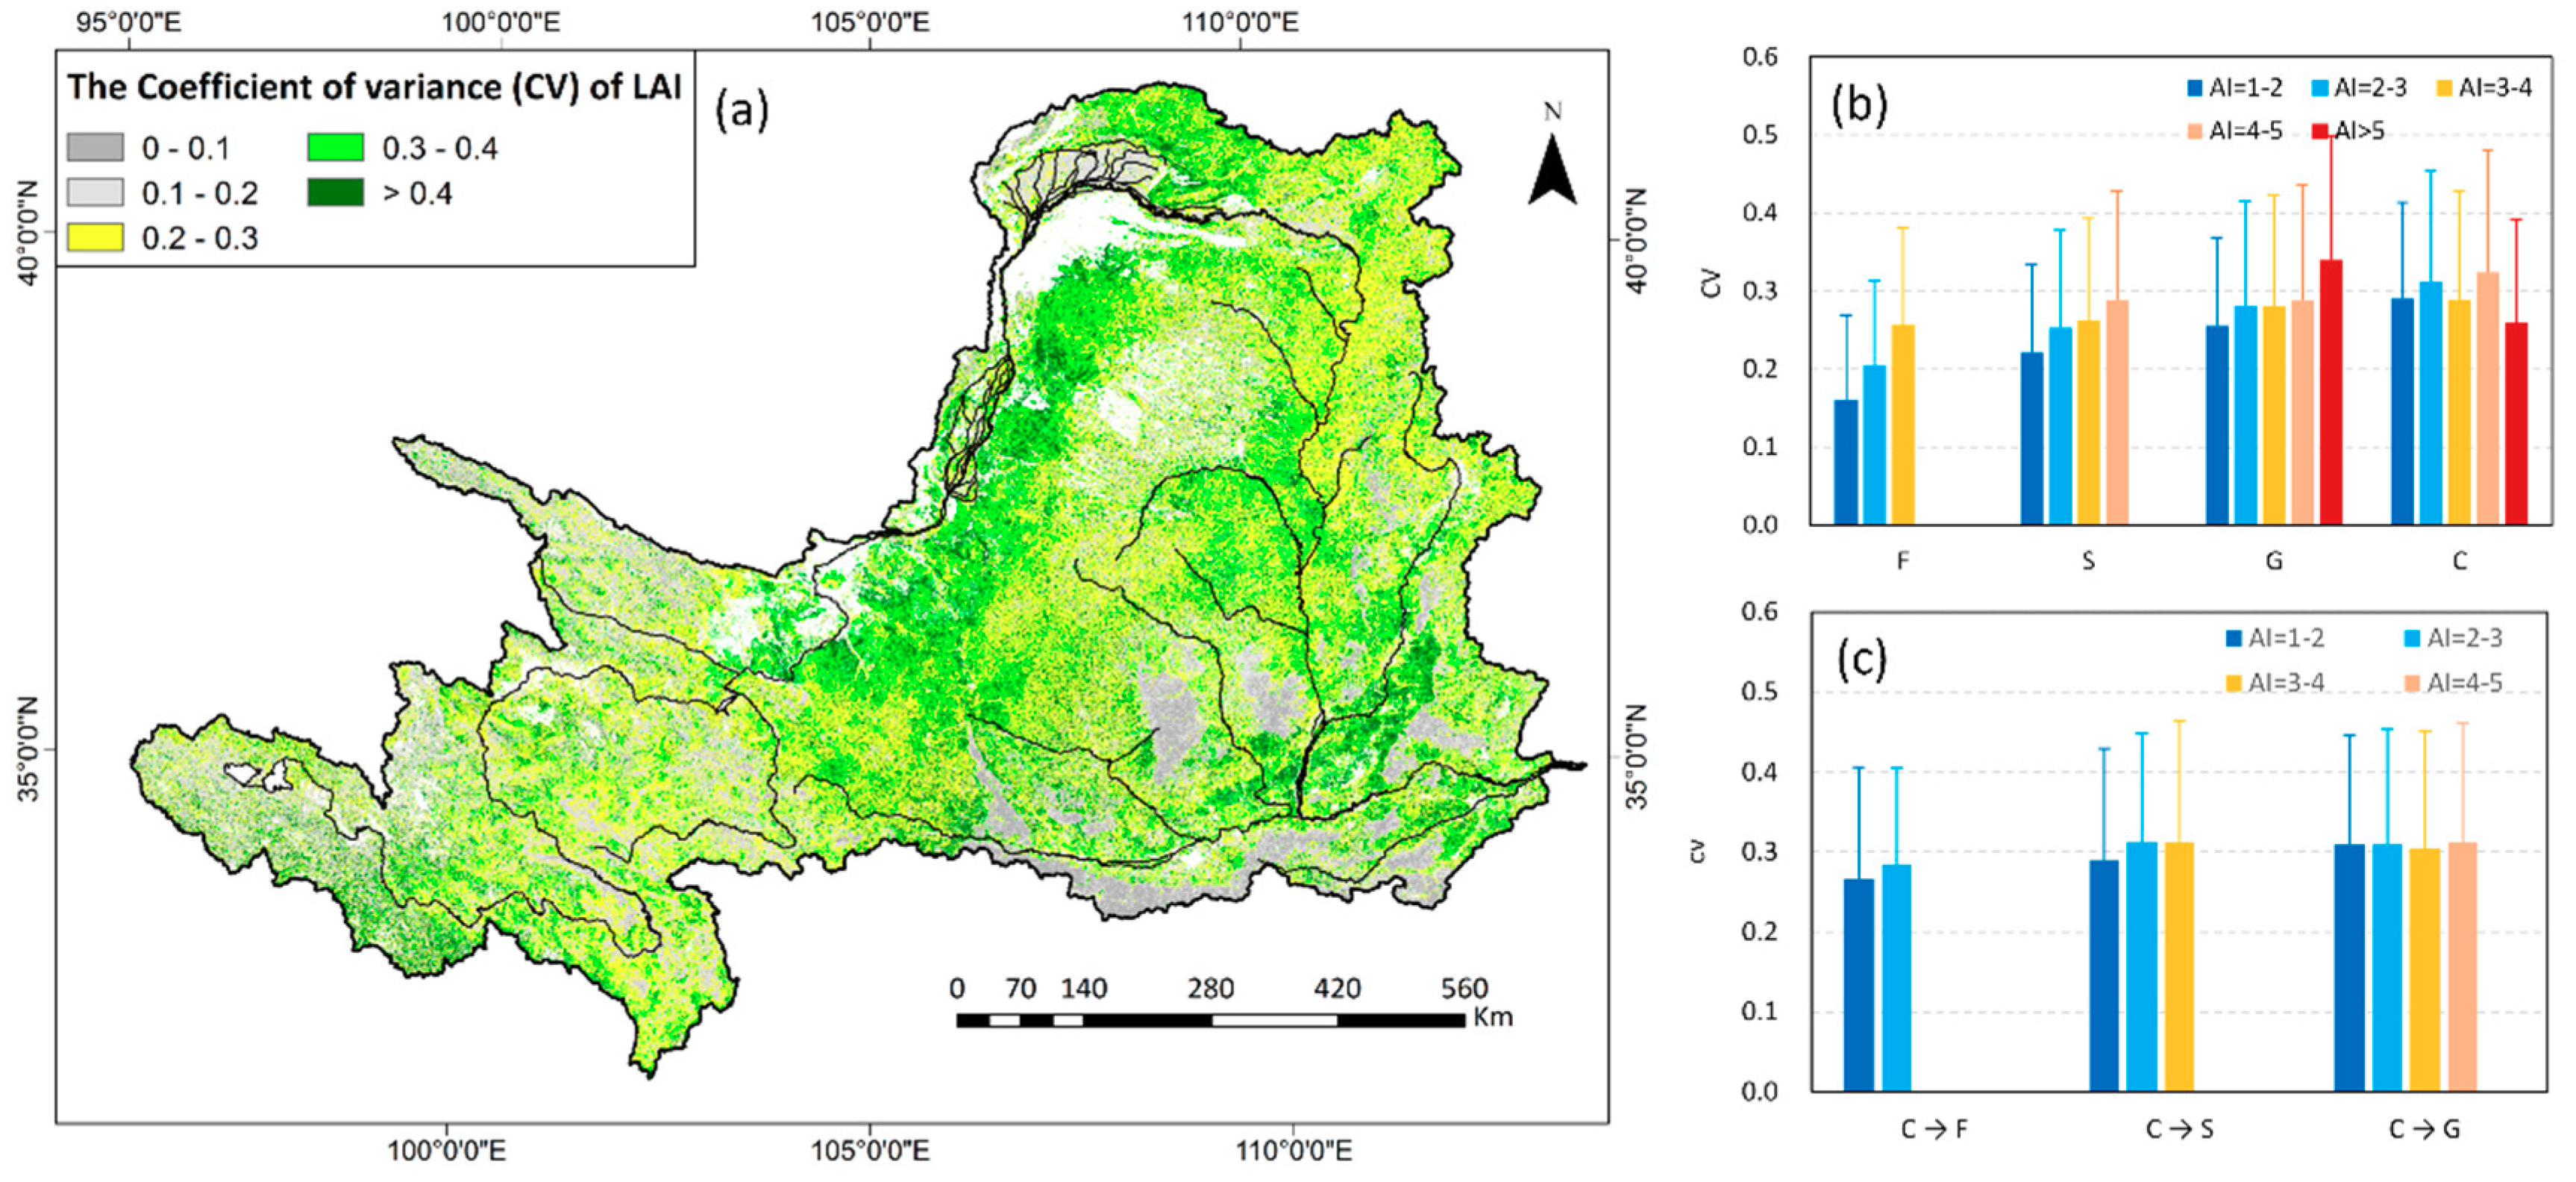
The value ranged from 0 to 0.75 in the study region, of which more than 60% clustered between 0.2–0.4, indicating a moderate fluctuation (Figure 8a). A slight fluctuation with a lower than 0.2 was distributed in Ziwuling, Huanglongshan, Lvliangshan, and Qinling in the southeastern region, the Hetao Plain in the northern region, and the Yellow River source in the western region. While in the Wudinghe, Kuyehe, and Yanhe watersheds, the down reach of the Fenhe watershed, and the arid region in the northwest part of the upper and middle reaches of the Yellow River, the fluctuation was quite strong with a larger than 0.4.
The fluctuation of vegetation LAI is closely associated with land use types. The variation extent for unconverted types ranked as: F (0.19) < S (0.24) < G (0.29) < C (0.30). The of converted types (0.27–0.31) were generally larger than the corresponding unconverted types with small differences among C → F, C → S, and C → G. In sub-regions with a different aridity index, the of the LAI series for unconverted types increased with drier conditions, and the magnitude of increase showed a trend of F > S > G, while the of converted types was similar under different hydrothermal conditions (Figure 8b,c).
3.4. Future Vegetation Sustainability Prediction
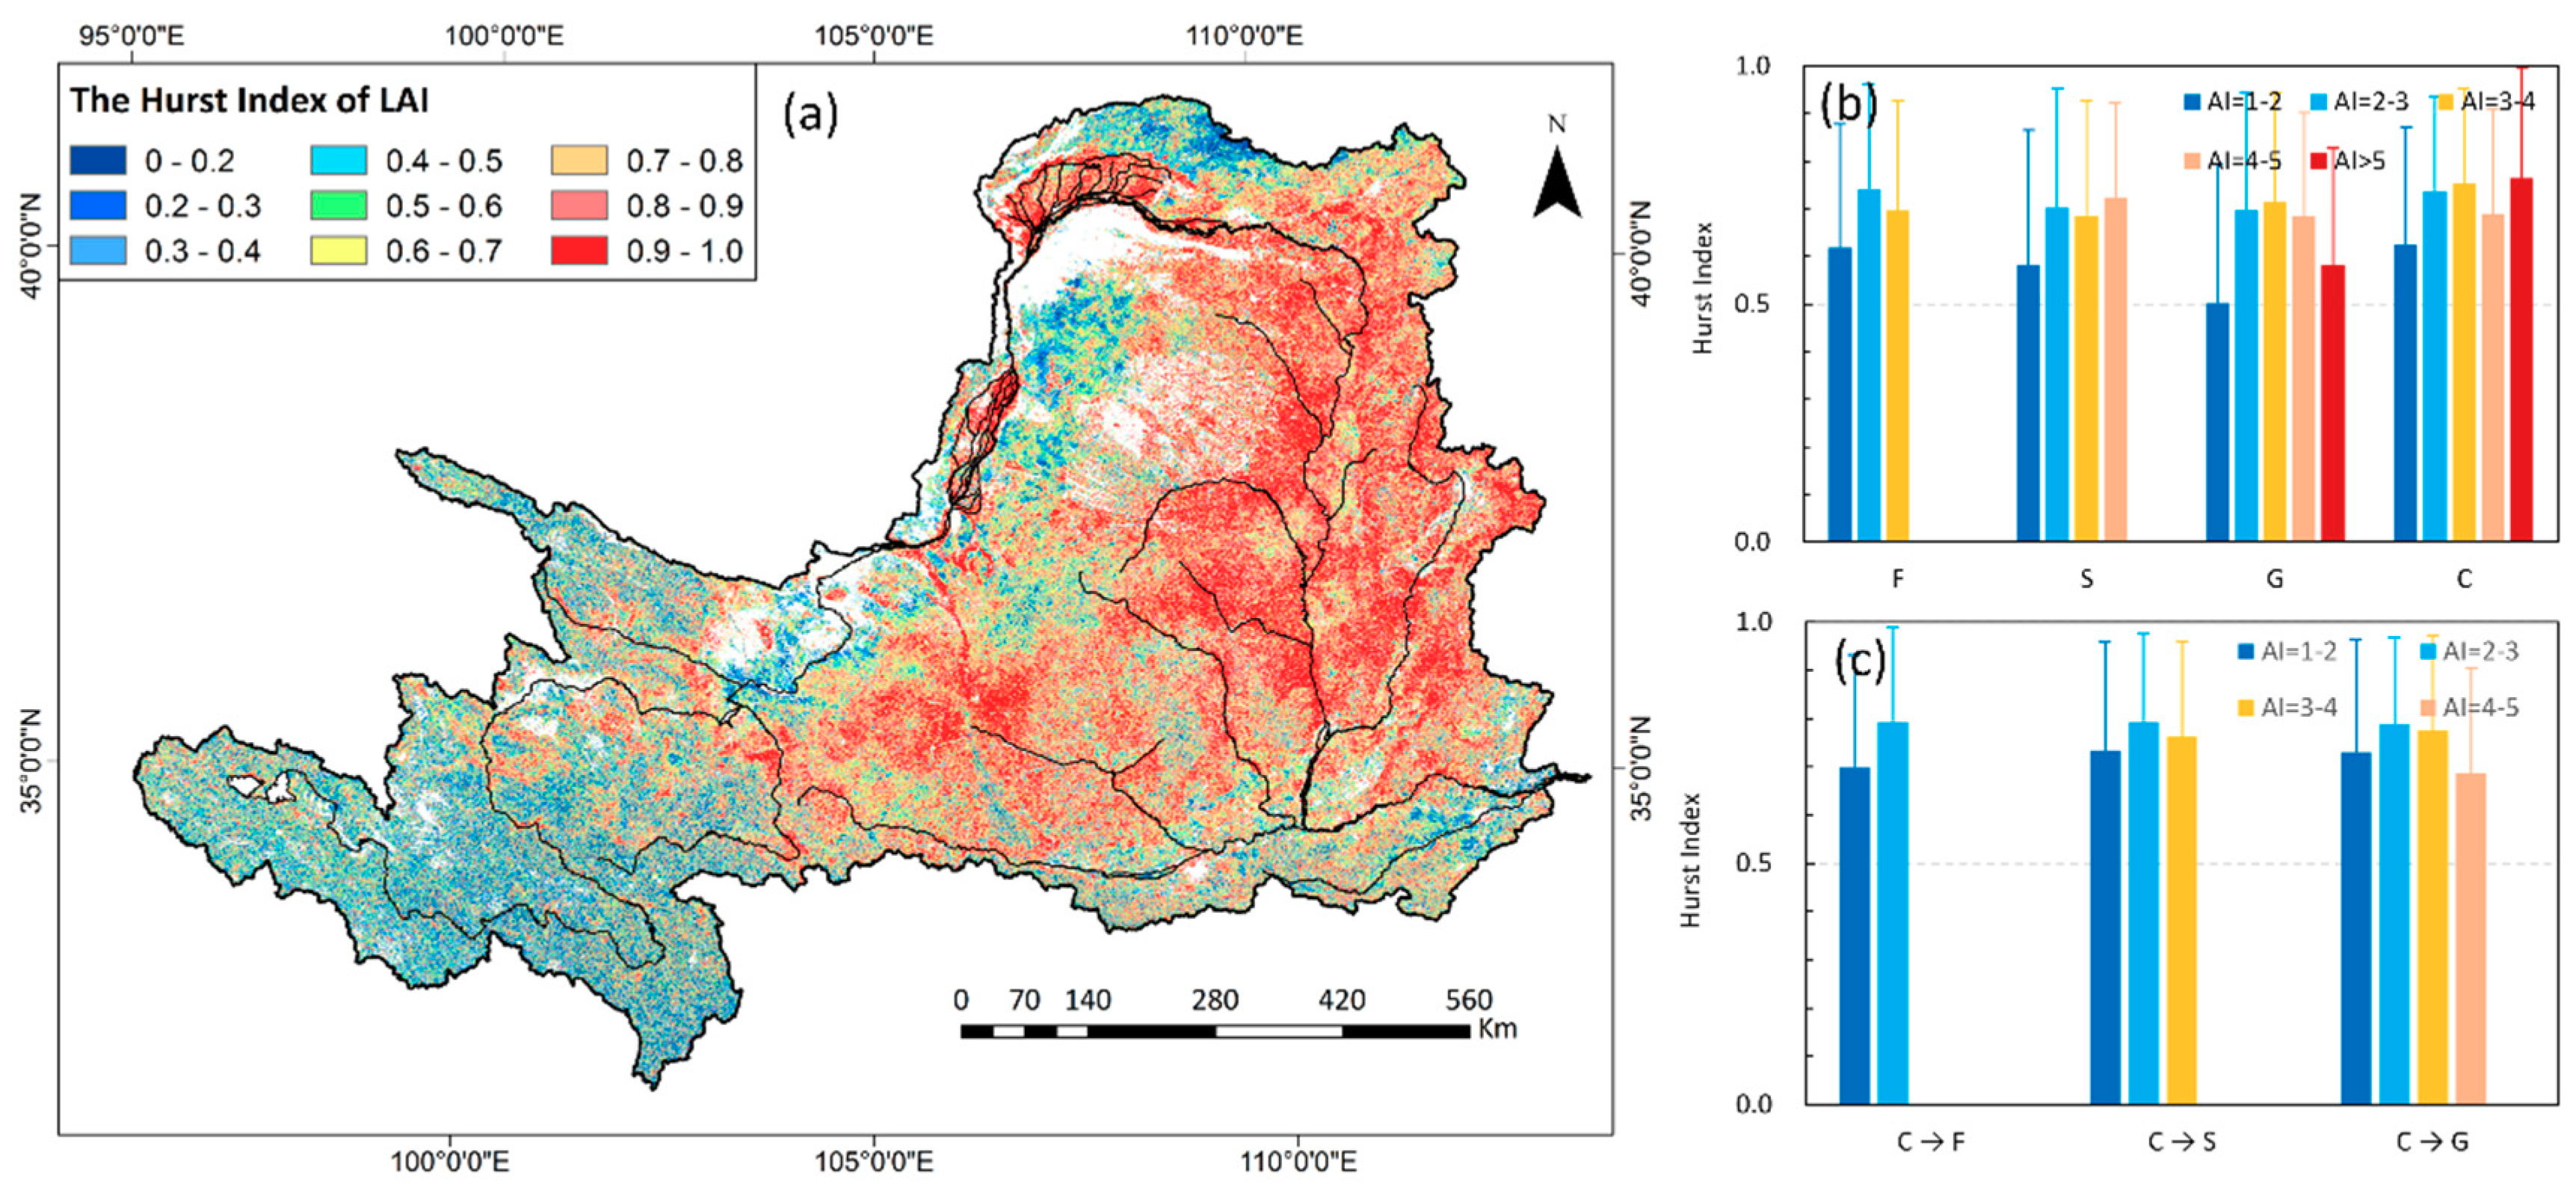
The future variation trend of the vegetation LAI maintaining consistent with that of the past (H > 0.5) occupied nearly 73.1% of the entire study area, mainly between Toudaoguai and Longmen in the middle region. The anti-continuity areas (H < 0.5) were in the source region of the Yellow River, Gansu, and Ningxia Provinces in the northwestern arid part, Yinshan in the northern part, and the Ziwuling and Liupanshan forests (Figure 9a).
The Hurst Index was universally larger than 0.5 for all land use types except for grassland in the AI = 1–2 sub-region. This exception may be attributed to the effect of alpine grassland in the source of the Yellow River Basin. As vegetation LAI increased over 2000–2015, they are expected to improve in the future and a larger H value indicated stronger growth. The H values of the converted types were slightly higher than the unconverted types. Similar to the changing rate, the H value for each land use type increased first and then decreased as the AI increased, and reached its highest value mainly in the AI = 2–3 sub-region. In particular, the H value was quite high for cropland in the driest sub-region with AI > 5 (Figure 9b,c).
4. Discussion
4.1. Differences of Vegetation Dynamics Features among Land Use Patterns
The overall implementation of vegetation construction and recovery has been recognized as the most important factor for the fast and overall greening trend in the study region since 1999 [16,34]. During the restoration programs, many methods were conducted comprehensively. First, cropland, which is critical for the eco-environment or that suffered from severe soil and water loss, was returned and re-vegetated with forest and grass according to the scientific design. The GTGP, experimentally practiced since 1999 and overall carried out since 2002, is one of the largest vegetation recovery projects in the world. Returning farmland on steep slopes () to grassland, shrubland and forestland is a key objective. During 2000–2015, the area of farmland was reduced by 5558 km2 while the area of forestland and shrubland increased by 2593 km2 in the Loess Plateau [52]. From the seventh (2004-2008) to eighth (2009-2013) Forest Inventory, the area of newly planted forest increased by , , and hectares in Shannxi, Neimenggu, and Gansu provinces, respectively. The afforestation area of Fenhe, Weihe, Beiluohe, Jinghe, Huangfuchuan, Yanhe, and Wudinghe has been increased by 128%, 113%, 93%, 82%, 76%, 66%, 55%, and 49%, respectively, during 1998–2006 [7]. Alternations in land use have strongly affected regional vegetation coverage variations [16,53]. After afforestation, methods such as closing hill were adopted to protect the newly planted trees. Studies have revealed that cropland experienced the strongest change since 1999 and its conversion to other vegetation types was the most significant reason [25]. In addition, vegetation improved most remarkably on slopes between 15° to 35° [25], which is consistent with the key managed zones of the GTGP. Forestland, shrubland, and grassland converted from cropland generally had a higher increasing rate than cropland as well as corresponding unconverted types over 2000 to 2015 (Figure 7), which demonstrated a faster growth for converted vegetation.
Second, construction of the basic farmland and farmland infrastructure was enhanced to ensure grain production after large-scale cropland conversion [54]. Therefore, the changing rates of cropland are quite high in all sub-regions (Figure 7). In arid regions with an AI > 5 located in the northwest, cropland, distributed mostly in the Ningxia Plain and Hetao Plain, mainly depends on irrigation (Figure 3a). Human activities such as farmland water conservancy establishments are of great benefit for cropland, resulting in good growth status and significant improvements during 2000–2015. In addition, the higher fluctuation of cropland LAI than other unconverted types also reflects the importance of effective farmland construction and management (Figure 8b).
Third, for previous forestland and grassland, vegetation constructions along with banning grazing and felling forest forbiddance were conducted to protect the natural succession and achieve natural recovery under non-disturbed conditions [55]. During 2002–2014, the area of mountain closure for each year increased from 53057 hectares to 2100449 hectares in China. The uptrend of LAI for unconverted forestland, shrubland, and grassland over 2000–2015, although to different extents (Figure 7), may be attributed to these protection and construction methods. Zhang et al. [56] revealed that vegetation construction contributed more than 70% for vegetation growth on Shanxi Plateau. As indicated by fluctuation features (Figure 8b), forest was the most stable, followed by shrub and grass over 2000–2015, indicating that the influence of vegetation construction was more notable for grass.
Different fluctuation characteristics reflect different degrees of the influence of external factors on the LAI series [16]. Stronger fluctuation for converted types than the corresponding unconverted forestland, shrubland, and grassland (Figure 8b,c) indicated that a more significant result of vegetation restoration had been achieved. Jia et al. [57] estimated the soil water storage in a 5 m soil layer of 716.4 mm on average before afforestation at 169 points on the Loess Plateau, which was 139% of the observed soil water storage. Relatively high initial soil water storage is beneficial for the vegetation growth of newly planted vegetation in the early stage [58]. Due to the single species and relatively simple stand structure, the plantation has weak stability and poor ability for confronting climate change [59]. While for vegetation with a longer growth and succession period, the relationship between plant structure and function and the surrounding environment (e.g., root uptake and soil water availability) reached a dynamic equilibrium. Under this circumstance, the resistance of vegetation to climate change is enhanced, leading to more stable growth and lower fluctuations. This may be another reason for the larger fluctuation in converted land use types than in unconverted types over 2000–2015.
4.2. Impact of Local Wetting Condition
The upper and middle reaches of the Yellow River crosses semi-humid, semi-arid, and arid climatic zones and the latter two occupy approximately 81.5% of the entire study region. Vegetation growth and development in dryland is sensitive to changes of external environment [60,61]. Vegetation is closely related to the spatial distribution patterns and variations of precipitation and temperature [62]. Previous studies have found that vegetation coverage change is correlated with precipitation and temperature since the 1980s in the study region [7] and a positive precipitation–vegetation relationship is mostly distributed [62]. The change of vegetation LAI responds sensitively to variations in precipitation with limited time lags at the month scale [63]. This clearly states that water availability directly influences vegetation LAI in water-controlled ecosystems [64]. This is primarily confirmed by the results, which show that LAI changing rates generally increase with decreasing AI for converted types and unconverted types (Figure 7). In addition, the absolute changing rate of vegetation LAI in sub-regions with AI < 3 was higher than that in arid sub-regions with AI > 3 (Figure 7a).
In the upper and middle reaches of the Yellow River, converted forestland, shrubland, and grassland from cropland mostly occurred in regions with AI = 1–3, AI = 1–5, and AI = 1–5, respectively (Table 1) during 2000–2015. Newly planted artificial vegetation growth is limited by regional hydrothermal conditions [65,66]. Generally, the LAI of newly planted forestland, shrubland, and cropland increased slower in arid regions than in semi-arid regions (Figure 6). In terms of different vegetation types, planted shrubland and grassland grew faster than forestland (Figure 7b), indicating that the balance between regional water availability and water demand by vegetation may influence the results of vegetation restoration. This suggests that the application of vegetation types with less water consumption may be more benefit for the local eco-environment. In addition, the ratio of LAI for converted types to corresponding unconverted types in similar hydrothermal conditions suggests the development of newly planted vegetation (Table 3). In drier conditions with an AI larger than two, the conversion of former cropland to grass and shrub developed better than forestland, which may suggest that planting grass or shrubs would be more favorable in most of the study region in future ecological restoration actions. Afforestation may only be recommended in wetter conditions with an AI = 1–2.
4.3. Implications of Vegetation Change Sustainability in Ecological Restoration
Vegetation would continue the greening trend over 2000–2015 in most regions (>70%) in the future, especially in sub-region with AI = 2–3, a key region for vegetation restoration (Figure 7 and Figure 9). The sustainability of converted types was slightly higher than that of the unconverted types (Figure 8b,c). Vegetation greening would increase evapotranspiration and soil water consumption by canopy interception, root uptake, and transpiration, directly affecting regional water and energy balance on one hand [13,67,68]. On the other hand, vegetation would alter the physical characteristics of the soil and increase surface roughness, indirectly changing regional water cycling [69,70,71]. Recently, many studies have pointed that conversions of land use types and vegetation recovery led to the decline of local soil water storage. Particularly in regions with a remarkable vegetation increase or large area of artificially planted exotic species, overconsumption of soil water resulted in a widespread dry soil layer [57,72]. Observations showed that the soil water contents under Robinia pseudoacacia, one of the main afforestation species in the Loess Plateau, decreased rapidly [73] and the drying layer extended from shallow layers (0–100 cm) to deeper layers (100–500 cm) with increasing forest age [74].
Soil desiccation may hamper vegetation growth [75,76]. In the Loess Plateau, especially in the northwestern region, many exotic trees such as Robinia pseudoacacia are “small but old trees” due to the lack of soil water [22]. More serious drought would even cause large scale vegetation death [77]. During the GTGP, fast-growing trees and grass with strong drought resistance have been widely planted. These adapted well to the local drying conditions and grew fast in the early period, which resulted in the fast improvement of vegetation LAI [58]. However, as the number of restoration years increases, soil drying resulting from the over-consumption of soil water would limit vegetation development [58]. Whether the fast increasing trend of vegetation LAI can be sustained needs continuous monitoring and focus in the future.
With the help of vegetation protection methods, unconverted vegetation LAI increased over 2000–2015. Although the increasing rate was lower than that of converted vegetation, unconverted forestland, shrubland, and grassland universally had larger LAI (Figure 4). This suggests that recovery of natural vegetation, such as secondary forest and existing grassland, would benefit the local ecological environment in the restoration process. Furthermore, local vegetation types are reported to consume less soil water and uptake water from shallower soil layers (e.g. 0–100cm) than exotic species [73]. Therefore, they may maintain an increasing trend for a longer time in the future. In the study area, vegetation regeneration and restoration are long-term processes aiming to establish a stable and sustainable ecological environment [7]. Therefore, the recovery of natural vegetation is more highly recommended than artificially planting new forest and grass in future vegetation restoration to ensure the sustainable development of the eco-environment. If afforestation is needed, local species may be more favorable than exotic species.
In this study, vegetation variations were detected for the converted and unconverted vegetation types identified by two land use maps for the 2000s and 2010s. Land use change with different degrees may occur each year in reality. Compared with using continuous land use maps for each year, which may introduce some fragmentary changes, using two maps to identify land use change patterns can obtain clearer results. However, this, to some extent, may also bring about some uncertainties. When calculating the characteristics of variation and fluctuation by the zonal statistic method in ArcGIS, the influences of restoration year were averaged and some differences may have been hidden to some extent. Although this influence may be limited to the overall features and trends, it needs more detailed consideration in future studies.
5. Conclusions
In this study, the vegetation dynamic characteristics were analyzed for unconverted forestland, shrubland, grassland, cropland, and converted forestland, shrubland, and grassland from cropland over 2000–2015 in the upper and middle reaches of the Yellow River. Then, the sustainability of the vegetation changing trend was predicted and its potential implications were discussed.
The main conclusions are as follows: (1) Vegetation exhibited an overall increasing trend in the study region, with a higher greening rate in sub-regions with AI < 3 than that in northwestern arid regions (AI > 3). Vegetation improved most in sub-region with AI = 2–3, which is one of the key areas in vegetation restoration. (2) The vegetation increasing rate was higher for converted land use types than that of unconverted types under similar drying conditions. For converted land use types, C → G and C → S improved more than C → F. (3) Vegetation fluctuation was slightly larger for converted types than unconverted types. The differences among types were small for converted types and large for unconverted types. The ranking for the unconverted type was forestland < shrubland < grassland < cropland.
Overall greening trend in the upper and middle reaches of the Yellow River indicated great achievements have been obtained since the implementation of the GTGP. Vegetation restoration exerted stronger influences on converted types from cropland than unconverted types. In the future, approximately 73.1% of the study region is expected to continue increasing. However, its sustainability and increasing rate in the future needs long-term monitoring.
Author Contributions
Conceptualization, W.W.; Formal Analysis, W.W. and L.S.; Investigation, W.W.; Resources, W.W.; Writing—Original Draft Preparation, W.W.; Writing—Review and Editing, W.W. and L.S.; Supervision, Y.L.; Project Administration, Y.L.; Funding Acquisition, Y.L.
Funding
This research was funded by the National Natural Science Foundation of China, grant number 2016YFC0501603 and 41390461.
Acknowledgments
We thank Kang, T. T. for her help in downloading and processing the MODIS data.
Conflicts of Interest
The authors declare no conflict of interest.
References
- Mohammad, A.G.; Adam, M.A. The impact of vegetative cover type on runoff and soil erosion under different land uses. Catena 2010, 81, 97–103. [Google Scholar] [CrossRef]
- Piao, S.L.; Fang, J.Y.; Liu, H.Y.; Zhu, B. NDVI-indicated decline in desertification in China in the past two decades. Geophys. Res. Lett. 2005, 32, L06402. [Google Scholar] [CrossRef]
- An, S.S.; Darboux, F.; Cheng, M. Revegetation as an efficient means of increasing soil aggregate stability on the Loess Plateau (China). Geoderma 2013, 209, 75–85. [Google Scholar] [CrossRef] [Green Version]
- Shi, H.; Shao, M.G. Soil and water loss from the Loess Plateau in China. J. Arid. Environ. 2000, 45, 9–20. [Google Scholar] [CrossRef]
- Tang, Q.; Oki, T.; Kanae, S.; Hu, H. A spatial analysis of hydro-climatic and vegetation condition trends in the Yellow River basin. Hydrol. Process. 2008, 22, 451–458. [Google Scholar] [CrossRef]
- Feng, X.M.; Sun, G.; Fu, B.J.; Su, C.H.; Liu, Y.; Lamparski, H. Regional effects of vegetation restoration on water yield across the Loess Plateau, China. Hydrol. Earth Syst. Sci. 2012, 16, 2617–2628. [Google Scholar] [CrossRef] [Green Version]
- Sun, W.Y.; Song, X.Y.; Mu, X.M.; Gao, P.; Wang, F.; Zhao, G.J. Spatiotemporal vegetation cover variations associated with climate change and ecological restoration in the Loess Plateau. Agric. For. Meteorol. 2015, 209, 87–99. [Google Scholar] [CrossRef]
- Liu, K.; Du, L.T.; Hou, J.; Hu, Y.; Zhu, Y.G.; Gong, F. Spatiotemporal variations of NDVI in terrestrial ecosystems in China from 1982–2012. Acta Ecologica Sinica 2018, 38, 1885–1896. [Google Scholar]
- Jia, K.; Liang, S.L.; Wei, X.Q.; Yao, Y.J.; Yang, L.Q.; Zhang, X.T.; Liu, D.Y. Validation of Global LAnd Surface Satellite (GLASS) fractional vegetation cover product from MODIS data in an agricultural region. Remote Sens. Lett. 2018, 9, 847–856. [Google Scholar] [CrossRef]
- Yang, L.Q.; Jia, K.; Liang, S.L.; Liu, M.; Wei, X.Q.; Yao, Y.J.; Zhang, X.T.; Liu, D.Y. Spatio-Temporal Analysis and Uncertainty of Fractional Vegetation Cover Change over Northern China during 2001–2012 Based on Multiple Vegetation Data Sets. Remote Sens. 2018, 10, 549. [Google Scholar] [CrossRef]
- Zhu, Z.C.; Piao, S.L.; Myneni, R.B.; Huang, M.T.; Zeng, Z.Z.; Canadell, J.G.; Ciais, P.; Sitch, S.; Friedlingstein, P.; Arneth, A.; et al. Greening of the Earth and its drivers. Nat. Clim. Chang. 2016, 6, 791–796. [Google Scholar] [CrossRef]
- Zheng, K.; Wei, J.-Z.; Pei, J.-Y.; Cheng, H.; Zhang, X.-L.; Huang, F.-Q.; Li, F.-M.; Ye, J.-S. Impacts of climate change and human activities on grassland vegetation variation in the Chinese Loess Plateau. Sci. Total Environ. 2019, 660, 236–244. [Google Scholar] [CrossRef]
- Li, S.; Liang, W.; Fu, B.J.; Lu, Y.H.; Fu, S.Y.; Wang, S.; Su, H.M. Vegetation changes in recent large-scale ecological restoration projects and subsequent impact on water resources in China’s Loess Plateau. Sci. Total Environ. 2016, 569, 1032–1039. [Google Scholar] [CrossRef]
- Hao, F.H.; Zhang, X.; Ouyang, W.; Skidmore, A.K.; Toxopeus, A.G. Vegetation NDVI Linked to Temperature and Precipitation in the Upper Catchments of Yellow River. Environ. Model. Assess. 2012, 17, 389–398. [Google Scholar] [CrossRef]
- Duan, H.C.; Yan, C.Z.; Tsunekawa, A.; Song, X.; Li, S.; Xie, J.L. Assessing vegetation dynamics in the Three-North Shelter Forest region of China using AVHRR NDVI data. Environ. Earth Sci. 2011, 64, 1011–1020. [Google Scholar] [CrossRef]
- Li, S.S.; Yang, S.N.; Liu, X.F.; Liu, Y.X.; Shi, M.M. NDVI-Based Analysis on the Influence of Climate Change and Human Activities on Vegetation Restoration in the Shaanxi-Gansu-Ningxia Region, Central China. Remote Sens. 2015, 7, 11163–11182. [Google Scholar] [CrossRef] [Green Version]
- Li, G.; Sun, S.B.; Han, J.C.; Yan, J.W.; Liu, W.B.; Wei, Y.; Lu, N.; Sun, Y.Y. Impacts of Chinese Grain for Green program and climate change on vegetation in the Loess Plateau during 1982–2015. Sci. Total Environ. 2019, 660, 177–187. [Google Scholar] [CrossRef]
- Peng, S.S.; Piao, S.L.; Zeng, Z.Z.; Ciais, P.; Zhou, L.M.; Li, L.Z.X.; Myneni, R.B.; Yin, Y.; Zeng, H. Afforestation in China cools local land surface temperature. Proc. Natl. Acad. Sci. USA. 2014, 111, 2915–2919. [Google Scholar] [CrossRef] [Green Version]
- Jiao, J.Y.; Zhang, Z.G.; Bai, W.J.; Jia, Y.F.; Wang, N. Assessing the Ecological Success of Restoration by Afforestation on the Chinese Loess Plateau. Restor. Ecol. 2012, 20, 240–249. [Google Scholar] [CrossRef]
- Li, Y.Z.; Liu, C.M.; Liu, X.M.; Liang, K.; Bai, P.; Feng, Y.X. Impact of the Grain for Green Project on the Land Use/Cover Change in the Middle Yellow River. J. Nat. Resour. 2016, 31, 2005–2020. [Google Scholar]
- Chen, Y.P.; Wang, K.B.; Lin, Y.S.; Shi, W.Y.; Song, Y.; He, X.H. Balancing green and grain trade. Nat. Geosci. 2015, 8, 739–741. [Google Scholar] [CrossRef]
- Wang, G.Y.; Innes, J.L.; Lei, J.F.; Dai, S.Y.; Wu, S.W. Ecology—China’s forestry reforms. Science 2007, 318, 1556–1557. [Google Scholar] [CrossRef]
- McVicar, T.R.; Li, L.; Van Niel, T.G.; Zhang, L.; Li, R.; Yang, Q.; Zhang, X.; Mu, X.; Wen, Z.; Liu, W.; Zhao, Y.; Liu, Z.; Gao, P. Developing a decision support tool for China’s re-vegetation program: Simulating regional impacts of afforestation on average annual streamflow in the Loess Plateau. For. Ecol. Manage. 2007, 251, 65–81. [Google Scholar] [CrossRef]
- Feng, X.M.; Fu, B.J.; Piao, S.; Wang, S.H.; Ciais, P.; Zeng, Z.Z.; Lu, Y.H.; Zeng, Y.; Li, Y.; Jiang, X.H.; Wu, B.F. Revegetation in China’s Loess Plateau is approaching sustainable water resource limits. Nat. Clim Chang. 2016, 6, 1019–1022. [Google Scholar] [CrossRef]
- Wang, Z.H.; Yao, W.Y.; Tang, Q.H.; Yang, E.; Kong, X.B.; Wang, L.L.; Xiao, P.Q. Spatio-temporal change analysis of leaf area index in the Loess Plateau during 2000–2014. Sci. Soil Water Conserv. 2017, 15, 71–80. [Google Scholar]
- Zhao, A.Z.; Zhang, A.B.; Liu, X.F.; Cao, S. Spatiotemporal changes of normalized difference vegetation index (NDVI) and response to climate extremes and ecological restoration in the Loess Plateau, China. Theor. Appl. Climatol. 2018, 132, 555–567. [Google Scholar] [CrossRef]
- Zhang, L.X.; Cong, Z.T.; Zhang, D.W.; Li, Q.S. Response of vegetation dynamics to climatic variables across a precipitation gradient in the Northeast China Transect. Hydrolog. Sci. J. 2017, 62, 1517–1531. [Google Scholar] [CrossRef]
- Djebou, D.C.S.; Singh, V.P.; Frauenfeld, O.W. Vegetation response to precipitation across the aridity gradient of the southwestern United states. J. Arid. Environ. 2015, 115, 35–43. [Google Scholar] [CrossRef]
- Wang, C.; Wang, S.; Fu, B.J.; Yang, L.; Li, Z.S. Soil Moisture Variations with Land Use Along the Precipitation Gradient in the North-South Transect of the Loess Plateau. Land Degrad. Dev. 2017, 28, 926–935. [Google Scholar] [CrossRef]
- Li, X.X.; Lian, J.J.; Huang, M.B. Dynamical change of fractional vegetation cover in central precipitation gradient zone of Loess Plateau. Bull. Soil Water Conserv. 2014, 34, 272–275. [Google Scholar]
- Wang, H.J.; Yang, Z.S.; Saito, Y.; Liu, J.P.; Sun, X.X.; Wang, Y. Stepwise decreases of the Huanghe (Yellow River) sediment load (1950–2005): Impacts of climate change and human activities. Glob. Planet. Change 2007, 57, 331–354. [Google Scholar] [CrossRef]
- Wang, F.; Wang, Z.M.; Yang, H.B.; Zhao, Y. Study of the temporal and spatial patterns of drought in the Yellow River basin based on SPEI. Sci. China-Earth Sci. 2018, 61, 1098–1111. [Google Scholar] [CrossRef]
- Gu, C.J.; Mu, X.M.; Gao, P.; Zhao, G.J.; Sun, W.Y. Changes in run-off and sediment load in the three parts of the Yellow River basin, in response to climate change and human activities. Hydrol. Process. 2019, 33, 585–601. [Google Scholar] [CrossRef]
- Zhou, H.J.; Van Rompaey, A.; Wang, J.A. Detecting the impact of the “Grain for Green” program on the mean annual vegetation cover in the Shaanxi province, China using SPOT-VGT NDVI data. Land Use Pol. 2009, 26, 954–960. [Google Scholar] [CrossRef]
- Miao, C.Y.; Yang, L.; Chen, X.H.; Gao, Y. The vegetation cover dynamics (1982–2006) in different erosion regions of the Yellow River Basin, China. Land Degrad. Dev. 2012, 23, 62–71. [Google Scholar] [CrossRef]
- Chen, X.J.; Mo, X.G.; Hu, S.; Liu, S.X. Contributions of climate change and human activities to ET and GPP trends over North China Plain from 2000 to 2014. J. Geogr. Sci. 2017, 27, 661–680. [Google Scholar] [CrossRef]
- Cao, R.; Jiang, W.G.; Yuan, L.H.; Wang, W.J.; Lv, Z.L.; Chen, Z. Inter-annual variations in vegetation and their response to climatic factors in the upper catchments of the Yellow River from 2000 to 2010. J. Geogr. Sci. 2014, 24, 963–979. [Google Scholar] [CrossRef]
- Zhou, J.; Jia, L.; Menenti, M. Reconstruction of global MODIS NDVI time series: Performance of Harmonic ANalysis of Time Series (HANTS). Remote Sens. Environ. 2015, 163, 217–228. [Google Scholar] [CrossRef]
- Allen, R.G.; Pereira, L.S.; Raes, D.; Smith, M. Crop evapotranspiration—Guidelines for Computing Crop Water Requirements—FAO Irrigation and Drainage Paper 56. FAO—Food and Agriculture Organization of the United Nations: Rome, Italy, 1998. [Google Scholar]
- Liu, Z.H.; Li, L.T.; Tim, R.M.; Van Niel, T.G.; Yang, Q.K.; Li, R. Introduction of the Professional Interpolation Software for Meteorology Data: ANUSPLINN. Meteorol. Mon. 2008, 34, 92–100. [Google Scholar]
- McVicar, T.R.; Li, L.T.; Niel, T.G.V.; Hutchinson, M.F.; Mu, X.M.; Liu, Z.H. Spatially Distributing 21 Years of Monthly Hydrometeorological Data in China: Spatio-Temporal Analysis of FAO-56 Crop Reference Evapotranspiration and Pan Evaporation in the Context of Climate Change; CSIRO Land & Water: Canberra, Australia, 2005. [Google Scholar]
- Hutchinson, M.F. ANUSPLIN Version 4.3 User Guide; The Australian National University: Canberra, Australia, 2004. [Google Scholar]
- Gao, X.J.; Giorgi, F. Increased aridity in the Mediterranean region under greenhouse gas forcing estimated from high resolution simulations with a regional climate model. Glob. Planet. Change 2008, 62, 195–209. [Google Scholar] [CrossRef]
- Chen, J.W.; Zhang, Y.X. Discussion on relation between humidity index and aridity degree. J. Desert Res. 1996, 16, 79–82. [Google Scholar]
- Meng, M.; Ni, J.; Zhang, Z.G. Aridity index and its applications in geo-ecological study. Acta Phytoecol. Sin. 2004, 28, 853–861. [Google Scholar]
- Ouyang, Z.; Zheng, H.; Xiao, Y.; Polasky, S.; Liu, J.; Xu, W.; Wang, Q.; Zhang, L.; Xiao, Y.; Rao, E.M.; et al. Improvements in ecosystem services from investments in natural capital. Science 2016, 352, 1455–1459. [Google Scholar] [CrossRef]
- Holben, B.N. Characteristics of Maximum-Value Composite Images from Temporal Avhrr Data. Int. J. Remote Sens. 1986, 7, 1417–1434. [Google Scholar] [CrossRef]
- Xin, Z.B.; Xu, J.X.; Zheng, W. Spatiotemporal variations of vegetation cover on the Chinese Loess Plateau (1981–2006): Impacts of climate changes and human activities. Sci. China Ser. D-Earth Sci. 2008, 51, 67–78. [Google Scholar] [CrossRef]
- Miao, L.J.; Jiang, C.; Xue, B.L.; Liu, Q.; He, B.; Nath, R.; Cui, X.F. Vegetation dynamics and factor analysis in arid and semi-arid Inner Mongolia. Environ. Earth Sci. 2015, 73, 2343–2352. [Google Scholar] [CrossRef]
- Liu, Y.; Li, L.H.; Chen, X.; Zhang, R.; Yang, J.M. Temporal-spatial variations and influencing factors of vegetation cover in Xinjiang from 1982 to 2013 based on GIMMS-NDVI3g. Glob. Planet. Change 2018, 169, 145–155. [Google Scholar] [CrossRef]
- Yuan, L.H.; Jiang, W.G.; Shen, W.M.; Liu, Y.H.; Wang, W.J.; Tao, L.L.; Zheng, H.; Liu, X.F. The spatio-temporal variations of vegetation cover in the Yellow River Basin from 2000 to 2010. Acta Ecol. Sin. 2013, 33, 7798–7806. [Google Scholar]
- Zhao, H.F.; He, H.M.; Wang, J.J.; Bai, C.Y.; Zhang, C.J. Vegetation Restoration and Its Environmental Effects on the Loess Plateau. Sustainability 2018, 10, 17. [Google Scholar] [CrossRef]
- Fan, X.; Ma, Z.; Yang, Q.; Han, Y.; Mahmood, R.; Zheng, Z. Land use/land cover changes and regional climate over the Loess Plateau during 2001–2009. Part I: Observational evidence. Clim. Change 2014, 129, 427–440. [Google Scholar] [CrossRef]
- Jia, X.X.; Wang, Y.Q.; Shao, M.A.; Luo, Y.; Zhang, C.C. Estimating regional losses of soil water due to the conversion of agricultural land to forest in China’s Loess Plateau. Ecohydrology 2017, 10, e1851. [Google Scholar] [CrossRef]
- Chen, L.D.; Huang, Z.L.; Gong, J.; Fu, B.J.; Huang, Y.L. The effect of land cover/vegetation on soil water dynamic in the hilly area of the loess plateau, China. Catena 2007, 70, 200–208. [Google Scholar] [CrossRef]
- Lin, K.H.; Ye, G.F. Review of the stability studies on plantation ecosystem. J. Southwest Fore. Coll. 2010, 30, 88–94. [Google Scholar]
- Rodriguez-Iturbe, I.; Porporato, A.; Laio, F.; Ridolfi, L. Intensive or extensive use of soil moisture: Plant strategies to cope with stochastic water availability. Geophys. Res. Lett. 2001, 28, 4495–4497. [Google Scholar] [CrossRef] [Green Version]
- Cleland, E.E.; Chuine, I.; Menzel, A.; Mooney, H.A.; Schwartz, M.D. Shifting plant phenology in response to global change. Trends Ecol. Evol. 2007, 22, 357–365. [Google Scholar] [CrossRef]
- Gao, J.; Jiao, K.W.; Wu, S.H.; Ma, D.Y.; Zhao, D.S.; Yin, Y.H.; Dai, E.F. Past and future effects of climate change on spatially heterogeneous vegetation activity in China. Earth Future 2017, 5, 679–692. [Google Scholar] [CrossRef] [Green Version]
- Zhang, H.Y.; Fang, N.F.; Shi, Z.H. Spatio-temporal patterns for the NDVI and its responses to climatic factors in the Loess Plateau. Acta Ecol. Sin. 2016, 36, 3960–3968. [Google Scholar]
- Porporato, A.; Laio, F.; Ridolfi, L.; Rodriguez-Iturbe, I. Plants in water-controlled ecosystems: active role in hydrologic processes and response to water stress: III. Vegetation water stress. Adv. Water Resour. 2001, 24, 725–744. [Google Scholar] [CrossRef]
- Lv, Y.H.; Hu, J.; Sun, F.X.; Zhang, L.W. Water retention and hydrological regulation: harmony but not the same in terrestrial hydrological ecosystem services. Acta Ecol. Sin. 2015, 35, 5191–5196. [Google Scholar]
- Brooks, P.D.; Troch, P.A.; Durcik, M.; Gallo, E.; Schlegel, M. Quantifying regional scale ecosystem response to changes in precipitation: Not all rain is created equal. Water Resour. Res. 2011, 47, W00J08. [Google Scholar] [CrossRef]
- Pei, X.F.; Gan, Z.M.; Liu, X. A study on the problem of returning farmland to forests in Yellow River Basin. J. Arid Land Resour. Environ. 2003, 17, 98–102. [Google Scholar]
- Cao, S.X.; Wang, X.Q.; Song, Y.Z.; Chen, L.; Feng, Q. Impacts of the Natural Forest Conservation Program on the livelihoods of residents of Northwestern China: Perceptions of residents affected by the program. Ecol. Econ. 2010, 69, 1454–1462. [Google Scholar] [CrossRef]
- Zhang, J.; Cheng, P.; Zhang, R.; Yan, M.F.; Ren, H.R. Influence of human activities on vegetation cover variations on Shanxi Plateau. J. Northwest Norm. Univ. (Nat. Sci.) 2016, 52, 118–124. [Google Scholar]
- Wang, Y.H.; Yu, P.T.; Xiong, W.; Shen, Z.X.; Guo, M.C.; Shi, Z.J.; Du, A.; Wang, L.M. Water-yield reduction after afforestation and related processes in the semiarid Liupan Mountains, Northwest China. J. Am. Water Resour. Assoc. 2008, 44, 1086–1097. [Google Scholar] [CrossRef]
- Jiao, Y.; Lei, H.M.; Yang, D.W.; Huang, M.Y.; Liu, D.F.; Yuan, X. Impact of vegetation dynamics on hydrological processes in a semi-arid basin by using a land surface-hydrology coupled model. J. Hydrol. 2017, 551, 116–131. [Google Scholar] [CrossRef]
- Jin, Z.; Dong, Y.S.; Wang, Y.Q.; Wei, X.R.; Wang, Y.F.; Cui, B.L.; Zhou, W.J. Natural vegetation restoration is more beneficial to soil surface organic and inorganic carbon sequestration than tree plantation on the Loess Plateau of China. Sci. Total Environ. 2014, 485, 615–623. [Google Scholar] [CrossRef] [Green Version]
- Li, J.; Li, Z.B.; Guo, M.J.; Li, P.; Cheng, S.D.; Yuan, B. Effects of vegetation restoration on soil physical properties of abandoned farmland on the Loess Plateau, China. Environ. Earth Sci. 2018, 77, 205. [Google Scholar] [CrossRef]
- Gu, C.J.; Mu, X.M.; Gao, P.; Zhao, G.J.; Sun, W.Y.; Tatarko, J.; Tan, X.J. Influence of vegetation restoration on soil physical properties in the Loess Plateau, China. J. Soils Sediments 2019, 19, 716–728. [Google Scholar] [CrossRef]
- Su, B.Q.; Shangguan, Z.P. Decline in soil moisture due to vegetation restoration on the Loess Plateau of China. Land Degrad. Dev. 2019, 30, 290–299. [Google Scholar] [CrossRef]
- Liang, H.B.; Xue, Y.Y.; Li, Z.S.; Wang, S.; Wu, X.; Gao, G.Y.; Liu, G.H.; Fu, B.J. Soil moisture decline following the plantation of Robinia pseudoacacia forests: Evidence from the Loess Plateau. For. Ecol. Manage. 2018, 412, 62–69. [Google Scholar] [CrossRef]
- Nan, G.W.; Wang, N.; Jiao, L.; Zhu, Y.M.; Sun, H. A new exploration for accurately quantifying the effect of afforestation on soil moisture: A case study of artificial Robinia pseudoacacia in the Loess Plateau (China). For. Ecol. Manage. 2019, 433, 459–466. [Google Scholar] [CrossRef]
- Chen, L.D.; Wang, J.P.; Wei, W.; Fu, B.J.; Wu, D.P. Effects of landscape restoration on soil water storage and water use in the Loess Plateau Region, China. For. Ecol. Manage. 2010, 259, 1291–1298. [Google Scholar] [CrossRef] [Green Version]
- Cao, S.X.; Chen, L.; Yu, X.X. Impact of China’s Grain for Green Project on the landscape of vulnerable arid and semi-arid agricultural regions: a case study in northern Shaanxi Province. J. Appl. Ecol. 2009, 46, 536–543. [Google Scholar] [CrossRef]
- McDowell, N.G.; Allen, C.D. Darcy’s law predicts widespread forest mortality under climate warming. Nat. Clim. Chang. 2015, 5, 669–672. [Google Scholar] [CrossRef]
Figure 1.
The position of the upper and middle Yellow River Basin and the distribution of five sub-regions classified by the aridity index (AI).
Figure 1.
The position of the upper and middle Yellow River Basin and the distribution of five sub-regions classified by the aridity index (AI).

Figure 2.
Comparison between the original and reconstructed Leaf Area Index (LAI) time-series during 2000–2015.
Figure 2.
Comparison between the original and reconstructed Leaf Area Index (LAI) time-series during 2000–2015.

Figure 3.
Distributions of land use patterns: (a) unconverted land use types; (b) converted land use types from cropland.
Figure 3.
Distributions of land use patterns: (a) unconverted land use types; (b) converted land use types from cropland.

Figure 4.
The mean value of LAI during 2000–2015 in the upper and middle reaches. (a) Distributions of mean LAI; (b) Mean LAI for unconverted land use types; (c) Mean LAI for converted land use types.
Figure 4.
The mean value of LAI during 2000–2015 in the upper and middle reaches. (a) Distributions of mean LAI; (b) Mean LAI for unconverted land use types; (c) Mean LAI for converted land use types.

Figure 5.
The trends in the LAI values over the entire study region and five sub-regions with a different aridity index from 2000–2015.
Figure 5.
The trends in the LAI values over the entire study region and five sub-regions with a different aridity index from 2000–2015.

Figure 6.
The spatial variations of LAI over 2000-2015: (a) absolute change rate (); (b) relative change ( ).
Figure 6.
The spatial variations of LAI over 2000-2015: (a) absolute change rate (); (b) relative change ( ).

Figure 7.
LAI change rates for unconverted types and converted types in AI sub-regions: (a1) and (b1) are absolute change rate (1/yr) for the unconverted and converted types, respectively; (a2) and (b2) are relative change rate (%/yr) for the unconverted and converted types, respectively.
Figure 7.
LAI change rates for unconverted types and converted types in AI sub-regions: (a1) and (b1) are absolute change rate (1/yr) for the unconverted and converted types, respectively; (a2) and (b2) are relative change rate (%/yr) for the unconverted and converted types, respectively.

Figure 8.
The stabilities of the LAI changed in the upper and middle reaches during 2000–2015. (a) Distributions of coefficient of variation (); (b) for unconverted land use types; (c) for converted land use types.
Figure 8.
The stabilities of the LAI changed in the upper and middle reaches during 2000–2015. (a) Distributions of coefficient of variation (); (b) for unconverted land use types; (c) for converted land use types.

Figure 9.
The sustainability of LAI changed in the upper and middle reaches during 2000–2015. (a) Distributions of Hurst Index; (b) Hurst Index for unconverted land use types; (c) Hurst Index for converted land use types.
Figure 9.
The sustainability of LAI changed in the upper and middle reaches during 2000–2015. (a) Distributions of Hurst Index; (b) Hurst Index for unconverted land use types; (c) Hurst Index for converted land use types.


Table 1.
Area proportions of land use types across different AI sub-regions.
| Land use types | AI = 1–2 | AI = 2–3 | AI = 3–4 | AI = 4–5 | AI > 5 | |
|---|---|---|---|---|---|---|
| Unconverted types | F | 42% | 48% | 7% | 2% * | 1% * |
| S | 34% | 41% | 15% | 4% | 6% * | |
| G | 21% | 33% | 20% | 8% | 18% | |
| C | 20% | 49% | 15% | 5% | 11% | |
| Converted from cropland | C → F | 49% | 45% | 3% * | 1% * | 2% * |
| C → S | 29% | 55% | 12% | 3% * | 2% * | |
| C → G | 9% | 62% | 22% | 3% | 3% * | |
* The corresponding land use type in the AI sub-region was not analyzed.
Table 2.
The percentage of LAI in conversion types to cropland.
| Conversion Types | AI = 1–2 | AI = 2–3 | AI = 3–4 | AI = 4–5 | AI > 5 |
|---|---|---|---|---|---|
| C → F | 134% | 152% | - | - | - |
| C → S | 117% | 110% | 90.9% | - | - |
| C → G | 90.7% | 83.5% | 79.1% | 89.6% | - |
Table 3.
The percentage of LAI of conversion types to unconverted types.
| Conversion Types | AI = 1–2 | AI = 2–3 | AI = 3–4 | AI = 4–5 | AI > 5 |
|---|---|---|---|---|---|
| C → F | 61.7% | 56.4% | - | - | - |
| C → S | 66.8% | 59.7% | 62.1% | - | - |
| C → G | 56.6% | 70.9% | 85.2% | 107% | - |
Table 4.
LAI variations of different land use types during 2000–2015.
| Land use types | β (1/yr) | R (%/yr) | |
|---|---|---|---|
| Unconverted types | Forestland | 0.075 | 2.1 |
| Shrubland | 0.053 | 2.3 | |
| Grassland | 0.027 | 2.1 | |
| Cropland | 0.042 | 2.9 | |
| Converted from Cropland | Forestland | 0.079 | 3.5 |
| Shrubland | 0.069 | 3.9 | |
| Grassland | 0.046 | 3.8 | |
© 2019 by the authors. Licensee MDPI, Basel, Switzerland. This article is an open access article distributed under the terms and conditions of the Creative Commons Attribution (CC BY) license (http://creativecommons.org/licenses/by/4.0/).
Share and Cite
MDPI and ACS Style
Wang, W.; Sun, L.; Luo, Y. Changes in Vegetation Greenness in the Upper and Middle Reaches of the Yellow River Basin over 2000–2015. Sustainability 2019, 11, 2176. https://0-doi-org.brum.beds.ac.uk/10.3390/su11072176
AMA Style
Wang W, Sun L, Luo Y. Changes in Vegetation Greenness in the Upper and Middle Reaches of the Yellow River Basin over 2000–2015. Sustainability. 2019; 11(7):2176. https://0-doi-org.brum.beds.ac.uk/10.3390/su11072176
Chicago/Turabian StyleWang, Wei, Lin Sun, and Yi Luo. 2019. "Changes in Vegetation Greenness in the Upper and Middle Reaches of the Yellow River Basin over 2000–2015" Sustainability 11, no. 7: 2176. https://0-doi-org.brum.beds.ac.uk/10.3390/su11072176
Note that from the first issue of 2016, this journal uses article numbers instead of page numbers. See further details here.