The Role of Hydrogen in the Ecological Benefits of Ultra Low Sulphur Diesel Production and Use: An LCA Benchmark

1
Air Liquide Forschung und Entwicklung GmbH, Gwinnerstrasse 27–33, 60388 Frankfurt am Main, Germany
2
Industrial Design Engineering, Design for Sustainability, Delft University of Technology, Landbergstraat 15, NL 2628CE Delft, The Netherlands
*
Author to whom correspondence should be addressed.
Sustainability 2019, 11(7), 2184; https://0-doi-org.brum.beds.ac.uk/10.3390/su11072184
Submission received: 21 February 2019
/
Revised: 25 March 2019
/
Accepted: 2 April 2019
/
Published: 11 April 2019
(This article belongs to the Special Issue Environmental Life Cycle Assessment)
Abstract
:Desulphurization of oil-based fuels is common practice to mitigate the ecological burden to ecosystems and human health of SOx emissions. In many countries, fuels for vehicles are restricted to 10 ppm sulphur. For marine fuels, low sulphur contents are under discussion. The environmental impact of desulphurization processes is, however, quite high: (1) The main current source for industrial hydrogen is Steam Methane Reforming (SMR), with a rather high level of CO2 emissions, (2) the hydrotreating process, especially below 150 ppm, needs a lot of energy. These two issues lead to three research questions: (a) What is the overall net ecological benefit of the current desulphurization practice? (b) At which sulfphur ppm level in the fuel is the additional ecological burden of desulphurization higher than the additional ecological benefit of less SOx pollution from combustion? (c) To what extent can cleaner hydrogen processes improve the ecological benefit of diesel desulphurization? In this paper we use LCA to analyze the processes of hydrotreatment, the recovery of sulphur via amine treating of H2S, and three processes of hydrogen production: SMR without Carbon Capture and Sequestration (CCS), SMR with 53% and 90% CCS, and water electrolysis with two types of renewable energy. The prevention-based eco-costs system is used for the overall comparison of the ecological burden and the ecological benefit. The ReCiPe system was applied as well but appeared not suitable for such a comparison (other damage-based indicators cannot be applied either). The overall conclusion is that (1) the overall net ecological benefit of hydrogen-based Ultra Low Sulphur Diesel is dependent of local conditions, but is remarkably high, (2) desulphurization below 10 ppm is beneficial for big cities, and (3) cleaner production of hydrogen reduces eco-cost by a factor 1.8–3.4.
Keywords:
Ultra Low Sulfur Diesel; ULSD; desulphurization; hydrogen; hydrotreating; SMR; CCS; electrolysis; LCA; eco-costs1. Introduction
1.1. SOx Pollution
During combustion of fuels, sulphur is transformed to a mixture of SO2 and SO3. Emissions of these exhaust gases into the atmosphere have potentially harmful effects on human health as well as natural ecosystems. Negative effects on human health are respiratory diseases [1,2] as well as cardiovascular diseases related to secondary fine particles PM2.5 [3,4,5]. Negative effects on natural ecosystems are the acidification of water and soil by acid rain: Many species cannot live in an environment at a lower pH level (e.g., vascular plants, trees, fish) [6,7]. Due to carbonate buffering, some areas are less prone to soil acidification than others [8,9,10]. There is a growing concern about the negative effects of acidification of the oceans [11].
1.2. Desulphurization of Crude Oil
Crude oil, used to produce various kinds of transportation and non-transportation liquid fuels, contains sulphur under the form of thiols, sulphides, disulphides, and thiophenes. The nature and amount of S-containing compounds vary significantly from reservoir to reservoir. Since 1985, the average sulphur content of the crude oils processed in European refineries has fluctuated at around 1.0% to 1.1%, with regional averages ranging from 0.6% to 1.2% [12]. Heavier oils tend to contain more impurities and thus extra refining resources are needed. Examples are deposits of northern Alberta (S content > 2%) and Mexican Altamira heavy crude oil (S content up to 6%) [13,14].
Hydrotreating (HDT) is predominantly adopted in refinery to remove sulphur (and other undesired elements—such as nitrogen, oxygen, halides, and metals—that may deactivate process catalysts) from various oil fractions, and to saturate olefinic and aromatic molecules for reducing gum formation in fuels. In particular the removal of sulphur is called hydrodesulphurization (HDS). Here sulphur is catalytically converted with hydrogen into H2S. Hydrogen sulphide is then recovered from the gases leaving the hydrotreater via absorption with amines and stripping. The last step is the sulphur recovery unit (SRU), where the elemental sulphur is recovered [12].
Due to increasingly stringent environmental regulations, the refinery catalytic reforming process cannot supply enough H2 to produce Ultra Low Sulphur Diesel (ULSD). Extra hydrogen is thus supplied to the refineries by gas industries or produced on purpose by the refineries. The nowadays largely predominant production route of hydrogen is steam methane reforming (SMR), mainly from natural gas [15]. Its environmental impact is dominated by direct CO2 emissions, although the impact of the natural gas supply chain might also play a substantial role. Alternative and more environmentally friendly technologies for hydrogen production are available but not yet applied extensively at large scale. In this paper, we considered SMR with Carbon Capture and Sequestration (CCS) [16,17] and alkaline water electrolysis (AEL) with renewable electricity [18].
Life Cycle Assessment (LCA) is an internationally standardized methodology (ISO 14040:2006 and ISO 14044:2006) to assess the environmental impact associated with a product by considering the required resources and released emissions in all the stages of its lifecycle.
The literature on LCAs of hydrotreating is rather limited. We found only three detailed and well documented peer reviewed papers [19,20,21]. Burgess and Brennan [19] assessed the environmental and economic burdens incurred in desulphurization of a gas oil feed with 2.19% S to 0.05% S diesel. A detailed life-cycle inventory list was made. Normalization was applied to reduce the various impact category results into a common environmental score. The authors concluded that hydrotreatment is the major contributor to both the environmental and economic burden. However, only well-established technologies for hydrogen production—catalytic reformer and SMR—were compared. The sulphur content in the feedstock was found to affect the balance between environmental burdens and benefits of desulphurization. A more systematic investigation of the effect of the sulphur concentration, not only in the feedstock but also in diesel, was published recently by Wu et al. [20,21]. Sulphur concentrations in diesel in the range of ULSD were included in these studies. The authors identified the reduction of hydrogen consumption as the most efficient way to reduce both the environmental impact and operating cost, but the impact of different technologies for hydrogen production was not investigated. Wu et al. suggested that, from a purely environmental point of view, the S content should not be decreased below 12 ppm. A combined environmental–economic approach indicates a much higher S concentration of ca. 100 ppm as the optimum solution. The environmental conclusions relied on one subsystem of the Eco-indicator 99 (a damage approach, which has been replaced now by the ReCiPe 2016 indicator).
An increasing number of papers dealing with comparative LCA analysis of the various production routes of hydrogen can be found in the literature. Most of them are exclusively (or almost exclusively) focused on C-footprint results. Only a few give the full range of the other emissions as well (acidification, eutrophication, et cetera). SMR, the current state-of-art technology for hydrogen production, is almost always taken as the reference case. A very comprehensive and recent review on this topic is given by Valente et al. [22]. Here 139 original case studies of renewable hydrogen, published until April 2016, were counted (nearly all of them on carbon footprint only). About half of the samples could be harmonized, leading to a rather consistent view on various routes of hydrogen production: Thermochemical processes (SMR, autothermal reforming, partial oxidation, gasification), electrochemical processes (water electrolysis—PEM, alkaline, and high temperature) and biological processes (fermentation of biomass). Overall, water electrolysis with wind and hydropower allows producing H2 with the lowest C-footprint (below 1 kg CO2eq/kg H2) [23]. Mehmeti et al. [24] found electricity to be the major contributor to the environmental impact of hydrogen from electrolytic processes not only in terms of global warming but also for all the considered midpoint impact categories. Chui et al. [25] applied an analytic hierarchy method to rank 11 different pathways of H2 production systems based on two main technologies: SMR and water electrolysis, with nine different kinds of renewable and fossil electricity. Again, water electrolysis with hydroelectric power was found as the most preferred pathway. Life-cycle assessment studies for by-product hydrogen, such as chlor-alkali electrolysis and steam cracking of natural gas liquids [26,27], also show a very significant reduction of GHG emissions compared to SMR. Even in the case of the most convenient scenario, the C-footprint of hydrogen could not reach values below production of hydrogen from water electrolysis.
1.3. Knowledge Gap, Research Questions, and the Structure of This Paper
While several subprocesses, such as hydrogen production and HDT, have been studied, LCA benchmarking on the combined subprocesses is not available yet. Moreover, the environmental burdens of the desulphurization processes have never been compared to the environmental gains of the reduction of the SO2 emissions.
The research questions (RQs) of this paper are:
- RQ 1.
- What is the overall net ecological benefit of the current desulphurization practice (ULSD via H2 from SMR)?
- RQ 2.
- At which S ppm level in fuel does the additional ecological burden of desulphurization become higher than the additional ecological benefit of less SOx pollution from combustion?
- RQ 3.
- To what extent can cleaner hydrogen processes improve the overall net ecological benefit of diesel desulphurization?
This paper first describes the product systems and the sources of LCI (Life Cycle Inventory) data (Section 2.1). Then the indicators, which are applied for the comparison of the ecological burden and the ecological benefit, are given in Section 2.2. The results of the analyses are in Section 3: First the comparison of the ecological benefit (i.e., the avoided SO2 emissions) and the ecological burden of the current system (Section 3.1), then the comparison with future improvements for the production of hydrogen (Section 3.2). In the Discussion we address the issue of the local vulnerability for SO2 (Section 4.1), as well as the issue of the source of electricity (Section 4.2) and economic feasibility (Section 4.3). The research questions are answered in the conclusion (Section 5).
2. Methods
2.1. The System under Study
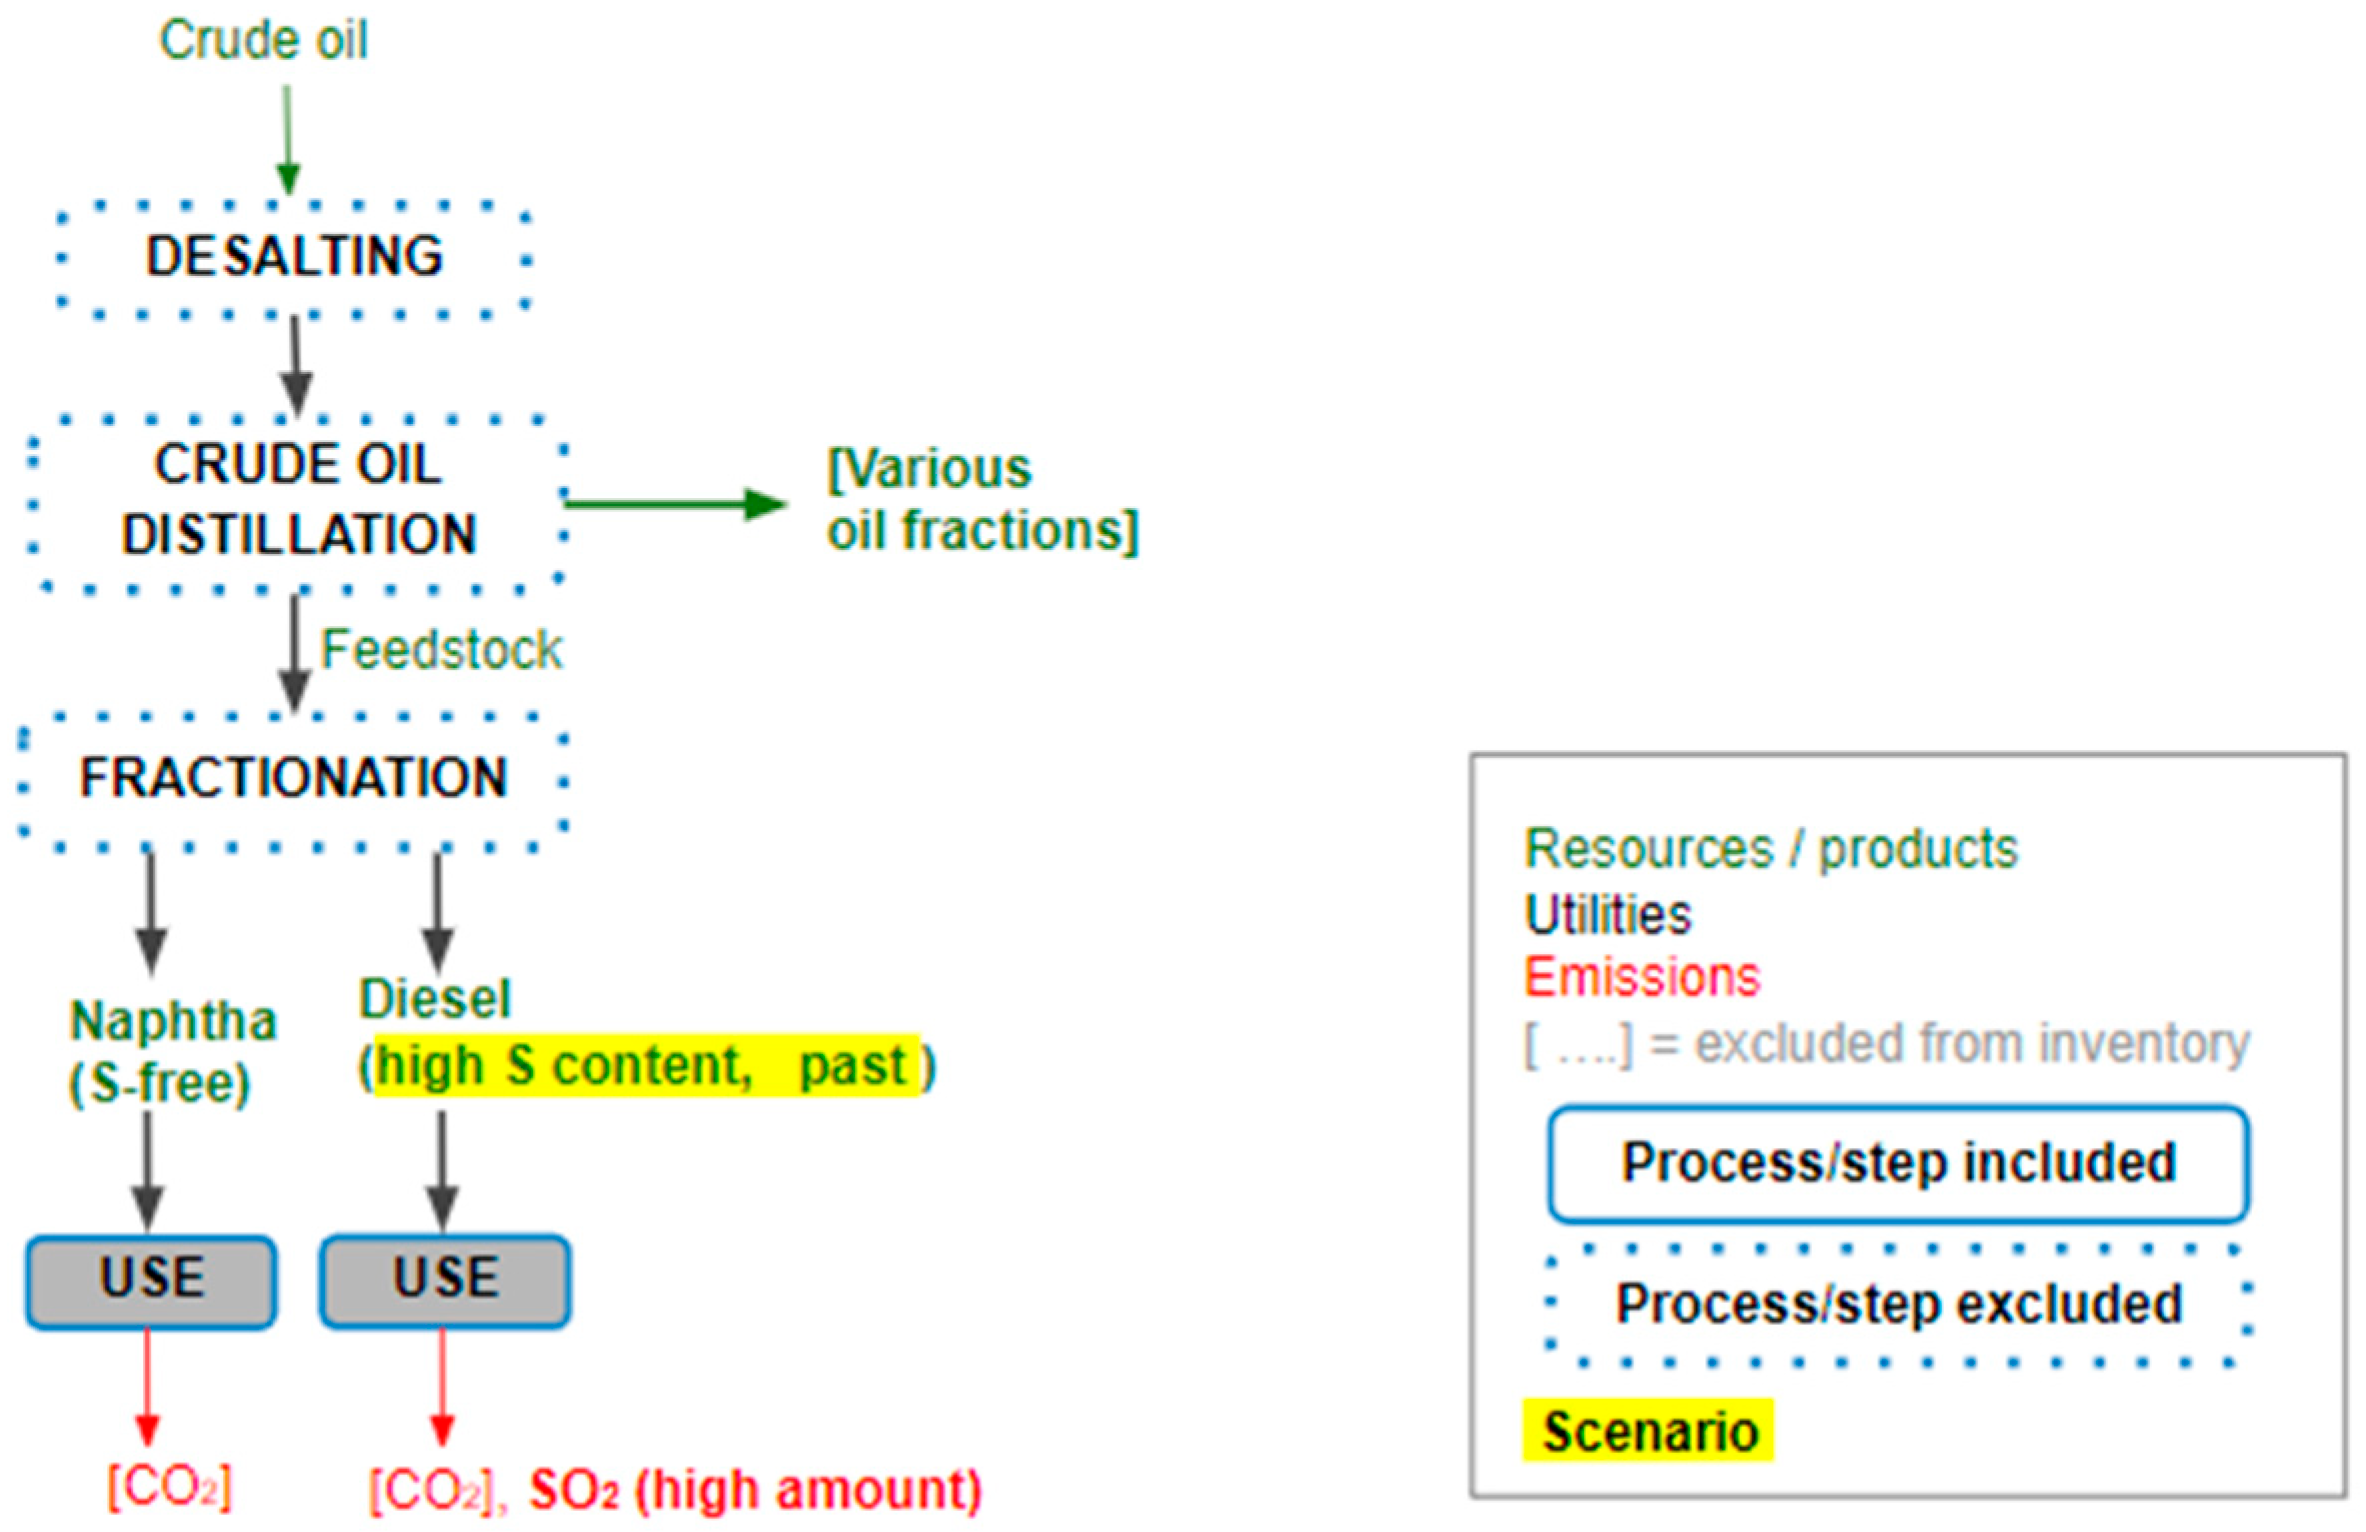
Our starting scenario (‘the past’) is depicted in Figure 1: Without desulphurization of diesel all the sulphur in the fuel ended up in nature.
As a consequence, we calculate the reduction of sulphur in the fuel as ‘avoided pollution’. We call this avoided pollution ‘ecological benefit’. This benefit is then compared to the additional environmental burden (consumed resources and emissions) required to desulphurize diesel. We call those burdens the ‘ecological burden’ of the required processes for desulphurization. In other words, the ‘ecological benefit’ as well as the ‘ecological burden’ refer to the comparison between the past scenario (without desulphurization) and the present or the future scenarios (with desulphurization).
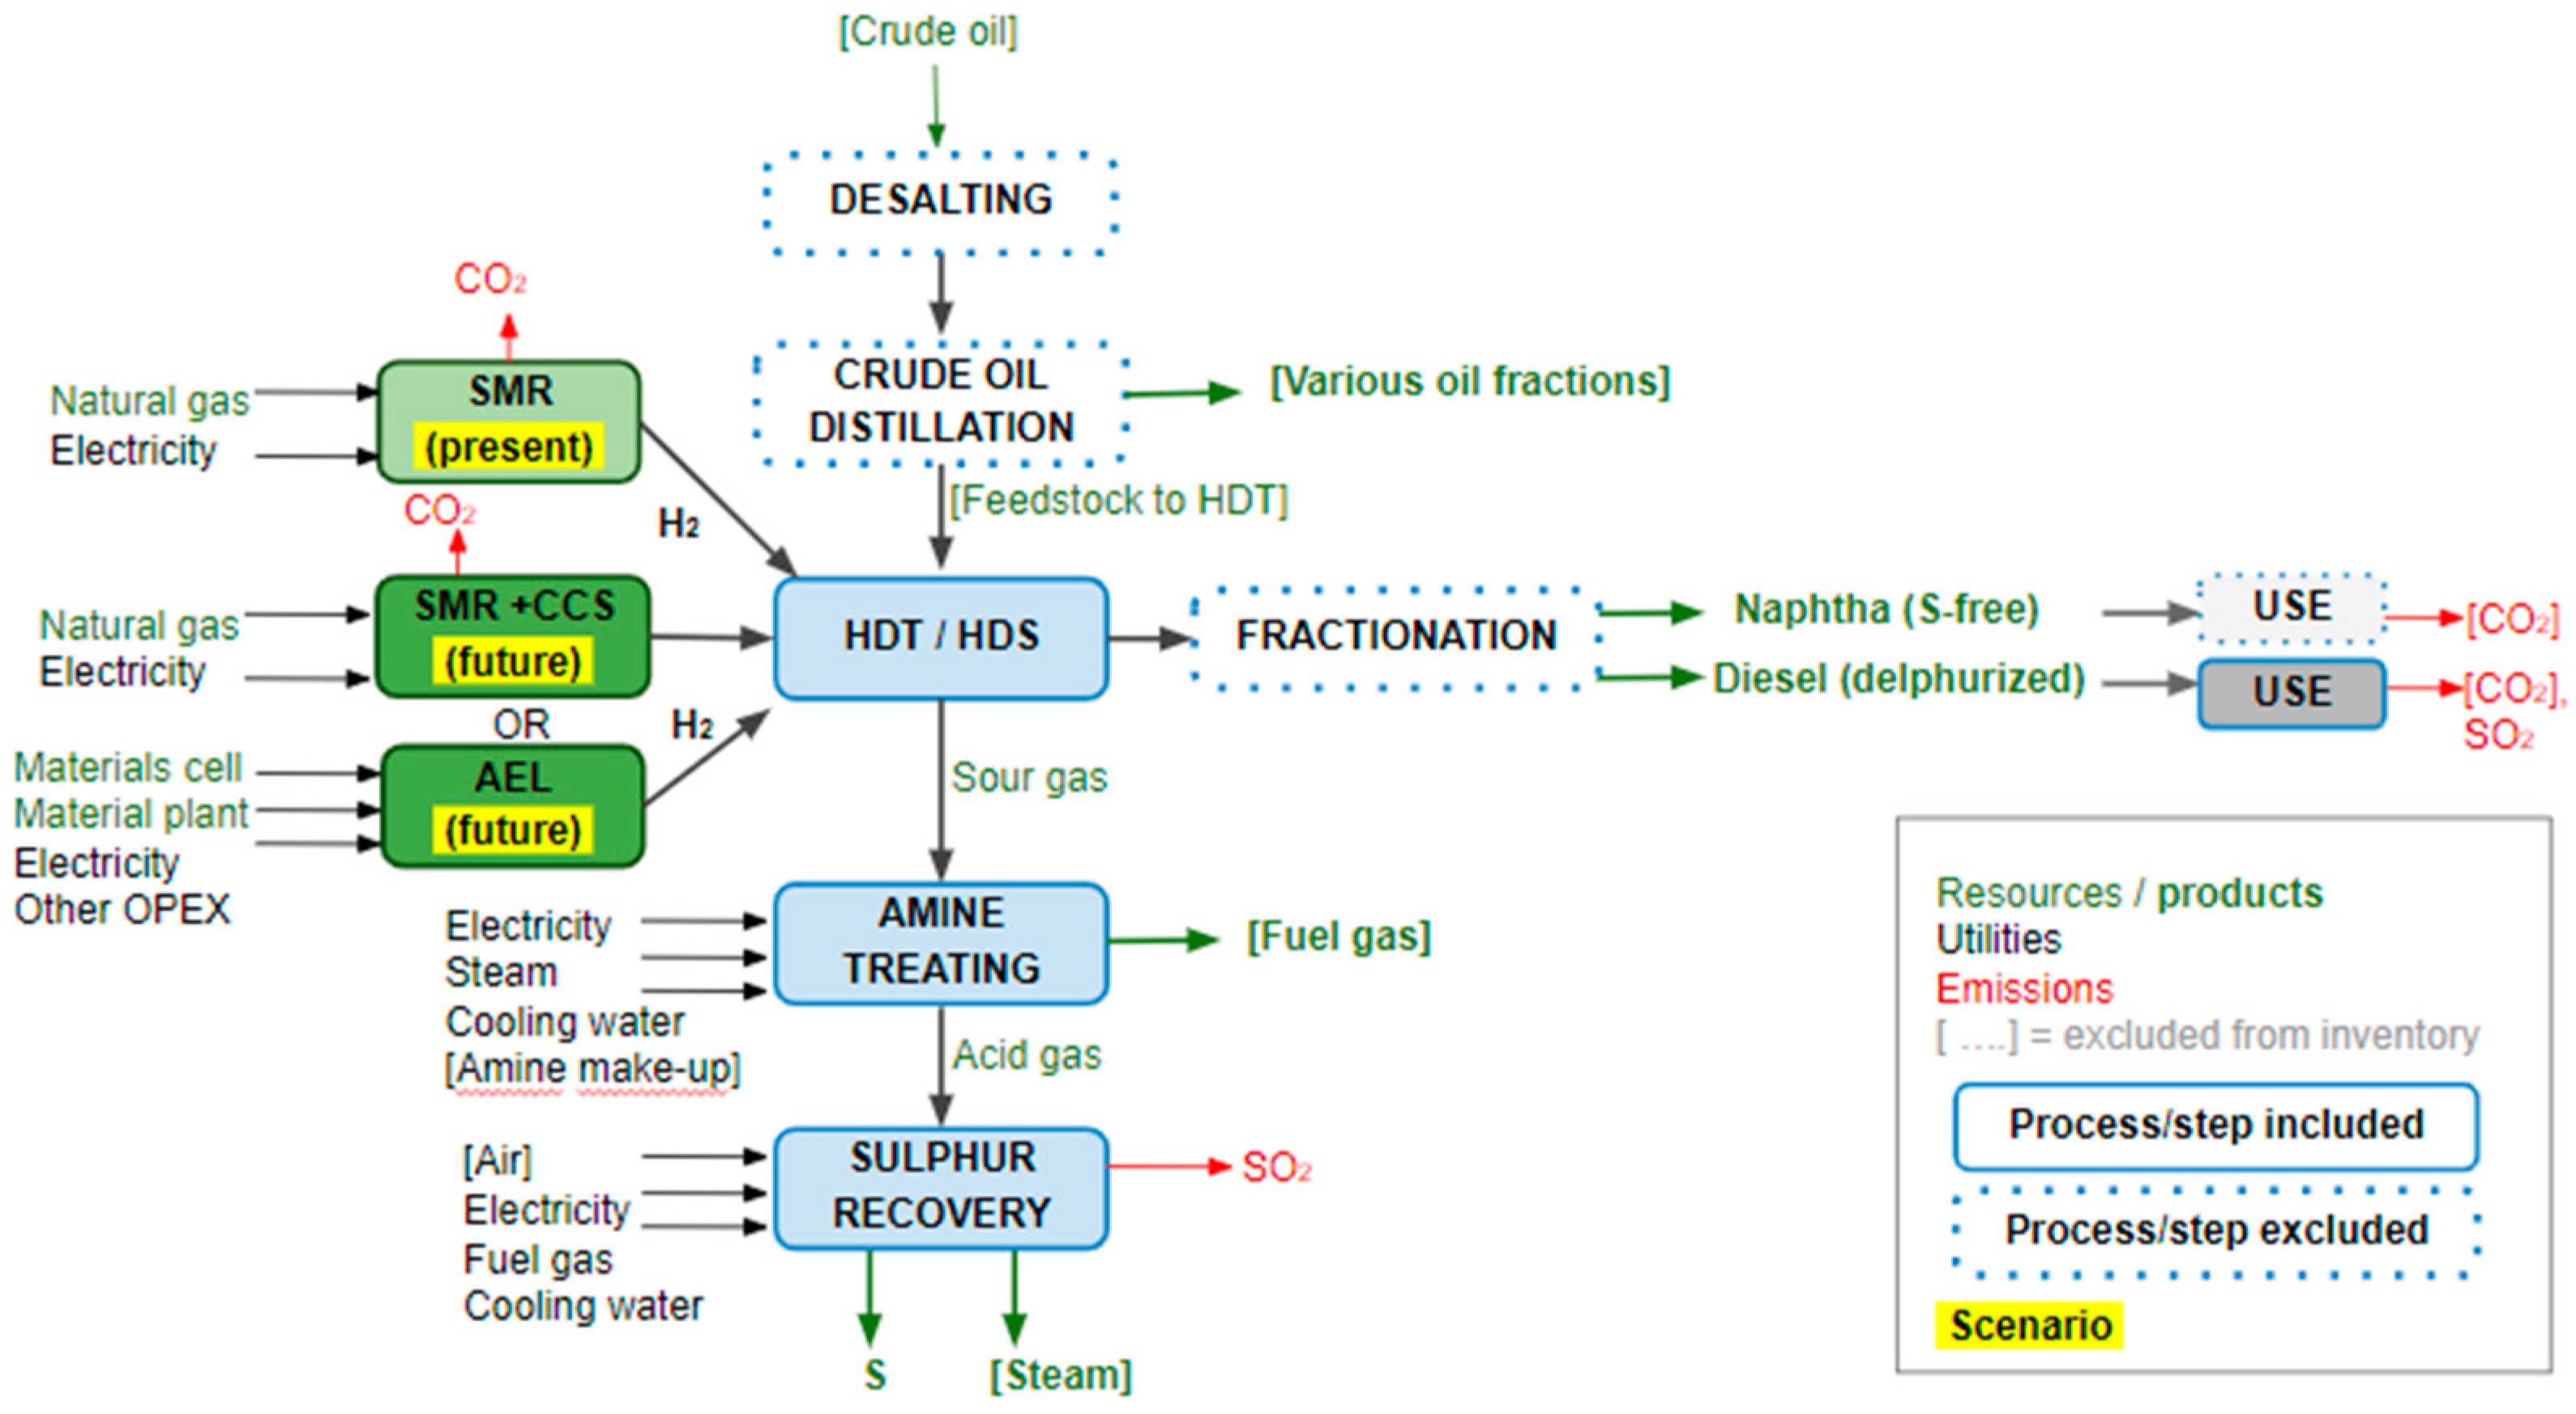
In our base case (‘the present’ scenario) we add the HDT/HDS unit in between the distillation of crude oil and the fractionation step (Figure 2). The HDT/HDS unit has two products: (1) The feed to the fractionation step, which gives S-free naphtha and desulphurized diesel, and (2) the H2S-containing gaseous stream. This sour gas is treated with amines. Finally, sulphur is recovered (99.8% typical recovery efficiency) via the Claus process (Sulphur Recovery Unit, SRU).
The HDT/HDS process requires hydrogen. In the ‘present scenario’ hydrogen is produced via SMR (without CCS), in the ‘future scenario’ via SMR + CCS or via alkaline water electrolysis (AEL).
Extraction, desalting, and distillation of crude oil are outside the boundary of the system under study. These processes have been excluded from the analysis since they are identical in all explored scenarios. For the same reason, the CO2 emissions from the combustion of diesel and naphtha products in the use phase have been excluded. Other processes excluded from the analysis are production/disposal of catalysts, treatment of sour water, amine make-up for the amine-treating process, construction and dismantling of operating units, as well as the use of recovered sulphur or other co-products (steam from sulphur recovery unit and fuel gas from amine treating).
For the HDT process, LCI data were taken from a recent publication by Wu et al. [20]. This includes two series of simulation data referring to an industrial HDT process with a processing capacity of 381 ton/h feed (1.57 wt% S, 155 ppm N) and a combined production of 334 ton/h diesel (40 ppm S, 15 ppm N) and 41 ton/h naphtha (<10 ppm S, <5 ppm N). The first series considers a feedstock with variable S content (from 1.3 to 1.8 wt%) which is converted into diesel with a constant S content of 38 ppm wt and sulphur-free naphtha. The second series refers to a feedstock with constant S content (1.57 wt% S) which is used to produce diesel with S content variable between 7 and 319 ppm wt and sulphur-free naphtha.
The required utilities for the HDT process are listed in Table S1 of the Supplementary Materials.
These data were complemented by typical average consumption and emissions figures for (1) the amine treating unit and (2) the Sulphur Recovery Unit (SRU). Both set of data (see Table S2 of the Supplementary Materials) were derived from Barthe et al. [12].
For the hydrogen production via SMR technology, with and without CCS, LCI data were taken from the IEAGHG Technical Report 2017-2 [16]. Among the six cases investigated in that study we selected the following three:
- Base case: SMR (9.0 ton/h H2) without CCS. The plant is equipped with feedstock pretreatment, pre-reformer, primary reformer, high temperature shift, and pressure swing adsorber (PSA) for H2-purification. Excess steam is converted into electricity, which is used to satisfy the plant needs. The excess power is exported to the grid.
- Case 2B: SMR with CO2 capture from the PSA tail gas using cryogenic and membrane separation technology (53% CO2 capture). Nowadays, there are several IG companies who have developed the cryogenic separation technology. In particular it should be noted that the Port-Jérôme project is the first large scale pilot demonstration of the CRYOCAP™ technology to capture CO2 from the hydrogen plants.
- Case 3: SMR with CO2 capture from the SMR’s flue gas using MEA (monoethanolamine) for chemical absorption (90% CO2 capture).
Details for SMR with and without CCS are given in Table S3 of the Supplementary Materials.
For hydrogen production via water electrolysis, LCI data from a recent publication by Koj et al. were used [28]. This refers to a pressurized 6 MW alkaline electrolysis (AEL) system with a novel Zirfon membrane, studied in a recent European research project [29]. Beside the electrolyser itself, auxiliary system components (balance of plant) were included. The complete LCI and associated eco-costs are in Table S4 of the Supplementary Materials.
The data listed above were complemented with data of standard background systems from the Ecoinvent database (version 3.4) and from the Idematapp2018 database of the Delft University of Technology. Selected key data are provided in Table S5 of the Supplementary Materials.
2.2. The Choice of the LCA Indicators
Since the common denominator of the three research questions is that a trade-off of different aspects (i.e., different ‘midpoints’ in LCA) must be made, it was decided to apply two ‘endpoint’ indicators in LCA: The damage-based ‘ReCiPe 2016 Endpoint (H) V1.02’ (in short: ReCiPe) system, and the prevention-based eco-costs 2017 V1.4 (in short: eco-costs) system.
The ReCiPe system [30] is one of the most applied damage-based indicator systems; however, it has two general disadvantages: (1) The pathway in the computer calculation is rather long and has many assumptions, making such a calculation rather inaccurate [31], and (2) it ends up with three endpoints, i.e., ‘damage to human health’, ‘damage to ecosystems’, and ‘damage to resource availability’. Adding up these three damage endpoints can only be done by either an extra monetizing step (which is rather problematic) or subjective weighting panels. Due to the subjectivity, the use of panels is discouraged by the ISO 14044, Section 4.4.5. Note that this issue is not restricted to ReCiPe: Other damage-based systems (e.g., IMPACT 2002+) suffer from this issue as well.
The eco-costs 2017 [32,33] has the advantage of a much shorter pathway from midpoint to endpoint level and has the advantage of one endpoint (one single indicator). The eco-costs endpoint is the total score for the eco-costs of carbon footprint, plus the eco-costs of human toxicity, plus the eco-costs of eco-toxicity, plus the eco-costs of resource scarcity [34]. See Appendix A for a short description. Especially in comparisons such as in this paper (e.g., the CO2 emissions of H2 production versus the avoided SO2 emissions), one single (endpoint) indicator seems to be indispensable. The eco-costs system is not only used in LCA benchmarking. It has been recently also used in slightly different applications, such as calculations on so-called external costs [35] and calculations on eco-efficiency [36].
3. Results
3.1. A Comparison of the Ecological Burden and the Ecological Benefit of the Present Production System
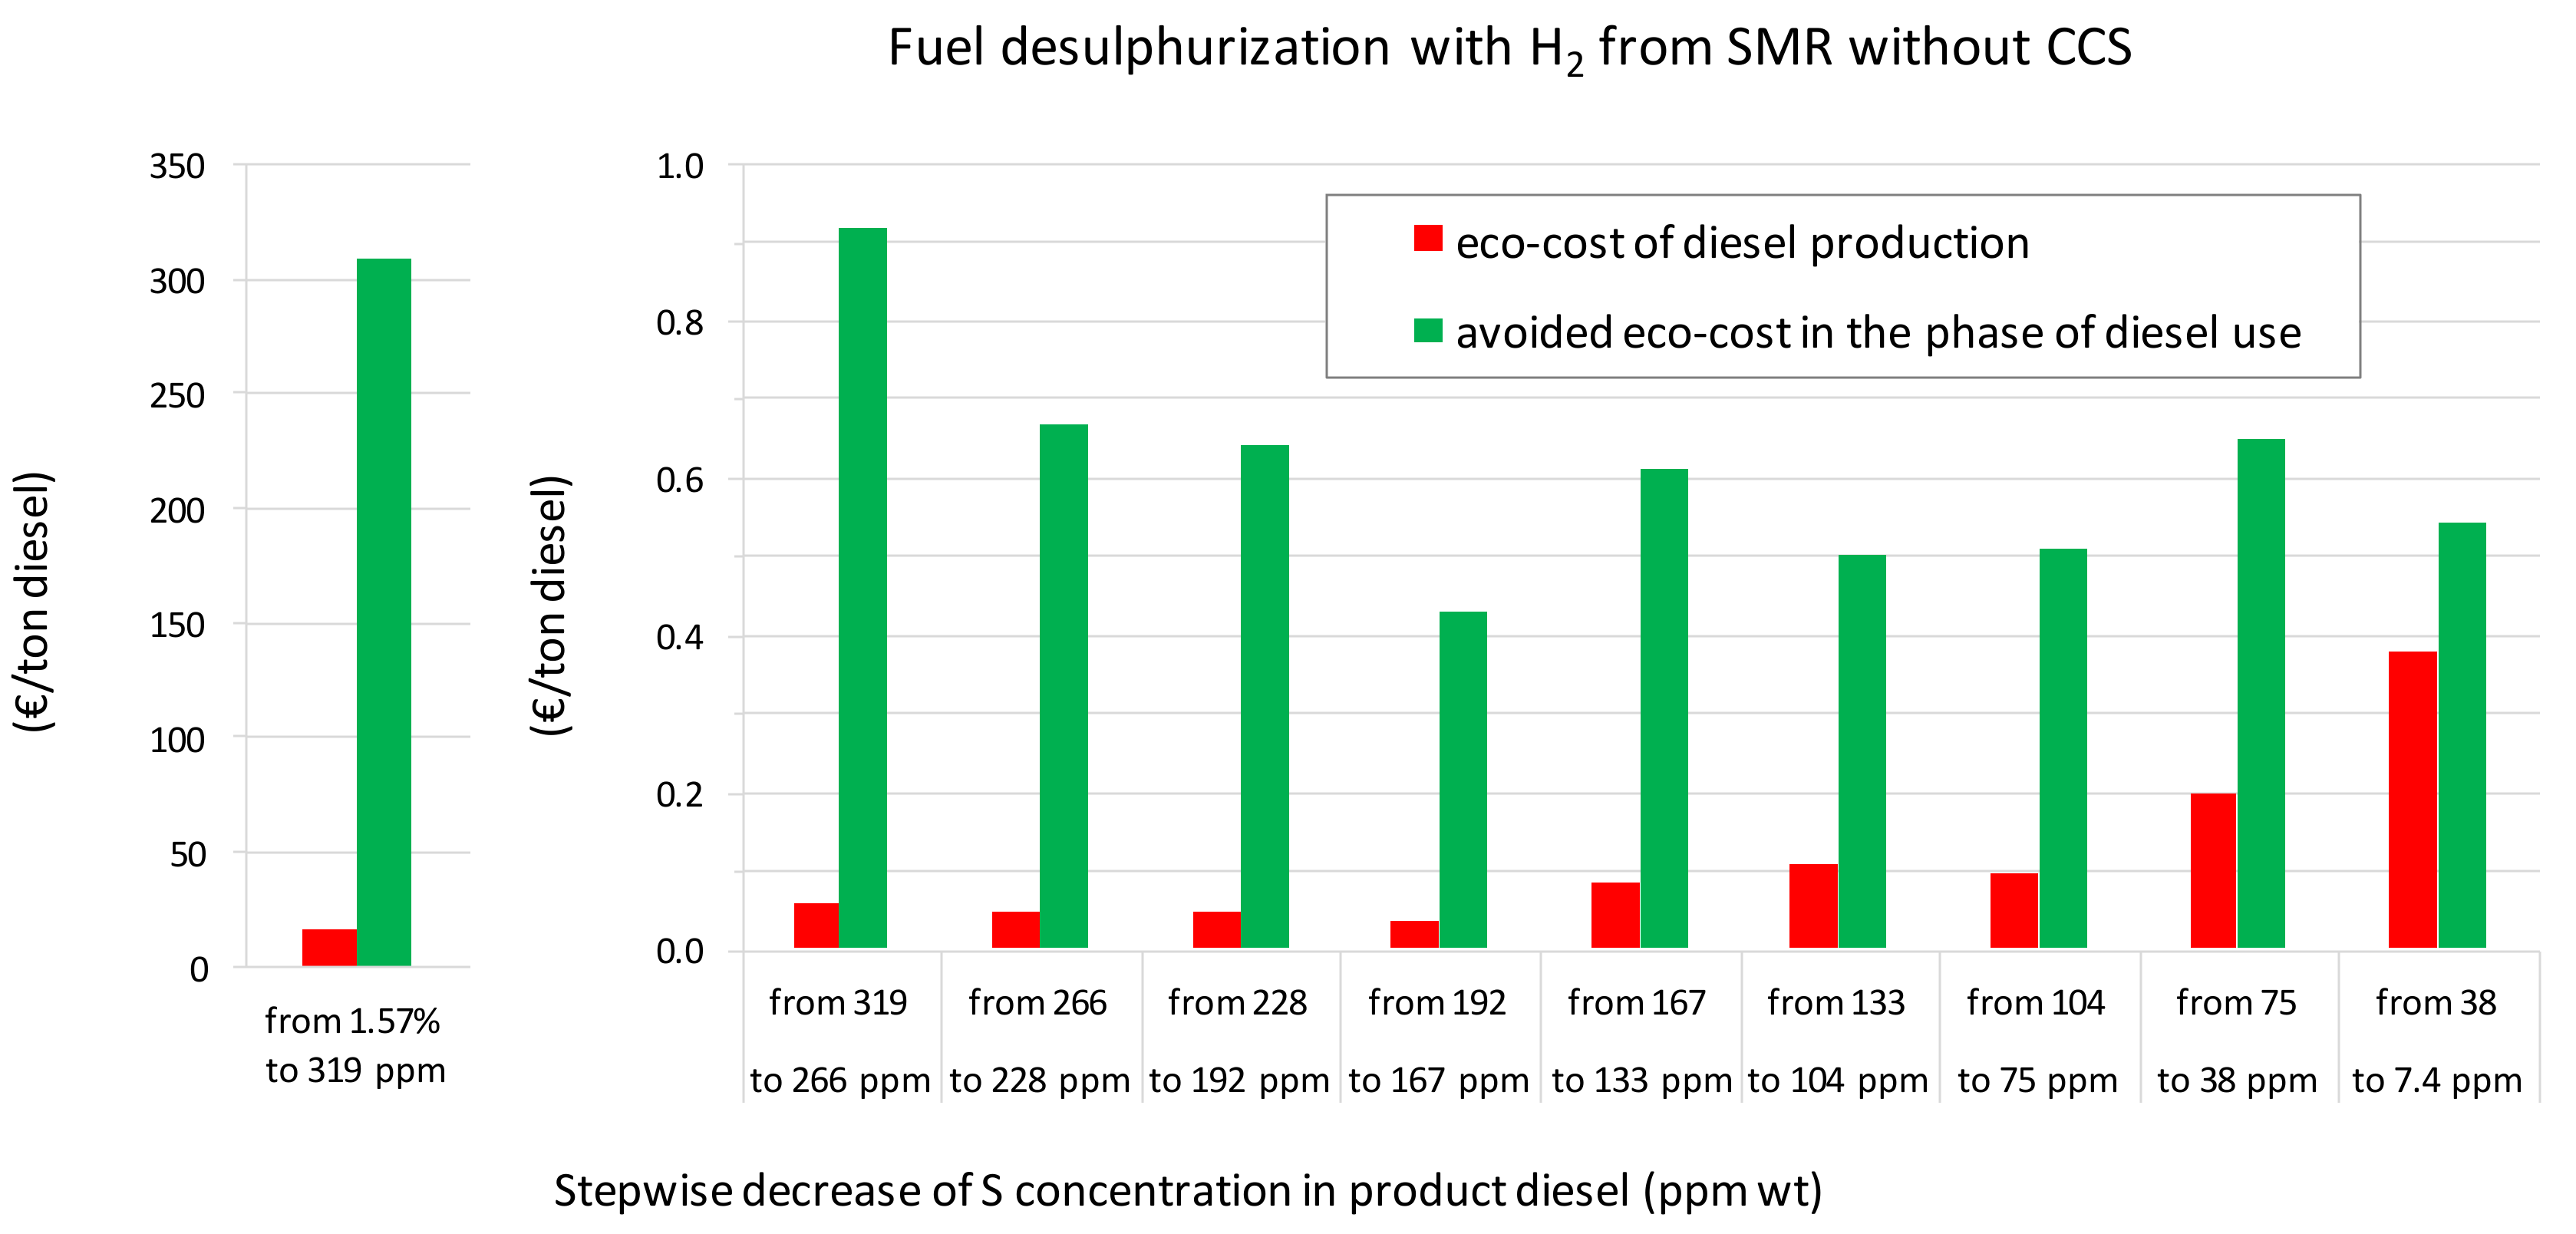
Figure 3 compares the avoided burden associated to the avoidance of SO2 emissions with the environmental burden associated to the hydrodesulphurization of 1 ton of diesel. The eco-costs 2017 system is applied as a single indicator. Thus, this figure depicts the ‘eco-costs of production’ and the ‘avoided eco-costs’, associated with the production and use of desulphurized diesel, respectively. The case considered is the stepwise removal of sulphur from the initial concentration of 1.57% to the end concentration of 7.4 ppm, in ten steps. Eco-costs are called ‘additional’ when they refer to each step of the desulphurization process and are called ‘overall’ when they refer to the sum of those steps (the ‘overall’ desulphurization process). The calculation has been made for the ‘present scenario’ (hydrogen from SMR without CCS) using the ‘past scenario’ (no desulphurization) as baseline.
These data clearly demonstrate that the ‘overall’ process of desulphurization (i.e., the sum of ten steps from 1.57% to 7.4 ppm S in Figure 3) appears highly beneficial with a ratio ‘avoided eco-costs’:’eco-costs production’ of 18. This means that the environmental impact of hydrogen production is much lower than the environmental benefit of avoiding SO2 emissions by cars. These figures are calculated for the present scenario with hydrogen from SMR without CCS. In Section 3.2 we calculate the ratio ‘avoided eco-costs’:’eco-costs production’ for four future scenarios (with H2 produced either via SMR/CCU or via water electrolysis) leading to values up to 64.
The ‘additional’ ecological burden of desulphurization up to 38 ppm is significantly below the ‘additional’ ecological benefit for avoided SO2 emissions. However, for the last step, from 38 to 7.4 ppm S, the ‘eco-costs of production’ is close to the corresponding ‘avoided eco-cost’: The ratio ‘avoided eco-costs’:’eco-costs production’ for this last step is 1.4. The conclusion may be that desulphurization below circa 10 ppm is not or hardly beneficial from the environmental point of view.
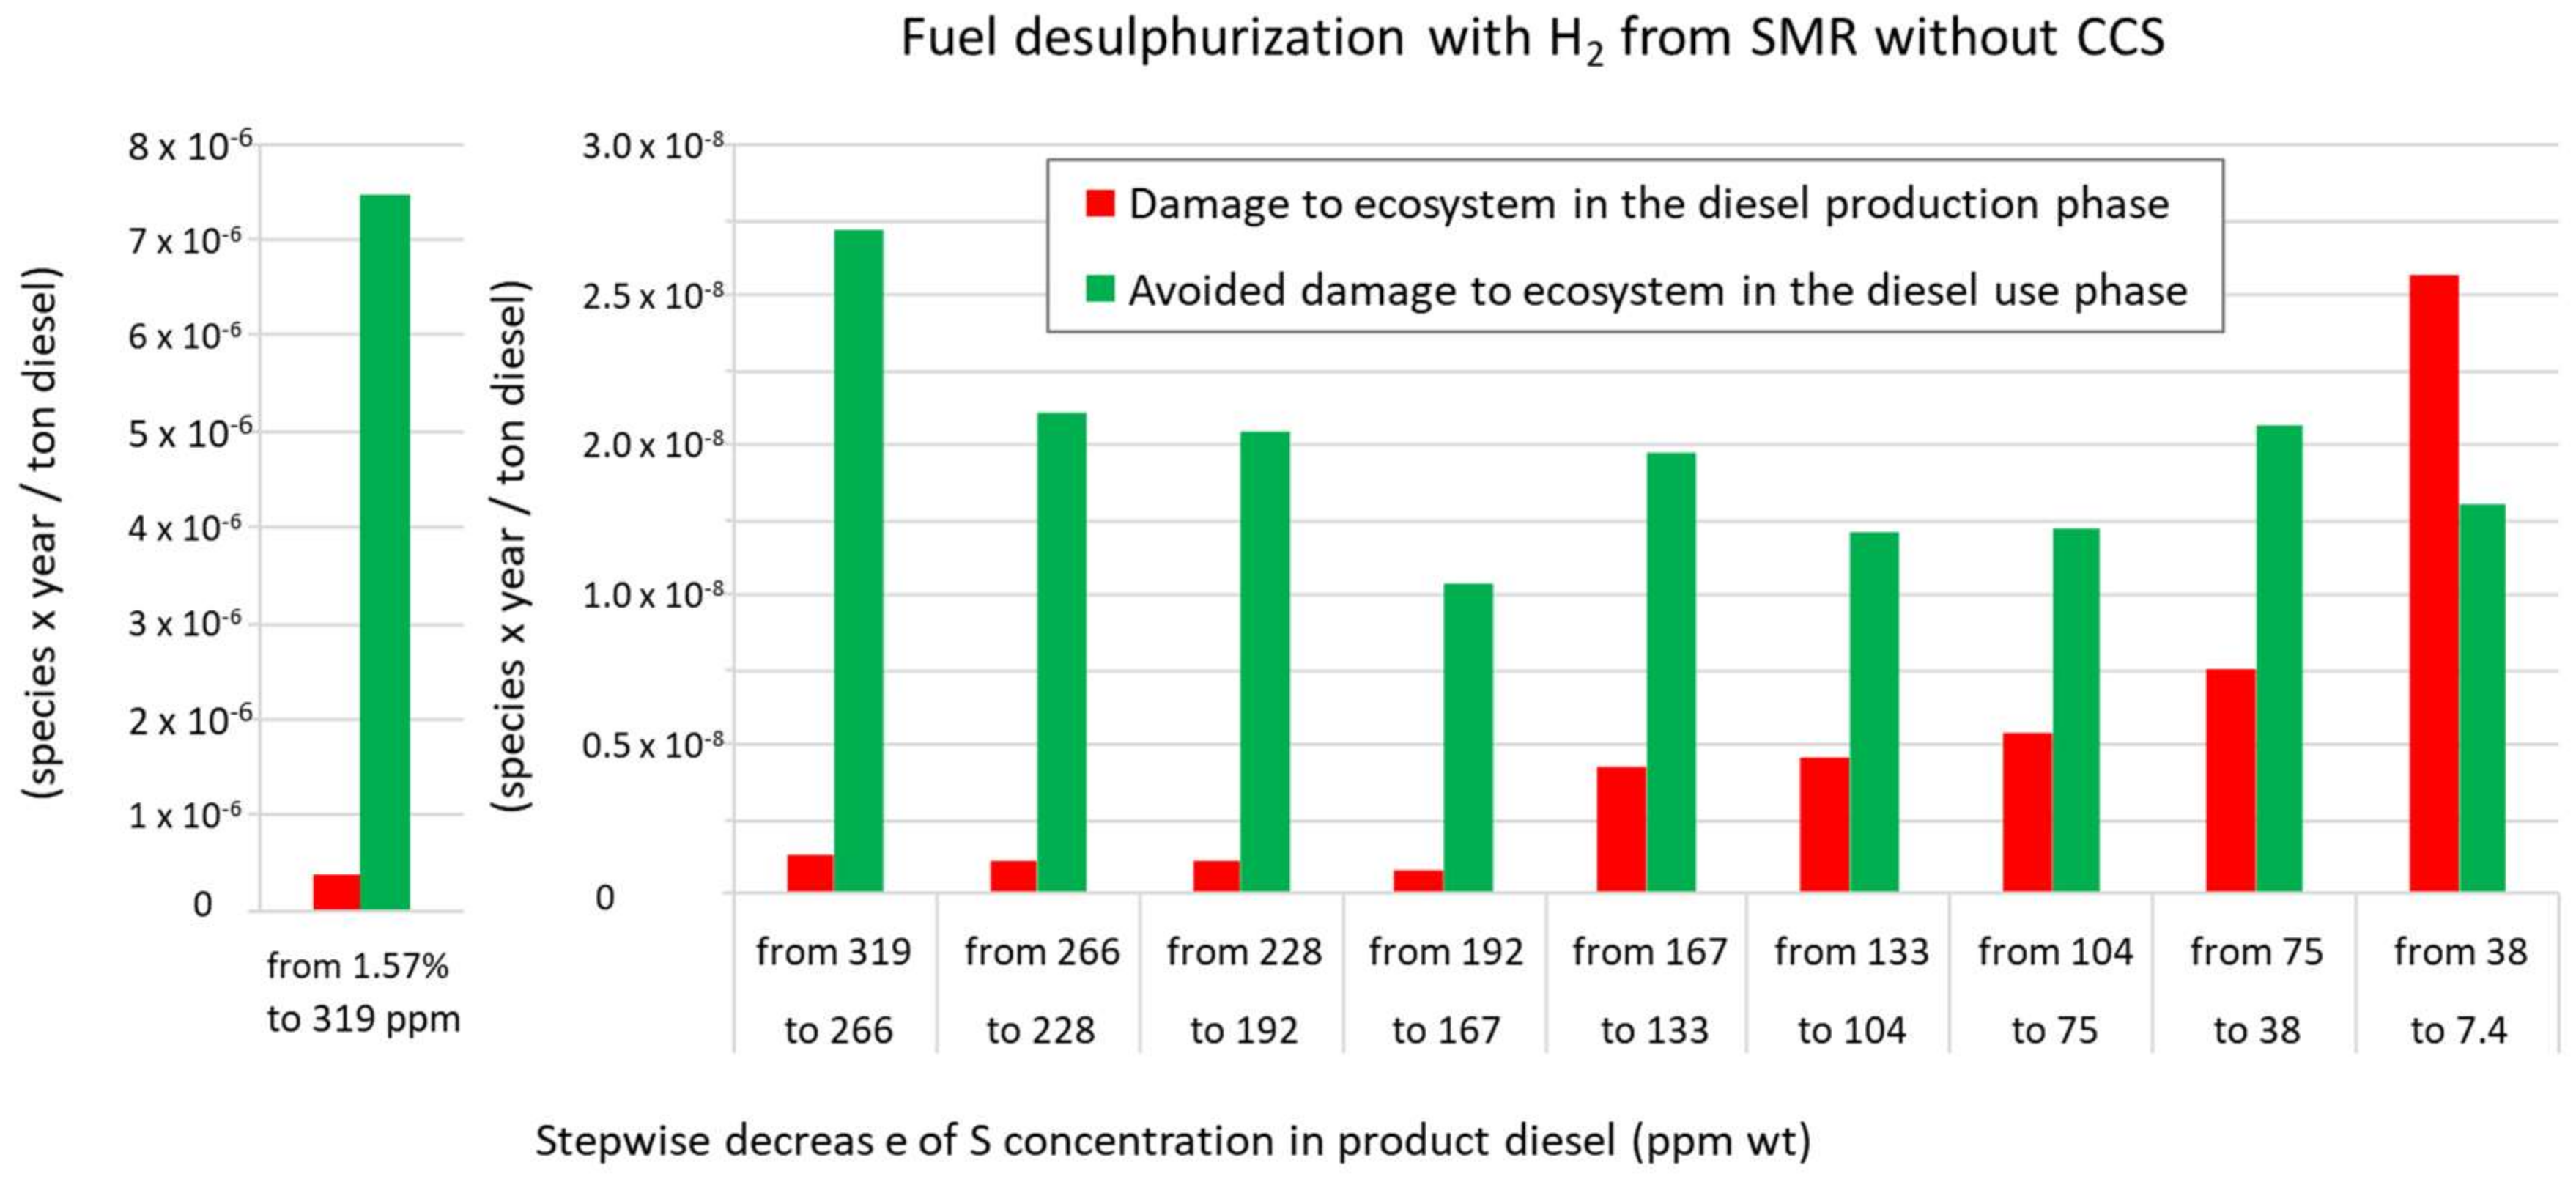
To check the dependency of the aforementioned conclusions on the eco-costs system, the calculations have also been done in the ReCiPe indicator system. Here we end up with three results for the three endpoints (see Figure 4, Figure 5 and Figure 6).
A key observation is that also in the ReCiPe system the ‘overall’ desulphurization process appears highly beneficial for both ecosystem quality and human health: The ratio ‘avoided ecological burden’:’ecological burden production’ is 17 and 38, respectively.
However, a remarkable conclusion of Figure 4 is that at the last desulphurization step (38 ppm S to 7.4 ppm S) the ReCiPe score of ‘damage to ecosystems’ is higher than the score of ‘avoided damage’. This indicates an ‘overshoot’ in purifying diesel for the original issue of ‘acid rain’. For ‘damage to human health’ (Figure 5) the damage is marginally lower than the avoided damage in the last desulphurization step. So, from the point of view of human health, the current practice of Ultra Low Sulphur Diesel seems to be acceptable.
The real problem with ReCiPe, and similarly with all other LCA damage-based methods, however, is that you cannot compare (or add up) the data of Figure 4, Figure 5 and Figure 6 since the units at the y-axis are different. The importance of ‘human health’ versus ‘ecosystems’, versus ‘resource scarcity’ in ReCiPe is not known: It depends on the personal view on ‘what is important’ (subjective paradigm). As an example: People that would regard resource scarcity as the most important issue in sustainability would conclude that desulphurization as such should be limited, since it has no credit in the system (see Figure 6). In other words, to draw any conclusion, it is required to know the relative importance of resource scarcity, human health, and eco-toxicity in the system. For the same reason, it is not possible to assess the damage of greenhouse gases in one damage-based single indicator [37]. In damage-based systems there are two solutions to resolve the problem (however, not introduced in ReCiPe 2016): (1) Adding a step for monetization of the damage [37,38] and (2) adding a subjective panel weighting system, e.g., the panel weighting system of the ReCiPe 2008 or the Eco-indicator 99 system [39]. In 2019 the panel-based weighting system of ReCiPe 2008 was re-introduced in ReCiPe 2016 to allow for single score results, applying 6 global normalization + weighting sets. These 6 sets of factors, however, result in a wide variety of indicator scores; a range of 20–40 for CO2 and SO2, which makes conclusions highly dependent on the choice of the normalization + weighting set. Wu [21] used the Eco-indicator 99 to calculate the environmental impact of desulphurization. These calculations suggest that the ‘overall’ environmental impact was bigger than the credit for sulphur concentrations in diesel below 12 ppm. Probably the ‘Europe H/A’ was used: The choice of another normalization + weighting set had generated other conclusions.
For the aforementioned reasons we decided to do the analyses of the next section only in the eco-costs system (the prevention-based, monetized, single indicator as mentioned in Section 2.2, and explained in Appendix A).
3.2. A Comparison of Present and Future Production Systems
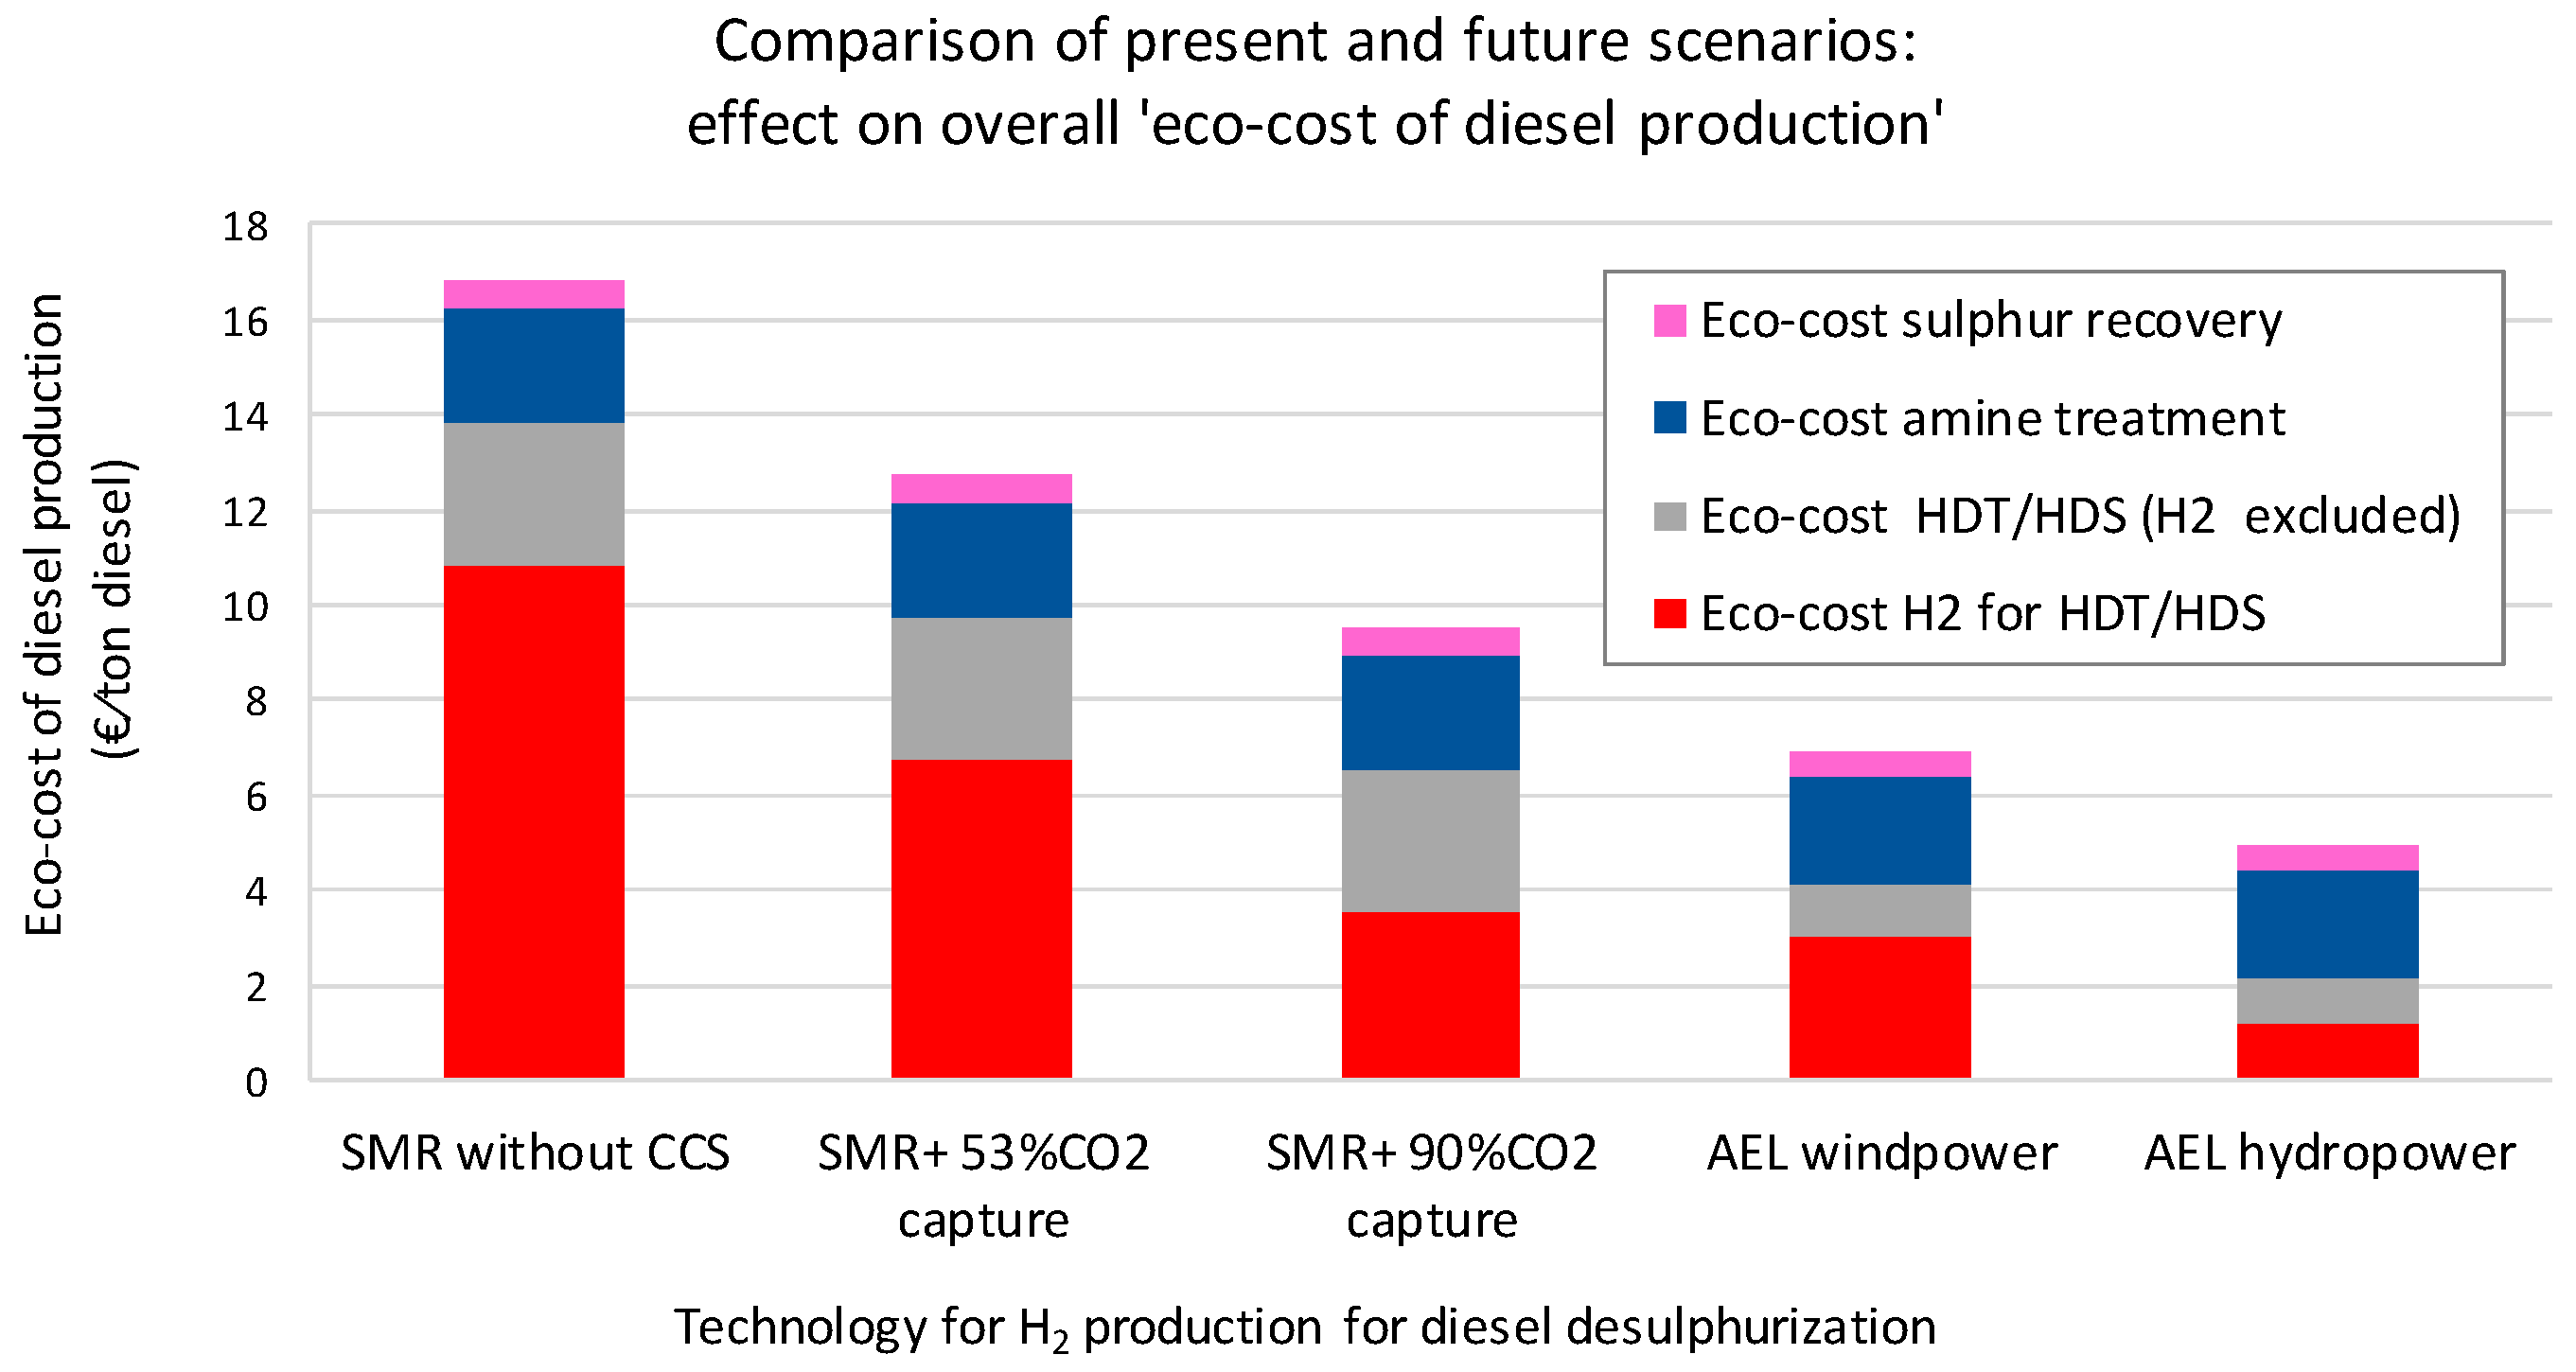
Improvement of the production system for Ultra Low Sulphur Diesel is possible by lowering the environmental burden of the production of H2. There are two types of solutions, which are already technically feasible but generally more expensive than SMR [40]: (1) CCS of the CO2 emissions of SMR and (2) electrolysis of water with renewable electricity. Table 1 and Figure 7 show the results of the eco-cost calculations on these alternatives, compared to the present scenario. The considered case is the ‘overall’ process of desulphurization of a feedstock with 1.57% S to 7.4 ppm S diesel. The avoided eco-costs associated to avoided SO2 is 313 € per ton diesel for all cases. The eco-cost of H2 is the major contributor to the total eco-cost. Only for electrolysis with hydropower (Alpine or from Norway) does the eco-cost of amine treatment appear to be higher. The ecological burden of amine treatment is governed by the required steam and cooling water (see Table S2 in the Supplementary Materials). The ‘avoided eco-costs’ to ‘eco-costs production’ ratio of the system progressively increases by a factor 3 (from 18 to 64) while the contribution of hydrogen to the ‘overall’ eco-cost decreases from 64% to 24%. For the present scenario, additional details and results for changing concentrations of S in the diesel product can be found in the Supplementary Materials (Table S6 and Figure S1a,b).
Table 2 shows, for the present scenario, the ‘overall’ effect of an increasing concentration of sulphur in the oil feedstock at parity of S content in the diesel (38 ppm wt). The major contributor of ‘eco-cost production’ is again hydrogen production (66%). The eco-cost of hydrogen increases linearly with the S concentration in the feed but at a slower pace than the ‘avoided eco-cost’ associated with avoided SO2 emissions. As a consequence, the ratio between ‘avoided eco-costs’ and ‘eco-costs production’ of the system increases from 17 to 20. Further details are in Table S8 and Figure S2 of Supplementary Materials.
Overall, we conclude that the net effect of desulphurization of diesel using hydrogen is environmentally beneficial and that the transition to a more environmentally friendly production of hydrogen is key for further improvement of the sustainability of clean fuels.
4. Discussion
4.1. The Issue of Local Damage
It is common practice in LCA to work with one score for acidification (SO2 emissions), and with one score for the damage to human health (secondary fine dust from SO2). For both situations, however, the cause–effect pathway is dependent on the local situation.
Due to carbonate buffering, some areas are less prone to acidification than others. This was first studied in [8], and later converted to so-called midpoint tables in LCA [9,10]. In the eco-costs system, the midpoint table of [10] is incorporated to enable local calculations. Production of diesel happens all over the world, and via logistic transport and storage systems there is no direct relationship between the place of production and the place of combustion. Therefore, for the production of desulphurized diesel, it makes sense to apply one average score for SO2. For the credit of the avoided SO2 emissions, however, it may make sense to take carbonate buffering into account, leading to the correction factors of Table 3 for the SO2 credit. Thus, for the present desulphurization scenario investigated in this paper, the ratio between the ‘overall’ ‘avoided eco-cost’ and the ‘overall’ ‘eco-cost of production’ ranges from 1.5 (= 18 × 0.082) for southern countries such as Spain and Italy, to 18 (average), to 62 (= 18 × 3.45) for Norway.
A similar issue is the local damage of human health by secondary fine dust. When SO2 is emitted in cities, more humans are affected than when it is emitted in rural areas. Since diesel is produced and distributed of all over the world, for the production of desulphurized diesel it makes sense to apply one average score for secondary fine dust SO2 particles. For the credit of the avoided SO2 emissions, however, it may make sense to take the local density of population into account [42], leading to the correction factors of Table 4 for the SO2 credit.
Table 4 shows that the environmental benefit for avoiding SO2 is a factor 2.71 to 2.79 higher for the cities Paris and London, respectively, compared to the average global score being the average of normal city and rural areas. For the present desulphurization scenario, the ratio between the human health ‘avoided eco-cost’ and the ‘eco-cost of diesel production’ ranges from 4 (= 18 × 0.22) for rural areas, to 18 (average), to 39–50 (18 × 2.17–18 × 2.79) for Paris and London. This means that, for these cities, it would make sense to purify diesel further below 10 ppm S. However, that would result in an overshoot of purification in the last step of Figure 3. The solution would be to produce special diesel for these cities, which is to be enabled by applying new technologies [43], and requires more sophisticated logistics for the distribution system. The total quantity of vehicles using diesel in cities, combined with the total quantity of people that suffer from the toxic emissions, will more than justify further purification of diesel in these cities.
4.2. The Issue of the Source of Electricity
Electricity in LCA always requires a bit of a nasty choice. For European cases, LCA practitioners normally make a choice between: (1) The average on the European grid of ENTSO-E, (2) the average of the grid inside a country, and (3) the data from the nearest power plant. This choice is subjective, since there is no direct physical relationship between the user of electricity from the grid and the supplier.
In our case, for the SMR and SMR + CCS scenarios, we took the average electricity from the ENTSO-E grid. It might be argued that some diesel comes from other continents, but we decided to neglect that effect.
For the electricity in the future cases of H2 production by renewable energy, we assumed that there is a direct financial relationship between the specific producer of electrical power and the producer of the H2 (as owner/shareholder or as owner of a Guarantee of Origin certificate).
4.3. The Issue of the Economic Feasibility
In eco-costs, the environmental gain of CCS with 90% CO2 capture compared to SMR is a factor of 1.8 (see Table 1: 16.9/9.5 = 1.8). The best gain is reached by electrolysis, using hydropower: A factor of 3.4 compared to SMR without CSS (see Table 1: 16.9/4.9 = 3.4).
Cleaner production systems for H2 (i.e., CCS or electrolysis) are technically feasible, but have the disadvantage of production costs levels that currently are too high: For 90% CCS this is circa 1.84 €/kg H2, resulting in a CO2 avoidance cost of 70 €/ton CO2 [16,44]. Given the current CO2 emission allowance price of circa 20 €/ton (December 2018) at the EU Emission Trading System, the CSS is not economically feasible. However, CCS comes within commercial reach in the period 2030–2050, when the emission rights are expected to climb above 70 €/ton [45,46]. Before 2030, subsidies are required to implement these cleaner production systems.
5. Conclusions
With regard to the research questions of Section 1.3, the following conclusions can be drawn:
RQ 1. What is the overall net ecological benefit of the current practice of desulphurization (ULSD and H2 from SMR)?
Ultra Low Sulphur Diesel obtained by hydrogen treatment (HDS) has a remarkably positive ‘overall’ effect on ecosystems as well as human health (in the eco-costs 2017 system as well as in ReCiPe 2016). This conclusion remains valid even if the required hydrogen is produced via state-of-art SMR technology. The ratio between ‘avoided eco-costs of human health’ and the ‘eco-cost of diesel production’ ranges from 4 for rural areas, to 18 (average), to 39–50 for Paris and London. For ecosystems, this ratio ranges from 1.5 for southern European countries, to 18 (average), to 62 for Norway.
RQ 2. At which S ppm level in diesel does the additional ecological burden of desulphurization become higher than the additional ecological benefit of less SOx pollution from combustion?
The point at which it can be concluded that we have overshot in diesel purification depends a bit on the indicator that is applied. In general, it can be concluded that further purification below 10 ppm S becomes doubtful. However, in crowded cities, values even below 10 ppm can be beneficial on a local level (however, that would require local distribution of extremely clean diesel).
RQ 3. To what extent can cleaner hydrogen processes improve the ecological benefit of diesel desulphurization?
A cleaner hydrogen process, by applying CCS technology to SMR or even better by producing H2 via water electrolysis, leads to considerable savings with regard to environmental pollution, since the current practice of production of hydrogen via SMR accounts for circa 60% of the ‘overall’ eco-costs of the production of Ultra Low Sulphur Diesel.
This study shows that trade-off decisions, which are needed in this kind of analysis (SO2 emissions versus CO2 emissions and/or resource scarcity), cannot be taken on the basis of the current damage-based indicator systems for LCA, like ReCiPe 2016. The eco-costs system fully supports LCA benchmarking for decision taking in these kinds of dilemmas.
It is not expected that cleaner production systems (e.g., CSS) for H2 will become economically feasible before 2030, which means that before that year governmental subsidies will be required to implement cleaner production systems.
Supplementary Materials
The following are available online at https://0-www-mdpi-com.brum.beds.ac.uk/2071-1050/11/7/2184/s1. Table S1: Utilities in the HDT process. Top: Feed with variable S content converted into S-free naphtha and diesel with a constant S content (38 ppm wt). Bottom: Feed with constant S content (1.57 wt%) used to produce S-free naphtha and diesel with variable S content. Data from Wu et al. [20]. Table S2: Utilities and eco-costs of Amine Treating and Sulphur Recovery processes. Data for consumption by Barthe et al. [12]. Table S3: SMR + CCS cases: Consumption, production, and CO2 emissions figures. Data from IEAGHG Technical Report 2017-02, Table 2 therein [16]. Table S4: LCI and eco-costs for hydrogen from water alkaline electrolysis (AEL). The entire AEL life cycle corresponds to 19,588,000 kgH2 = (20 y) × (8300 h/y) × (118 kg H2/h). Eco-costs are calculated for two electricity scenarios: Windmill and hydropower. Quantities of materials from Koj et al. [28]. Table S5: Background LCI data. Table S6: ‘Overall’ ‘eco-costs of production’ and ‘avoided eco-cost’ for the desulphurization of a feedstock with 1.57 wt% S to diesel with variable S content. Figure S1a,b: Desulphurization of a feedstock with 1.57 wt% S to diesel with variable S content using H2 from SMR: ‘Overall’ ‘eco-cost of production’ (a) and ‘additional’ ‘eco-cost of production’ (b). Table S8: ‘Overall’ ‘eco-cost of production’ and ‘avoided eco-cost’ for the desulphurization of a feedstock with variable S content to a 38 ppm S diesel. Figure S2a,b: Desulphurization of a feedstock with variable S content to diesel with 38 ppm S using H2 from SMR: ‘Overall’ ‘eco-cost of production’ (a) and ‘additional’ ‘eco-cost of production’ (b).
Author Contributions
Conceptualization and original draft preparation: J.G.V. Data analysis, Writing—Review & Editing: R.O.
Funding
This research received no external funding.
Acknowledgments
The authors thank Air Liquide who made this study possible.
Conflicts of Interest
The authors declare no conflict of interest.
Appendix A. Short Description of the Eco-Costs Indicator System in LCA
A short description of the eco-costs system can be found at this book [34], of which the following text is a quotation.
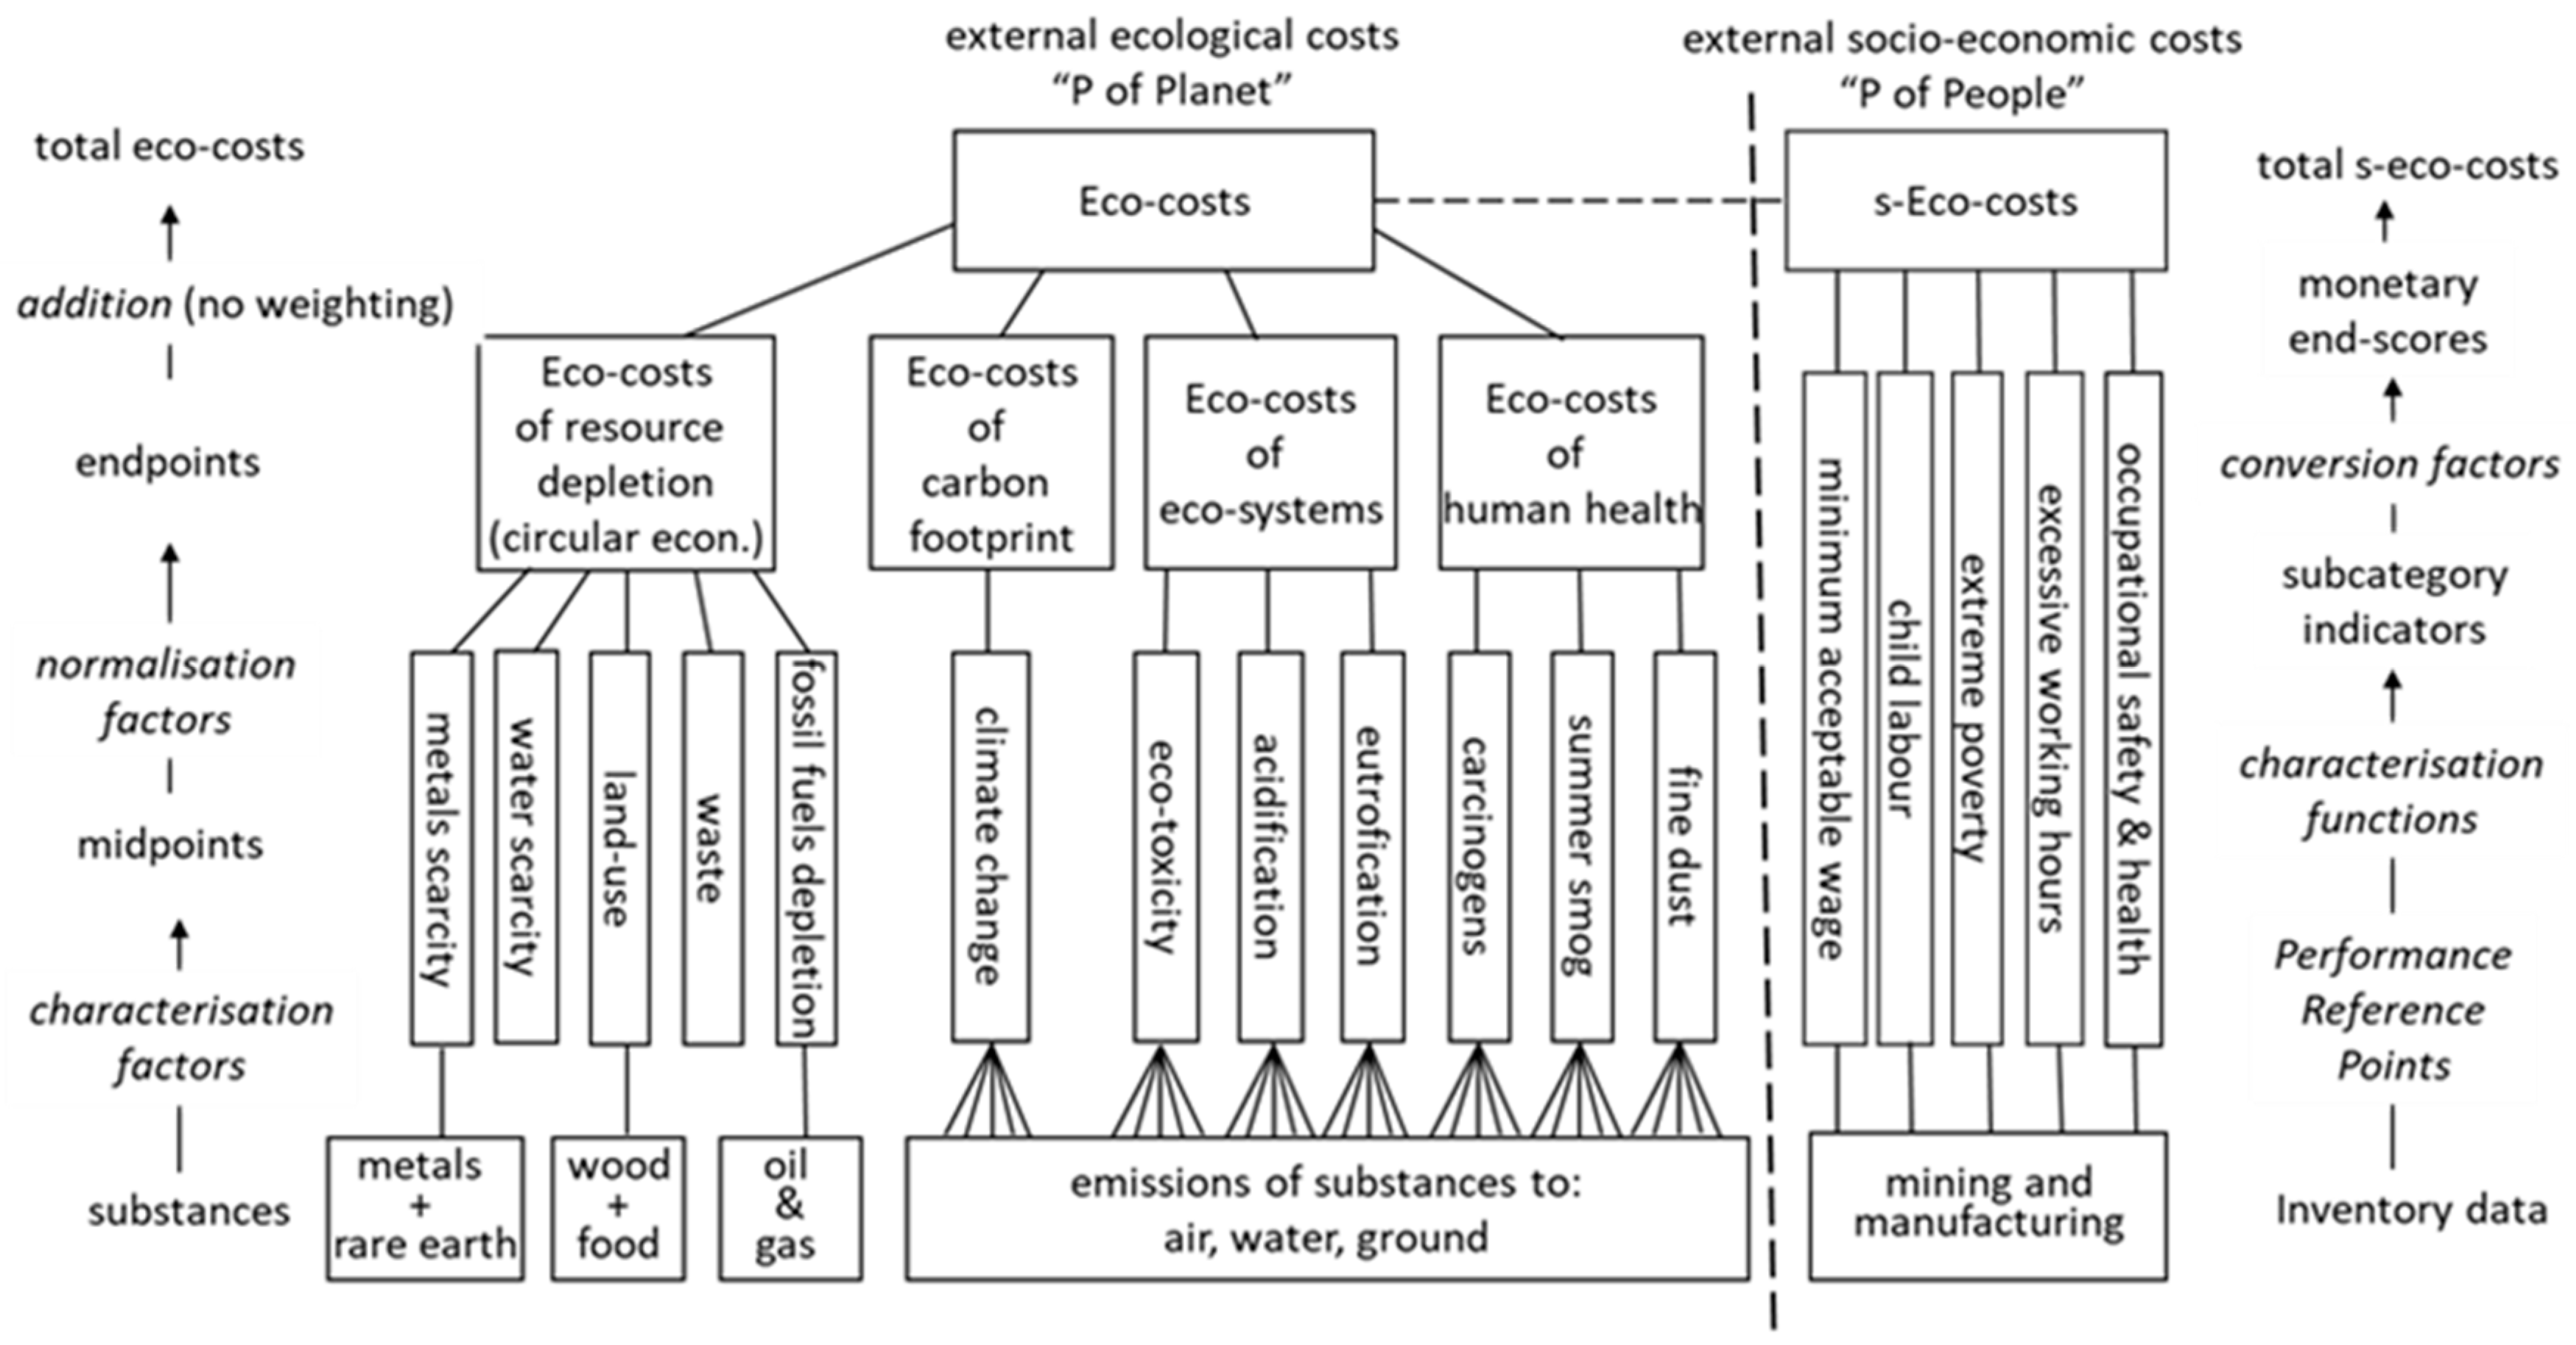
The system of the eco-costs is a monetary single indicator system in LCA [32,33]. Eco-costs are the costs of the environmental burden of a product on the basis of prevention of that burden. They are the costs that should be made to reduce the environmental pollution and materials depletion in our world to a level that is in line with the carrying capacity of our earth. In practice, the eco-costs of a product or service are based on the sum of the (marginal) prevention costs (or abatement costs) of the midpoints, as depicted in Figure A1. The system is widely applied in design and engineering, since it is related to the so-called ‘hidden’ or ‘external’ costs of a product or service, and since it has the advantage of integrating all midpoints into one single indicator to enable easy LCA benchmarking.
Figure A1.
The total eco-costs system in Life Cycle Assessment (LCA) [34].
Figure A1.
The total eco-costs system in Life Cycle Assessment (LCA) [34].

The method of the eco-costs 2017 (version 1.5) comprises tables of over 36,000 emissions, and has been made operational by special database for SimaPro: Idematapp Version 2018 and Idemat Version 2018 (based on LCIs from Ecoinvent V3.4) published by the Delft University of Technology. Over 10,000 materials and processes are covered in total. Excel look-up tables are provided at The Model of the Eco-costs/Value Ratio (EVR) (www.ecocostsvalue.com). An app for smartphones has been developed for easy material selection (see www.idematapp.com).
For emissions of toxic substances, the following set of characterization factors (marginal prevention costs) is used in the eco-costs 2017 system, see Table A1:

Table A1.
Midpoint characterization factors in the eco-costs 2017 system, Version 1.5.
| Eco-Costs of | Equivalent |
|---|---|
| acidification | 8.75 €/kg SOx equivalent |
| eutrophication | 4.17 €/kg phosphate equivalent |
| ecotoxicity | 55.0 €/kg Cu equivalent |
| human toxicity | 3754 €/kg Benzo(a)pyrene equivalent |
| summer smog (respiratory diseases) | 10.38 €/kg C2H4 equivalent |
| fine dust | 34.0 €/kg fine dust PM2.5 |
| global warming (GWP 100) | 0.116 €/kg CO2 equivalent |
The characterization (‘midpoint’) tables which are applied in the eco-costs 2017 system, are recommended by the ILCD:
- IPPC 2013, 100 years, for greenhouse gasses
- USETOX 2, for human toxicity (carcinogens) and ecotoxicity
- ILCD, for acidification, eutrophication, and photochemical oxidant formation (summer smog)
- UNEP/SETAC 2016, for fine dust PM2.5 (for PM10 the default factors of the ILCD Midpoint+ are used)
In addition to the abovementioned eco-costs for emissions, there is a set of eco-costs to characterize the ‘midpoints’ of resource depletion:
- Eco-costs of abiotic scarcity (metals, including rare earth, and fossil fuels)
- Eco-costs of land-use change (based on loss of biodiversity, of vascular plants and mammals, used for eco-costs of tropical hardwood)
- Eco-costs of water scarcity (based on the midpoint Water Stress Indicator (WSI) of countries’ eco-costs of landfill)
The abovementioned marginal prevention costs at midpoint level can be combined to ‘endpoints’ in three groups, plus global warming as a separate group:
- Eco-costs of human health = the sum of carcinogens, summer smog, and fine dust
- Eco-costs of ecosystems = the sum of acidification, eutrophication, and ecotoxicity
- Eco-costs of resource scarcity = the sum of abiotic depletion, land-use, water, and landfill
- Costs of global warming = the sum of CO2 and other greenhouse gases (the GWP 100 table)
- Total eco-costs = the sum of human health, ecosystems, resource scarcity, and global warming.
Since the endpoints have the same monetary unit (e.g., euro, dollar), they are added up to the total eco-costs without applying a ‘subjective’ weighting system. This is an advantage of the eco-costs system (see also ISO 14044 Sections 4.4.3.4 and 4.4.5). The so-called ‘double counting’ (ISO 14044 Section 4.4.2.2.3) is avoided in the eco-costs system.
The eco-costs of global warming (also called eco-costs of carbon footprint) can be used as an indicator for the carbon footprint. The eco-costs of resource depletion can be regarded as an indicator for ‘circularity’ in the theory of the circular economy. However, it is advised to include human toxicity and eco-toxicity and include the eco-costs of global warming in the calculations on the circular economy as well. The eco-costs of global warming are required to reveal the difference between fossil-based products and bio-based products, since biogenic CO2 is not counted in LCA (biogenic CO2 is part of the natural recycle loop in the biosphere). Therefore, total eco-costs can be regarded as a robust indicator for cradle-to-cradle calculations in LCA for products and services in the theory of the circular economy. Since the economic viability of a business model is also an important aspect of the circular economy, the added value of a product–service system should be part of the analysis. This requires the two-dimensional approach of Eco-Efficient Value Creation as described on the Wikipedia page on the model of the ecocosts/value ratio, EVR.
The Delft University of Technology has developed a single indicator for S-LCA as well, the so-called s-eco-costs, to incorporate the sometimes appalling working conditions in production chains (e.g., production of garments, mining of metals). Aspects are the low minimum wages in developing countries (the ‘fair wage deficit’), the aspects of ‘child labour’ and ‘extreme poverty’, the aspect of ‘excessive working hours’, and the aspect of ‘OSH (Occupational Safety and Health)’. The s-eco-costs system has been published in the Journal of Cleaner Production.
References
- World Health Organization. Chapter 7.4 “Sulfur dioxide”. In Air Quality Guidelines for Europe, 2nd ed.; WHO Regional Publications, European Series, No. 91; WHO: Geneva, Switzerland, 2000. [Google Scholar]
- World Health Organization. Air Quality Guidelines Global Update 2005. Particulate Matter, Ozone, Nitrogen Dioxide and Sulfur Dioxide; WHO: Geneva, Switzerland, 2005. [Google Scholar]
- Fantke, P.; Evans, J.; Hodas, N.; Apte, J.; Jantunen, M.; Jolliet, O.; McKone, T.E. Health impacts of fine particulate matter. In Global Guidance for Life Cycle Impact Assessment Indicators; Frischknecht, R., Jolliet, O., Eds.; UNEP DTIE Sustainable Lifestyles, Cities and Industry Branch: Paris, France, 2016; Volume 1. [Google Scholar]
- Apte, J.S.; Marshall, J.D.; Cohen, A.J.; Brauer, M. Addressing Global Mortality from Ambient PM2.5. Environ. Sci. Technol. 2015, 49, 8057–8066. [Google Scholar] [CrossRef]
- Di, Q.; Dai, L.; Wang, Y.; Zanobetti, A.; Choirat, C.; Schwartz, J.D.; Dominici, F. Association of Short-term Exposure to Air Pollution with Mortality in Older Adults. JAMA 2017, 318, 2446–2456. [Google Scholar] [CrossRef] [PubMed]
- Driscoll, C.T.; Lawrence, G.B.; Bulger, A.J.; Butler, T.J.; Cronan, C.S.; Eagar, C.; Lambert, K.F.; Likens, G.E.; Stoddard, J.L.; Weathers, K.C. Acidic Deposition in the Northeastern United States: Sources and Inputs, Ecosystem Effects, and Management Strategies: The effects of acidic deposition in the northeastern United States include the acidification of soil and water, which stresses terrestrial and aquatic biota. BioScience 2001, 51, 180–198. [Google Scholar]
- Harriman, R.; Wells, D.E. Causes and effects of surface water acidification. Water Pollut. Control 1985, 84, 215–224. [Google Scholar]
- Potting, J.; Schöpp, W.; Blok, K.; Hauschild, M. Site-Dependent Life-Cycle Impact Assessment of Acidification. J. Ecol. 1998, 2, 63–87. [Google Scholar] [CrossRef]
- Seppälä, J.; Posch, M.; Johansson, M.; Hettelingh, J.-P. Country-dependent Characterisation Factors for Acidification and Terrestrial Eutrophication Based on Accumulated Exceedance as an Impact Category Indicator. Int. J. Life Cycle Assess. 2006, 11, 403–416. [Google Scholar] [CrossRef]
- Posch, M.; Seppälä, J.; Hettelingh, J.-P.; Johansson, M.; Margni, M.; Jolliet, O. The role of atmospheric dispersion models and ecosystem sensitivity in the determination of characterisation factors for acidifying and eutrophying emissions in LCIA. Int. J. Life Cycle Assess. 2008, 13, 477–486. [Google Scholar] [CrossRef]
- National Research Council. Ocean Acidification: A National Strategy to Meet the Challenges of a Changing Ocean; National Academies Press: Washington, DC, USA, 2010. [Google Scholar] [CrossRef]
- Barthe, P.; Chaugny, M.; Roudier, S.; Delgado Sancho, L. Best Available Technique (BAT) Reference Document for the Refining and Mineral Oil and Gas; JRC Science and Policy Report EUR 27140EN; Publications Office of the European Union: Luxembourg City, Luxembourg, 2015. [Google Scholar]
- De Crisci, A.G.; Moniri, A.; Xu, Y. Hydrogen from hydrogen sulfide: Towards a more sustainable hydrogen economy. Int. J. Hydrog. Energy 2019, 44, 1299–1327. [Google Scholar] [CrossRef]
- De León, J.N.D.; Kumar, C.R.; Antúnez-García, J.; Fuentes-Moyado, S. Recent Insights in Transition Metal Sulfide Hydrodesulfurization Catalysts for the Production of Ultra Low Sulfur Diesel: A Short Review. Catalysts 2019, 9, 87. [Google Scholar] [CrossRef]
- IEA Energy Technology ETE 05 2017, Hydrogen Production & Distribution. Available online: https://webstore.iea.org/iea-energy-technology-essentials-hydrogen-production-distribution (accessed on 19 February 2019).
- IEAGHG Technical Report 2017-02. Techno-Economic Evaluation of SMR Based Standalone (Merchant) Hydrogen Plant with CCS; IEAGHG: Cheltenham, UK, 2007; Available online: https://ieaghg.org/exco_docs/2017-02.pdf (accessed on 19 February 2019).
- Figueroa, J.D.; Fout, T.; Plasynski, S.; McIlvried, H.; Srivastava, R.D. Advances in CO2 capture technology—The U.S. Department of Energy’s Carbon Sequestration Program. Int. J. Greenh. Gas Control 2008, 2, 9–20. [Google Scholar] [CrossRef]
- Kelly, N.A.A. Hydrogen production by water electrolysis (Chapter 6). In Advances in Hydrogen Production, Storage and Distribution; Basie, A., Iulianelli, A., Eds.; Elsevier Ltd.: Amsterdam, The Netherlands, 2014. [Google Scholar]
- Burgess, A.A.; Brennan, D.J. Desulfurisation of gas oil A case study in environmental and economic assessment. J. Clean. Prod. 2001, 9, 465–472. [Google Scholar] [CrossRef]
- Wu, L.; Liu, Y. Environmental impacts of hydrotreating processes for the production of clean fuels based on life cycle assessment. Fuel 2016, 164, 352–360. [Google Scholar] [CrossRef]
- Wu, L.; Wang, Y.; Zheng, L.; Han, X.; Hong, F. Multi-objective Operational Optimization of a Hydrotreating Process Based on Hydrogenation Reaction Kinetics. Ind. Eng. Chem. Res. 2018, 57, 15785–15793. [Google Scholar] [CrossRef]
- Valente, A.; Irribaren, D.; Dofour, J. Harmonized Life-Cycle global warming impact of renewable hydrogen. J. Clean. Prod. 2017, 149, 762–772. [Google Scholar] [CrossRef]
- Suleman, F.; Dincer, I.; Agelin-Chaab, M. Comparative impact assessment study of various hydrogen production methods in terms of emissions. Int. J. Hydrog. Energy 2016, 41, 8364–8375. [Google Scholar] [CrossRef]
- Mehmeti, A.; Angelis-Dimakis, A.; Arampatzis, G.; McPhail, S.J.; Ulgiati, S. Life Cycle Assessment and Water Footprint of Hydrogen Production Methods: From Conventional to Emerging Technologies. Environments 2018, 5, 24. [Google Scholar] [CrossRef]
- Chui, F.; Elkamel, A.; Fowler, M. An integrated Decision Support Framework for the Assessment and Analysis of Hydrogen Production Pathways. Energy Fuels 2006, 20, 346–352. [Google Scholar] [CrossRef]
- Lee, D.-Y.; Elgowainy, A.; Dai, Q. Life cycle greenhouse gas emissions of hydrogen fuel production from chlor-alkali processes in the United States. Appl. Energy 2018, 217, 467–479. [Google Scholar] [CrossRef]
- Lee, D.-Y.; Elgowainy, A. By-product hydrogen from steam cracking of natural gas liquids (NGLs): Potential for large-scale hydrogen fuel production, life-cycle air emissions reduction, and economic benefit. Int. J. Hydrog. Energy 2018, 43, 20143–20160. [Google Scholar] [CrossRef]
- Koj, J.C.; Wulf, C.; Schreiber, A.; Zapp, P. Site-Dependent Environmental Impacts of Industrial Hydrogen Production by Alkaline Water Electrolysis. Energies 2017, 10, 860. [Google Scholar] [CrossRef]
- Koj, J.C.; Schreiber, A.; Zapp, P.; Marcuello, P. Life Cycle Assessment of improved high pressure alkaline electrolysis. Energy Procedia 2015, 75, 2871–2877. [Google Scholar] [CrossRef]
- Huijbregts, M.A.J.; Steinmann, Z.J.N.; Elshout, P.M.F.; Stam, G.; Verones, F.; Vieira, M.; Zijp, M.; Hollander, A.; Van Zelm, R. ReCiPe2016: A harmonised life cycle impact assessment method at midpoint and endpoint level. Int. J. Life Cycle Assess. 2017, 22, 138–147. [Google Scholar] [CrossRef]
- Rosenbaum, R.K.; Bachmann, T.M.; Gold, L.S.; Huijbregts, M.A.J.; Jolliet, O.; Juraske, R.; Koehler, A.; Larsen, H.F.; MacLeod, M.; Margni, M.; et al. USEtox—The UNEP-SETAC toxicity model: Recommended characterisation factors for human toxicity and freshwater ecotoxicity in life cycle impact assessment. Int. J. Life Cycle Assess. 2008, 13, 532–546. [Google Scholar] [CrossRef]
- Vogtlander, J.G.; Bijma, A. The ‘Virtual Pollution Prevention Costs ‘99’. J. Life Cycle Assess. 2000, 5, 113–124. [Google Scholar] [CrossRef]
- Vogtlander, J.G.; Brezet, H.C.; Hendriks, C.F. The virtual eco-costs ‘99. A Single LCA-Based Indicator for Sustainability and the Eco-Costs-Value Ratio (EVR) model for Economic Allocation. Int. J. Life Cycle Assess. 2001, 6, 157–166. [Google Scholar] [CrossRef]
- Vogtlander, J.G. A Practical Guide to LCA for Students, Designers and Business Managers, 5th ed.; Academic Press: Delft, The Netherlands, 2017. [Google Scholar]
- Mano, T.B.; Guillén-Gosálbez, G.; Jiménez, L.; Ravagnani, M.A.S.S. Synthesis of heat exchanger networks with economic and environmental assessment using fuzzy-Analytic Hierarchy Process. Chem. Eng. Sci. 2019, 195, 185–200. [Google Scholar] [CrossRef]
- Aghbashlo, M.; Rosen, M.A. Exergoeconoenvironmental analysis as a new concept for developing thermodynamically, economically, and environmentally sound energy conversion systems. J. Clean. Prod. 2018, 187, 190–204. [Google Scholar] [CrossRef]
- Dong, Y.; Hauschild, M.; Sørup, H.; Rousselet, R.; Fantke, P. Evaluating the costs of greenhouse gases emissions in the life cycle impact assessment. J. Clean. Prod. 2019, 209, 538–549. [Google Scholar] [CrossRef]
- Weidema, B.P. Using the budget constraint to monetarise impact assessment results. Ecol. Econ. 2009, 68, 1591–1598. [Google Scholar] [CrossRef]
- Goedkoop, M.; Spriensma, R. The Eco-indicator 99. A Damage Oriented Method for Life Cycle Impact Assessment. Methodology Report, 3rd ed.; Pré Consultants: Amersfoort, The Netherlands, 2001. [Google Scholar]
- Cédric, P. Renewable Energy Division, Updated 1st October 2017, IEA, Producing Ammonia and Fertilizers: New Opportunities from Renewables. Available online: https://www.iea.org/media/news/2017/Fertilizer_manufacturing_Renewables_01102017.pdf (accessed on 19 February 2019).
- Midpoint Characterisation Table for Acidification in of the ILCD Midpoint+ System. Available online: http://eplca.jrc.ec.europa.eu/?page_id=140 (accessed on 15 December 2018).
- Apte, J.S.; Bombrun, E.; Marshall, J.D.; Nazaroff, W.W. Global Intraurban Intake Fractions for Primary Air Pollutants from Vehicles and Other Distributed Sources. Environ. Sci. Technol. 2012, 46, 3415–3423. [Google Scholar] [CrossRef]
- Gupta, M.; He, J.; Nguyen, T.; Petzold, F.; Fonseca, D.; Jasinski, J.B.; Sunkara, M.K. Nanowire catalysts for ultra-deep hydro-desulfurization and aromatic hydrogenation. Appl. Catal. B Environ. 2016, 180, 246–254. [Google Scholar] [CrossRef]
- Salkuyeh, Y.K.; Saville, B.A.; MacLean, H.L. Techno-economic analysis and life cycle assessment of hydrogen production from natural gas using current and emerging technologies. Int. J. Hydrog. Energy 2017, 42, 18894–18909. [Google Scholar] [CrossRef]
- Ferdinand, F. EU ETS in 2030: A Long-Term Price Forecast. CEPS Task Force: EU ETS Market Stability Reserve, Brussels. 2014. Available online: https://www.ceps.eu/sites/default/files/Ferdinand.pdf (accessed on 19 February 2019).
- Lewis, M. EU Carbon Prices Could Double by 2012 and Quadruple by 2030. Carbon Tracker, 2018. Available online: https://www.carbontracker.org/eu-carbon-prices-could-double-by-2021-and-quadruple-by-2030/ (accessed on 19 February 2019).
Figure 1.
The system of departure (‘past scenario’): No desulphurization. ‘Feedstock’ indicates the feed to the hydrotreating/hydrodesulphurization (HDT/HDS) step in the ‘present’ and ‘future’ scenarios. The step ‘fractionation’ has been inserted to maintain coherence with the process scheme of the publication we used as the source of the HDT/HDS data [20].

Figure 2.
System for ‘present scenario’ (HDT/HDS with Steam Methane Reforming (SMR) without Carbon Capture and Sequestration (CCS)) and ‘future scenario’ (HDT/HDS + SMR with CCS or + water alkaline electrolysis (AEL)). Utilities for the HDT/HDS process unit are in Table S1 of the Supplementary Materials.

Figure 3.
The ‘additional’ eco-costs of the desulphurization processes (red bars) and the ‘additional’ avoided eco-costs related to the avoided SO2 emissions (green bars) for an initial HDS feedstock with 1.57% S concentration. Data at the x-axis are the stepwise decrease of S concentration in diesel in ppm. Note: The eco-costs of SO2 is 875 €/t.

Figure 4.
Results for the ReCiPe endpoint of ‘damage to ecosystems’: The ‘additional’ damage in the production phase of desulphurized diesel (red bars) and the ‘additional’ avoided damage in its use phase due to avoided SO2 emissions (green bars). Case of an initial HDS feedstock with 1.57% S concentration. Data at the x-axis are the stepwise decrease of S concentration in diesel in ppm. Note: The damage to ecosystems of SO2 is 2.12 × 10⁻⁴ species × year/ton SO2.

Figure 5.
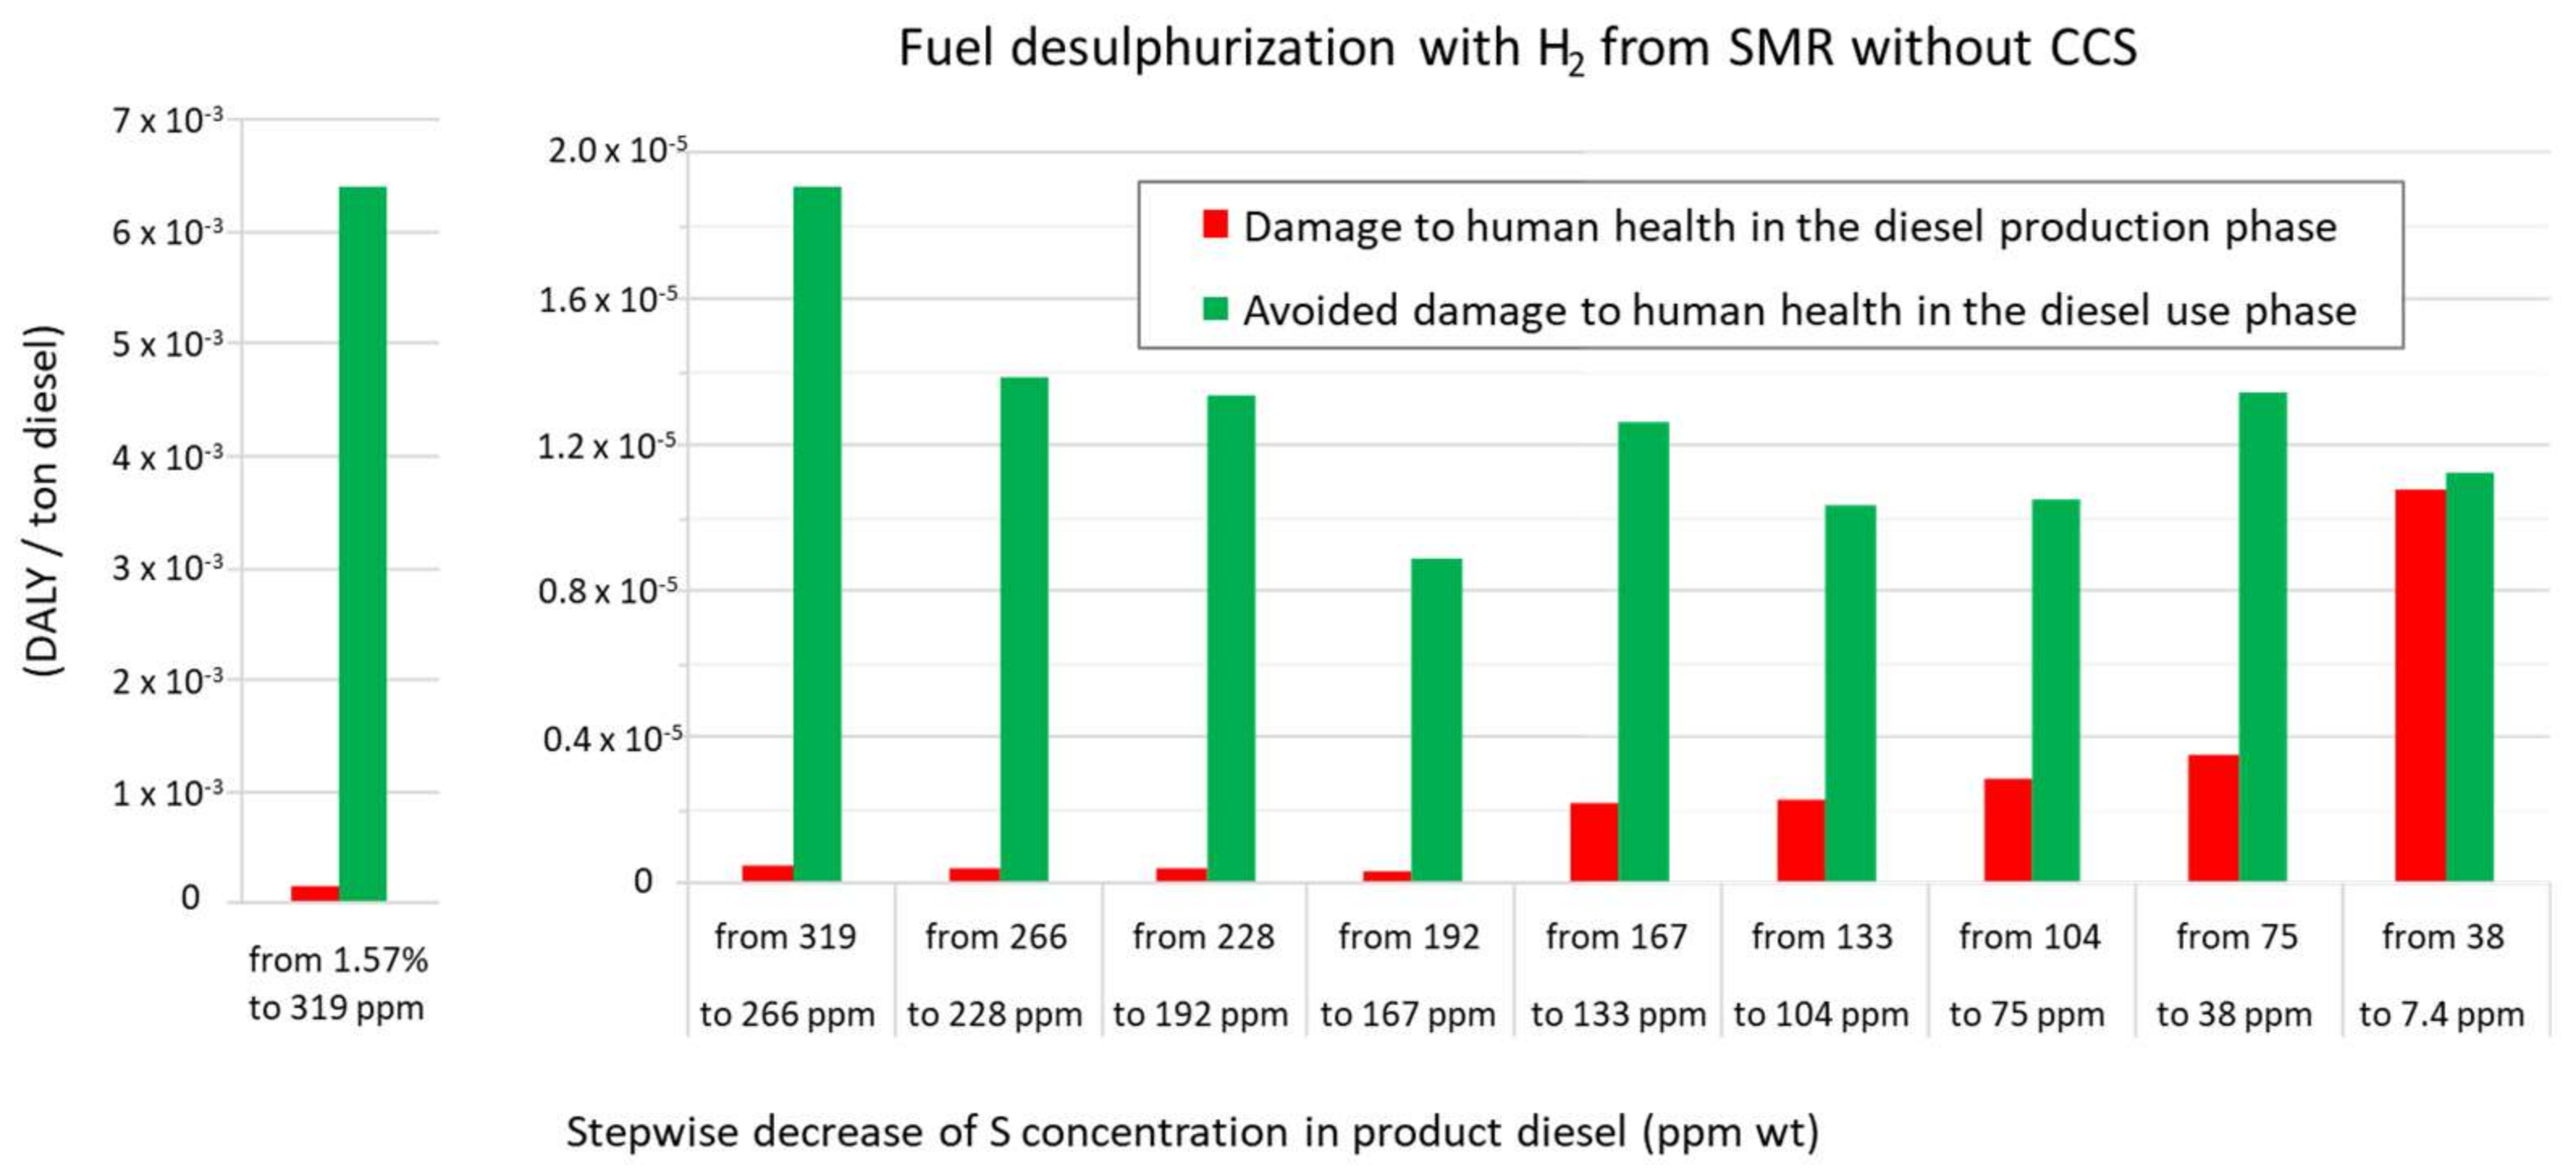
Results for the ReCiPe endpoint of ‘damage to human health’: The ‘additional’ damage in the production phase of desulphurized diesel (red bars) and the ‘additional’ avoided damage in its use phase due to avoided SO2 emissions (green bars). Case of an initial HDS feedstock with 1.57% S concentration. Data at the x-axis are the stepwise decrease of S concentration in diesel in ppm. Note: The damage to human health of SO2 is 1.82 × 10⁻¹ DALY/ton SO2.
Figure 5.
Results for the ReCiPe endpoint of ‘damage to human health’: The ‘additional’ damage in the production phase of desulphurized diesel (red bars) and the ‘additional’ avoided damage in its use phase due to avoided SO2 emissions (green bars). Case of an initial HDS feedstock with 1.57% S concentration. Data at the x-axis are the stepwise decrease of S concentration in diesel in ppm. Note: The damage to human health of SO2 is 1.82 × 10⁻¹ DALY/ton SO2.

Figure 6.
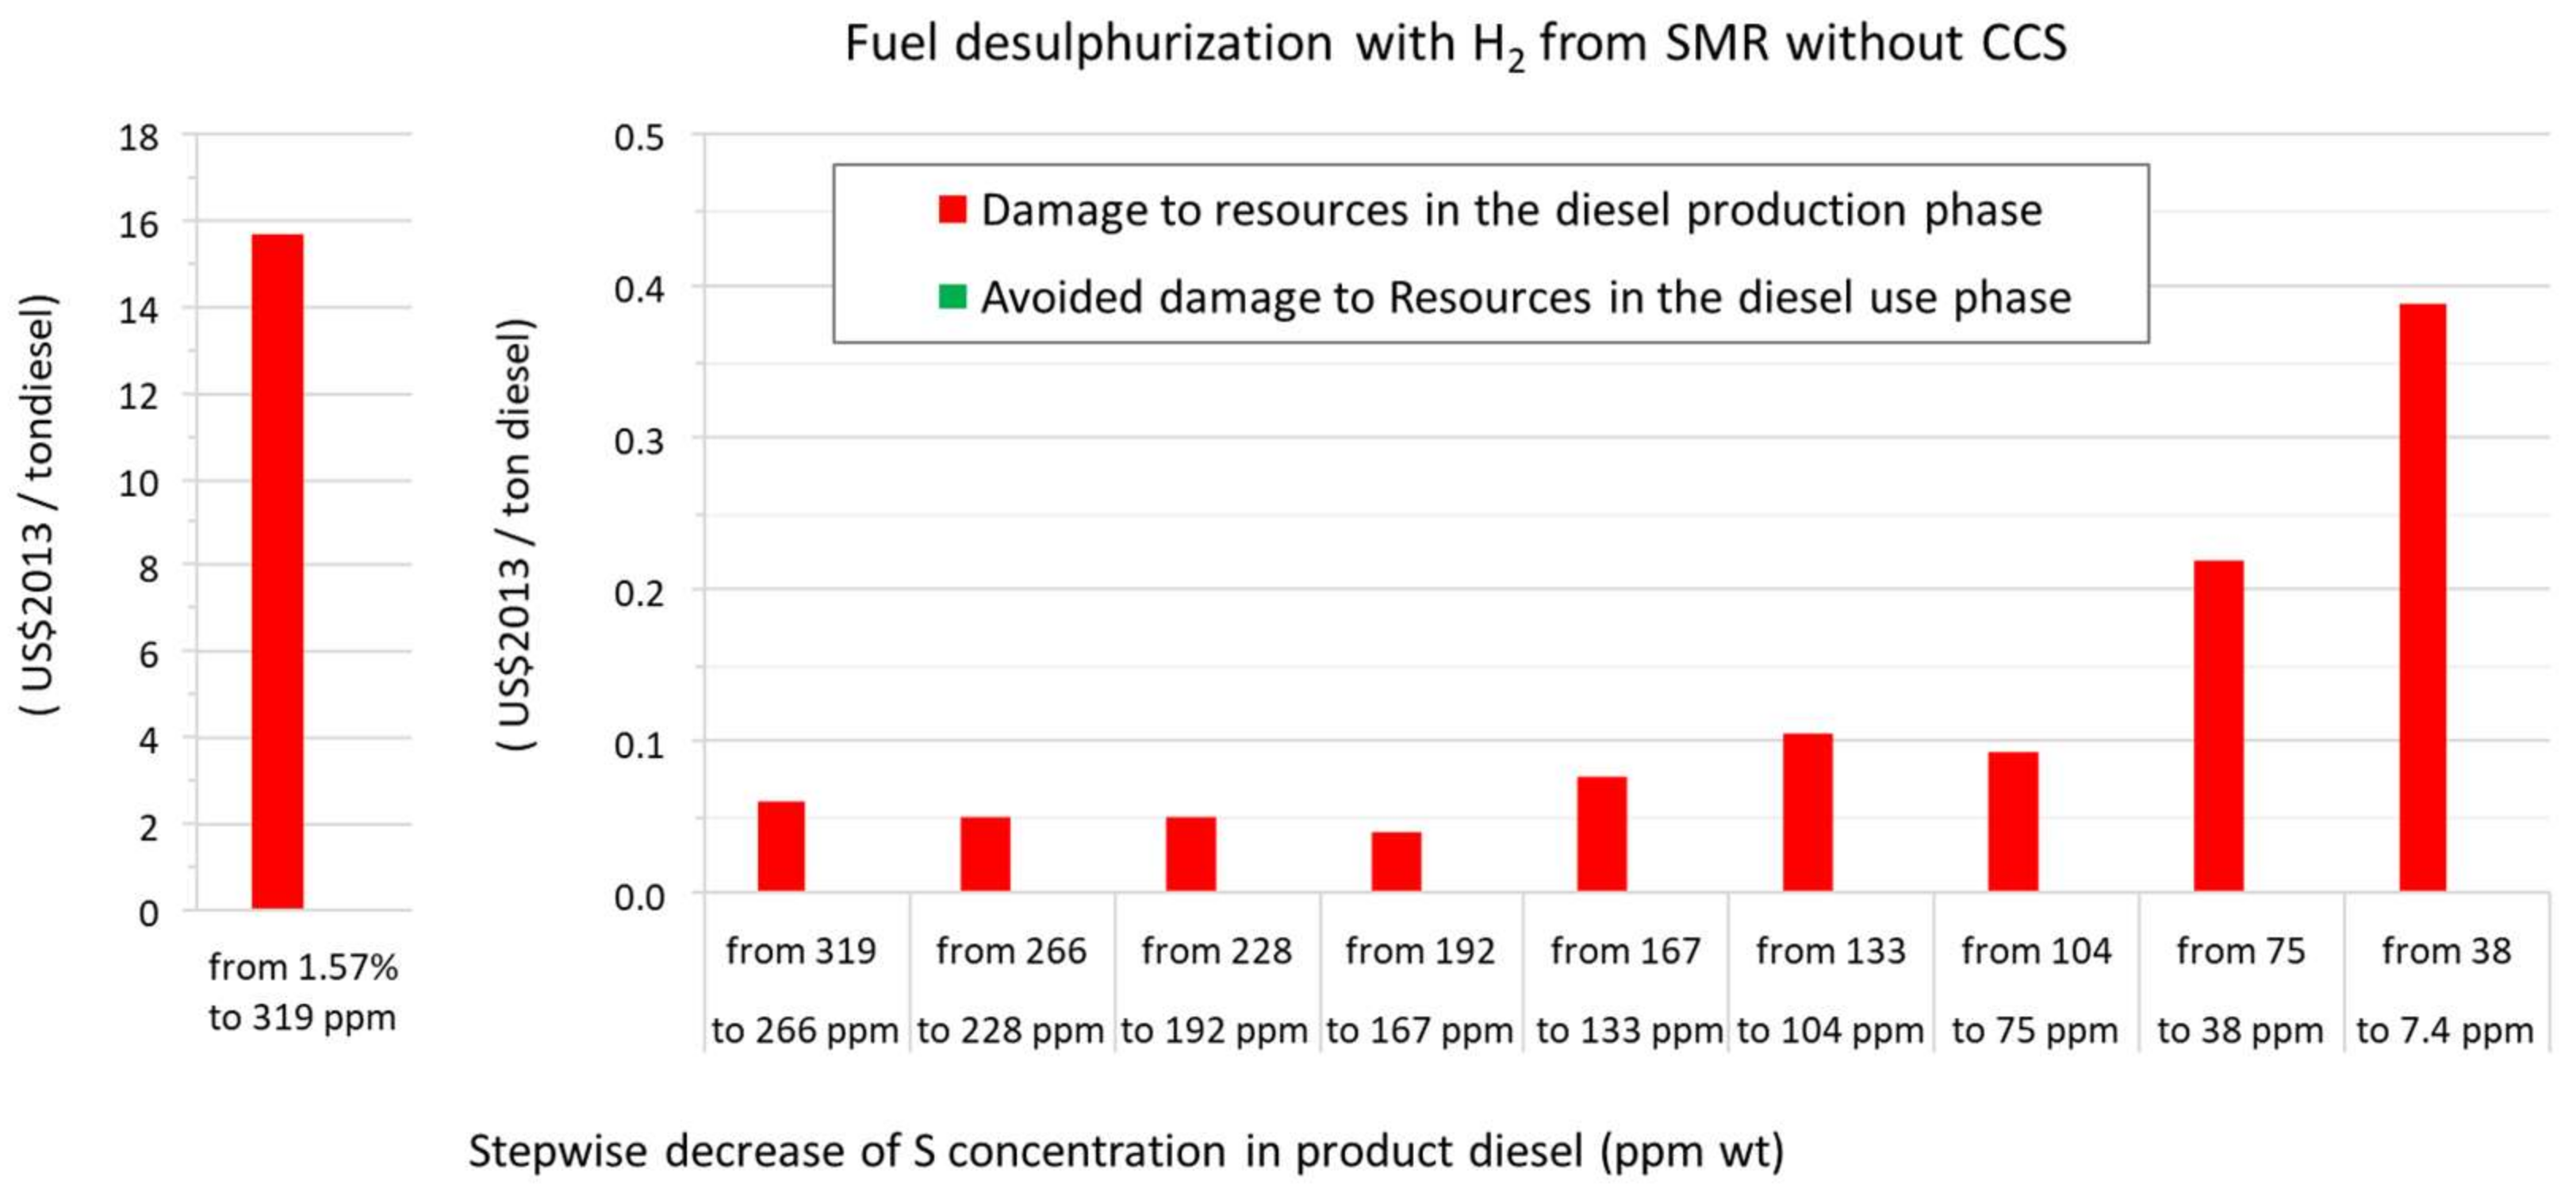
Results for the ReCiPe endpoint of ‘damage to resource availability’: The ‘additional’ damage in the production phase of desulphurized diesel (red bars) for an initial HDS feedstock with 1.57% S concentration. Data at the x-axis are the stepwise decrease of S concentration in diesel in ppm. Note that there is no benefit for resource availability due to SO2 avoidance.
Figure 6.
Results for the ReCiPe endpoint of ‘damage to resource availability’: The ‘additional’ damage in the production phase of desulphurized diesel (red bars) for an initial HDS feedstock with 1.57% S concentration. Data at the x-axis are the stepwise decrease of S concentration in diesel in ppm. Note that there is no benefit for resource availability due to SO2 avoidance.

Figure 7.
Comparison of eco-cost of diesel production for present scenario and future scenarios. ‘Overall’ desulphurization from 1.57% S in the feedstock to 7.4 ppm S in the diesel.
Figure 7.
Comparison of eco-cost of diesel production for present scenario and future scenarios. ‘Overall’ desulphurization from 1.57% S in the feedstock to 7.4 ppm S in the diesel.

Table 1.
Comparison of the ‘overall’ eco-costs of production of desulphurized diesel of the present system and the alternatives for the future. ‘Overall’ desulphurization from 1.57% S in the feedstock to 7.4 ppm S in the diesel.
Table 1.
Comparison of the ‘overall’ eco-costs of production of desulphurized diesel of the present system and the alternatives for the future. ‘Overall’ desulphurization from 1.57% S in the feedstock to 7.4 ppm S in the diesel.
| SCENARIO (1.57% S in Feed to 7.4 ppm S in Diesel) | Present: H2 from SMR without CCS | Future: H2 from SMR with CCS | Future: H2 from Water Alkaline Electrolysis | |||
|---|---|---|---|---|---|---|
| 53% CO2 Capture | 90% CO2 Capture | |||||
| Electricity | EU Grid * | Windpower ** | Hydropower *** | |||
| Eco-costs H2 for HDT/HDS | (€/ton diesel) | 10.9 (64%) | 6.7 (53%) | 3.6 (37%) | 3.0 (44%) | 1.17 (24%) |
| Eco-costs HDT/HDS (H2 excluded) | (€/ton diesel) | 3.0 (18%) | 3.0 (23%) | 3.0 (31%) | 1.1 (16%) | 1.0 (20%) |
| Eco-costs amine treatment | (€/ton diesel) | 2.4 (14%) | 2.4 (19%) | 2.4 (25%) | 2.3 (33%) | 2.3 (46%) |
| Eco-costs sulphur recovery | (€/ton diesel) | 0.6 (4%) | 0.6 (5%) | 0.6 (6%) | 0.5 (7%) | 0.5 (10%) |
| Total eco-costs production | (€/ton diesel) | 16.9 (100%) | 12.7 (100%) | 9.5 (100%) | 6.9 (100%) | 4.9 (100%) |
| Avoided eco-costs (avoided SO2 emissions) | (€/ton diesel) | 313.4 | 313.4 | 313.4 | 313.4 | 313.4 |
| ‘Avoided eco-costs’/’Total eco-costs production’ | (€/€) | 18 | 25 | 33 | 46 | 64 |
* 0.0287 €/MJ (average in Europe without Switzerland); ** 0.0016 €/MJ (electricity offshore windmill, Dutch coast); *** 0.00045 €/MJ (hydroelectric power, Norway).
Table 2.
Comparison of the ‘overall’ eco-costs of the present system of hydrodesulphurization of a feedstock with variable S content to diesel with 38 ppm S.
Table 2.
Comparison of the ‘overall’ eco-costs of the present system of hydrodesulphurization of a feedstock with variable S content to diesel with 38 ppm S.
| SCENARIO | Present: H2 from SMR without CCS | ||||||
|---|---|---|---|---|---|---|---|
| (Variable S Concentration in Feed to 38 ppmS Diesel) | |||||||
| S content in feed | (wt%) | 1.30 | 1.40 | 1.50 | 1.57 | 1.70 | 1.80 |
| Eco-costs H2 for HDT/HDS | (€/ton diesel) | 9.78 (65.8%) | 10.18 (65.9%) | 10.58 (65.9%) | 10.86 (65.9%) | 11.38 (66.0%) | 11.78 (66.1%) |
| Eco-costs HDT/HDS (H2 excluded) | (€ ton diesel) | 2.59 | 2.58 | 2.60 | 2.60 | 2.59 | 2.60 |
| Eco-costs amine treatment | (€/ton diesel) | 1.98 | 2.13 | 2.29 | 2.40 | 2.59 | 2.75 |
| Eco-costs sulphur recovery | (€/ton diesel) | 0.51 | 0.55 | 0.59 | 0.61 | 0.67 | 0.70 |
| Total ‘eco-costs production’ | (€/ton diesel) | 14.87 (100%) | 15.44 (100%) | 16.05 (100%) | 16.47 (100%) | 17.23 (100%) | 17.83 (100%) |
| ‘Avoided eco-costs’ (avoided SO2 emissions) | (€/ton diesel) | 258.77 | 278.73 | 298.70 | 312.88 | 338.60 | 358.55 |
| ‘Avoided eco-costs’/Total ‘eco-costs production’ | (€/€) | 17.4 | 18.1 | 18.6 | 19.0 | 19.7 | 20.1 |
Table 3.
Country factors (kg SO2 equivalent per kg SO2) in damage-based systems to correct for the local carbonate buffering (a high factor means a low level of carbonate buffering and thus a high level of damage). Calculated from [41].
Table 3.
Country factors (kg SO2 equivalent per kg SO2) in damage-based systems to correct for the local carbonate buffering (a high factor means a low level of carbonate buffering and thus a high level of damage). Calculated from [41].
| Factor | Country | Factor | Country | Factor | Country |
|---|---|---|---|---|---|
| 0.024 | Albania | 1.741 | Germany | 3.453 | Norway |
| 0.543 | Austria | 0.906 | Great Britain | 1.330 | Poland |
| 0.525 | Belarus | 0.009 | Greece | 0.028 | Portugal |
| 1.205 | Belgium | 0.414 | Hungary | 0.153 | Romania |
| 0.077 | Bosnia and Herzegovina | 0.426 | Ireland | 0.028 | Russia |
| 0.031 | Bulgaria | 0.084 | Italy | 0.111 | Serbia and Montenegro |
| 0.143 | Croatia | 0.329 | Latvia | 0.181 | Slovenia |
| 1.618 | Czech Republic | 0.434 | Lithuania | 0.600 | Slovakia |
| 1.560 | Denmark | 0.961 | Luxemburg | 0.082 | Spain |
| 0.282 | Estonia | 0.027 | Macedonia | 1.521 | Sweden |
| 0.353 | Finland | 0.134 | Moldova | 0.377 | Switzerland |
| 0.546 | France | 1.186 | Netherlands | 0.117 | Ukraine |
Table 4.
City factors (health damage factors for fine dust PM2.5, per kg SO2) to correct for the linear population density (a high factor means high damage to human health). Note: the norm city has a theoretical size of 2 million inhabitants and 200 km² urbanized area, based on parametrization of 3600 world’s largest cities.
| City | Factor | City | Factor | City | Factor | City | Factor |
|---|---|---|---|---|---|---|---|
| normal city | 1.78 | Den Haag | 0.73 | London | 2.79 | Munich | 1.05 |
| Amsterdam | 0.84 | Eindhoven | 0.30 | Lyon | 0.93 | Paris | 2.71 |
| Barcelona | 2.05 | Frankfurt | 0.57 | Madrid | 1.62 | Rome | 1.00 |
| Berlin | 1.57 | Hannover | 0.46 | Marseille | 0.69 | Rotterdam | 0.55 |
| Brussels | 1.19 | Koln | 0.66 | Milano | 1.26 | rural average | 0.22 |
© 2019 by the authors. Licensee MDPI, Basel, Switzerland. This article is an open access article distributed under the terms and conditions of the Creative Commons Attribution (CC BY) license (http://creativecommons.org/licenses/by/4.0/).
Share and Cite
MDPI and ACS Style
Olindo, R.; Vogtländer, J.G. The Role of Hydrogen in the Ecological Benefits of Ultra Low Sulphur Diesel Production and Use: An LCA Benchmark. Sustainability 2019, 11, 2184. https://0-doi-org.brum.beds.ac.uk/10.3390/su11072184
AMA Style
Olindo R, Vogtländer JG. The Role of Hydrogen in the Ecological Benefits of Ultra Low Sulphur Diesel Production and Use: An LCA Benchmark. Sustainability. 2019; 11(7):2184. https://0-doi-org.brum.beds.ac.uk/10.3390/su11072184
Chicago/Turabian StyleOlindo, Roberta, and Joost G. Vogtländer. 2019. "The Role of Hydrogen in the Ecological Benefits of Ultra Low Sulphur Diesel Production and Use: An LCA Benchmark" Sustainability 11, no. 7: 2184. https://0-doi-org.brum.beds.ac.uk/10.3390/su11072184
Note that from the first issue of 2016, this journal uses article numbers instead of page numbers. See further details here.