Walkability Assessment in a Rapidly Urbanizing City and Its Relationship with Residential Estate Value


1
Department of Architecture, National University of Singapore, Singapore 117566, Singapore
2
School of Urban Planning and Design, Peking University, Shenzhen 518055, China
3
College of Urban and Environmental Sciences, Peking University, Beijing 100871, China
*
Author to whom correspondence should be addressed.
Sustainability 2019, 11(8), 2205; https://0-doi-org.brum.beds.ac.uk/10.3390/su11082205
Submission received: 17 March 2019
/
Revised: 4 April 2019
/
Accepted: 6 April 2019
/
Published: 12 April 2019
(This article belongs to the Collection Sustainable Built Environment)
Abstract
:Walkability has increasingly been recognized as an important factor for sustainable urban development that, however, has seldom been investigated in rapid urbanizing cities, especially in the Asian context. This paper assessed walkability in Futian District in the central area of Shenzhen, which has undergone very rapid urbanization within a short period of time. Walkability was assessed for 2013 and 2018 using a walkability index adapted from Walk Score. It was compared with housing prices of 215 randomly selected residential buildings, to further explore the relationships between walkability and residential estate value, provided as one practical application of the assessment of walkability in urban management. Our results show that Futian District has low walkability level, although walkability has been generally improved from 2013 to 2018. A high spatial variation of walkability level within this area was observed in both years. Overall, there was a negative relationship between walkability and housing prices (significant only in 2018), which is inconsistent with studies elsewhere. The results suggest that the housing prices in Futian District are more strongly influenced by other factors rather than by walkability. In addition, the ability of the walkability model to explicitly delineate spatial variation of walkability level makes it a powerful tool to be applied in urban planning and management. Results of this study also have practical applications, which can be used as a reference for residents’ home selection and enable them to make informed decisions in selecting walkable neighborhoods with acceptable prices.
1. Introduction
Walking within the city has been overlooked, undervalued, or not adequately recognized as an important mode of movement with the appearance of car and development of high-speed road transport since the 1920s [1,2,3]. In fact, it was reported that car-oriented transportation systems and land use policies nowadays have made walking less convenient and more dangerous, and pedestrian accessibility has declined steadily in conjunction with urban development in a large number of cities worldwide [4,5,6]. The high dependence on car as means of transportation is a widely recognized urban issue, as it is associated with increasing urban sprawl and low density of land use, high dependence on energy, increasing atmospheric and noise pollution, and long commuting time caused by traffic congestion. There has thus been high level of advocacy to reduce car dependence and instead plan and design cities to be more walkable. Promoting walkability has become the main focus of environmental and policy initiatives in a number of cities in recent decades [5,7,8,9], which is not surprising as walking plays an important and unique role in an efficient transport system [1,3]. It provides benefits in mobility, physical activity, psychological pleasure, health, social connection, recreation, environment protection, energy conservation, etc. [6,10,11]. Therefore, walkable cities have been advocated, and walkability has been treated as the foundation of a sustainable and livable city [6,10].
The concept of walkability essentially is about how conductive the built environment is for walking to various destinations [5,6,10,12,13]. Walkability captures the proximity between functionally complementary land uses and the directness of a route, or the connectivity between destinations from the perspective of accessibility [12], which is often associated with factors like street width, street connectivity, pedestrian crossings, number of lanes, distribution of facilities, safe speed, etc. [5,7,9,10,14]. Apart from the accessibility perspective, walkability also can be defined as a pleasant walking environment, which is influenced by a number of factors such as cleanness of streets, safe crossings, sense of security, appearance of street trees, lighting at night, etc. [3,6,8,15,16].
Accordingly, within the spectrum of walkability assessment, previous studies have focused on assessing pedestrian environment, which was either assessed subjectively by respondents or objectively by researchers [8,15,17,18]. In these studies, checklists assessment, stated preference survey, on-street survey, and on the move survey are commonly used methods to obtain pedestrians’ perceptions on walking environment [8,18]. There are also studies using multi-layer geographic information data to objectively assess walkability level in GIS, including residential density, street connectivity, land-use mix, intersections, land use accessibility and diversity of uses, net retail area, etc. [5,7,9,14,19,20,21].
Walkability also can be assessed from the perspective of accessibility to daily facilities [13,22]. The literature indicates that accessibility-based factors are more indicative of walkability level and have a stronger effect on walking behavior [10,23]. Specifically, if a certain area is more supportive of walking to reach various daily facilities, then the walkability level in this area would be higher [22]. This perspective is in line with the essence of the concept of walkability, since a walkable area should provide opportunities to reaching various destinations [13]. This approach is actually a proxy of land-use mix and street connectivity, which were used to represent the diversity of land uses and facilities in some previous studies [7,14,18]. In other words, walkability assessment based on distribution of public facilities (i.e., facility-based walkability assessment) treats accessibility and diversity of services as the leading predictor of walking behavior. Facility-based walkability assessment is superior in assessing and benchmarking walkability, using geospatial data in a direct and replicable manner, compared with measures of surveys, self-reporting perceptions, audits, and observational data employed in previous studies [10]. Yet, while the existing literatures provide information and methodology for walkability assessment, facility-based walkability measurement is not widely used and needs further exploration. Walk ScoreTM is a typical walkability measurement based on the assessment of accessibility to daily facilities. Walk Score was developed by Frontlane in partnership with academics [24], and has been validated as an appropriate measurement of walkability [24,25,26,27]. More specifically, Walk Score was found to be significantly positively correlated with commonly used objective measures of walkability (such as street connectivity, residential density, accessibility to public transits, etc.), as well as subjective evaluation of walkable environment attributes [24]. Therefore, Walk Score has the potential to be used as a comprehensive measurement of walkability, which is also more operational than traditional measurements. However, the Walk Score database currently is only available mainly for U.S. cities and several Canadian cities. Very few studies have been conducted elsewhere in the world, including China. This study applied Walk Score to a rapidly urbanizing district in Shenzhen and explored the spatial and temporal variations in walkability over two time periods. In addition, as walkability is associated with a wide range of urban features, we also investigated the relationship between walkability and real estate value in the study area.
The measurement of walkability has applications in a variety of research fields, including geography, urban planning, architecture, psychology, public health, economic studies, etc. For instance, it has been adopted in many cities around the world to investigate its relationship with people’s walking behavior, physical activities, modes of transportation, life quality, community safety, etc. [2,9,14,20,28,29,30,31]. A growing body of studies showed that a community with high walkability tends to lead to high social [32,33], economic [10,11,34,35,36], environmental [6,37], and public health values [21,38,39,40,41]. One particular application of walkability assessment in economic domain is the investigation of the relationship between walkability and real estate value [35]. The economic value of a walkable neighborhood was obtained by encouraging economic transactions and social exchanges [1,11,42]. A growing number of studies have contributed to the debate on the relationship between walkability level and property value [1,10,34,35,36,42,43,44,45,46]. For instance, it was reported that walkability level is positively correlated with residential estate value in 13 out of 15 housing markets sampled in U.S. metropolitan areas [34]. Similarly, Pivo and Fisher [35] found that greater walkability was capitalized into higher apartment values consistently. Gilderbloom [10]’s study found a positive impact of walkability on housing value. Rauterkus and Miller [36]’s finding is also in agreement with this positive correlation, and they found that this relationship is stable over time. However, Rauterkus and Miller [36] reported that in more car-dependent neighborhoods the impact of walkability on residential land values becomes weaker. Likewise, Li, Joh [45] reported that improvement of walkability yielded a greater housing price increase in a walkable neighborhood than in a car-dependent neighborhood. Apart from positive correlations, insignificant or negative correlations were also observed. Boyle, Barrilleaux [46] found that walkability’s impact on housing value is statistically insignificant in Miami, Florida. Similarly, in Cortright [34], two out of the 15 studies housing markets did not show positive correlation between walkability and housing value, and one of them (Las Vegas) exhibited negative correlation, while another one (Bakersfield) showed insignificant correlation.
The studies above demonstrated that there are inconsistencies among different studies, and there are still unanswered questions in the relationship between walkability and real estate value. Several reasons can be postulated, such as socio-economic conditions of the study area, car-dependent level of study area, urban morphology, etc. It thus remains largely unknown that if the positive correlation between walkability and housing value also holds in rapidly urbanizing cities in China. Few studies have been conducted in China to examine the economic impact of walkable neighborhoods, especially in Shenzhen as a typical rapidly urbanizing city where land use, transportation network, and facilities experienced huge changes since 1980s. Unlike some cities in Europe and U.S. with fine-grained pedestrian network, Futian District as the central part of Shenzhen was urbanized rapidly from a small fishing village to a big city in 30 years, from the early 1980s to the late 2000s [47,48,49]. During this period, a large number of main roads with large scales were constructed rapidly to meet the demand of economic increase, which constituted the major components of road system in Shenzhen, with little consideration given to the smaller scale pedestrian design or high-density urban design for creating walkable urban spaces [48,49]. As a result, the planning and urban form of Shenzhen is more car-oriented, rather than pedestrian-oriented. The scale of neighborhood and city is also large and not intimate enough for pedestrians. In this context, this study is essential and would shed light on whether Futian District as a rapidly urbanizing area is walkable for pedestrians, and whether there exists positive correlation between walkability level and residential estate value in this area.
Therefore, the key aim of this study is to use modified Walk Score methodology to assess walkability objectively in a rapidly urbanizing district in China and to explore the relationship between walkability and real estate value, based on the distribution of public facilities and real estate value data collected in 2013 and 2018. The specific objectives are: (1) to see how this methodology can be applied in a Chinese context and to explore spatial and temporal variation of walkability level in a rapidly urbanizing district; (2) to examine if the presumed positive correlation between walkability level and residential estate value holds in this area.
2. Methods
2.1. Data Preparation
2.1.1. Study Area
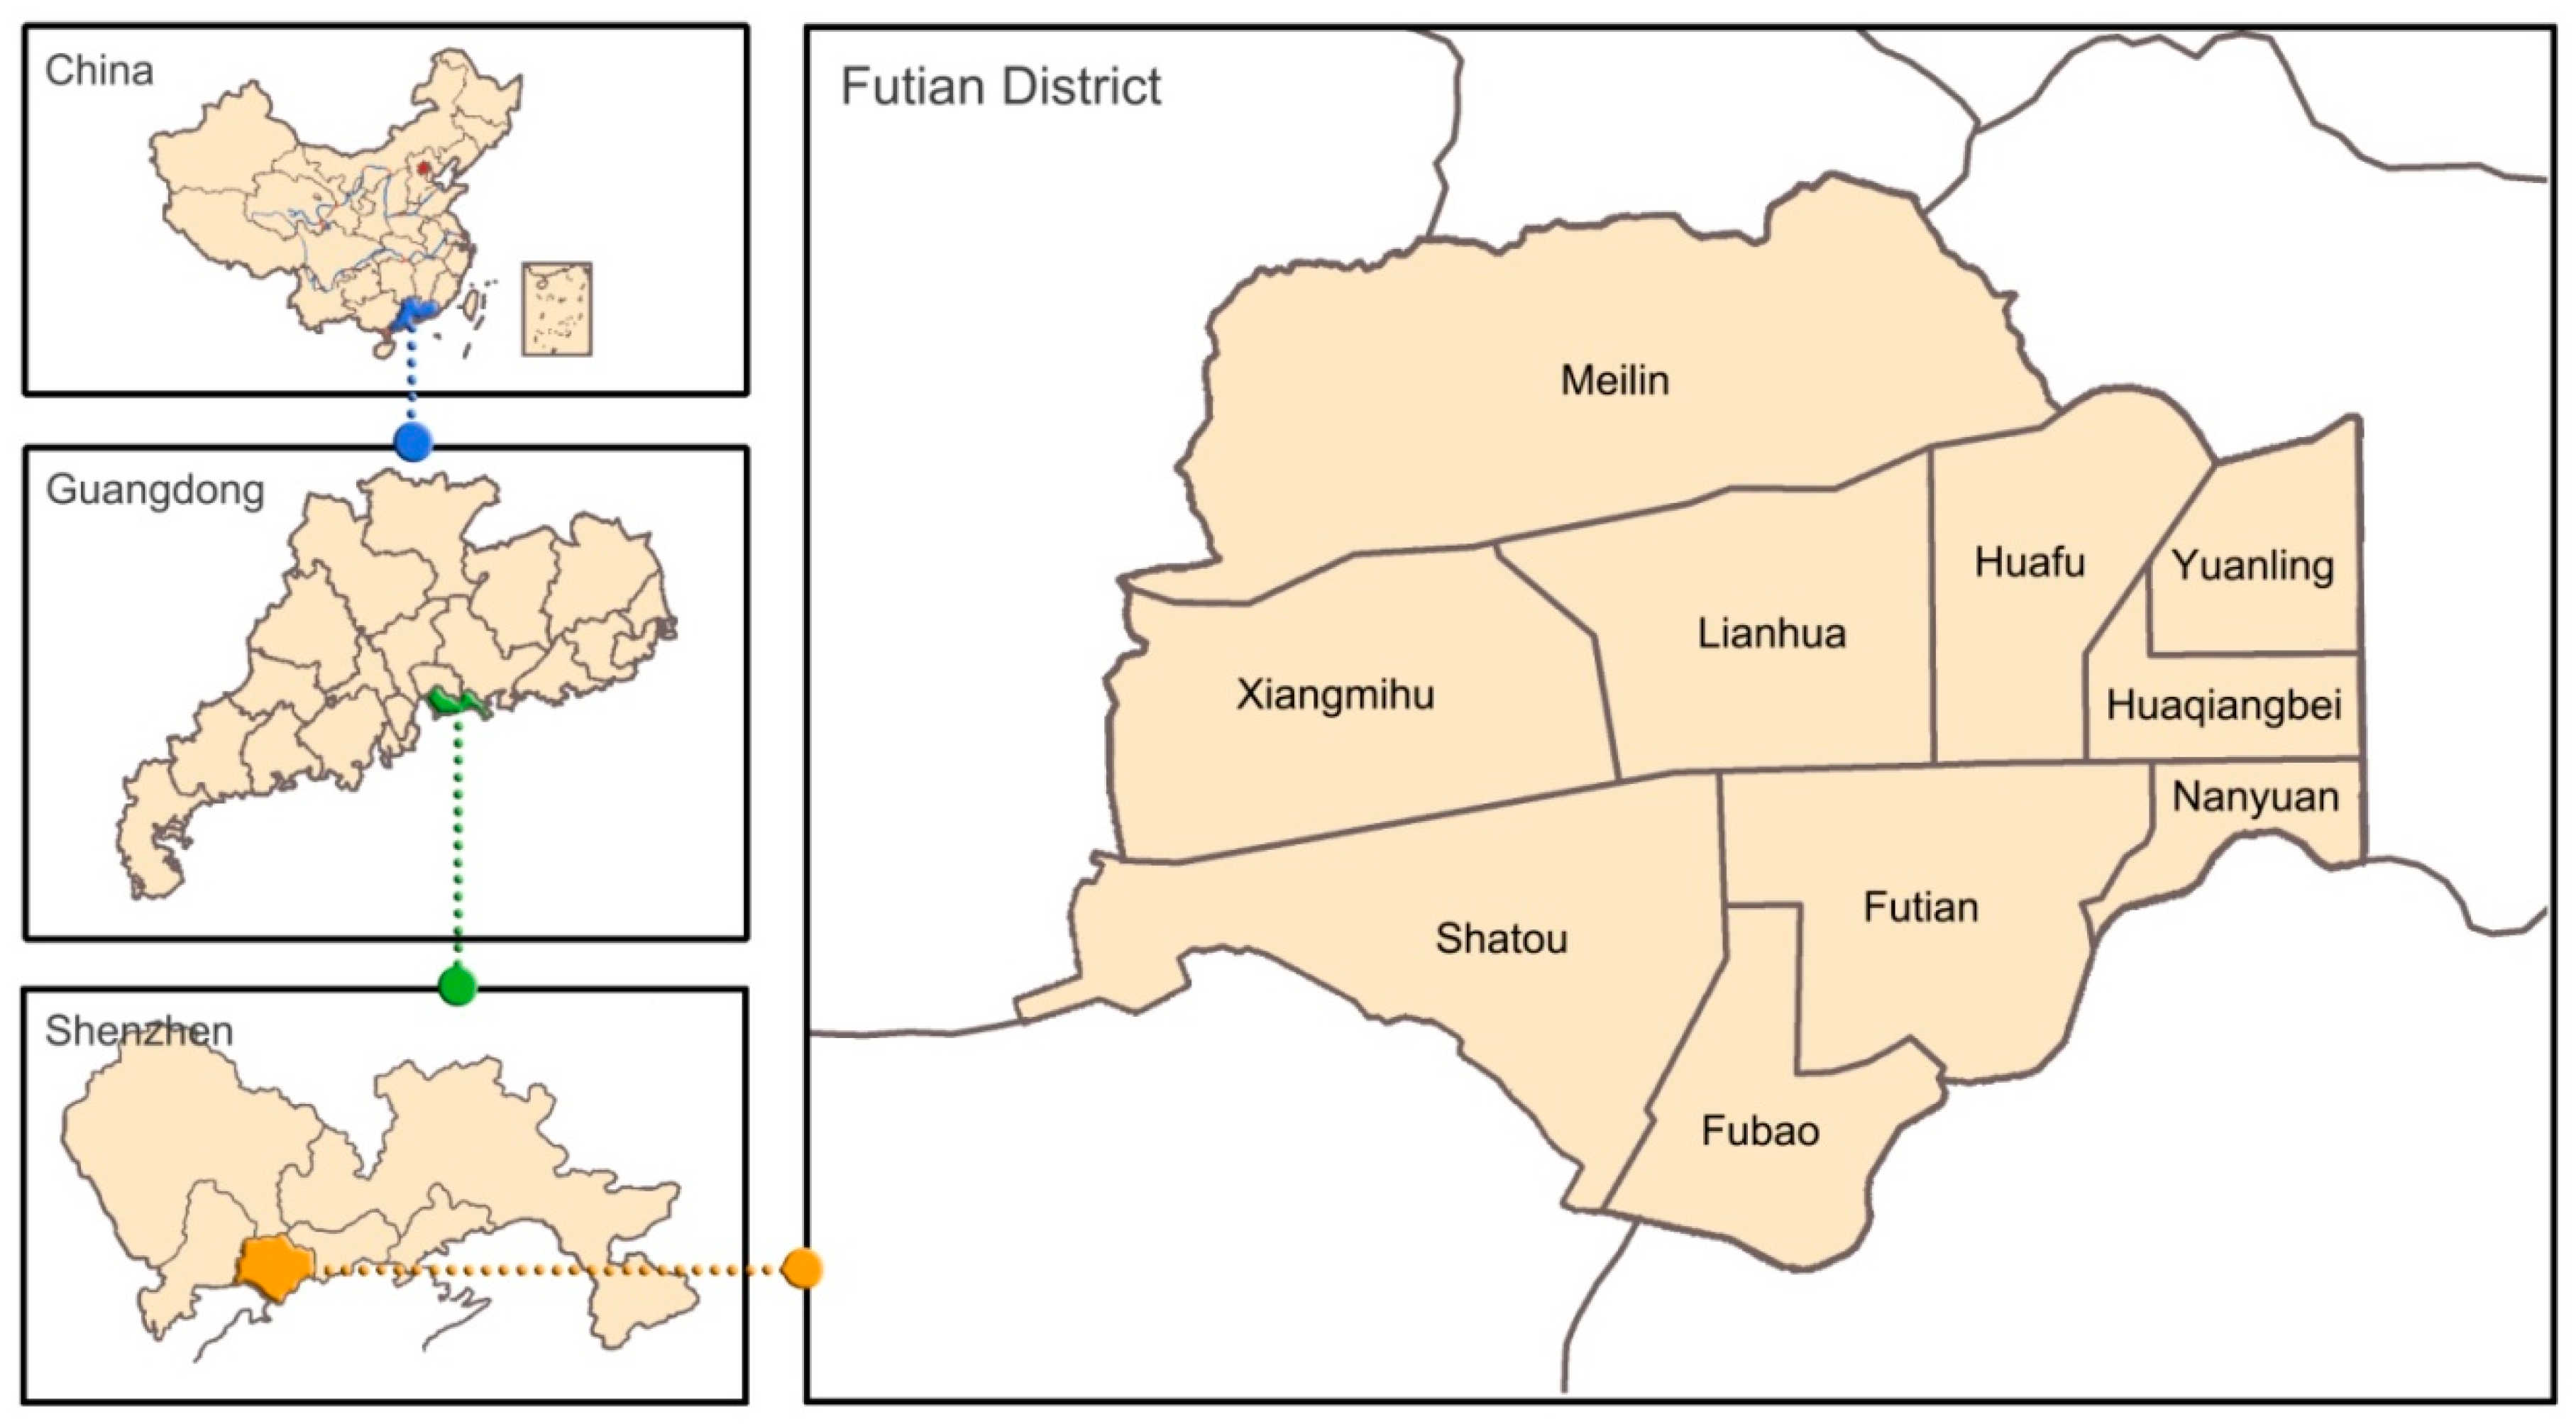
Our study area is Futian District, which is located in the southeastern of Shenzhen, Guangdong province, China (Figure 1). The total area of Futian District is approximately 78 km2, which constitutes 4% of the whole area of Shenzhen. The total population of Futian District is 1,501,700 [50]. There are 10 subzones in this district. Shenzhen is the fourth largest city in China and is one of the wealthiest cities in the country. Shenzhen was designated as the special economic zone in the 1980s, since when the reform and opening up policy was implemented in China and dramatically facilitated the economic development of this area. Futian typifies the rapid urbanization pattern, which was witnessed in many parts of Shenzhen and China.
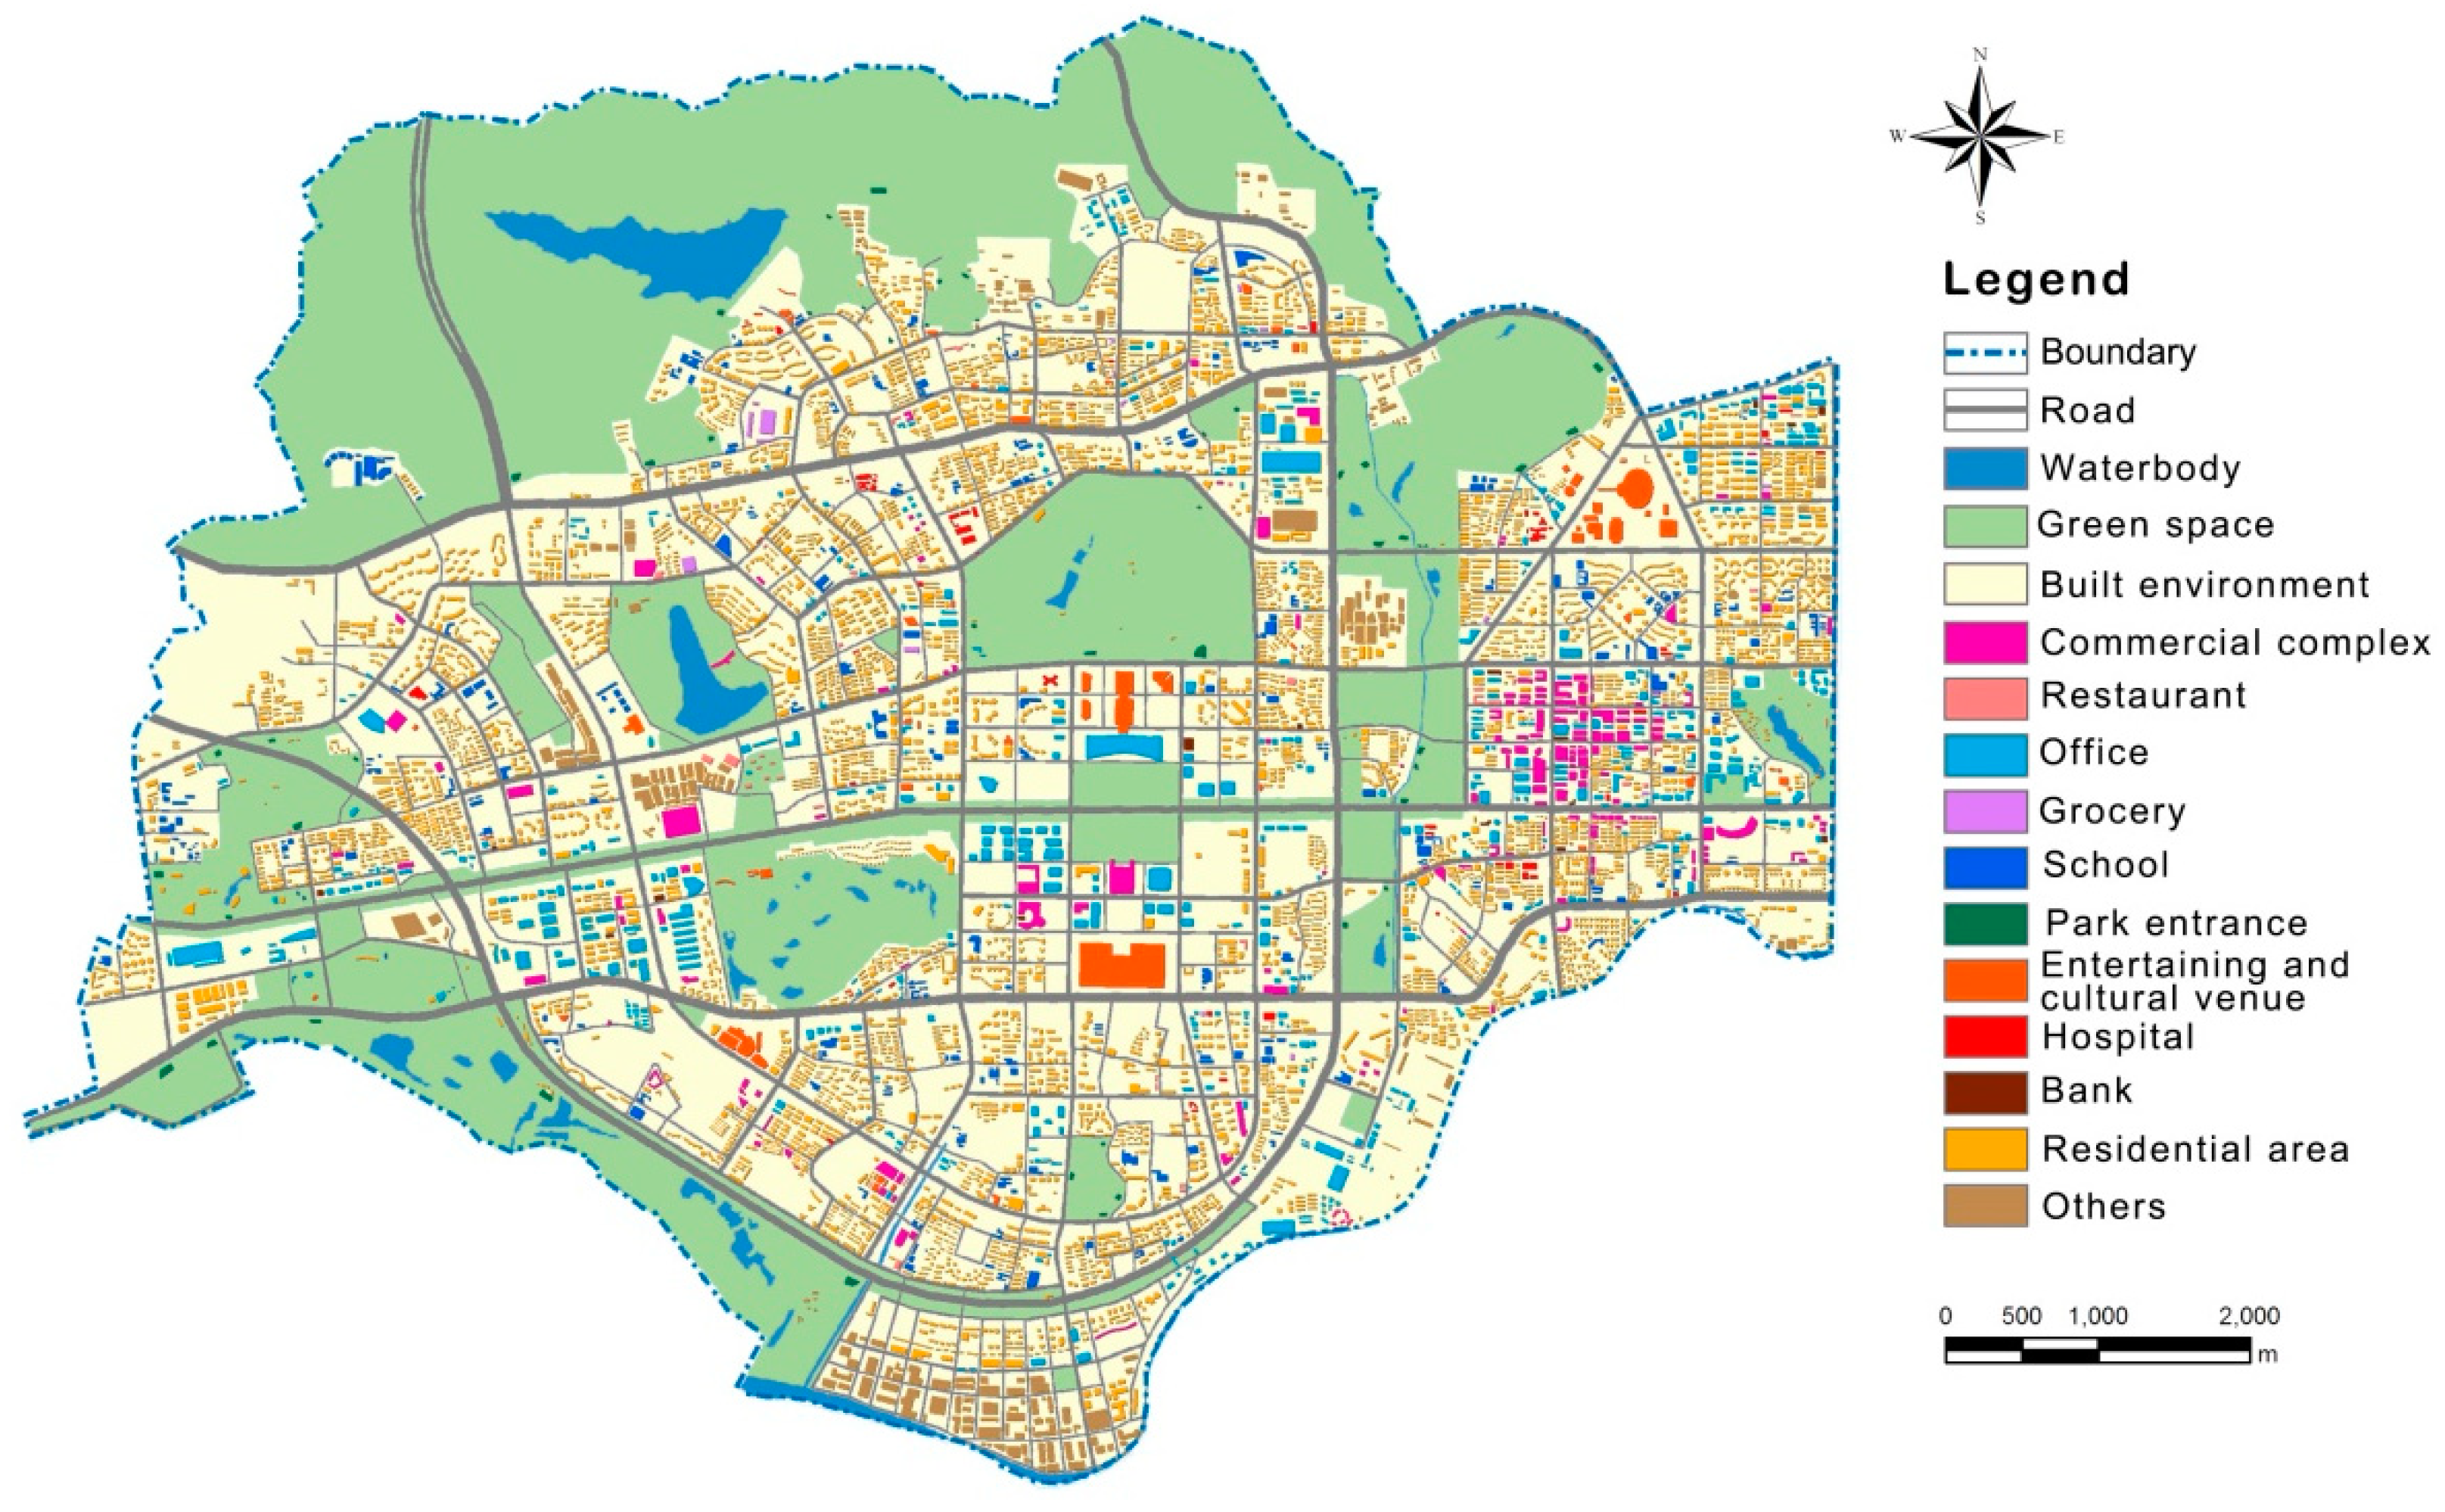
Futian District is the administrative center, central business district, and transportation center of Shenzhen. The development of transportation in this area is especially extensive, involving subways, highways, major roads, minor roads, etc., which consequently exerts a profound influence on the land use alongside the transportation network [47,51]. Since it has the typical characteristics of a transportation system and the distribution of public facilities as a rapid urbanizing area, it thus serves as a suitable site to assess its walkability level. The spatial distribution of built environment, facilities, nature resources, and road network was shown in Figure 2. It can be seen that as with its rapid urbanization process, there are still a certain number of parks and natural resources that were preserved, located in peripheral areas as well as central parts of Futian District.
2.1.2. Data Collection
Data on types, quantity, and spatial distribution of public facilities were in the form of points of interest (POI), collected using Google Map. For the aim of comparative analysis, data were accessed in April 2013 and January 2018, respectively. We collected data for these two years mainly because Shenzhen experienced rapid urbanization during this period. Its urban pattern became more compact because of the prevailing redevelopment of central urban areas. In addition, more public facilities were built, especially in our study site, i.e., Futian District. We thus hypothesized that there exists differences in the walkability level between these two years. The major types of public facilities located within Futian District consist of commercial complex, restaurant, office, grocery, school, park, entertaining and cultural venue, hospital, bank, and others. Each facility’s information (name, type, and coordinates) were converted to point features using ArcGIS10.2 (ESRI, Redlands, CA, USA).
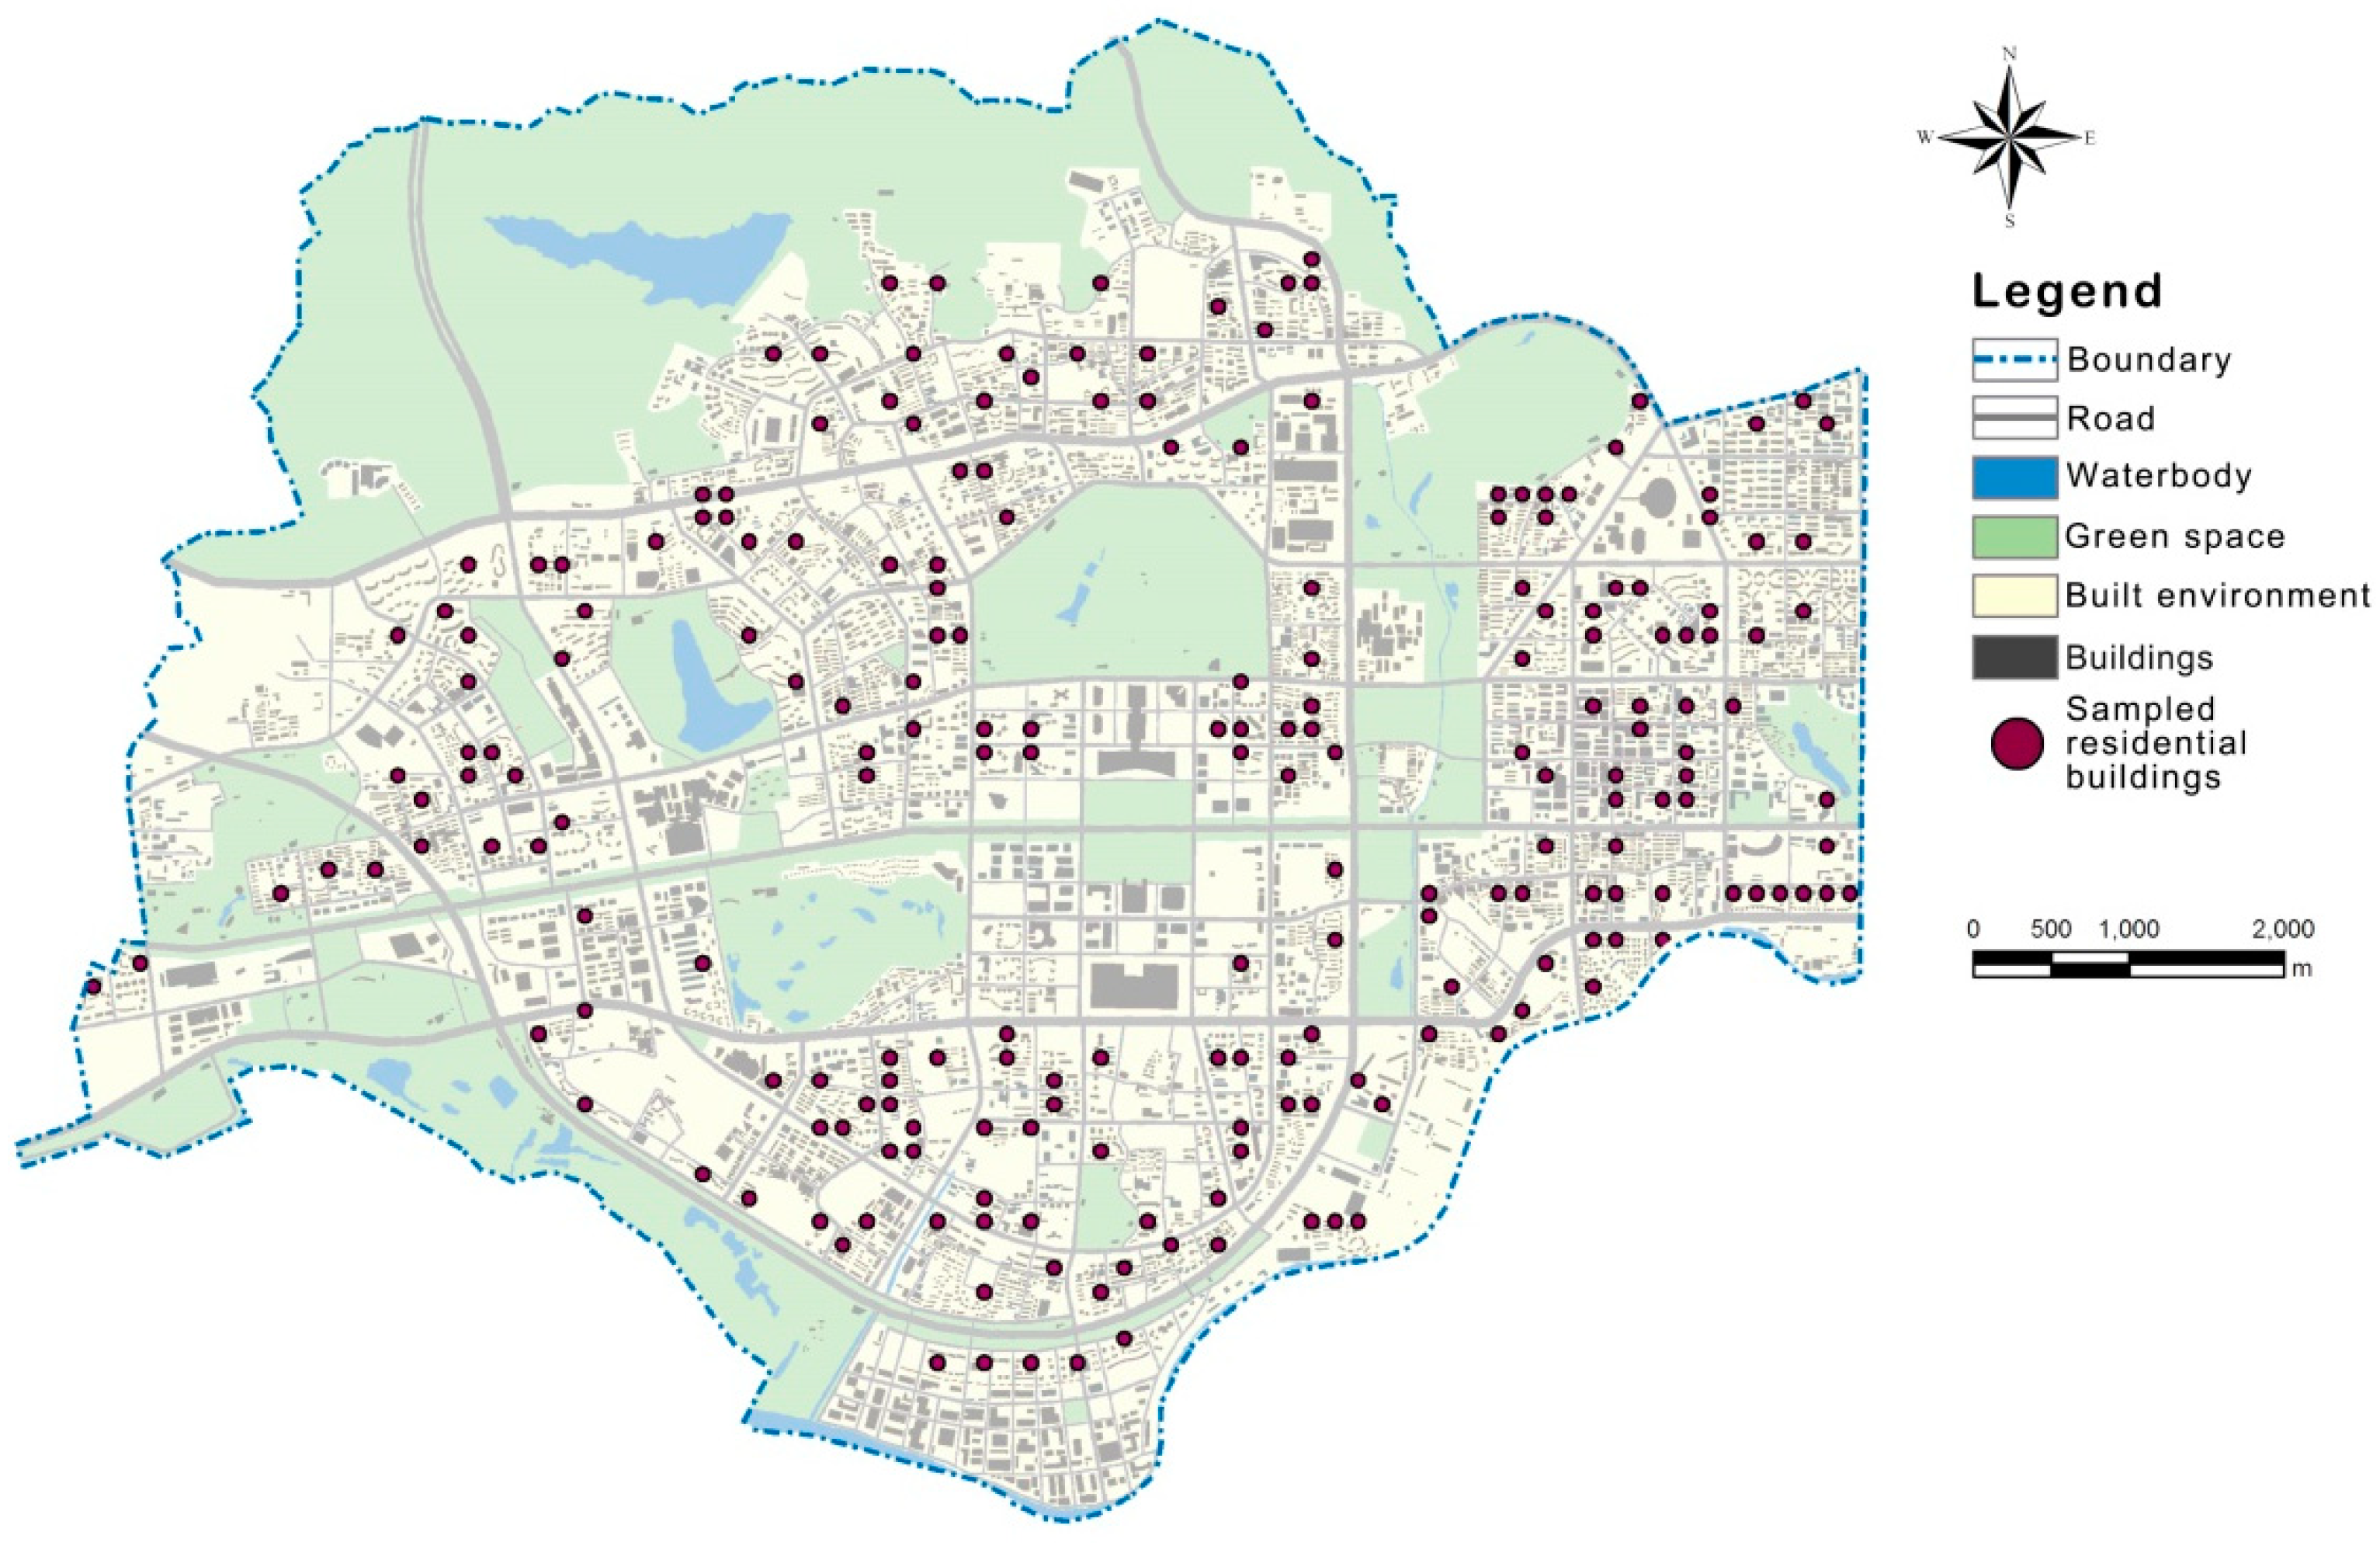
A total number of 215 residential buildings were randomly sampled within Futian District, to represent the general trend of spatial variation in housing values (Figure 3). Specifically, the spatial locations of sampled residential buildings were first abstracted as points which are the centroids of footprints of buildings. Since each point has a unique ID, 220 IDs were randomly selected from all residential building points using a random number generator (source: [53]), and the selected IDs can be used to locate sampled residential buildings. The sampled residential buildings in Futian District share the common attribute of high-rises, with similar architectural typologies. Transaction prices were used to represent the value of sampled residential buildings, which were obtained from two online real estate transaction websites which are commonly used in China, in April 2013 and January 2018, respectively (source: [54,55]). After data check, five sampled buildings were removed from the database due to lack of data on transaction prices, and finally the sample size was 215.
2.2. Development of Walkability Index
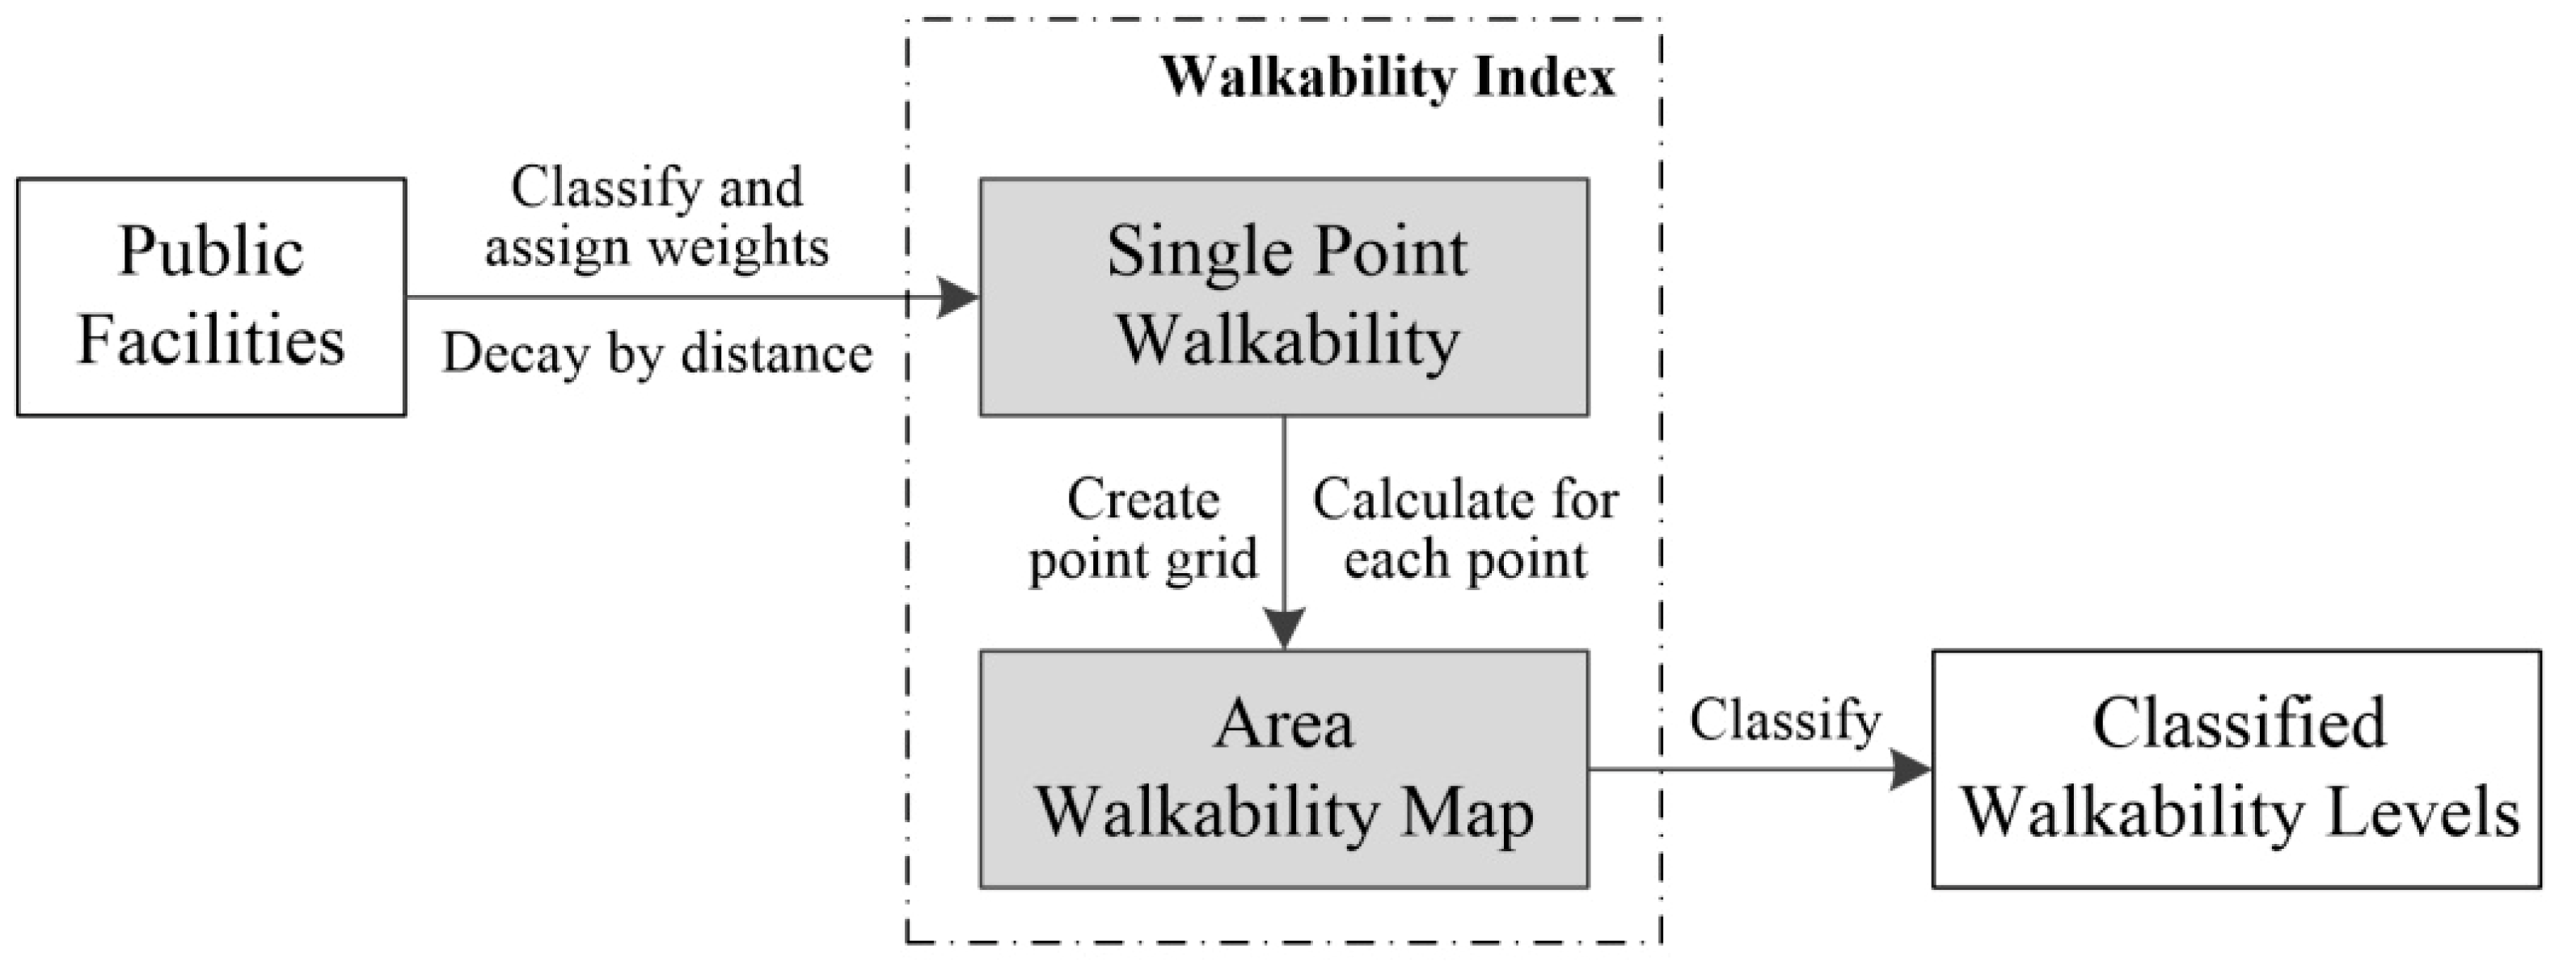
The methodology for quantitative assessment of walkability was adapted from Walk ScoreTM [24]. Carr, Shira [25] tested and concluded that Walk Sore is a reliable and valid measurement of walkability to public facilities. The specific weights assigned to each type of facility were modified based on residents’ daily needs and the types of facilities in Shenzhen, which would be explained in Section 2.2.1. The adapted Walk Score was termed as “walkability index” in this study. The development of this walkability index consists of two levels, which are single point walkability calculation and area walkability map generation, respectively. The methodological framework for the development of walkability index was shown in Figure 4.
2.2.1. Single Point Walkability Calculation
The value of single point walkability illustrates the walkability level of a specific traveling origin to its surrounding facilities, such as schools, parks, restaurants, etc. The data processing procedure of single point walkability was elaborated as follows:
(1) Public facilities classification and weights assigning
Public facilities were classified into nine groups, and weights were assigned to them based on their relative significance to residents’ daily needs [24], with a total weight of 16 (Table 1). The selection of facility types and weights were graded and verified by qualified researchers who developed Walk Score [24], and the weights were slightly modified with reference to the usage of public facilities of residents in Shenzhen and experts’ discussions. Specifically, commercial complex was not incorporated in the original Walk Score calculation, since groceries and single shops are more popular and needed in the American cultural context; while large commercial complex which consists of shops, restaurants, supermarket, cinema, etc. was assigned with the weight of 3 in our modified version, since it is the main venue for shopping and recreation in the context of Shenzhen. Bookstore was assigned with the weight of 1 in original Walk Score, but it was removed in our assessment, since bookstores are not common in Shenzhen due to the high level of digitalization of books and shift of people’s reading behavior towards digital media. In addition, the weights for school and park entrance were both improved from 1 to 1.5, since they are relatively more important for the public in the context of Shenzhen and even China.
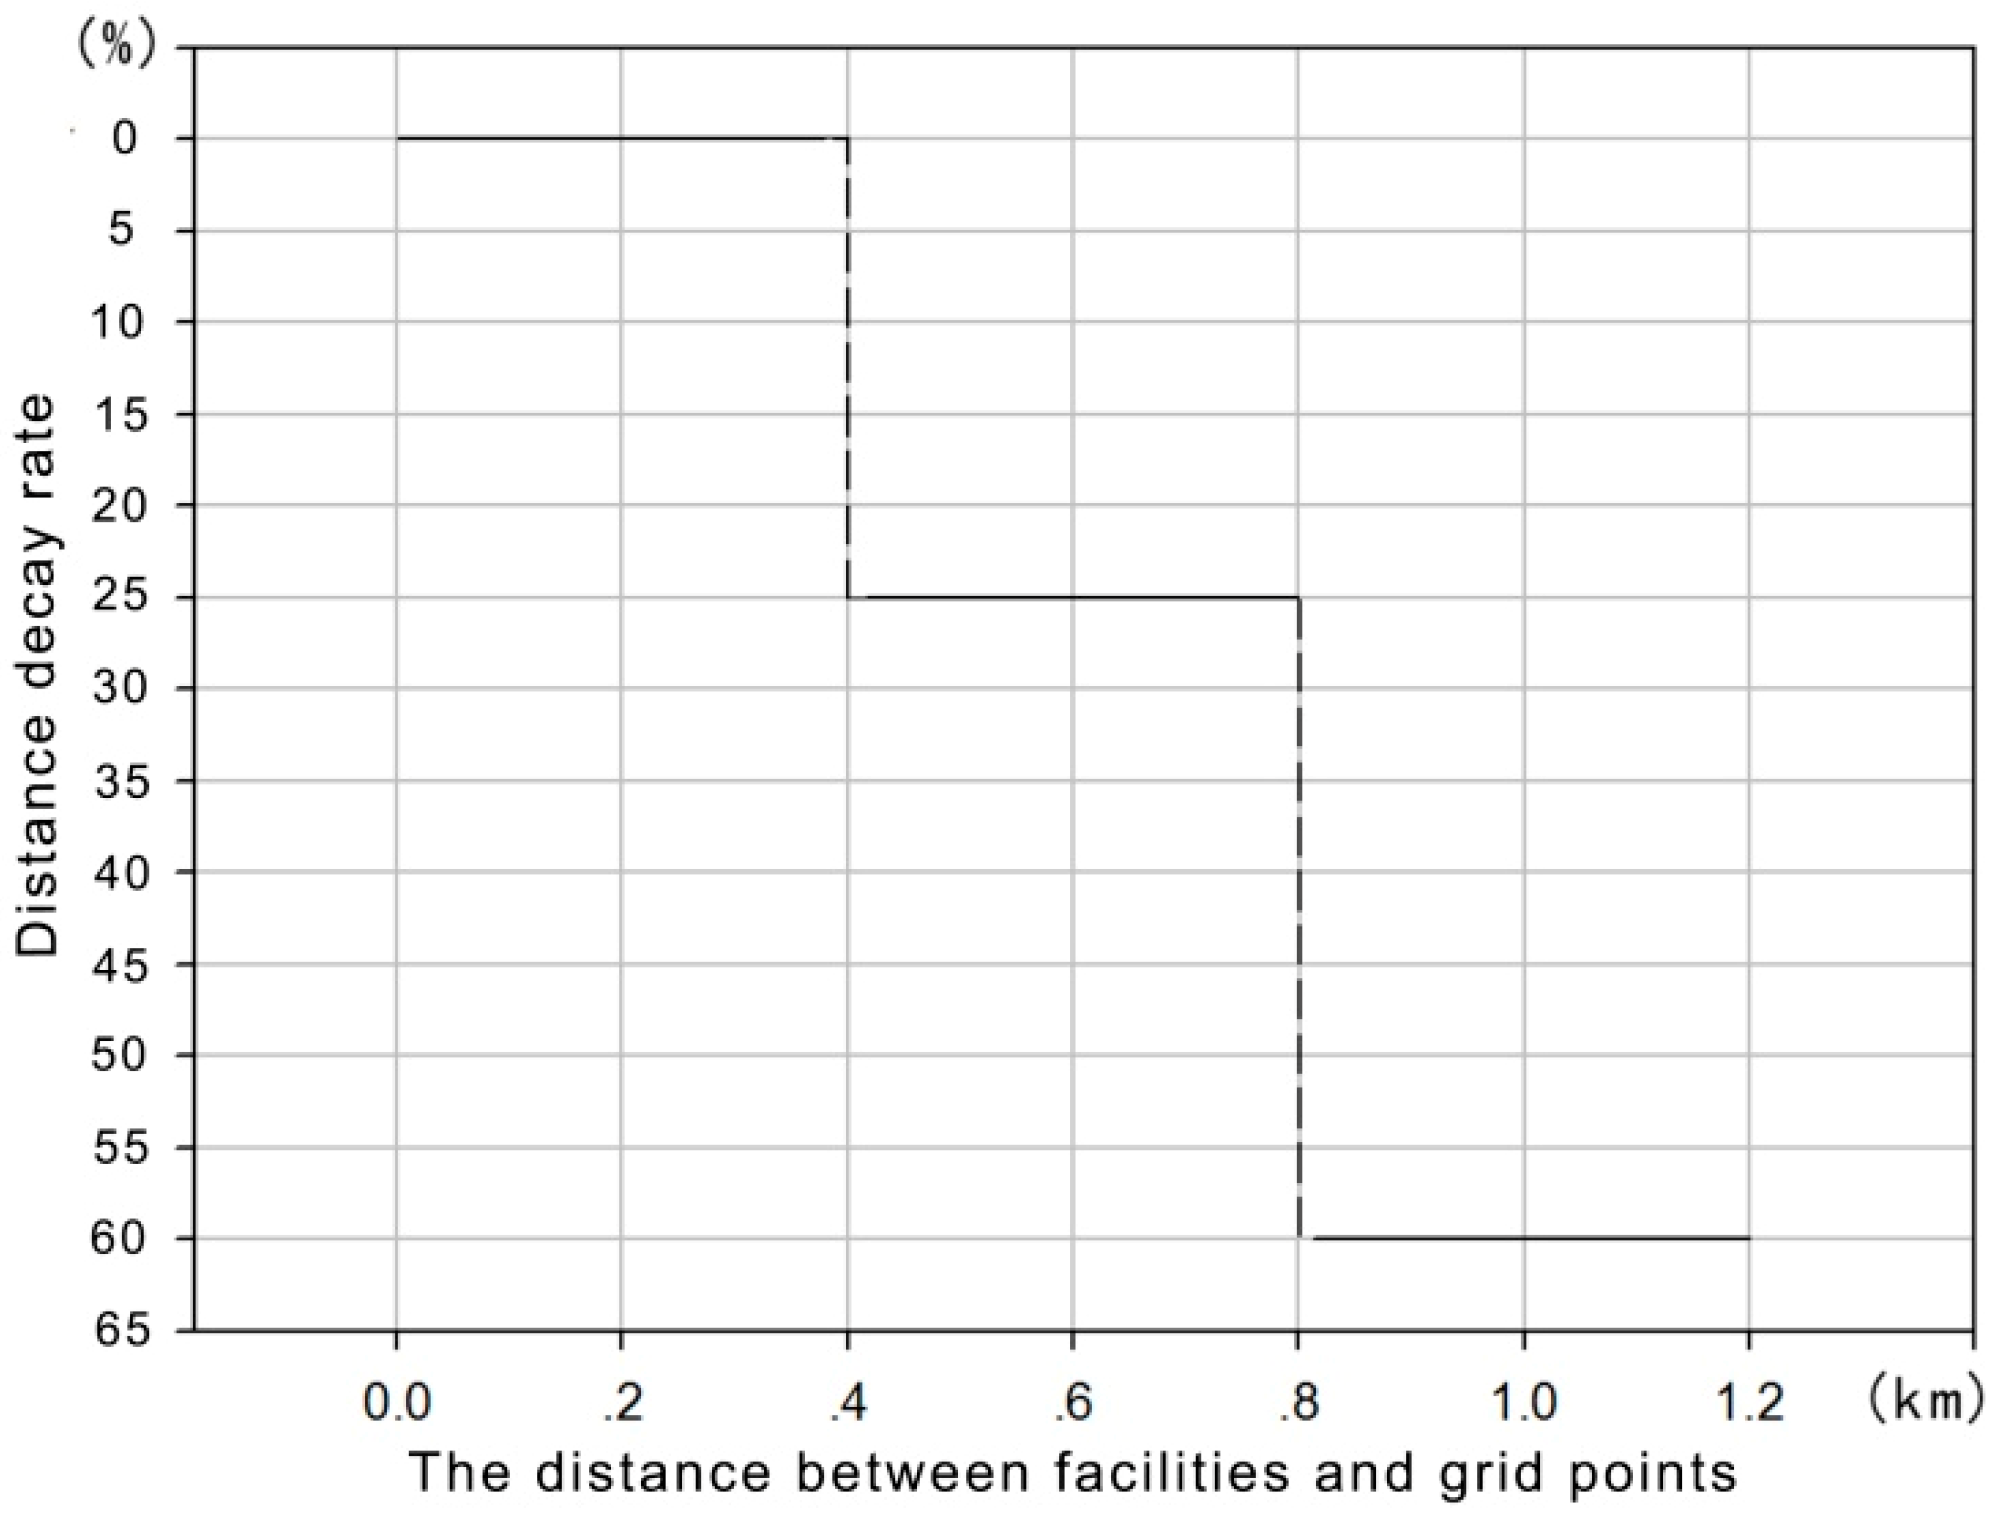
Residents’ accessibility levels to surrounding facilities were calculated using Euclidean distance (Function 1), through Near tool in ArcGIS 10.2. Euclidean distances to each type of facility were weighted and aggregated to calculate single point walkability. However, the influence of facilities on walkability level is not uniform for all surrounding facilities, and it would decay as the distance to facilities increases. Therefore, the single point walkability value was decayed according to the function shown in Figure 5, which was simplified based on Carr, Shira [24]. Distance decay tendency was simplified to an interval curve due to the limitation of computation power of ArcGIS, since the computation task would be too huge if continuous distance decay curve was adopted. The distance decay rate for each interval was in accordance with Carr, Shira [24]. According to the commonly used walking speed of 4.8 km/h [56], residents’ walking distance ranges from 0 to 0.4 km as the increase of walking time from 0 to 5 min. When walking time is increased to 10 min and 15 min, walking distance would reach 0.8 km and 1.2 km, respectively. With regard to the distance decay rate, there is no decay if the distance is within 0.4 km, since most people feel comfortable to walk within 0.4 km [57]; when distance to facilities increases to 0.8 km and 1.2 km, the decay rate would increase to 25% and 60% respectively [24]. Generally, walking time within 1.2 km is acceptable and convenient for residents’ daily walking behavior. The distance decay rate would be too high for walking distance above 1.2 km, which would result in a subtle effect on walkability level. Therefore, distance intervals of 0–0.4 km (5 min), 0.4–0.8 km (10 min), 0.8–1.2 km (15 min) were used to calculate the distance decay effect on single point walkability (Figure 5). The calculation of single point walkability was conducted in ArcGIS 10.2, using the Buffer Overlay Analysis to identify the surrounding facilities within the three distance intervals respectively, as well as to assign weight and distance decay rate to each facility, and finally to get the single point walkability level.
where d is Euclidean distance, xi and yi are geographic coordinates of ith origin; xj and yj are geographic coordinates of jth facility.
d = (|xi − xj|2 + |yi − yj|2)1/2
2.2.2. Area Walkability Map Generation
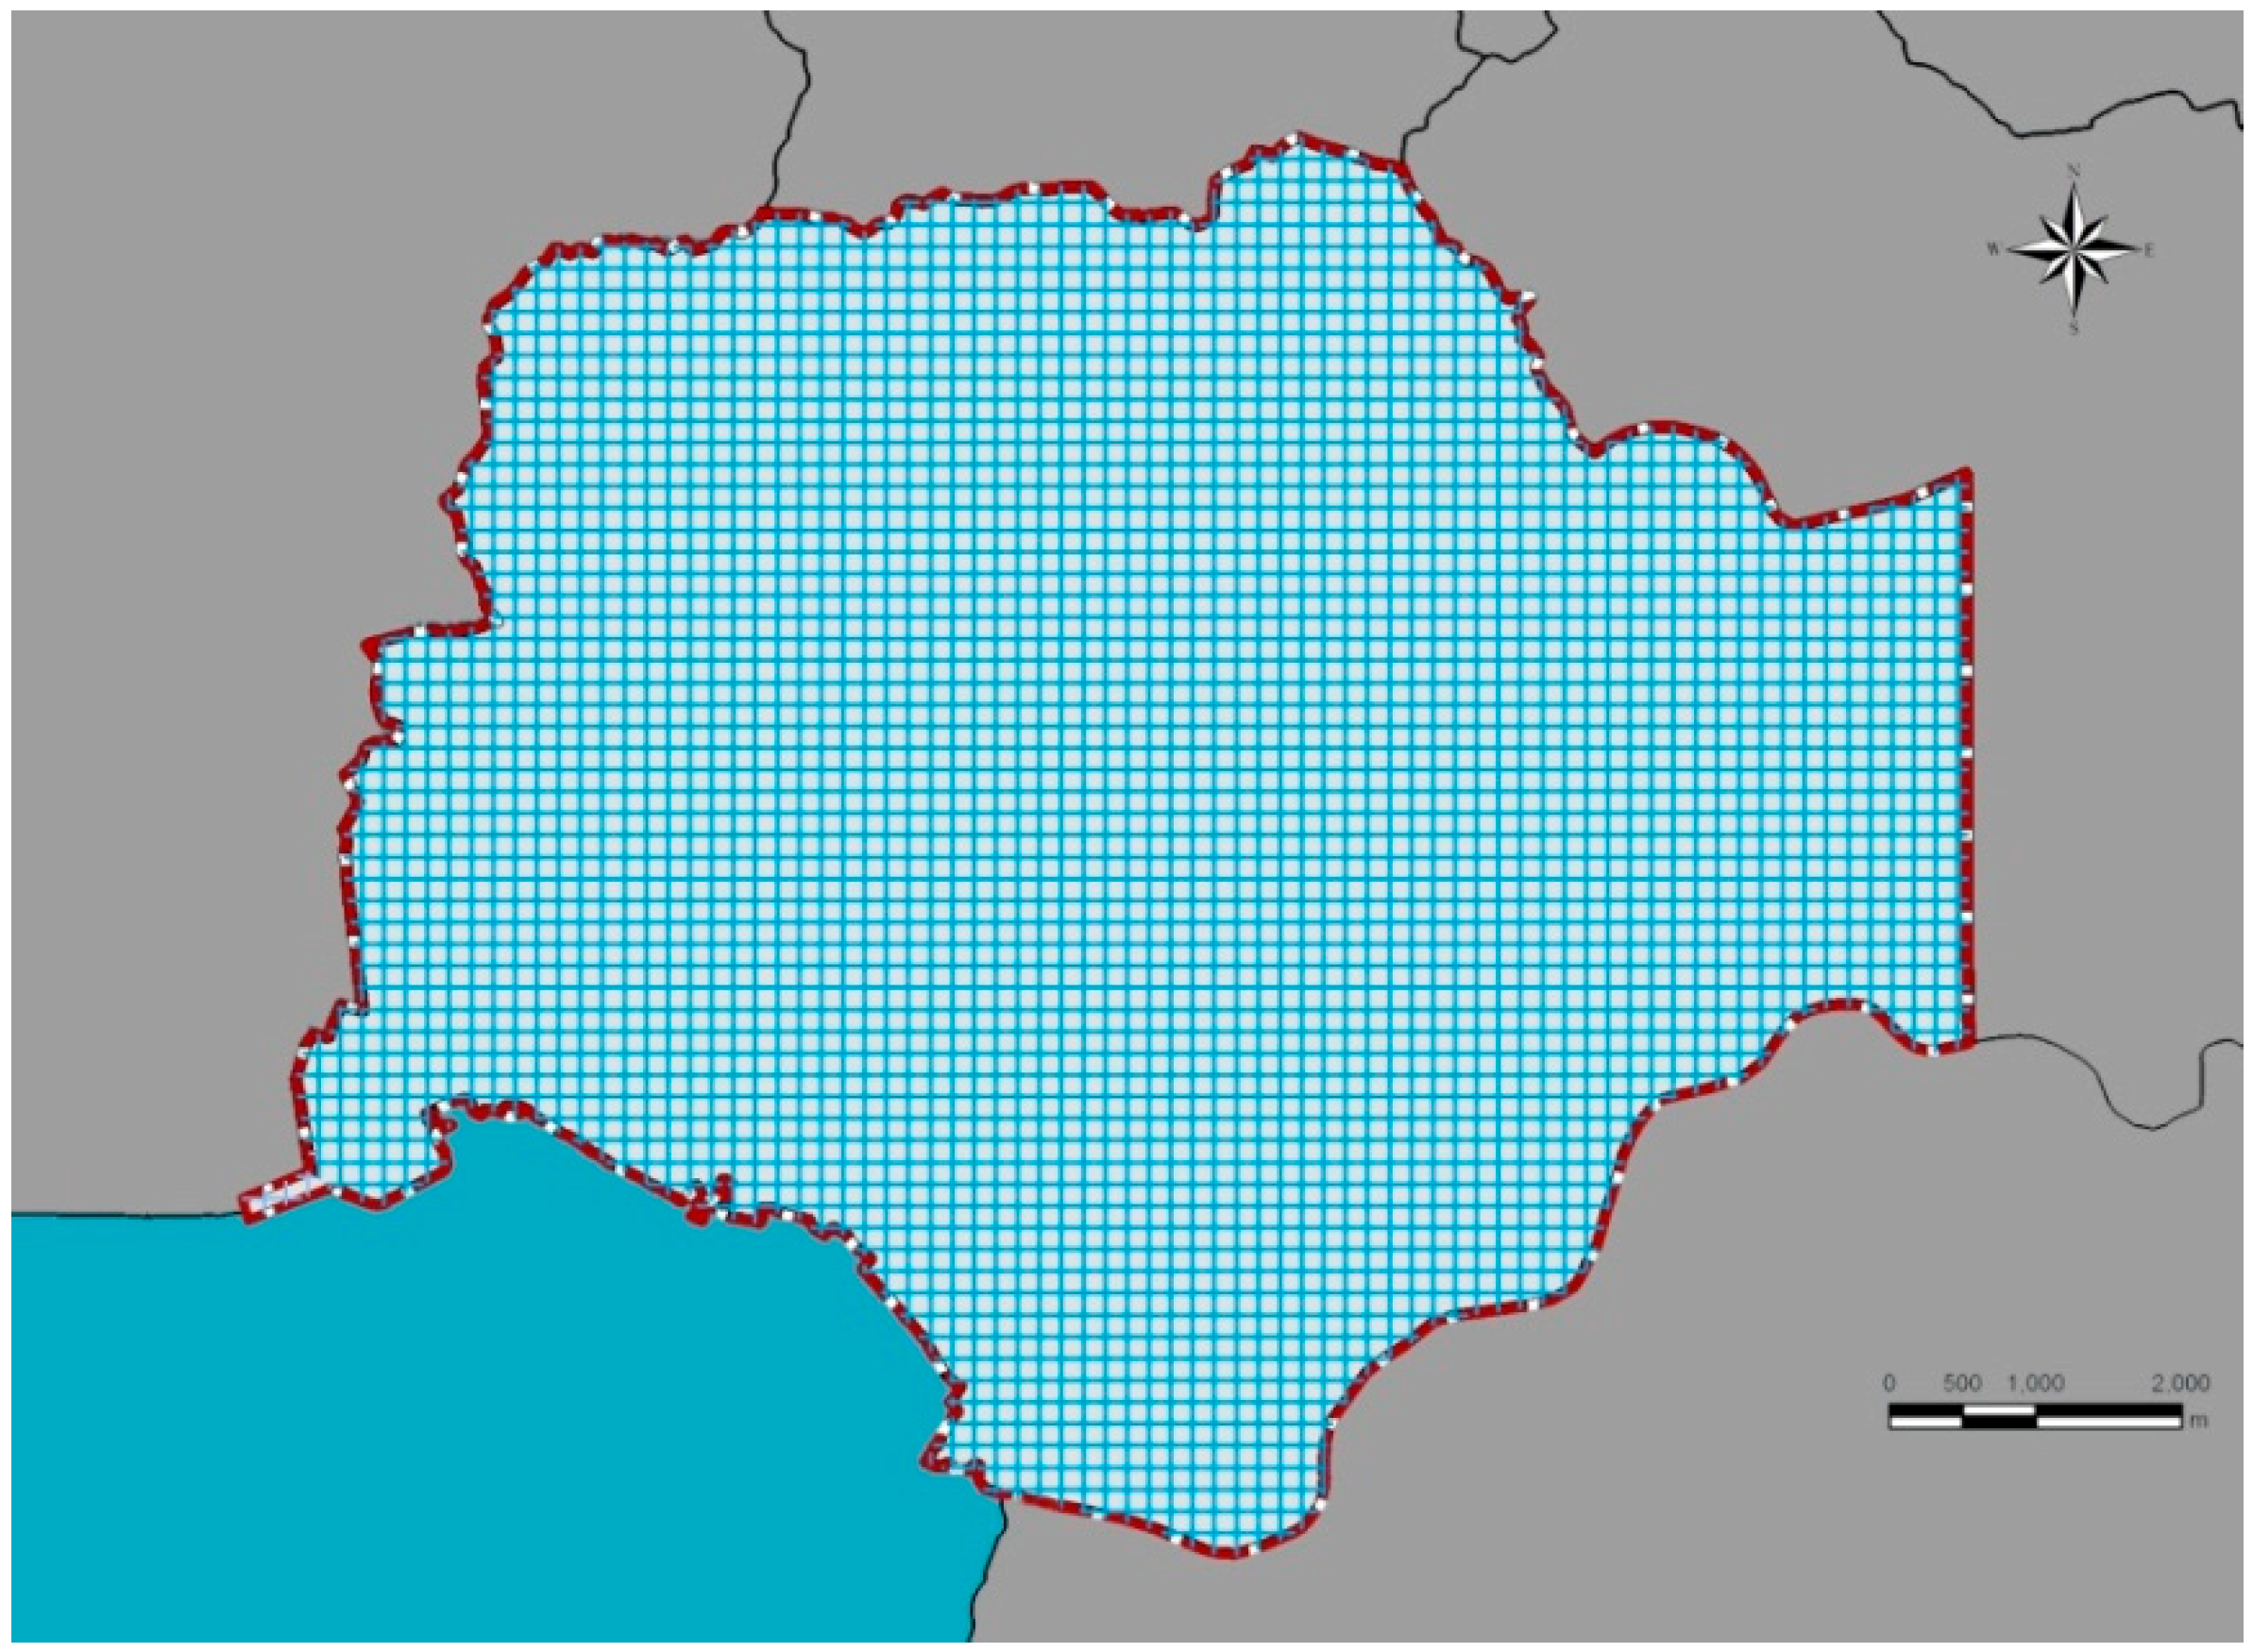
Area walkability map explicitly illustrates the spatial variation of walkability level within a specific region, and its generation is based on single point walkability value. First, a point grid with an interval of 150 m was created for the whole Futian District (Figure 6), consisting of 3192 single points. The 150 m interval was equivalent to the length of 500 feet used in the original Walk Score calculation. Subsequently, walkability value of each single point was calculated according to the methodology stated in Section 2.2.1, using a program written in Python to guide ArcGIS 10.2 for the calculation. The walkability values of 3192 single points were reprocessed in Microsoft Office Access 2010 (Microsoft, Redmond, WA, USA), to calculate the normalized walkability. The highest single point walkability was normalized to 100, yielding an array of single point walkability ranging from 0–100, from the least to most walkable. The area walkability map was finally generated from the rasterized and interpolated (using Ordinary Kriging method) single point walkability dataset. Ordinary Kriging method was used to interpolate since its prediction power is stronger in spatial analysis, which considers the spatial distribution of sampled points, and hence is more commonly used [58].
2.3. Relationship between Walkability and Residential Estate Value
First, the spatial pattern of residential estate value of 215 sampled residential buildings was examined and interpolated using Ordinary Kriging method in ArcGIS 10.2, to see how housing prices vary across the region. Secondly, the walkability level of each sampled building was calculated. In the following stage, bivariate correlation, Ordinary Least Square regression, and t-test analyses were conducted to explore the relationship between walkability and house price using IBM SPSS Statistics 22 (IBM Corp., Armonk, NY, USA).
3. Results and Discussion
3.1. Spatial Pattern of Walkability Level
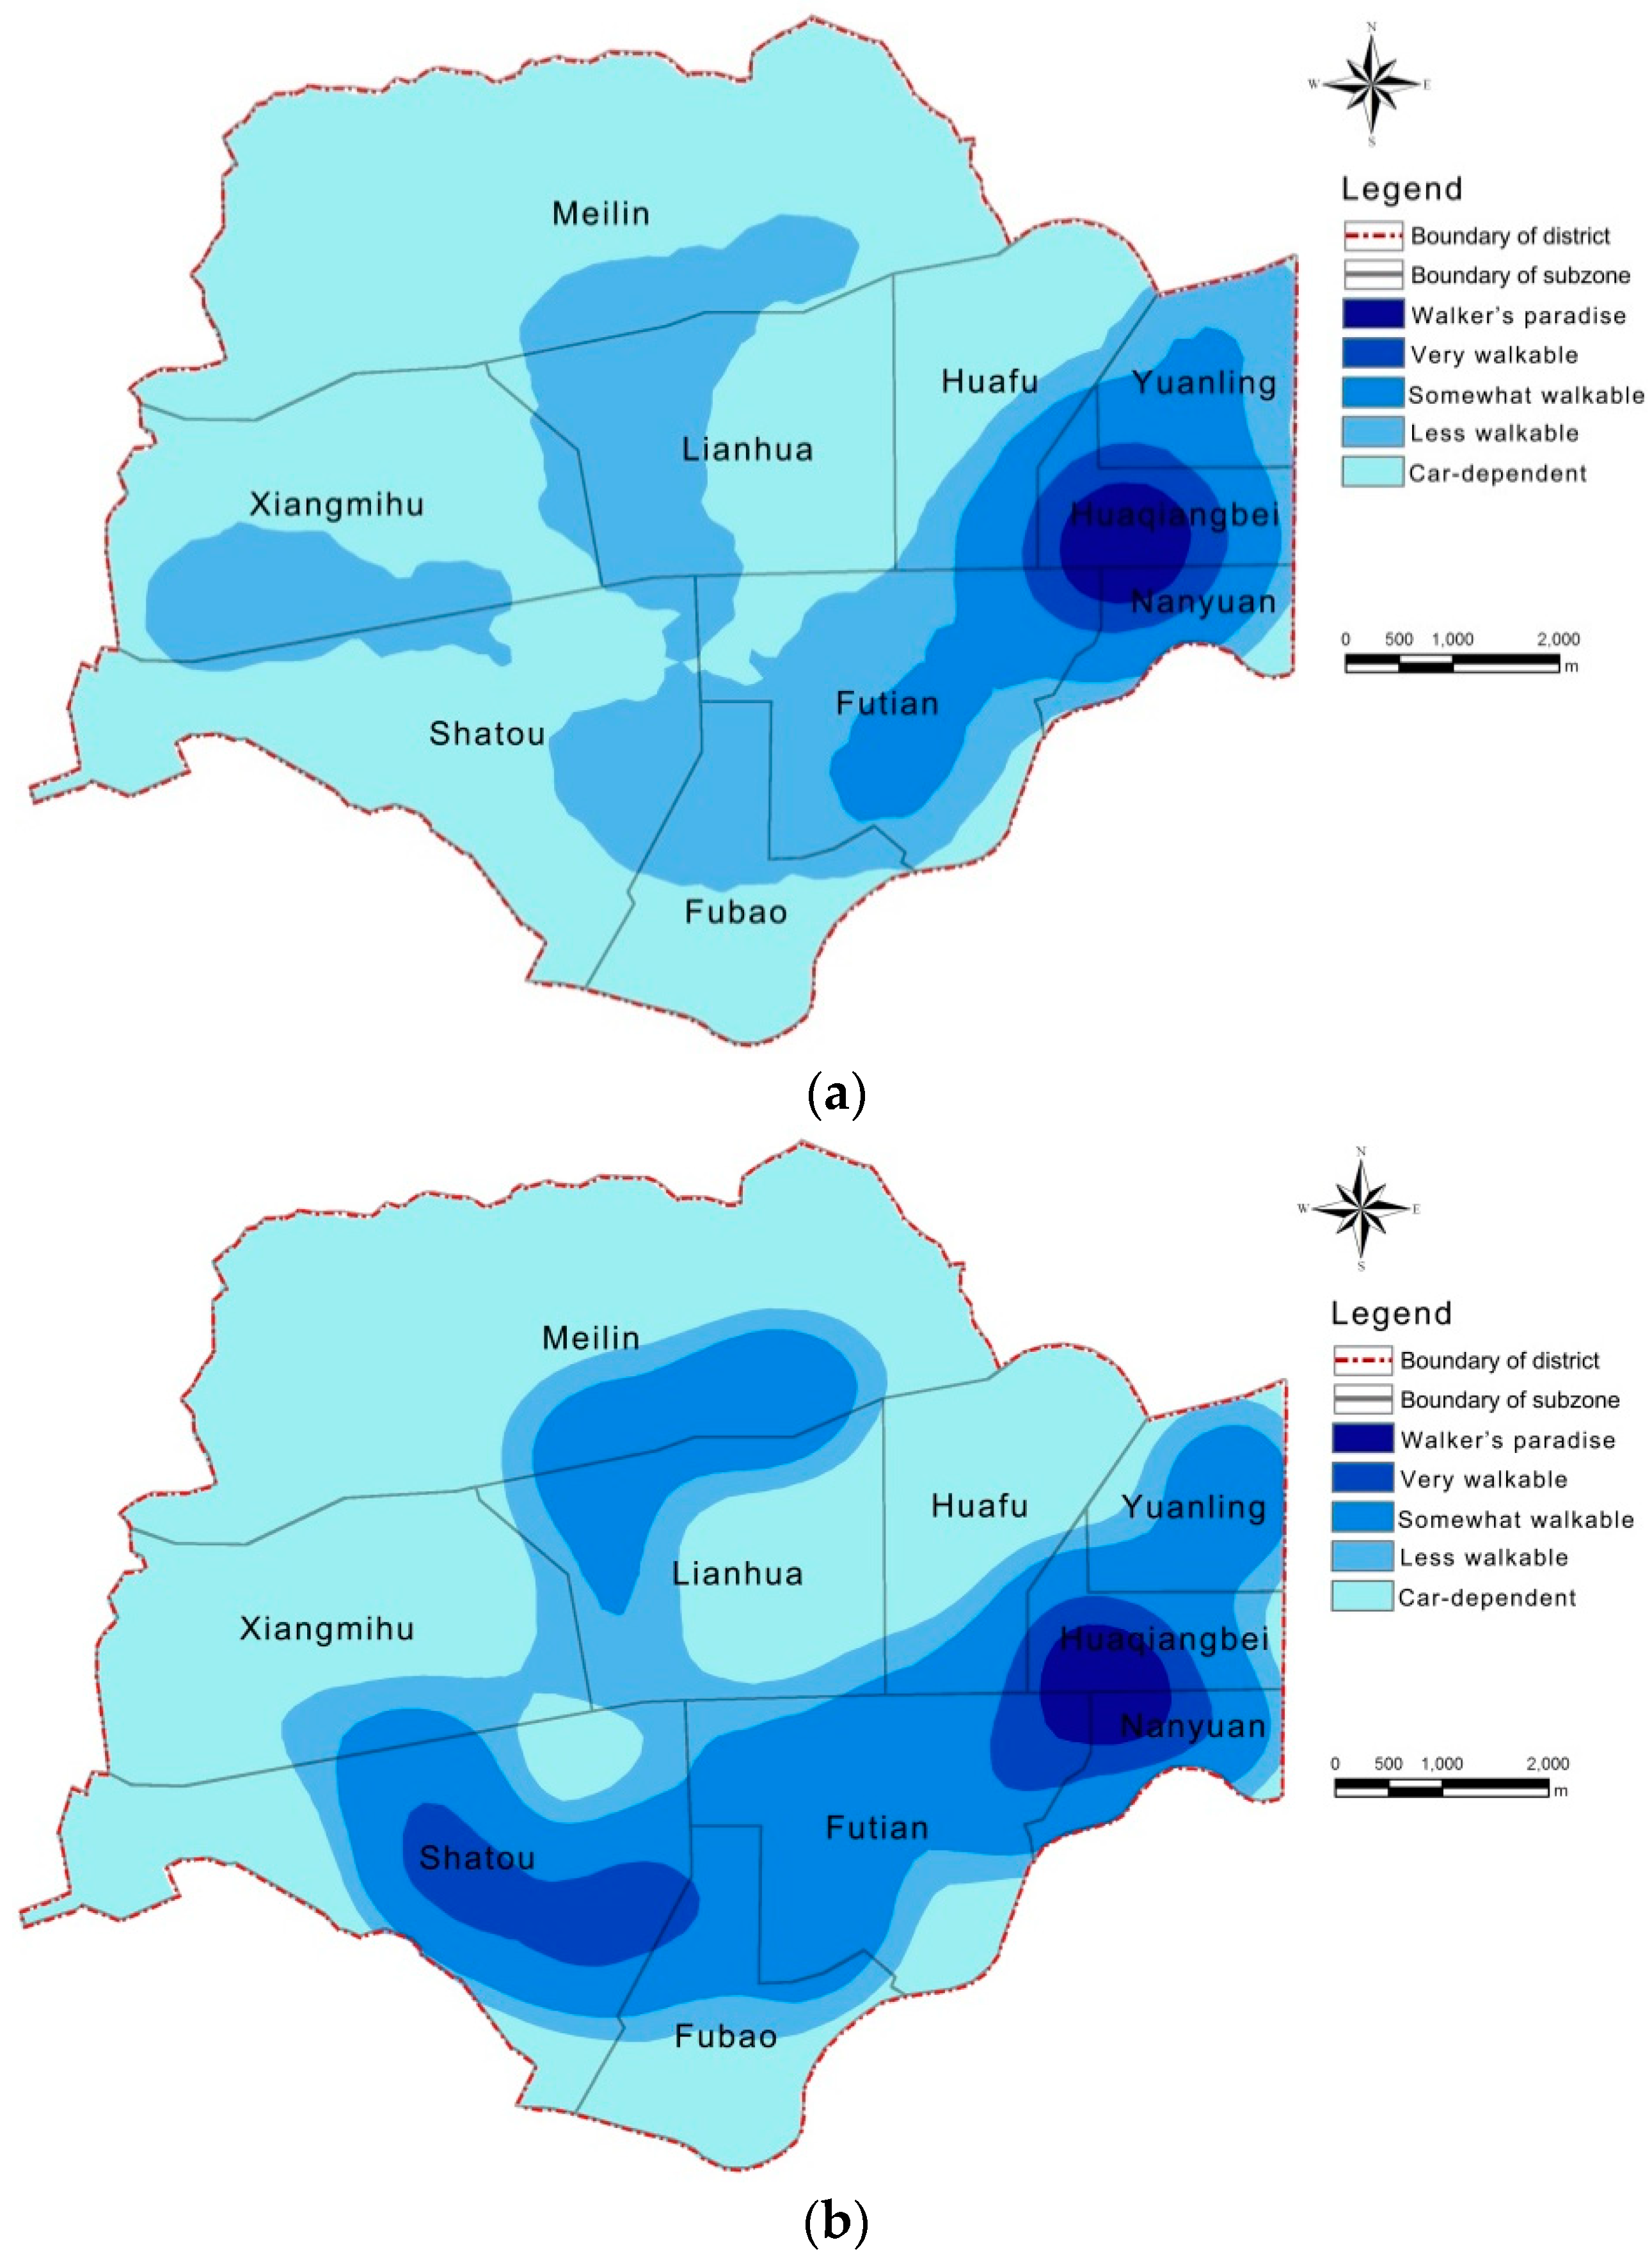
The spatial variability in walkability value (ranging from 0–100) across Futian District in 2013 and 2018 was shown in Figure 7. In 2013, the overall walkability level in Futian District is not high, with one very high value center and three relatively high value centers. The center with the highest walkability value is located in the eastern part, which is one of the most prosperous business centers as well as the largest digital market in Shenzhen. A large number of facilities like commercial complexes, offices, and restaurants are located in this area, and the presence of these facilities substantially improved its walkability level. Among the other three relatively high value centers, two of them are located in subzone Lianhua and Futian, respectively. The common characteristics of these two areas are high variety of facilities. The last center with high walkability is located in the western part, i.e., subzone Xiangmihu, which is a creative culture center as well as tourism center, with a high quality of urban design and landscape design. It is also noticed that the north-western area of Futian District (Meilin subzone) is largely undeveloped, with abundant nature resources but few public facilities, which inevitably resulted in very low walkability level. The walkability level in 2018 was considerably improved, especially in the northern, western, and southern parts. The mean of walkability level of the whole area has been increased from 19.09 (2013) to 23.59 (2018). If we only focus on the walkability level in built environment and exclude green spaces and waterbodies, the mean value improved from 23.21 (2013) to 30.16 (2018). The average walkability level in Futian District is not high in both years, which is mainly attributed to its car-oriented transportation system, large-scale streets, and uneven spatial distribution of daily facilities.
In order to further illustrate spatial variation and temporal change of walkability, walkability levels were classified according to Table 2 and results are shown in Figure 8 and Table 3. Among the five categories, areas which are “walker’s paradise” and “very walkable” only constitute 5% of the whole built environment in 2013, and this proportion was improved to 10% in 2018. In contrast, the category of “car-dependent” occupies a considerable larger proportion, which constitutes 47% of built environment in 2013, and decreased to 38% in 2018. As for the category of “somewhat walkable”, the proportion has been largely improved from 11% in 2013 to 35% in 2018. In summary, the proportion of areas with walkability values above 30 has increased from 16% to 45% from year 2013 to 2018. It also can be seen from Figure 8 that the walkability level in large parts of the northern, western, and southern areas has transformed from less walkable to somewhat walkable. On the whole, our results showed that walkability level has generally been improved from 2013 to 2018, indicating that more daily facilities that are easy to access have been built in the past five years in Futian District.
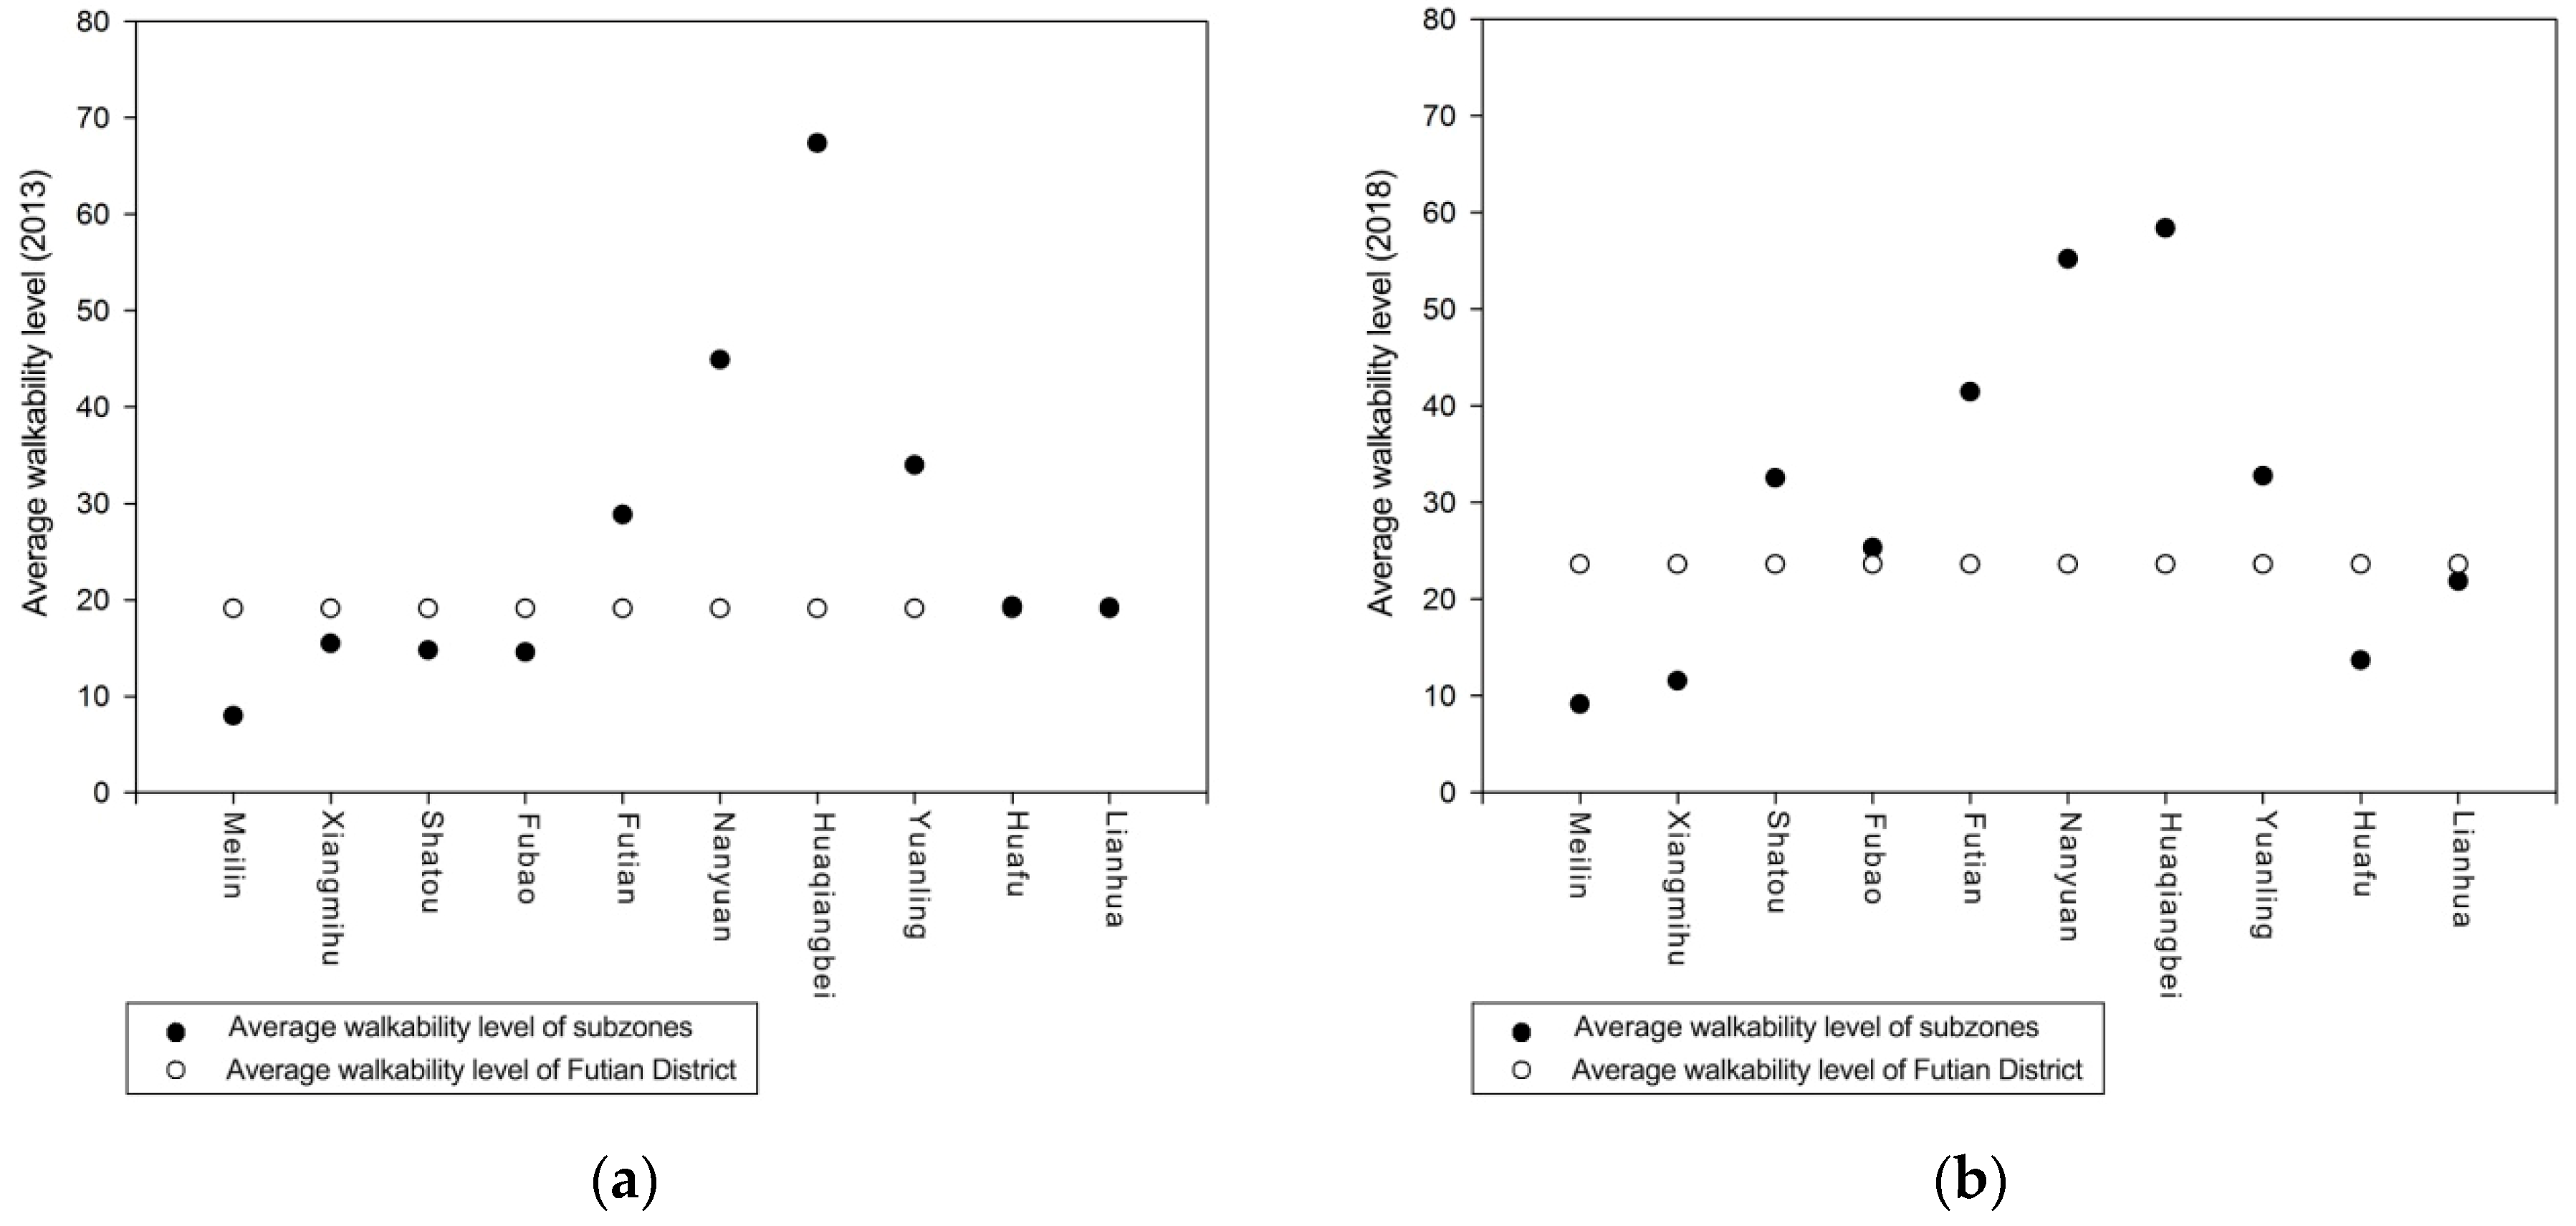
For the aim of identifying areas with high or low walkability more explicitly, mean value of walkability was calculated for each subzone. As shown in Figure 9, there are four subzones that consistently have higher than average walkability level in 2013 and 2018, namely Futian, Nanyuan, Huaqiangbei, and Yuanling, which are all located around the eastern high value center as shown in Figure 7 and Figure 8. The largest increase of average walkability value (18 points) was observed in Shatou which is located in southeastern part, and followed by Futian and Fubao, which are located in the southern part, implying that more daily facilities were built in these subzones. Xiangmihu in the western and Meilin in the north consistently have lower than average walkability levels, due to their adjacency to undeveloped areas and nature resources. Although the adjacency to park entrances was assigned with a weight of 1.5 (Table 1) and would contribute to the walkability level of this area, its positive effect was moderated by the negative effect of the lack of other types of facilities. The decrease of average walkability in Huafu is also attributed to the same reason. It was found that subzones located at peripheral areas have lower average walkability level compared with central and eastern subzones, which is mainly due to the fact that daily facilities are more densely distributed in the central and eastern areas, especially in the Huaqiangbei subzone. Results also indicated that subzones with lower than average walkability are more car-oriented. Retrofitting built environment in these areas to be pedestrians-oriented was suggested, also planning and design standards can be revised for the aim of creating more walkable environment.
3.2. Relationship between Walkability and Residential Estate Value
Housing value is influenced by a variety of factors apart from walkability, such as accessibility to public transit, water-based features, proximity to urban or industrial areas, etc. [36], but our focus is to what extent differences in walkability as one of the influential factors, can explain variability in housing prices. The housing prices of 215 sampled residential buildings in 2013 and 2018 were investigated, and the interpolated spatial pattern of housing price was shown in Figure 10. Prices were classified into eight categories using Geometric Intervals method in ArcGIS 10.2. Prediction errors of Ordinary Kriging interpolation were summarized in Table 4. It can be seen that errors are within tolerance and the accuracy of the predicted housing price maps is satisfying. The northern part of Futian District is mainly distributed with undeveloped natural resources, and there is little residential land use. Hence, the predicted housing prices in the northern part are inevitably with low accuracy in prediction. It should be noted that the interpolated map of housing prices in Futian District was only used for illustration of the general trend, and only the 215 sampled points with accurate data of housing prices were used in the following correlation and t-test analyses.
Results showed that housing prices largely increased from 2013 to 2018. This large increase in housing price is mainly attributed to the fast growth of the housing transaction market and residents’ increased demand of buying houses in the first-tier cities in China including Shenzhen since the 2010s. The spatial pattern of housing prices showed a decreasing tendency from the central horizontal axis to surroundings, for both years. The most expensive residential estates were located in the western part of Futian District, which is not the most walkable area. Interestingly, the eastern and southern areas with high walkability levels have medium to low housing prices. This observation seems to be contradicting with the presumed positive relationship between walkability and housing price. Among the classified categories, areas with prices of high to super high only occupy a small proportion in 2013, while this percentage considerably increased in 2018.
To further confirm our observations, bivariate correlation was conducted to examine the relationship between walkability and housing price. Bivariate correlation is commonly used to assess the strength of association between two variables [59]. As shown in Table 5, it can be seen that the relationship between natural log transformed variables changed from insignificant to significantly negative when data collected in 2013 and 2018 were compared. For the dataset in 2013, insignificant correlation indicates that housing price was more strongly influenced by other factors and walkability did not exert a strong impact. For the dataset in 2018, natural logarithm of samples’ walkability is significantly negatively correlated with natural log transformed housing price at the 0.01 level (Table 5). Ordinary Least Square regression between housing value and walkability in 2018 was also conducted to further explore this negative correlation, and results showed that a 10-point increase in walkability would decrease housing value by around 3–4%, with an R-squared of 0.065.
For the aim of further exploring their relationship, the full sample set was divided into two groups of subsamples with higher and lower than median walkability value, and their mean values of walkability and residential estate price were statistically compared using t-test. As shown in Table 6, the differences of walkability value between two groups were shown to be significant both for year 2013 and 2018, and groups in 2018 showed a larger difference. As for differences of residential estate price between two groups, they were also found to be significant in both 2013 and 2018, while the dataset in 2018 exhibited a larger difference (8754 RMB/m2) and higher significance level (p < 0.001). These results implied that more walkable areas have relatively lower housing prices in both 2013 and 2018, and this trend is even more obvious and the differences in housing price are larger in 2018.
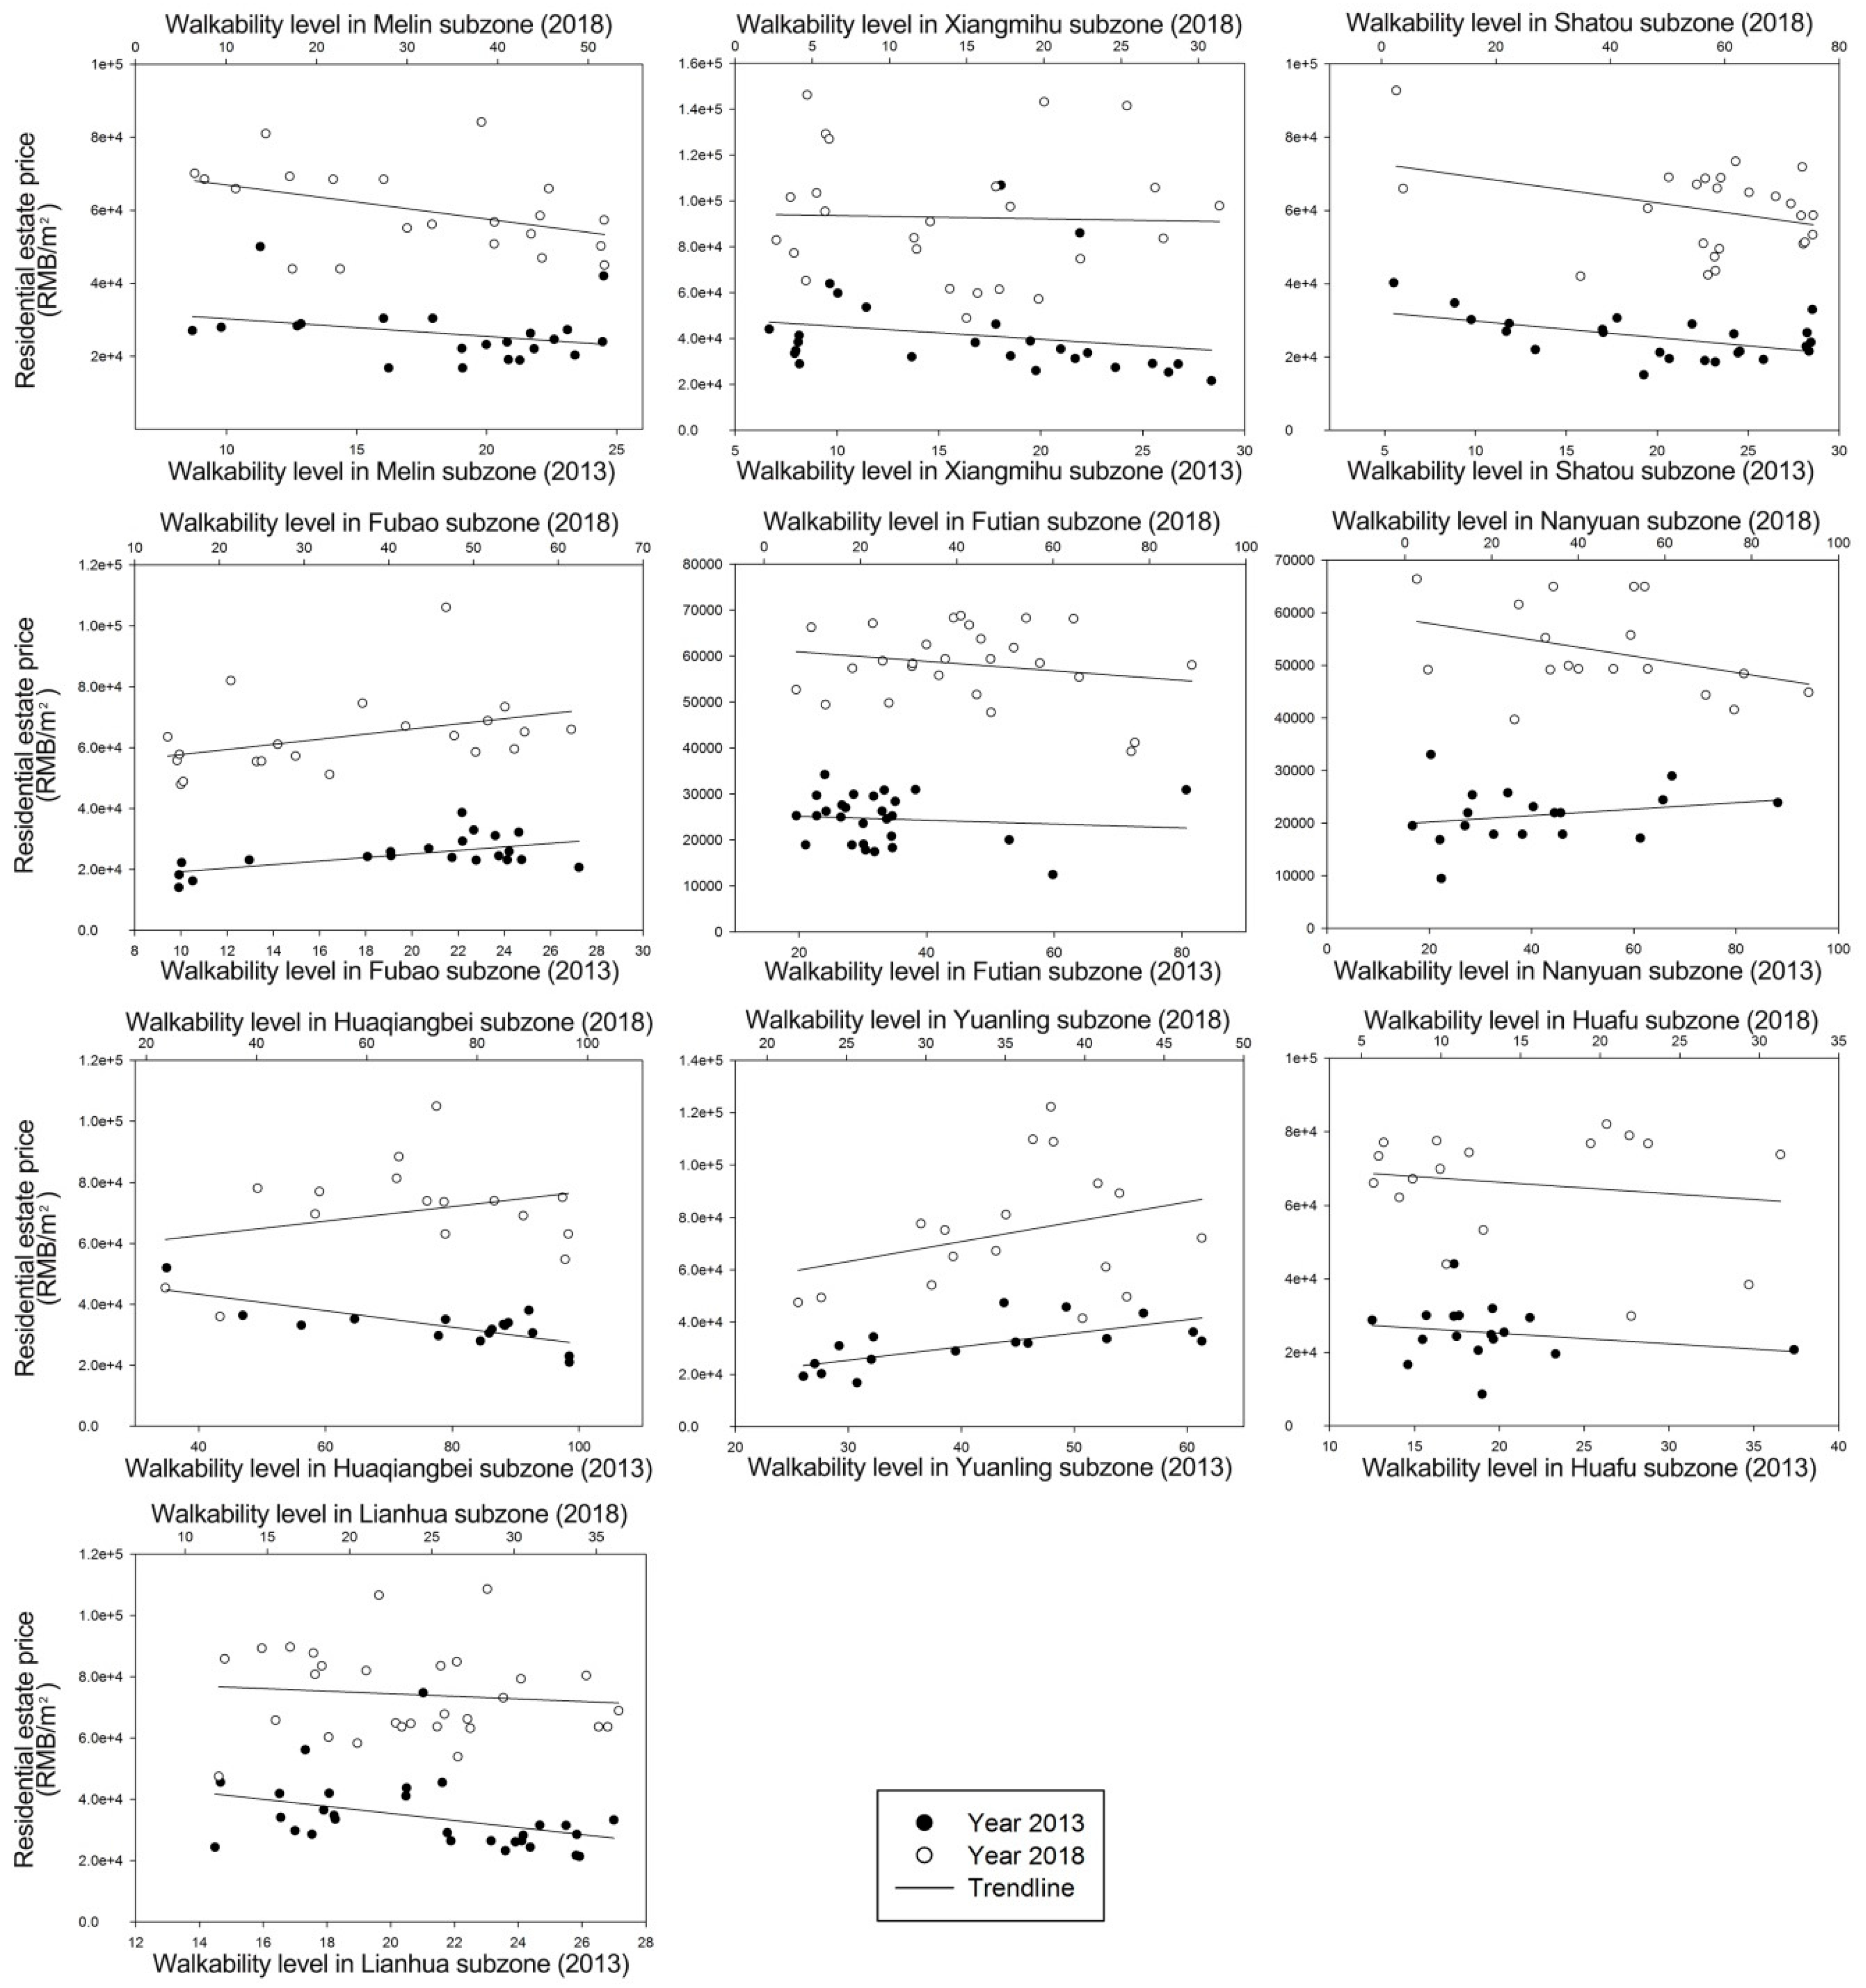
The relationship between residential estate value and walkability level was also analyzed at a smaller subzone scale. As shown in Figure 11, the relationship between these two variables varied across different subzones, and even showed different trends in 2013 and 2018. For instance, Yuanling demonstrated a positive trend in both years, which means that highly walkable areas have higher housing prices; Shatou showed a negative trend in both years; Huaqiangbei exhibited a negative trend in 2013 but changed to positive in 2018; the other subzones exhibited a vague relationship between these two variables. This observed variation is mainly attributed to scale effects. Different subzones have different urban forms, car-dependent levels, numbers and distributions of daily facilities, etc., which together contributed to the differences in trends among these subzones. In addition, these differences are also accounted by the limited sample size in each subzone, which is not large enough to reveal a robust relationship but can be used as references for local variations.
Results on the relationship between walkability and housing price stated above are not consistent with the positive correlations identified in some previous studies conducted in U.S. cities [10,34,35]. However, Rauterkus and Miller [36]’s finding that the impact of walkability on land value is stronger in more walkable neighborhoods than less walkable ones, indicates that the influence of walkability on land value could be less strong and less significant in car-dependent neighborhoods. This result provides some evidences for the negative correlation observed in Futian District, which is generally car-dependent or less walkable (average walkability value is 19.09 in 2013 and 23.59 in 2018). Parallel to this finding, Li, Joh [45] concluded that the improvement of walkability in car-dependent neighborhoods did not result in increase in property values, while positive impact was found in walkable neighborhoods. Cortright [34] also reported that 2 out of 15 sampled housing markets, which are two very fast-growing areas (Las Vegas and Bakersfield) in the U.S., exhibited negative or insignificant correlation between walkability and housing value respectively. These findings lend support for our inference that the negative correlation observed in Futian District is partly attributed to its rapid urbanization process and relatively car-dependent urban form. The urbanization process in Shenzhen has been very rapid since the 1980s, transforming it from a fishing village to a global city. The urban development process has led to a less compact urban form, lower mixed land use, and larger scale transportation network. All these factors contributed to the car-dependent urban form of Futian District. In addition, high provision and intense usage of private cars in Shenzhen also moderated the positive influences that walkability exerts on residential estate value. However, it also should be noted that high walkability does not necessarily eradicate car dependency [10]. In more walkable areas, people can reach shopping malls, restaurants, groceries, offices, etc. more easily, but they may still need to rely on car or public transport for daily commuting, which is the common phenomenon in Shenzhen. This phenomenon is mainly due to the fact that residents’ choices on housing locations are determined by multiple factors, such as price, developer, environmental quality, etc., while walkability is only one of them. For areas with low walkability but high housing price, these neighborhoods are not easily accessible to daily facilities and are not expected to be walkable by homebuyers, thus it is implied that walkability is not a major concern for these homebuyers. Therefore, it is inferred that housing prices in Futian District and even Shenzhen is more influenced by other factors rather than walkability.
It is also worth noting that the negative correlation between walkability and housing price observed in 2018 does not mean a causal relationship, i.e., the lower housing prices in more walkable areas are not caused by high walkability level but rather influenced by other factors. This inverse relationship may also be attributed to the fact that highly walkable areas in Futian District tend to be older and more developed neighborhoods, where the age and facilities of these residential estates tends to be older, resulting in lower housing value compared with newly developed estates. For instance, some newly developed residential estates located in the western area with higher environmental quality and better administrations have higher housing prices, although their walkability level is generally not high. In contrast, a number of early developed neighborhoods located in Futian and Nanyuan subzones are more walkable, but their housing prices are lower, partly accounted by the older house age and poorly maintained facilities in these subzones.
4. Conclusions
A walkable environment plays an important role in supporting vibrant and sustainable urban communities. In China, its importance has not been fully recognized in urban planning process and public policy commitments. This study examined the spatial and temporal variation of walkability in year 2013 and 2018 using a modified Walk Score methodology in a rapidly urbanizing district in China, which has seldom been operationalized in a context like this. In addition, the relationship between walkability level and residential estate value was explored. It was found that although on average walkability in Futian District is not high, it has increased from 19.09 in 2013 to 23.59 in 2018. The area of “car-dependent” region has decreased, while the proportion of areas with walkability value above 30 out of built environment has increased considerably from 16% to 45% from 2013 to 2018. In addition, high spatial variation was observed across the study area: one eastern high center and three sub-high centers were identified. As for the relationship between walkability and residential estate value, in contrast with the positive correlations observed in some U.S. cities, negative correlation was observed for data in 2013 and 2018, although the relationship is only statistically significant in 2018. This is mainly attributed to the rapid urbanization process and car-dependent urban form of Futian District, supported by several previous studies with similar findings. Therefore, housing price in Futian District is more influenced by other factors rather than walkability.
Results of this study are of considerable importance in terms of extending current literature on walkability measurement and exploration of the relationship between walkable environment and housing values in a rapid urbanizing Chinese city context. Another key contribution of this study is that discussions on the underlying reasons for the incompatibility of spatial pattern of walkability and housing price provide implications for future planning activities and policy-making. Policies should be made to create walkable environment, improve environmental quality, and guide the development of housing market at the same time. Our findings lend credence to policies encouraging projects that would improve pedestrian infrastructure and walkability level. Local government also could provide incentives for developers to constructing walkable neighborhood. Developers should be willing to develop more walkable residential estates as long as additional expenses for walkable locations and environment do not exceed the benefits brought about by walkability. In addition, the walkability model used in this study has the potential to be applied in other cities in China as a powerful tool for urban planners, policy makers, and the public. A platform can be built to incorporate information on walkability and prices of local residential estates, which is helpful for residents to make informed decision in selecting walkable neighborhoods with acceptable prices.
Although the walkability model used in this study provides an operational measurement of facility-based walkability, it has some limitations. Euclidean distance was adopted in computing the distance between pedestrian and facility, due to the ease of capturing facilities within multiple distance ranges. However, it would be more accurate in measuring walkability if network distance along actual road networks was used. In addition, although the distribution of facilities is the focus of measurement of walkability in this index, it would be more comprehensive to incorporate the assessment of quality of walking environment in future studies, such as aesthetic attributes, cleanliness, safety, presence of roadside trees, pleasant urban design, etc. In addition, we suggest future studies to be conducted in China and other Asian countries, to provide more empirical examples, so as to contribute to the development and application of Walk Score in the Asian contexts.
In conclusion, Shenzhen as a typical rapidly urbanizing city in China requires further research on developing localized walkability measurement, exploring local influential factors on walkability level, investigating specific ways in which walkability has an effect on housing values, as well as approaches to creating a more walkable and sustainable environment.
Author Contributions
Conceptualization, J.Y.Z.; methodology, J.Y.Z.; software, J.Y.Z.; validation, J.Y.Z., P.Y.T., H.Z., and Y.Z.; formal analysis, J.Y.Z.; investigation, J.Y.Z.; resources, H.Z.; data curation, J.Y.Z. and H.Z.; writing—original draft preparation, J.Y.Z.; writing—review and editing, P.Y.T. and Y.Z.; visualization, J.Y.Z.; supervision, P.Y.T. and H.Z.; project administration, H.Z.
Funding
This research received no external funding.
Conflicts of Interest
The authors declare no conflict of interest.
References
- Litman, T.A. Economic value of walkability. World Transp. Policy Pract. 2003, 10, 3–11. [Google Scholar] [CrossRef]
- Owen, N.; Humpel, N.; Leslie, E.; Bauman, A.; Sallis, J.F. Understanding environmental influences on walking: Review and research agenda. Am. J. Prev. Med. 2004, 27, 67–76. [Google Scholar] [CrossRef]
- Southworth, M. Designing the walkable city. J. Urban Plan. Dev. 2005, 131, 246–257. [Google Scholar] [CrossRef]
- Pucher, J.; Dijkstra, L. Making walking and cycling safer: Lessons from Europe. Transp. Q. 2000, 54, 25–50. [Google Scholar]
- Lo, R.H. Walkability: What is it? J. Urban. 2009, 2, 145–166. [Google Scholar] [CrossRef]
- Forsyth, A.; Southworth, M. Cities afoot—Pedestrians, walkability and urban design. J. Urban Design 2008, 13, 1–3. [Google Scholar] [CrossRef]
- Leslie, E.; Coffee, N.; Frank, L.; Owen, N.; Bauman, A.; Hugo, G. Walkability of local communities: Using geographic information systems to objectively assess relevant environmental attributes. Health Place 2007, 13, 111–122. [Google Scholar] [CrossRef]
- Kelly, C.E.; Tight, M.R.; Hodgson, F.C.; Page, M.W. A comparison of three methods for assessing the walkability of the pedestrian environment. J. Transp. Geogr. 2011, 19, 1500–1508. [Google Scholar] [CrossRef]
- Owen, N.; Cerin, E.; Leslie, E.; DuToit, L.; Coffee, N.; Frank, L.; Bauman, A.; Hugo, G.; Saelens, B.E.; Sallis, J.F. Neighborhood walkability and the walking behavior of Australian adults. Am. J. Prev. Med. 2007, 33, 387–395. [Google Scholar] [CrossRef] [PubMed]
- Gilderbloom, J.I. Does walkability matter? An examination of walkability’s impact on housing values, foreclosures and crime. Cities 2015, 42, 13–24. [Google Scholar]
- Litman, T.A. Economic Value of Walkability; Victoria Transport Policy Institute: Victoria, BC, Canada, 2017. [Google Scholar]
- Lwin, K.; Murayama, Y. Modelling of urban green space walkability: Eco-friendly walk score calculator. Comput. Environ. Urban Syst. 2011, 35, 408–420. [Google Scholar] [CrossRef]
- Manaugh, K.; El-Geneidy, A. Validating walkability indices: How do different households respond to the walkability of their neighborhood? Transp. Res. Part D Transp. Environ. 2011, 16, 309–315. [Google Scholar] [CrossRef]
- Villanueva, K.; Knuiman, M.; Nathan, A.; Giles-Corti, B.; Christian, H.; Foster, S.; Bull, F. The impact of neighborhood walkability on walking: Does it differ across adult life stage and does neighborhood buffer size matter? Health Place 2014, 25, 43–46. [Google Scholar] [CrossRef] [Green Version]
- Clifton, K.J.; Smith, A.D.L.; Rodriguez, D. The development and testing of an audit for the pedestrian environment. Landsc. Urban Plan. 2007, 80, 95–110. [Google Scholar] [CrossRef]
- Craig, C.L.; Brownson, R.C.; Cragg, S.E.; Dunn, A.L. Exploring the effect of the environment on physical activity: A study examining walking to work. Am. J. Prev. Med. 2002, 23, 36–43. [Google Scholar] [CrossRef]
- Giles-Corti, B.; Donovan, R.J. Socioeconomic status differences in recreational physical activity levels and real and perceived access to a supportive physical environment. Prev. Med. 2002, 35, 601–611. [Google Scholar] [CrossRef]
- Leslie, E.; Saelens, B.; Frank, L.; Owen, N.; Bauman, A.; Coffee, N.; Hugo, G. Residents’ perceptions of walkability attributes in objectively different neighbourhoods: A pilot study. Health Place 2005, 11, 227–236. [Google Scholar] [CrossRef]
- Vargo, J.; Stone, B.; Glanz, K. Google walkability: A new tool for local planning and public health research? J. Physi. Act. Health 2012, 9, 689–697. [Google Scholar] [CrossRef]
- Todd, M.; Adams, M.A.; Kurka, J.; Conway, T.L.; Cain, K.L.; Buman, M.P.; Frank, L.D.; Sallis, J.F.; King, A.C. GIS-measured walkability, transit, and recreation environments in relation to older Adults’ physical activity: A latent profile analysis. Prev. Med. 2016, 93, 57–63. [Google Scholar] [CrossRef]
- Frank, L.D.; Schmid, T.L.; Sallis, J.F.; Chapman, J.; Saelens, B.E. Linking objectively measured physical activity with objectively measured urban form. Am. J. Prev. Med. 2005, 28, 117–125. [Google Scholar] [CrossRef]
- Kuzmyak, J.; Baber, C.; Savory, D. Use of walk opportunities index to quantify local accessibility. Transp. Res. Rec. J. Transp. Res. Board 2006, 1977, 145–153. [Google Scholar] [CrossRef]
- Ewing, R.; Cervero, R. Travel and the built environment: A meta-analysis. J. Am. Plan. Assoc. 2010, 76, 265–294. [Google Scholar] [CrossRef]
- Carr, L.J.; Shira, D.I.; Bess, M.H. Walk Score™ as a global estimate of neighborhood walkability. Am. J. Prev. Med. 2010, 39, 460–463. [Google Scholar] [CrossRef]
- Carr, L.J.; Shira, D.I.; Bess, M.H. Validation of walk score for estimating access to walkable amenities. Br. J. Sports Med. 2011, 45, 1144–1148. [Google Scholar] [CrossRef]
- Duncan, D.T.; Aldstadt, J.; Whalen, J.; Melly, S.J. Validation of walk scores and transit scores for estimating neighborhood walkability and transit availability: A small-area analysis. GeoJournal 2013, 78, 407–416. [Google Scholar] [CrossRef]
- Duncan, D.T.; Aldstadt, J.; Whalen, J.; Melly, S.J.; Gortmaker, S.L. Validation of Walk Score® for estimating neighborhood walkability: An analysis of four US metropolitan areas. Int. J. Environ. Res. Public Health 2011, 8, 4160–4179. [Google Scholar] [CrossRef]
- Frank, L.D.; Engelke, P. Multiple impacts of the built environment on public health: Walkable places and the exposure to air pollution. Int. Reg. Sci. Rev. 2005, 28, 193–216. [Google Scholar] [CrossRef]
- Cao, X.; Handy, S.L.; Mokhtarian, P.L. The influences of the built environment and residential self-selection on pedestrian behavior: Evidence from Austin, TX. Transportation 2006, 33, 1–20. [Google Scholar] [CrossRef]
- Zhu, X.; Lee, C. Walkability and safety around elementary schools: Economic and ethnic disparities. Am. J. Prev. Med. 2008, 34, 282–290. [Google Scholar] [CrossRef]
- Rogers, S.H.; Halstead, J.M.; Gardner, K.H.; Carlson, C.H. Examining walkability and social capital as indicators of quality of life at the municipal and neighborhood scales. Appl. Res. Qual. Life 2011, 6, 201–213. [Google Scholar] [CrossRef]
- Wood, L.; Frank, L.D.; Giles-Corti, B. Sense of community and its relationship with walking and neighborhood design. Soc. Sci. Med. 2010, 70, 1381–1390. [Google Scholar] [CrossRef]
- Leyden, K.M. Social capital and the built environment: The importance of walkable neighborhoods. Am. J. Public Health 2003, 93, 1546–1551. [Google Scholar] [CrossRef]
- Cortright, J. Walking the Walk: How Walkability Raises Home Values in US Cities, in CEOs for Cities; CEOs for Cities: Cleveland, OH, USA, 2009. [Google Scholar]
- Pivo, G.; Fisher, J.D. The walkability premium in commercial real estate investments. Real Estate Econ. 2011, 39, 185–219. [Google Scholar] [CrossRef]
- Rauterkus, S.Y.; Miller, N.G. Residential land values and walkability. J. Sustain. Real Estate 2011, 3, 23–43. [Google Scholar]
- Saelens, B.; Sallis, J.; Frank, L. Environmental correlates of walking and cycling: Findings from the transportation, urban design, and planning literatures. Ann. Behav. Med. 2003, 25, 80–91. [Google Scholar] [CrossRef] [PubMed]
- Ewing, R.; Schmid, T.; Killingsworth, R.; Zlot, A.; Raudenbush, S. Relationship between urban sprawl and physical activity, obesity, and morbidity. Am. J. Health Promot. 2003, 18, 47–57. [Google Scholar] [CrossRef]
- Doyle, S.; Kelly-Schwartz, A.; Schlossberg, M.; Stockard, J. Active community environments and health: The relationship of walkable and safe communities to individual health. J. Am. Plan. Assoc. 2006, 72, 19–31. [Google Scholar] [CrossRef]
- Creatore, M.I.; Glazier, R.H.; Moineddin, R.; Fazli, G.S.; Johns, A.; Gozdyra, P.; Matheson, F.I.; Kaufman-Shriqui, V.; Rosella, L.C.; Manuel, D.G. Association of neighborhood walkability with change in overweight, obesity, and diabetes. Jama 2016, 315, 2211–2220. [Google Scholar] [CrossRef]
- Wasfi, R.A.; Dasgupta, K.; Orpana, H.; Ross, N.A. Neighborhood walkability and body mass index trajectories: Longitudinal study of Canadians. Am. J. Public Health 2016, 106, 934–940. [Google Scholar] [CrossRef] [PubMed]
- Leinberger, C.B.; Alfonzo, M. Walk This Way: The Economic Promise of Walkable Places in Metropolitan; The Brookings Institution: Washington, DC, USA, 2012. [Google Scholar]
- Sohn, D.W.; Moudon, A.V.; Lee, J. The economic value of walkable neighborhoods. Urban Design Int. 2012, 17, 115–128. [Google Scholar] [CrossRef]
- Carswell, A.; Zahirovic-Herbert, V.; Gibler, K. Who Cares about Walk Scores? A Quantile Approach to Residential House Prices and Walkability; European Real Estate Society (ERES): Bergisch Gladbach, Germany, 2016. [Google Scholar]
- Li, W.; Joh, K.; Lee, C.; Kim, J.; Park, H.; Woo, A. Assessing benefits of neighborhood walkability to single-family property values: A spatial hedonic study in Austin, Texas. J. Plan. Educ. Res. 2015, 35, 471–488. [Google Scholar] [CrossRef]
- Boyle, A.; Barrilleaux, C.; Scheller, D. Does walkability influence housing prices? Soc. Sci. Q. 2014, 95, 852–867. [Google Scholar] [CrossRef]
- Yao, K.; Liya, Z. From rapid urbanization to deep urbanization: Exploring new approaches of urbanization for Shenzhen. Hous. Real Estate 2017, 8, 15–16. [Google Scholar]
- Wang, L.; Hui, Z. The principle of road network structures and its ecological effects on landscape in Shenzhen. Geogr. Res. 2012, 31, 853–862. [Google Scholar]
- Wang, Z.; Liu, Y.; Wei, J.; Zeng, H. The impacts of road pattern on land uses in rapidly urbanizing regions. Res. Environ. Sci. 2008, 21, 180–185. [Google Scholar]
- Shenzhen Bureau of Statistics. 2016 Statistics Report of Economic and Social Development in Shenzhen; Shenzhen Bureau of Statistics: Shenzhen, China, 2017.
- Jiangxing, M.; Xiaopei, Y.; Yongjian, H.; Zhigang, L. Impacts of open transport system on changes in land use spatial distribution under rapid urbanization in Shenzhen city. Res. Sci. 2008, 30, 1880–1889. [Google Scholar]
- Google. Google Map; Google: Shenzhen, China, 2013. [Google Scholar]
- Random Integer Generator. 2018. Available online: https://www.random.org/integers/ (accessed on 2 January 2018).
- Fangtianxia. 2018. Available online: https://www.fang.com/default.htm (accessed on 2 January 2018).
- Anjuke. 2018. Available online: https://www.anjuke.com/ (accessed on 2 January 2018).
- Bohannon, R.W. Comfortable and maximum walking speed of adults aged 20–79 years: Reference values and determinants. Age Ageing 1997, 26, 15–19. [Google Scholar] [CrossRef]
- Burgess, J.; Harrison, C.M.; Limb, M. People, parks and the urban green: A study of popular meanings and values for open spaces in the city. Urban Stud. 1988, 25, 455–473. [Google Scholar] [CrossRef]
- ESRI. How Kriging Works. 2019. Available online: http://desktop.arcgis.com/en/arcmap/10.3/tools/3d-analyst-toolbox/how-kriging-works.htm) (accessed on 28 January 2018).
- Lee Rodgers, J.; Nicewander, W.A. Thirteen ways to look at the correlation coefficient. Am. Stat. 1988, 42, 59–66. [Google Scholar] [CrossRef]
Figure 1.
Location of Futian District and its subzones.

Figure 2.
Nature and built environment in Futian district (source: [52]).
Figure 2.
Nature and built environment in Futian district (source: [52]).

Figure 3.
Distribution of sampled residential buildings.

Figure 4.
Methodological framework for the development of walkability index.

Figure 5.
Distance decay function figure.

Figure 6.
Point grid for area walkability map generation.

Figure 7.
(a) Spatial variation of walkability value in Futian District in 2013; (b) and Spatial variation of walkability value in Futian District in 2018.
Figure 7.
(a) Spatial variation of walkability value in Futian District in 2013; (b) and Spatial variation of walkability value in Futian District in 2018.

Figure 8.
(a) Classified walkability levels in 2013; (b) Classified walkability levels in 2018.

Figure 9.
(a) Average walkability levels of subzones in Futian District in 2013; (b) Average walkability levels of subzones in Futian District in 2018.
Figure 9.
(a) Average walkability levels of subzones in Futian District in 2013; (b) Average walkability levels of subzones in Futian District in 2018.

Figure 10.
(a) Spatial pattern of residential real estate price in 2013; (b) Spatial pattern of residential real estate price in 2018.
Figure 10.
(a) Spatial pattern of residential real estate price in 2013; (b) Spatial pattern of residential real estate price in 2018.

Figure 11.
Relationship between residential estate price and walkability level of sampled buildings in each subzone in 2013 and 2018.
Figure 11.
Relationship between residential estate price and walkability level of sampled buildings in each subzone in 2013 and 2018.


Table 1.
Public facility types and weights.
| Public Facility Type | Building Type | Weight |
|---|---|---|
| Commercial complex | commercial | 3 |
| Restaurant | commercial | 3 |
| Office | commercial/public | 2 |
| Grocery | commercial | 2 |
| School | public | 1.5 |
| Park entrance | public | 1.5 |
| Entertaining and cultural venue | commercial/public | 1 |
| Hospital | public | 1 |
| Bank | public | 1 |
| Total | - | 16 |
Table 2.
Classification of walkability.
| Value of Walkability | Description |
|---|---|
| 80–100 | Walker’s paradise: daily errands do not require a car |
| 60–80 | Very walkable: most errands can be accomplished on foot |
| 30–60 | Somewhat walkable: some facilities are within walking distance |
| 20–30 | Less walkable: a few facilities are within walking distance |
| 0–20 | Car-dependent: almost all errands require a car |
Table 3.
Proportion of area of classified walkability categories in Futian District (2013 and 2018).
Table 3.
Proportion of area of classified walkability categories in Futian District (2013 and 2018).
| Walkability Index | Categories | Proportion of Whole Area 1 (%) (2013) | Proportion of Whole Area 1 (%) (2018) | Proportion of Built Environment 2 (%) (2013) | Proportion of Built Environment 2 (%) (2018) |
|---|---|---|---|---|---|
| 80–100 | Walker’s paradise | 1.53 | 1.56 | 2.22 | 2.27 |
| 60–80 | Very walkable | 2.17 | 5.40 | 3.05 | 7.58 |
| 30–60 | Somewhat walkable | 8.56 | 26.64 | 10.56 | 35.29 |
| 20–30 | Less walkable | 27.75 | 14.15 | 37.46 | 16.88 |
| 0–20 | Car-dependent | 60.00 | 52.25 | 46.70 | 37.98 |
1 The proportion of area of each category of walkability level out of the whole area of Futian District; 2 The proportion of area of each category of walkability level out of the area of built environment (where green and blue spaces were excluded).
Table 4.
Prediction errors of Ordinary Kriging interpolation.
| Year | Mean Standardized | Root-Mean-Square Standardized | Root-Mean-Square | Average Standard Error |
|---|---|---|---|---|
| 2013 | 0.000 | 1.066 | 8208.474 | 7450.749 |
| 2018 | 0.014 | 1.002 | 13,221.880 | 13,199.290 |
Table 5.
Bivariate correlation of walkability level and residential estate price (2013 and 2018).
| Variables | Natural Logarithm of Samples’ Walkability Level in 2013 and 2018 | ||
|---|---|---|---|
| Pearson Correlation Coefficient | Significance (Bilateral) | N | |
| Natural logarithm of samples’ housing price (2013) | −0.097 | 0.158 | 215 |
| Natural logarithm of samples’ housing price (2018) | −0.280 ** | 0.012 | 215 |
** Correlation is significant at the 0.01 level (2-tailed).
Table 6.
Comparison of walkability value and residential estate price across subsample sets.
| Variable | Samples | Sample Size | Mean | Median | Difference in Subsamples |
|---|---|---|---|---|---|
| walkability value (2013) | Full sample | 215 | 28.92 | 23.19 | NA |
| Subsample below median walkability value (<23.19) | 107 | 17.15 | 18.08 | −23.43 *** | |
| Subsample above median walkability value (≥23.19) | 108 | 40.58 | 30.29 | ||
| walkability value (2018) | Full sample | 215 | 35.80 | 31.37 | NA |
| Subsample below median walkability value (<31.37) | 108 | 17.96 | 18.34 | −35.85 *** | |
| Subsample above median walkability value (≥31.37) | 107 | 53.81 | 51.41 | ||
| Residential estate price (RMB/m2) (2013) | Full sample | 215 | 28998 | 26991 | NA |
| Subsample below median walkability value (<23.19) | 107 | 31267 | 28864 | 4517 ** | |
| Subsample above median walkability value (≥23.19) | 108 | 26750 | 25809 | ||
| Residential estate price (RMB/m2) (2018) | Full sample | 215 | 67662 | 64954 | NA |
| Subsample below median walkability value (<31.37) | 108 | 72018 | 67176 | 8754 *** | |
| Subsample above median walkability value (≥31.37) | 107 | 63264 | 63067 |
** Difference between the mean values across two subsample sets is significant at the 0.01 level. *** Difference between the mean values across two subsample sets is significant at the 0.001 level.
© 2019 by the authors. Licensee MDPI, Basel, Switzerland. This article is an open access article distributed under the terms and conditions of the Creative Commons Attribution (CC BY) license (http://creativecommons.org/licenses/by/4.0/).
Share and Cite
MDPI and ACS Style
Zhang, J.; Tan, P.Y.; Zeng, H.; Zhang, Y. Walkability Assessment in a Rapidly Urbanizing City and Its Relationship with Residential Estate Value. Sustainability 2019, 11, 2205. https://0-doi-org.brum.beds.ac.uk/10.3390/su11082205
AMA Style
Zhang J, Tan PY, Zeng H, Zhang Y. Walkability Assessment in a Rapidly Urbanizing City and Its Relationship with Residential Estate Value. Sustainability. 2019; 11(8):2205. https://0-doi-org.brum.beds.ac.uk/10.3390/su11082205
Chicago/Turabian StyleZhang, Jingyuan, Puay Yok Tan, Hui Zeng, and Ye Zhang. 2019. "Walkability Assessment in a Rapidly Urbanizing City and Its Relationship with Residential Estate Value" Sustainability 11, no. 8: 2205. https://0-doi-org.brum.beds.ac.uk/10.3390/su11082205
Note that from the first issue of 2016, this journal uses article numbers instead of page numbers. See further details here.