Spatial Big Data Analysis of Political Risks along the Belt and Road


1
School of International Relations and Public Affairs, Fudan University, Shanghai 200433, China
2
Department of Politics and International Studies, University of Cambridge, Cambridge CB2 1TN, UK
3
Department of Land Economy, University of Cambridge, Cambridge CB2 1TN, UK
4
School of Architecture and Urban Planning, Huazhong University of Science and Technology, Wuhan 430074, China
5
Smart Planning and Design Collaborative Innovation Research Center, Huazhong University of Science and Technology, Wuhan 430074, China
6
Hubei New Urbanization Engineering Technology Research Center, Huazhong University of Science and Technology, Wuhan 430074, China
*
Author to whom correspondence should be addressed.
†
These authors contributed equally to this study.
Sustainability 2019, 11(8), 2216; https://0-doi-org.brum.beds.ac.uk/10.3390/su11082216
Submission received: 7 January 2019
/
Revised: 17 February 2019
/
Accepted: 2 April 2019
/
Published: 12 April 2019
(This article belongs to the Special Issue OBOR—One Belt One Road Research: New Forms of International and Cross-Industry Collaboration for Sustainable Growth and Development)
Abstract
:As many regions along the Belt and Road have long been struggling with terrorist attacks, crimes, wars, and corruption, political risks pose important challenges for infrastructure projects and transnational investment. The objective of the article is to contribute to the identification of different types of political risks along the Silk Road Economic Belt and 21st Century Maritime Silk Road, and the visualization of their micro-level spatial distribution based on the Global Database of Events, Language, and Tone (GDELT) datasets from October 2013 to May 2018. By adopting the bivariate Moran’s I model to compare the distribution of political risks along the Belt and Road and that of the Chinese Belt and Road Initiative (BRI) investment and construction projects based on data from the China Global Investment Tracker (CGIT), the article also generates an overall political risk profile for Chinese BRI projects. Our findings show that a particularly high percentage of Chinese BRI projects are distributed in regions with high political risks. This research has important implications for the discussion and study of the BRI. First, by combining geographic spatial statistical analysis and political science conceptual frameworks, we point out the necessity to query the BRI from interdisciplinary perspectives grounded in empirical research. Second, the research delivers to researchers, academics, practitioners, consultants and policy makers interested in the BRI the latest insights into the risks and challenges along the Belt and Road. Third, it advocates policies and strategies conducive to identifying, assessing and mitigating political risks in investment along the Belt and Road and to strengthening the sustainable development of the BRI.
1. Introduction
In the context that the global economy had experienced a slow recovery and that the international trade and investment landscape and rules for multilateral trade had undergone important adjustments, the Chinese President Xi Jinping proposed the Belt and Road Initiative (BRI) in 2013. The BRI is set to open up new investment and trade opportunities and reinvigorate the flow of capital, goods and services between China and countries along the Belt and Road. In the past five years, over 88 countries and international non-government organizations (NGOs) have signed 103 documents for cooperation on the BRI [1], and the initiative is expected to enter a new stage in 2019. However, as many regions along the Belt and Road have long been struggling with terrorist risks, crime, wars, corruption, etc., the sustainability of the BRI is beset by potential political risks, and China has already experienced certain economic losses in Malaysia and Myanmar due to regional conflicts and the alternation of political power. The objective of this article is to contribute to the identification of different types of political risks along the Silk Road Economic Belt and 21st Century Maritime Silk Road, and the visualization of their micro-level spatial distribution based upon the Global Database of Events, Language, and Tone (GDELT) datasets from October 2013 to May 2018. In doing so, it analyzes the following two research questions:
RQ1: How are different types of political risks distributed along the Belt and Road?
RQ2: What is the relationship between the spatial distribution of China’s BRI investment and construction projects, and that of the political risks along the Belt and Road?
It is worth noting that the BRI has already developed into a broad initiative that is open to all nations and is not limited by geographic boundaries. However, this study focuses on the regions along the Belt and Road in the narrow sense, that is the Silk Road Economic Belt and 21st Century Maritime Silk Road. Based upon the concept of the Silk Road Economic Belt and 21st Century Maritime Silk Road proposed by the official website of the Xinhua Silk Road [2], this article analyzes 65 countries in East Asia, Southeast Asia, West Asia, South Asia, Central Asia, and Central and Eastern Europe.
One contribution of this research is to provide a comprehensive assessment of the political risks along the Belt and Road, including political instability, social unrest, lack of democracy, and external conflict. Another contribution is that this study uses big datasets and spatial statistical methods, which not only enable the visualization of multifarious political risks at the micro-level scale, but also provide a new quantitative analysis model to examine the political risk profile of China’s BRI projects.
This research sheds light on the study of the BRI in two aspects. First, by combining geographic spatial statistical analysis and political science conceptual frameworks, it emphasizes the need to analyze the BRI from interdisciplinary perspectives grounded in empirical research. Second, this research serves as a reference about the risks and challenges along the Belt and Road, for researchers, academics, practitioners, consultants and policy makers interested in the BRI. Third, similar to our broader research agenda in this field, this article has significant policy implications, and underlines the importance of integrating micro-level research on the BRI with policy-making geared towards the sustainable development of the grand initiative. The remainder of this paper proceeds as follows. A literature review on the BRI and on political risk assessment is provided in Section 2. Section 3 identifies different political risk indicators and introduces the datasets that can be used to quantify these indicators. Section 4 elaborates the spatial statistical methods that are used in this study to analyze big datasets (in particular, this article adopts the method of kernel density estimation and the bivariate Moran’s I model). Section 5 presents the findings and provides a comparison between the distribution of the political risks along the Belt and Road and that of China’s BRI investment and construction projects. Conclusions are given in Section 6.
2. Literature Review
Since the BRI was proposed in 2013, there has been a remarkable increase in academic research on the initiative. Among the literature, three themes stand out. The first theme is motivations behind the BRI. While Yu [3] argues that the BRI aims to develop inter-connectivity of infrastructure development, and to offer Chinese enterprises a channel to conduct overseas investment, Ferdinand [4] considers that the BRI reflects China’s intention to shun the hegemony of the US and take the lead in shaping the global order. The second theme is the BRI’s impact on globalization. A prominent work focusing on this theme is by Liu and Dunford [5], who contend that the BRI helps emerging countries modernize and reduce poverty. Liu’s book [6] has a similar finding, namely that the BRI will make globalization more inclusive. The third theme is the implications of the BRI for countries and regions lying along it. For instance, Zeng [7] considers that Europe is only a second-order concern for China and may benefit less from the BRI than Asian countries. Lim [8] argues that mainland Southeast Asian countries will engage more with and benefit more from the BRI than maritime Southeast Asian countries.
As many regions along the Belt and Road are unstable and crisis-prone, at the same time as analyzing the motivations and impacts of the BRI, it is also important to analyze and assess the political risks along the BRI, which have a great impact on the investment environment and sustainability of the grand initiative. Despite its importance, there has generally been a dearth of analysis in this field. The small number of publications devoted to it include Ren and Niu’s study [9] of political risks in Sri Lanka, Ren and Yi’s research [10] on political risks in Israel, and Zhao et al.’s assessment [11] of terrorist risks along the BRI. Nonetheless, these works are limited in scope, either due to their focus on specific countries [9,10] or due to their interest in a particular type of risk, such as terrorism [11]. Therefore, more comprehensive analysis of various political risks along the Belt and Road is needed.
Both economic and political science research agree that understanding political risks matters for investment and economics. Previous research on political risks has mainly focused on two important topics. The first topic is the impact of political risks on investment. An early study conducted by Jensen [12] shows that democratic regimes decrease Foreign Direct Investment (FDI) inflows. Another example is Li’s research [13], which reveals that although interstate conflicts make a country less likely to become an investment location, they do not have obvious influence on FDI inflow. Also, Zhang and Hao [14] find that improvement in political relations has a positive and significant effect on China’s Outward Direct Investment. The second topic examines measures that can be taken to mitigate the political risks in conditions of high turbulence. For example, Fudaliński [15] emphasizes the necessity of modifying the existing model solutions and adapting them to the company’s demands. In another study, Wang et al. [16] propose the Alien Eyes’ Risk Model, which demonstrates three risk hierarchy levels and the way to avoid each level of risk.
In comparison, there is a general lack of academic research on the identification of political risks and the assessment of various political risks in different countries. The limited number of works focusing on this subject commonly use qualitative methods to analyze different types of political risks. One example is Nie and Yan’s work [17], which points out that China’s investment in countries belonging to the Association of Southeast Asian Nations (ASEAN) faces several kinds of political risks, including risks of civil disturbance, confiscation of property and contract violation. However, this research does not explain how political risks in one ASEAN country are different from the risks in another ASEAN country. A number of rating indexes, such as the Fragile States Index and the International Country Risk Guide provided by rating agencies contribute to this field of study by analyzing various types of political risks in different countries. However, such indexes are often problematic and fraught with pitfalls. On one hand, as rating data of political risks are mostly obtained using the Fuzzy Synthetic Evaluation Model, Analytic Network Process, and Delphi Method, all of which rely heavily on expert judgement, analysis based upon these data is often questioned in terms of its objectivity and reliability. On the other hand, most of the rating agencies, including Marsh and Economist Intelligence Unit (EIU), merely evaluate political risks at the country level. However, notably, not all regions in a country with high political risks are unsuitable for investment, since even in the most risky country there may be certain peaceful regions. Hence, country-level risk evaluation is not sufficient to provide precise policy advice, and there is a need to assess political risks at the local level.
The article fills the gap in the literature on the BRI by identifying and evaluating different types of political risks at the local level along the Belt and Road. Also, this article tries to contribute to the research on political risks by using big datasets and spatial statistical methods, which not only enable micro-level and more objective analysis, but also allow the effective visualization of political risks.
3. Data
The article follows Root [18], Brewers [19] and Jodice [20] in defining political risks as the probability of the disruption of multinational enterprises’ investment and operations by political forces or events. Robock [21] divides political risks into two categories: (1) macro political risks, meaning the probability of discontinuities that can impact all multinational enterprises; and (2) micro political risks, referring to the probability of discontinuities that are selectively directed towards specific fields of business activity. This study focuses on macro political risks along the Belt and Road, and aims to analyze the probability of events that have the potential to affect the profits or goals of multinational enterprises in general.
Academic scholars and rating agencies have introduced multifarious indicators to measure political risks. As is demonstrated in Table 1, we find that the most common indicators include regime type, political stability, social unrest, external conflicts, ethnic fragmentation, and corruption. Considering the difficulty in quantifying corruption, and the correlation between regime type and corruption, as in “advanced democratic institutions eventually reduced corruption” [22], as well as the correlation between ethnic fragmentation and political instability, as in “areas with high levels of ethnic polarization encountered more terrorist attacks” [23], this article excludes those two variables from the analysis. Rather, it focuses on the first four indicators, and tries to quantify them with the help of big data.
Despite the frequent appearance of the term “big data” in media reports, policy statements, and academic papers, there is no strict definition for the term. In general, big data is considered to be a large amount of information that is generated automatically in the form of text, video, images, social media and information from sensor or machine-to-machine data [27]. Big data is originally linked to three important concepts: volume, variety, and velocity. The concept of volume means that the size of the data determines their value, the potential insight that can be gained from them, and whether they can be considered as big data or not. The concept of variety refers to the type and nature of the data, which helps analysts to use the resulting insight effectively. The concept of velocity means that the speed at which the data are generated and processed should meet the demands of and challenges to growth and development [28]. For social scientists, a vital obstacle to using big data is that the data which are accessible to them are often derived from mixed sources, ranging from social media to digital sensors, which are not designed to produce valid and reliable data for academic analysis [29].
The data used for the analysis in this article were acquired from GDELT, which was created by Kalev Leetaru of Yahoo!, Georgetown University, and other scholars. As a metadata [30], the GDELT project collects information of events from 1979 to the present from the world’s broadcast, print, and internet news in nearly every part of every country, in over 100 languages, and is one of the largest open-access spatiotemporal datasets in existence. The advantage of this database is not limited to its volume of data. The data for the dataset is mainly collected from print and internet news, which increases the data’s reliability for social science research. Another advantage of this database is that all events are point dataset which include the latitude and longitude information and show the location of each event.
This study extracts and processes GDELT data from October 2013 to May 2018. We select data in this period as the BRI was not proposed until October 2013, and since other data that we use in this study, from the China Global Investment Tracker (CGIT), end in May 2018. As there is a separate dataset for events on each date during this period, we find 1703 datasets, and the number of events in each dataset ranges from 60,000 to 120,000. We input data of all these datasets into Microsoft SQL Server (Microsoft Corporation, Redmond, Washington, US), and then extract the data of assault, protest, coerce and fight in countries and regions along the Belt and Road. This yields 10,218,000 events in total, which we identify as our research object. This study adopts a much larger dataset to analyze political risks along the BRI than similar studies on the BRI, such as Wang et al. [16], which adopts 17 indexes acquired from the world development index dataset to analyze the coordinated relationship between social economy and energy environment in the BRI, Liu et al. [31], which employs 1193 Outward Foreign Direct Investment (OFDI) events obtained from the Directory of Chinese Foreign Investment Enterprises to examine the OFDI agglomeration under the BRI, and Ploywarin et al. [32], which uses 675 questionnaires to analyze the factors influencing public risk perceptions of Thai high-speed railway projects based upon the BRI.
The data of assault refer to events that involve the use of unconventional forms of violence which do not require the high levels of organization typical of state military establishments, such as terrorist attacks and crimes. The data of protest refer to events that involve civilian demonstrations and other collective actions such as strikes, hunger strikes, and rallies carried out as protests against enterprises or governments. The data of coerce include events that involve repression against civilians, the confiscation and destruction of property and restrictions on political freedoms. The data of fight contain events that involve the use of conventional force and acts of war, typically by organized armed groups.
As is demonstrated in Table 2, the four data types of assault, protest, coerce, and fight respectively reflect political instability, social unrest, lack of democracy, and external conflict, and bring different types of potential costs for the investment and operations of multinational enterprises.
In order to analyze the political risks to Chinese investment and construction in countries along the Belt and Road, we also employ the data of the CGIT. Created by the American Enterprise Institute, the CGIT is the world’s first and most comprehensive database which tracks the global investment and construction of Chinese enterprises from 2005 to 2018, containing a total of 2908 projects. As a variable in the data is the BRI, we select the data which are marked as BRI projects, and select the countries along the Silk Road Economic Belt and 21st Century Maritime Silk Road. This yields 656 projects in total. Among these projects, 84 are distributed in Central Asia, 376 are distributed in Southeast Asia and South Asia, 155 are located in West Asia and North Africa, and 41 are located in Central and Eastern Europe.
It is worth noting that the CGIT only marks the geographic location of Chinese overseas investment projects at the national scale. Therefore, we search the geographic location of each of China’s BRI investment projects from October 2013 to May 2018 at the local scale online, in order to examine the implications of the political risks along the Belt and Road for Chinese BRI investment and construction projects at the local scale.
4. Method
As spatial analysis techniques have been identified as useful tools for mapping and analyzing trends, there has been a growing tendency to adopt spatial statistical methods to analyze a wide range of topics in political science, security study, and public policy since the early 21st century. One such topic is voting behavior. A prominent study conducted by Sui and Hugill [33] employs spatial clustering analysis to examine the voting behavior in the city of College Station, Texas, and finds that the voter turnout heavily affects the extent of neighborhood effects in local elections. Similarly, Borghesi and Bouchaud [34] discover that there has been strong spatial correlation between the turnout rates and the distance between towns in elections in France since 1992. Another topic that has widely been discussed by using spatial statistical methods is urban policy. For instance, Fan and Myint [35] adopt local spatial autocorrelation indexes to examine landscape fragmentation. Yu et al. [36] analyze the urban landscape of China by detecting urban spatial clusters from nighttime light satellite images. Moreover, as spatial statistical methods allow the visualization of crime patterns in time and space, they have been increasingly adopted in the study of crimes and terrorist attacks, the latter of which represent a form of criminal act, despite the difference in their goals and those of criminal activities [37]. For instance, the work of Nakaya and Yano [38] uses space-time kernel density estimation and scan statistics to reveal that transient clusters alternatively appear in a pair of hotspot regions in Kyoto, Japan. Adopting the negative binomial regression model, Python et al. [23] analyze the ethnic divisions and terrorist attacks at a local scale. Xiao and Zhang [39] combine the approaches of space-time cube and space-time hot spot to examine the geographic distributions and temporal trends of the terrorist attacks launched by the so-called “Islamic State of Iraq and the Levant”. It is important to note that the recent boom of big data analytics in social science affords unprecedented opportunities for scholars to conduct more precise and objective analysis. Hence, some studies in political science, security study, and public policy try to combine spatial statistical methods and big data. One example is the work of Long et al. [40], which uses bus smart card data and a spatial correlation method to identify jobs-housing places and commuting trips in Beijing, China.
Nonetheless, when it comes to research on political risks, the spatial statistical method and big data analysis have rarely been adopted, despite the efforts of certain rating agencies such as Marsh and Control Risks to visualize political risks with the help of ArcGIS software (Esri, Redlands, CA, USA).
This research aims to fill this gap and, in order to visualize and analyze the political risks along the Belt and Road, combines the approach of kernel density estimation, spatial overlay and the bivariate Moran’s I model. In the first step, this article estimates the kernel density of the distribution of each political risk to analyze the spatial patterns of assault, protest, coerce, and fight. Next, it adopts the method of spatial overlay to conduct synthetic analysis of the four types of risk. Then, it employs the bivariate Moran’s I model to analyze the political risk profile of China’s BRI projects.
The kernel density calculates a magnitude per unit area from point or polyline features using a kernel function to fit a smoothly tapered surface to each point or polyline. It is a non-parametric method to estimate a variable’s probability density function based upon a finite data sample [41]. This method has recently become a commonly applied spatial analysis tool to draw a density surface in a Geographic Information System (GIS)—a “computer system that stores and links nongraphic attributes or geographically referenced data with graphic map features to allow a wide range of information processing and display operations” [42]—environment.
Spatial overlay is one of the most fundamental GIS functions, and aggregates data from one layer to another. By superimposing multiple datasets which have the same spatial reference parameters, such as coordinate system, this method enables the identification of the spatial relationship between various political risks. The overlay creates a composite map of political risks by combining the datasets’ geographic attributes.
The bivariate Moran’s I is a model that helps evaluate whether one variable is spatially correlated to another variable. As the data records used in this study are very big, in order to overcome the computational challenges, we first use the Microsoft SQL Server to conduct data processing, and then compute the data using the ArcGIS and GeoDa software (developed by Dr. Luc Anselin and his team, Chicago, IL, USA).
5. Empirical Results
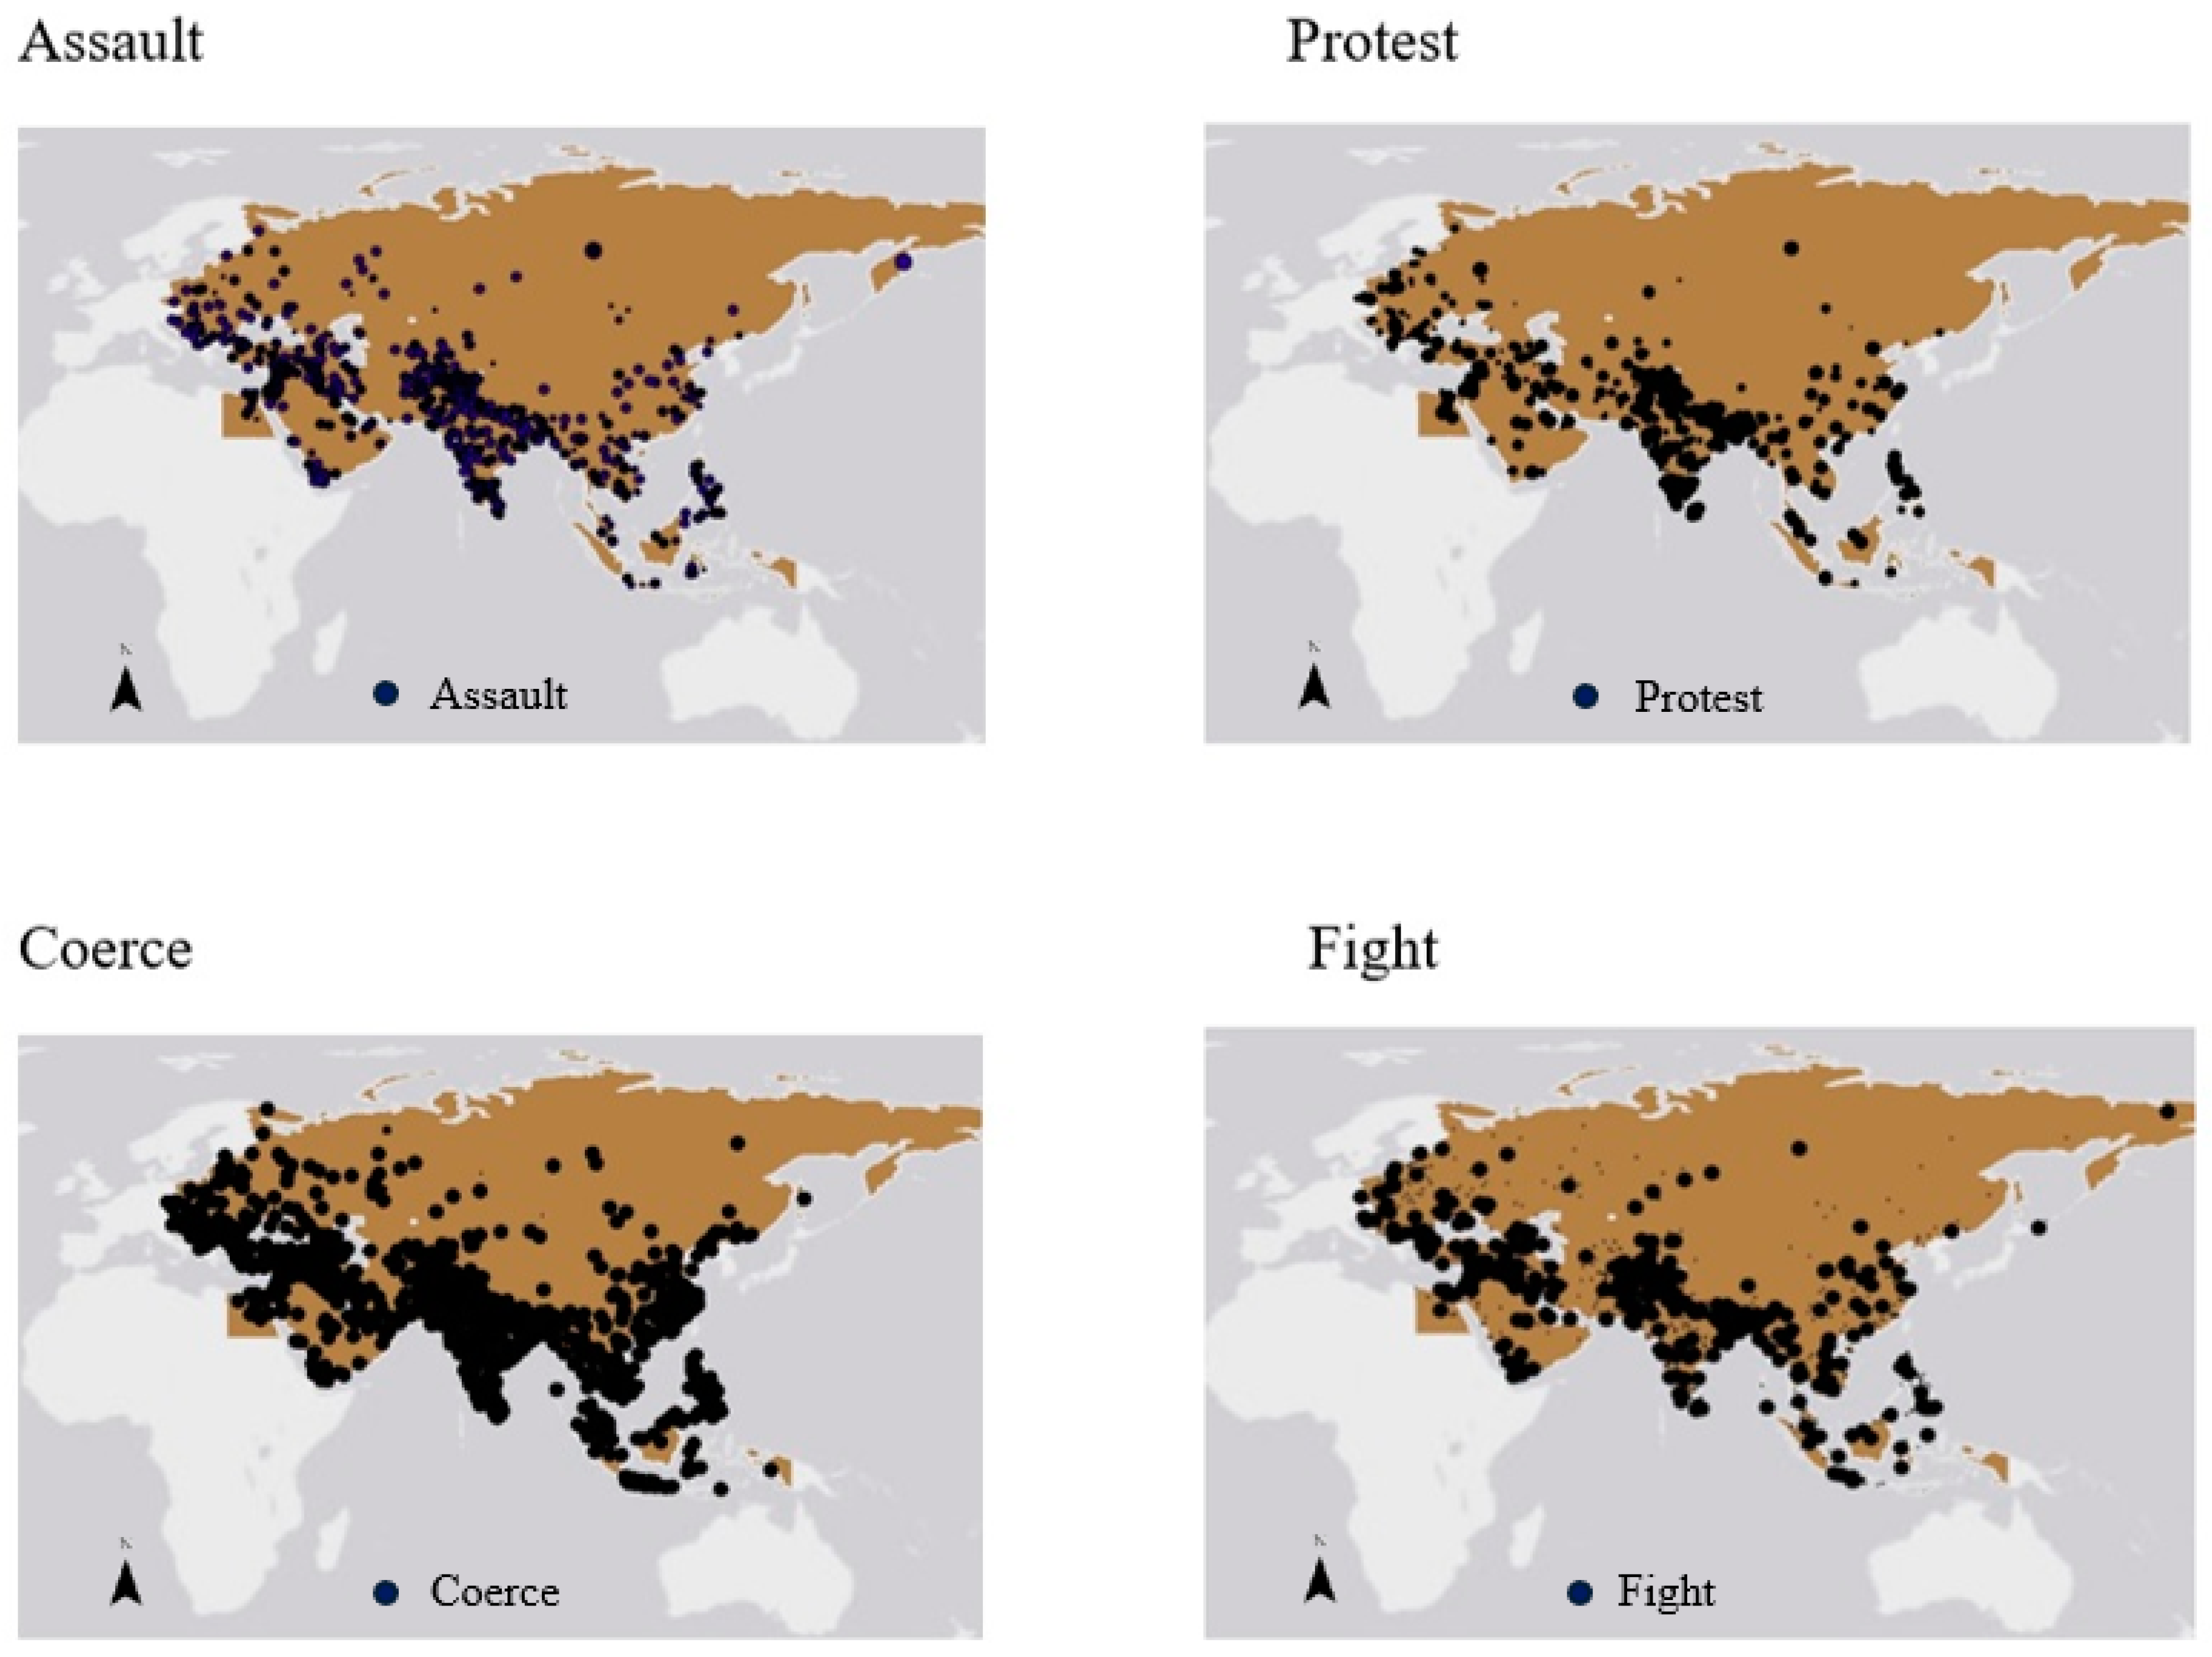
In this research, we try to address RQ1 first and then analyze RQ2. To address RQ1, we mainly adopt the kernel density estimation method. In the first step, we select the individual incidents of assault, protest, coerce, and fight respectively over the period of October 2013 to May 2018 in the 65 countries along the Silk Road Economic Belt and 21st Century Maritime Silk Road from the GDELT database. In order to visualize these four types of political incidents in three-dimensional space, we map them with the help of ArcGIS, as shown in Figure 1.
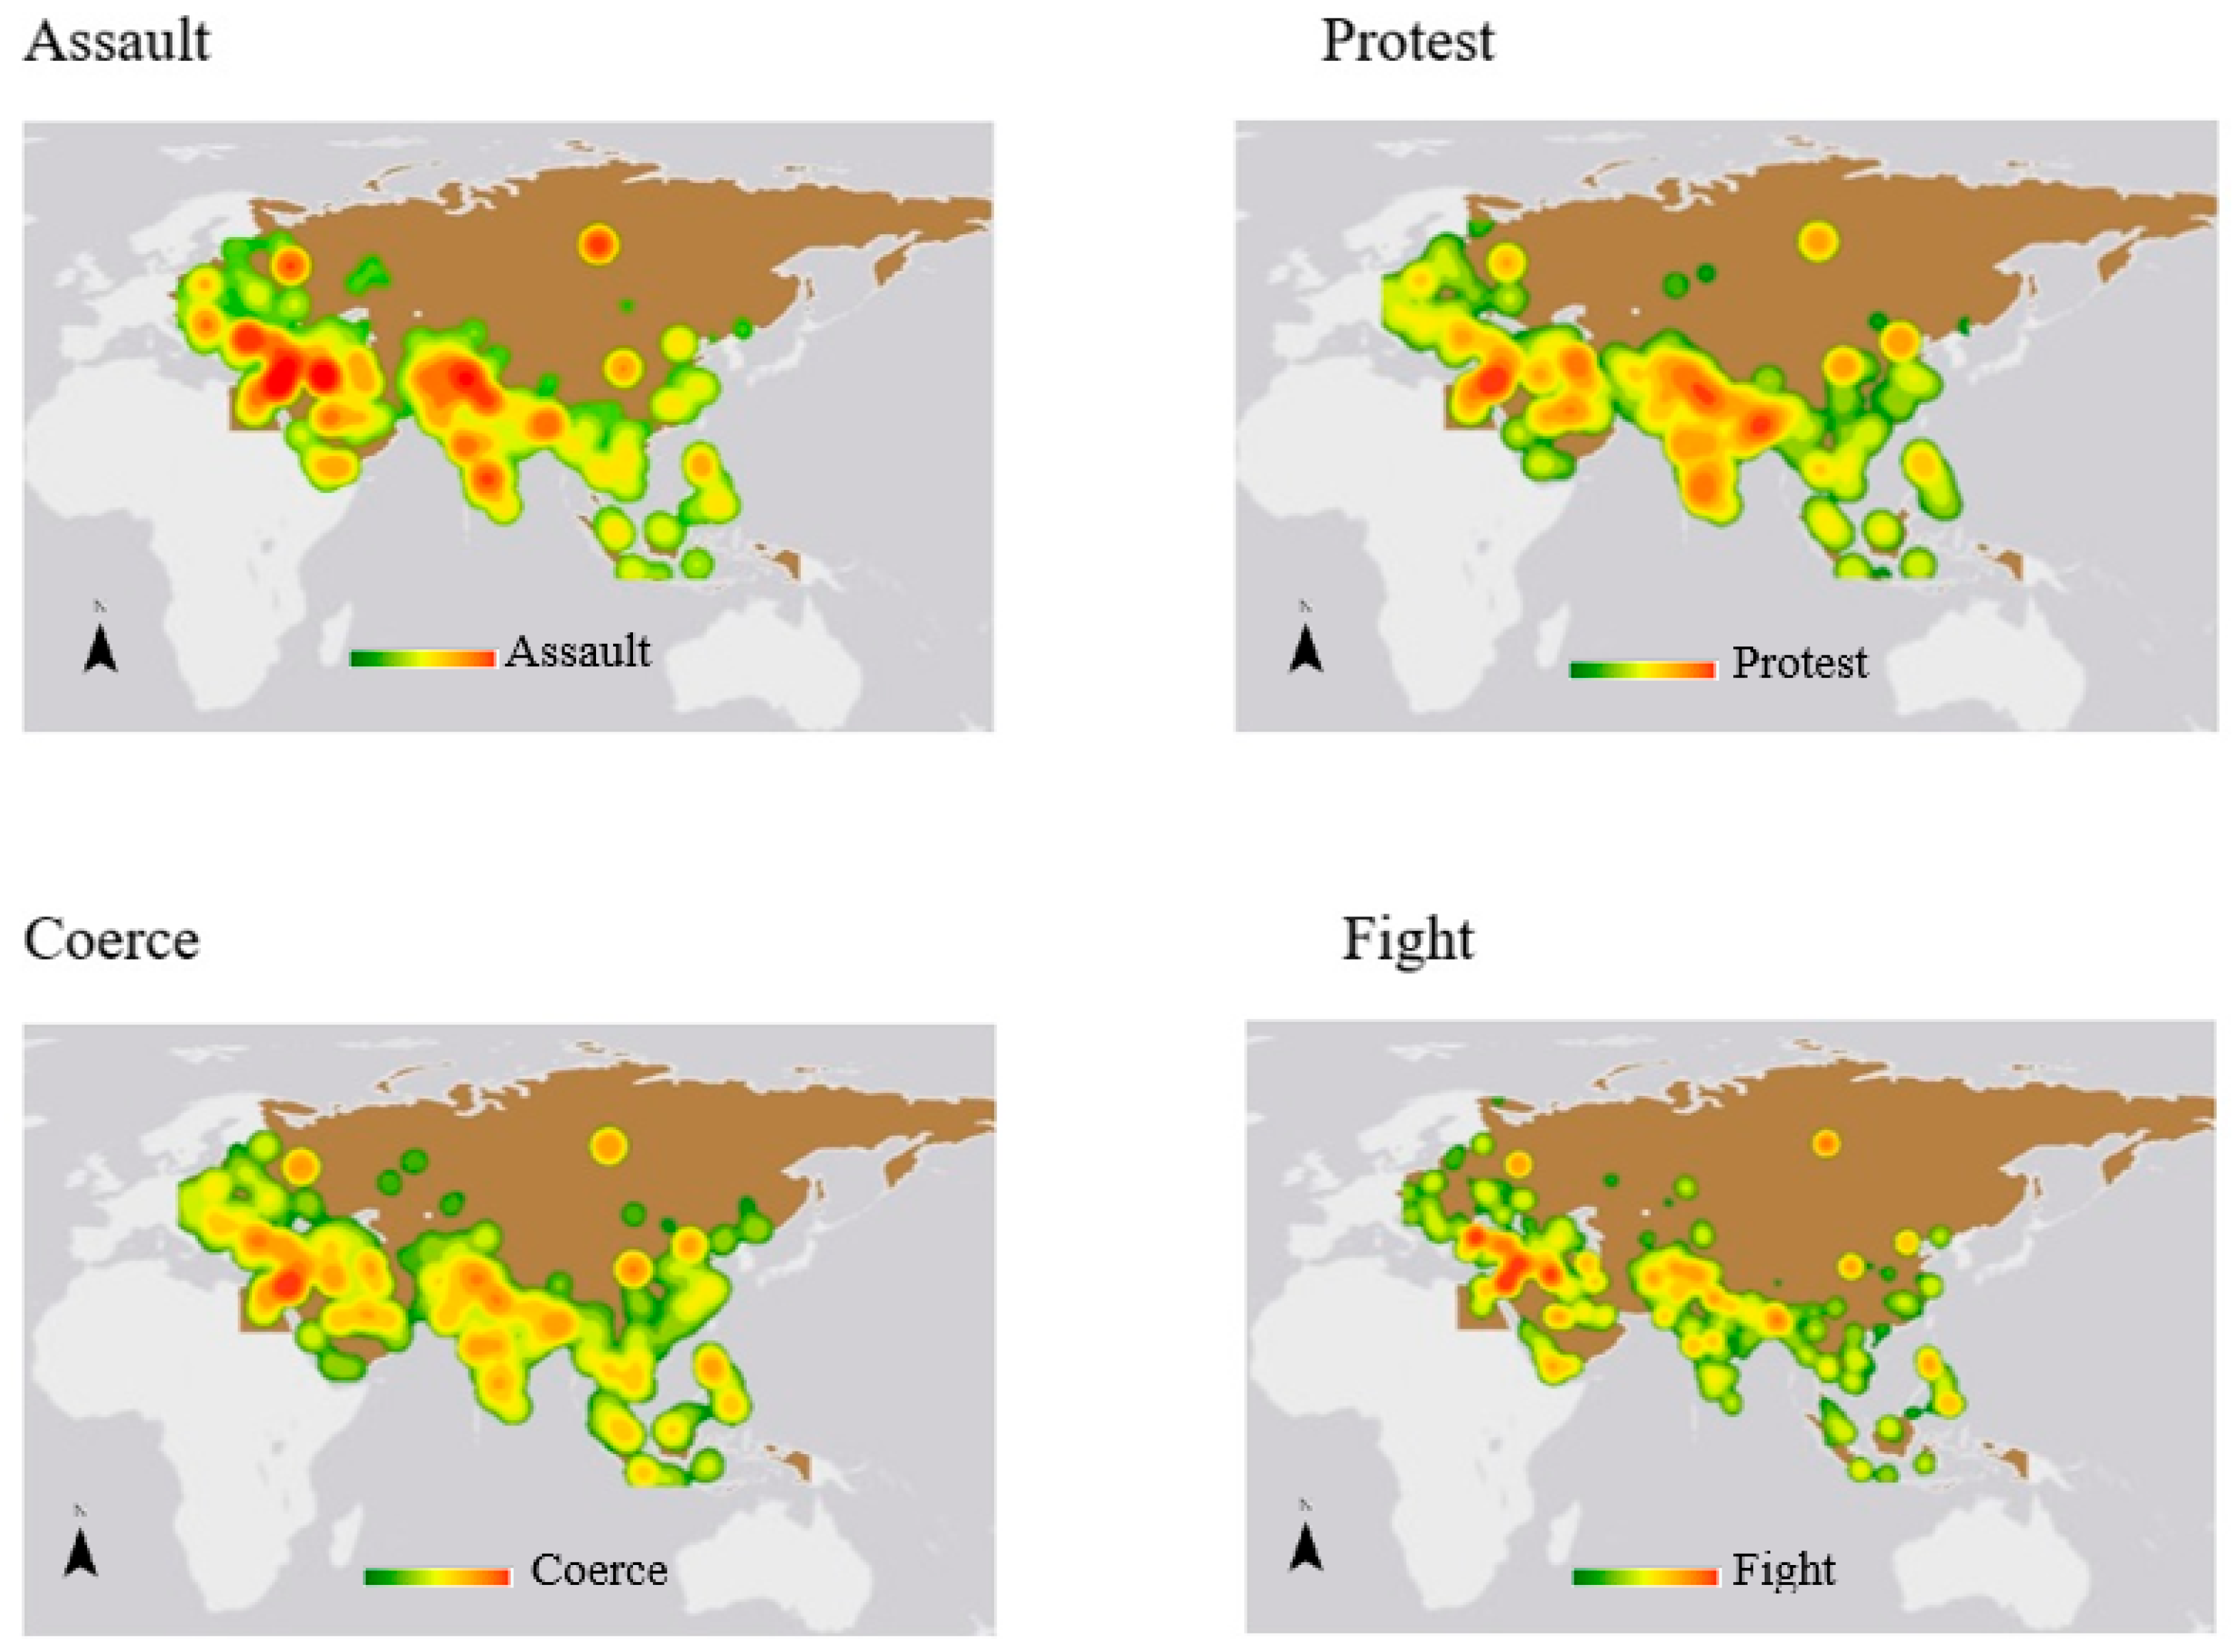
Next, as is demonstrated in Figure 2, the study adopts kernel density estimation by using the weighted overlay tool to multiply the incidents by the weights which were measured by the GDELT database according to the incidents’ impacts on the safety and stability of a country or region, and by aggregating points and calculating the Getis-Ord Gi* statistic (hot spot analysis) for each bin. The Getis-Ord Gi* statistic is calculated using the Hot Spot Analysis tool of ArcGIS, a cloud-based mapping and research platform. The resultant z-scores and p-values show where features with either high or low values cluster spatially. The Hot Spot Analysis tool examines each feature in the context of neighboring features. Only if a feature has a high value and is surrounded by other features with high values will it be marked as a statistically significant hot spot. The local sum for a feature and its neighbors is compared proportionally to the sum of all features. If there is a very large gap between the local sum and the expected local sum which does not result from random chance, then it produces the result of a statistically significant z-score.
The Getis-Ord local statistic is calculated as:
where xj is the attribute value for feature j, wi,j is the spatial weight between features i and j, n is the total number of features, and:
Since the statistics is a z-score, no further calculations are required.
In the map, dark red areas indicate clusters of incidents and a strong impact on local safety. The aim of generating the kernel density map is to show the static distribution of the four types of incidents along the Belt and Road during October 2013 to May 2018. As demonstrated in Figure 1, contrary to conventional wisdom, which states that the most common political risks faced by multinational enterprises are political instability risks, including those caused by terrorism and crime, the political risks that have the widest spatial influence along the Belt and Road are the risks of lack of democracy, followed by external conflict, political instability and social unrest.
A comparison of the kernel density estimation for the four types of incidents yields a couple of important findings that have significant implications for foreign investment along the Belt and Road.
First, it is worth noting that different countries and regions are beset with different types of incidents. For instance, while the Metohija region suffers from more assault incidents, Mindanao Island experiences more coerce and fight incidents. This means that multinational enterprises need to pay close attention to potential costs caused by political instability when investing and operating in the Metohija region, and to costs caused by lack of democracy and external conflicts in Mindanao Island. Another example is that while Jakarta suffers from more coerce incidents, Dhaka undergoes more protest events. This indicates that multinational enterprises need to place more emphasis on potential costs caused by lack of democracy in Jakarta and by social unrest in Dhaka.
Second, we find that very different results can be yielded when analyzing political risks at different spatial scales. For instance, although few incidents occur in Russia as a whole, the north part of the country, especially Moscow and the North Caucasus, appears to be highly unstable and to carry high political risks. To cite another example, although Saudi Arabia appears to have a relatively high level of political risks, the Hejaz region has a low level of political risks.
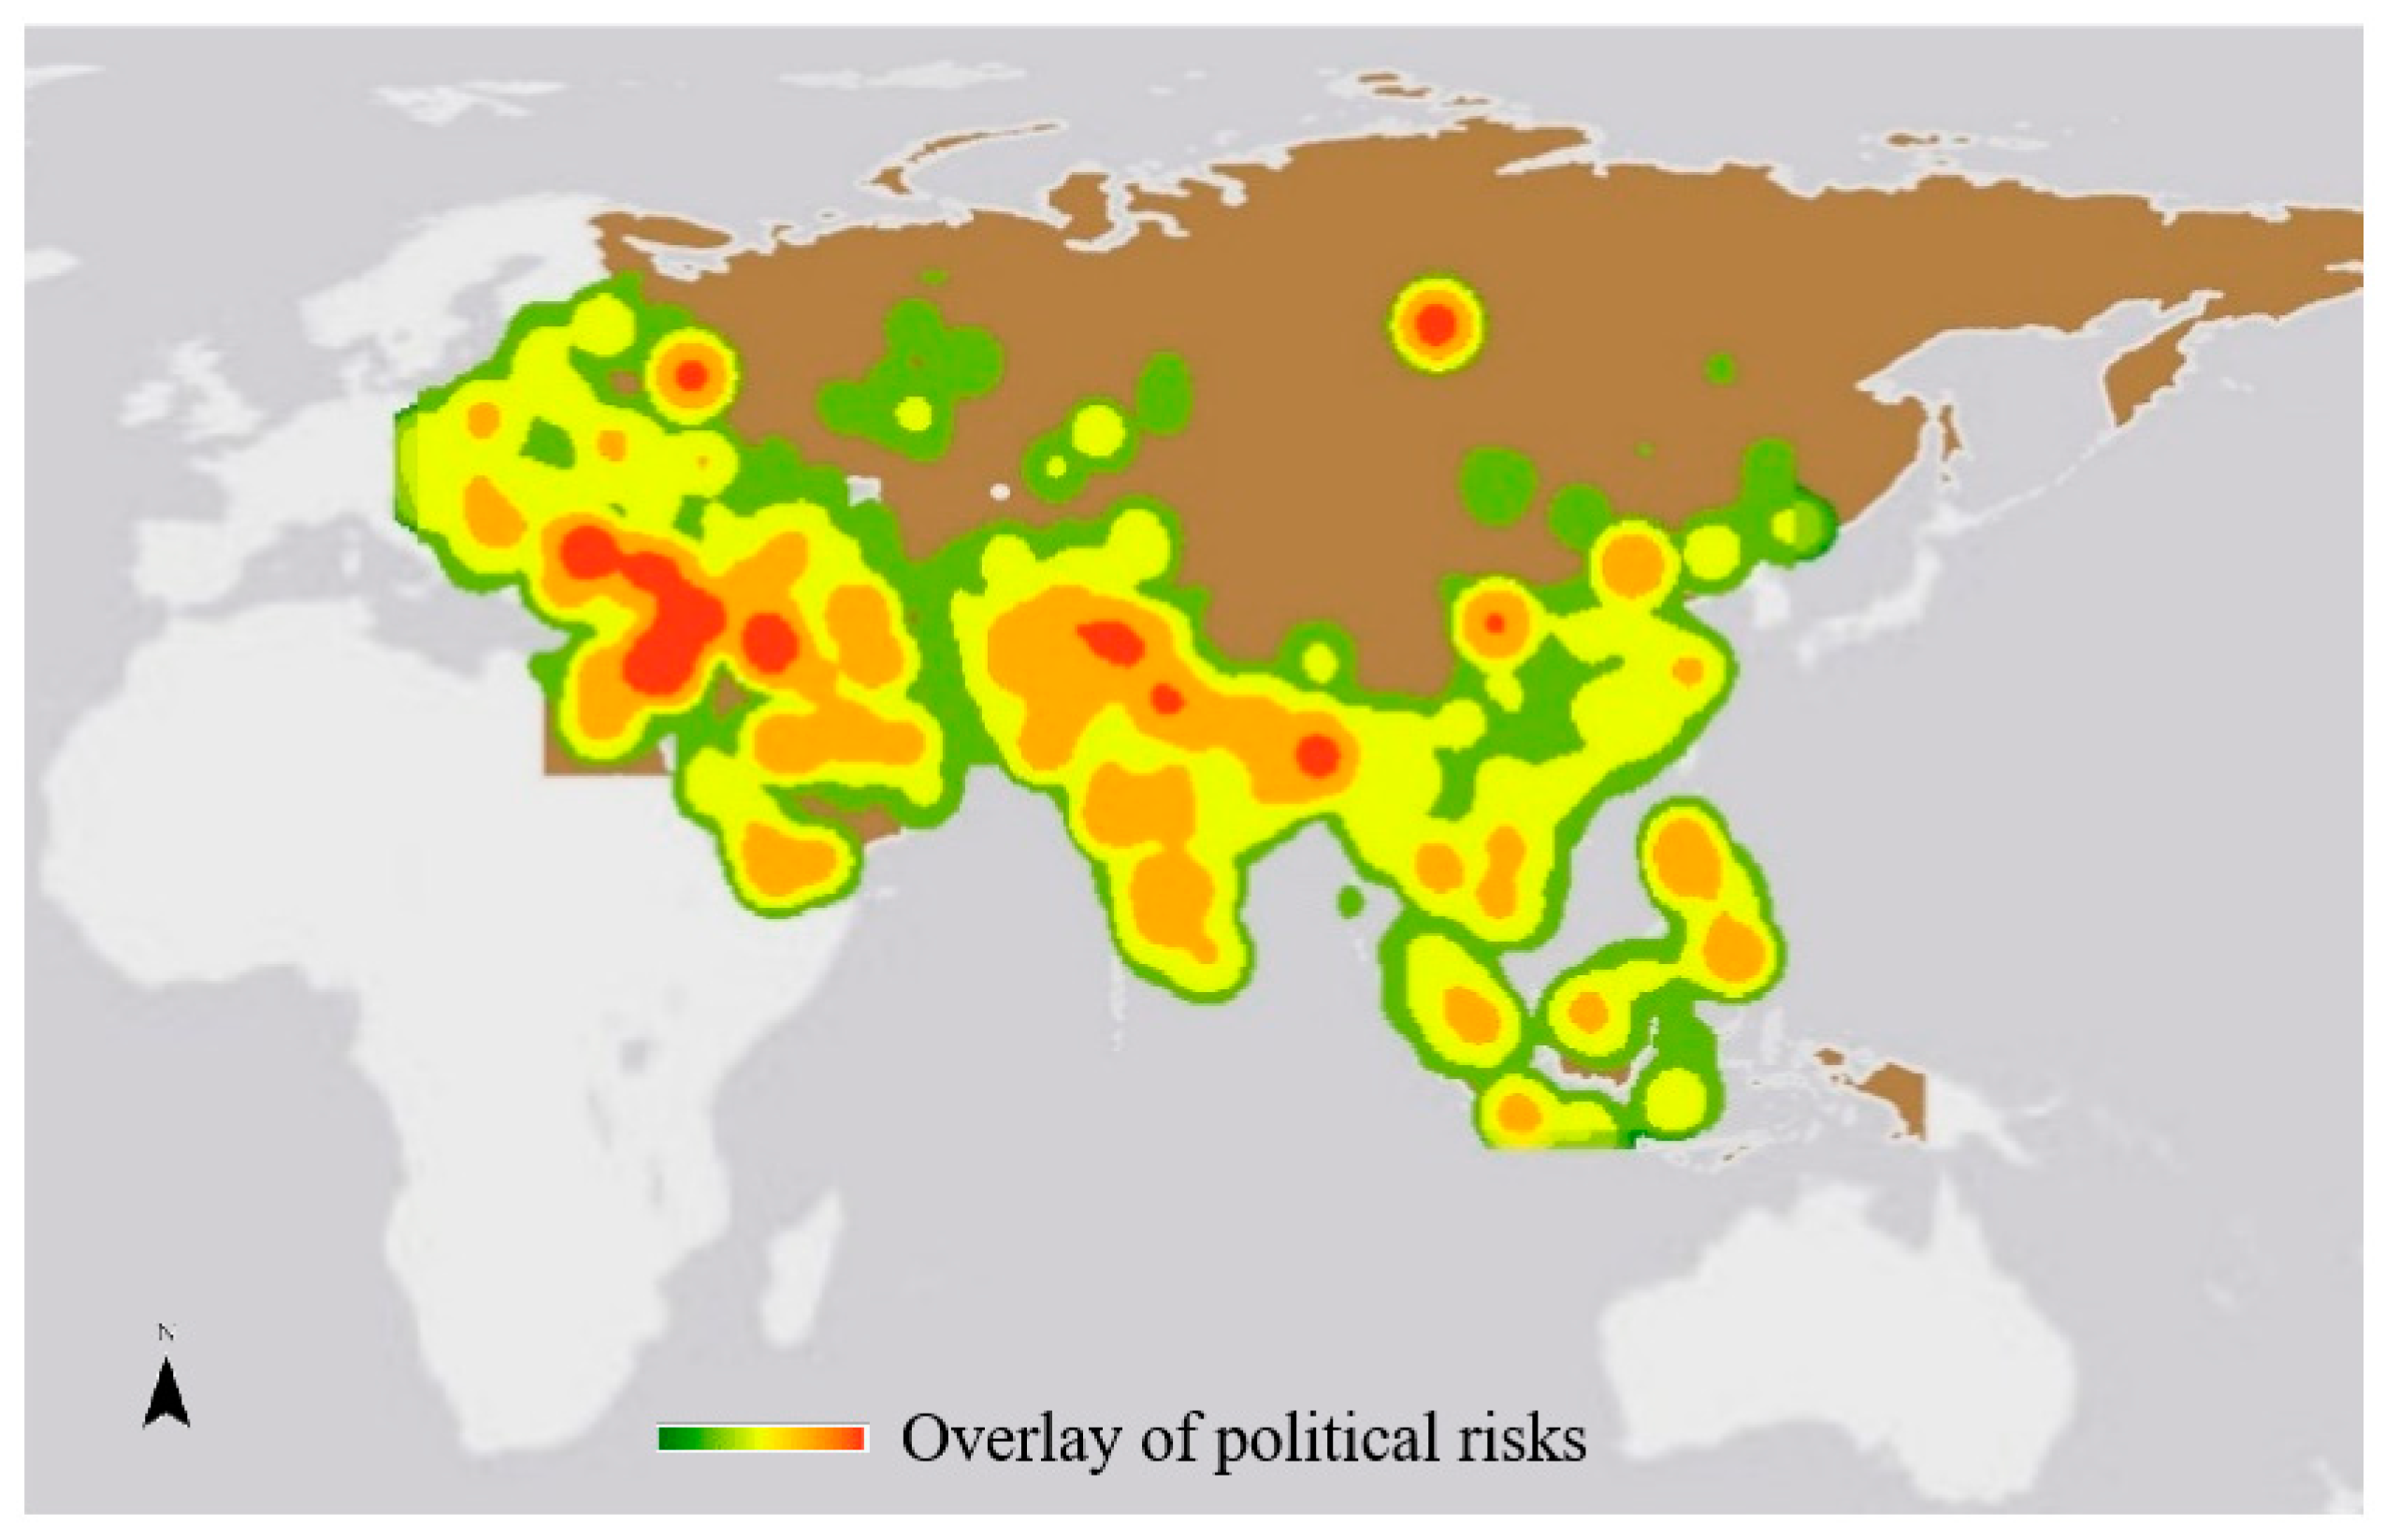
After visualizing and analyzing different types of political risks along the Belt and Road, we address RQ2. Specifically, we adopt the spatial overlay method and bivariate Moran’s I model to compare the geographic distribution of political risks along the Belt and Road and that of Chinese BRI investment and construction. By adopting the spatial overlay method, we generate Figure 3 based on the abovementioned kernel density estimation of the assault, protest, coerce, and fight incidents. The aim is to show the impact of the four types of risks along the Belt and Road in general.
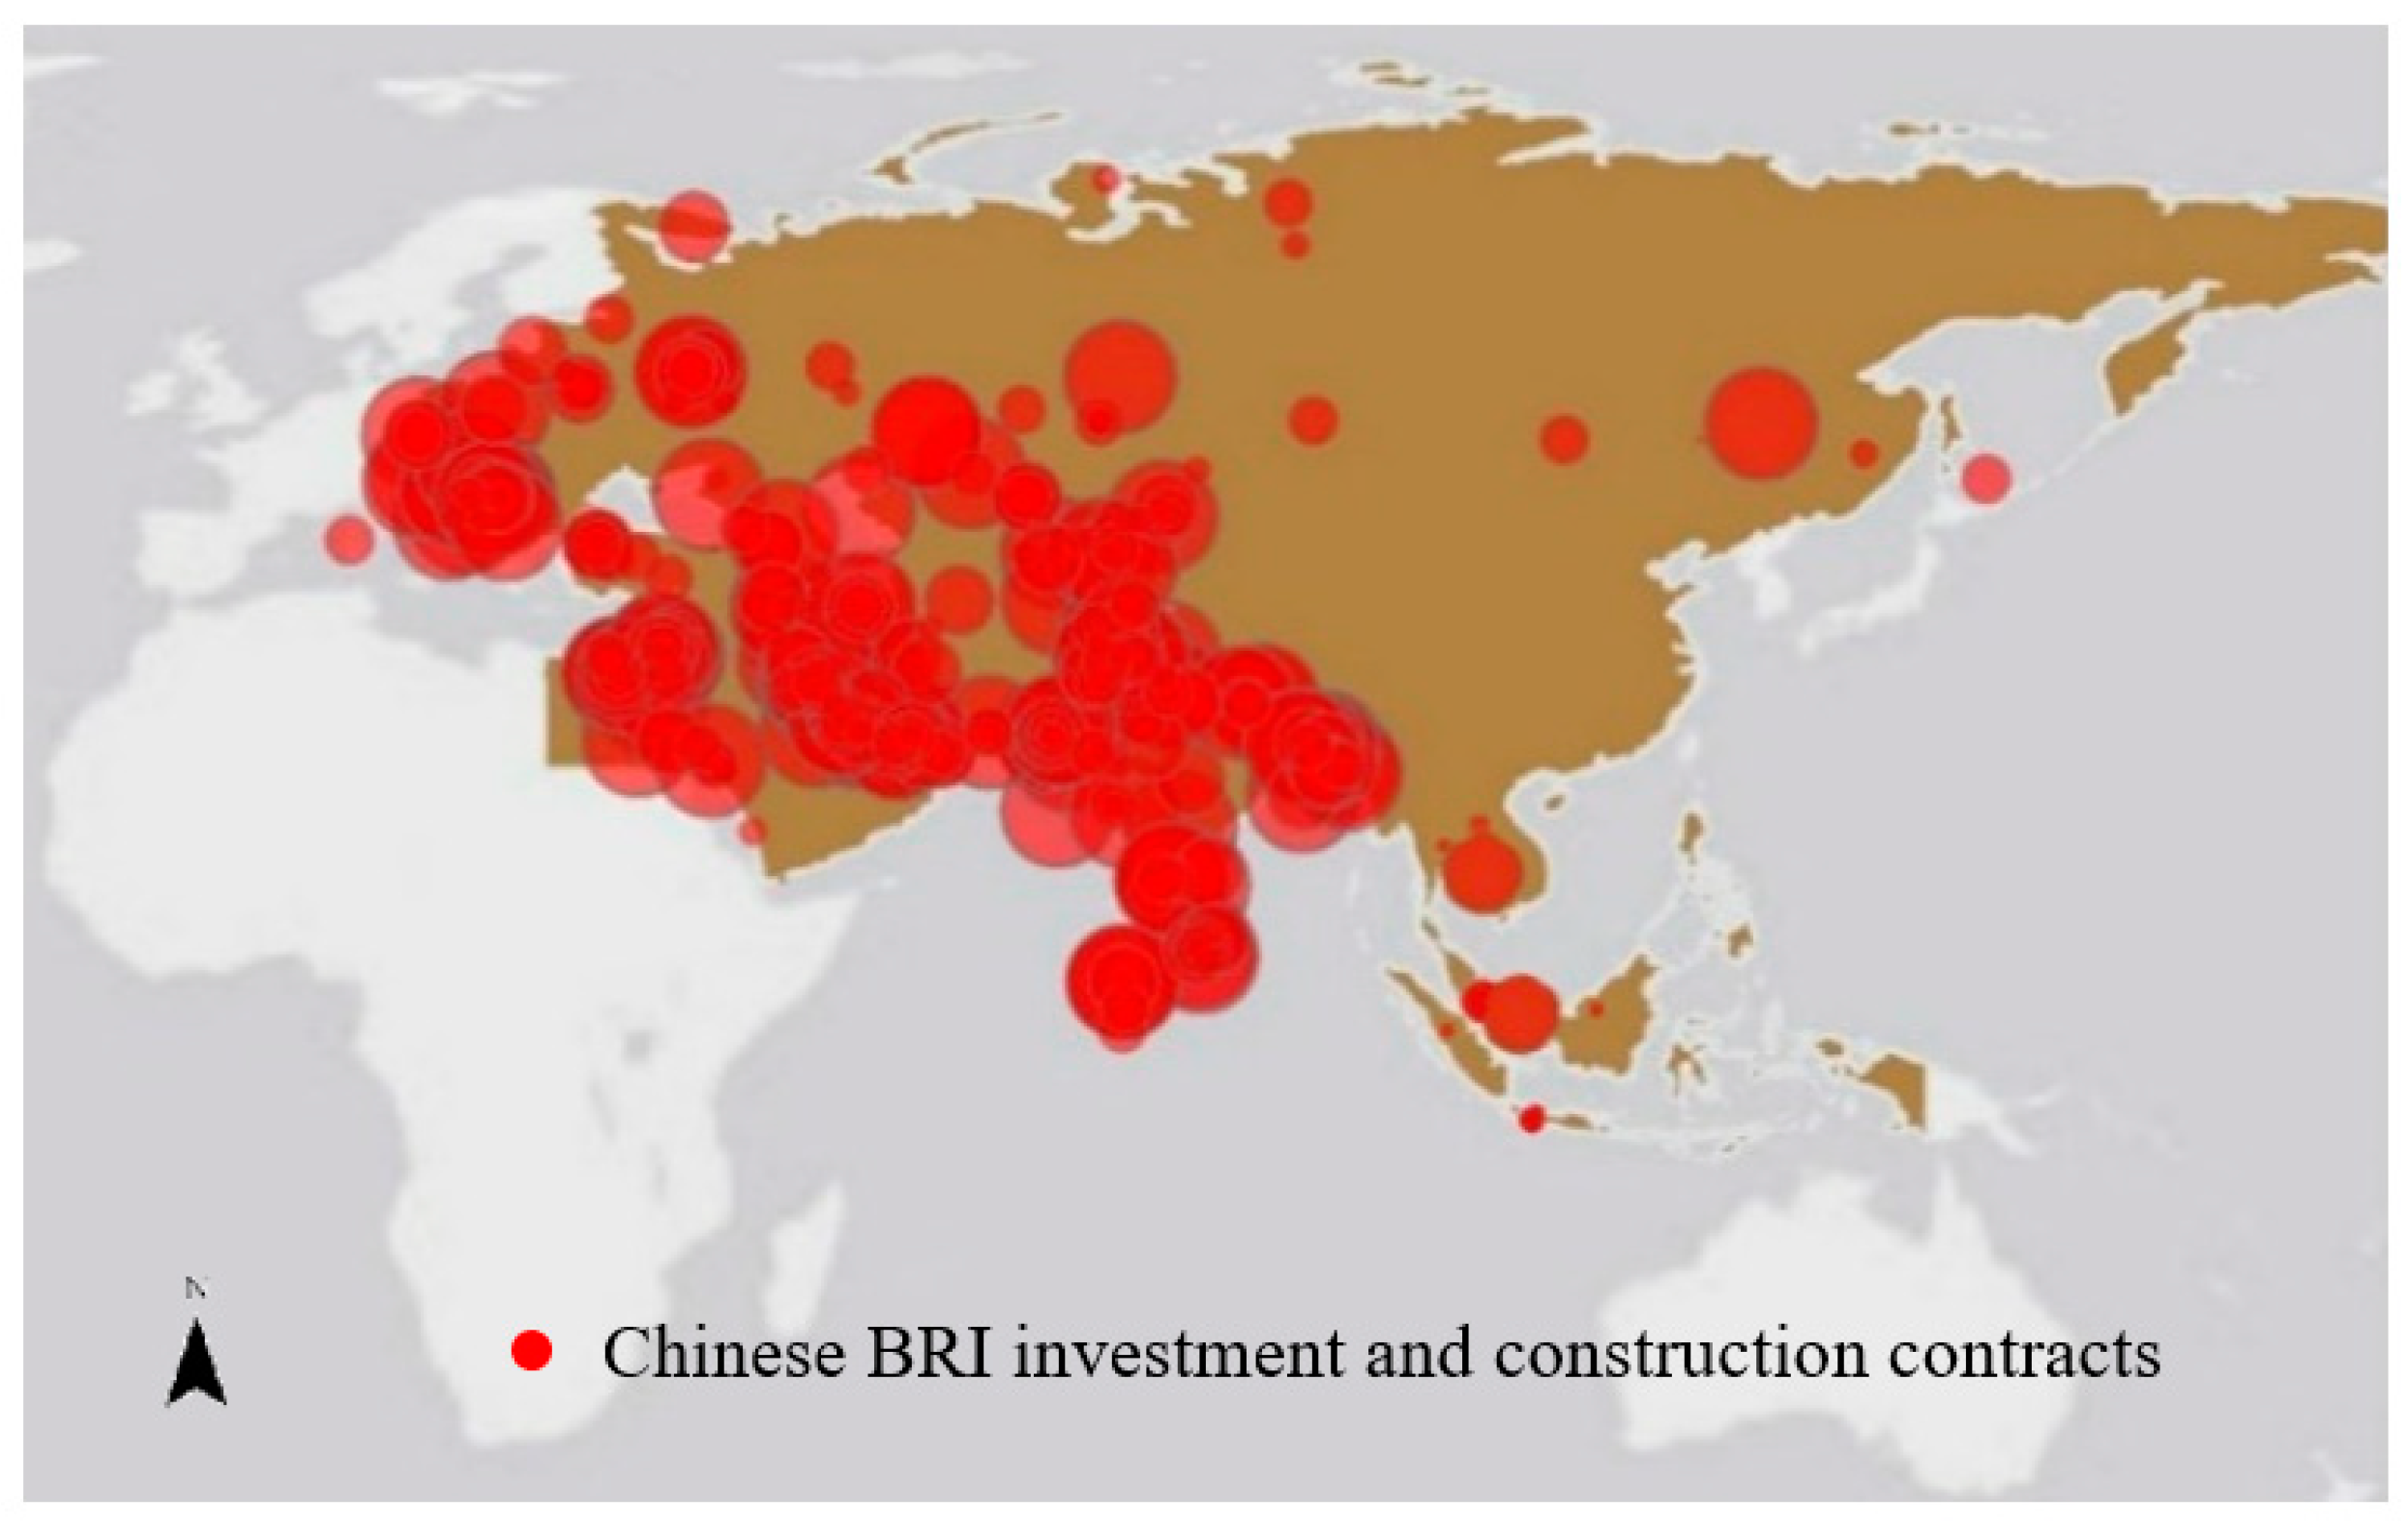
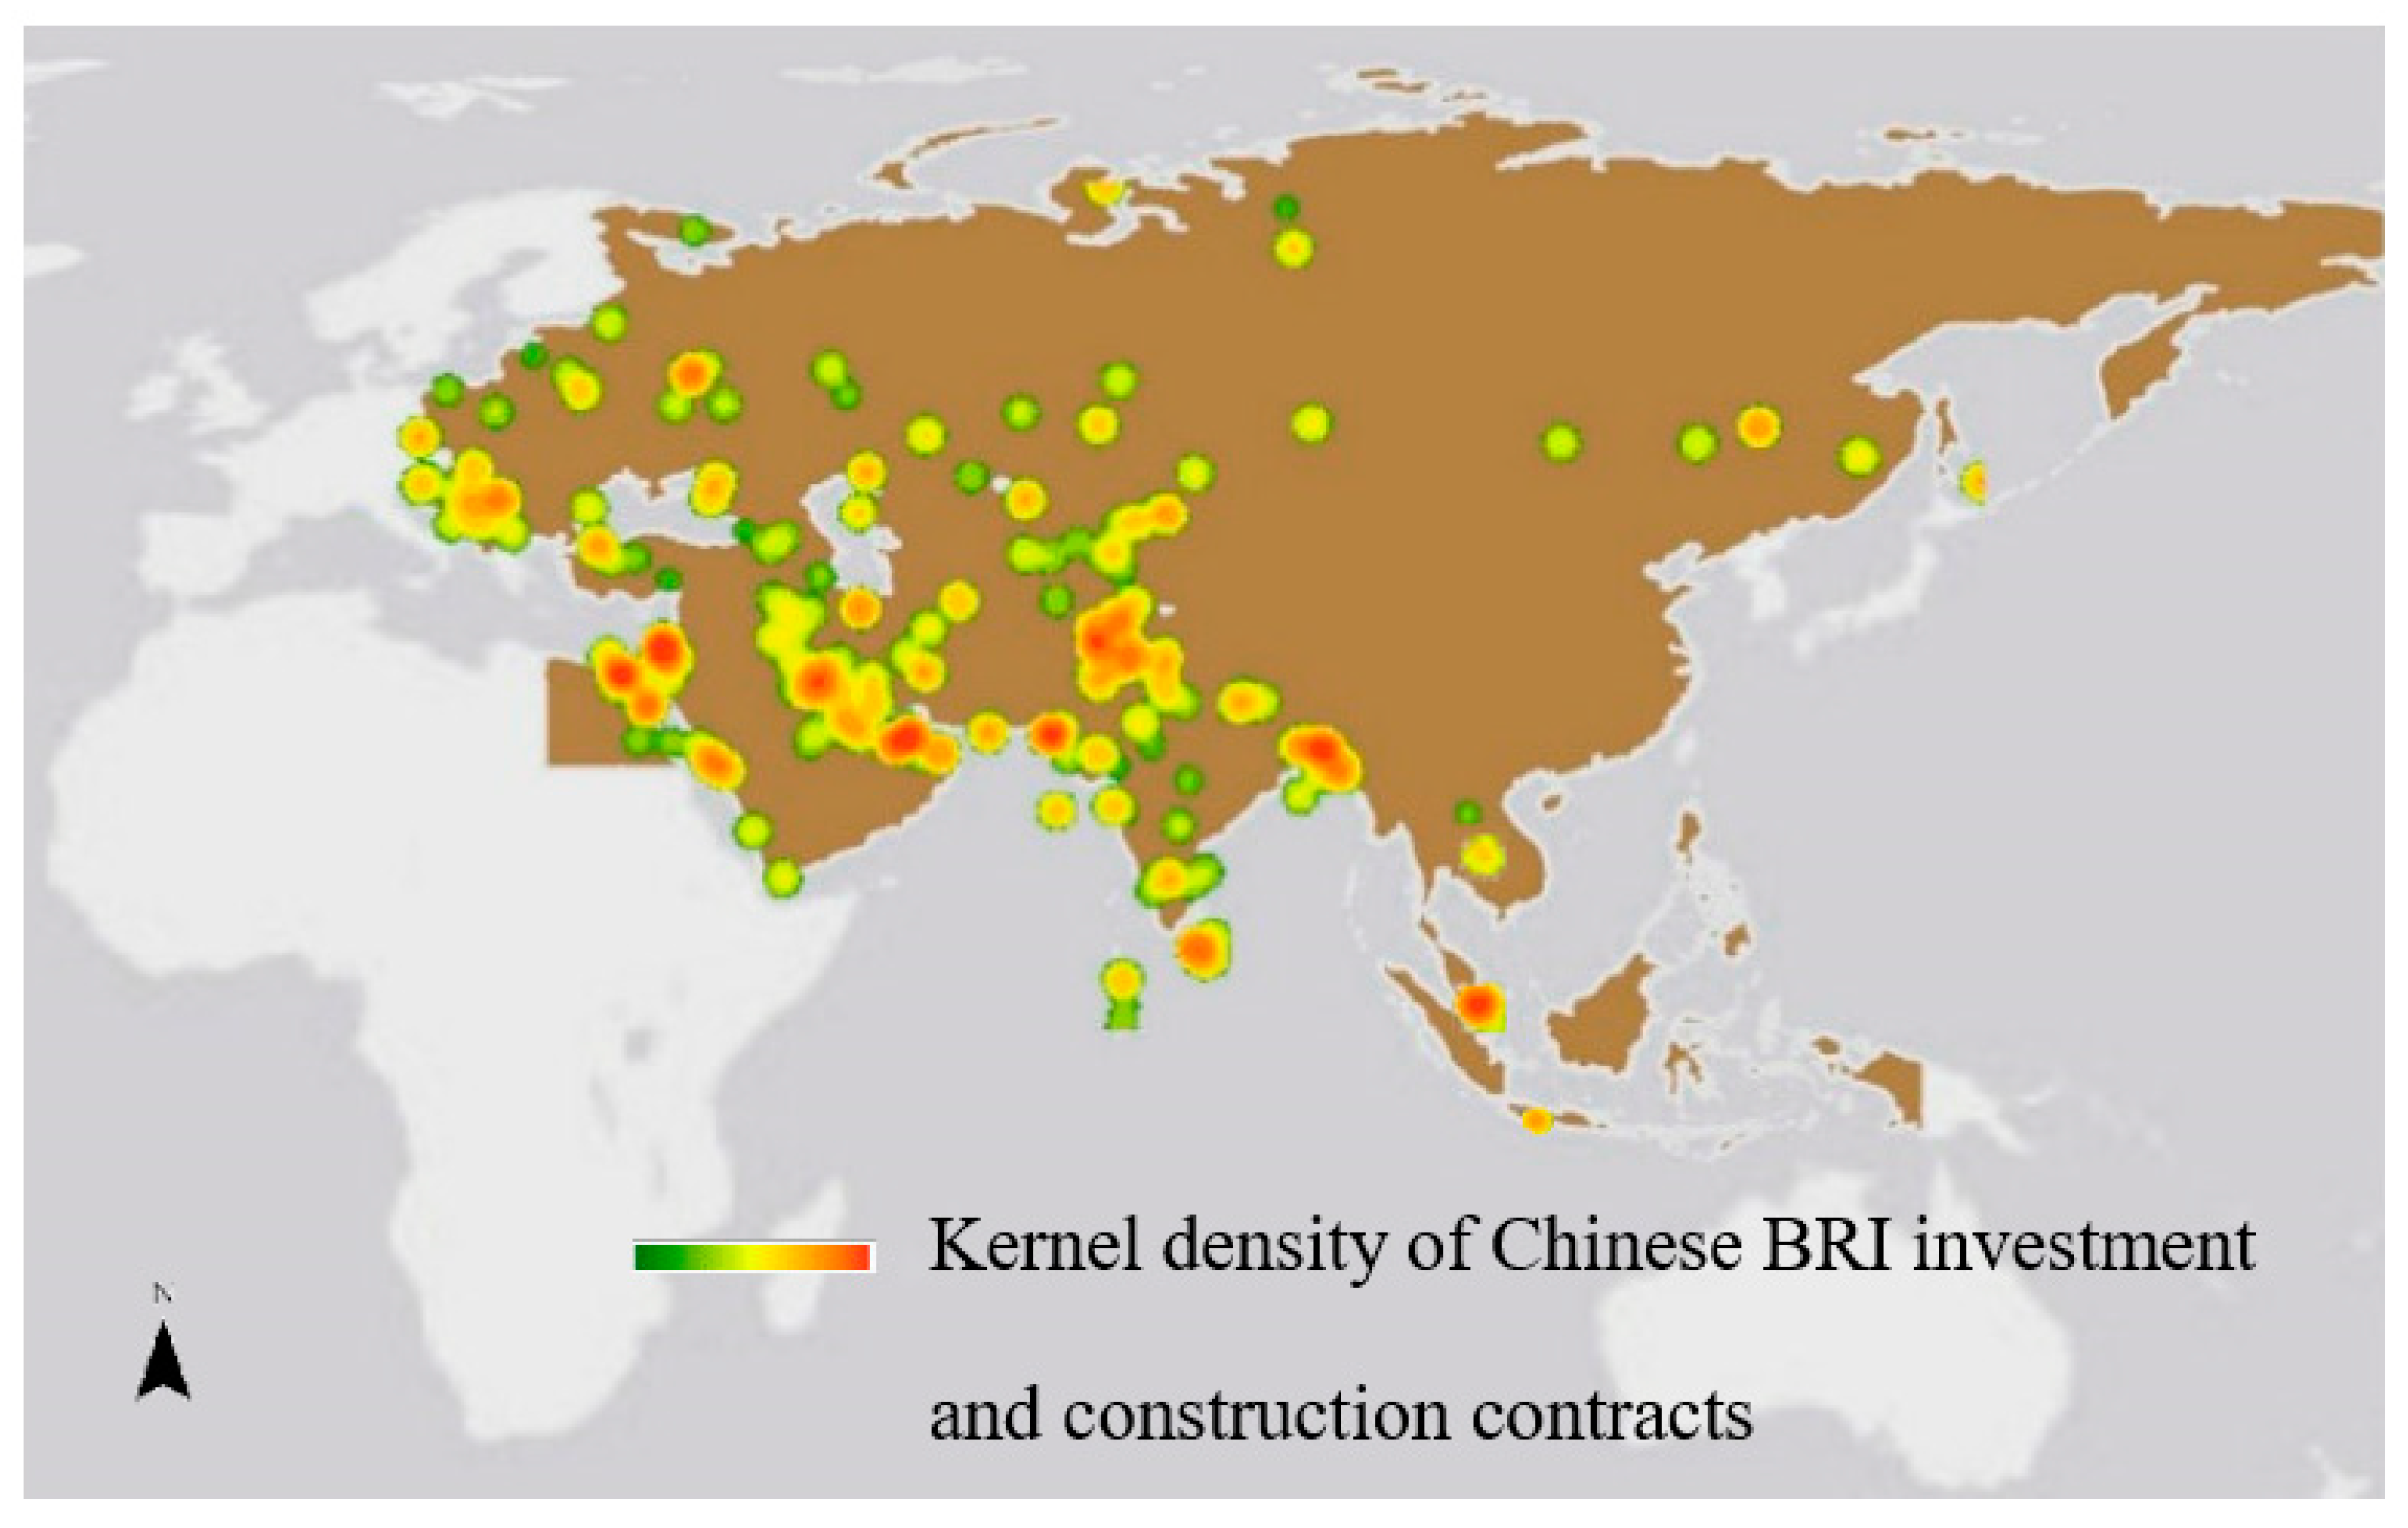
In the next step, we adopt the CGIT data and use a scatter plot to map the Chinese BRI investment and construction projects at a local scale, as shown in Figure 4. Based on Figure 4, we adopt a kernel density estimation model to visualize the density of the Chinese BRI investment and construction, and generate Figure 5.
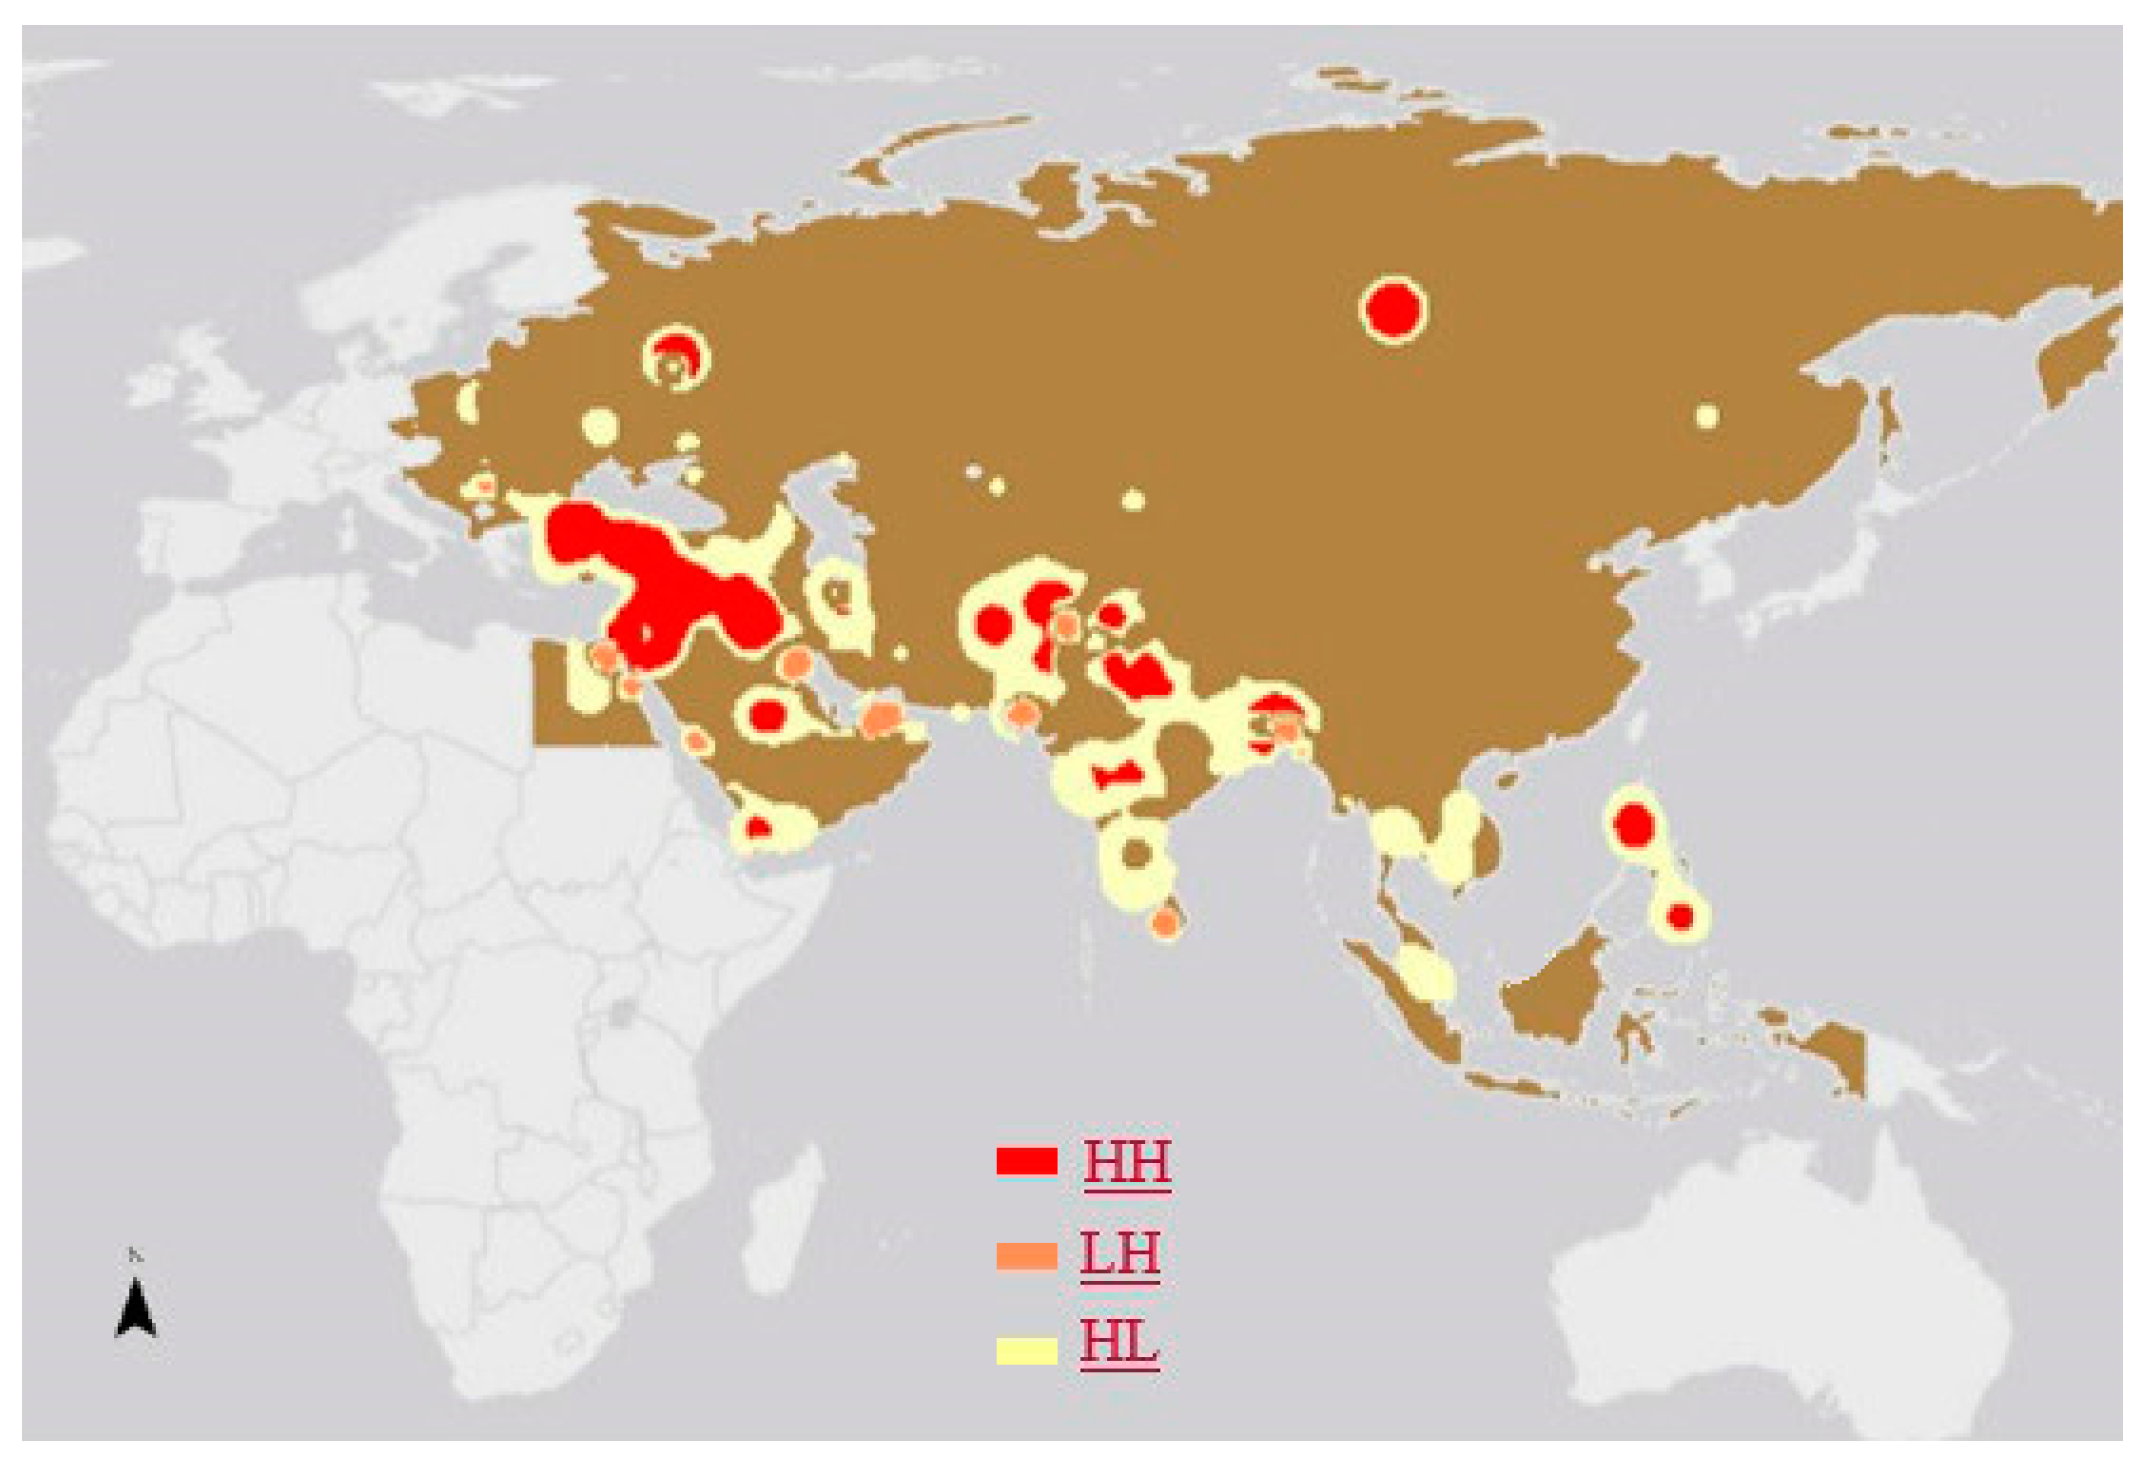
Next, we conduct a spatial correlation analysis of Figure 3 and Figure 5. The aim is to examine whether there is more Chinese investment and construction projects in regions with high political risks or regions with low political risks. To conduct the spatial correlation analysis, this article adopts the local bivariate Moran’s I algorithm using GeoDa, which enables us to calculate spatial correlation within various spatial units. The advantage of the local bivariate Moran’s I is that it allows the analysis of how the value of one variable is positively spatially correlated (High-high, HH, or Low-low, LL) or negatively spatially correlated (Low-High, LH, or High-Low, HL) with the value of another variable. The calculation formula is as follows:
where Wij is the spatial connection matrix that links the spatial unit of i to j.
calculates the value of k which is the attribute of i, and calculates the value of l which is the attribute of j. and are the averages of k and l, respectively. σk and σl are the variances of k and l.
As is shown in Table 3, the results of the global bivariate Moran’s I analysis show significant positive spatial correlations between China’s BRI investment and construction projects and political risks along the BRI (Moran’s I: 0.396).
Local Indicators of Spatial Association (or LISA) are an important method that allows researchers to identify localized map areas where values are positively or negatively correlated. As is shown in Figure 6, we generate the LISA map based on the examination of z (p = 0.001). The four possibilities generated by local bivariate Moran’s I represent four types of local spatial correlations: Quadrant I, suggesting that the numbers of both political risks and Chinese BRI projects are large (HH); Quadrant II, indicating that small numbers of political risks are surrounded by large numbers of Chinese BRI projects (LH); Quadrant III, indicating that large numbers of political risks are surrounded by small numbers of Chinese BRI projects (HL); and Quadrant IV, meaning that both political risks and the numbers of Chinese BRI projects are small (LL).
As Figure 4 demonstrates, the red color marks Quadrant I, the orange color marks Quadrant II, and the yellow color marks Quadrant III. As the regions where both political risks and the number of Chinese BRI projects are small are not our research object, Quadrant IV is not marked with any color. The regions where political risks and the number of Chinese BRI projects have no obvious spatial correlation are also not marked with any color on the map. We find that China’s BRI investment and construction projects cluster around both regions with low political risks, such as Kolkata, Zadar, Atyrau, Muscat and Alexandria, and regions with high political risks, such as the North Caucasus, Baghdad, Basra, Aden, the West Bank, Luzon, and Mindanao Island. As there are more regions marked with red, we conclude that more of China’s BRI investment and construction projects are distributed in regions with high political risks than in those with low political risks. This is partly due to the fact that many regions with high political risks, such as the North Caucasus, have rich oil and mineral resources. Hence, when conducting BRI projects, Chinese multinational enterprises need to be invested and prepared to balance out the passive impacts of political risks, and take measures such as purchasing customized insurance that covers the enterprises’ interests on chosen territories to mitigate the potential political risks.
6. Discussion
This research is by no means the first attempt to assess political risks in different regions. However, compared to the outcomes of the risk evaluation conducted by rating agencies, the empirical results obtained from this research are very different, and offer a more thorough investigation into the distribution of various political risks at the local level along the BRI, and thus provide a more meaningful reference for researchers, practitioners and policy makers. Take the EIU’s report of BRI risk assessment as an example. The EIU has established a scoring system which gives the least risky countries a score of 0 and the most risky countries a score of 100. In the EIU’s report [43], among the 39 BRI countries analyzed by the EIU, 59% (23 countries), including Egypt, Bahrain, Jordan, Cambodia, Armenia, Turkey, etc., received a score of between 40 and 60, meaning that they are somewhere between high-risk and low-risk countries. Unlike the risk evaluation conducted by rating agencies represented by the EIU, the results of our research reveal political risks at the local level, and clearly show that, whereas political risks are low in the western regions of Egypt, such as Siwa, Dakhia Oasis and Qasr al-Farafra, the political risks are high in the Sinai Peninsula. Similarly, whilst the northeastern regions of India, such as Assam and Uttar Pradesh, have high political risks, some western regions, such as Gujarat, have relatively lower political risks. By visualizing the political risks in specific cities and regions in different BRI countries, this research provides more precise guidance for practitioners and policy makers about investment decisions.
A debate has emerged over political risks along the BRI since the initiative was proposed in 2013. Many observers and commentators have noticed that many areas along the BRI face high political risks [44,45]. On the other side of the debate, some literature, such as a report by Deloitte Insights [46], states that the risks associated with the BRI are less severe than many assume. Nonetheless, scholarship on both sides of the debate is mostly based upon qualitative studies. Furthermore, most of the scholarship only focuses on the question of whether political risks along the Silk Road Economic Belt and 21st Century Maritime Silk Road are high, but does not analyze to what extent the current Chinese BRI investment and construction projects are affected by political risks. The findings of this study contribute to BRI research and policy-making by verifying that political risks along the BRI have a significant impact on Chinese projects and should arouse the attention of both private and public investors in China, as more Chinese BRI investment and construction projects are distributed in regions with high political risks than in regions with low political risks.
7. Conclusions
This study proposes a theoretical political risk analysis model based on big datasets and spatial statistical methods. It uses GDELT and CGIT data from October 2013 to May 2018, and combines the approaches of kernel density estimation, spatial overlay, and bivariate Moran’s I.
This article aims to contribute to the application of big data and spatial statistical methods to research in political science, security study, and public policy. Along with the emergence of the information-sensing internet of mobile devices, remote sensing, microphones and software logs, the so-called big data revolution is not only having a great impact on natural science, but also on social science studies. Nonetheless, the use of big data in social science still faces huge challenges, given that “the successful collection and rigorous analysis of this data require new skills, new collaborations, new research methods…” [47]. This article tries to contribute to this field in the specific context of a major economic development initiative. By adopting spatial statistical methods that are widely used in geography to analyze economic and political issues, this article suggests that interdisciplinary analysis is essential for social scientists to draw the most meaningful conclusions from big datasets.
Compared to traditional ways of analyzing political risks, which largely rely on rating indexes and qualitative methods, the model proposed in this article allows micro-level risk examination. It leads to more effective visual analysis of the distribution of political risks, and makes the entire risk assessment process more reliable, reproducible and scalable. The proposed model can be further validated and improved by obtaining additional data on similar risks.
However, this research is limited, as it only examines political risks along the BRI. More works remain to be done to systematically analyze economic risks, such as exchange-rate risks and credit risks, as well as cultural risks including regional and subcultural differences. Also, this research is limited in terms of the time frame. As the BRI was only launched in 2013, this research was only able to analyze the data of political incidents in a recent five year period. More comprehensive studies will be enabled when data covering longer periods become available in the future.
By analyzing different types of political risks along the BRI at the local level based on big data analysis and spatial statistical methods, this research paves the way for future avenues of research on political risks. This article shows that combining spatial statistical methods and big data analysis is valuable for analyzing and visualizing clusters of political risks at the local level and can be leveraged to study more topics in political science, security studies, and public policy such as political participation, state governance, and political discourse.
This research also makes an important contribution for future research on the BRI in a couple of ways. First, according to a survey conducted by the Center for China and Globalization, an independent think-tank based in Beijing, more than 32% of the enterprises that have invested in BRI projects consider political risks as the most important challenge they face [48]. This research argues that discussion about the BRI should not be limited to its motivations or impacts, and emphasizes the importance of analyzing the risks and challenges along the BRI. We also contend that, in addition to political risks, more efforts should be made to examine the economic risks, cultural risks, and other challenges along the Belt and Road. Second, to date, despite the growing number of scholarly works on various topics related to the BRI, BRI research is still at a preliminary stage, and most studies are conducted at a general and macro level. This article points out the necessity of conducting micro-level research on the BRI, and suggests that this should not be limited to the analysis of political risks along the BRI. Instead, it calls for more micro-level research on the distribution of mineral resources, tourist resources, natural disasters, etc., along the BRI, in order to enrich the existing macro-level studies on these topics [49,50,51].
Important policy implications can be derived from this study. First, this article emphasizes the importance of distinguishing different types of political risks and adopting different policies to cope with each of them. For instance, while enterprises can reduce the risks caused by political instability such as terrorist attacks and crimes through increasing the number of security personnel, risks caused by a lack of democracy may only be addressed by intergovernmental negotiations. By offering a typology of political risks and mapping different political risks in three-dimensional space, this research emphasizes that practitioners and policy makers need to formulate different solutions to deal with various types of political risks. Second, this article considers that the evaluation of political risks at exclusively the country level seems to have limited utility, given that a high-risk region may exist within a peaceful country. The mapping of political risks along the Belt and Road at a micro-level scale suggests the necessity for decision-makers to formulate investment and trade plans at the local level. This includes the prime mover in the Belt and Road initiative, China. As risk varies in nature and intensity across the BRI-participating countries, the actions China will need to take to reduce risk will have to be specific to each location. Third, this article indicates that a large proportion of Chinese BRI investment and construction projects are distributed in regions with high political risks. This means that Chinese multinational enterprises should take sophisticated measures to maximize their opportunities while mitigating potential costs caused by political risks.
Author Contributions
Conceptualization, C.Z.; methodology, C.X.; software, C.X.; validation, C.Z.; formal analysis, C.Z.; investigation, C.Z. and C.X.; resources, C.Z. and C.X.; data curation, C.Z., X.X., and H.L.; writing, C.Z.; review and editing, C.X.; supervision, H.L.; funding acquisition, H.L.
Funding
The authors of this work would like to give special thanks for the funding support from: (1) The Intelligent Planning Support System Research fund (Grant No. D1218006); (2) The Technology Innovation Foundation of Hubei Province (Grant No. 2017ADC073).
Acknowledgments
The authors thank the anonymous reviewers for their valuable comments for improving this paper.
Conflicts of Interest
The authors declare no conflicts of interest.
References
- Xinhua Net. China’s Trade with Countries along One Belt and One Road has Exceeded 5 Trillion US Dollars. Xinhua Net, 17 May 2018. [Google Scholar]
- Xinhua Silk Road. Which Countries Are Along the Belt and Road? 25 December 2017. Available online: http://silkroad.news.cn/2017/1225/76186.shtml (accessed on 2 April 2019).
- Yu, H. Motivation behind China’s ‘One Belt, One Road’ Initiatives and Establishment of the Asian Infrastructure Investment Bank. J. Contemp. China 2017, 105, 353–368. [Google Scholar] [CrossRef]
- Ferdinand, P. Westward Ho—The China Dream and ‘One Belt, One Road’: Chinese Foreign Policy under Xi Jinping. Int. Aff. 2016, 4, 941–957. [Google Scholar] [CrossRef]
- Liu, W.; Dunford, M. On the era of economic globalization 3.0: Concurrently Discuss the Concept of Intercommunication of ‘One Belt One Road’. China Ind. Econ. 2016, 1, 5–20. [Google Scholar]
- Liu, W. Inclusive Globalization: New Philosophy of China’s Belt and Road Initiative; The Commercial Press: Beijing, China, 2017. [Google Scholar]
- Zeng, J. Does Europe Matter? The Role of Europe in Chinese Narratives of “One Belt One Road” and “New Type of Great Power Relations”. J. Common Mark. Stud. 2017, 5, 1162–1176. [Google Scholar] [CrossRef]
- Lim, A. China’s “Belt and Road” and Southeast Asia: Challenges and Prospects. J. Southeast Asian Stud. 2015, 20, 3–15. [Google Scholar] [CrossRef]
- Ren, L.; Niu, H. “One Belt One Road” Investment Political Risk Study in Sri Lanka. Glob. Dev. Perspect. 2015, 15. Available online: http://intl.cssn.cn/gj/gj_gjwtyj/gj_sjjj/201512/P020151224570363849442.pdf (accessed on 2 April 2019).
- Ren, L.; Yi, L. “One Belt One Road” Investment Political Risk Study in Israel. Glob. Dev. Perspect. 2015, 15, 1–10. [Google Scholar]
- Zhao, M.; Dong, S.; Wang, Z.; Cheng, H.; Qin, F.; Li, Y.; Li, Z.; Li, F. Assessment of Countries’ Security Situation along the Belt and Road and Countermeasures. Bull. Chin. Acad. Sci. 2016, 6, 689–696. [Google Scholar]
- Jensen, N. Political Risk, Democratic Institutions, and Foreign Direct Investment. J. Politics 2008, 70, 1040–1052. [Google Scholar] [CrossRef] [Green Version]
- Li, Q. Political Violence and Foreign Direct Investment. In Research in Global Strategic Management-Regional Economic Integration; Fratianni, M., Rugman, A.M., Eds.; Elsevier Ltd.: Oxford, UK, 2006; pp. 225–249. [Google Scholar]
- Zhang, L.; Hao, X. The Impact of Political Relations on China’s Outward Direct Investment. Entrep. Bus. Econ. Rev. 2018, 4, 11–25. [Google Scholar] [CrossRef]
- Fudaliński, J. Risk Taking Propensity and Firm Internationalisation Process. Entrep. Bus. Econ. Rev. 2015, 2, 85–104. [Google Scholar] [CrossRef]
- Wang, S.; Song, J.; Wang, X.; Yang, W. The Spatial and Temporal Research on the Coupling and Coordinated Relationship between Social Economy and Energy Environment in the Belt and Road Initiatives. Sustainability 2019, 11, 407. [Google Scholar] [CrossRef]
- Nie, M.; Yan, X. Political Risks of China’s Foreign Direct Investment towards ASEAN and the Legal Precaution. Contemp. Asia Pac. 2007, 1, 36–43. [Google Scholar]
- Root, F. Analyzing Political Risks in International Business. In Multinational Enterprise in Transition: Selected Readings and Essays; Kapoor, A., Grub, P., Eds.; Darwin Press: Detroit, MI, USA, 1972; pp. 345–365. [Google Scholar]
- Brewers, T. Political Risk Assessment for Foreign Direct Investment Decisions: Better Methods for Better Results. Columbia J. World Bus. 1981, 1, 5–12. [Google Scholar]
- Jodice, D.A. Trends in Political Risk Assessment: Prospects for the Future. In International Political Risk Management: New Dimensions; Ghadar, F., Moran, T.H., Eds.; Ghadar & Associates: Washington, DC, USA, 1984; pp. 8–26. [Google Scholar]
- Robock, S. Political Risk: Identification and Assessment. Columbia J. World Bus. 1971, 4, 6–20. [Google Scholar]
- Sung, H. Democracy and Political Corruption: A Cross-National Comparison. Crime Law Soc. Chang. 2004, 41, 179–194. [Google Scholar] [CrossRef]
- Python, A.; Brandsch, J.; Tskhay, A. Provoking Local Ethnic Violence—A Global Study on Ethnic Polarization and Terrorist Targeting. Political Geogr. 2017, 58, 77–89. [Google Scholar] [CrossRef]
- EIU (Economist Intelligence Unit). Political Instability Index: Vulnerability to Social and Political Unrest. 2009. Available online: http://viewswire.eiu.com/ index. asp?layout=VWArticleVW3&article_id=874361472 (accessed on 2 April 2019).
- Baek, K.; Qian, X. An Analysis on Political Risks and Flow of Foreign Direct Investment in Developing and Industrialized Economies. Econ. Manag. Financ. Mark. 2011, 4, 60–91. [Google Scholar]
- Diamonte, R.L.; Liew, J.M.; Stevens, R.L. Political Risk in Emerging and Developed Markets. Financ. Anal. J. 1996, 52, 71–76. [Google Scholar]
- Beyer, M.; Laney, D. The Importance of ‘Big Data’: A Definition; Gartner: Stamford, CT, USA, 2012. [Google Scholar]
- Laney, D. 3D Data Management: Controlling Data Volume, Velocity and Variety; META Group: Rome, Italy, 2001. [Google Scholar]
- Lazer, D. The Rise of the Social Algorithm. Science 2015, 6239, 1090–1091. [Google Scholar] [CrossRef]
- Bodas-Sagi, D.; Labeaga, J. Using GDELT Data to Evaluate the Confidence on the Spanish Government Energy Policy. Int. J. Interact. Multimed. Artif. Intell. 2016, 6, 38–43. [Google Scholar]
- Liu, H.; Jiang, J.; Zhang, L.; Chen, X. OFDI Agglomeration and Chinese Firm Location Decisions under the “Belt and Road” Initiative. Sustainability 2018, 10, 4060. [Google Scholar] [CrossRef]
- Ploywarin, S.; Song, Y.; Sun, D. Research on Factors Affecting Public Risk Perception of Thai High-Speed Railway Projects Based on “Belt and Road Initiative”. Sustainability 2018, 10, 1978. [Google Scholar] [CrossRef]
- Sui, D.; Hugill, P. A GIS-based Spatial Analysis on Neighborhood Effects and Voter Turn-out: A Case Study in College Station, Texas. Political Geogr. 2002, 21, 159–173. [Google Scholar] [CrossRef]
- Borghesi, C.; Bouchaud, J. Spatial Correlations in Vote Statistics: A Diffusive Field Model for Decision-Making. Phys. Condens. Matter 2010, 3, 395–404. [Google Scholar] [CrossRef]
- Fan, C.; Myint, S. A Comparison of Spatial Autocorrelation Indices and Landscape Metrics in Measuring Urban Landscape Fragmentation. Landsc. Urban Plan. 2014, 121, 117–128. [Google Scholar] [CrossRef]
- Yu, B.; Shu, S.; Liu, H.; Song, W.; Wu, G.; Wang, L.; Chen, Z. Object-based Spatial Cluster Analysis of Urban Landscape Pattern Using Nighttime Light Satellite Images: A Case Study of China. Int. J. Geogr. Inf. Sci. 2014, 28, 2328–2355. [Google Scholar] [CrossRef]
- Peng, G.; Guo, D.; Liao, K.; Webb, J.J.; Cutter, S.L. Early Detection of Terrorism Outbreaks Using Prospective Space—Time Scan Statistics. Prof. Geogr. 2013, 4, 676–691. [Google Scholar]
- Nakaya, T.; Yano, K. Visualising Crime Clusters in a Space-time Cube: An Exploratory Data-analysis Approach Using Space-time Kernel Density Estimation and Scan Statistics. Trans. GIS 2010, 3, 223–239. [Google Scholar] [CrossRef]
- Xiao, C.; Zhang, C. Visualizing the spatiotemporal patterns of The Islamic State of Iraq and the Levant Terrorist Attacks from Its Early Creation. Environ. Plan. A Econ. Space 2018, 3, 497–499. [Google Scholar] [CrossRef]
- Long, Y.; Zhang, Y.; Cui, C. Identifying Commuting Pattern of Beijing Using Bus Smart Card Data. Acta Geogr. Sin. 2012, 10, 1339–1352. [Google Scholar]
- Bors, A.; Nasios, N. Bayesian Estimation of Kernel Bandwidth for Nonparametric Modelling. In Artificial Neutral Networks—ICANN; Alippi, C., Polycarpou, M., Panayiotou, C., Ellinas, G., Eds.; Springer: Berlin, Germany, 2009; p. 245. [Google Scholar]
- Liu, X.; Long, Y. Automated identification and characterization of parcels with Open Street Map and points of interest. Environ. Plan. B Urban Anal. City Sci. 2016, 2, 341–360. [Google Scholar]
- EIU. “One Belt, One Road”: An Economic Roadmap. Available online: http://www.eiu.com/Handlers/WhitepaperHandler.ashx?fi=One-Belt-One-Road-an-economic-roadmap-(Sep).pdf&mode=wp&campaignid=OBORSept2016 (accessed on 2 April 2019).
- Zhang, C.; Xiao, C. China’s Belt and Road Initiative Faces New Security Challenges in 2018. The Diplomat, 21 December 2017. Available online: https://thediplomat.com/2017/12/chinas-belt-and-road-initiative-faces-new-security-challenges-in-2018/ (accessed on 2 April 2019).
- Shi, T. Political risks pose hazards for China’s Belt and Road. Bloomberg, 24 May 2017. Available online: https://www.insurancebusinessmag.com/asia/business-news/political-risks-pose-hazards-for-chinas-belt-and-road-68404.aspx (accessed on 2 April 2019).
- Deloitte Insights. Embracing the BRI ecosystem in 2018. Available online: https://www2.deloitte.com/insights/us/en/economy/asia-pacific/china-belt-and-road-initiative.html (accessed on 2 April 2019).
- Metzler, K.; Kim, D.A.; Allum, N.; Denman, A. Who is Doing Computational Social Science? Trends in Big Data Research. SAGE White Paper. 2016. Available online: https://0-us-sagepub-com.brum.beds.ac.uk/sites/default/files/compsocsci.pdf (accessed on 2 April 2019).
- Political Risks Becomes the Biggest Risks for BRI Investment. Xinhua Silu, 8 January 2019. Available online: http://silkroad.news.cn/2019/0108/127117.shtml (accessed on 2 April 2019).
- Tang, J.; Zhang, T.; Zhou, P.; Zheng, R. An Analysis of Mineral Resources Distribution and Investment Climate in the “One Belt, One Road” Countries. Geol. Bull. China 2015, 10, 1918–1928. [Google Scholar]
- Sun, W.; Wang, M.; Zhang, Z.; Zheng, Y. The Distribution Characteristics and Development Model of the Humanity and Geological Tourism Resources along the “One Belt and One Road”. Geol. Rev. 2017, s1, 2728. [Google Scholar]
- Yang, T.; Guo, Q.; Xiao, T. Research on Distribution Characteristics of Natural Disasters along “The Belt and Road”. J. Saf. Sci. Technol. 2016, 10, 165–171. [Google Scholar]
Figure 1.
Map of individual events of assault, protest, coerce, and fight in October 2013–May 2018.

Figure 2.
Kernel density map of data of assault, protest, coerce, and fight in October 2013–May 2018. Note: the dark red color indicates clusters of incidents.
Figure 2.
Kernel density map of data of assault, protest, coerce, and fight in October 2013–May 2018. Note: the dark red color indicates clusters of incidents.

Figure 3.
Spatial overlay map of data of assault, protest, coerce, and fight in October 2013–May 2018. Note: the dark red color indicates clusters of incidents.
Figure 3.
Spatial overlay map of data of assault, protest, coerce, and fight in October 2013–May 2018. Note: the dark red color indicates clusters of incidents.

Figure 4.
Scatter plot map of Chinese Belt and Road Initiative (BRI) investment and construction contracts, October 2013–May 2018.
Figure 4.
Scatter plot map of Chinese Belt and Road Initiative (BRI) investment and construction contracts, October 2013–May 2018.

Figure 5.
Kernel density map of Chinese BRI investment and construction contracts, October 2013–May 2018. Note: the dark red color indicates higher kernel density.
Figure 5.
Kernel density map of Chinese BRI investment and construction contracts, October 2013–May 2018. Note: the dark red color indicates higher kernel density.

Figure 6.
Spatial correlation between kernel density map of Chinese BRI investment and construction contracts and spatial overlay map of data of assault, protest, coerce, and fight for October 2013–May 2018. HH refers to High-High, LH refers to Low-High, and HL refers to High-Low.
Figure 6.
Spatial correlation between kernel density map of Chinese BRI investment and construction contracts and spatial overlay map of data of assault, protest, coerce, and fight for October 2013–May 2018. HH refers to High-High, LH refers to Low-High, and HL refers to High-Low.


Table 1.
Indicators of political risks in the existing literature.
| Economist Intelligence Unit [24] | Baek and Qian [25] | Robin et al. [26] |
|---|---|---|
| Regime Type | Democratic Accountability | Political Leadership |
| History of Political Instability | Government Stability | Political Terrorism |
| Proclivity to Labor Unrest | Internal Conflicts | Civil War Risks |
| A Country’s Neighborhood | External Conflicts | External Conflict |
| Ethnic Fragmentation | Ethnic Tensions | Racial and Nationality Tensions |
| Corruption | Corruption | Corruption in Government |
| Trust in Institutions | Military in Politics | Military in Politics |
| Status of Minorities | Investment Profile | Political Party Development |
| Level of Social Provision | Law and Order | Quality of Bureaucracy |
| Inequality | Religious Tensions | Law and Order Tradition |
| State History | Socioeconomic Conditions | Organized Religion in Politics |
| Bureaucracy Quality | Economic Expectations versus Reality | |
| Economic Planning Failures |
Table 2.
Data types used in this study and the corresponding political risk indicators and potential costs for multinational enterprises.
Table 2.
Data types used in this study and the corresponding political risk indicators and potential costs for multinational enterprises.
| Data type | Political Risk Indicator | Potential Costs for Multinational Enterprises |
|---|---|---|
| Assault | Political Instability | Hiring private security; providing security training to employees and families; losing properties as a result of looting |
| Protest | Social Unrest | Potential work and transport stoppages; losing man-hours |
| Coerce | Lack of Democracy | Government nationalization and confiscation actions; repudiation of contracts; increasing taxes and tariffs |
| Fight | External conflict | Losing contracts; rebuilding; loss of life |
Table 3.
Results of the bivariate Moran’s I analysis between China’s BRI investment and construction projects (CBICP) and political risks (PR).
Table 3.
Results of the bivariate Moran’s I analysis between China’s BRI investment and construction projects (CBICP) and political risks (PR).
| CBICP | Moran’s I | z-Value | p-Value |
|---|---|---|---|
| PR | 0.396 | 286.5828 | 0.001 |
© 2019 by the authors. Licensee MDPI, Basel, Switzerland. This article is an open access article distributed under the terms and conditions of the Creative Commons Attribution (CC BY) license (http://creativecommons.org/licenses/by/4.0/).
Share and Cite
MDPI and ACS Style
Zhang, C.; Xiao, C.; Liu, H. Spatial Big Data Analysis of Political Risks along the Belt and Road. Sustainability 2019, 11, 2216. https://0-doi-org.brum.beds.ac.uk/10.3390/su11082216
AMA Style
Zhang C, Xiao C, Liu H. Spatial Big Data Analysis of Political Risks along the Belt and Road. Sustainability. 2019; 11(8):2216. https://0-doi-org.brum.beds.ac.uk/10.3390/su11082216
Chicago/Turabian StyleZhang, Chuchu, Chaowei Xiao, and Helin Liu. 2019. "Spatial Big Data Analysis of Political Risks along the Belt and Road" Sustainability 11, no. 8: 2216. https://0-doi-org.brum.beds.ac.uk/10.3390/su11082216
Note that from the first issue of 2016, this journal uses article numbers instead of page numbers. See further details here.