Long-Term Effects of Anthropogenic Factors on Nonpoint Source Pollution in the Upper Reaches of the Yangtze River

MOE Key Laboratory of Resources and Environmental System Optimization, College of Environmental Science and Engineering, North China Electric Power University, Beijing 102206, China
*
Author to whom correspondence should be addressed.
Sustainability 2019, 11(8), 2246; https://0-doi-org.brum.beds.ac.uk/10.3390/su11082246
Submission received: 6 March 2019
/
Revised: 10 April 2019
/
Accepted: 11 April 2019
/
Published: 15 April 2019
Abstract
:With the continuous enhancement of point source pollution control, non-point source (NPS) pollution has become an important factor in the deterioration of surface water quality. Meanwhile, due to the soaring global population, long-term effects of anthropogenic factors on non-point source pollution in large river basins have increasingly attracted worldwide attention. The Yangtze river is the largest river basin of China, and protecting its ecological environment has great significance on protecting the lifeline of the entire Yangtze river. In this study, the improved output coefficient and nutrient losses empirical model were used to conduct space–time simulations of non-point source pollution in the upper reaches of the Yangtze river (URYR) based on GIS during 1960–2003. This method reveals the anthropogenic effects of non-point source pollution in the upper reaches of the Yangtze river. The results indicate that the impacts of anthropogenic factors on dissolved pollutants increased significantly, while those on sediment and adsorbed pollutants increased first and then decreased during the simulation year. Agricultural land use and atmospheric deposition, as well as rural life, were the main sources of dissolved pollutants. In addition, dry land and paddy fields were the major sources of sediment and adsorbed pollutants. For the load intensities, the long-term effects of anthropogenic factors on dissolved pollutants increased rapidly, and those on the load intensity of sediment and adsorbed pollutants increased first and then decreased. Therefore, the study would propose some corresponding environmental management measures to strengthen environmental protection and non-point source pollution control in the upper reaches of the Yangtze river.
1. Introduction
The world is facing more and more serious water pollution problems, and non-point source (NPS) pollution has gradually become the most significant factor [1]. Both anthropogenic factors and ecological factors have a major impact on NPS pollution. Ecological factors bring pollutants into water sources through rainfall [2], soil loss and transport of nutrients such as nitrogen and phosphorus pollutants [3]. Anthropogenic factors mainly take into account the sediment particles; nitrogen, phosphorus, and other nutrients; pesticides and other harmful substances [4]; livestock breeding wastewater [5]; and urban living garbage. All of the above are the main sources of water pollution, and surface runoff, soil erosion, farmland drainage and atmospheric deposition are the main sources of NPS pollution. At present, the impacts of anthropogenic factors on water NPS pollution are especially serious in China [6]. The contributions of nutrients and harmful pollutants in agricultural land use (dry land, paddy field, fruit forest and urban land) are even more significant [7]. In recent decades, the impacts of anthropogenic factors on water NPS pollution have been increasing due to population growth, including climate change [8], deforestation, ecological land reduction and soil erosion. Generally speaking, anthropogenic factors affect the source, transport process, pollution load and load intensity of NPS pollutants [9]. Studying the impacts of anthropogenic factors on NPS pollutions, especially long-term impacts on large basins [10], is of great significance to understanding the impacts of anthropogenic factors on water quality and to promoting the management of land and the sustainable use of water resources [11].
The process and characteristics of NPS pollution are determined by multifaceted factors. According to previous studies, although ecological factors have had a certain impact on non-point source pollution, anthropogenic factors [12] have had more serious effects. Anthropogenic factors such as agricultural land use and rural life have increased the content of pollutants in soils and atmosphere, have affected change climatic characteristics, topography, soil structure and vegetation areas, and have destroyed ecosystems on land [2]. Therefore, many scholars have studied the non-point source pollution in the Yangtze River Basin. Wang et al. developed a binary structure model to analyze the pollution load of adsorbed pollutants in the upper reaches of the Yangtze river (URYR) [13]. Ouyang et al. used a soil and water assessment tool (SWAT) model to simulate NPS pollution in Bazhong city in the Yangtze River Basin [14]. Wu et al. combined the Universal Soil Loss Equation (USLE) and GIS to explore sediment transport in the Three Gorges reservoir area [15]. Mishra et al. applied the Hydrologic Simulation Programme—Fortran (HSPF) model to determine the runoff and sediment yield in the Indian basin [16]. At the same time, the nutrient losses empirical model (NLEM), which is mainly used to estimate the load of adsorbed pollutants, has also been applied to many watersheds at home and abroad [17]. In this study, an improved export coefficient model (IECM) is proposed based on the Johns export coefficient model [18]. IECM is mainly used for the load estimation of dissolved NPS pollutants, and it could be used to simulate NPS pollution in many large watersheds, such as the Northeast of the United States, the upper reaches of the Yangtze river in China, the Three Gorges Reservoir Region of China, and so on [19]. Traditional models (such as SWAT, HSPF, and generalized watershed loading functions (GWLF)) were mostly established in foreign river basins, which are very different from the Yangtze River Basin. The IECM takes into account rainfall and topography in the URYR and requires less parameters. It is of great significance for large scale river basins, which have few monitoring points and lack long-term continuous monitoring data. The study of the impacts of ecological factors on NPS pollution found that the IECM and NLEM could be used to accurately monitor large-scale watersheds with fewer sites that lacked long-term monitoring data [20]. Therefore, it is also very important to further study the comprehensive effects of various anthropogenic factors on NPS, as well as their respective impacts, on a macro-temporal scale.
The upper reaches of the Yangtze river [21], known as the green ecological barrier, is the catchment area of the Three Gorges Reservoir Region, and an important watershed in China. Its NPS pollution plays a vital role in the water quality of the Yangtze river [22]. In recent years, under the influence of anthropogenic factors and ecological factors, the water quality of the Yangtze river has changed greatly [23]. In this study, IECM and NLEM were used to simulate the annual loads and load intensities of NPS pollution caused by each anthropogenic factor, all anthropogenic factors and the total impact factors. Finally, according to the results of ecological and anthropogenic factors, a comparative analysis was made to determine the respective impacts of various anthropogenic factors on NPS pollution in the URYR. The purpose of this study was to reveal the variation of non-point source (NPS) pollution in the URYR, which is helpful for strengthening the management of water resources, guiding the rational use of land and protecting the ecological environment of the basin.
2. Materials and Methods
2.1. Watershed Description
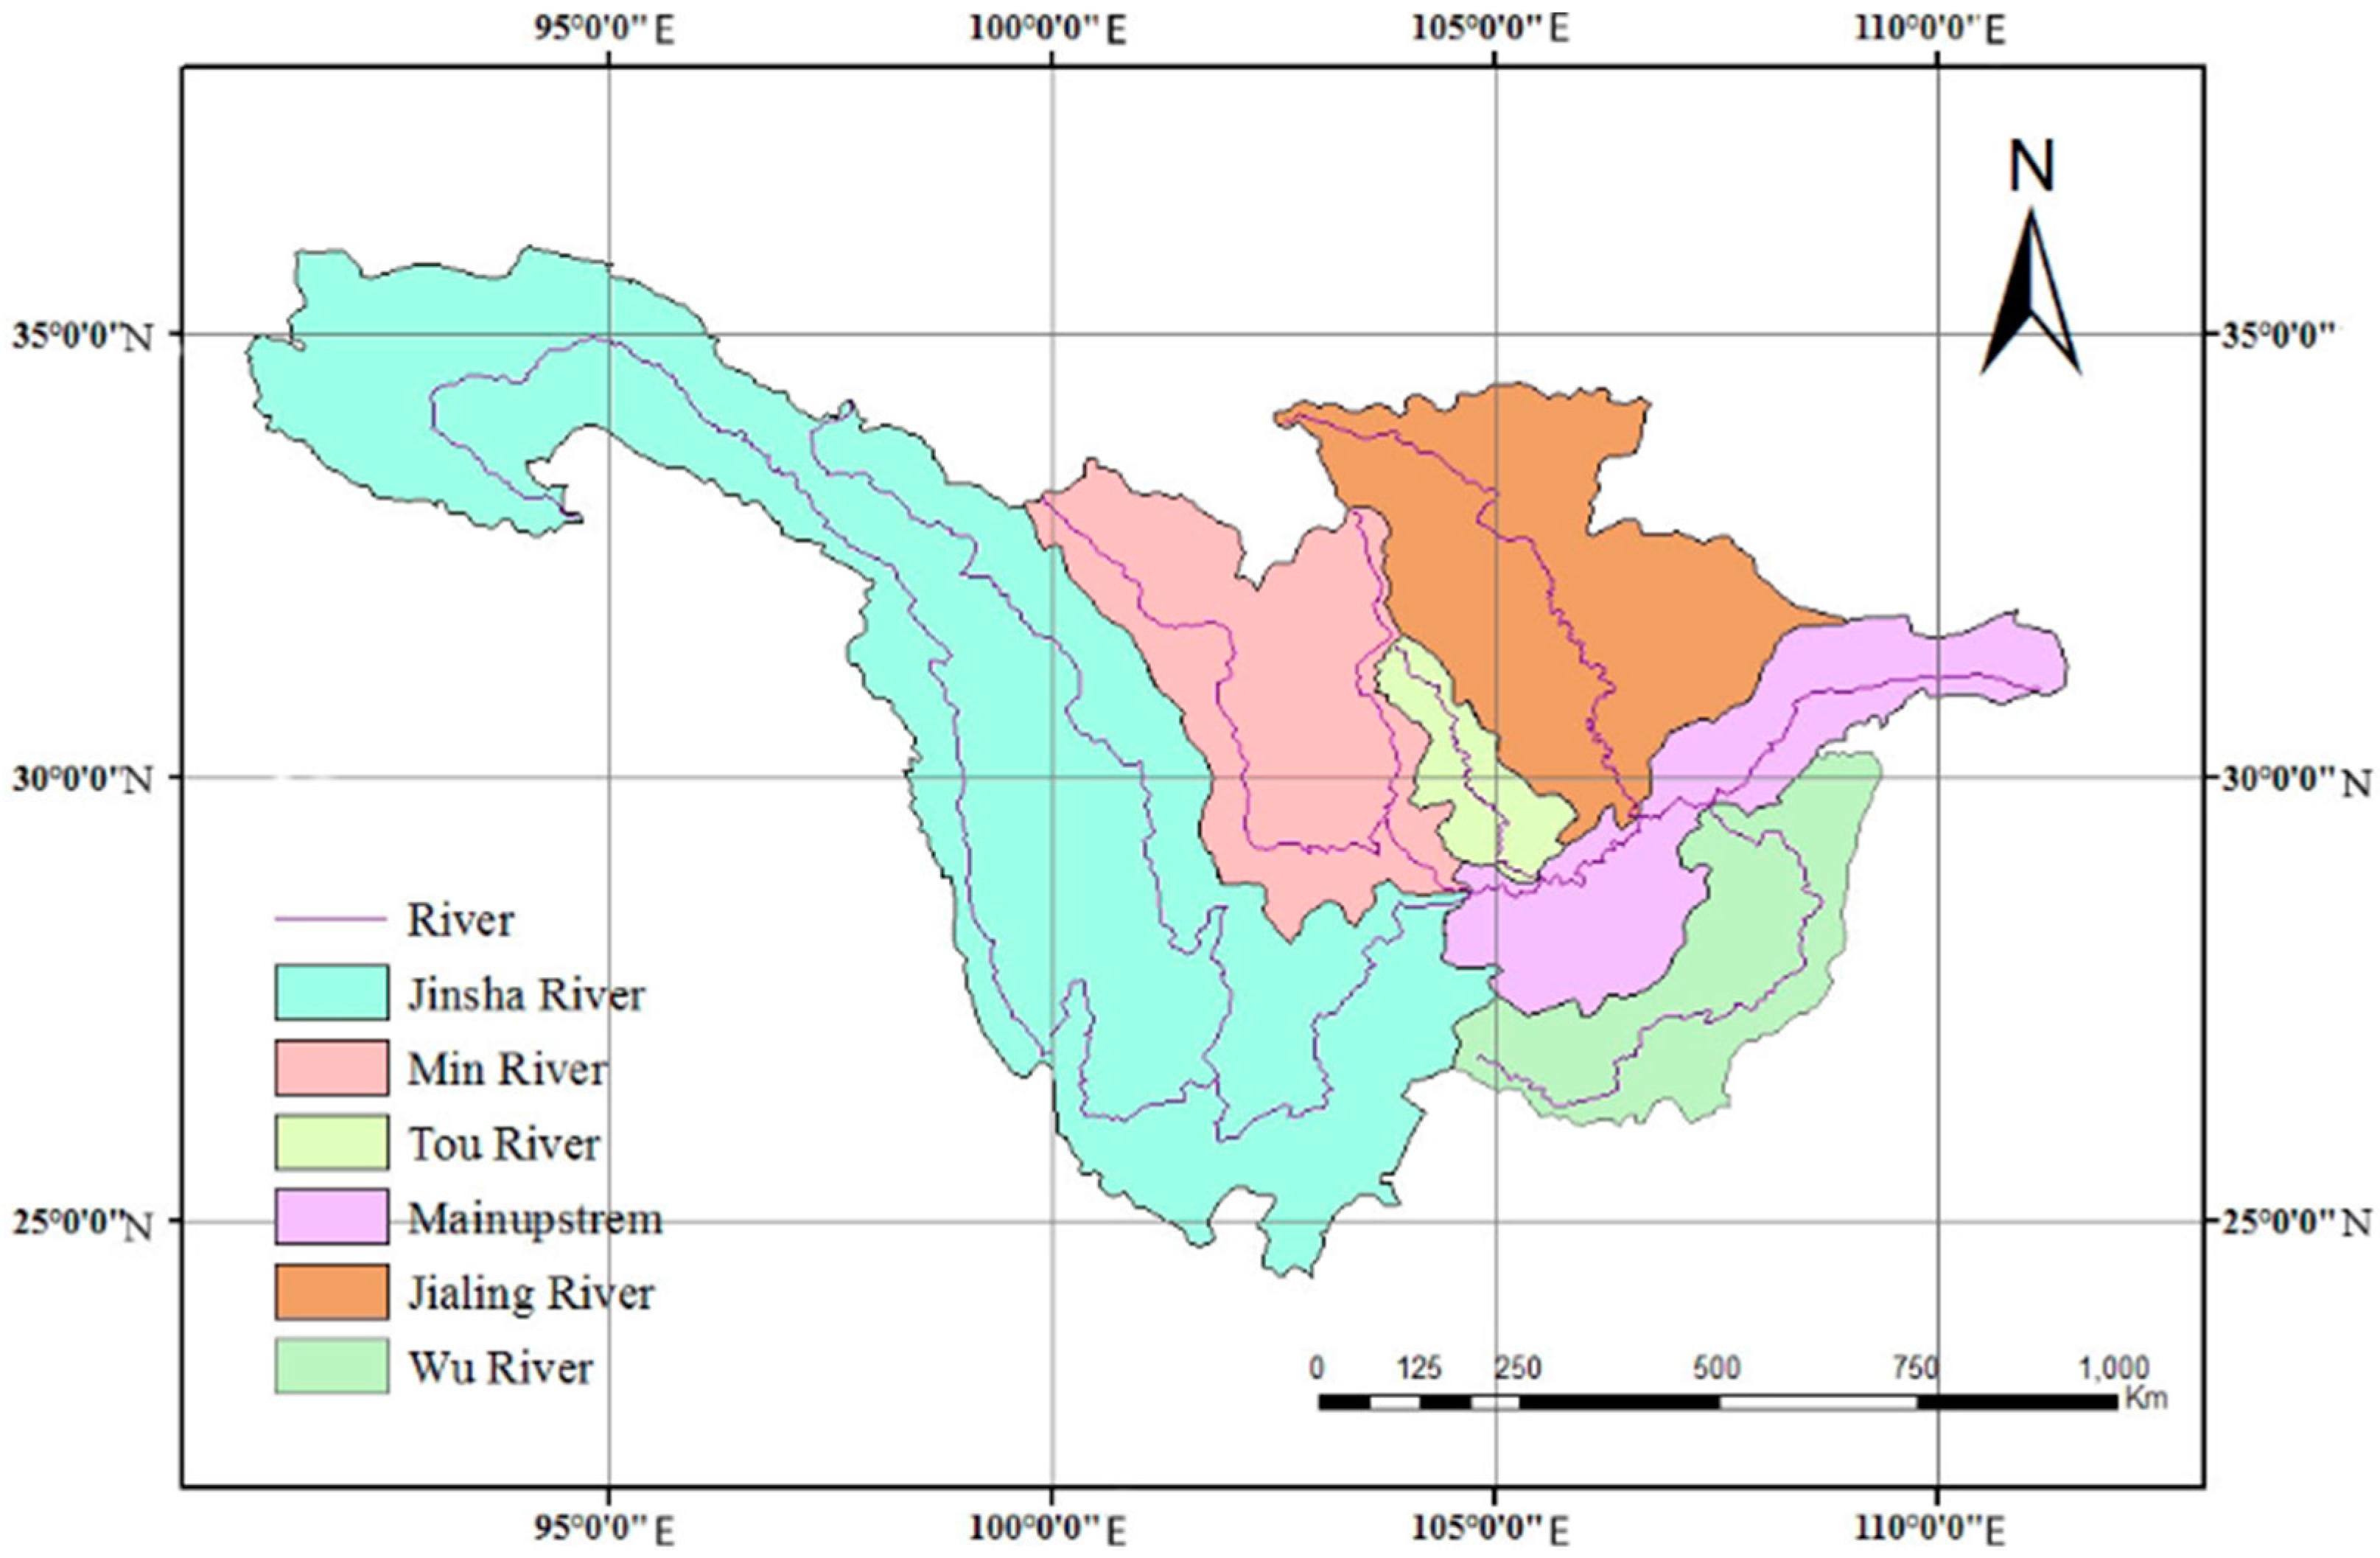
The upper reaches of the Yangtze river basin is located in the southwest of China. The latitude and longitude ranges are 90°~112° E, and 24°~36° N [24]. The watershed is exported to Yichang city, Hubei province, and the drainage area is about 1 million square km. The URYR is high in the west and low in the east, with a river length of 4511 km, a gap of 5300 m, a volume of water resource of 447 billion m3, and a per capital water resource of 2926 m3, which is higher than 20% of the national average [25]. The major river systems in the basin include the Jinshajiang river, Tuojiang river, Minjiang river, Jialingjiang river and Wujiang river (Figure 1). The topography and geomorphology are complex and varied, including the Qinghai-Xizang plateau, Hengshan mountains, Yungui plateau, Sichuan basin and so on [26]. The average annual rainfall in the basin is 800.7 mm [27], and the precipitation is mainly concentrated in summer, accounting for 60% of the total precipitation in the whole year [28], with minimal precipitation in winter (from December to February). The areas with the most abundant precipitation are located on the eastern and western edges of the Sichuan basin, and the annual precipitation exceeds 1000 mm. The spatial and temporal distribution of rainfall is very uneven. The undulating terrain and relatively concentrated rainfall are powerful drivers for slope erosion, and create conditions for the massive loss of sediment and nutrients in basin [29]. In addition, the long-term improper land use and the construction of the Three Gorges Project have also had a significant impact on NPS pollution in the upper reaches of the Yangtze [30].
2.2. Data Collection and Preparation
All data related to this study include the following: (i) a digital elevation model (DEM) established by the Institute of Geographical Sciences and Natural Resources Research, Chinese Academy of Sciences (IGSNRR, CAS) that was the basis for basin division, water system generation and hydrological process simulation; (ii) a topographic map with a scale of 1:1,000,000 was provided by the National Geomatics Center of China; (iii) land-use maps (1960–2003) with a scale of 1:100,000 that were derived from digitalizing and interpreting remote sensing images provided by IGSNRR, CAS; (iv) all meteorological data relating to the study were taken from 173 sites in the study area and the China Meteorological Administration, including annual precipitation (1950–2003), which was then interpolated into each subdivided area by linear interpolation method and station position; (v) the hydrological data and water quality data (1960–2003) relating to the concentration of adsorbed and dissolved pollutants of watershed outlets were derived from relevant monitoring stations throughout the study area; (vi) the utilization rate of chemical fertilizers, livestock breeding amount, rural population, rural domestic sewage discharge amount, municipal administrative divisions and other social and economic data (1960~2003) were obtained from statistical departments at all levels in the study area; (vii) the soil erodibility data and background values of soil adsorbed pollutants were obtained from the China Soil Scientific Database; (viii) the layer of stream network built up using the geographic information system under the assumption that an upstream catchment greater than 1 km2 defined a channel; (ix) the layers of sediment delivery ratio and the enrichment ratios calculated according to literatures [31]; (x) the layer of export coefficients related to each spatial unit (grid cell, 1 × 1 km) determined through calibration using the genetic algorithm. All data related to this study are presented in Table 1.
Firstly, according to the impact factors of NPS pollution, this study divided pollution sources into rural life, livestock breeding, land use and atmospheric deposition. The URYR is a region with more people and less land, and the contradiction between people and land in the URYR is very prominent. About 70% of the cultivated land in the URYR is slope farming without soil and water conservation measures, especially in the steep slopes larger than 25° [14]. As shown in Table 2, land use types in the URYR are diverse, primarily including dry land, paddy fields, fruit trees, urban land, forest, grassland, water area and unused land. This paper divided land use into natural land and unnatural land. Natural land included forest, grassland and unused land. Non-natural land included dry land, paddy fields, fruit trees and urban land. According to the research content, the pollution sources [1] were divided into artificial and natural pollution sources, among which the artificial pollution sources included rural life, livestock breeding, dry land, paddy fields, fruit trees and urban land use; the natural pollution sources included forest, grassland and unused land. Atmospheric deposition is caused by both natural and artificial sources of pollution. Secondly, previous researchers have established methods for calculating precipitation factors, topographic factors, rainfall and runoff factors in URYR basin. Finally, the method of determining the export coefficient of rural life and livestock breeding was mainly achieved through consulting literature [32], and the export coefficient of land use was calculated using the model of export coefficient based on hydrology and water quality data. The export coefficient of each source in the study area is listed in Table 3. The annual average rainfall and sediment transport ratio in the URYR is shown in Table 4 and Table 5. In addition, due to the lack of data on the concentration of nutrients in the discrete precipitation in the study area, the atmospheric deposition was derived from the NPS dissolved nitrogen and dissolved phosphorus (DN and DP) loads by using the relevant conclusions of other literatures. In this study, the export coefficients of the influencing factors of the study area were affected by the uneven precipitation of the URYR and the complex topographic terrain. Therefore, the accuracy of the NPS pollution simulation results in the study area can be improved by using the IECM that introduced precipitation impact factors and terrain influence factors.
2.3. Methods
2.3.1. The Improved Export Coefficient Model
Data was divided according into dissolved and adsorbed pollutants. The NPS pollution load in the URYR was simulated using data from nearly half a century; therefore, the choice of model directly determined the feasibility and accuracy of the study. Among many NPS pollution models, the export coefficient model (ECM) requires few parameters and is suitable for NPS pollution load estimation in large scale watersheds. For the load simulation of dissolved pollutants, DN and DP were used as typical dissolved NPS pollutants [33], and the IECM method was used to calculate them. The improved export coefficient model is based on ECM, which is supported by the theory that the dissolved nutrient load from the outlet of the basin is equal to the sum of losses from a single source [31]. Due to the lack of representation of the effects of rainfall and topography on the existing ECM, the model is less sensitive and accurate in predicting the spatiotemporal evolution of NPS pollution in the study area. The ECM can be expressed as
The ECM is suitable for study areas with uniform rainfall and flat terrain. However, the URYR has uneven rainfall and complex topography. If the impact of rainfall and topography on non-point source pollution are taken into account in the model, the IECM that accords with the characteristics of the studied area can be obtained [34], and a more objective simulation of NPS pollution can be realized. The IECM can be expressed as
where L is loss of nutrients (kg); α is precipitation impact factor; β is terrain impact factor; Ei is the export coefficient for the nutrient source i (kg/ca·yr or kg/km2·yr); Ai is area of the watershed occupied by land use type i (km2), or number of livestock type i, or that of rural people; Ii is the input of nutrients to source i (kg); and p is the input of nutrients from atmospheric deposition (kg). Moreover, the calculation methods of precipitation impact factor α and terrain impact factor β have been presented in previous articles [2].
Next, this study determined the value of αt through regression analysis and related formulas. Rainfall impact factor α can be calculated by the following formula:
where αt is the annual difference impact factor of rainfall, αs is the rainfall spatial distribution impact factor, r is the annual average rainfall in the watershed, Rj is the annual rainfall of spatial unit j in the watershed and is the average annual rainfall in the watershed.
Finally, the terrain impact factor can be calculated by the following formula:
where θj is the slope of the spatial unit j in the basin, is the average slope of the study area (13.67°) and d is a constant (0.6104).
2.3.2. The Nutrient Losses Empirical Mode
For the load simulation of adsorbed pollutants adsorbed nitrogen and adsorbed phosphorus (AN and AP) were used as typical adsorbed NPS pollutants, and the NLEM simulation was used to estimate them. Unlike dissolved pollutants, adsorbed pollutants cannot be measured only by water quality monitoring. In this model, the adsorbed nitrogen and phosphorus elements are transported by a soil erosion process, and their loads are affected by soil particle loss and sediment load. Therefore, it is necessary to calculate the amount of soil erosion and sediment. The calculation of soil erosion is based on the USLE principle of the general soil erosion equation. Sediment load refers to the part of the soil particles that enters the river channel due to soil erosion on the slope. Thus, NLEM can be represented by the following formula [17]:
where LA is the sediment load or the loss of adsorbed pollutants (t/km2), Dr is sediment transport ratio, S is soil erosion that can be calculated by the soil erosion model (t/km2), Q is the background value of pollutants in soil loss (kg/kg) and η is the soil enrichment ratio of adsorbed pollutants [35].
The Universal Soil Loss Equation can be expressed as
where R is the rainfall erosivity factor, K is the soil erodibility factor, C is the crop cover and management factor, P is the soil and water conservation measure factor, Lb is the slope length factor and A is the slope-steepness factor.
Anthropogenic factors of NPS pollution include rural life, livestock breeding, land use and the atmospheric deposition raised from them, while ecological factors are related to grassland, forest, unused land and the atmospheric deposition raised from them. Therefore, based on the effects of ecological factors on NPS pollution, the effects of anthropogenic factors on NPS pollution and its variation law are further studied.
3. Results and Discussion
According to the IECM and NLEM, the reliable data were obtained, and the NPS pollution in the URYR was analyzed effectively. The influence factors of NPS pollution in the URYR were divided into anthropogenic factors and ecological factors. The ecological factors included forest, grassland, unused land and the atmospheric deposition produced by them. Anthropogenic factors included rural life, livestock breeding, land use and the atmospheric deposition caused by anthropogenic factors (ADAF). Using these classifications, the long-term effects of anthropogenic factors on NPS pollution in the URYR from 1960 to 2003 were studied in this paper, and the corresponding management measures have also been proposed.
3.1. Temporal Variation of Anthropogenic Effects on NPS Pollutant Loads
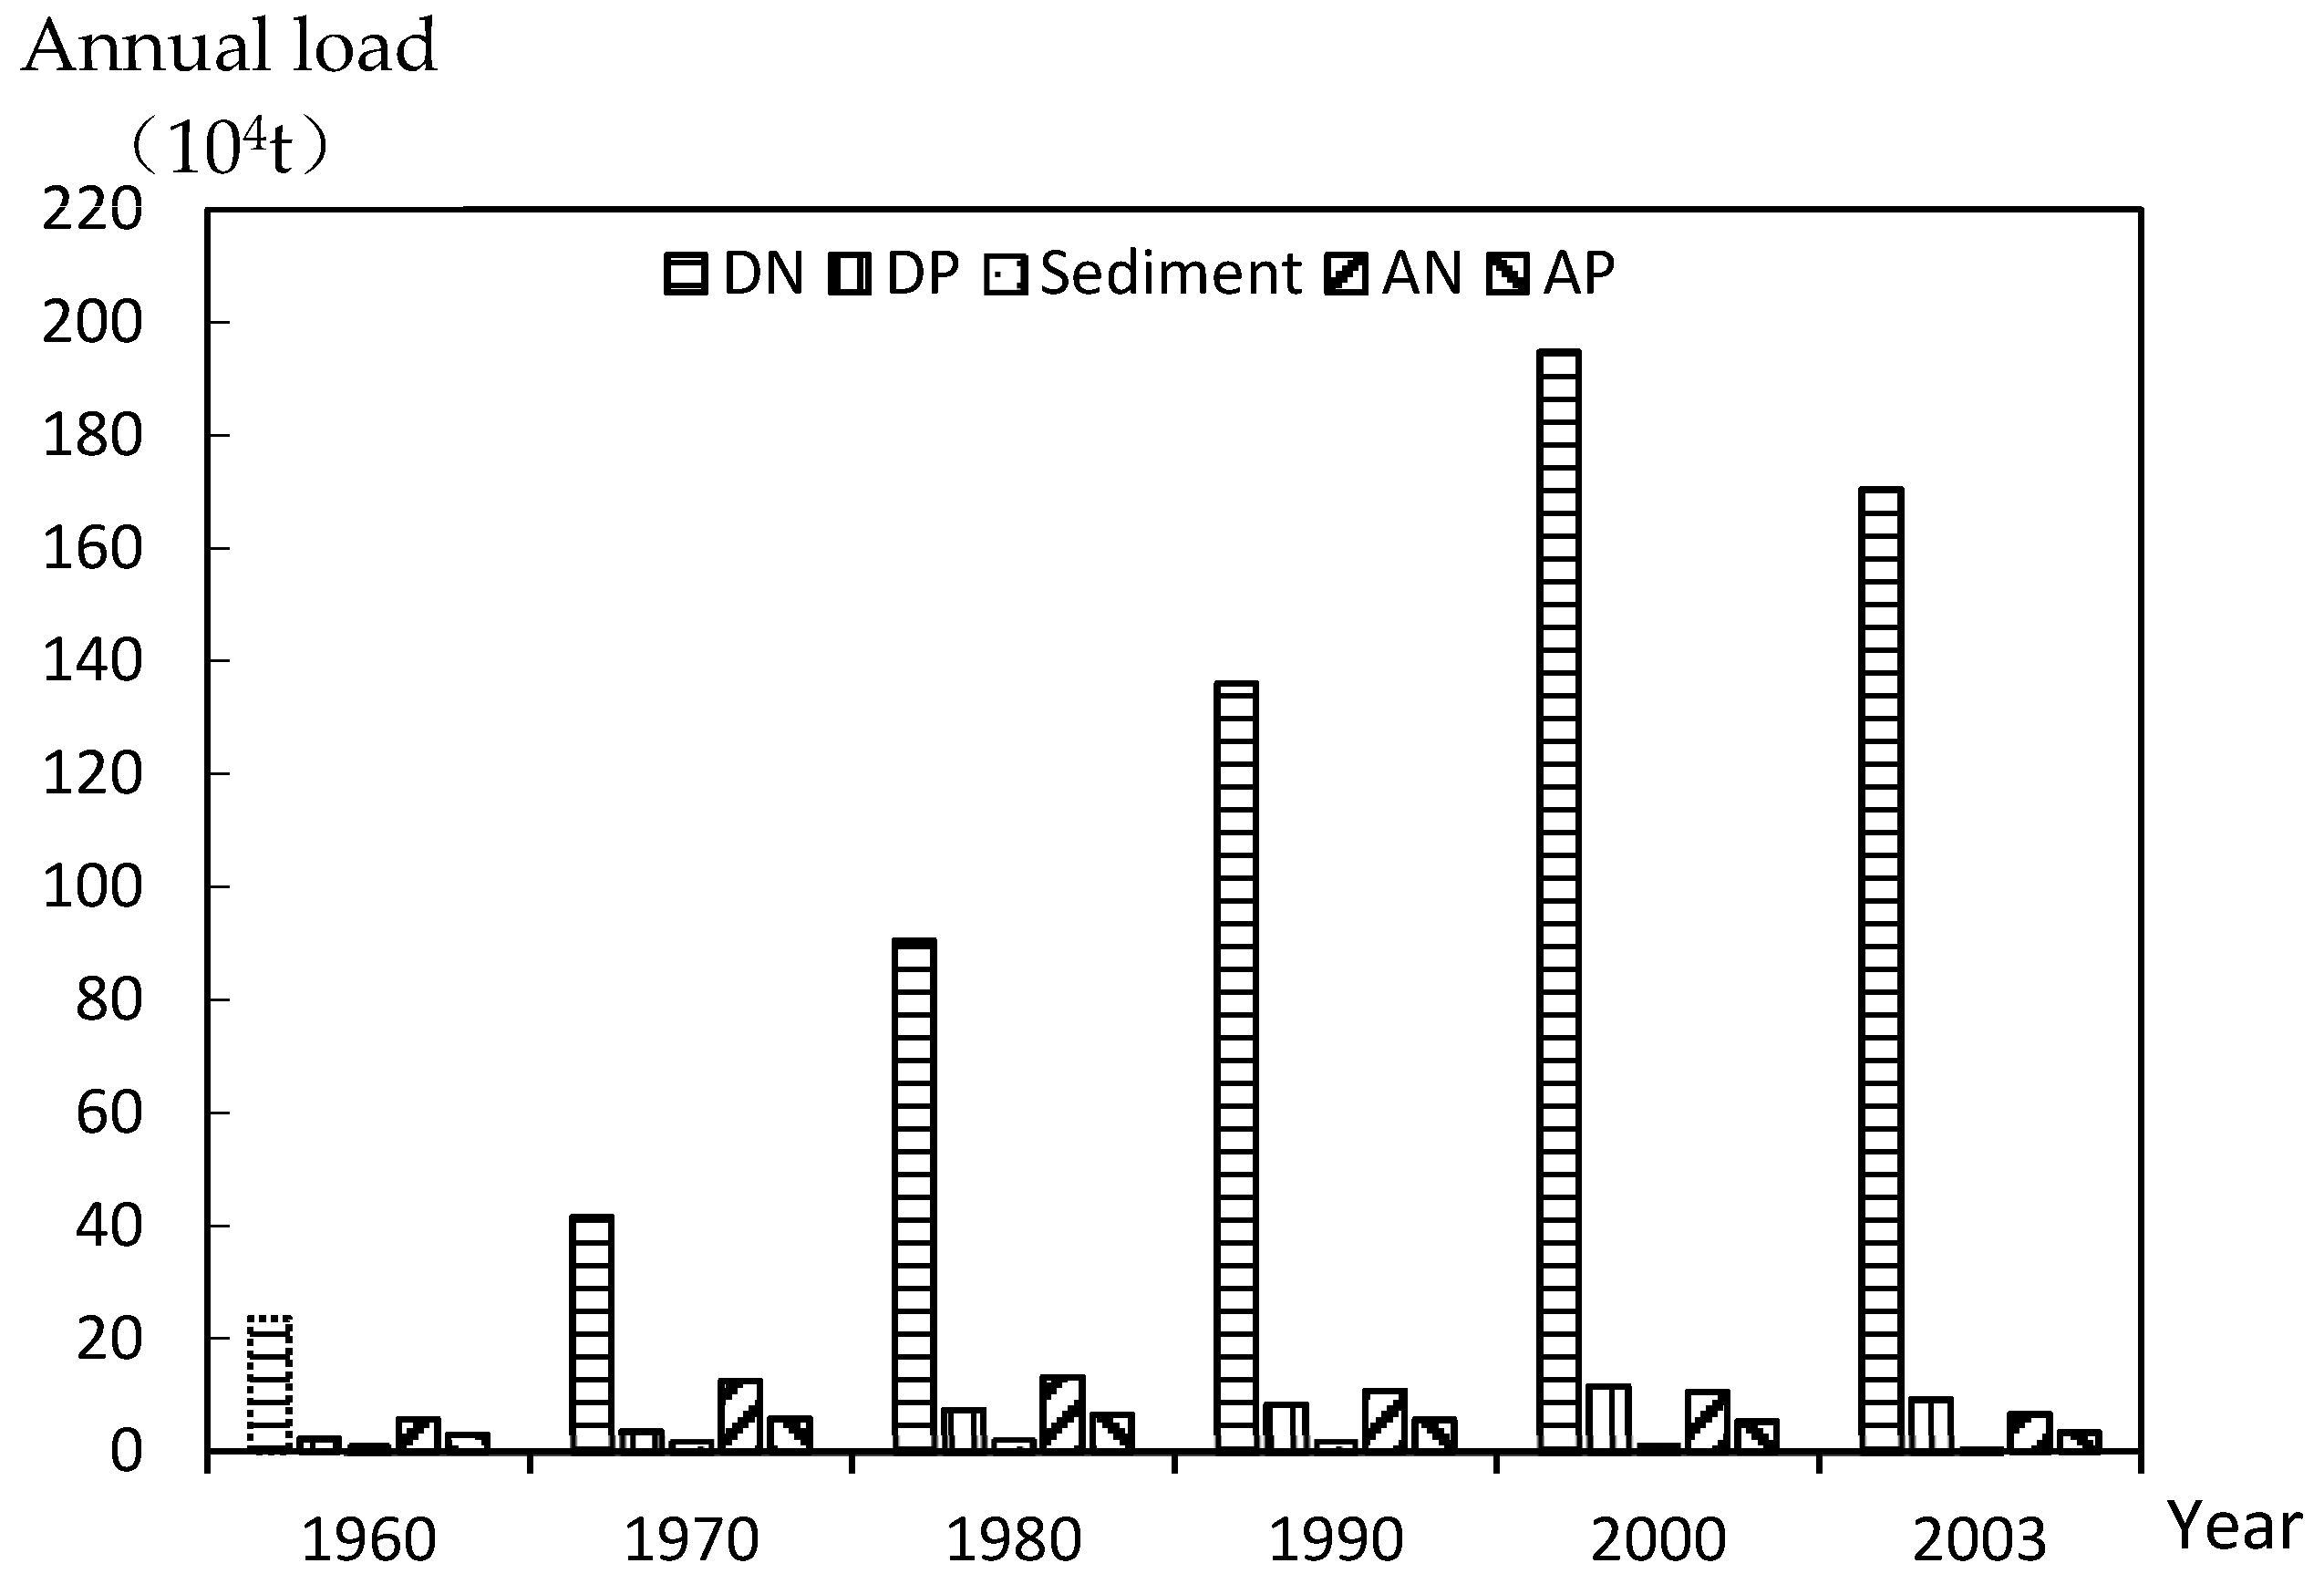
The temporal variation on annual NPS pollution loads caused by anthropogenic factors in the URYR during 1960–2003 is shown in Figure 2. In terms of dissolved N and dissolved P, the anthropogenic contributions were significantly increased from 2352 and 2.26 × 10⁴ t in 1960, to 194.77 × 10⁴ t and 11.5 × 10⁴ t in 2000, then decreased slightly to 170.46 × 10⁴ t and 9.19 × 10⁴ t in 2003, respectively. For sediment, AN and AP, the contributions of anthropogenic factors increased first, then decreased from 1960 to 2003. They first increased from 1.06 × 10⁸ t, 5.71 × 10⁴ t and 2.95 × 10⁴ t in 1960, to 2.13 × 10⁸ t, 13.15 × 10⁴ t and 6.53 × 10⁴ t in 1980, then declined to 0.64 × 10⁸ t, 6.62 × 10⁴ t and 3.37 × 10⁴ t in 2003, respectively.
The time variation of anthropogenic effects on NPS pollution could be explained by the following reasons. First of all, the rapid development of livestock breeding and the dramatic augment in the use of agrochemical fertilizers caused an increase in the loss of NPS pollutants in the study area between 1960 and 2000 [36], especially the increase of dissolved pollutant load. In addition, the population explosion, urbanization, large-scale deforestation and wasteland led to a reduction of ecological land [37], and the enlargement of agricultural and urban land also increased the loss of sediment and adsorbed pollutants [38]. Secondly, due to uneven rainfall in the URYR [27,28], the increase in rainfall from 1960 to 1980 exacerbated soil erosion, which resulted in the augment of sediment and adsorbed pollutants in the study area. Subsequently, the state implemented family planning policies, and the population growth rate slowed after 1990. In the period from 1990 to 2003, the country adopted the URYR as a key area for national environmental protection and ecological construction. At the same time, the Three Gorges Project and its supporting projects [39], the Changzhi Project and the Conversion of Cropland to Forests and Grassland Project, were carried out. Those moves enlarged ecologically productive land, reduced soil erosion and cut down the content of sediment and adsorbed pollutants. The change of economic model also saw a decline in DN and DP in 2003. Therefore, rational planning of land use and proper development of agriculture/animal husbandry will be beneficial to NPS pollution control. The findings of this study are complementary to those of Ding et al.
3.2. Contribution Rates of Anthropogenic Factors to Total NPS Pollutant Load
Anthropogenic and ecological factors have long-term effects on NPS pollution in the URYR, but it was worthwhile to analyze whether the contribution rate of anthropogenic factors to the total NPS pollution load was a dominant factor. Therefore, the contribution rates of anthropogenic factors to the total NPS pollution load from 1960 to 2003 are shown in the Figure 3.
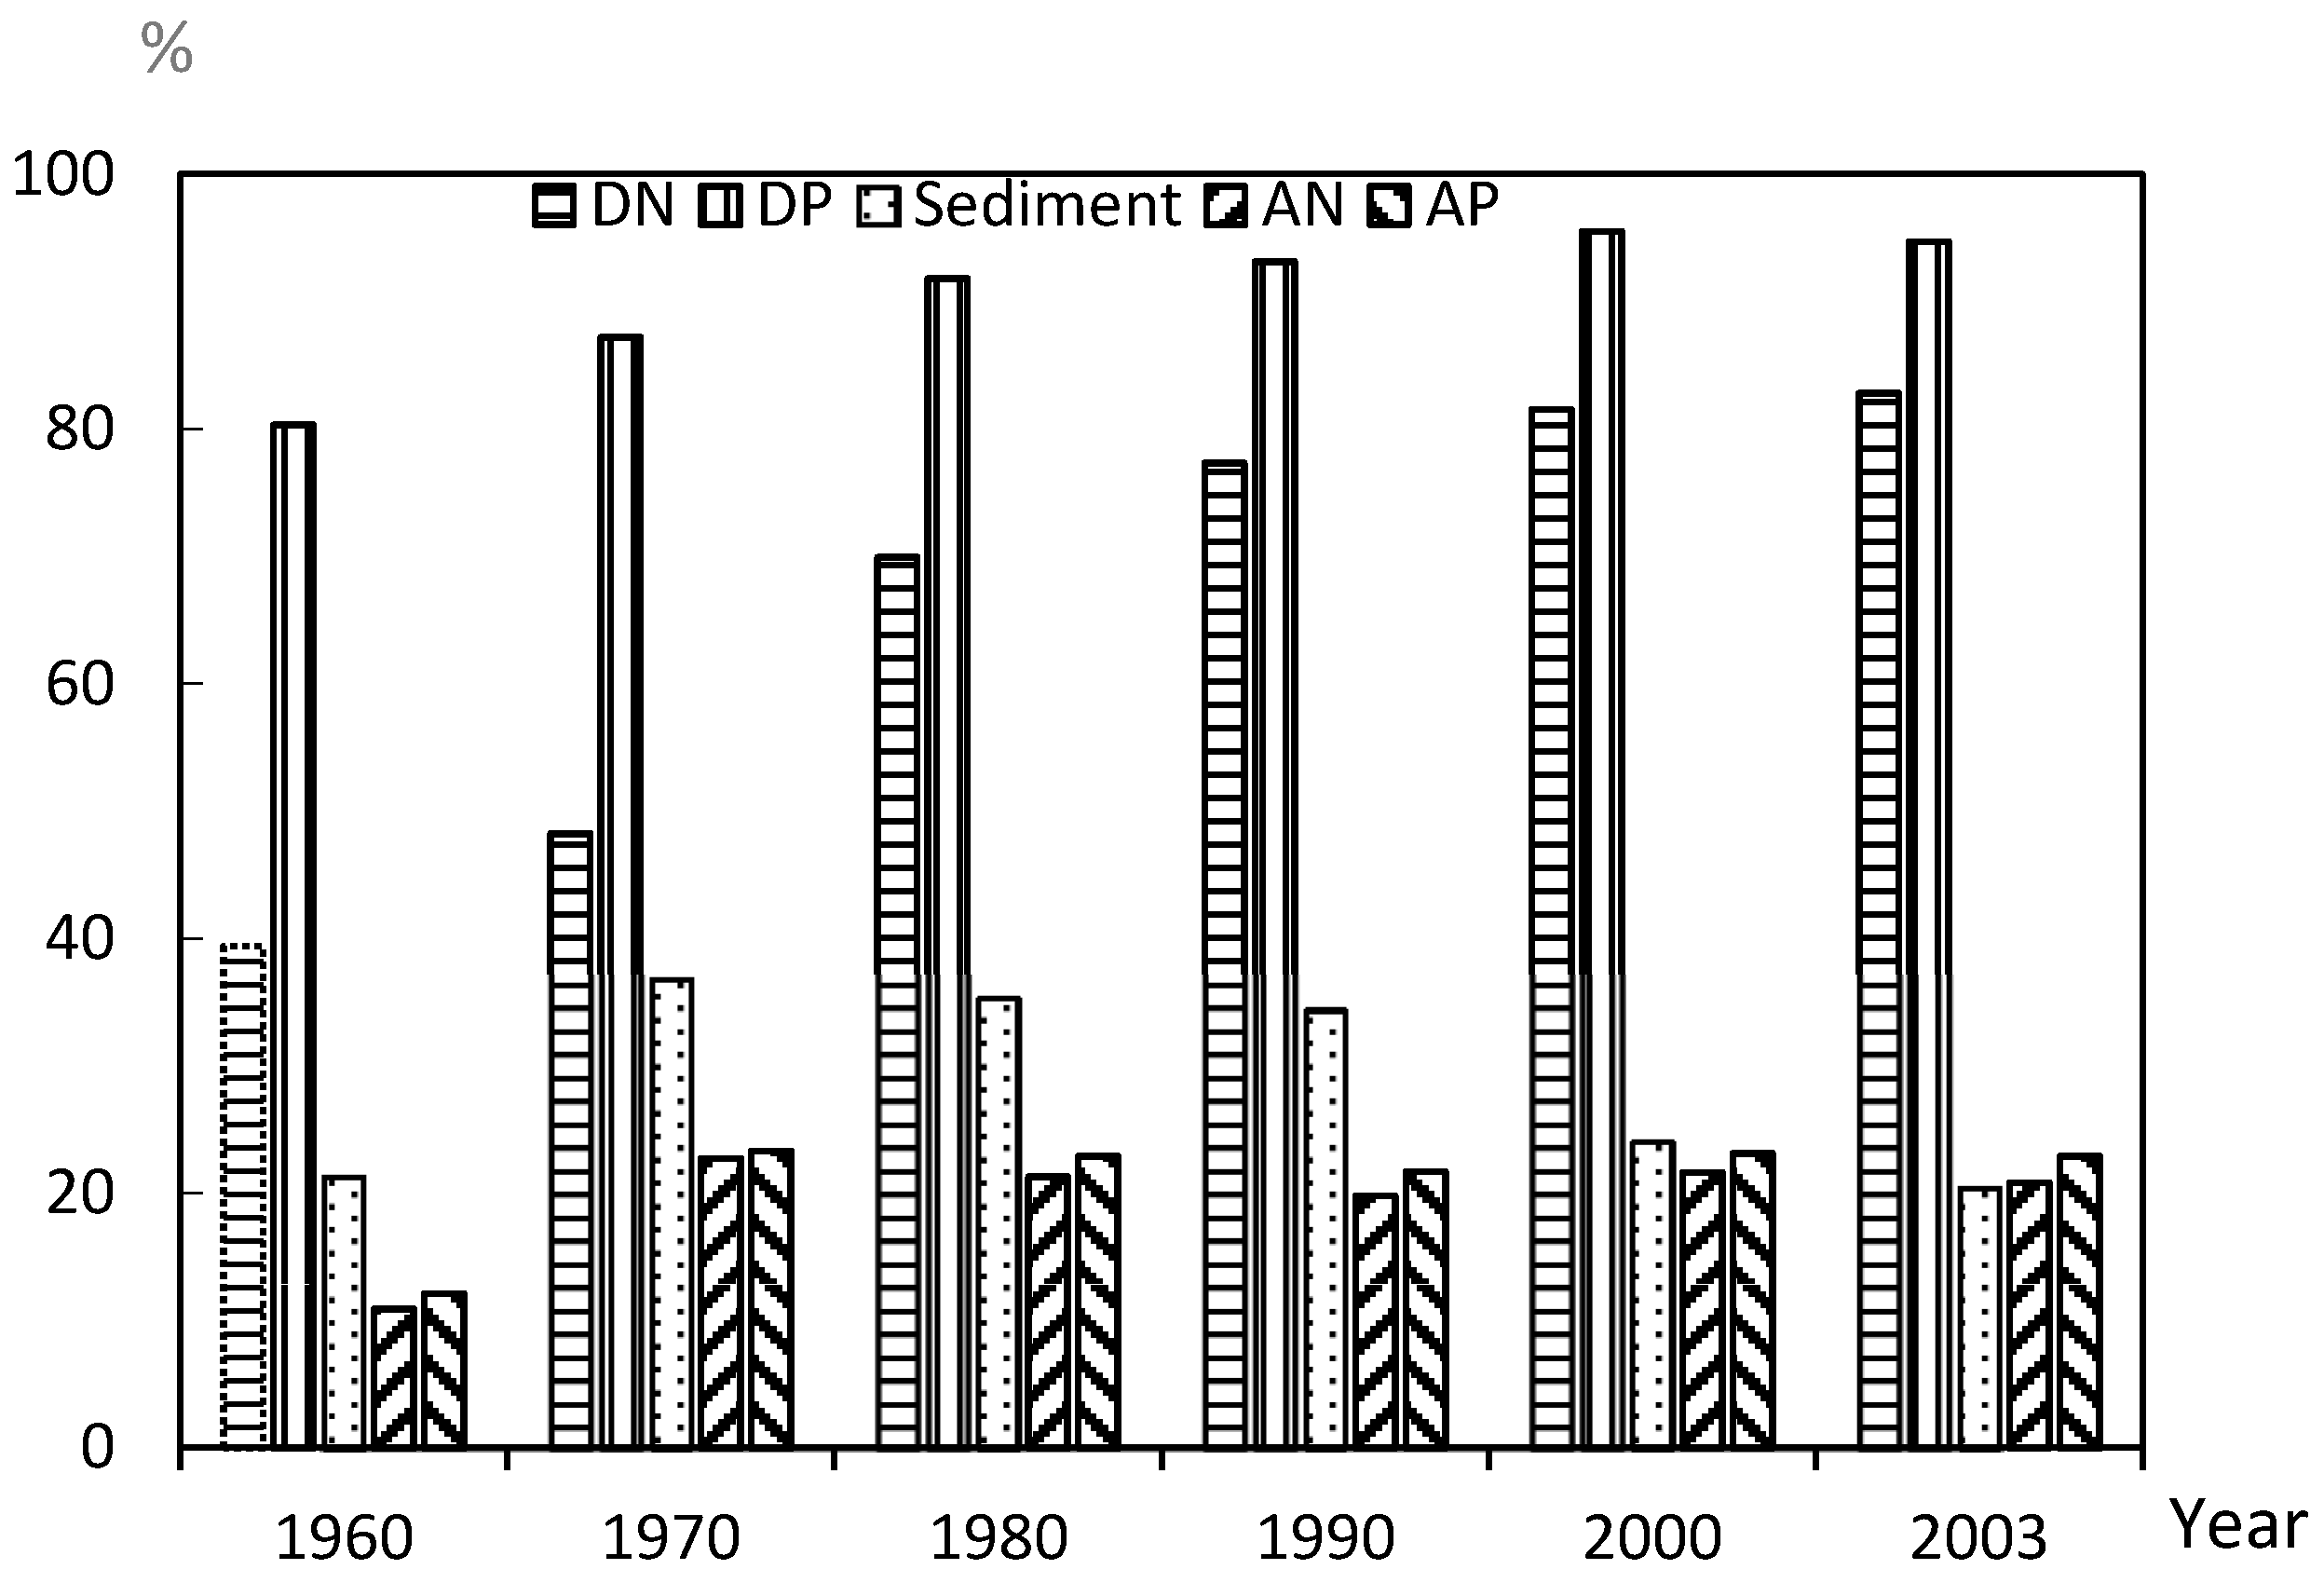
For the DN, it can be seen from the figure that the contribution rates of the DN load caused by anthropogenic factors to the total load were 39.4% and 48.2% in 1960 and 1970, respectively. However, the contribution rates of the DN load caused by anthropogenic factors to the total load increased year by year from 1980 to 2003. During the following decades, the contribution rate of anthropogenic factors was in the range of 69.9–82.8%. Therefore, for the source of DN, ecological factors were the main impact factors from 1960 to 1970, while anthropogenic factors dominated the period from 1980 to 2003. Changes in the dominant sources of dissolved pollutants were caused by a sharp increase in population in the URYR, accelerated urbanization and a large number of agricultural activities [36,38]. At the same time, the contribution rate of the DP load to the total pollutant load was always dominated by anthropogenic factors, and the contribution rates were 80.3% to 94.7% from 1980 to 2003.
The sediment and adsorbed pollutants generated by anthropogenic factors accounted for a lower proportion of the total pollution load during the simulation year. The figure shows that the annual loads of sediment, AN and AP contributed to the total pollution load in the range of 20.4–36.8%, 10.9–22.7% and 12.1–23.3%, respectively. The data showed that ecological factors had always been the main source of sediment and adsorbed pollutants, while anthropogenic factors did not dominate. Despite the population growth and greater constructions happening in the river basin [37,40], ecological land still contributed higher than anthropogenic factors to sediment load into the catchment. This study further indicates that human activities such as agriculture have produced lots of sediment and adsorbed pollutants. Consequently, the correct allocation of ecological land and artificial land can effectively control the content of pollutants.
3.3. Temporal Variation of Anthropogenic Effects on Load Intensities
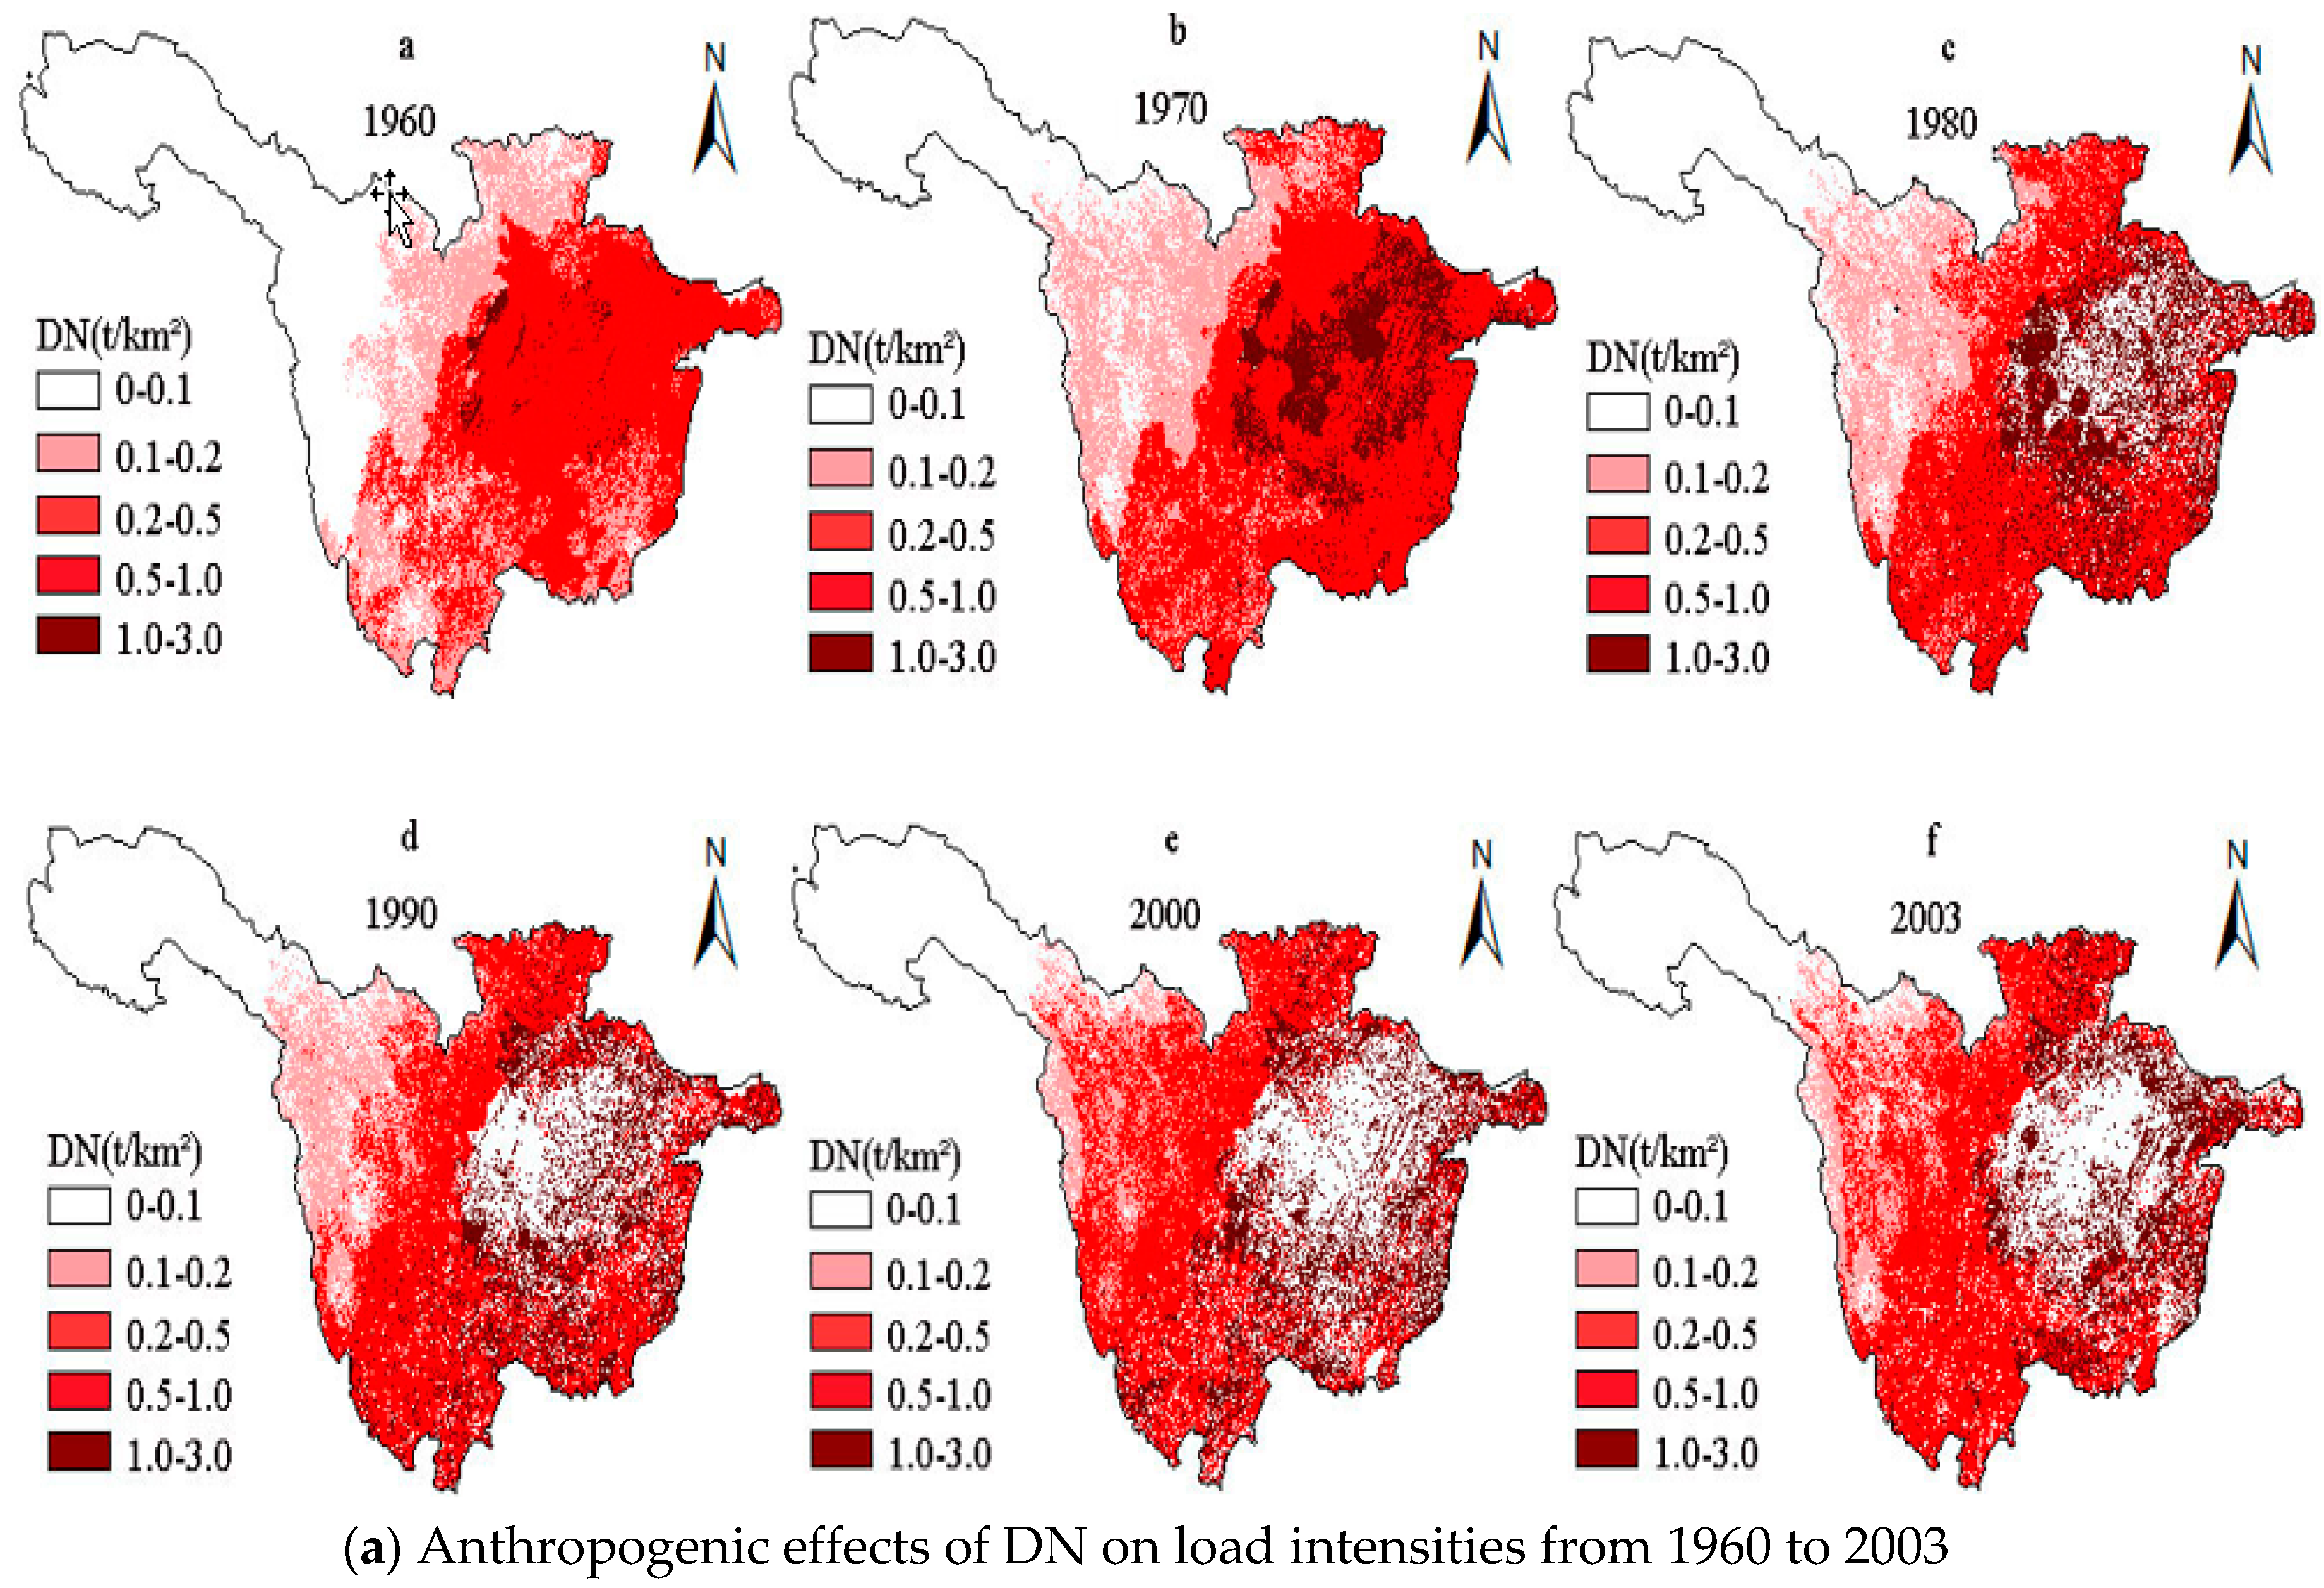
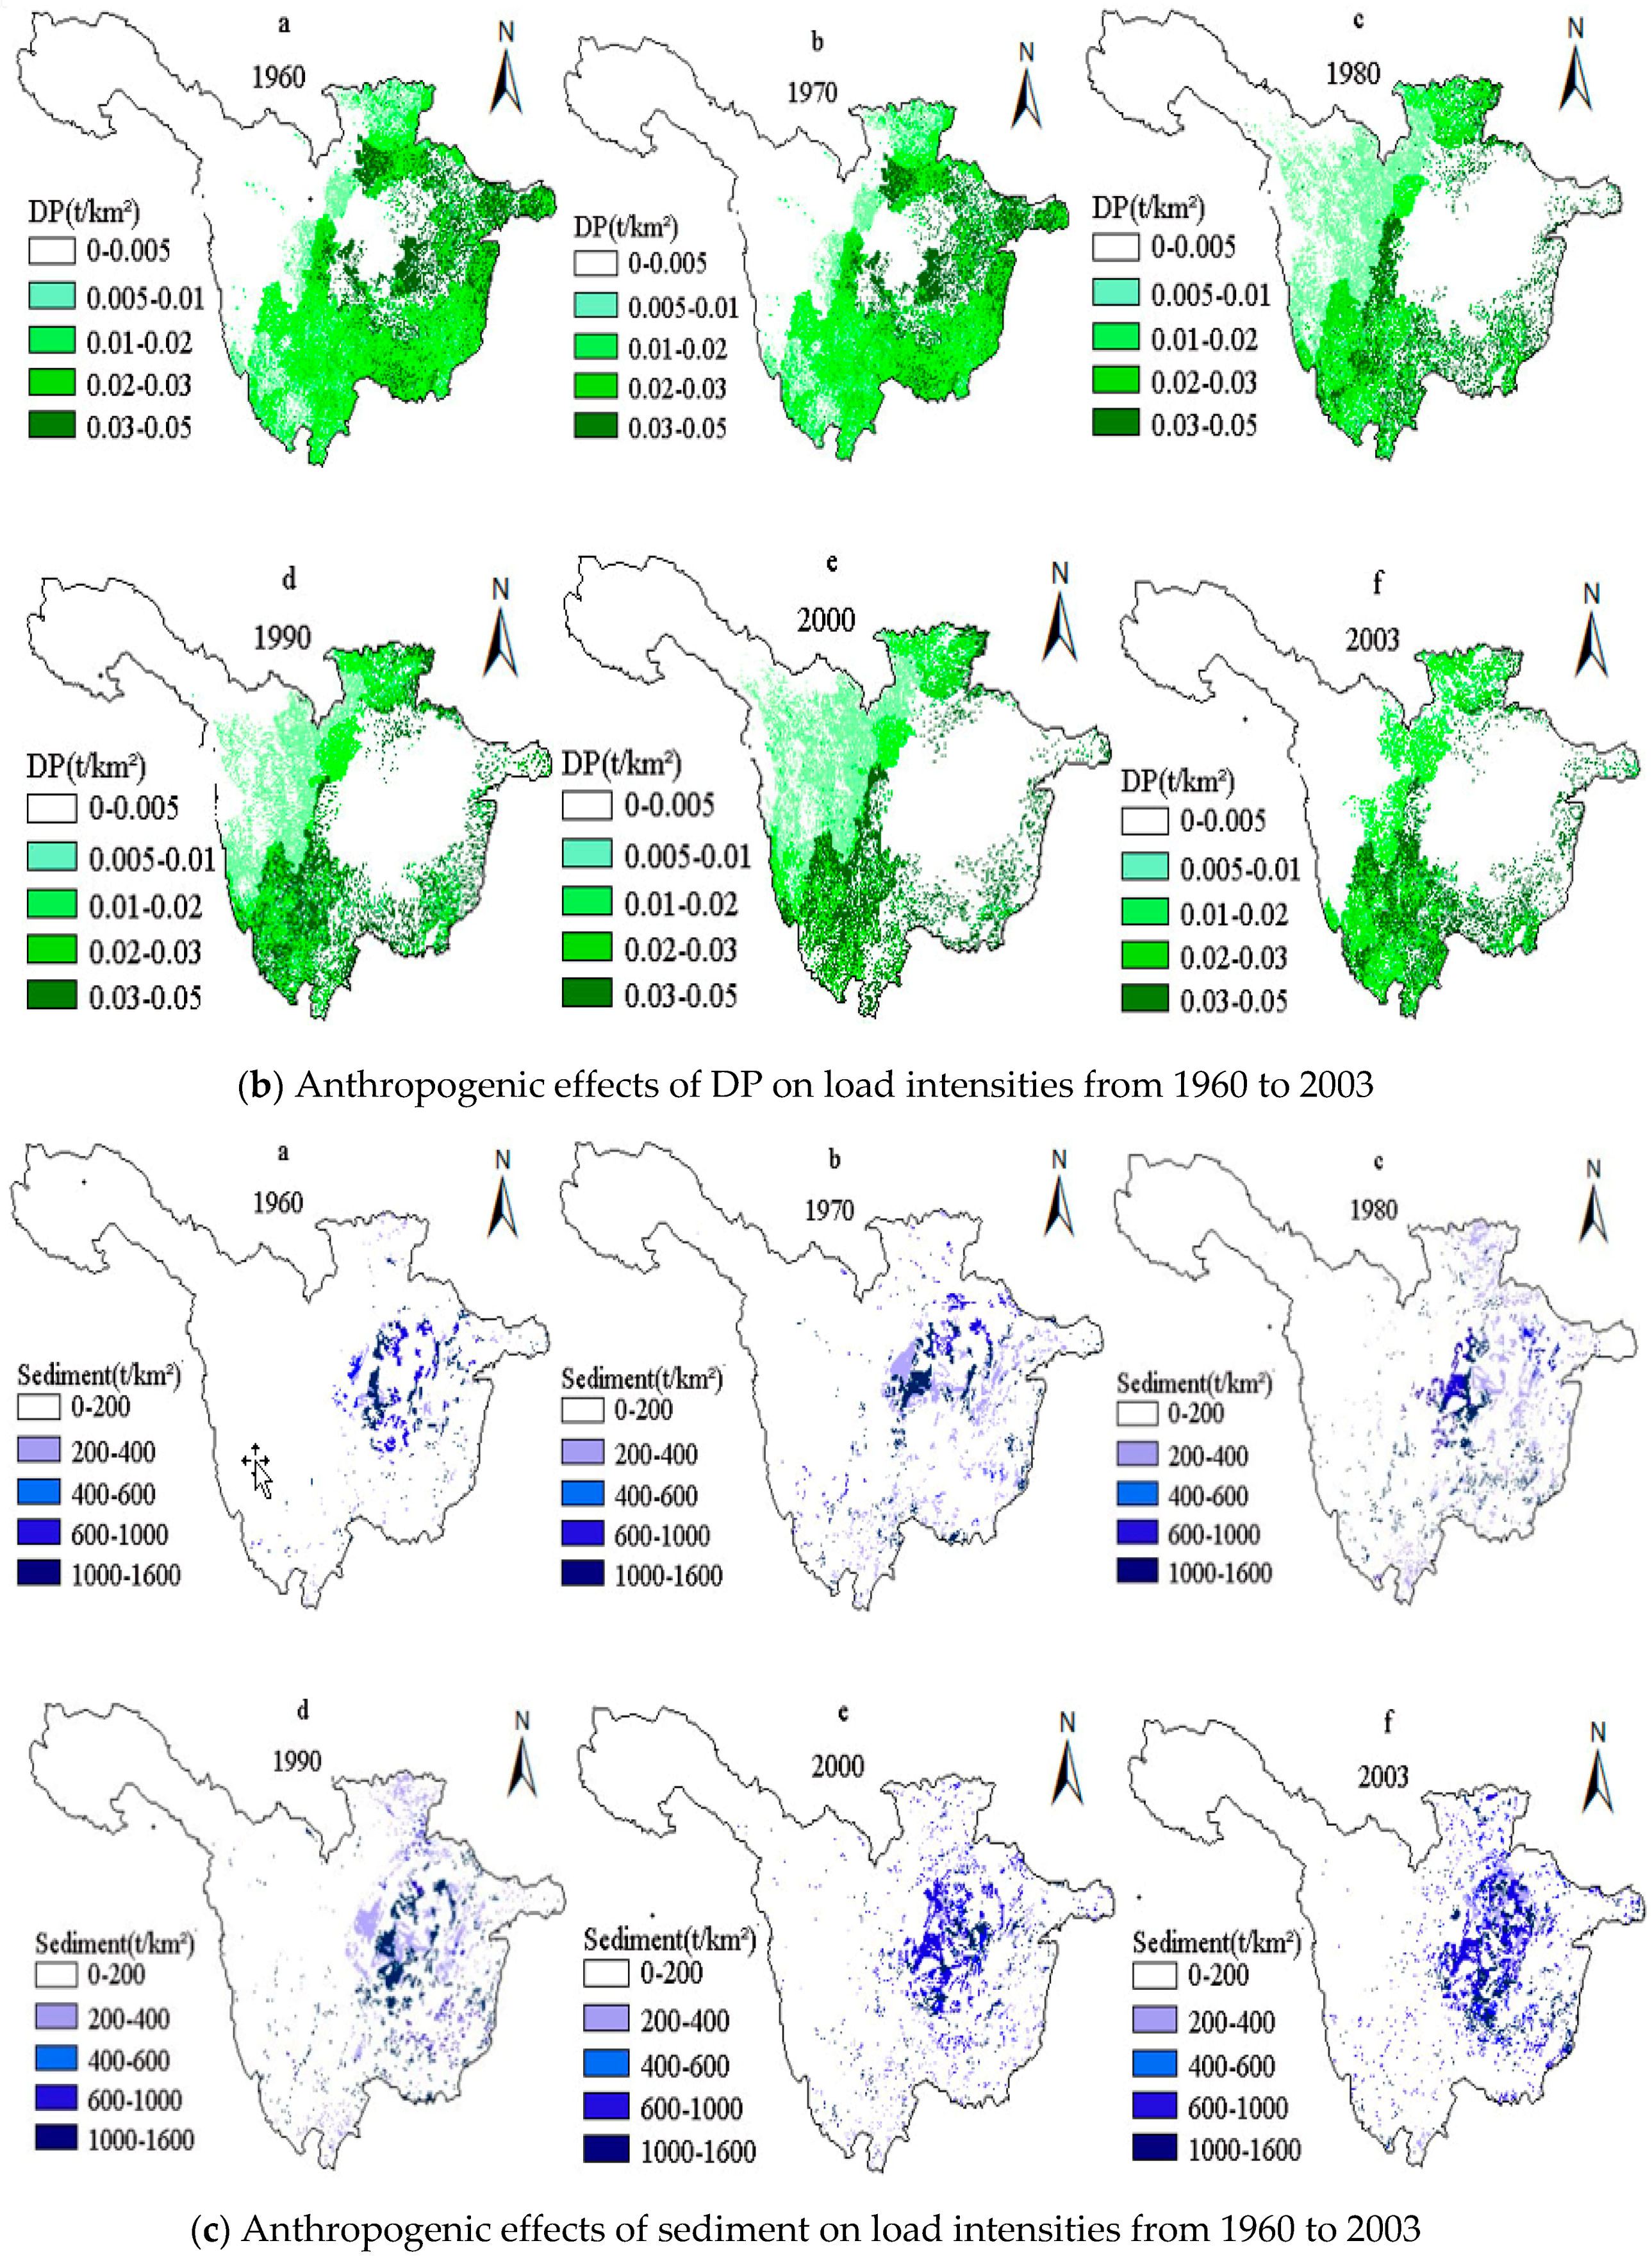
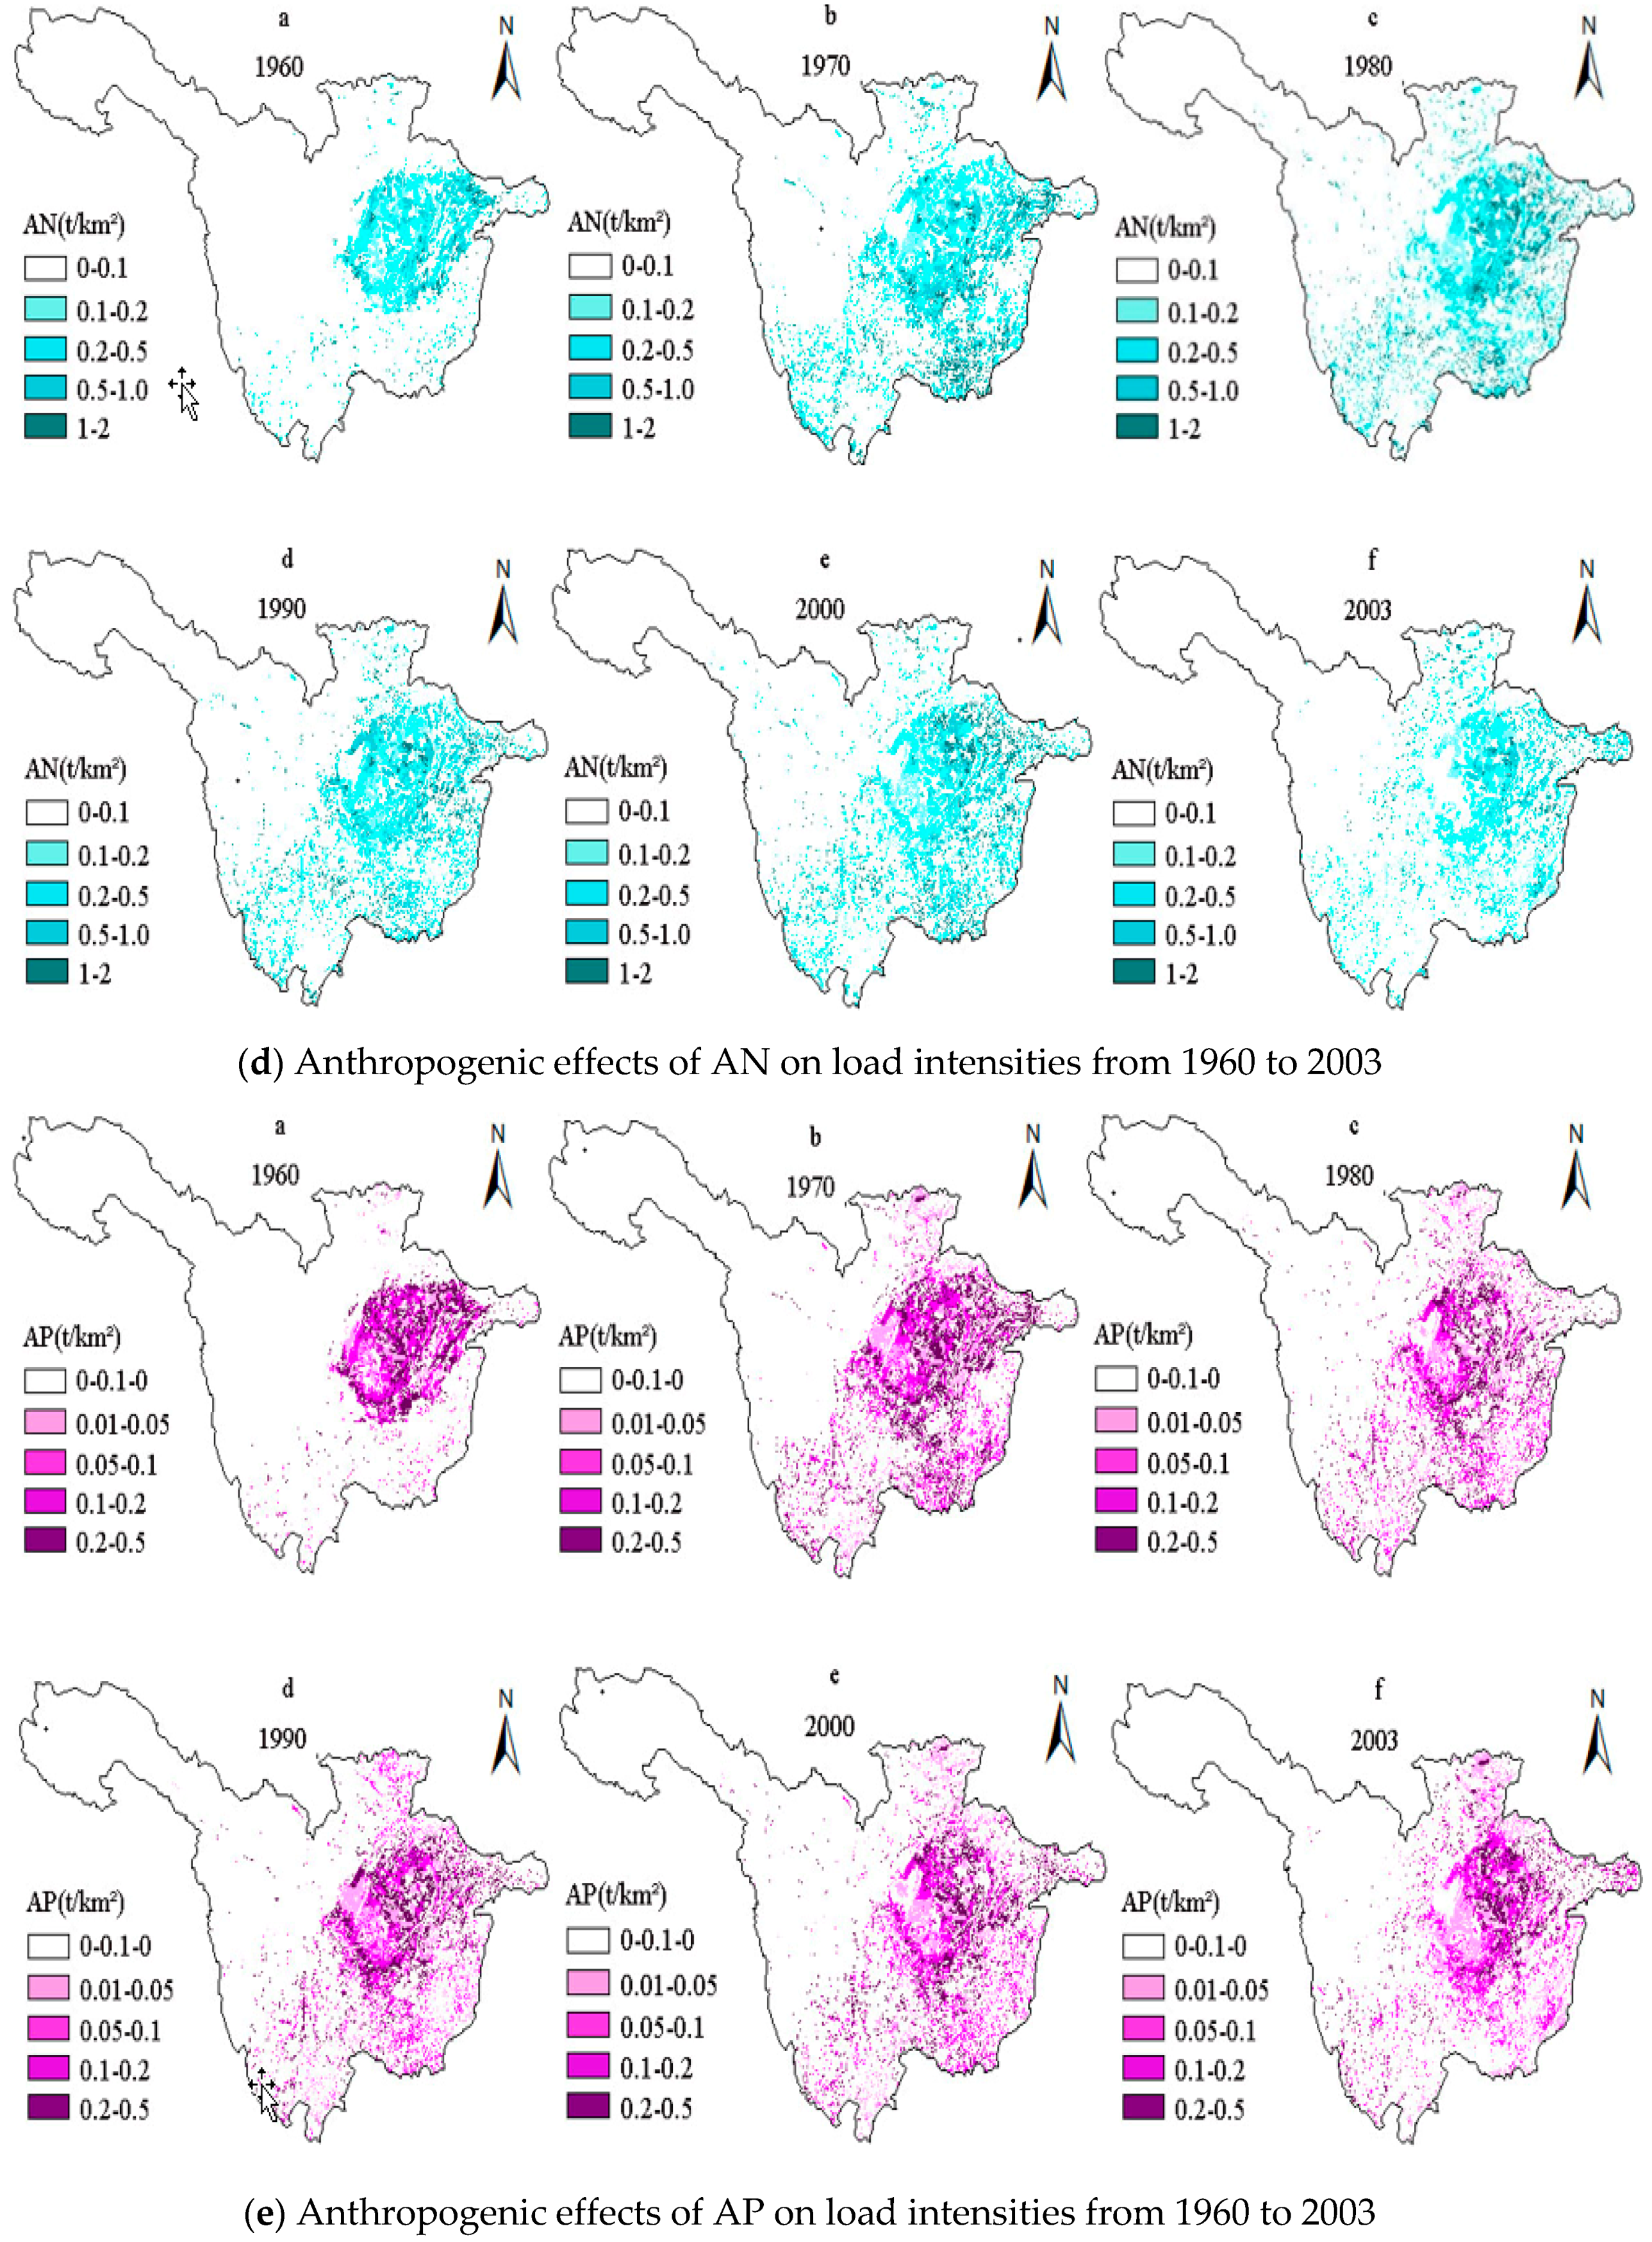
The pollutant load can reflect the time-varying effects of anthropogenic factors on NPS pollution in the URYR, while the load intensity represents the pollution load per unit area. Therefore, the simulation of NPS pollution load intensities in the URYR during the period of 1960–2003 could eliminate the impact of NPS pollution loss caused by the land area. The effects of anthropogenic factors on NPS pollution in the URYR were also more clearly reflected. In addition, the temporal changes of the effects of anthropogenic factors on load intensities in the URYR from 1960 to 2003 were simulated and analyzed by GIS. As shown in Figure 4, the spatial distribution of DN load intensity changed significantly from 1960 to 1980, and it did not change much from 1990 to 2003. For DP, spatial variation of load intensity was similar to DN. The spatial distribution of load intensities of other pollutants increased first and then decreased during the period of 1960–2003. These changes were consistent with the interpretation in Figure 5. Non-point source pollution has temporal dynamics and spatial variability, and it is very important to draw a spatial distribution map of pollution load.
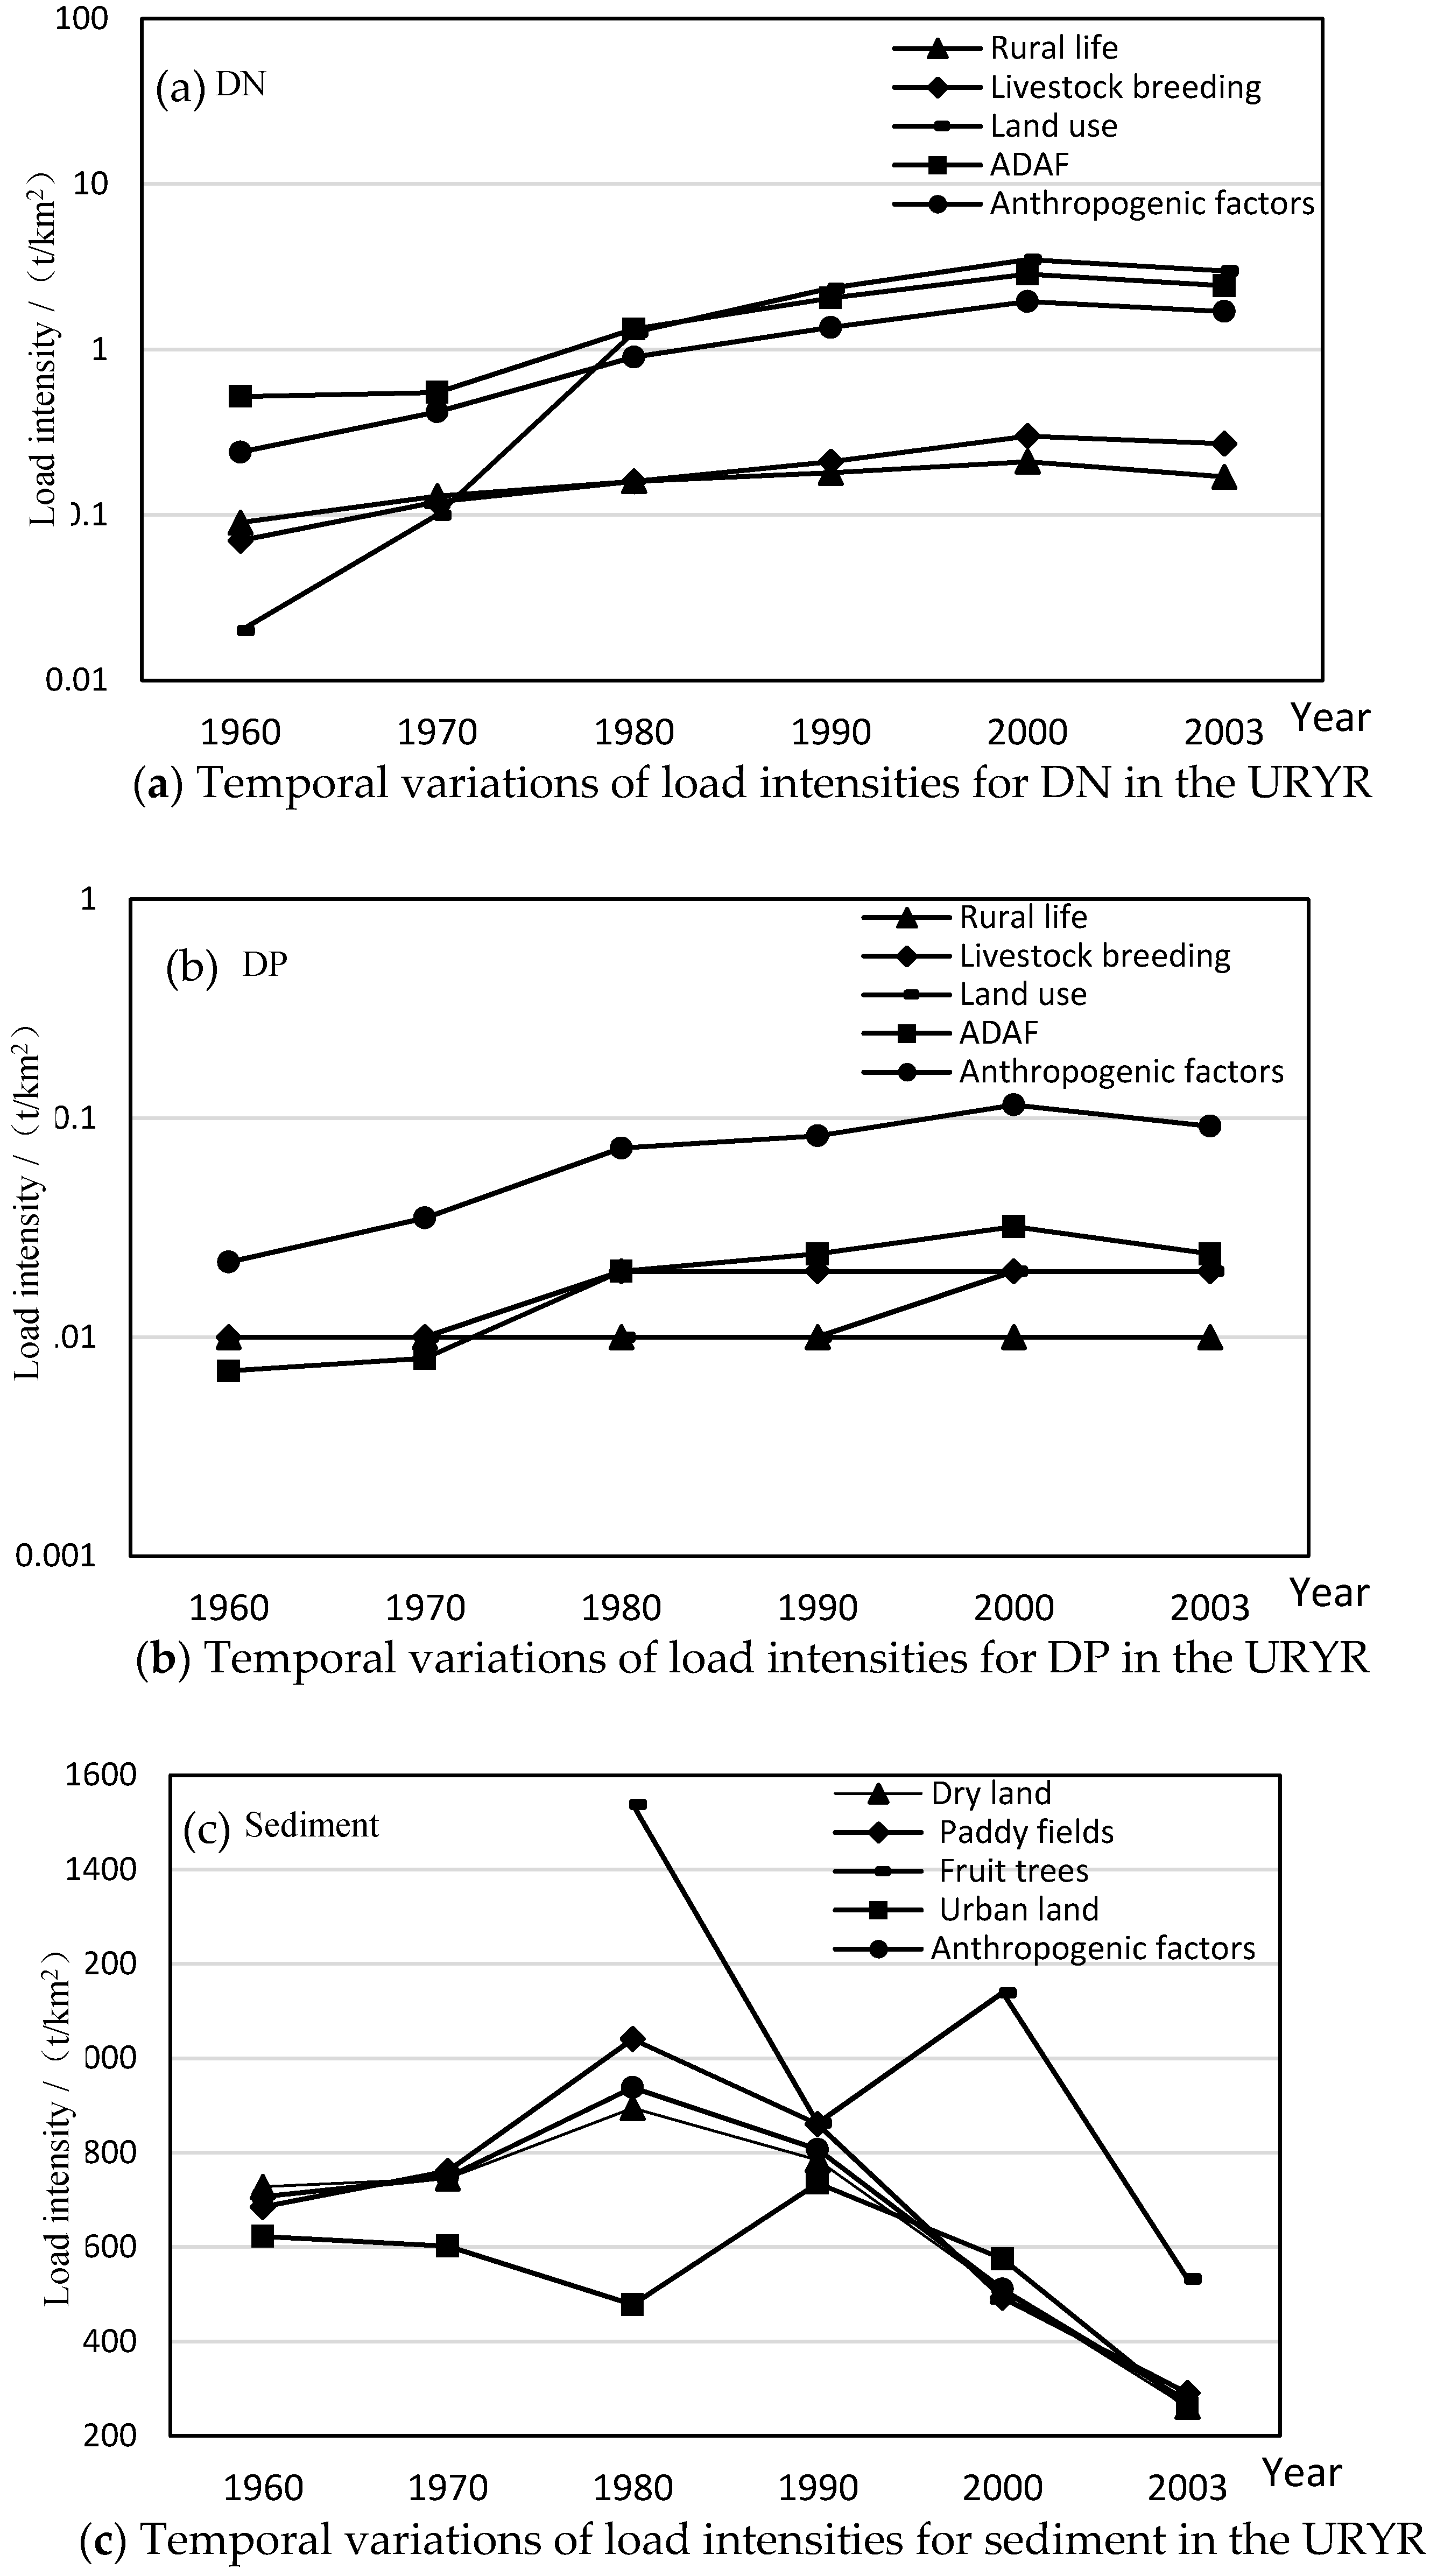
As can be seen in Figure 5, the load intensities for dissolved pollutants caused by anthropogenic factors first increased and then became flat between 1960 and 2003. For DN, the load intensity caused by rural life, livestock breeding and atmospheric deposition showed an increasing trend, and the load intensity caused by land use increased significantly. The load intensity of land use was higher, while load intensities of rural life and livestock breeding were relatively low. Therefore, anthropogenic factors increased the content of DN and enhanced the DN load intensity. For DP, the load intensity caused by anthropogenic factors increased from 1960 to 1980, and did not change much between 1980 and 2000, before decreasing slightly up to 2003. In general, the main causes of this fluctuation were population surge, extensive development of livestock breeding and uncontrolled fertilizer use before 1990 [36]. After 1990, the state implemented some environmental protection policies.
For sediment, as shown in Figure 5, the load intensity of sediment produced by dry land, paddy fields and urban land increased first and then decreased during the period of 1960–2003; the load intensity of dry land increased from 727.76 t/km2 in 1960, to 894.26 t/km2 in 1980, then decreased to 261.64 t/km2 in 2003; the load intensity of paddy fields increased from 685.11 t/km2 in 1960, to 1040.60 t/km2 in 1980, then decreased to 290.68 t/km2 in 2003; the load intensity of sediment in urban land started at 622.65 t/km2 in 1960, then increased to 735.56 t/km2 in 1990, then decreased to 258.53 t/km2 in 2003. The load intensity generated by fruit trees fluctuated but eventually declined. Sediment load generated by fruit trees was the highest intensity, the load caused by paddy fields and dry land were in the middle and the load produced by urban land was lowest. Land types, tillage patterns, soil erosion, rainfall, runoff and other factors determined the magnitude of sediment load intensity. As a whole, the load intensity of sediment caused by anthropogenic factors increased first and then decreased over time. Due to the expansion of agricultural land area, it can be seen that soil erosion was aggravated and sediment load intensity increased from 1960 to 1980. Under the influence of soil and water conservation measures and the initial results of the “Changzhi Project”, the sediment pollution caused by human activities was controlled to a certain extent after 1980.
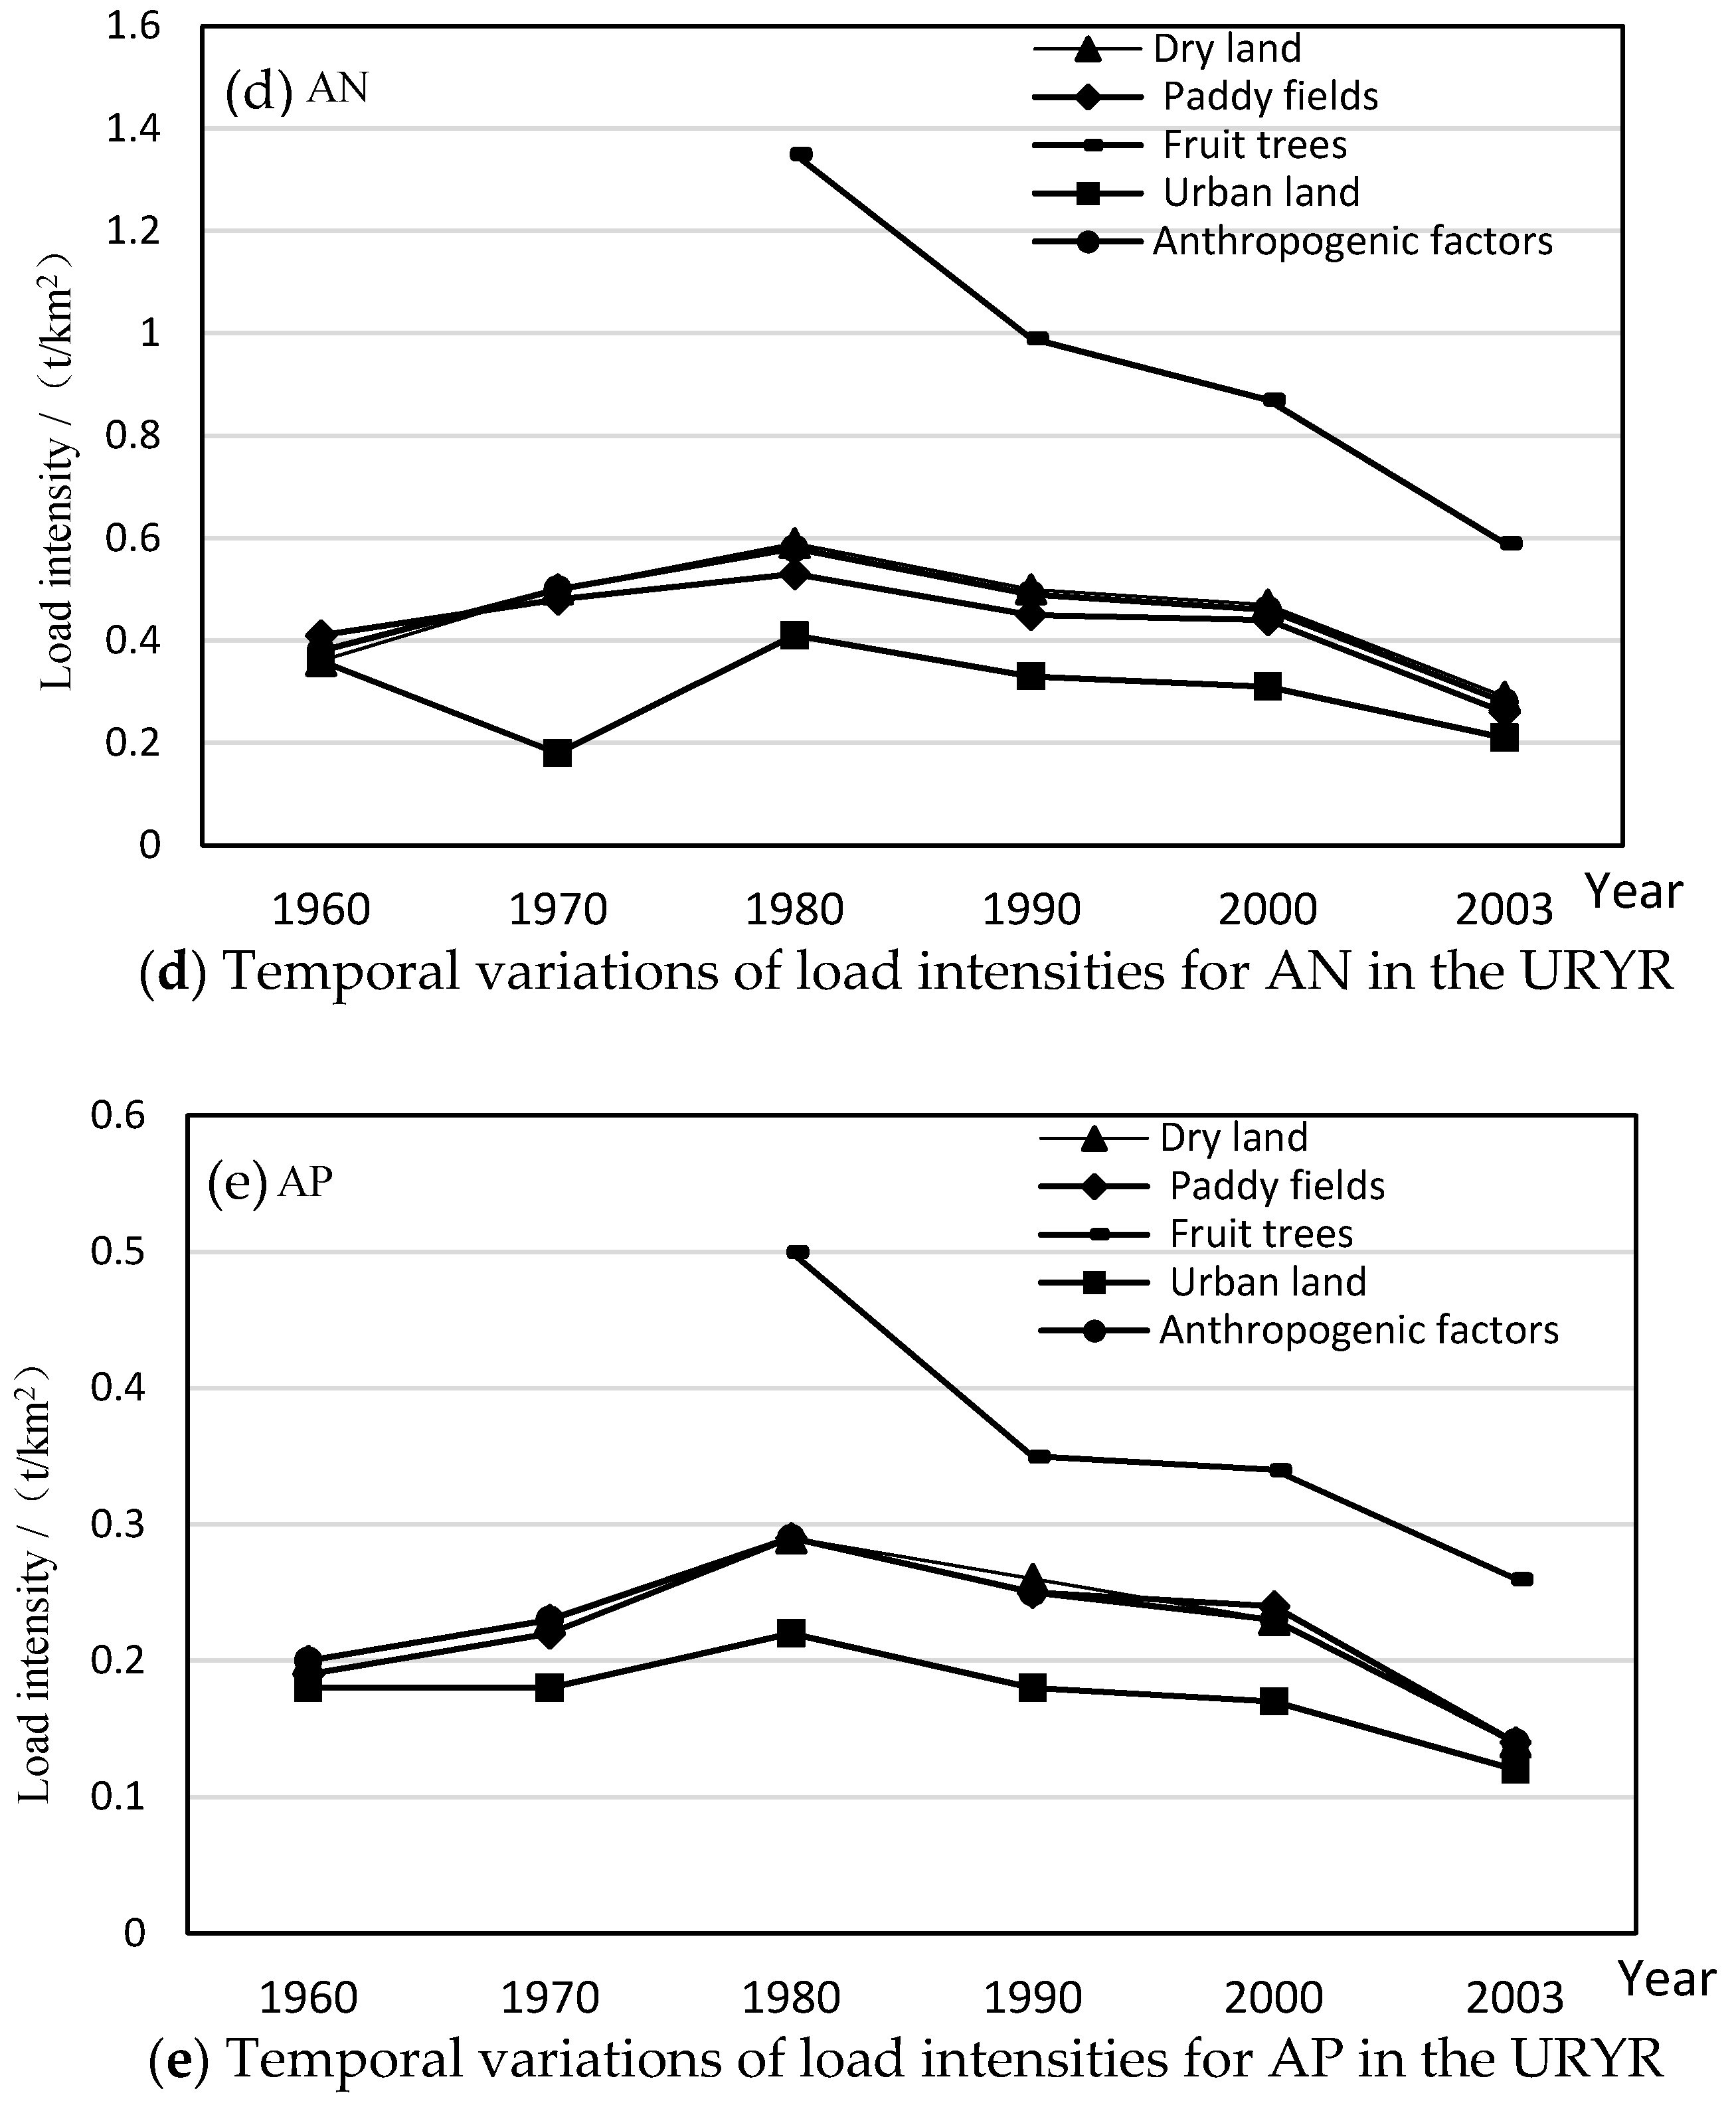
As shown in Figure 5, the load intensity for adsorbed pollutants increased first and then decreased in dry land and paddy fields, and the load intensity of fruit trees decreased, but the load intensity by urban land did not change significantly from 1960 to 2003. On the whole, the load intensity of pollution sources increased first and then decreased, and reached a maximum in 1980. Therefore, the load intensity of adsorbed pollutants caused by human activities was affected mainly by rainfall, farming patterns, soil and water conservation and other measures, and the reason was similar to that of sediment. Compared with the results of Shen et al. [31], this study divided different land types and described the effects of various anthropogenic factors on NPS pollution, and the final effects were consistent.
3.4. Effects of Various Anthropogenic Factors on NPS Pollution
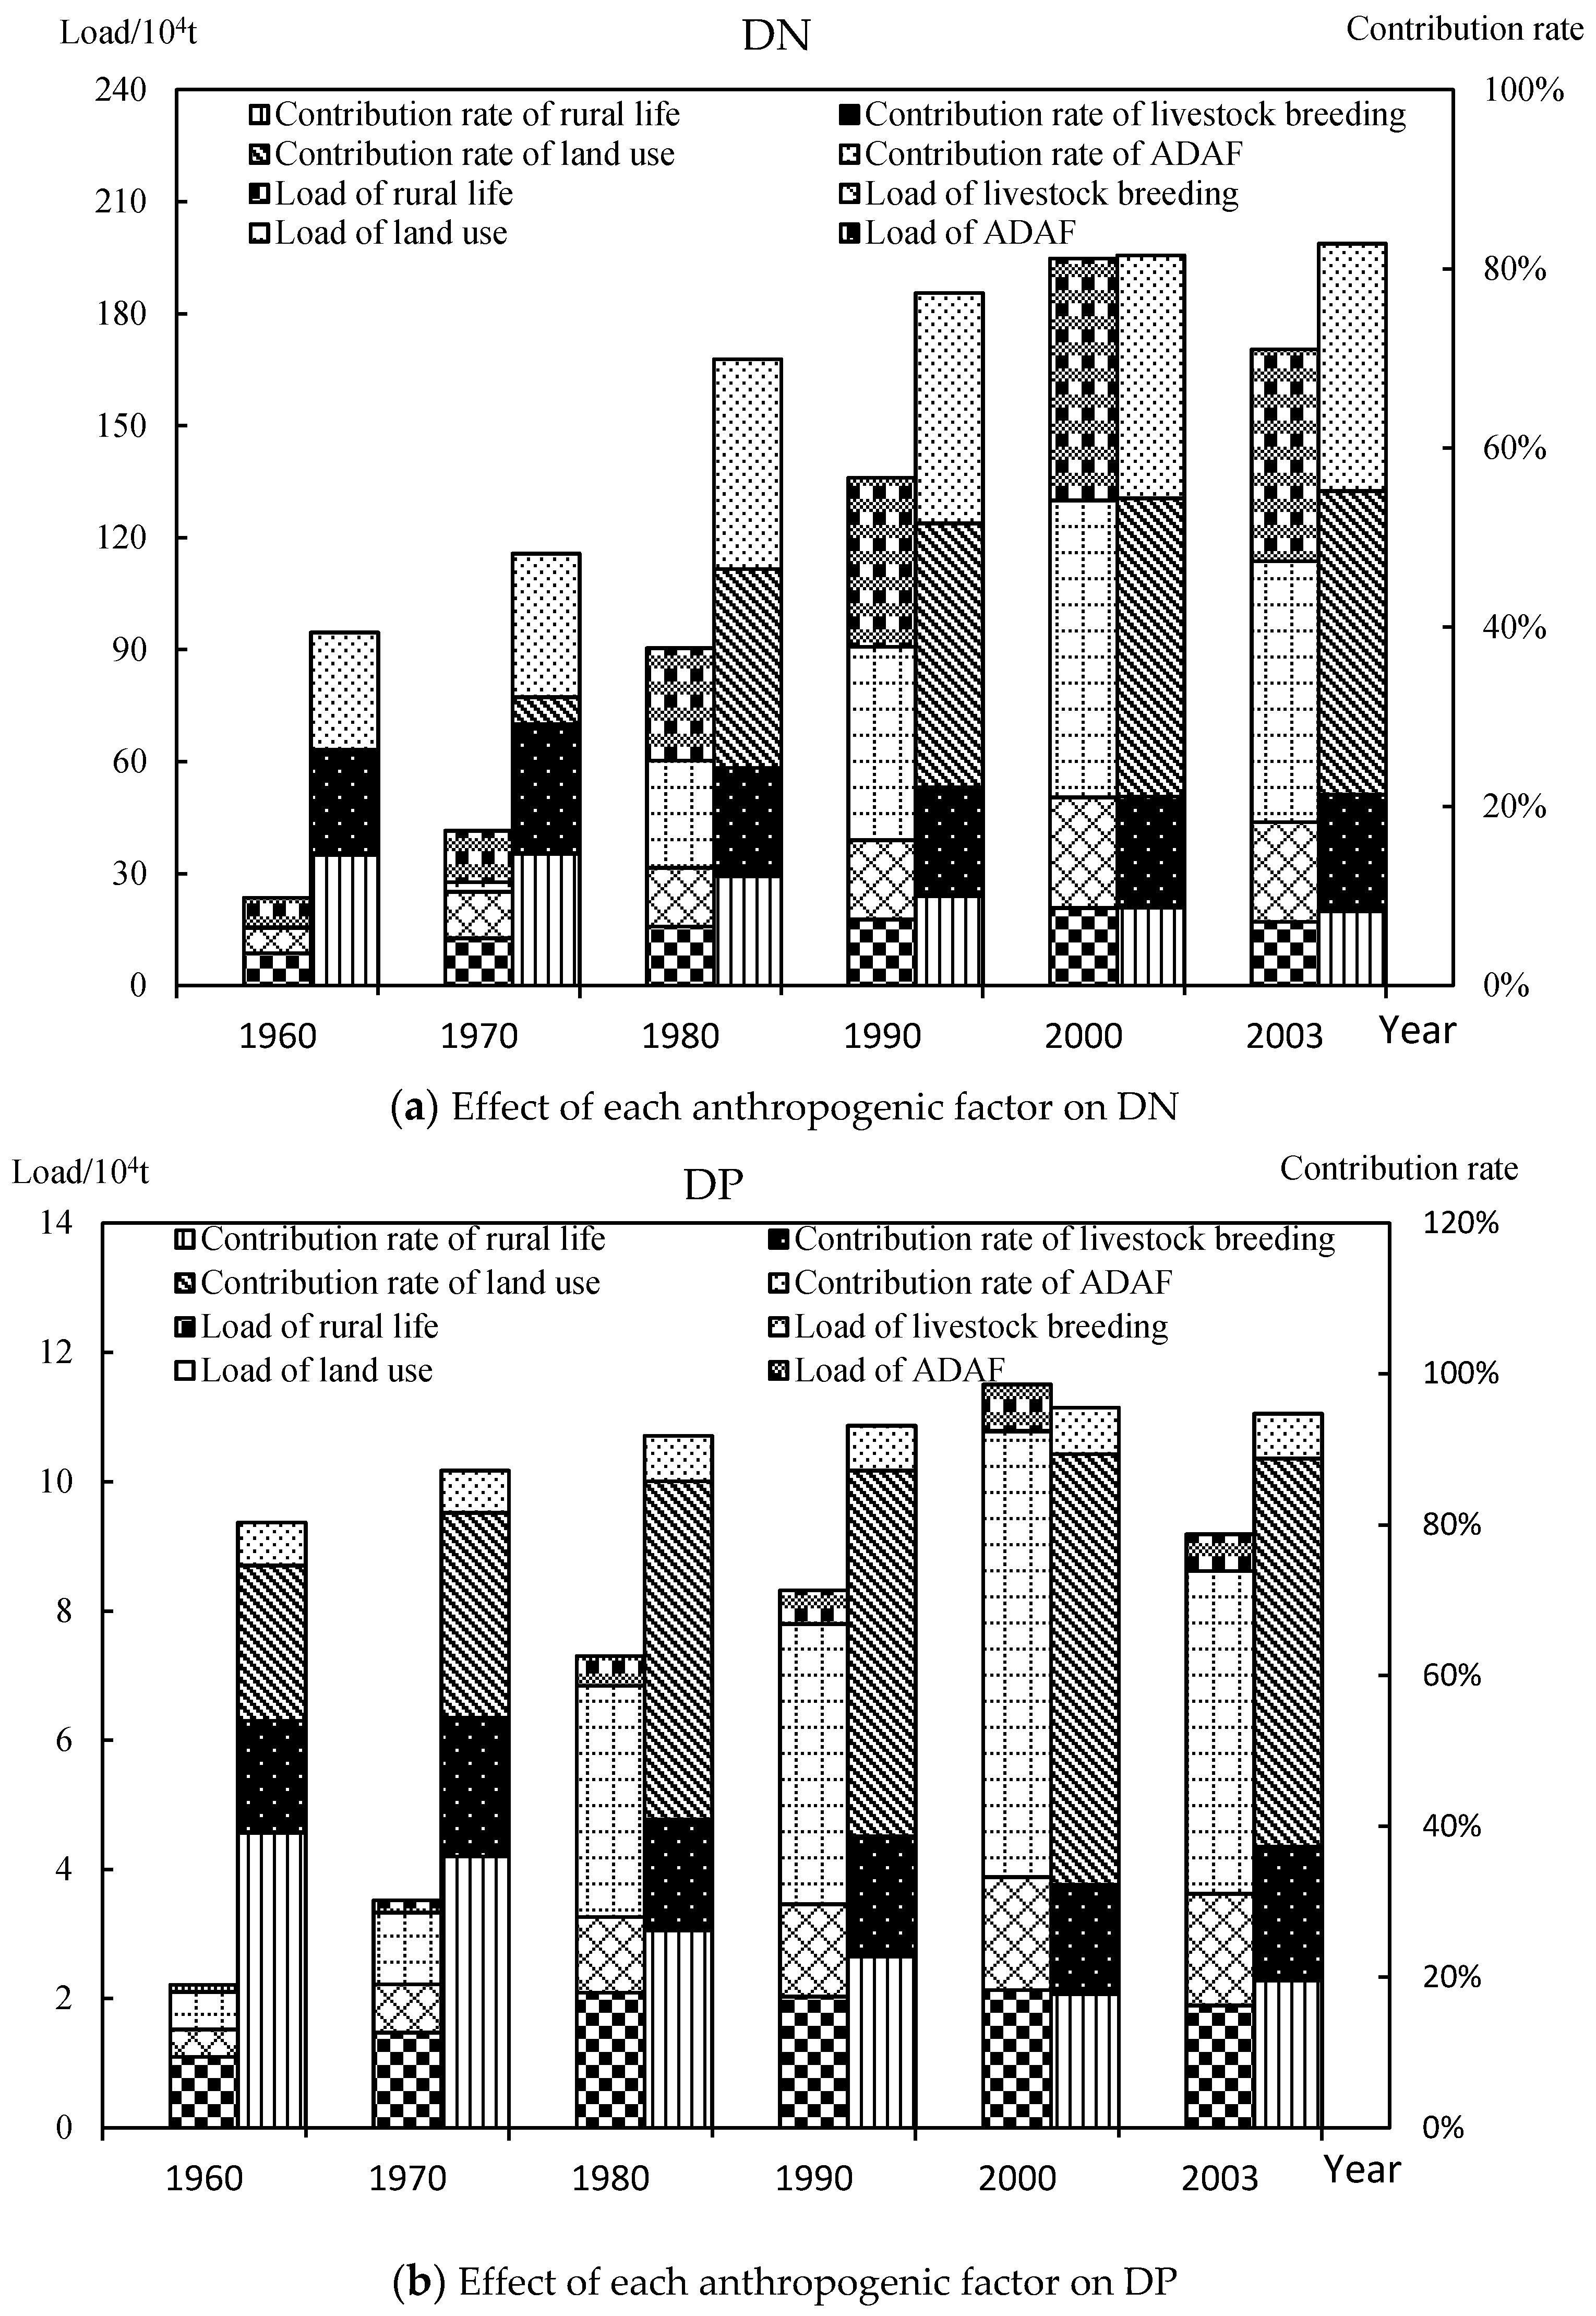
Based on the models proposed in Section 2.1 and GIS, the pollution load caused by each anthropogenic factor and the contribution rates to the total load during 1960–2003 were calculated. The effect of anthropogenic factors on NPS pollution in the URYR was analyzed, as shown in Figure 6.
In terms of DN, the annual loads caused by rural life, livestock breeding, land use and atmospheric deposition all showed an upward trend from 1960 to 2000, and declined by 2003. The contribution rate of rural life to the total pollution load decreased, and the contribution rate of livestock breeding did not change significantly. The contribution rates of land use and atmospheric deposition showed an upward trend. Among them, agricultural land and atmospheric deposition were the main contributors to DN, and the sum of contribution rates exceeded 60%. The reason was that the unreasonable utilization of land and the large use of nitrogen fertilizers caused an increase in DN. As a result of the implementation of environmental protection measures and the change of land farming patterns, the load and contribution rate began to slow down.
For DP, the changing trend of annual loads was similar to DN. The contribution rates of atmospheric deposition and livestock farming to the total pollution load changed little, the contribution rate of rural life declined and the contribution rate of unnatural land began to slow down. However, rural life and land use were the main contributors to DP, and its sum of contribution rates exceeded 70%. The reason for this was that the irrational utilization of land and the large use of phosphate fertilizer caused an increase in DP. With changes in lifestyle and farming patterns, the load and contribution rate began to slow.
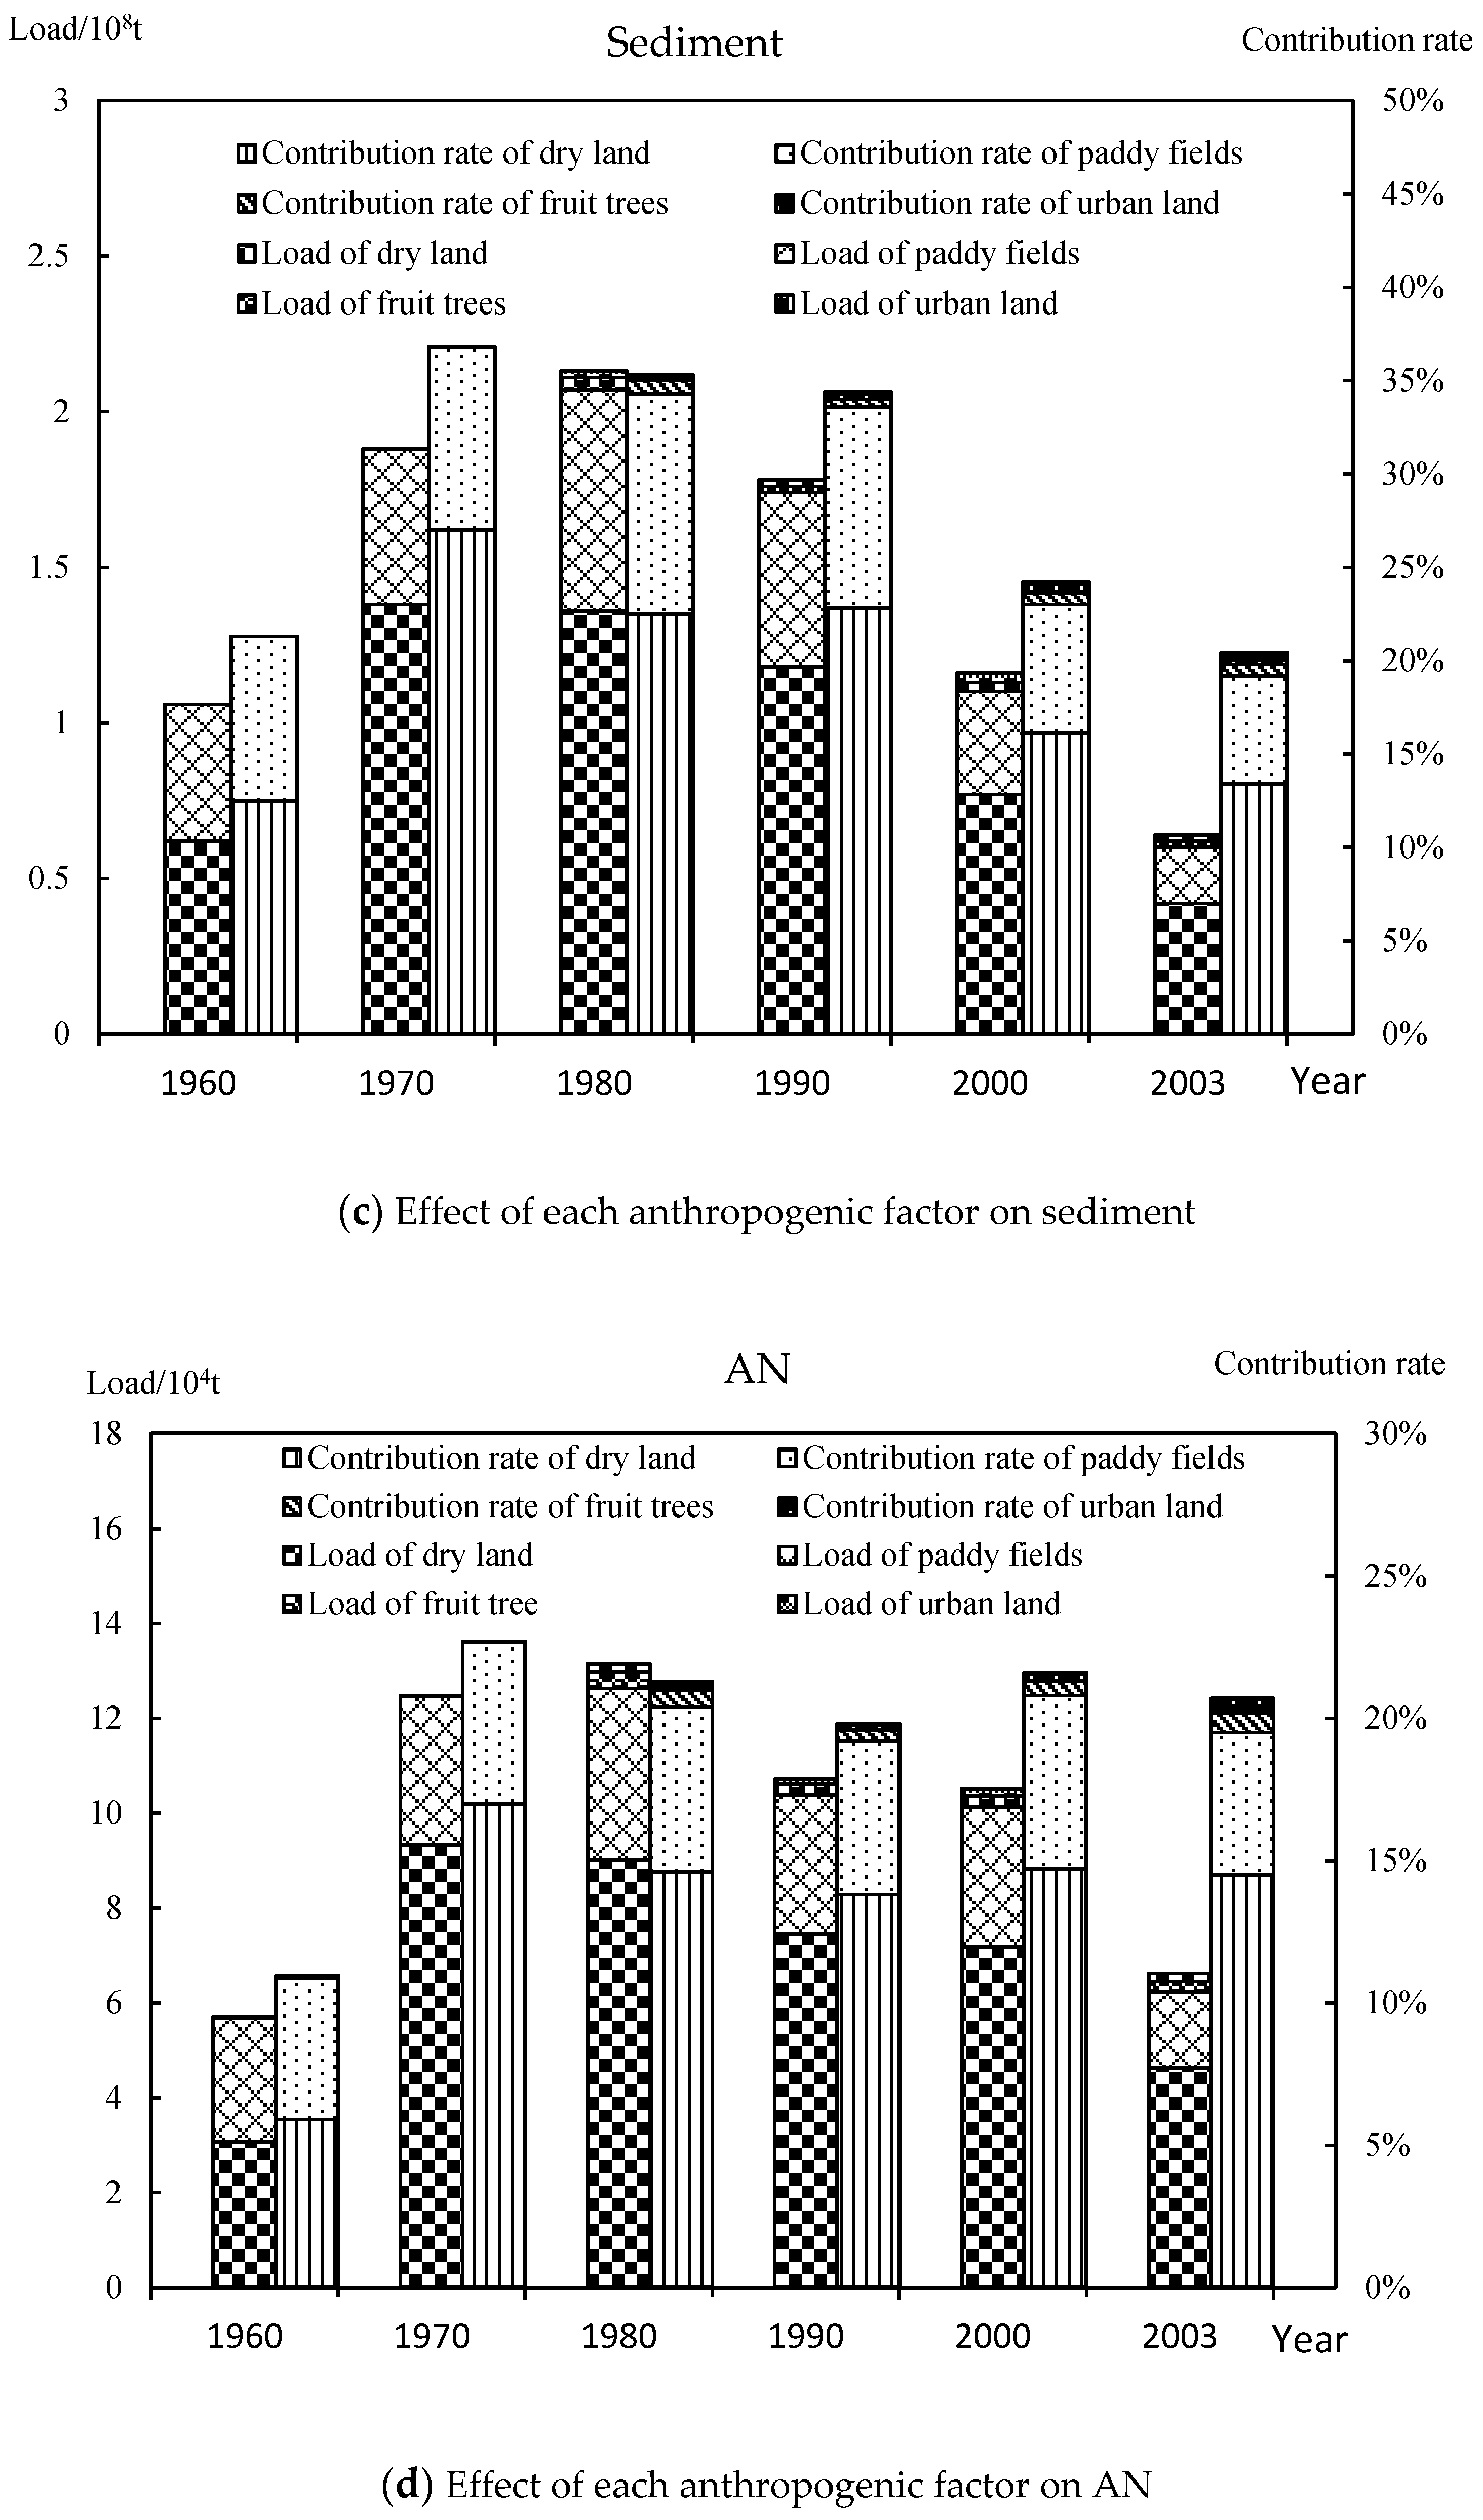
For sediment, the annual loads generated by fruit trees and urban land use did not change significantly from 1980 to 2003. The annual loads caused by dry land and paddy fields increased first and then decreased from 1960 to 2003. Their changes in contribution rates to the total load also had the same trend.
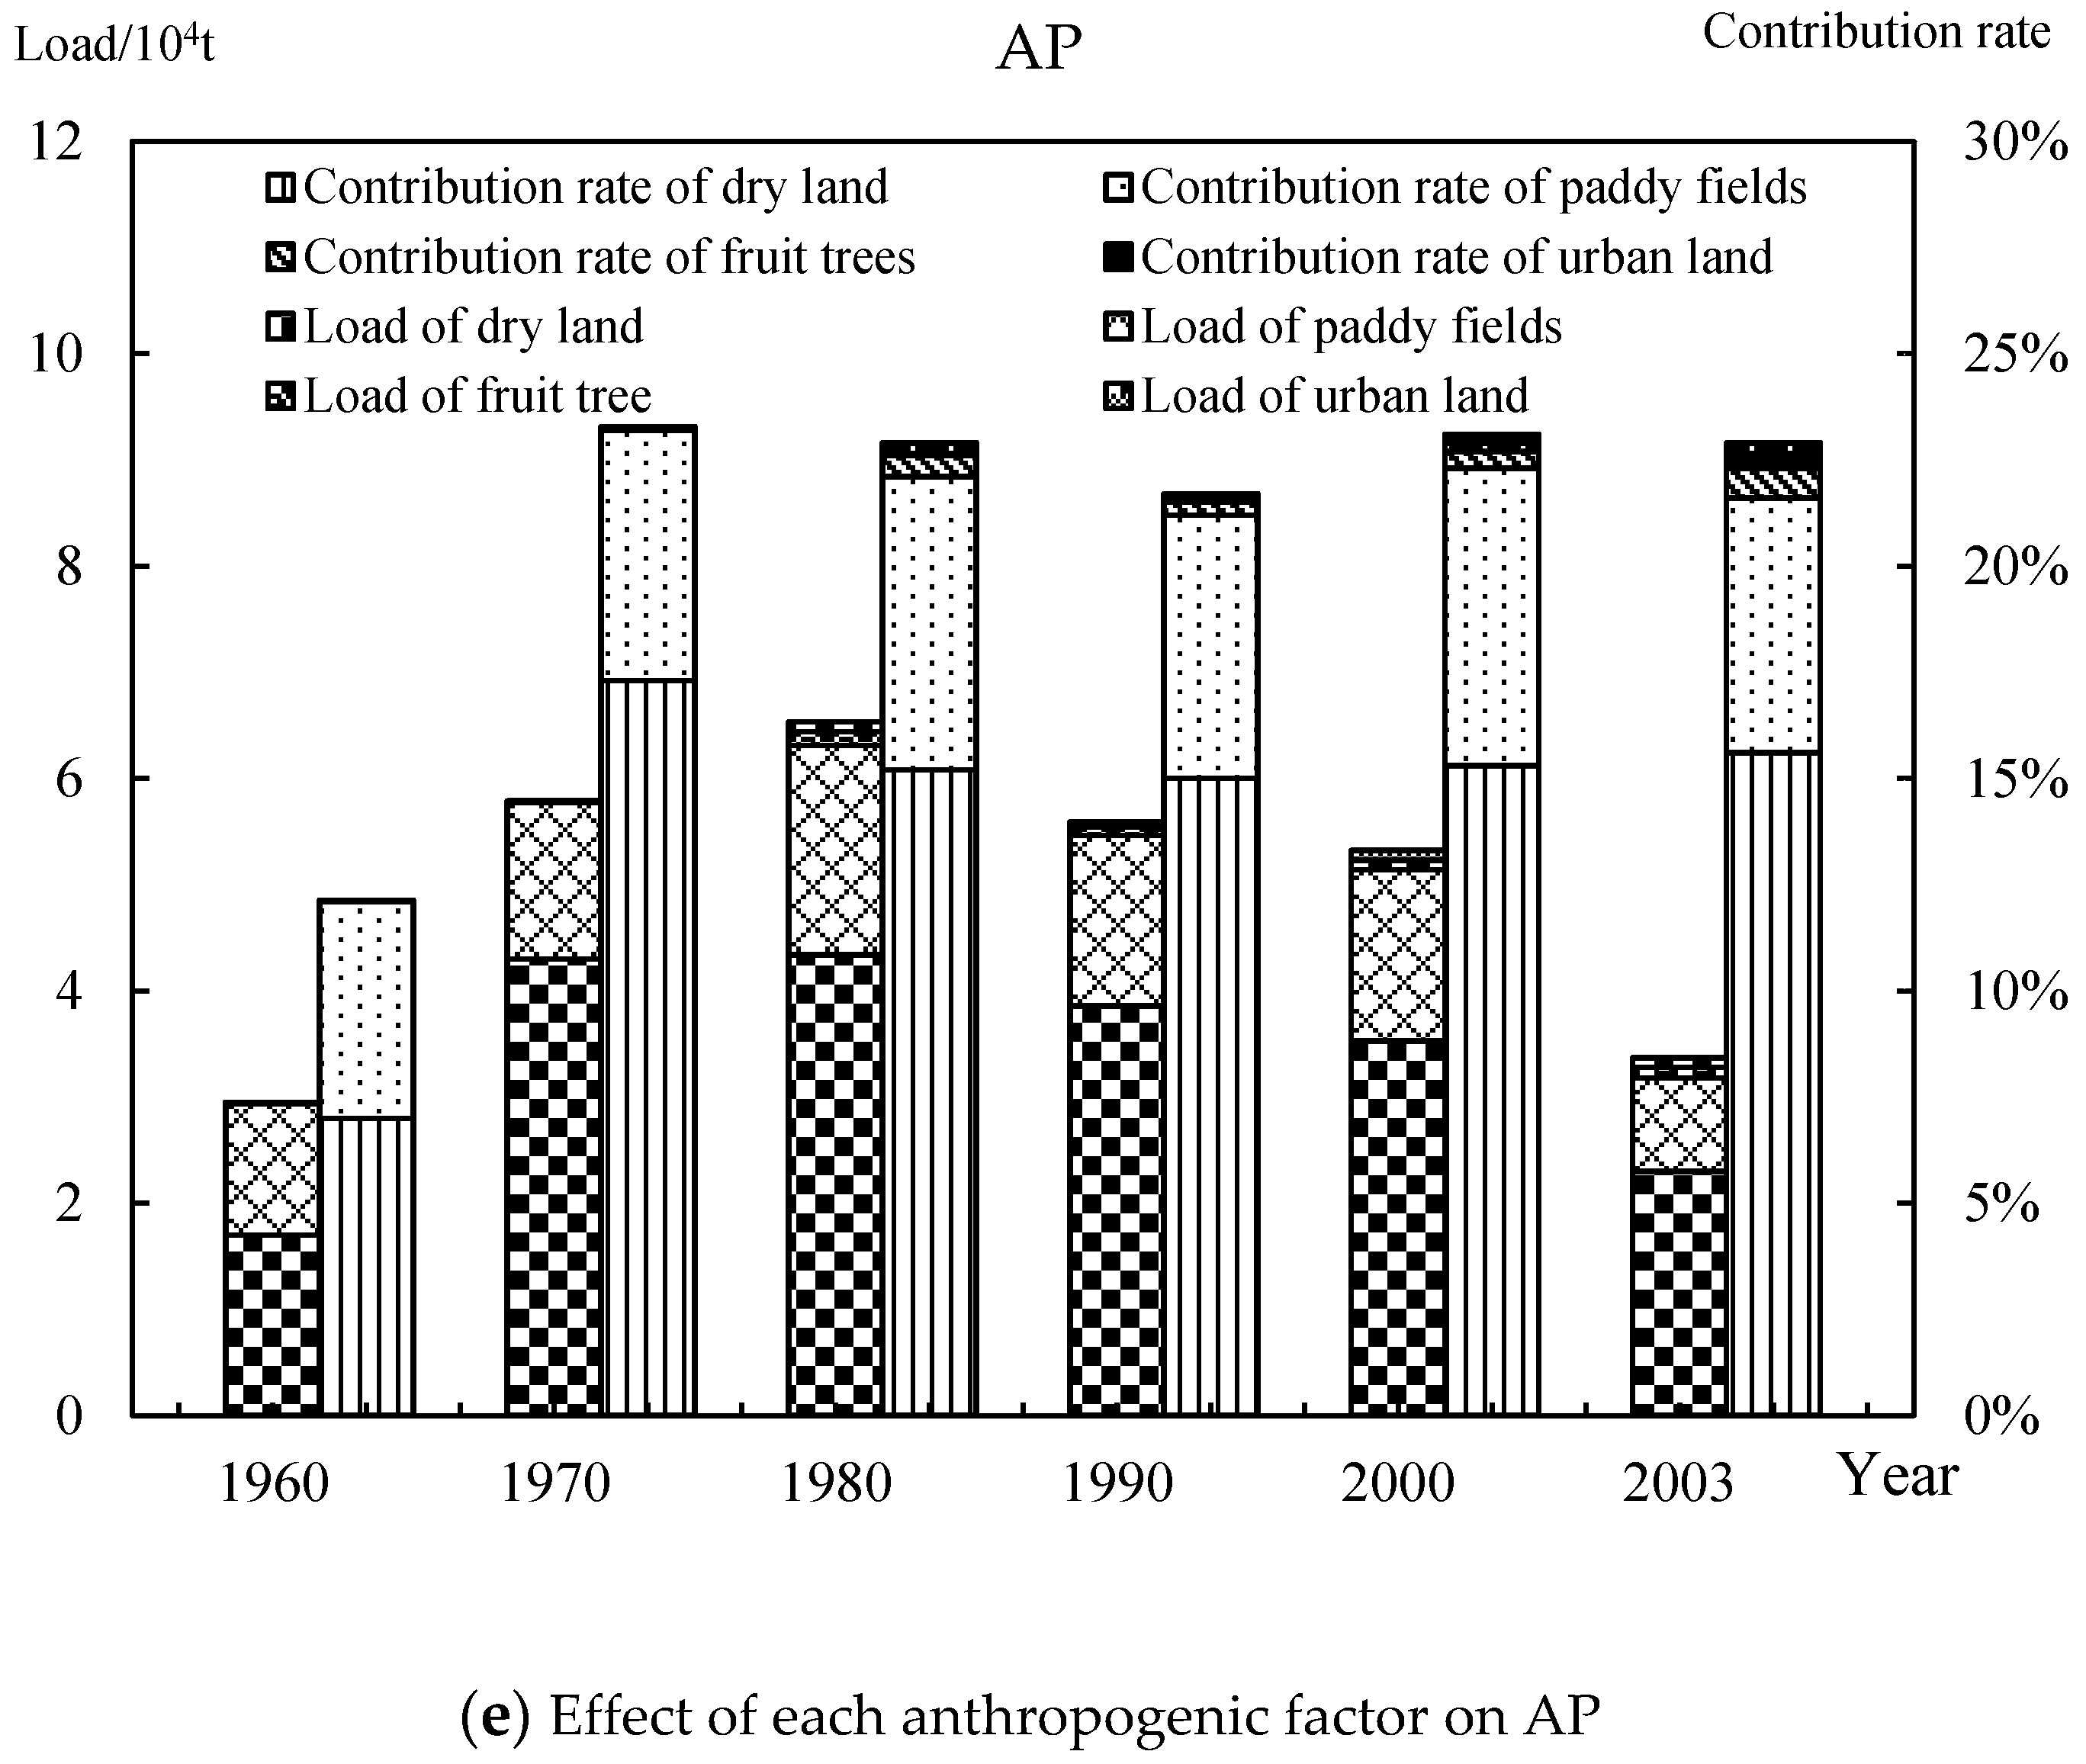
In addition, the effects of anthropogenic factors on adsorbed pollutants were similar to those of sediments. The total contribution rate of dry land and paddy fields reached 20%, and were the main sources of adsorbed pollutants in anthropogenic factors. According to the data, land use was a secondary source of sediment and adsorbed pollutants compared with unused land. It was further shown that the loss of sediment and adsorbed pollutants was related to soil erosion and pollutant characteristics. These results are consistent with previous studies [2,22], indicating that anthropogenic factors were main sources of dissolved pollutants, and ecological factors were main sources of sediment and adsorbed pollutants.
4. Conclusions
Numerous studies have shown that non-point source pollution is the main cause of urban water environmental pollution both at home and abroad. This study conducted a space-time simulation of NPS pollution load in the URYR basin during the period from 1960 to 2003 based on GIS and remote sensing (RS) technology. The temporal and spatial variation of long-term effects of anthropogenic factors on the NPS pollution in the URYR was analyzed. This study will provide guidance for water quality management in the URYR and other ecological environments where NPS pollution is becoming increasingly serious.
In this study, the improved export coefficient model and nutrient loss model were used to simulate the dissolved and adsorbed pollutants. Data analysis not only showed that ecological factors had an impact on NPS pollution in the URYR, but also that NPS pollution caused by anthropogenic factors was becoming more and more serious. In terms of contribution, the contributions of anthropogenic factors to dissolved pollutants increased significantly, and the contributions to sediment and adsorbent increased first and then decreased during the period from 1960 to 2003. As far as the main impact factors are concerned, anthropogenic factors replaced ecological factors as the main impact factor for dissolved N from 1960 to 2003. Agricultural activities have always been the dominant factor in the production of dissolved P and have been a secondary impact factor for sediment and adsorbed pollutants. In terms of load intensity, the load intensity of dissolved pollutants increased rapidly, and the load intensities of sediment and adsorbent pollutants increased first and then decreased. For various anthropogenic factors, land use, atmospheric deposition and rural life were the main sources of dissolved pollutants; nevertheless, dry land and paddy fields were the major sources of sediment and adsorbed pollutants. The study found that human activities such as agriculture, rural life, population and urban construction can produce non-point source pollutants. For half a century, anthropogenic factors have had a significant impact on NPS pollution. According to the changing trend of NPS pollution, a series of environmental protection policies implemented from 1990 to 2003 were effective. Therefore, the results can provide a reference for future NPS pollution control.
This study mainly analyzed the effects of anthropogenic factors on NPS pollution in the URYR. It also proposed some environmental management measures, such as rational use of land, controlling the use of chemical fertilizers and the scale of livestock breeding, as well as implementing soil and water conservation. The recommendations made in the current research are based on the time frame analyzed and should be considered cautiously as several changes could have occurred between 2003 and 2019. These results, nevertheless, provide valuable information for managing the impact of anthropogenic activities on river catchments, and further studies involving recent data, where available, are strongly recommended. In future research, the data from recent years will be increased and the effects of other factors on NPS pollution in the URYR will be analyzed more comprehensively based on the results and analysis of this study.
Author Contributions
Formal analysis, X.D.; Resources, X.D. and L.L.; Investigation, L.L.; Data curation, L.L.; Writing—original draft, X.D.; Writing—review and editing, L.L.
Funding
This research was funded by National Natural Science Foundation of China (51309097), the National key scientific and technological projects of the PRC (2014ZX07104-005) and the Fundamental Research Funds for the Central Universities of PRC.
Acknowledgments
We are very grateful to National Natural Science Foundation of China (51309097), the National key scientific and technological projects of the PRC (2014ZX07104-005) and the Fundamental Research Funds for the Central Universities of PRC. The authors gratefully acknowledge the financial support of the programs and agencies.
Conflicts of Interest
The authors declare no conflict of interest.
References
- Chen, X.; Liu, X.; Peng, W.; Dong, F.; Huang, Z.; Wang, R. Non-point source nitrogen and phosphorus assessment and management plan with an improved method in data-poor regions. Water 2017, 10, 17. [Google Scholar] [CrossRef]
- Ding, X.W.; Hou, B.D.; Xue, Y.; Jiang, G.H. Long-term effects of ecological factors on nonpoint source pollution in the upper reach of the Yangtze river. J. Environ. Inform. 2017, 30, 17–28. [Google Scholar] [CrossRef]
- Liu, J.; Shen, Z.; Yan, T.; Yang, Y. Source identification and impact of landscape pattern on riverine nitrogen pollution in a typical urbanized watershed, Beijing, china. Sci. Total Environ. 2018, 628, 1296–1303. [Google Scholar] [CrossRef] [PubMed]
- Yuan, C.; Liu, L.; Ye, J.; Ren, G.; Zhuo, D.; Qi, X. Assessing the effects of rural livelihood transition on non-point source pollution: A coupled abm-iecm model. Environ. Sci. Pollut. Res. 2017, 24, 12899–12917. [Google Scholar] [CrossRef] [PubMed]
- Wu, Y.; Liu, J.; Shen, R.; Fu, B. Mitigation of nonpoint source pollution in rural areas: From control to synergies of multi ecosystem services. Sci. Total Environ. 2017, 607–608, 1376–1380. [Google Scholar] [CrossRef] [PubMed]
- Lin, C.; Wu, Z.; Ma, R.; Su, Z. Detection of sensitive soil properties related to non-point phosphorus pollution by integrated models of sedd and pload. Ecol. Indic. 2016, 60, 483–494. [Google Scholar] [CrossRef]
- Wang, J.; Shao, J.; Wang, D.; Ni, J.; Xie, D. Simulation of the dissolved nitrogen and phosphorus loads in different land uses in the three gorges reservoir region-based on the improved export coefficient model. Environ. Sci. Proc. Impacts 2015, 17, 1976–1989. [Google Scholar] [CrossRef]
- Mijke, V.O.; Maarten, K.; Tom, B.; Gertjan, G.; Hans, M. Combined effects of climate change and dam construction on riverine ecosystems. Ecol. Eng. 2018, 120, 329–344. [Google Scholar]
- Fan, Y.R.; Huang, W.W.; Huang, G.H.; Huang, K.; Li, Y.P.; Kong, X.M. Bivariate hydrologic risk analysis based on a coupled entropy-copula method for the Xiangxi River in the three gorges reservoir area, China. Theor. Appl. Climatol. 2016, 125, 381–397. [Google Scholar] [CrossRef]
- Guo, L.; Su, N.; Zhu, C.; He, Q. How have the river discharges and sediment loads changed in the Changjiang river basin downstream of the three gorges dam? J. Hydrol. 2018, 560, 259–274. [Google Scholar] [CrossRef]
- Zeng, X.T.; Li, Y.P.; Huang, G.H.; Liu, J. Modeling water trading under uncertainty for supporting water resources management in an arid region. J. Water Res. Plan Manag. 2016, 142, 04015058. [Google Scholar] [CrossRef]
- Xu, H.J.; Wang, X.P.; Zhang, X.X. Alpine grasslands response to climatic factors and anthropogenic activities on the Tibetan plateau from 2000 to 2012. Ecol. Eng. 2016, 92, 251–259. [Google Scholar] [CrossRef]
- Wang, X.; Hao, F.; Cheng, H. Estimating non-point source pollutant loads for the large-scale basin of the Yangtze river in China. Environ. Earth Sci. 2011, 63, 1079–1092. [Google Scholar] [CrossRef]
- Ouyang, W.; Hao, F.H.; Wang, X.L. Nonpoint Source Pollution Responses Simulation for Conversion Cropland to Forest in Mountains by SWAT in China. Environ. Manag. 2008, 41, 79–89. [Google Scholar] [CrossRef] [PubMed]
- Wu, L.; Long, T.Y.; Liu, X. Simulation of soil loss processes based on rainfall runoff and the time factor of governance in the Jialing River Watershed, China. Environ. Monit. Assess. 2012, 184, 3731–3748. [Google Scholar] [CrossRef]
- Mishra, A.; Kar, S.; Singh, V.P. Determination of runoff and sediment yield from a small watershed in sub-humid subtropics using the HSPF model. Hydrol. Process. 2007, 21, 3035–3045. [Google Scholar] [CrossRef]
- Su, J.; Du, X.; Li, X.; Wang, X.; Li, W.; Zhang, W. Development and application of watershed-scale indicator to quantify non-point source p losses in semi-humid and semi-arid watershed, china. Ecol. Indic. 2016, 63, 374–385. [Google Scholar] [CrossRef]
- Johnes, P.J. Evaluation and management of the impact of land use change on the nitrogen and phosphorus load delivered to surface waters: The export coefficient modelling approach. J. Hydrol. 1996, 183, 323–349. [Google Scholar] [CrossRef]
- Li, J.; Yang, W.J.; Li, W.J.; Mu, L.; Jin, Z.W. Coupled hydrodynamic and water quality simulation of algal bloom in the Three Gorges Reservoir, China. Ecol. Eng. 2018, 119, 97–108. [Google Scholar] [CrossRef]
- Wilkinson, S.N.; Dougall, C.; Kinsey-Henderson, A.E.; Searle, R.D.; Ellis, R.J.; Bartley, R. Development of a time-stepping sediment budget model for assessing land use impacts in large river basins. Sci. Total Environ. 2014, 468–469, 1210–1224. [Google Scholar] [CrossRef]
- Wang, C.; Dai, S.B.; Ran, L.S.; Jiang, L.; Li, W.T. Contribution of river mouth reach to sediment load of the Yangtze river. Adv. Meteorol. 2015, 2015, 415058. [Google Scholar] [CrossRef]
- Ding, X.W.; Shen, Z.Y.; Liu, R.M.; Chen, L.; Lin, M. Effects of ecological factors and human activities on nonpoint source pollution in the upper reach of the Yangtze river and its management strategies. Hydrol. Earth Syst. Sci. Discuss. 2014, 11, 691–721. [Google Scholar] [CrossRef]
- Huang, L.; Zhong, M.; Gan, Q.; Liu, Y.; Huang, L.; Zhong, M. A novel calendar-based method for visualizing water quality change: The case of the Yangtze river 2006–2015. Water 2017, 9, 708. [Google Scholar] [CrossRef]
- Su, B.; Huang, J.; Zeng, X.; Gao, C.; Jiang, T. Impacts of climate change on streamflow in the upper Yangtze river basin. Clim. Chang. 2017, 141, 533–546. [Google Scholar] [CrossRef]
- Deng, F.; Lin, T.; Zhao, Y.; Yuan, Y. Zoning and analysis of control units for water pollution control in the Yangtze river basin, china. Sustainability 2017, 9, 1374. [Google Scholar] [CrossRef]
- Jiang, C.; Zhang, L.; Tang, Z. Multi-temporal scale changes of streamflow and sediment discharge in the headwaters of yellow river and Yangtze river on the Tibetan plateau, china. Ecol. Eng. 2017, 102, 240–254. [Google Scholar] [CrossRef]
- Guo, H.; Chen, X.; Hydrology, B.O. Spatial contribution and cause analysis for runoff decreasing in the upstream of Yangtze river. J. Water Res. 2017, 6, 309–316. [Google Scholar]
- Sun, Z.; Zhu, X.; Pan, Y.; Zhang, J.; Liu, X. Drought evaluation using the grace terrestrial water storage deficit over the Yangtze river basin, china. Sci. Total Environ. 2018, 634, 727–738. [Google Scholar] [CrossRef]
- Xu, G.; Cheng, S.; Li, P.; Li, Z.; Gao, H.; Yu, K. Soil total nitrogen sources on dammed farmland under the condition of ecological construction in a small watershed on the loess plateau, china. Ecol. Eng. 2017, 121, 19–25. [Google Scholar] [CrossRef]
- Wang, X.; Li, X.; Wu, Y. Maintaining the connected river-lake relationship in the middle Yangtze river reaches after completion of the three gorges project. Int. J. Sediment Res. 2017, 4, 487–494. [Google Scholar] [CrossRef]
- Shen, Z.; Chen, L.; Ding, X.; Hong, Q.; Liu, R. Long-term variation (1960–2003) and causal factors of non-point-source nitrogen and phosphorus in the upper reach of the Yangtze river. J. Hazard. Mater. 2013, 252–253, 45–56. [Google Scholar] [CrossRef] [PubMed]
- An, C.; Yang, S.; Huang, G.; Zhao, S.; Zhang, P.; Yao, Y. Removal of sulfonated humic acid from aqueous phase by modified coal fly ash waste: Equilibrium and kinetic adsorption studies. Fuel 2016, 165, 264–271. [Google Scholar] [CrossRef]
- Zhuo, D.; Liu, L.; Yu, H.; Yuan, C. A national assessment of the effect of intensive agro-land use practices on nonpoint source pollution using emission scenarios and geo-spatial data. Environ. Sci. Pollut. Res. 2018, 25, 1683–1705. [Google Scholar] [CrossRef] [PubMed]
- Ding, X.; Shen, Z.; Hong, Q.; Yang, Z.; Wu, X.; Liu, R. Development and test of the export coefficient model in the upper reach of the Yangtze river. J. Hydrol. 2010, 383, 233–244. [Google Scholar] [CrossRef]
- Duarte, L.; Teodoro, A.C.; Goncalves, J.A. Assessing soil erosion risk using RUSLE through a GIS open source desktop and web application. Environ. Monit. Assess. 2016, 188, 351. [Google Scholar] [CrossRef] [PubMed]
- Li, S.; Gu, S.; Tan, X. Water quality in the upper Han River basin, China: The impacts of land use/land cover in riparian buffer zone. J. Hazard. Mater. 2009, 165, 317–324. [Google Scholar] [CrossRef] [PubMed]
- Li, Q.; Yu, M.; Lu, G. Impacts of the Gezhouba and Three Gorges reservoirs on the sediment regime in the Yangtze river, China. J. Hydrol. 2011, 403, 224–233. [Google Scholar] [CrossRef]
- Siciliano, G. Urbanization strategies, rural development and land use changes in China: A multiple-level integrated assessment. Land Use Policy 2012, 29, 165–178. [Google Scholar] [CrossRef]
- Zhang, N.; He, H.M.; Zhang, S.F.; Jiang, X.H. Influence of Reservoir Operation in the Upper Reaches of the Yangtze river (China) on the Inflow and Outflow Regime of the TGR-based on the Improved SWAT Model. Water Resour. Manag. 2012, 26, 691–705. [Google Scholar] [CrossRef]
- Bieger, K.; Georg, H.; Fohrer, N. Simulation of Streamflow and Sediment with the Soil and Water Assessment Tool in a Data Scarce Catchment in the Three Gorges Region, China. J. Environ. Qual. 2012, 11, 37–45. [Google Scholar] [CrossRef]
Figure 1.
Location of the upper reaches of the Yangtze river and its sub-watersheds.

Figure 2.
The variations of annual NPS pollutant loads changed with time caused by anthropogenic factors (1960–2003) (DN: dissolved nitrogen; DP: dissolved phosphorus; AN: absorbed nitrogen; AP: absorbed phosphorus).
Figure 2.
The variations of annual NPS pollutant loads changed with time caused by anthropogenic factors (1960–2003) (DN: dissolved nitrogen; DP: dissolved phosphorus; AN: absorbed nitrogen; AP: absorbed phosphorus).

Figure 3.
Contribution rates of anthropogenic factors to annual NPS pollutant load (1960~2003) (DN: dissolved nitrogen; DP: dissolved phosphorus; AN: absorbed nitrogen; AP: absorbed phosphorus).
Figure 3.
Contribution rates of anthropogenic factors to annual NPS pollutant load (1960~2003) (DN: dissolved nitrogen; DP: dissolved phosphorus; AN: absorbed nitrogen; AP: absorbed phosphorus).

Figure 4.
Temporal variations of anthropogenic effects on load intensities of NPS pollutants in the URYR during the period from 1960~2003 (DN: dissolved nitrogen; DP: dissolved phosphorus; AN: absorbed nitrogen; AP: absorbed phosphorus).
Figure 4.
Temporal variations of anthropogenic effects on load intensities of NPS pollutants in the URYR during the period from 1960~2003 (DN: dissolved nitrogen; DP: dissolved phosphorus; AN: absorbed nitrogen; AP: absorbed phosphorus).


Figure 5.
Temporal variations of load intensities of NPS pollutants affected by anthropogenic factors in the URYR (1960~2003) (DN: dissolved nitrogen; DP: dissolved phosphorus; AN: absorbed nitrogen; AP: absorbed phosphorus).
Figure 5.
Temporal variations of load intensities of NPS pollutants affected by anthropogenic factors in the URYR (1960~2003) (DN: dissolved nitrogen; DP: dissolved phosphorus; AN: absorbed nitrogen; AP: absorbed phosphorus).


Figure 6.
Effect of each anthropogenic factor on NPS pollution in the URYR (1960–2003) (DN: dissolved nitrogen; DP: dissolved phosphorus; AN: absorbed nitrogen; AP: absorbed phosphorus).
Figure 6.
Effect of each anthropogenic factor on NPS pollution in the URYR (1960–2003) (DN: dissolved nitrogen; DP: dissolved phosphorus; AN: absorbed nitrogen; AP: absorbed phosphorus).


Table 1.
Data Available for Constructing Non-point Source (NPS) Database.
| Data Type | Scale | Data Description | Data Source |
|---|---|---|---|
| Digital elevation model (DEM) | 1:250,000 | Elevation, watershed classification, water system generation and hydrological process simulation | Institute of Geographical and Natural Resources Research, Chinese Academy of Sciences; National Geomatics Center of China |
| Topographic map data | 1:1,000,000 | Basin boundary | National Geomatics Center of China |
| Land use maps | 1:100,000 | Land use classifications (1960–2003) | Institute of Geographical Sciences and Natural Resources Research, Chinese Academy of Sciences |
| Soil map | 1:1,000,000 | Soil physical and chemical properties | Institute of Soil Science, Chinese Academy of Sciences |
| Meteorological data | 173 stations | Weather data (1950–2003) including rainfall, temperature, relative humidity and solar radiation | China Meteorological Administration |
| Social and economic data | Data for all provinces in the upper reaches of the Yangtze river (URYR) | Data (1960–2003) regarding population, livestock breeding amount, planting, harvest and agricultural cultivation | China Agriculture Yearbook; China Statistic Yearbook |
| Water quality and sediment data | 11 stations | Sediment (1960–2003); nitrogen and phosphorus (1991–2000) | China Environment Yearbook (1989–2000); Bulletin of Yangtze River Sediment (1960–2003) |
Table 2.
Statistics on land use status of the URYR in 2003.
| Area | Non-Natural Land (104 km2) | Natural Land (104 km2) | |||||||
|---|---|---|---|---|---|---|---|---|---|
| Province | Dry Land | Paddy Fields | Fruit Trees | Urban Land | Forest | Grassland | Water Area | Unused Land | |
| Qinghai | 0.00 | 0.00 | 0.00 | 0.00 | 0.07 | 11.12 | 1.44 | 3.50 | |
| Tibet | 0.00 | 0.00 | 0.00 | 0.00 | 0.33 | 1.80 | 0.05 | 0.11 | |
| Yunnan | 0.95 | 0.49 | 0.00 | 0.07 | 6.85 | 2.69 | 0.18 | 0.10 | |
| Guizhou | 1.93 | 0.57 | 0.01 | 0.04 | 5.06 | 1.18 | 0.03 | 0.00 | |
| Sichuan | 8.89 | 4.03 | 0.25 | 0.47 | 16.09 | 16.21 | 0.65 | 0.77 | |
| Chongqing | 2.40 | 1.09 | 0.09 | 0.10 | 3.31 | 0.55 | 0.11 | 0.00 | |
| Shaanxi | 0.35 | 0.05 | 0.00 | 0.01 | 0.43 | 0.29 | 0.00 | 0.00 | |
| Gansu | 1.29 | 0.01 | 0.00 | 0.08 | 1.66 | 0.88 | 0.02 | 0.04 | |
| Hubei | 0.51 | 0.08 | 0.02 | 0.00 | 1.04 | 0.14 | 0.01 | 0.00 | |
| Total | 16.33 | 6.32 | 0.38 | 0.79 | 34.84 | 34.86 | 2.50 | 4.52 | |
Table 3.
Export coefficients of various affecting factors in the upper reaches of the Yangtze river.
Table 3.
Export coefficients of various affecting factors in the upper reaches of the Yangtze river.
| Affecting Factors | Export Coefficients of Dissolved Nitrogen | Export Coefficients of Dissolved Phosphorus | |
|---|---|---|---|
| Ecological factors | Grassland | 0.300 | 0.006 |
| Forest | 0.200 | 0.003 | |
| Unused land | 0.500 | 0.008 | |
| Atmospheric deposition raised from grassland, forest and unused land (ADEF) | 33% of the total | 6% of the total | |
| Anthropogenic factors | Rural life (t/ca·yr) | 1.872 | 0.214 |
| Livestock breeding (t/ca·yr) | 0.060~7.320 | 0.005~0.310 | |
| Land use | 0.080~1.100 | 0.032~0.068 | |
| Atmospheric deposition caused by rural life, livestock breeding and land use (ADAF) | 33% of the total | 6% of the total | |
Table 4.
List of average rainfall in the study area.
| Serial Number | Year | Number of Monitoring Stations | Annual Average Rainfall in the URYR (mm) |
|---|---|---|---|
| 1 | 1991 | 120 | 839.24 |
| 2 | 1992 | 121 | 770.72 |
| 3 | 1993 | 120 | 865.00 |
| 4 | 1994 | 121 | 761.43 |
| 5 | 1995 | 121 | 826.92 |
| 6 | 1996 | 121 | 798.63 |
| 7 | 1997 | 121 | 750.25 |
| 8 | 1998 | 122 | 934.68 |
| 9 | 1999 | 122 | 885.61 |
| 10 | 2000 | 122 | 862.56 |
Table 5.
List of sediment transport ratios in the upper reaches of the Yangtze river.
| Watershed | Jinsha River | Jialing River | Tuo River | Min River | Wu River | Three Gorges Reservoir Area |
|---|---|---|---|---|---|---|
| Average transfer ratio | 0.31 | 0.37 | 0.14 | 0.18 | 0.1 | 0.28 |
© 2019 by the authors. Licensee MDPI, Basel, Switzerland. This article is an open access article distributed under the terms and conditions of the Creative Commons Attribution (CC BY) license (http://creativecommons.org/licenses/by/4.0/).
Share and Cite
MDPI and ACS Style
Ding, X.; Liu, L. Long-Term Effects of Anthropogenic Factors on Nonpoint Source Pollution in the Upper Reaches of the Yangtze River. Sustainability 2019, 11, 2246. https://0-doi-org.brum.beds.ac.uk/10.3390/su11082246
AMA Style
Ding X, Liu L. Long-Term Effects of Anthropogenic Factors on Nonpoint Source Pollution in the Upper Reaches of the Yangtze River. Sustainability. 2019; 11(8):2246. https://0-doi-org.brum.beds.ac.uk/10.3390/su11082246
Chicago/Turabian StyleDing, Xiaowen, and Lin Liu. 2019. "Long-Term Effects of Anthropogenic Factors on Nonpoint Source Pollution in the Upper Reaches of the Yangtze River" Sustainability 11, no. 8: 2246. https://0-doi-org.brum.beds.ac.uk/10.3390/su11082246
Note that from the first issue of 2016, this journal uses article numbers instead of page numbers. See further details here.