Research on the Efficiency of Local Government Health Expenditure in China and Its Spatial Spillover Effect

School of Statistics, Jiangxi University of Finance and Economics, No. 169, East Shuanggang Road, Nanchang 330013, China
*
Author to whom correspondence should be addressed.
Sustainability 2019, 11(9), 2469; https://0-doi-org.brum.beds.ac.uk/10.3390/su11092469
Submission received: 6 March 2019
/
Revised: 21 April 2019
/
Accepted: 22 April 2019
/
Published: 26 April 2019
(This article belongs to the Special Issue Social Public Health System and Sustainability)
Abstract
:The efficiency of the local government health expenditure (GHE) in China determines the level of public health services. However, the local government does not pay much attention to that efficiency, though the scale of local GHE is increasing. In this paper, first, we use the data envelopment analysis (DEA) method to measure the static overall efficiency of the local government health expenditure (GHE) in each region of China from 2007 to 2016. Then, based on the spatial statistical theory, global and local spatial Moran’s I value is utilized to investigate its spatial correlation and spatial agglomeration phenomenon. Finally, the spatial spillover effect (SSE) of the static overall efficiency of local GHE in each region is measured by constructing a spatial Durbin model (SDM). It is demonstrated that there are significant differences in the efficiency of the local GHE between different regions of China. In addition, it is shown that Moran’s I value of the static overall efficiency of the local GHE from 2007 to 2016 is positive. It passed the test of the 5% significance level, indicating that there is a positive spatial correlation between the efficiency of the local GHE and a spatial spillover effect. On the other hand, the decomposition of the SDM reveals that the proportion of GHE to financial expenditure, gross domestic product (GDP) per capita, and population density have a positive effect on the efficiency of the local GHE. Hence, their growth will improve the GHE efficiency in the local region and neighboring regions. In contrast, the proportion of urban population, illiteracy, and fiscal decentralization have a negative effect. Thus, their growth will decrease the GHE efficiency in the local region and neighboring regions. The results are discussed and suggestions are given based on the analysis in this paper. The main contribution of this work is to consider the spatial spillover effect in terms with realistic meaning. The results obtained can be used as a reference for optimizing the structure and improving the efficiency of government health inputs. It breaks the government’s GDP-only theory-based assessment system and helps to improve it by assessing the GHE efficiency.
1. Introduction
For a long time, China has been committed to building an efficient and sustainable social public health system (SPHS). Relevant policies are proposed by the government to improve efficiency and sustainability. Lots of science founding are established to make a substantial contribution to the improvement of public health. In addition, we know that the efficiency of government health expenditure (GHE) and healthcare sustainability can affect each other. However, the current Chinese medical and health services cannot meet the new requirements, that is, the people’s growing demand for healthcare, the high quality of health services, and the wide coverage of the medical insurance. It is also very difficult to achieve the goal of an equal and sustainable healthcare service. Thus, it is important to study the GHE efficiency.
Nowadays, it is difficult and expensive to see a doctor in China, which is an outstanding social issue, and the relationship between doctors and patients is becoming terrible. In this context, the scale and efficiency of the government’s social public health services supply have received much attention in all sectors of our society and they also constitute a hot research topic. On the one hand, it is an important perspective for local governments in exploring the causes of the imbalance in the national wealth and livelihood. On the other hand, local governments’ insufficient input in social public health services or high-input-low-output (HILO) will also affect its supply efficiency. At present, many scholars have empirically analyzed that local governments have a policy bias toward ignoring public service expenditures in the process of fiscal expenditure [1,2]. However, there is little researche on the HILO problem. With the constraint of the relative lack of public service input in China [3], we need to determine how to improve the efficiency of local government’s public service supply, in order to improve the output effect with an equal input, since this plays a decisive role in improving the efficiency of the Chinese public service. In particular, with the increase of local government social public health service input, a slight change in supply efficiency will have a great influence on the achievement of the set goals [4].
In view of this, this paper intends to use the mainstream methods of health economic supply theory and empirical research to analyze the input and output of the government’s social public health service. Then, we measure the government’s health expenditure efficiency in different regions of China, based on the spatial correlated test and spatial panel measurement model. According to the results of the empirical analysis, some suggestions are proposed to help design the government’s new health input mechanism, which can accelerate the construction of a healthy China, improve the national health policy, and deepen the reform of the medical and health system.
2. Literature Review
Since the data envelopment analysis (DEA) method was proposed by Farrell in 1957 [5], and developed by Charnes, Cooper, and Rhodes (CCR) in 1978 [6], the quantitative evaluation theory and empirical research methods of local government social public health service supply efficiency have made great progress in the past 30 years. For example, Afonso and Fernandes (2006) used the DEA two-step analysis method to study the efficiency and influencing factors of local GHEs in Europe and Portugal [7]. Hadad et al. (2013) used the DEA estimation model to estimate the efficiency of the healthcare system and found that, in the Organization for Economic Co-operation and Development (OECD) countries, the number of stable healthcare systems is higher [8]. On the other hand, many Chinese scholars have also conducted some related research. Han and Miao (2010) used the DEA-Tobit two-stage analysis framework to measure the efficiency and influencing factors of GHEs in various provinces or cities in China [9]. Luo (2012) used the DEA-Bootstrap two-stage analysis framework to measure the efficiency of Chinese local fiscal expenditures and their influencing factors [10]. Guan et al. (2014) used the DEA four-stage analysis framework to measure the efficiency of the social public healthcare input in 30 provinces in China and the results show that the provincial social public health expenditure has an annual efficiency loss of 29.5% [11]. Jin and Song (2012) used the DEA and Malmquist productivity index to analyze the differences in government health expenditure efficiency among different regions in China [12]. Thus, in terms of evaluation methods, DEA solves the difficulty by integrating the efficiency of different project units and multiple-input-multiple-output (MIMO), so that it is easy to compare the efficiency values of different projects.
There is no typical academic and practical method to simply measure the supply efficiency of the government public health service. The most important thing to do is explore how to improve the efficiency of government health expenditure. It is found from the existing literature that scholars mainly pay attention to the evaluation of social public health expenditure efficiency, ignoring the research on the efficiency of regional public health expenditure. However, the level of economic and social development among different regions is obviously different. We need to consider the regional disparities in the calculation of the expenditure efficiency of different regions. In 2009, as a Chinese policy goal, the improvement of the utilization of health resources in the new healthcare reform was clearly proposed. Nowadays, with the increasing convenience of social transportation, the sharing of health resources among different regions is more convenient and the spatial nature of medical and health services is more obvious. This makes it more practical to study the efficiency of healthcare utilization and we can propose some policy suggestions to improve government supply efficiency based on this study.
Some scholars have studied the spatiality of government health expenditures and most studies show that the allocation of health resources in China is spatial. Wang et al. (2015) pointed out that the efficiency of health resources is a multi-dimensional and comprehensive problem closely related to factors, such as the economy, population, and regional development [13]. At the same time, the combination of traditional statistical methods and spatial statistical methods can better reveal the advantages and disadvantages of the health field, with a spatial distribution [13]. Han et al. (2016) believed that the total allocation of health resources in Chinese provinces or cities is basically consistent with the economic development of the regions [14]. Gu (2014) pointed out that when we study the allocation of health support areas, we should not only investigate the characteristics and needs of local areas, but also consider the influence of neighboring areas [15].
On the one hand, many scholars have conducted research on the output indicators in studying the efficiency of GHE. Retzlaff-Roberts (2004) [16] and Hadad et al. (2013) [8] selected life expectancy and infant mortality (survival) as output indicators. Liu et al. (2014) [17] selected the number of health institutions, health personnel and beds as intermediate output indicators. The number of outpatients and inpatients, emergency mortality, and observation room mortality were considered as final output indicators. Xiao al. (2014) [18] selected maternal mortality and infant mortality as output indicators.
On the other hand, scholars have conducted a lot of research on the factors affecting the efficiency of GHE. Most research starts from the economic, social, and political factors. For example, Tu (2012) pointed out that the factors that have a great impact on hospital efficiency include the fiscal decentralization, proportion of GHE, urbanization level, density of medical institutions, and medical technology level. Among them, only the fiscal decentralization, proportion of GHE, and medical technology level were considered to be the major factors affecting the efficiency of primary healthcare institutions [19]. Li and Wang (2015) conducted a study on the efficiency of local GHEs. The results showed that there were obvious regional differences in the efficiency of local GHEs during the sample period. The main factors affecting efficiency include the fiscal decentralization, household registration system, healthcare reform, urbanization level, economic development level, population density, and education level [20].
Among the existing research, many scholars have conducted fruitful research on the efficiency of GHE. Relevant research has a strong reference effect in the improvement of the supply efficiency of local governments’ public health services in China. However, the characteristics of social public health services make it difficult to measure local governments’ supply. Thus, it has not yet formed a comprehensive, consistent, and general evaluation system, methods, indicators, and research conclusions. In addition, the existing literature has the following limitations:
First, the discussion on the efficiency of GHE in the existing literature is relatively simple, if the low efficiency, caused by the uneven allocation of health resources, is not considered.
Secondly, due to the difficulty associated with accurately evaluating government health inputs and outputs, most scholars choose life expectancy and child mortality as output variables in studying the efficiency of GHE. However, health resources, such as the number of institutional beds and technicians, are the most direct outputs of GHE.
Finally, the spillover effect of health resource utilization efficiency has not been considered in the existing literature in studying the efficiency of GHE. Therefore, due to the special nature of public health services, there are still no comprehensive, consistent, general evaluation systems, methods, indicators, and research conclusions, though many scholars have conducted a lot of research on the efficiency of GHE.
3. Methods and Materials
3.1. Study Settings and Potential Data Sources
The research object of this paper was 31 provinces, municipalities directly under the central government and autonomous regions in China. The relevant indicator data of each region from 2007 to 2016 were obtained from the China Statistical Yearbook [21], China Health Statistical Yearbook [22] and China Financial Yearbook [23]. The geographical distance between provincial capitals and cities in different regions was drawn from Wikipedia.
3.2. Variable Selection
3.2.1. Input Variable Selection
In this paper, the local GHE in 31 provinces (municipalities, autonomous regions) of China were selected as the sole input variable. Considering the comparability of the economy and data, Hong Kong, Macao, and Taiwan were not included in the calculation.
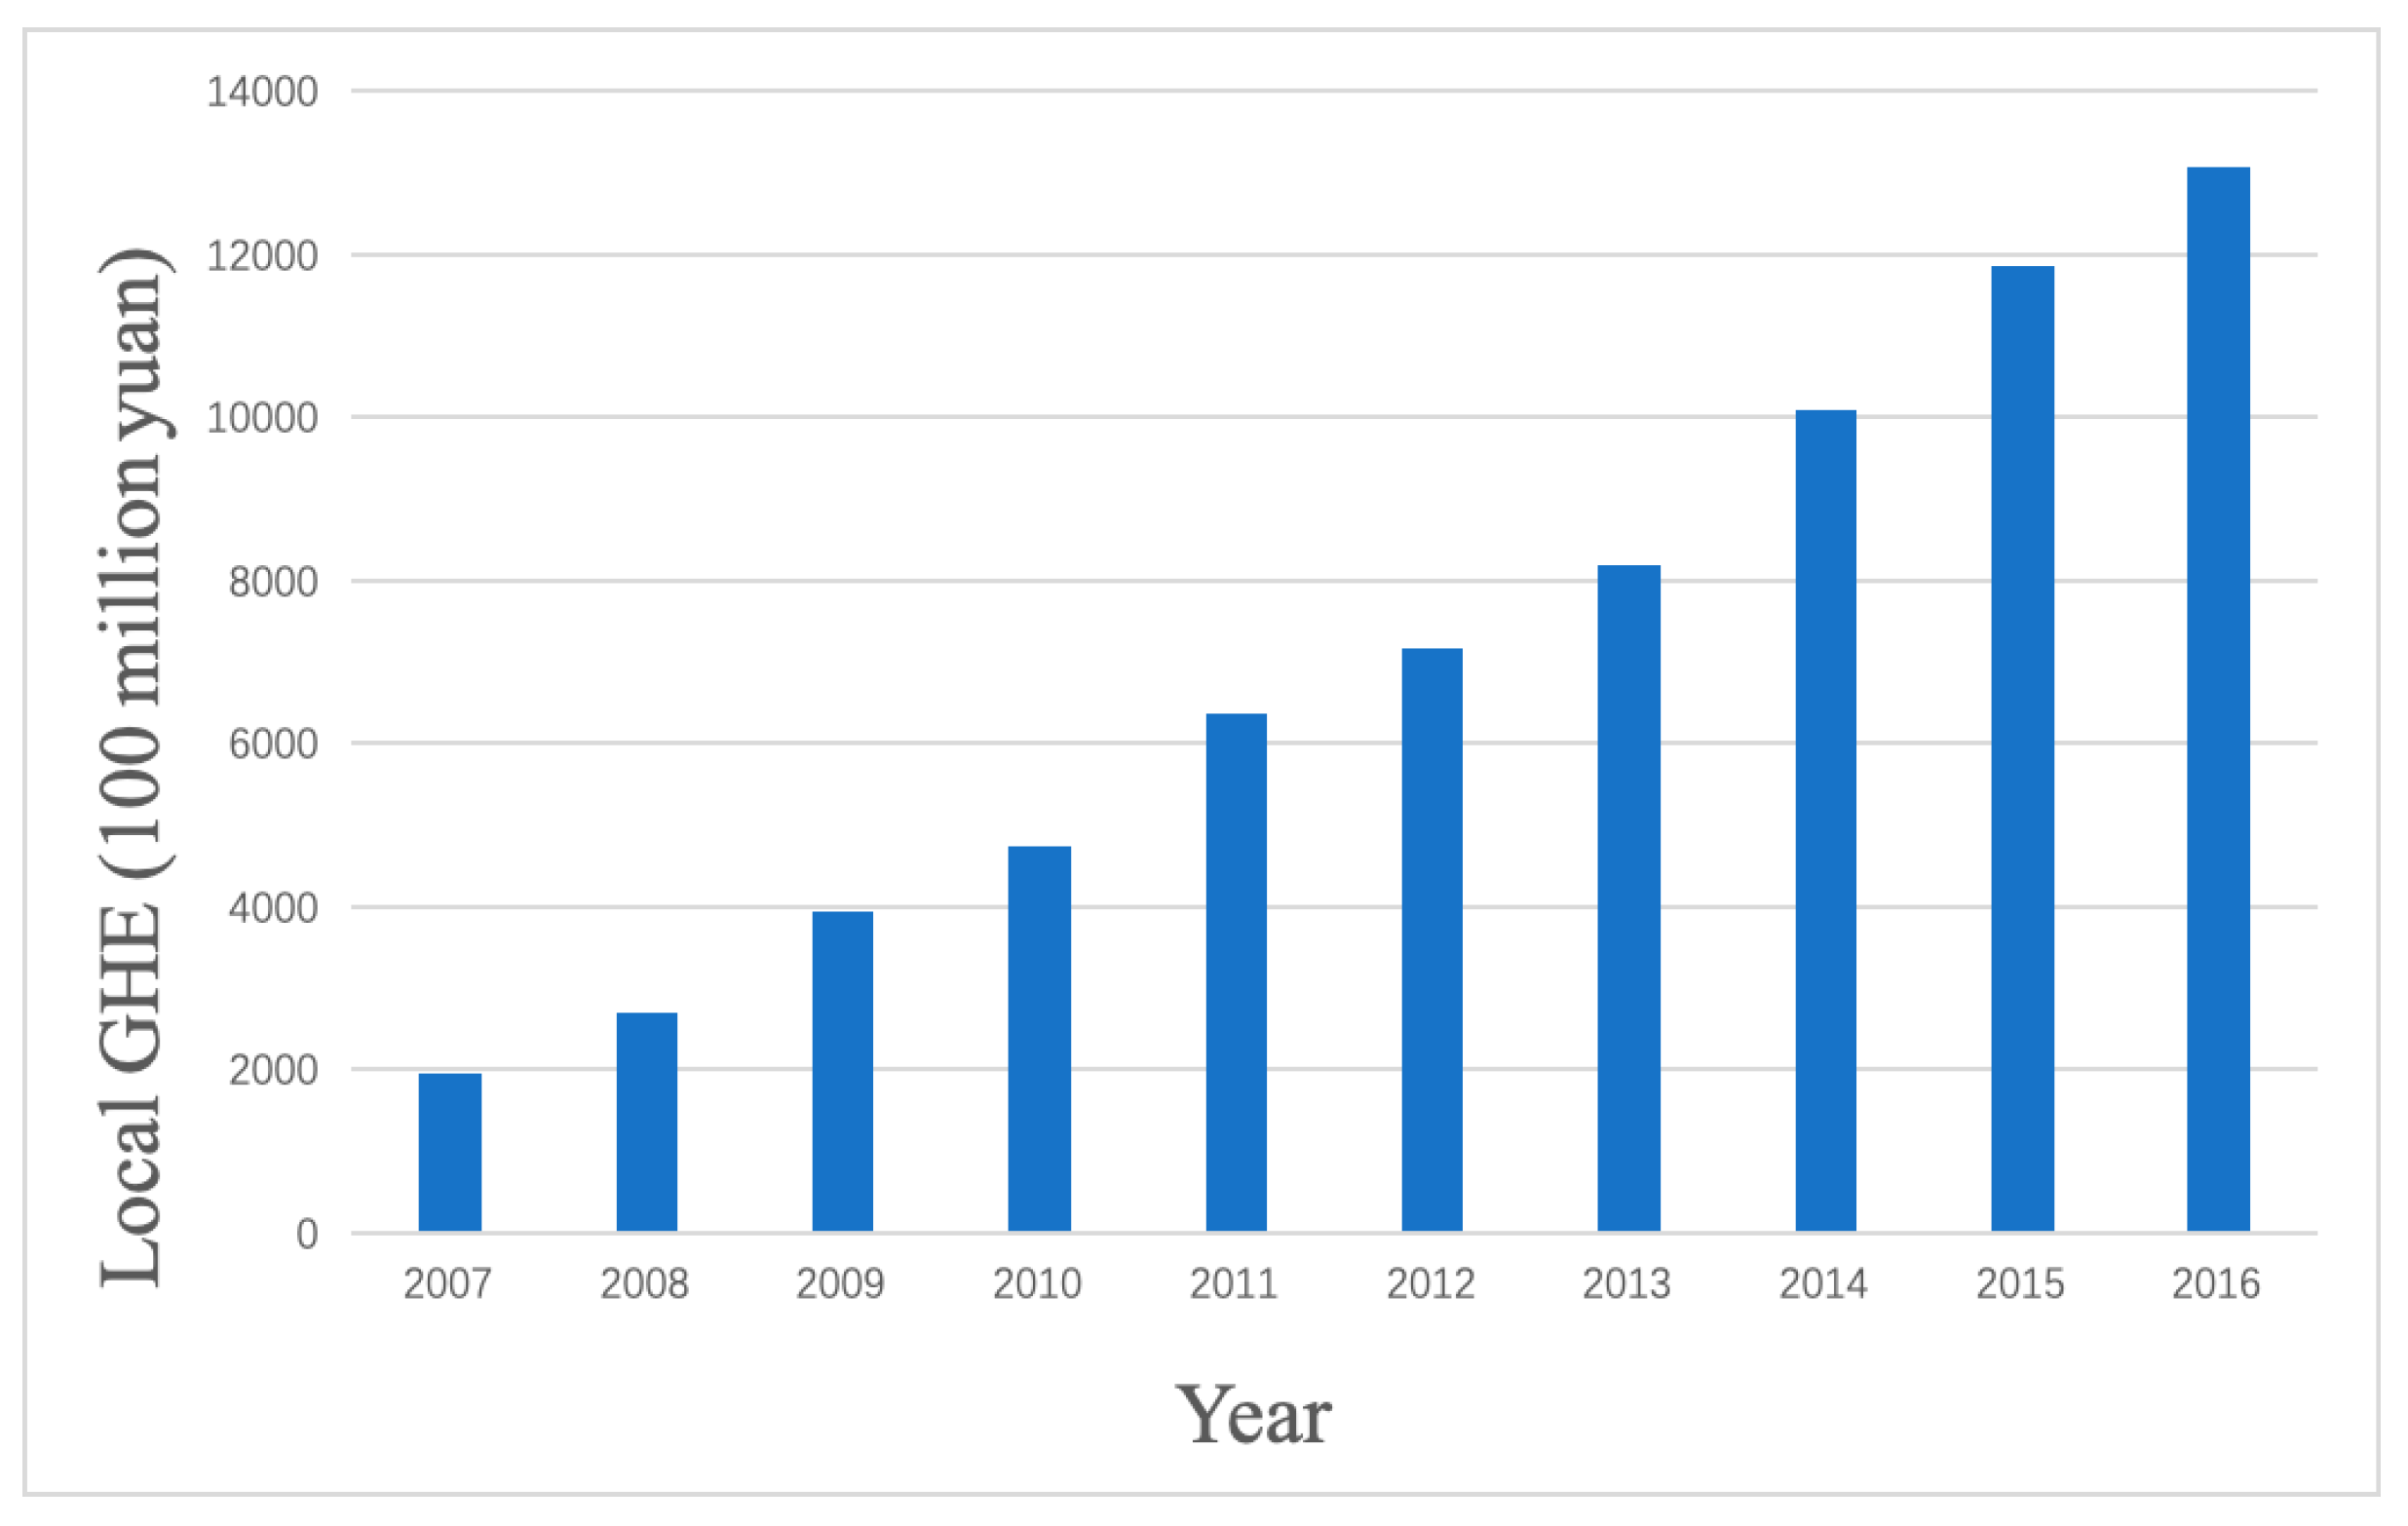
Figure 1 shows the local GHE in China from 2007 to 2016. From Figure 1, it can be seen that the local GHE in China had a rapid growth trend, from 199.58 billion Chinese yuan in 2007 to 1306.76 billion Chinese yuan in 2016, with a 650% increase. Among them, the largest absolute growth was in 2014, up 188.34 billion Chinese yuan from 2013. While the local government has increased health expenditure year by year, the problems in China, including it being difficult and expensive to see a doctor, are still serious. In addition, we often need to consider the spatial correlation when there is spatial distribution in the economic subjects, however, the traditional econometric models often neglect spatial correlation because of the irrelevance in the regional data. Spatial econometrics, as a branch of econometrics, incorporates the spatial weight matrix into the regression model, which is widely used in regional science, urban economics, geoeconomics, and development economics. Spatial econometrics studies how to deal with spatial heterogeneity (spatial structure) and spatial correlation (spatial interaction) in regression models. This paper will measure the efficiency of the local GHE and its spatial spillover effect. The selection of output and influencing factor variables are given as follows.
3.2.2. Output and Influencing Factor Variables Selection
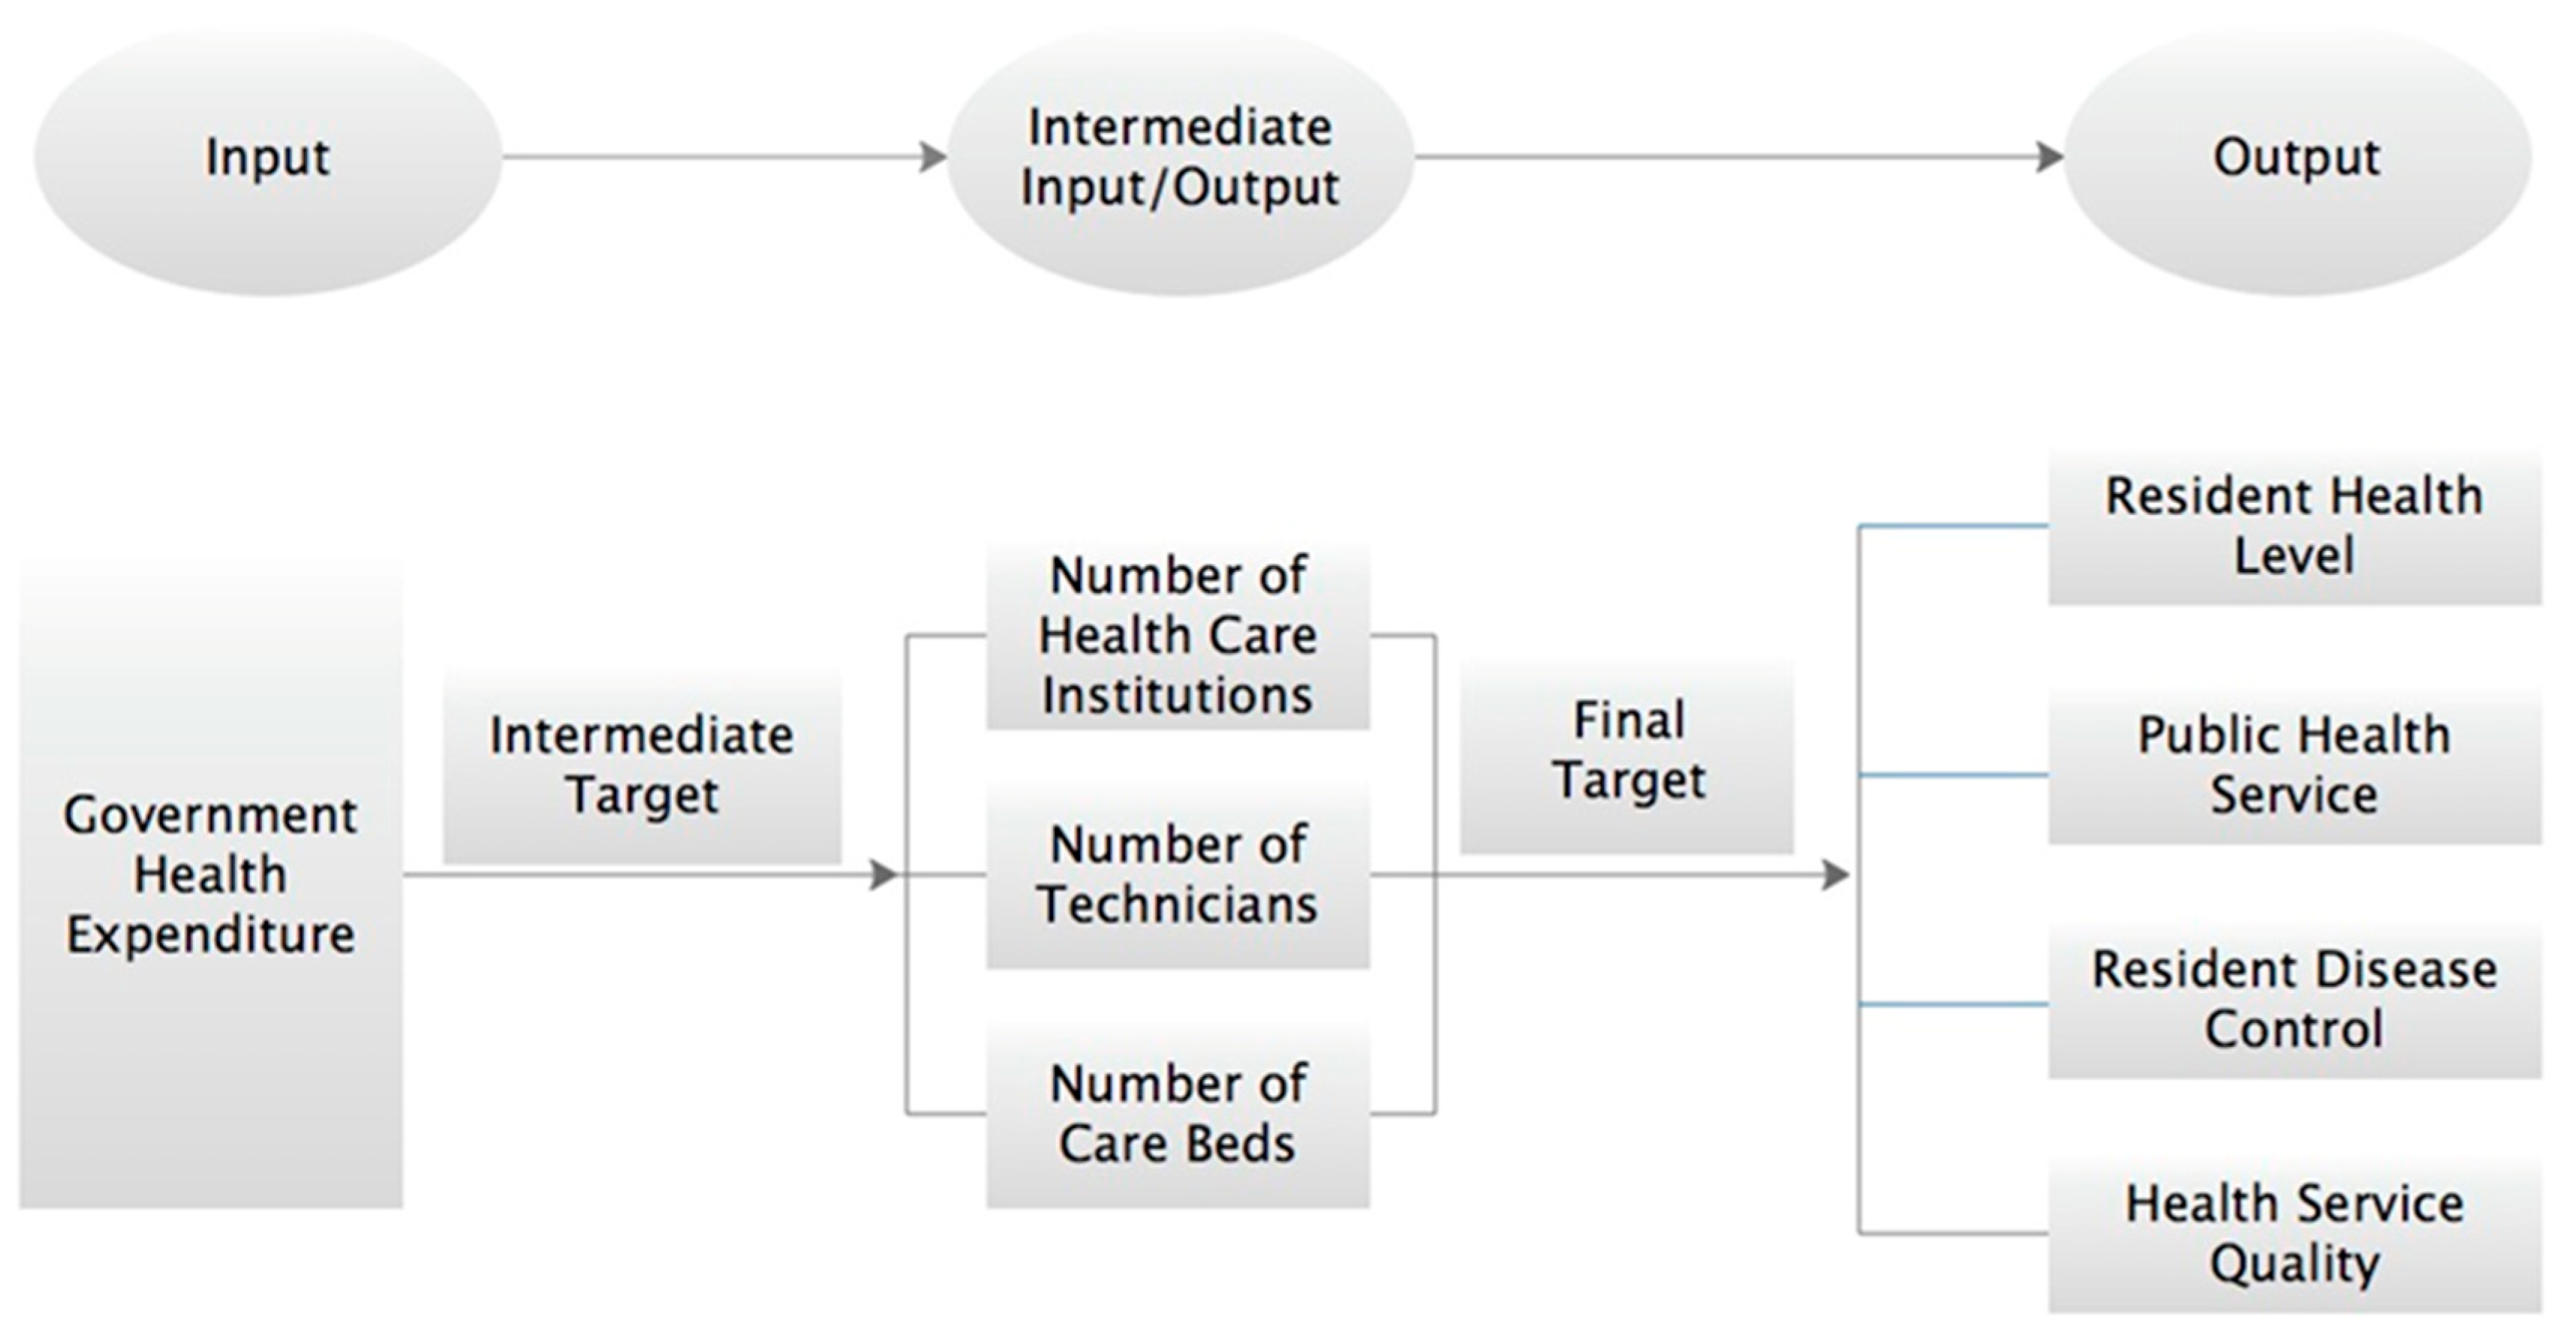
The basic goal of GHE is to achieve the optimal supply of public health services under the condition of limited health resources in order to obtain the maximum health output. From this point of view, we can divide the target of GHE into an intermediate target and a final target (see Figure 2).
Therefore, according to the final goal of the local GHE, this paper chooses the following seven indicators to show the inputs and outputs of local governments in the field of health services: (1) Severe malnutrition rate among children under five years old and the mortality rate, reflecting the health level of residents; (2) the number of outpatient visits and the medical expenses per capita of outpatients and inpatients, reflecting public health services; (3) infectious disease incidence rate of Class A and B statutory reports and infectious disease mortality rate, reflecting the residents’ diseases control; and (4) hospital bed utilization rate, reflecting the quality of healthcare services. The output of local government public health services from 2007 to 2016 is shown in Table 1.
Based on the existing research results, this paper will consider the urban and rural, cultural, economic, and demographic factors, which may have an important impact on the spatial spillover effect of the local GHE efficiency. Therefore, the proportion of urban population, illiteracy rate, the GHE accounting for the proportion of fiscal expenditure, gross domestic product (GDP) per capita, fiscal decentralization, and population density are selected as explanatory variables, which are shown in detail in Table 2.
3.3. Method
3.3.1. DEA Method
The DEA method, occasionally called frontier analysis, was developed by Charnes, Cooper, and Rhodes (CCR) in 1978 [6]. DEA models are classified into the model of Banker, Charnes, and Cooper (BCC) [24] and the CCR model. The BCC model is an output-oriented model and the CCR model is an input-oriented model. This paper chooses the output-oriented BCC model to study the efficiency of the local GHE. The specific model is shown as follows.
Assuming that the DEA model has J decision-making units (DMUs), , each DMU has M input items, , and N output items, . Thus, the overall efficiency of -th DMU can be obtained from the following linear programming.
where is the desired overall efficiency and and are the weights for the outputs and inputs, respectively.
The purpose of this paper is to study the input of local governments in the field of public health services and to maximize the output of medical and health services with a certain amount of scale of health resources. Thus, this paper chooses the BCC model to calculate the efficiency of the local GHE in China. Furthermore, with the increasing convenience of social transportation and the more convenient sharing of health resources among different regions, the spatial spillover effect of public health services in different regions will be more obvious. In view of this, we continue to explore the temporal and spatial correlation and evolution trend of the local GHE efficiency in order to obtain a deeper understanding of the efficiency of the local GHE in China, which has great significance for optimizing the results of financial expenditure and improving the GHE efficiency.
3.3.2. Spatial Econometric Model Method
(1) Morland Index
The First Law of Geography asserts that everything is related and the closer the things are, the higher the degree of correlation will be [25]. We record the geospatial data of n regions as , where i and j represent region i and region j, respectively. The distance between region i and region j is recorded as , which can be defined as a spatial weight matrix as follows.
where the elements on the principal diagonal are equal to 0, i.e., (the distance of the same region is expressed as 0). It should be noted that the commonly used spatial weight matrix is the spatial adjacent weight matrix, which can be expressed as follows:
As we know, the spatial measurement method can be used when there is spatial correlation among the data. If there is no spatial correlation, the general measurement method is used. “Spatial autocorrelation” means that regions have similar values of variables to other similar regions. Spatial autocorrelation can be divided into positive spatial correlation and negative spatial correlation. The most widely used method to measure spatial correlation is the Moran index, which is given as follows.
where is the sample variance and is the sum of all spatial weight matrixes.
The value range of the Moran index is [−1,1]. If the Moran index I is greater than 0, there is a positive spatial correlation among different regions. If I is less than 0, there is a negative spatial correlation. If I is close to 0, the correlation among different regions is weak. The Moran index can be decomposed into the global Moran index and the local Moran index. The global Moran index represents the overall correlation, while the local Moran index decomposes the Moran index of each region in a certain year, which indicates a clustering phenomenon in this region. The Moran index can be regarded as the correlation coefficient between the observed value and its spatial lag.
The global Moran index is decomposed to obtain the Moran index value of each sample individual. The spatial dependence of each sample individual and its adjacent individual can be judged by plotting the value of each sample individual and its spatial adjacent individual as a scatter plot. Generally, four quadrants are obtained using scatter plots of the local Moran index. Each quadrant corresponds to a spatial structure, representing a set of special relationships between the value of individual variables and the mean value of adjacent individual variables, and each sample individual is grouped into a quadrant. Specifically, the value of individual variables in the first quadrant is high (H) and that of adjacent individuals is also high (H) and is expressed as HH, which is a common spatial expression pattern of a high-high cluster. The value of individual variables in the third quadrant is low (L), and the value of variables in adjacent individuals is low (L) and expressed by LL, which is a typical low-low cluster. The number of individuals in the second quadrant and the fourth quadrant is relatively small, where the value of individual variables is low, with high-value neighboring individual variables, and the value of individual variables is high, with low-value neighboring individual variables; this can be expressed by the LH and HL clusters, respectively. Furthermore, positive spatial correlation refers to the high-high or low-low cluster, while negative spatial correlation refers to the high-low or low-high cluster. There is no spatial correlation among the HL or LH cluster regions with random distribution. In this way, we can find the identity of the population and economic clusters in China by identifying the Chinese provinces using the HH and LL characteristics and the local Moran index.
(2) Spatial Econometric Model
➢ Model Selection
First, the spatial autoregressive model of the panel should be examined. The specific formula is as follows.
where is the i-th row of the spatial weight matrix W, , is the (i, j)-th element of the spatial weight matrix W, and is the individual effect of region i. If is related to , it is a fixed effects model; otherwise, it is a random effects model. The usual Hausman test can be used to determine whether a fixed-effect or a random-effect model should be used and it is shown as follows.
where is the first-order lag of the interpreted variable , is the spatial lag of the explanatory variable, is the i-th row of the corresponding spatial weight matrix D, is the time effect, and is the i-th row of the disturbance item space weight matrix M. The following items explain how to distinguish the spatial autoregressive models [26].
- (a)
- If , it is a Spatial Durbin Model (SDM);
- (b)
- If and , it is a Spatial Autoregression Model (SAR);
- (c)
- If and , it is a Spatial Autocorrelation Model (SAC);
- (d)
- If and , it is a Spatial Error Model (SEM).
➢ Decomposition Mechanism of the Special Spillover Effect
The spatial Durbin model can decompose the explanatory variable-spillover effect using the partial differential method proposed by LeSage and Pace in 2009 [27], considering the total, direct, and indirect effects. Among them, the direct effect is the influence on the local region caused by the explanatory variables, while the indirect effect is the influence on the result of the explanatory variables in the neighboring regions. The specific calculation method is given as follows.
which can be rewritten as
where we have , and is an n-order identity matrix. In addition, the above equation can be converted into a matrix form, shown as
Thus, the total, direct, and indirect effects are obtained as
4. Results
4.1. Efficiency Analysis of Local Government Health Expenditure
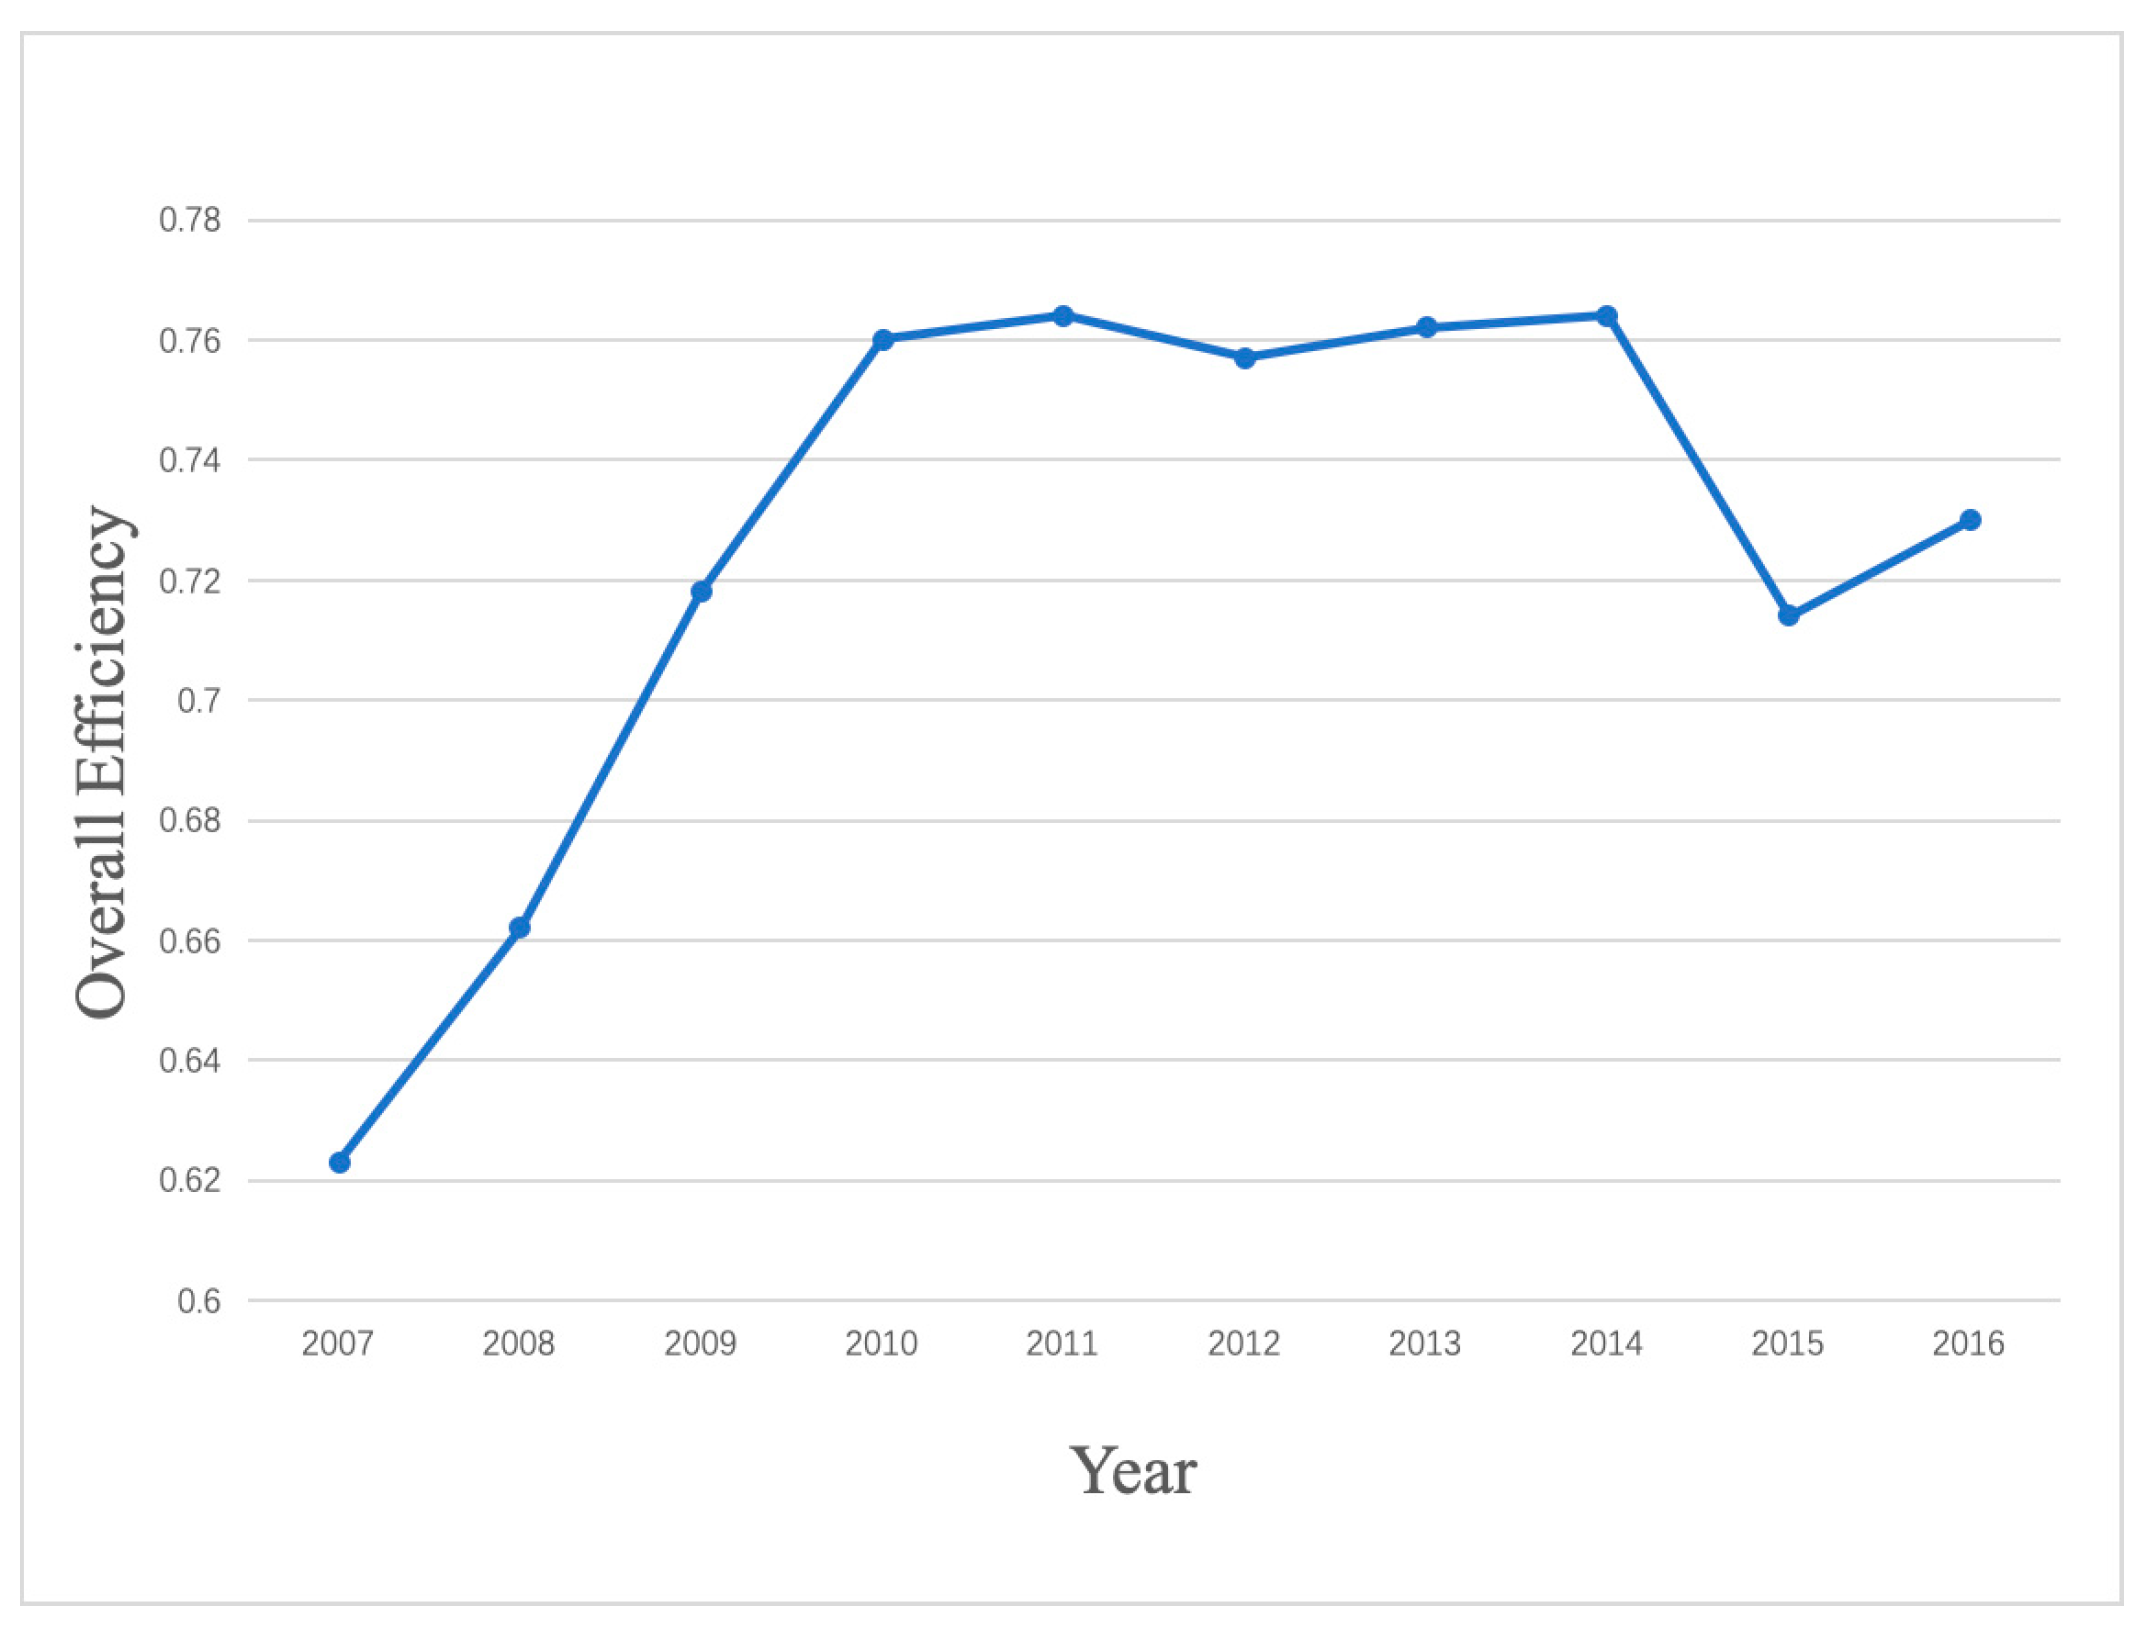
In this paper, we used the output-oriented BCC model and Deap 2.1 software to process the input and output data in order to obtain the efficiency of the local GHE from 2007 to 2016. The results are shown in Figure 3.
Figure 3 shows the changing trend of the static overall GHE efficiency of 31 regions from 2007 to 2016. During these 10 years, it can be seen that the overall efficiency increased from 0.62 to 0.73.
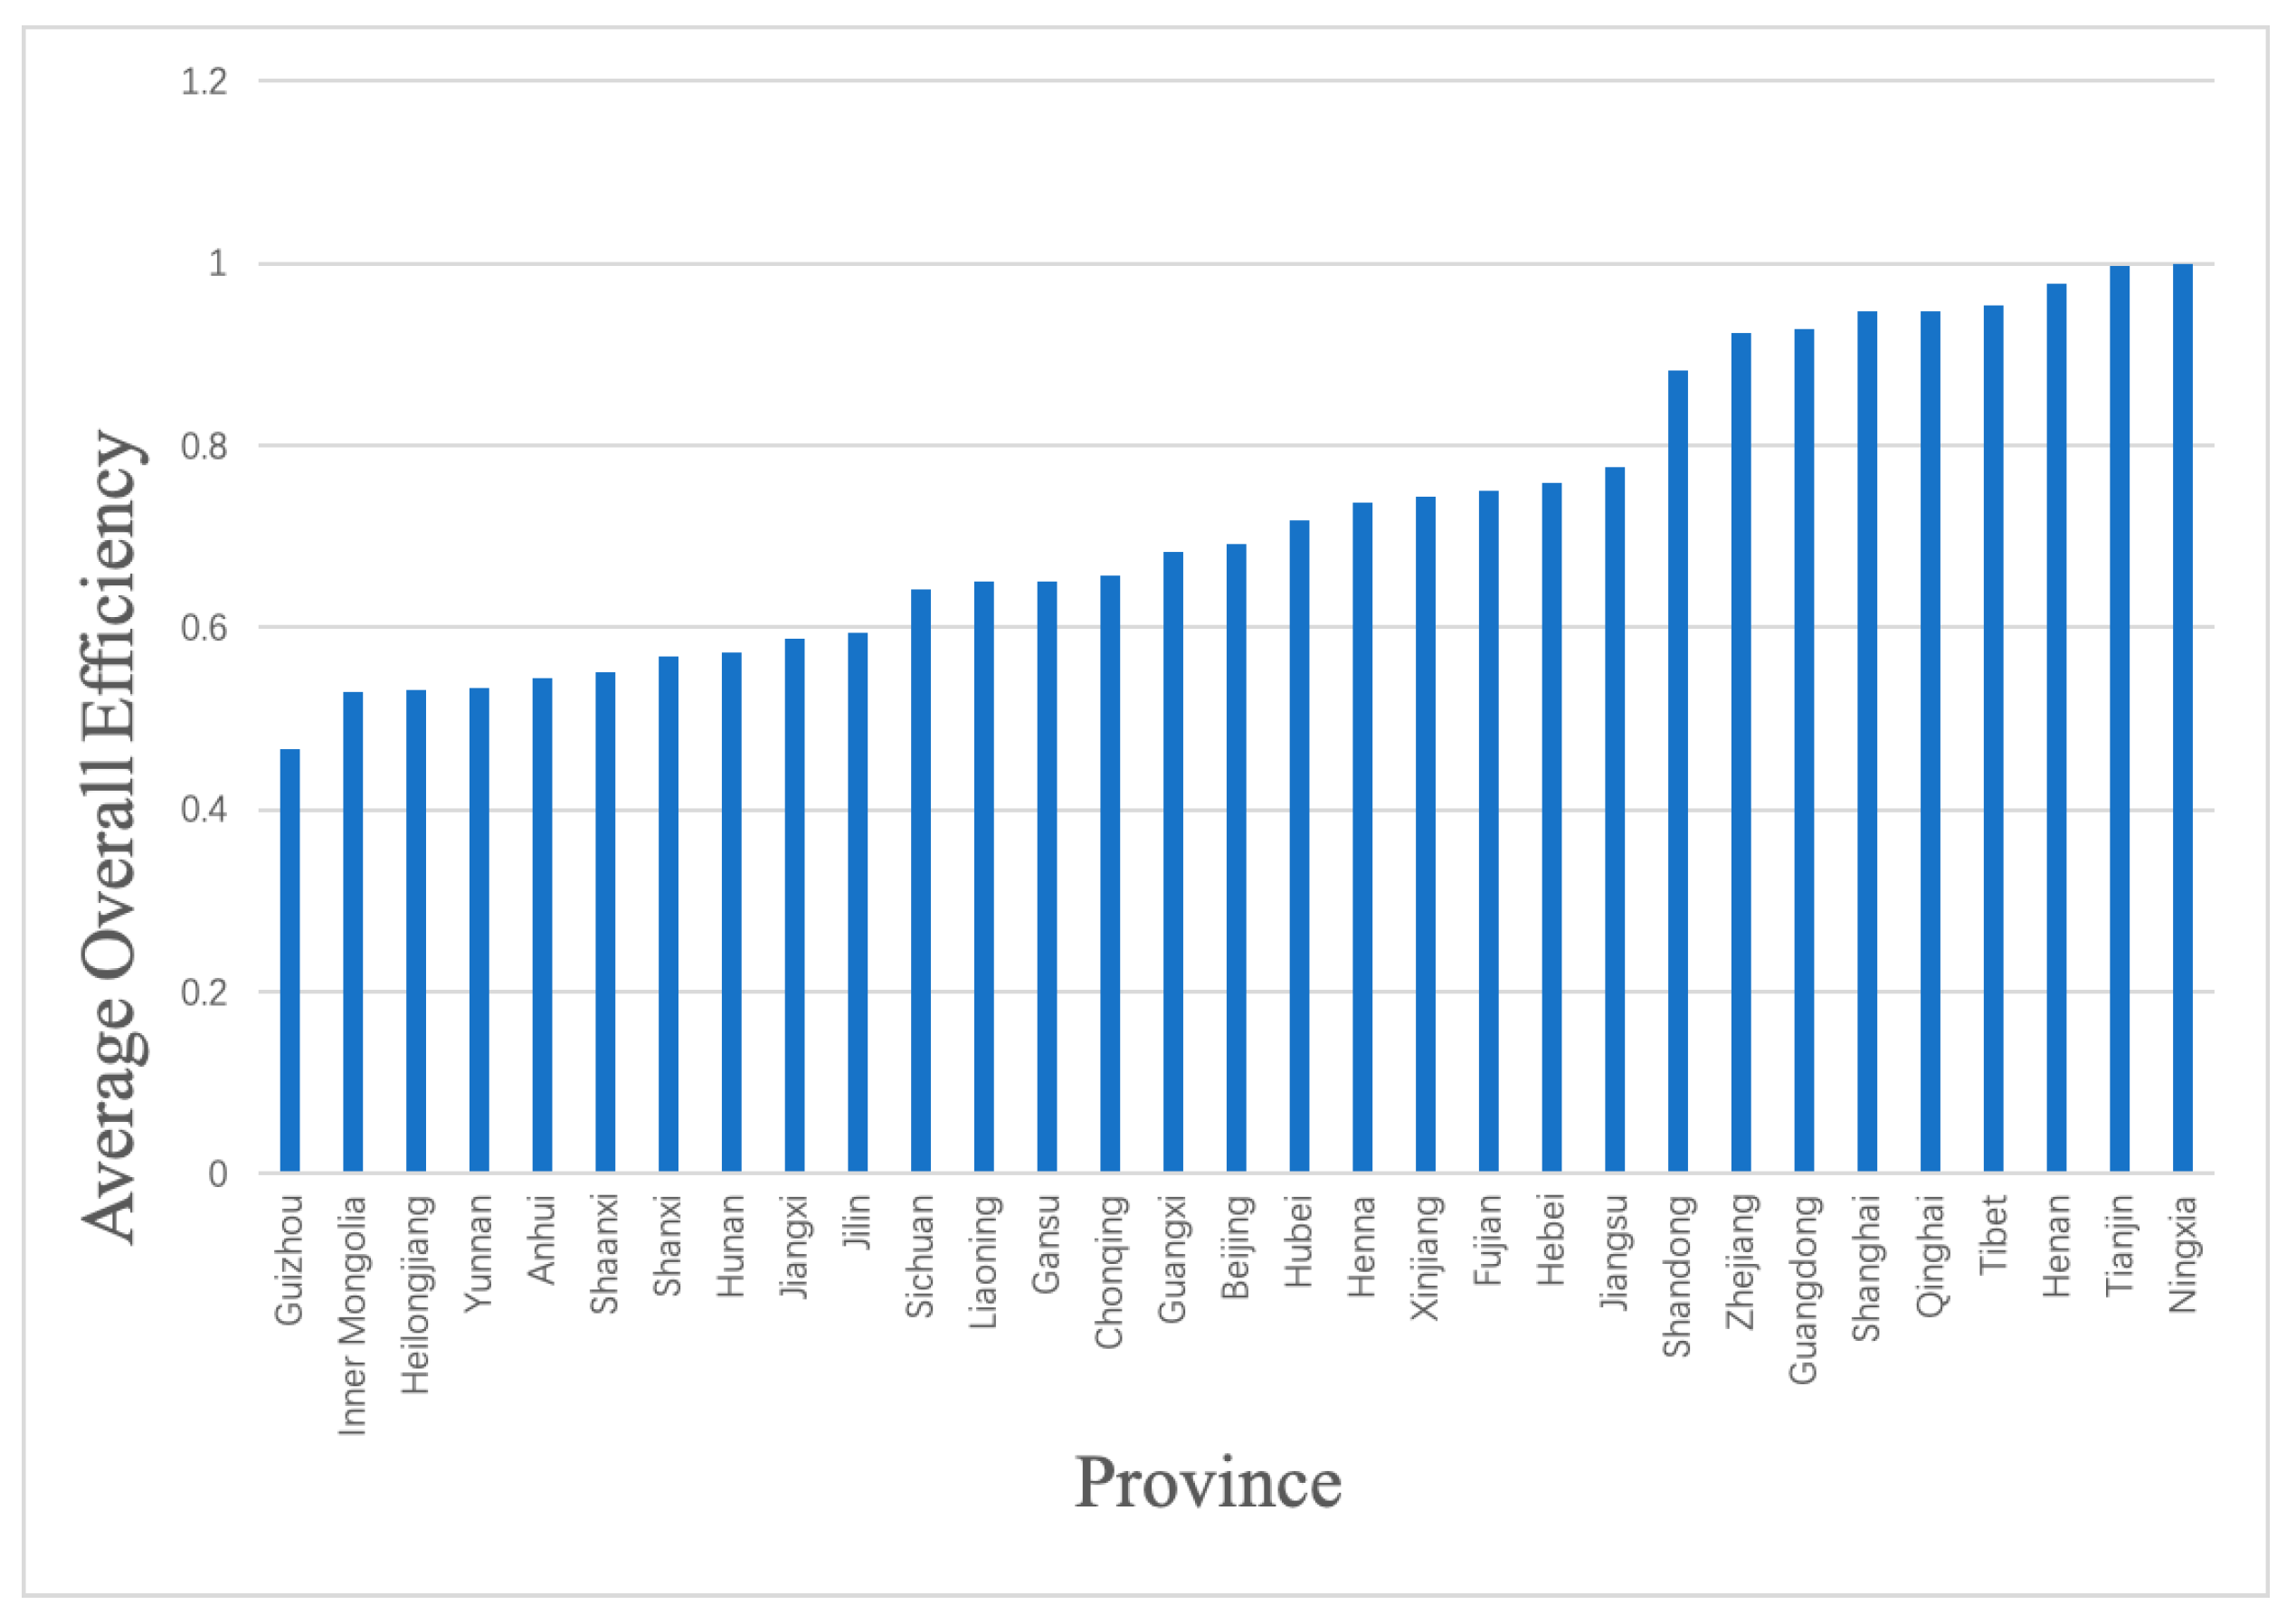
As shown in Figure 4, we used the average overall efficiency of the local GHE from 2007 to 2016 as a representative to analyze the differences in the total efficiencies among different regions. From Figure 4, we can see that the lowest overall efficiency is in Guizhou and the highest is in Ningxia. Among them, the overall efficiencies of 22 regions are under 0.8, for example, in Guizhou, Inner Mongolia, and Heilongjiang. There are nine regions whose overall efficiencies are greater than 0.9. Furthermore, it is not difficult to see that the overall efficiencies of the eastern region are generally higher, while those of the northeast and central regions are generally lower.
4.2. Spatial Spillover Effect Analysis of Local Government Health Expenditure
4.2.1. Global Moran Index Calculation
The efficiency of GHE is a multi-dimensional and comprehensive problem closely related to factors such as the economy, culture, population, and regional development. Moreover, factors such as economic development, population cluster, and other factors in neighboring regions may also have an impact on the efficiency of the local GHE. Therefore, theoretically speaking, the efficiency of the local GHE has spatial correlation. In order to verify this hypothesis, this paper used the Moran index.
In this paper, we used Stata software to test the global spatial autocorrelation of the static overall efficiency of the local GHE from 2007 to 2016. The results are shown in the following Table 3.
Table 3 shows that the Moran’s I value of the static overall efficiency of the local GHE from 2007 to 2016 is positive. Moreover, from the test of the 5% significance level, the efficiency of the local GHE is shown to have a positive spatial correlation in the past 10 years, that is, the efficiency of local GHE is spatial agglomeration. At the same time, we can see from the changing trend of the Moran’s I value that the spatial correlation degree of the Chinese local GHE became stronger and stronger from 2007 to 2014 and slightly declined from 2015 to 2016.
4.2.2. Local Moran Index Calculation
The results of the global Moran index show that the efficiency of the local GHE has a positive spatial correlation from 2007 to 2016. However, it cannot reveal which regions are in high-cluster areas or low-cluster areas. In view of this, this paper chose the three years when China completed five key tasks of deepening the reform of medical and health systems from 2009 to 2011. We used Stata software to calculate the local Moran index of the local GHE efficiency, in order to further show whether there was a local spatial agglomeration phenomenon for the efficiency of the local GHE. In this paper, Arcmap 10.2 software was used to describe the distribution of Moran scatter plots. The results are shown in the following figures.
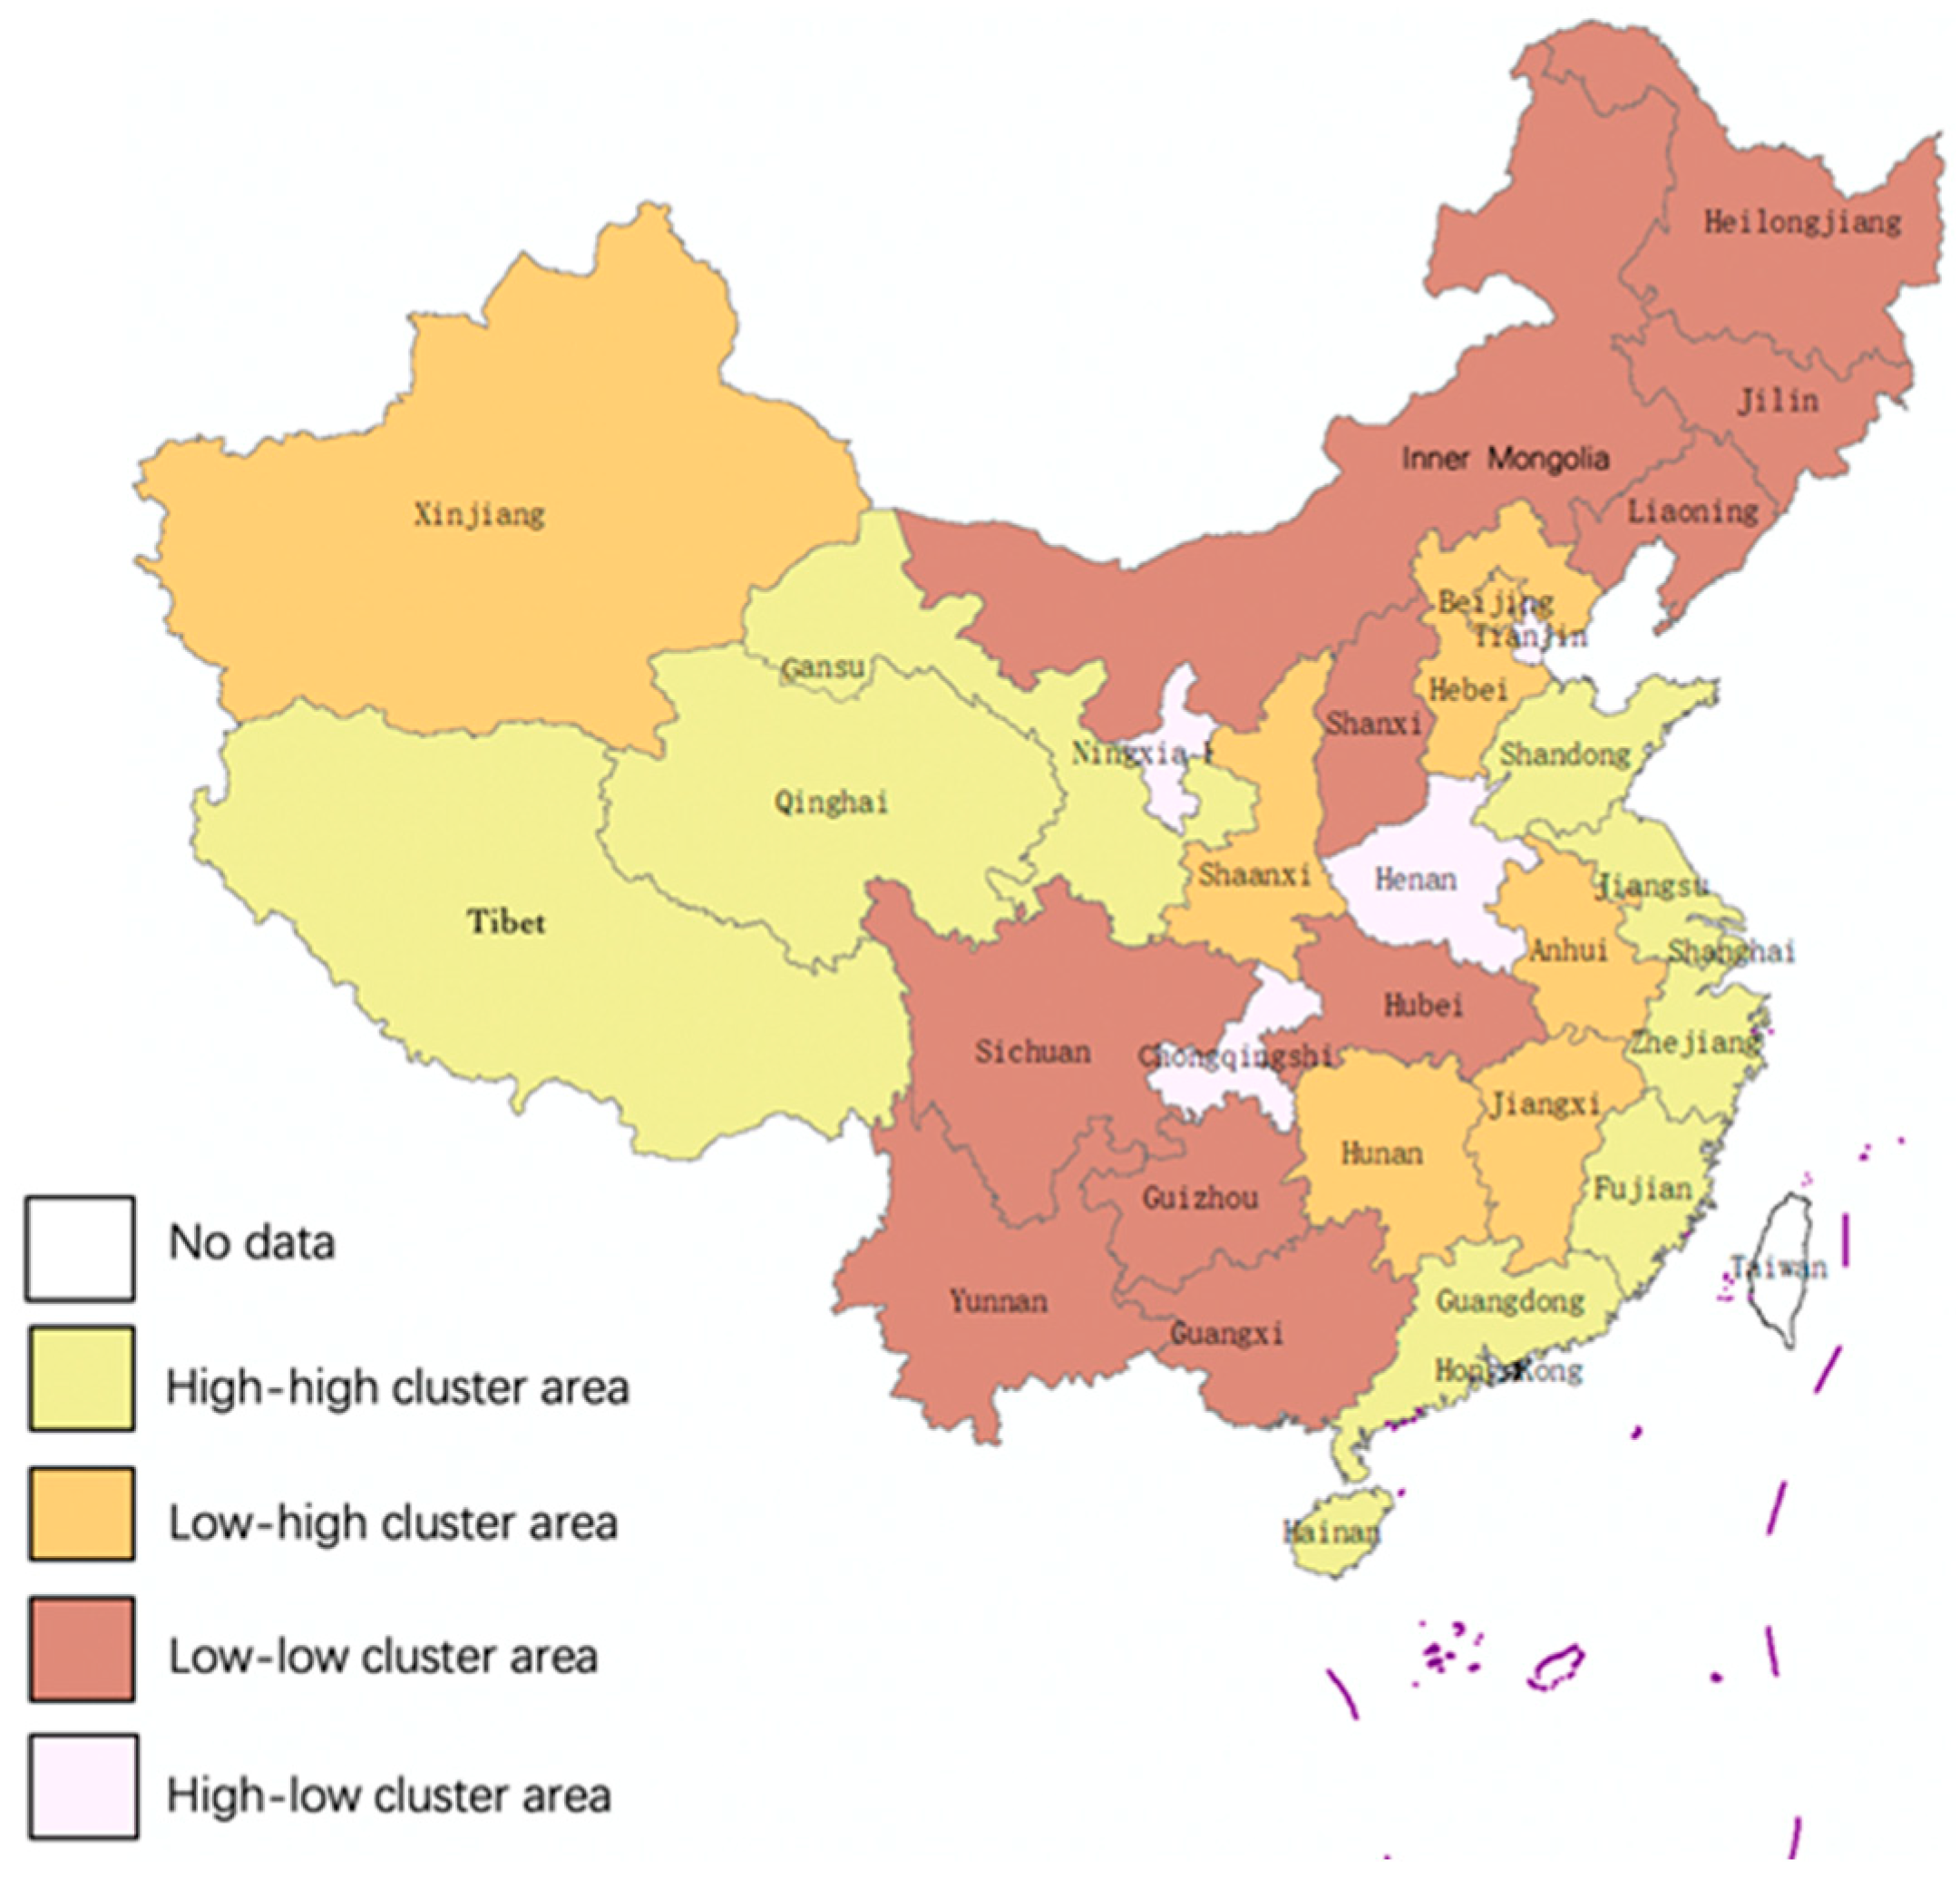
Figure 5, Figure 6 and Figure 7 show that the positive spatial correlation regions are mainly concentrated in the northeastern, eastern, and western regions of China. Among them, the low-low cluster areas are mainly concentrated in Inner Mongolia, Liaoning, Jilin, and Heilongjiang in Northeastern China and Sichuan, Yunnan, Chongqing, Guizhou, Guangxi, etc. in Western China, belong to the low GHE efficiency regions. The high-high cluster areas, mainly concentrated in Beijing, Jiangsu, Shanghai, Zhejiang, etc. in Eastern China and Tibet and Qinghai in Western China, belong to the high GHE efficiency regions. Henan had a negative spatial correlation agglomeration in the past three years, showing high-low clustering phenomenon, which indicates that the GHE efficiency of its neighboring region is very low.
4.2.3. Spatial Econometric Model Analysis
After verifying the spatial correlation of Chinese local GHE efficiency, we built a spatial panel econometric model to further analyze the impact of the proportion of urban population, illiteracy rate, the proportion of government health expenditure to fiscal expenditure, GDP per capita, and population density on the efficiency of the local GHE.
In this paper, the idea in [28] was used as a reference in choosing a spatial model, that is, an SDM model without any constraints was firstly estimated and then whether the SDM model can be simplified was tested. According to Equation (6), the SDM model estimation was first selected, then we processed the data using Stata software. Finally, Wald and likelihood ratio (LR) tests [29] were carried out to verify whether the SAR model and SEM model were nested in the SDM model. The results are shown in Table 4.
From Table 4, the results of Wald and LR tests show that the hypothesis of and or and is negated. The SAC model and SDM model were further tested to see which was more suitable. The results showed that the absolute values of the Akaike information criterion (AIC) and Bayesian information criterion (BIC) of the SDM model were less than those of the SAC model, so the SDM model was more suitable for this paper. The Hausman test of the SDM model had a p-value of 0.000 < 0.05, which indicated that the random effect model hypothesis was rejected at the 5% significance level. Therefore, the fixed effect model of SDM was more suitable.
On the other hand, we can see that the spatial lag coefficient (rho) of explanatory variables is not significantly zero according to the estimation results of SDM. LeSage and Pace (2009) proposed that there will be systematic errors in measuring the spillover effect using the coefficient of SDM when the spatial lag term coefficient of the explanatory variables is not significantly zero [27]. In this case, the spatial effect of SDM should be further decomposed to accurately reflect the direction and extent of the impact of each explanatory variable on the GHE efficiency in the local and neighboring regions [27]. In view of this, this paper decomposed the SDM to obtain the total, direct, and indirect effects of each explanatory variable, as shown in Table 5.
From Table 5, we can see that the total, direct, and indirect effects of the proportion of the urban population are significantly negative among the factors affecting the local GHE efficiency. It is also shown that, with the increase of the proportion of the urban population, both the local and neighboring GHE efficiencies decrease. The reason is that, with the increase of the urbanization proportion, people’s healthcare needs increase correspondingly. However, with the increasingly convenient transportation and health services, people choose much more developed regions or countries for their healthcare service, which leads to a decline in the GHE efficiency.
The total, direct, and indirect effects of the illiteracy rate are all negative, but the direct and indirect effects have not passed the significant level test. This shows that the increase of the illiteracy rate will lead to a decrease of the local GHE efficiency, but the influence of spatial decomposition effect on the local and neighboring regions is very small. This may be due to the lower cultural quality of residents, because they know less about the transmission and prevention of some common diseases and are more likely to get sick. Moreover, the lower the education level of residents, the more difficult it will be to communicate with hospitals, ask for medical and health services, choose the right medical institutions, and obtain accurate healthcare information when they are sick. In addition, it will have some influence on people’s awareness of the need to cooperate with the government’s healthcare supervision, which will also decrease GHE efficiency.
The total and direct effects of the proportion of GHE to fiscal expenditure are significantly positive, while the indirect effects are negative and do not pass the significant level test. This shows that the increase of the proportion of GHE to fiscal expenditure will have a positive impact on the local GHE efficiency. The greater local governments’ input in the field of healthcare, the higher the GHE efficiency will be. The reason is that, with the increase of local government input in the field of healthcare, it will be possible to provide better health services and thus improve the GHE efficiency.
The total, direct, and indirect effects of GDP per capita are all significantly positive, which indicates that the improvement of GDP per capita will improve the local GHE efficiency. This influence is reflected not only in improving the local GHE efficiency, but also the significant promotion effect on neighboring regions. This can be explained by the fact that residents in rich regions have a higher demand for high-quality health services, which may put more pressure on local governments to improve their health expenditure efficiency by increasing the health service level.
The total effect of fiscal decentralization is negative and has passed the significance level test, while the direct and indirect effects are negative but not significant. This indicates that the greater the degree of fiscal decentralization, the less the local GHE efficiency will be improved. This may be due to government competition caused by fiscal decentralization, which may lead to an inadequate provision of public goods by local governments and the reduction of the GHE scale, decreasing the efficiency of health expenditure.
The total, direct, and indirect effects of the population density are all significantly positive. The higher the population density, the higher the GHE efficiency. We believe that a higher population density can reduce the cost of government management and supervision and thus help to improve the GHE efficiency.
5. Discussion
In this paper, after using the DEA, spatial Moran’s I value, and SDM model to measure the GHE efficiency and its spatial spillover effect from 2007 to 2016, we found that there are obvious differences in the local GHE efficiency due to the different levels of economic development and the high or low foundation of medical and health industry among different regions of China. We also found that the GHE efficiency in China increased year by year from 2007 to 2014, decreased slightly in 2015, and continued to increase in 2016. Finally, we found that the GHE efficiency has a significant positive spatial spillover. The proportion of GHE to fiscal expenditure, GDP per capita, and population density have a positive impact on the GHE efficiency. Their growth will promote the GHE efficiency in the local region and adjacent areas. Conversely, the proportion of urban population, illiteracy rate, and fiscal decentralization have a negative impact on the GHE efficiency. Their growth will reduce the efficiency in the local region and adjacent areas.
The strength of this study is to consider the spatial spillover effect in terms with realistic meaning. The results obtained can be used as a reference for optimizing the structure and improving the efficiency of government health inputs. It breaks the government’s GDP-only theory-based assessment system and helps to improve it by assessing the GHE efficiency. On the other hand, our study makes a significant contribution to the literature on public health services with spatial spillover effect.
Based on the obtained results and analysis, we have some suggestions and policy recommendations, which are as follows:
Develop a reasonable health insurance system. In the current context of aging and urbanization, China should formulate a scientific and reasonable healthcare insurance system, which can not only minimize the waste of health resources, but also improve the efficiency of the local GHE.
Improve the fiscal decentralization system. China should strengthen the supervision and management of financial expenditure in various regions, so as to improve the efficiency of the local GHE.
Reduce the regional unbalance. From the calculation and analysis of the local Moran index of the GHE efficiency, the GHE efficiency of Beijing, Jiangsu, Shanghai, and Zhejiang in the eastern region and Tibet and Qinghai in the western region is high, showing a high-high cluster. Conversely, the GHE efficiency of Inner Mongolia, Liaoning, Jilin, and Heilongjiang in the northeastern region and Sichuan, Yunnan, Chongqing, Guizhou, and Guangxi in the western region is generally low, showing a low-low cluster. Henan Province in the middle region shows negative spatial correlation, which is a high-low cluster area. The central part is located in the east–west junction grounding zone, which is driven, to a certain extent, by the developed areas in the east, but the development is still lagging behind. Therefore, the overall economic development pattern of China is not coordinated and is unbalanced among different regions. Correspondingly, the GHE efficiency is also unbalanced in terms of regional development. In order to maximize the GHE efficiency, we should vigorously implement the strategy of regional coordinated development, strengthen the health construction in the central and western regions, improve the level of health efficiency, and induce regional spillover of the GHE efficiency.
Strengthen the health cooperation. It is very important to strengthen the overall coordination among different regions and cross-administrative health cooperation. We should standardize inter-regional health rules and policies, improve the formulation and implementation of inter-regional environmental policies, reduce vicious competition in health expenditure efficiency and avoid blind competition and excessive competition. For the eastern region, which is in a high-high cluster area, regional exchanges and cooperation can be promoted to achieve coordinated development and common progress among regions. In order to reduce the efficiency of health expenditure and improve the “free-rider” behavior, it is necessary to establish standardized and unified health regulations and standards for the western and northeastern regions in low-low cluster areas.
Utilize the spatial spillover effect. Chinese GHE has a significant spatial spillover effect. In order to promote the coordinated development of the regional economy, the government should guide the flow of health resources in the region through fiscal and tax policies and optimize the layout of regional health centers. On the other hand, the government can fully utilize the spatial spillover effect of the health expenditure efficiency through the rational layout of regional health centers in order to promote regional development. In addition, we can use the spatial spillover effect to break down administrative barriers. Local government health services should break down the administrative barriers between regions, to make it convenient for people to enjoy the healthcare services in different places. At the same time, we need to strengthen the healthcare exchanges and cooperation with neighboring regions and make full use of regional spillover effect mechanism in order to better realize the effective supply of local basic healthcare services.
Optimize the urban population structure. China should rationally optimize the urban population structure, promote population aggregation, and play its role in improving the efficiency of health expenditure in local region and adjacent areas. Moreover, we need to accelerate the balanced development of the regional economy. From the analysis results concerning the spatial measurement of the health expenditure efficiency in China, the impact of Chinese economic development on the efficiency of health expenditure is obviously unbalanced. The growth of economics and the proportion of GHE to financial expenditure have promoted the efficiency of health expenditure in local regions and adjacent areas, while fiscal decentralization has inhibited it. The government can further adjust the proportion of GHE to financial expenditure to maintain economic growth and promote health expenditure efficiency. In order to comprehensively promote the construction of social education and improve people’s cultural quality, the government needs to further promulgate policies to promote the development of Chinese education. The efficiency of health expenditure can be significantly improved if the illiteracy rate is reduced.
6. Conclusions
In this paper, the DEA and spatial regression models are used to measure the local GHE efficiency and its spatial spillover effect in 31 provinces (municipalities and autonomous regions) of China from 2007 to 2016. The conclusions are summarized as follows.
Due to the different levels of economic development and the high or low foundation of the medical and health industry in various regions of China, there are obvious differences in the local GHE efficiency.
As far as individual regions are concerned, the overall efficiency of local GHE in Shandong, Zhejiang, Guangdong, Shanghai, Qinghai, Tibet, Hainan, Tianjin, and Ningxia is higher than 0.8. However, the overall efficiency of other regions is generally not high, which indicates that there is a large waste of GHE in these regions.
The results of the global Moran index calculations show that there is a positive spatial correlation between the local GHE efficiency from 2007 to 2016, that is, the efficiency of the local GHE is a spatial agglomeration. At the same time, we can also see from the trend of the Moran index that the spatial correlation degree of the local GHE from 2007 to 2014 shows an upward trend, while the spatial correlation degree between 2015 and 2016 slightly declines. At the same time, from 2007 to 2016, the proportion of the urban population, the illiteracy rate, the proportion of GHE to fiscal expenditure, the GDP per capita, fiscal decentralization, and population density are the main factors affecting the efficiency of the local GHE and they are all spatially correlated.
The calculation results of the local Moran index show that the positive spatial correlation regions are mainly concentrated in the northeast, east, and west of China. Among them, the low-low cluster areas are mainly concentrated in Inner Mongolia, Liaoning, Jilin, and Heilongjiang in the northeast region and Sichuan, Yunnan, Chongqing, Guizhou, Guangxi, etc. in the western region. High-high cluster areas are mainly concentrated in Beijing, Jiangsu, Shanghai, Zhejiang, etc. in the eastern region and Tibet and Qinghai in the western region. Henan is a spatial negative correlation cluster region, showing a high-low clustering phenomenon.
The results of the spatial econometric model in this paper show that, from the perspective of total, direct, and indirect effects, the proportion of GHE to fiscal expenditure and GDP per capita are two important indicators representing economic factors and the population density represents the population factors. They have a positive impact on the health and financial expenditure efficiency of local government and their growth will improve the efficiency of the local and neighboring regions, while the three indicators of the proportion of urban population, illiteracy rate, and fiscal decentralization have a negative impact on the health and financial expenditure efficiency of local governments and their growth will reduce the efficiency of local and neighboring regions.
Author Contributions
M.W. and C.T. conceived and designed the study; M.W. collected and analyzed the data and drafted the paper; M.W. and C.T. read and revised the draft critically. All authors read and approved the final manuscript.
Funding
This research is funded by the National Social Science Foundation of China (Grant No. 16BTJ004; 14BJY160), the Bidding Project of Cooperative Innovation Center of Jiangxi University of Finance and Economics, “Research on Development of Biomedical Industry and Policy Support” (Grant No. 2016-03), Special Project of the National Social Science Foundation of China (Grant No. 18VSJ016), and the National Natural Science Foundation of China (Grant No. 81760619).
Acknowledgments
We would like to thank Lisu Yu and Xiaohui Liu for their help to improve the paper.
Conflicts of Interest
The authors declare no conflict of interest.
References
- Ping, X.; Bai, J. Fiscal decentralization and local public good provision in China. J. Financ. Trade Econ. 2006, 2, 49–55. [Google Scholar]
- Fu, Y. Chinese Decentralization, Local Fiscal Models and Public Goods Supply: Theoretical and Empirical Research; Fudan University: Shanghai, China, 2007. [Google Scholar]
- Lv, W.; Wang, W. Research on the equalization of basic public service providing in China-based on the analysis of public demand and government ability. J. Public Financ. Res. 2008, 5, 10–18. [Google Scholar]
- Liu, Z.; Tang, T.; Yang, W. Efficiency measurement of provincial expenditure: DEA technique. J. Econ. Theor. Bus. Manag. 2009, 7, 50–56. [Google Scholar]
- Farrell, M.J. The measurement of technical efficiency. J. R. Stat. Soc. Ser. Ageneral 1957, 30, 1078–1092. [Google Scholar]
- Charnes, A.; Cooper, W.W.; Rhodes, E. Measuring the efficiency of decision-making units. Eur. J. Oper. Res. 1978, 2, 429–444. [Google Scholar] [CrossRef]
- Afonso, A.; Fernandes, S. Measuring local government spending efficiency: Evidence for the Lisbon region. Reg. Stud. 2006, 40, 39–53. [Google Scholar] [CrossRef]
- Hadad, S.; Hadad, Y.; Tuval, T.S. Determinants of healthcare systems efficiency in OECD countries. Eur. J. Health Econ. 2013, 14, 253–265. [Google Scholar] [CrossRef]
- Han, H.; Miao, Y. Calculation of local health expenditure efficiencies and empirical study on influencing factors: DEA-Tobit analysis based on panel data of 31 provinces in China. J. Financ. Econ. 2010, 5, 4–15. [Google Scholar]
- Luo, H. Empirical study on fiscal spending efficiency on healthcare and its influencing factors. J. Chin. Health Econ. 2012, 31, 13–15. [Google Scholar]
- Guan, Y.; Liu, J.; Wang, B. A study of dynamic evaluation on the efficiency of provincial public healthcare expenditure in China-based on the perspective of health system reform. J. Guizhou Univ. Financ. Econ. 2014, 1, 89–97. [Google Scholar]
- Jing, R.; Song, X. Performance analysis of Chinese public health expenditure in the background of new medical reform-an empirical study based on DEA and Malmquist productivity index. J. Public Financ. Res. 2012, 9, 54–60. [Google Scholar]
- Wang, Y.; Fan, J.; Zhao, J.; Dong, Y.; Wang, Y. Taking Shandong province as an example to explore the spatial analysis of utilization efficiency of health resource allocation. J. Chin. Health Econ. 2015, 32, 1056–1058. [Google Scholar]
- Han, Y.; Hu, Q.; Wang, L.; Shao, Y.; Wang, Z.; Han, X. Analysis of the inter-provincial differences of the health resource allocation efficiency in China. Chin. J. Soc. Med. 2016, 33, 86–89. [Google Scholar]
- Gu, J. A spatial study on the allocation of healthcare resource. J. Chin. Health Econ. 2014, 31, 21–23. [Google Scholar]
- Retzlaff-Roberts, D.; Chang, C.F.; Rubin, R.M. Technical efficiency in the use of health care resources: A comparison of OECD countries. J. Health Policy 2004, 69, 55–72. [Google Scholar] [CrossRef]
- Liu, Z.; Zhang, X.; Yang, D. Research on Efficiency Change of Chinese Government Health Investment: Based on Panel Three Stage DEA model. J. Cent. Univ. Financ. Econ. 2014, 1, 97–104. [Google Scholar]
- Xiao, H.; Cao, T.; Tang, L. Measurement and analysis of government health expenditures and health efficiency. Chin. J. Health Policy 2014, 7, 71–77. [Google Scholar]
- Tu, Y. Study on government health input’s efficiency in China. J. Chin. Health Econ. 2012, 9, 62–66. [Google Scholar]
- Li, Y.; Wang, Y. A study on healthcare expenditure efficiencies of China’s local governments and their influencing factors. J. Humanit. Soc. J. Hainan Univ. 2015, 5, 41–49. [Google Scholar]
- National Bureau of Statistics of China. China Statistical Yearbook; National Bureau of Statistics of China: Beijing, China, 2008–2017.
- National Health Commision of the People’s Republic of China. China Health Statistical Yearbook; National Health Commision of the People’s Republic of China: Beijing, China, 2008–2017.
- National Bureau of Statistics of China. China Financial Yearbook; National Bureau of Statistics of China: Beijing, China, 2008–2017.
- Banker, R.D.; Charnes, A.; Cooper, W.W. Some models for estimating technical and scale inefficiencies in data envelopment analysis. Manag. Sci. 1984, 30, 1078–1092. [Google Scholar] [CrossRef]
- Tobler, W. The First Law of Geography: A computer movie simulating urban growth in the Detroit region. Econ. Geogr. 1970, 46, 234–240. [Google Scholar] [CrossRef]
- Viton, P.A. Notes on spatial econometric models. City Reg. Plan. 2010, 870, 2–17. [Google Scholar]
- LeSage, J.; Pace, R.K. Introduction to Spatial Econometrics; Chapman and Hall/CRC: Boca Raton, FL, USA, 2009. [Google Scholar]
- Ertur, C.; Koch, W. Growth, technological interdependence and spatial externalities: Theory and evidence. J. Appl. Econom. 2007, 22, 1033–1062. [Google Scholar] [CrossRef]
- Engle, R.F. Wald, likelihood ratio, and Lagrange multiplier tests in econometrics. Handb. Econom. 1984, 2, 775–826. [Google Scholar]
Figure 1.
Chinese local government health expenditures from 2007 to 2016.

Figure 2.
Government health expenditure (GHE) target.

Figure 3.
Overall efficiency of Chinese local government health expenditures from 2007 to 2016.

Figure 4.
Ranking of the average overall efficiency of Chinese local government health expenditures from 2007 to 2016.
Figure 4.
Ranking of the average overall efficiency of Chinese local government health expenditures from 2007 to 2016.

Figure 5.
The spatial agglomeration of Chinese local government health expenditures overall efficiency in 2009.
Figure 5.
The spatial agglomeration of Chinese local government health expenditures overall efficiency in 2009.

Figure 6.
The spatial agglomeration of Chinese local government health expenditures overall efficiency in 2010.
Figure 6.
The spatial agglomeration of Chinese local government health expenditures overall efficiency in 2010.

Figure 7.
The spatial agglomeration of Chinese local government health expenditures overall efficiency in 2011.
Figure 7.
The spatial agglomeration of Chinese local government health expenditures overall efficiency in 2011.


Table 1.
Outputs of government-invested public health service from 2007 to 2016.
| Indicator Name | Maximum | Minimum | Mean | Standard Deviation |
|---|---|---|---|---|
| Outpatient consultation (100 million) | 2.56 | 0.53 | 1.88 | 0.75 |
| Infectious disease incidence rate of Class A and B statutory reports (%) | 302.00 | 232.13 | 262.89 | 25.37 |
| Outpatient and inpatient medical expenses per capita (Chinese yuan) | 5077.44 | 9141.66 | 7225.28 | 1388.96 |
| Bed use rate (%) | 76.52 | 89.00 | 85.03 | 3.50 |
| Severe malnutrition rate among children under 5 years old (%) | 1.33 | 2.06 | 1.56 | 0.26 |
| Population mortality rate (%) | 5.83 | 6.07 | 5.95 | 0.09 |
| Infectious disease mortality rate (%) | 0.89 | 1.26 | 1.11 | 0.12 |
Table 2.
Selection of influencing factors of spatial measurement model.
| Indicator (Unit) | Calculation Method |
|---|---|
| Proportion of urban population (%) | Regional urban population/region permanent resident population * 100% |
| Illiteracy rate (%) | Number of illiterates over 15 years old/total population over 15 years old * 100% |
| Proportion of government health expenditure to financial expenditure (%) | Local government health expenditure/local fiscal expenditure * 100% |
| GDP per capita (Chinese yuan/person) | Gross regional product/regional resident population |
| Fiscal decentralization (%) | Local finance general budget expenditure/important fiscal expenditure * 100% |
| Population density (person/km2) | Regional permanent population/region total area |
Table 3.
Global spatial correlation test of static overall efficiency of government health expenditure.
Table 3.
Global spatial correlation test of static overall efficiency of government health expenditure.
| Year | Moran’s I Value | p-Value |
|---|---|---|
| 2007 | 0.201 | 0.021 |
| 2008 | 0.22 | 0.016 |
| 2009 | 0.256 | 0.007 |
| 2010 | 0.22 | 0.017 |
| 2011 | 0.246 | 0.009 |
| 2012 | 0.255 | 0.008 |
| 2013 | 0.292 | 0.003 |
| 2014 | 0.336 | 0.001 |
| 2015 | 0.32 | 0.001 |
| 2016 | 0.315 | 0.002 |
Table 4.
Global spatial correlation test of static overall efficiency of government health expenditure.
Table 4.
Global spatial correlation test of static overall efficiency of government health expenditure.
| Indicator Name | SDM Model Fixed Effect | SDM Model Random Effect |
|---|---|---|
| Proportion of urban population | 0.0110 ** | −0.00109 |
| Illiteracy rate | −0.00698 * | −0.00628 |
| Proportion of GHE to fiscal expenditure | 0.0165 ** | 0.0177 ** |
| GDP per capita | 0.00000243 | 0.00000306 * |
| Fiscal decentralization | 0.473 * | 0.373 |
| Population density | 0.000984 *** | 0.000132 |
| rho | 0.519 *** | 0.517 *** |
| Hausman test | 0.000 | |
| Wald test | chi2(5) = 18.3 Prob > chi2 = 0.0000 | |
| LR test | chi2(5) = 25.96 Prob > chi2 = 0.0001 | |
| AIC | BIC | |
| SDM model | −687.2068 | −634.8948 |
| SAC model | −841.149 | −811.2564 |
Note: *, **, *** indicate significant levels at 10%, 5%, and 1%, respectively.
Table 5.
Spatial spillover effect decomposition with SDM Model.
| Indicator Name | Total Effect | Direct Effect | Indirect Effect |
|---|---|---|---|
| Proportion of urban population | −0.0032115 *** | −0.0019761 *** | −0.0012354 *** |
| Illiteracy rate | −0.0016742 *** | −0.0010302 | −0.000644 |
| Proportion of GHE to fiscal expenditure | 0.0078264 *** | 0.0048158 *** | 0.0030106 |
| GDP per capita | 1.33 *** | 8.21 *** | 5.13 *** |
| Fiscal decentralization | −0.115438 *** | −0.0710317 | −0.0444063 |
| Population density | 0.0000458 *** | 0.0000282 *** | 0.0000176 *** |
Note: *, **, *** indicate significant levels at 10%, 5%, and 1%, respectively.
© 2019 by the authors. Licensee MDPI, Basel, Switzerland. This article is an open access article distributed under the terms and conditions of the Creative Commons Attribution (CC BY) license (http://creativecommons.org/licenses/by/4.0/).
Share and Cite
MDPI and ACS Style
Wang, M.; Tao, C. Research on the Efficiency of Local Government Health Expenditure in China and Its Spatial Spillover Effect. Sustainability 2019, 11, 2469. https://0-doi-org.brum.beds.ac.uk/10.3390/su11092469
AMA Style
Wang M, Tao C. Research on the Efficiency of Local Government Health Expenditure in China and Its Spatial Spillover Effect. Sustainability. 2019; 11(9):2469. https://0-doi-org.brum.beds.ac.uk/10.3390/su11092469
Chicago/Turabian StyleWang, Mengying, and Chunhai Tao. 2019. "Research on the Efficiency of Local Government Health Expenditure in China and Its Spatial Spillover Effect" Sustainability 11, no. 9: 2469. https://0-doi-org.brum.beds.ac.uk/10.3390/su11092469
Note that from the first issue of 2016, this journal uses article numbers instead of page numbers. See further details here.