Using Native Vegetation Screens to Lessen the Visual Impact of Rural Buildings in the Sierras de Béjar and Francia Biosphere Reserve: Case Studies and Public Survey


 ,
,  and
and
Abstract
:1. Introduction
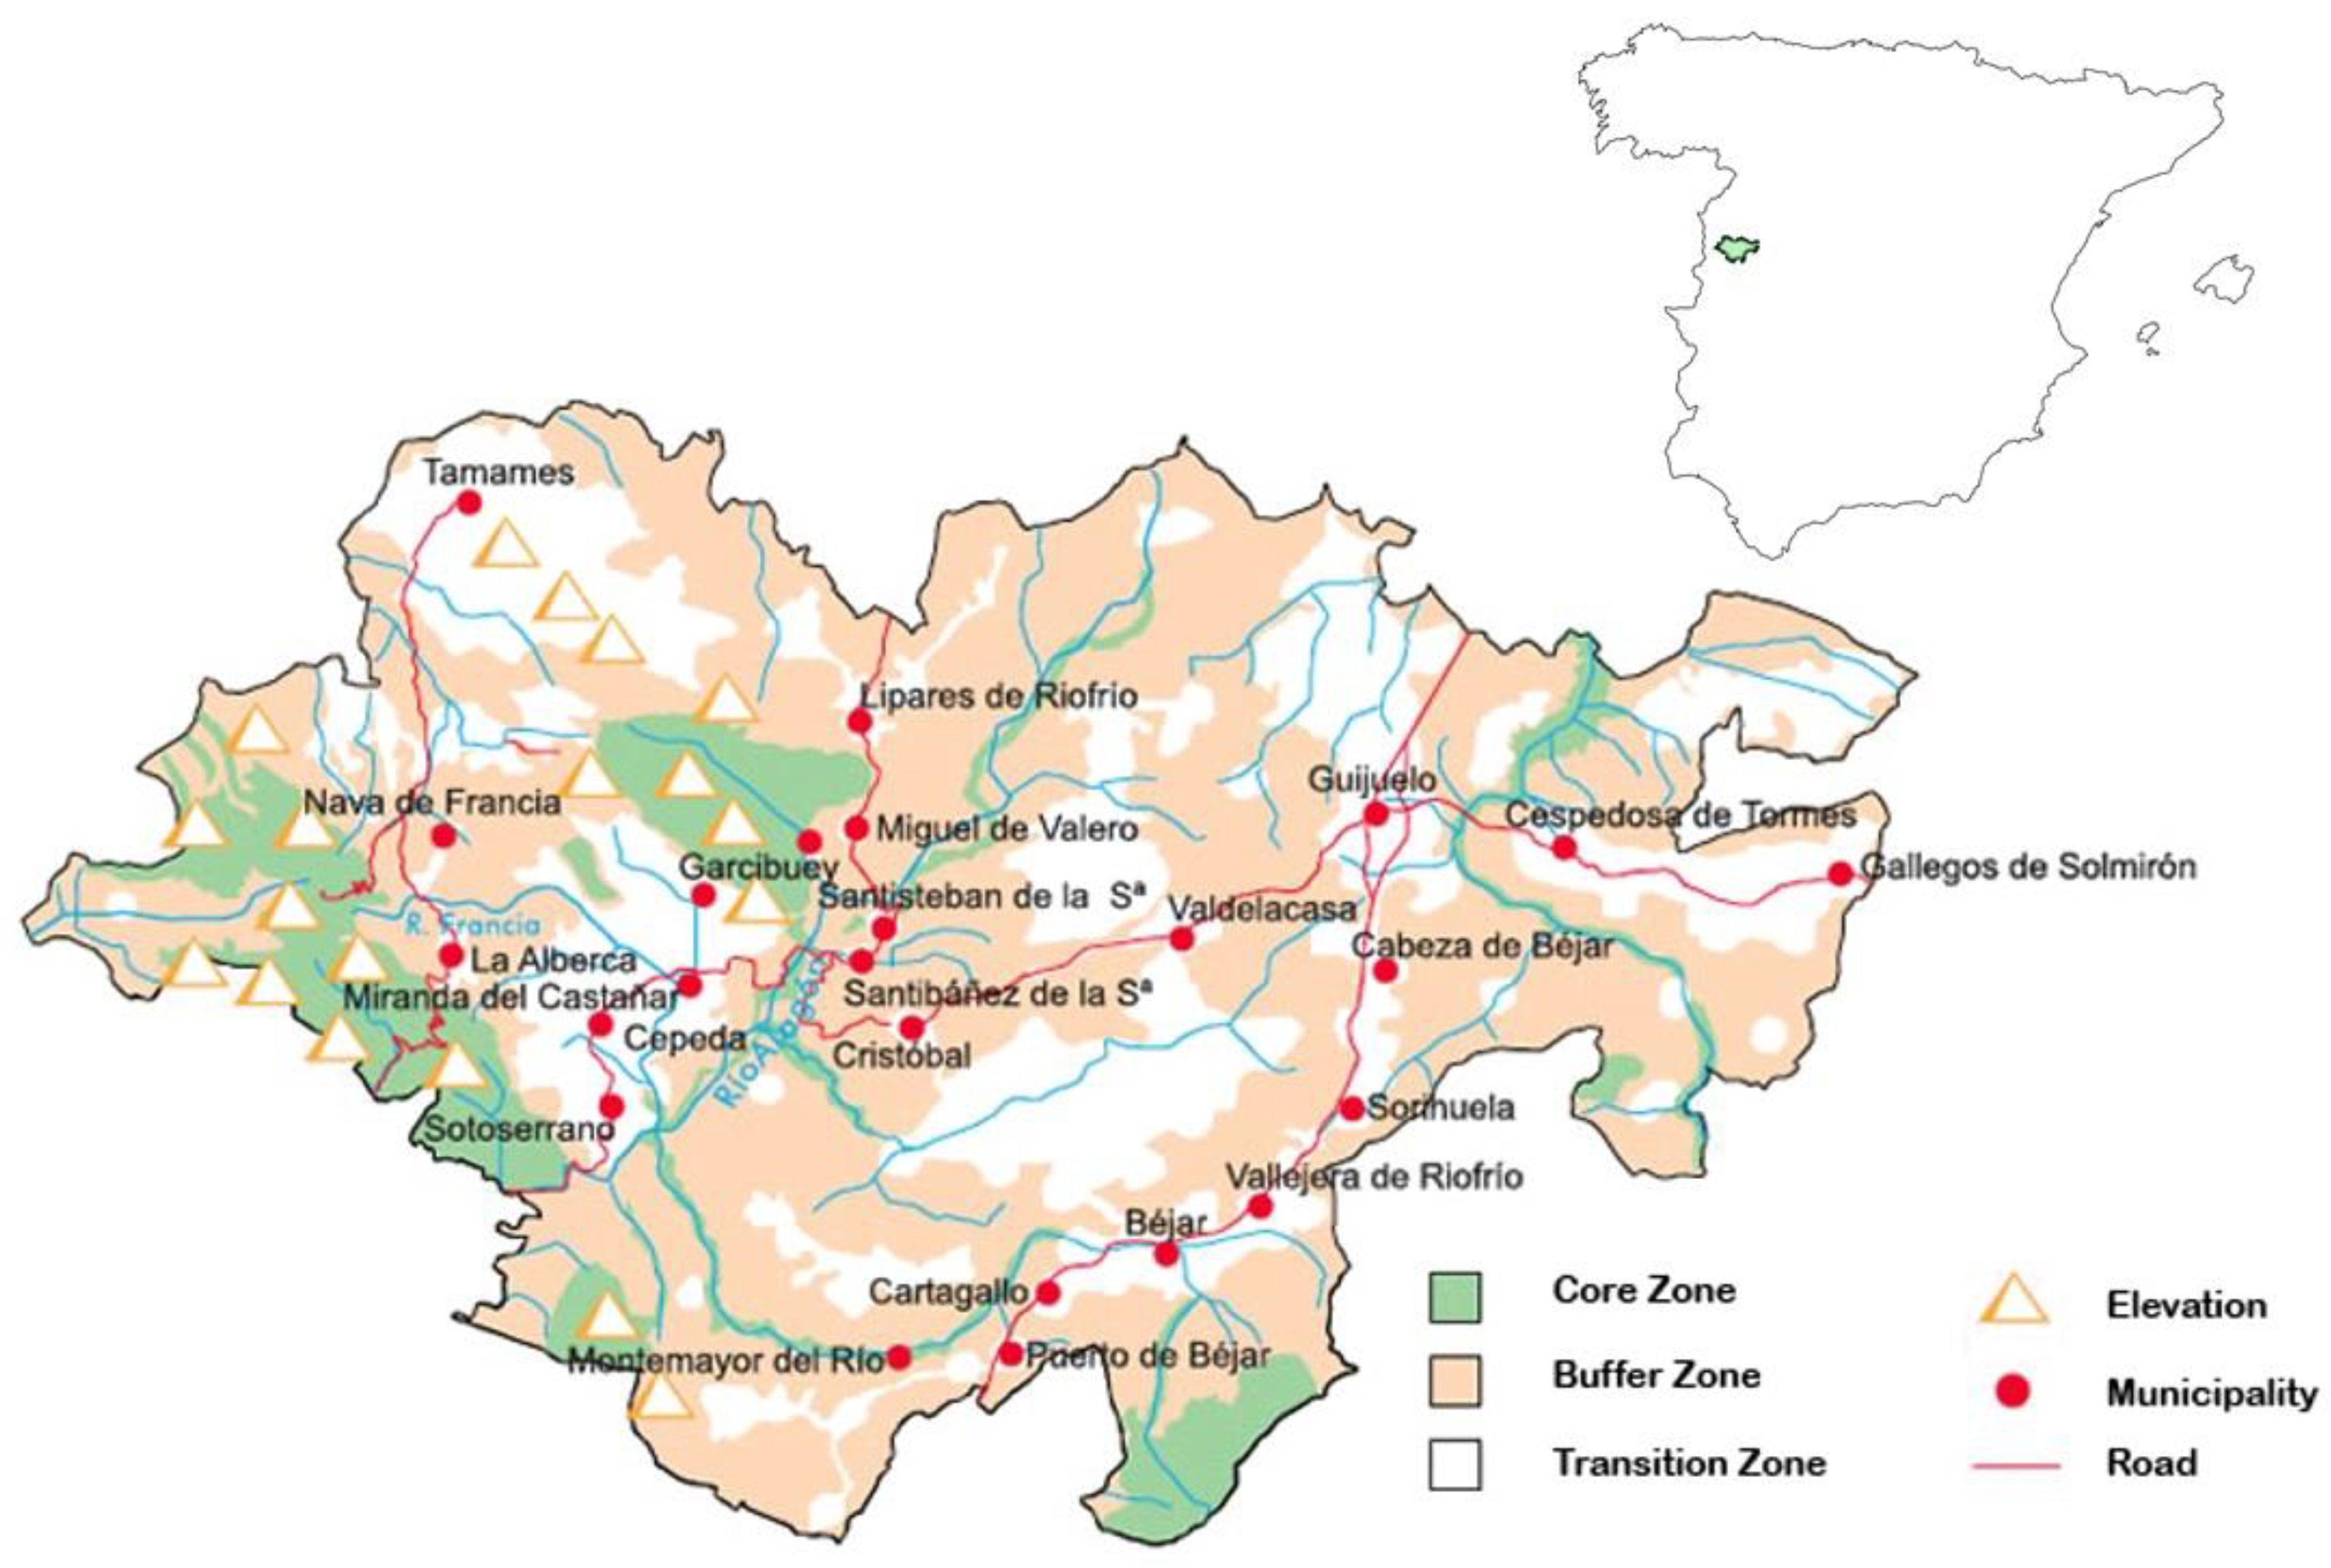
2. Study Area
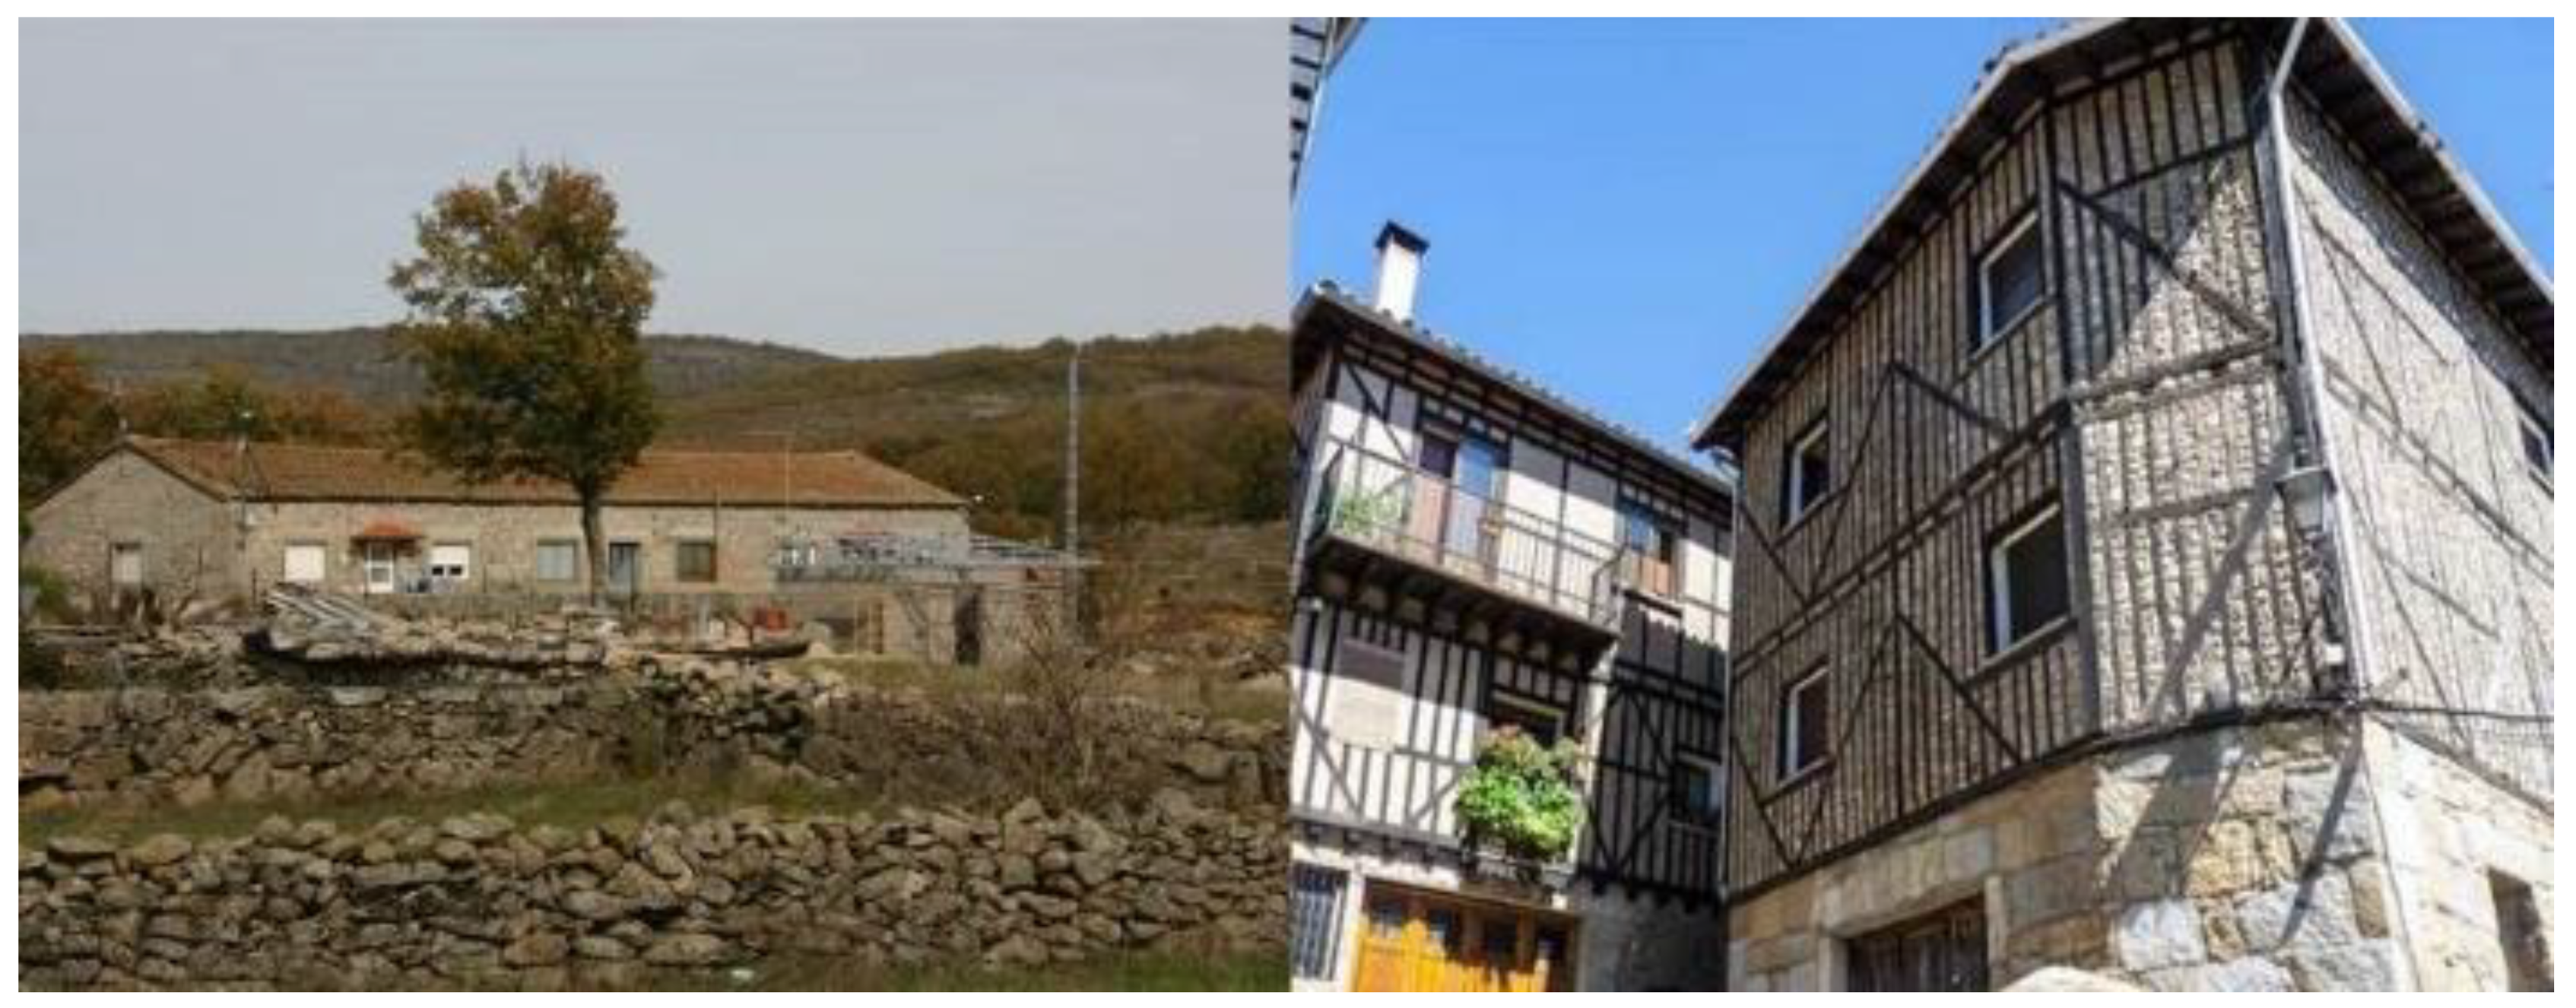
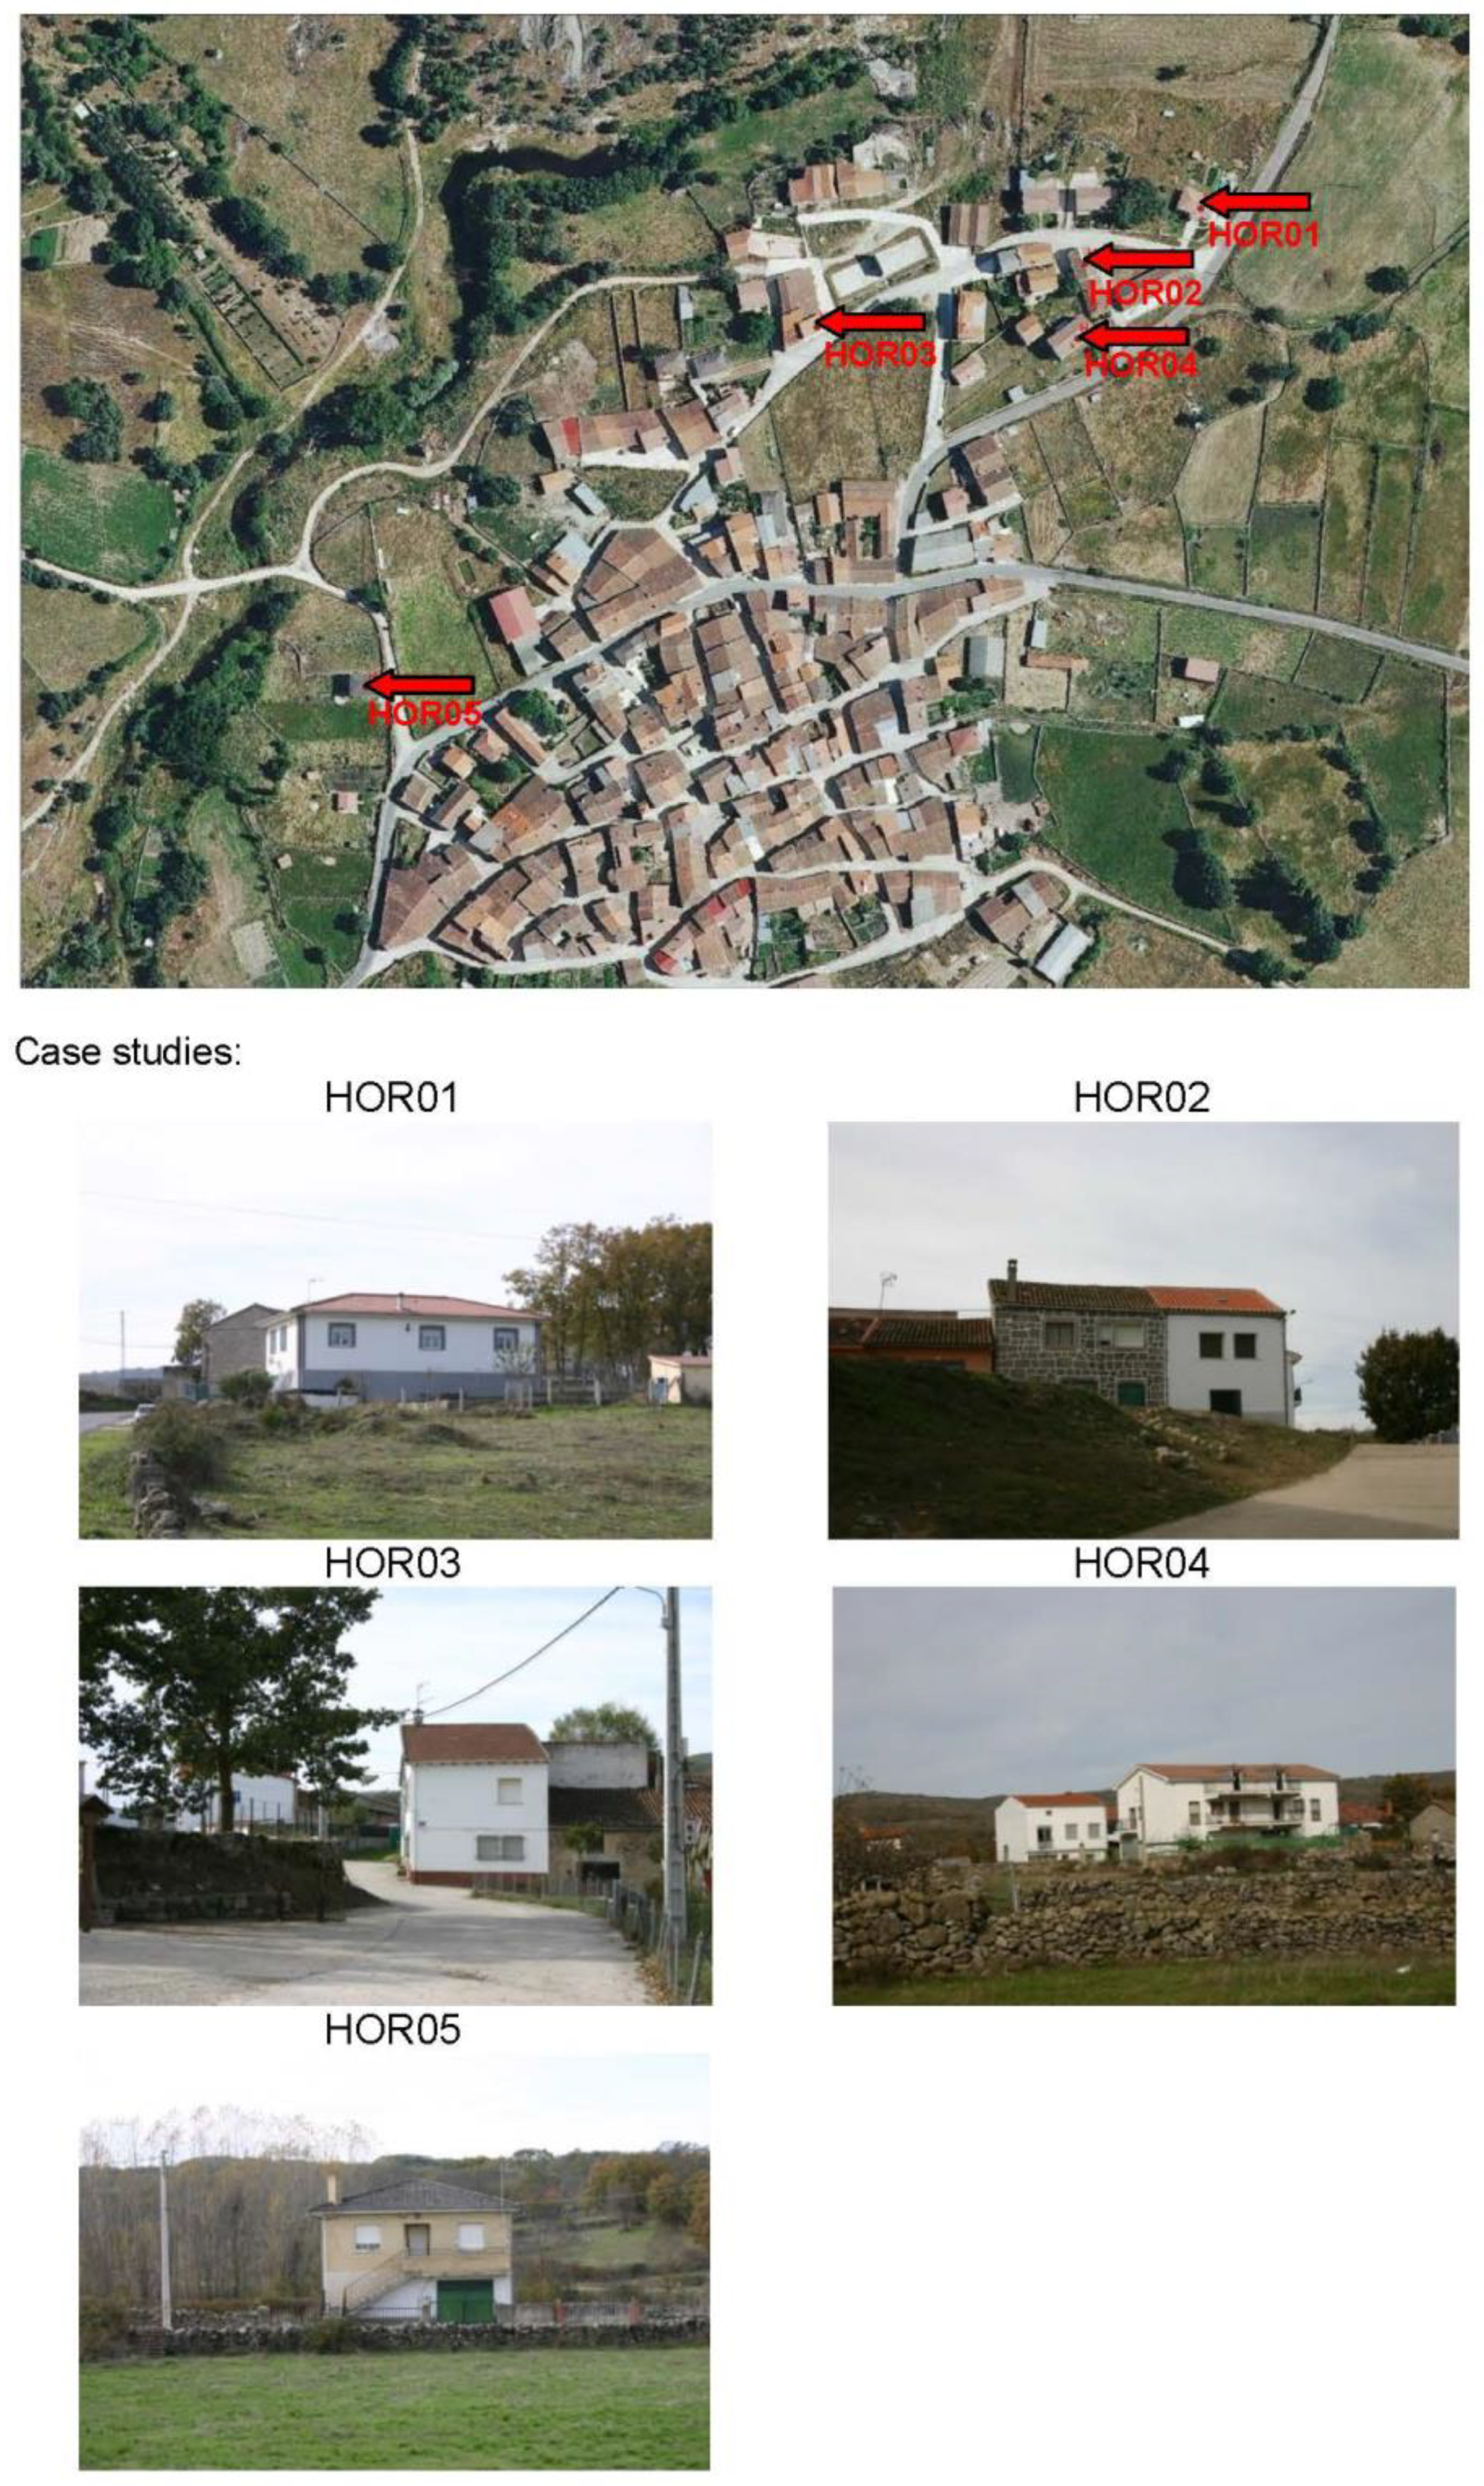
2.1. Description of the Study Area
2.2. Information Gathering
- -
- The natural and landscape context;
- -
- A lack of unification of legal criteria in the aesthetic regulation of new buildings;
- -
- Forecasts for increasing tourism in the medium term.
- -
- Not to be built in the style of local traditional architecture;
- -
- To be in a state of severe neglect;
- -
- To be taller than the other dominant elements.
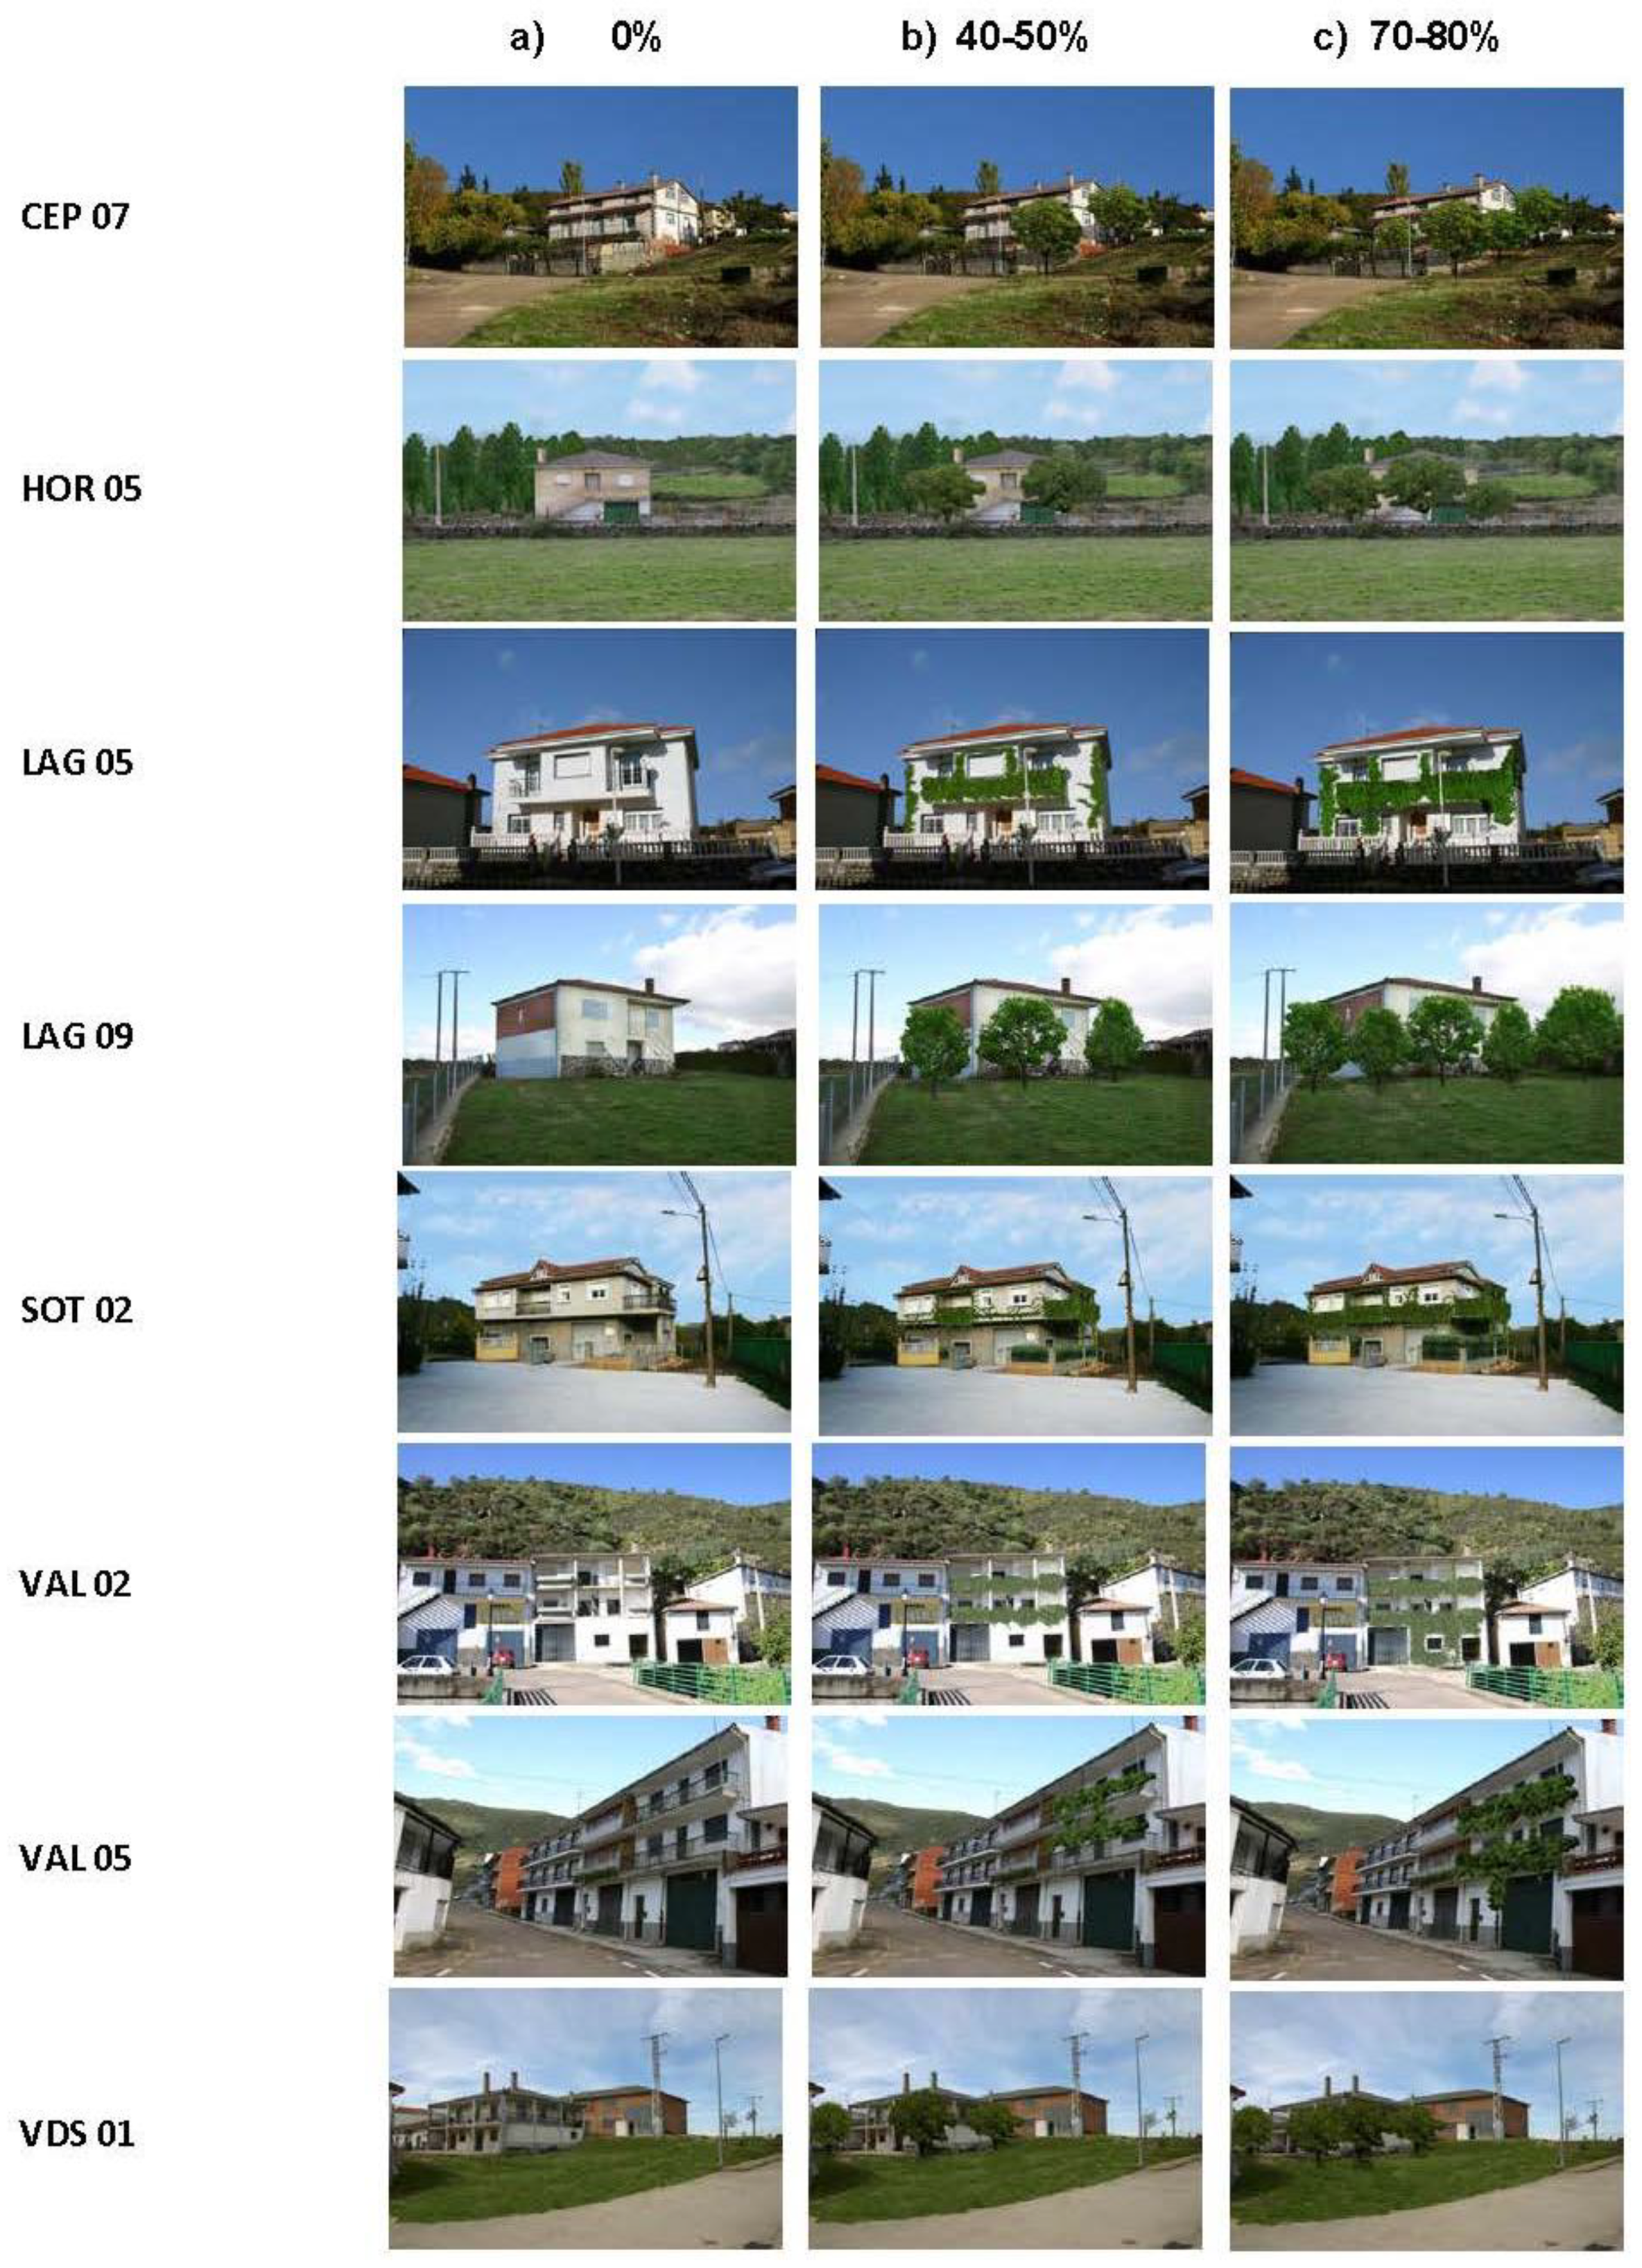
- (1)
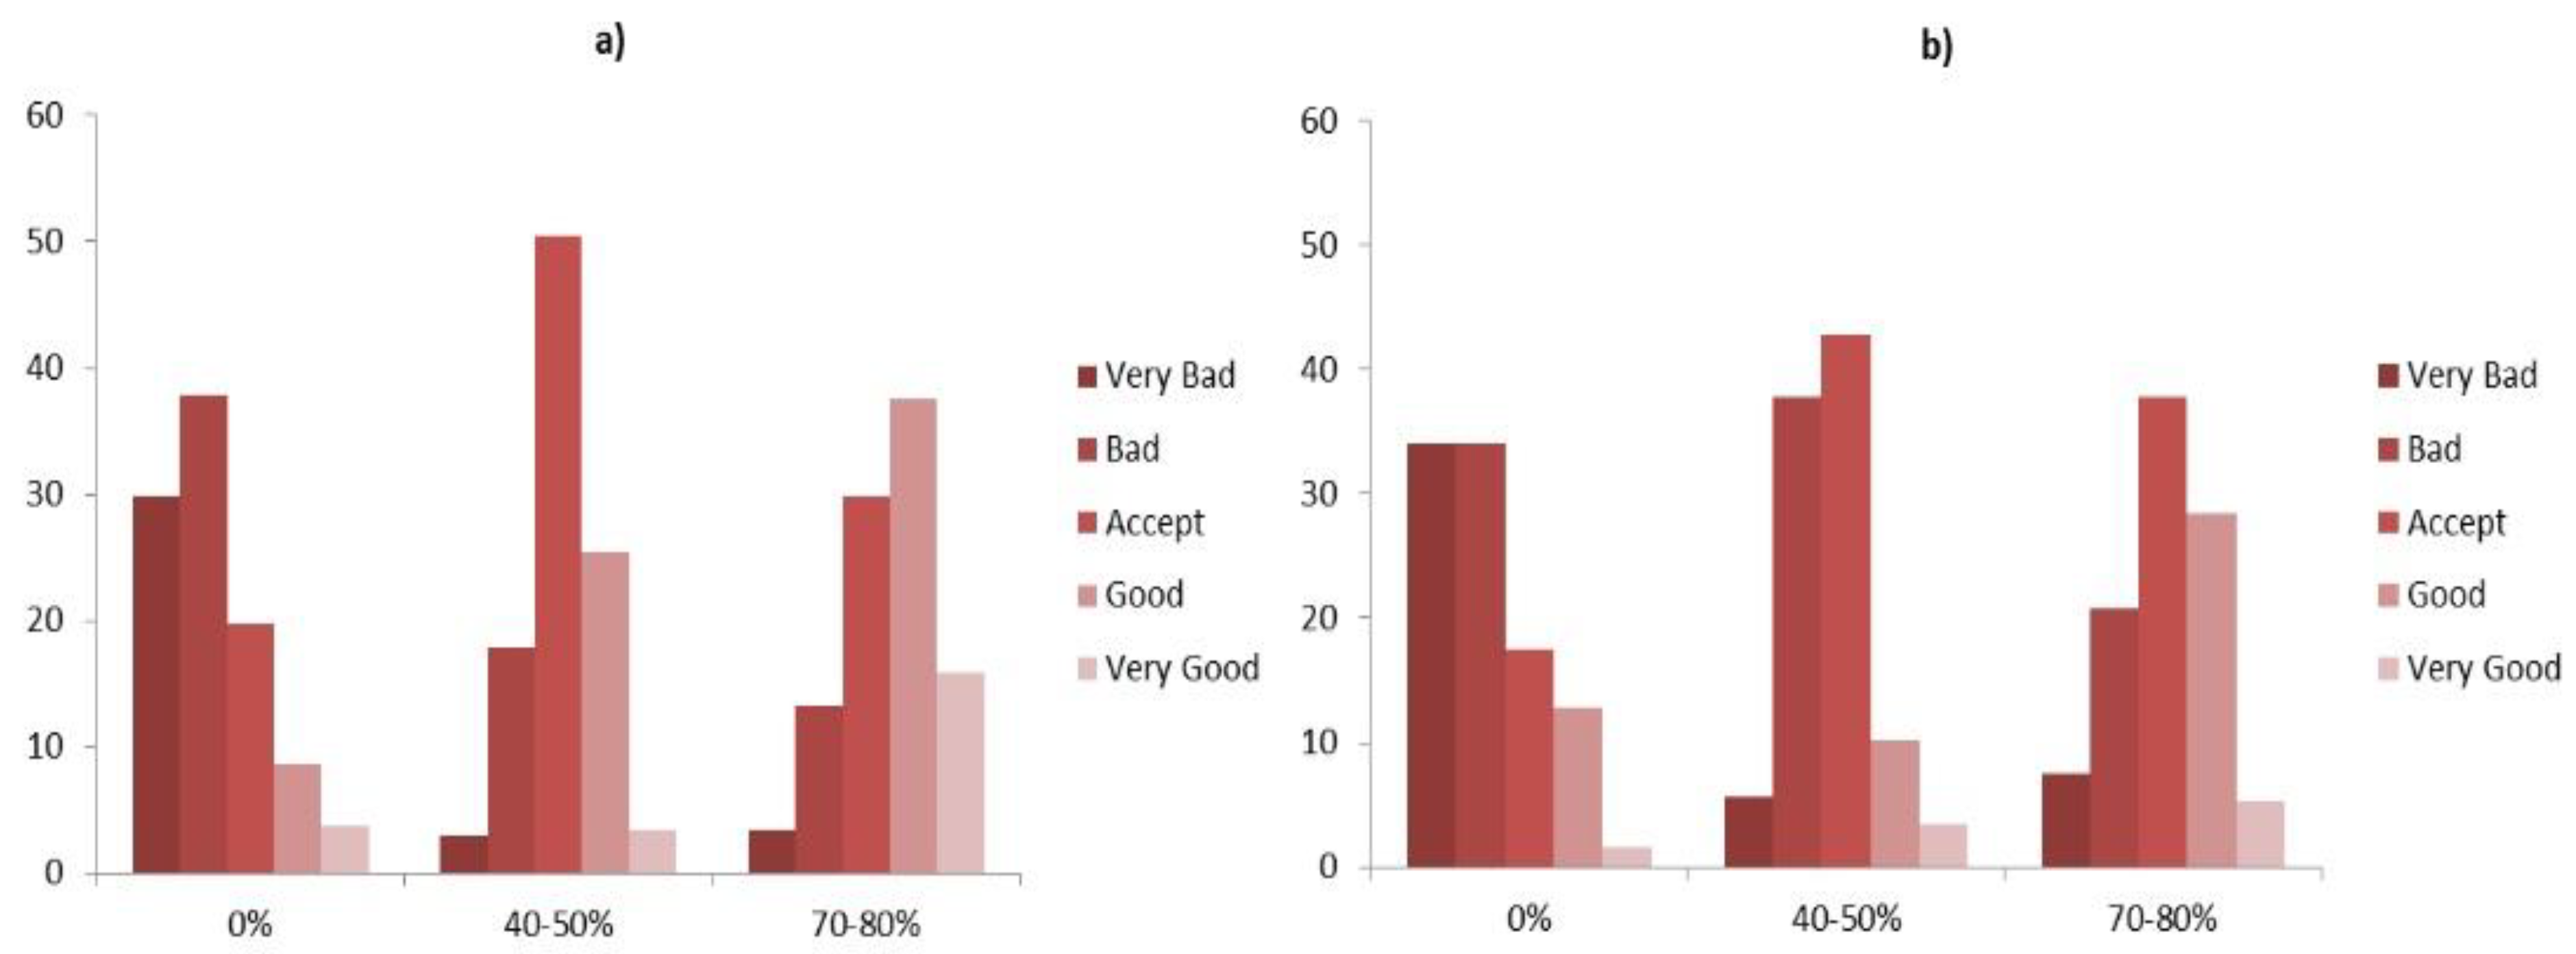
- No vegetation on the infograph, providing 0% filtering (real and control case). Expected to be the scenario worst evaluated by observers;
- (2)
- Vegetation providing filtering of around 40–50%;
- (3)
- Vegetation providing maximum filtering of around 70–80%.
3. Materials and Methods
3.1. Selection of Participants
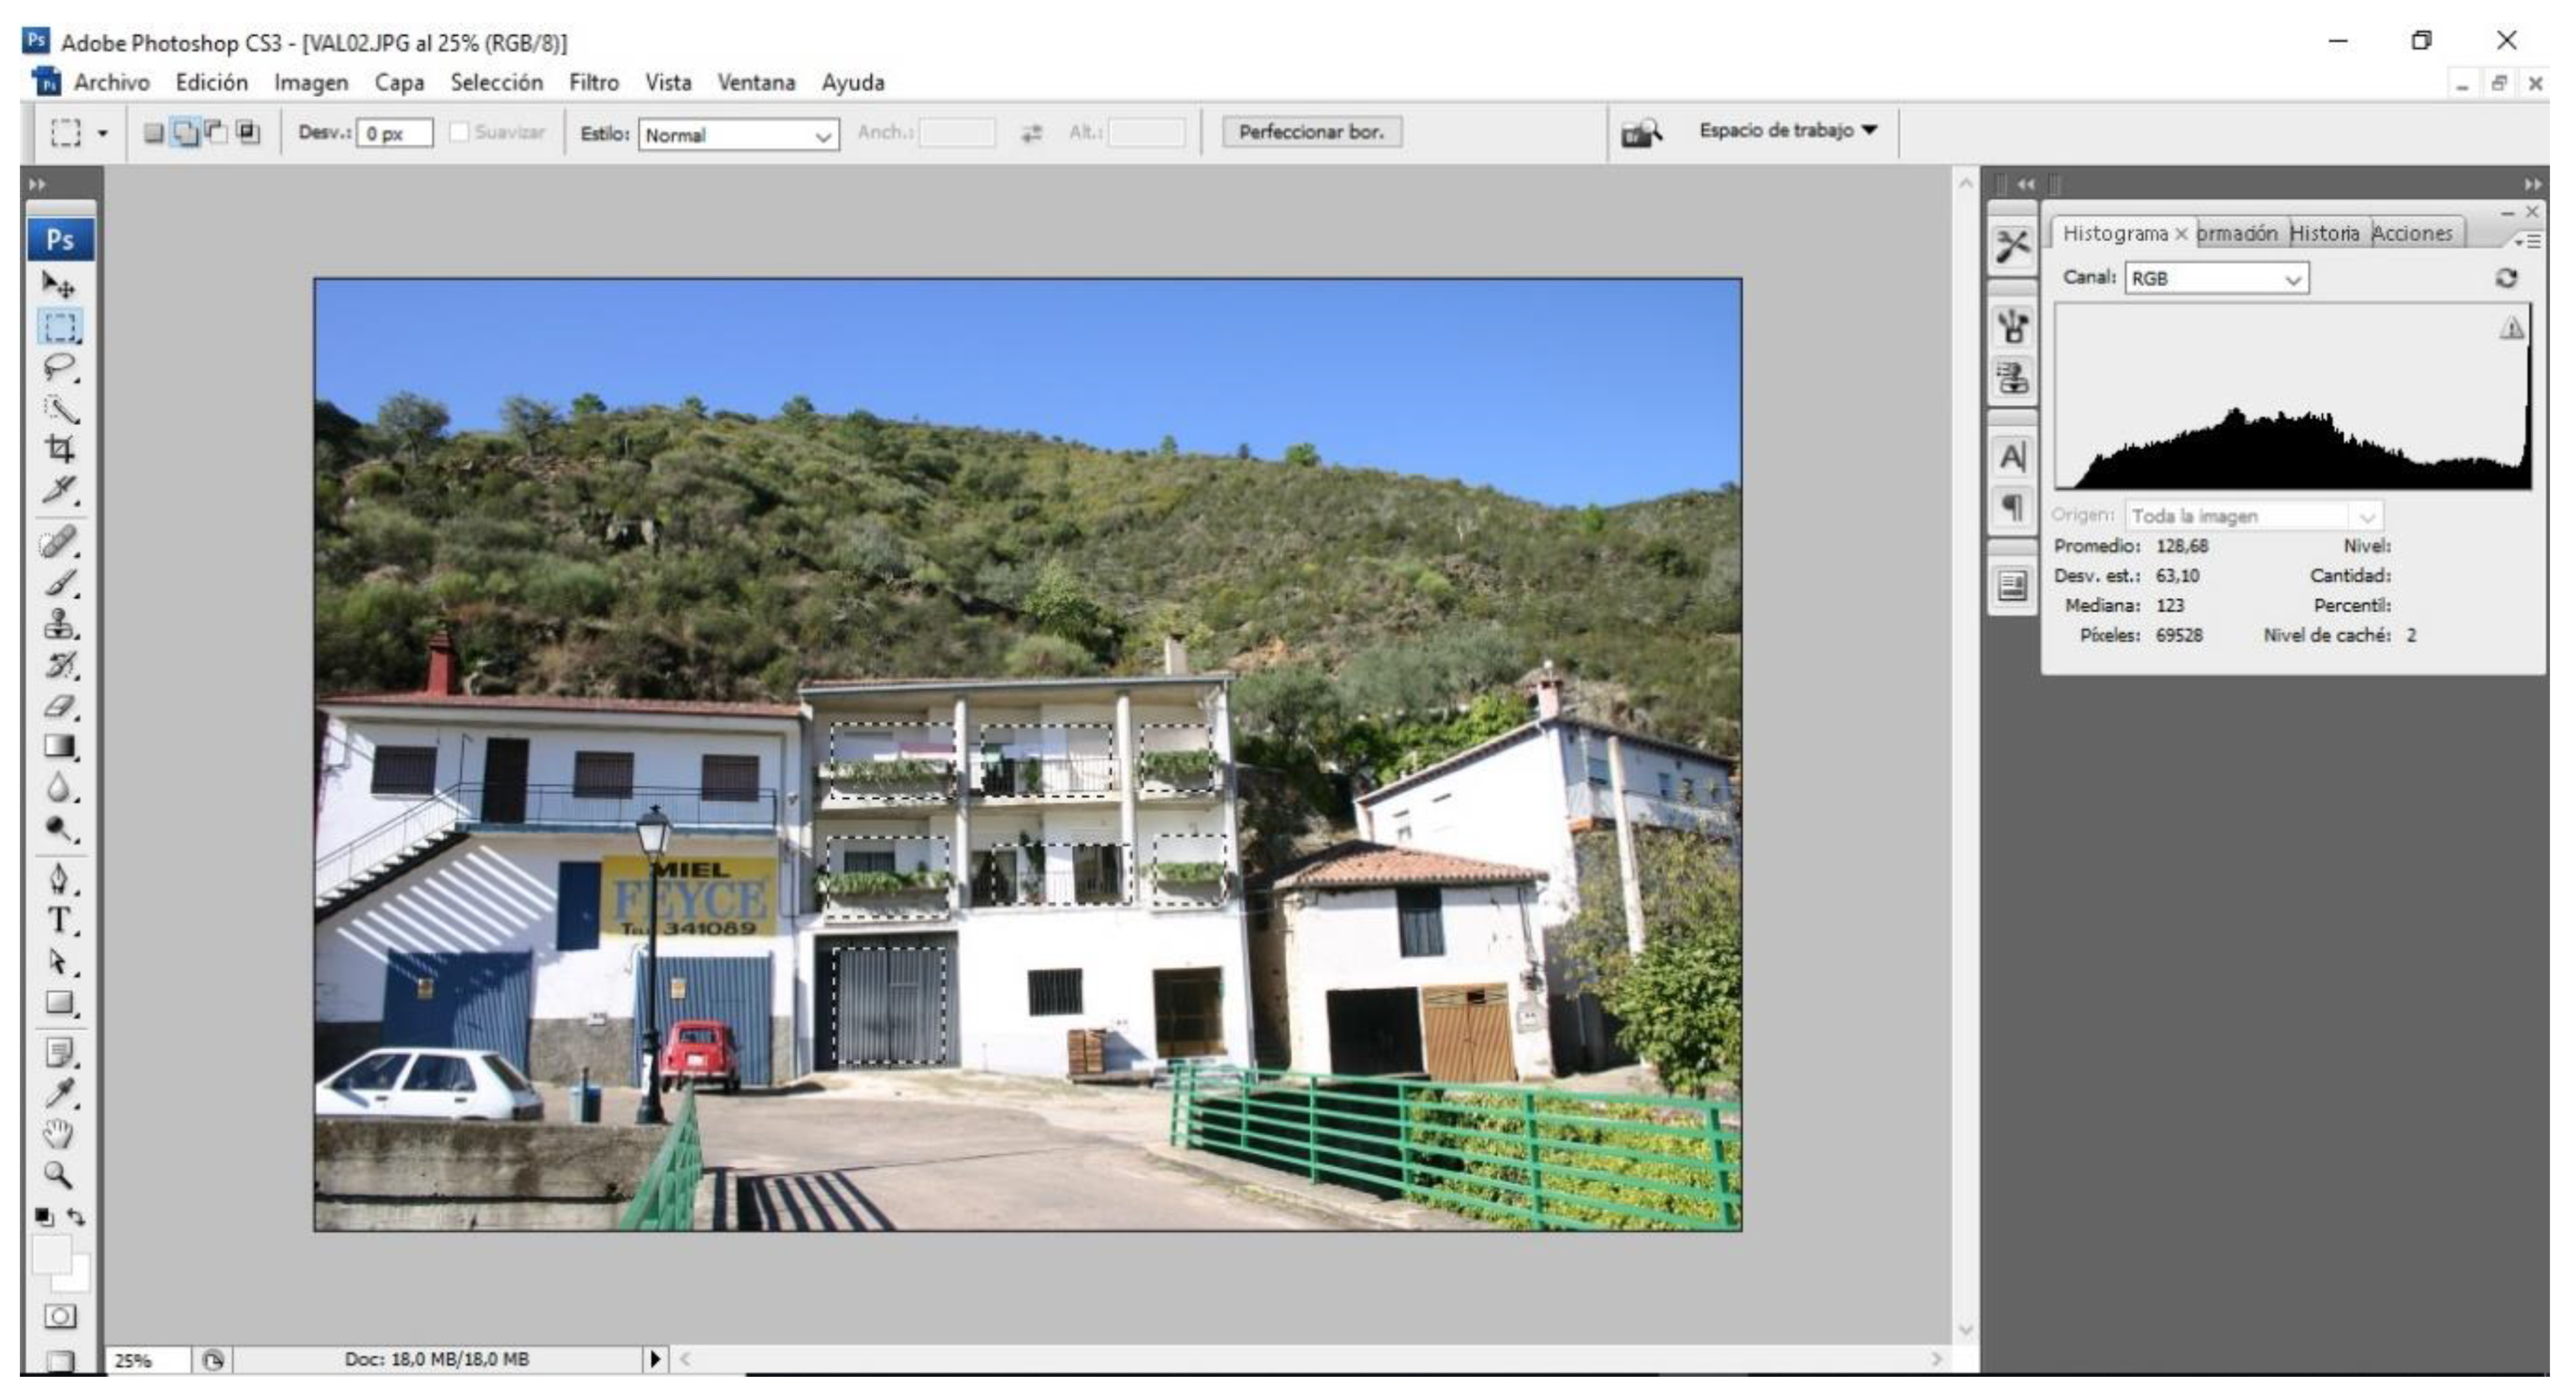
3.2. Survey Preparation
3.3. Statistical Analysis
4. Results and Discussion
5. Conclusions
- (1)
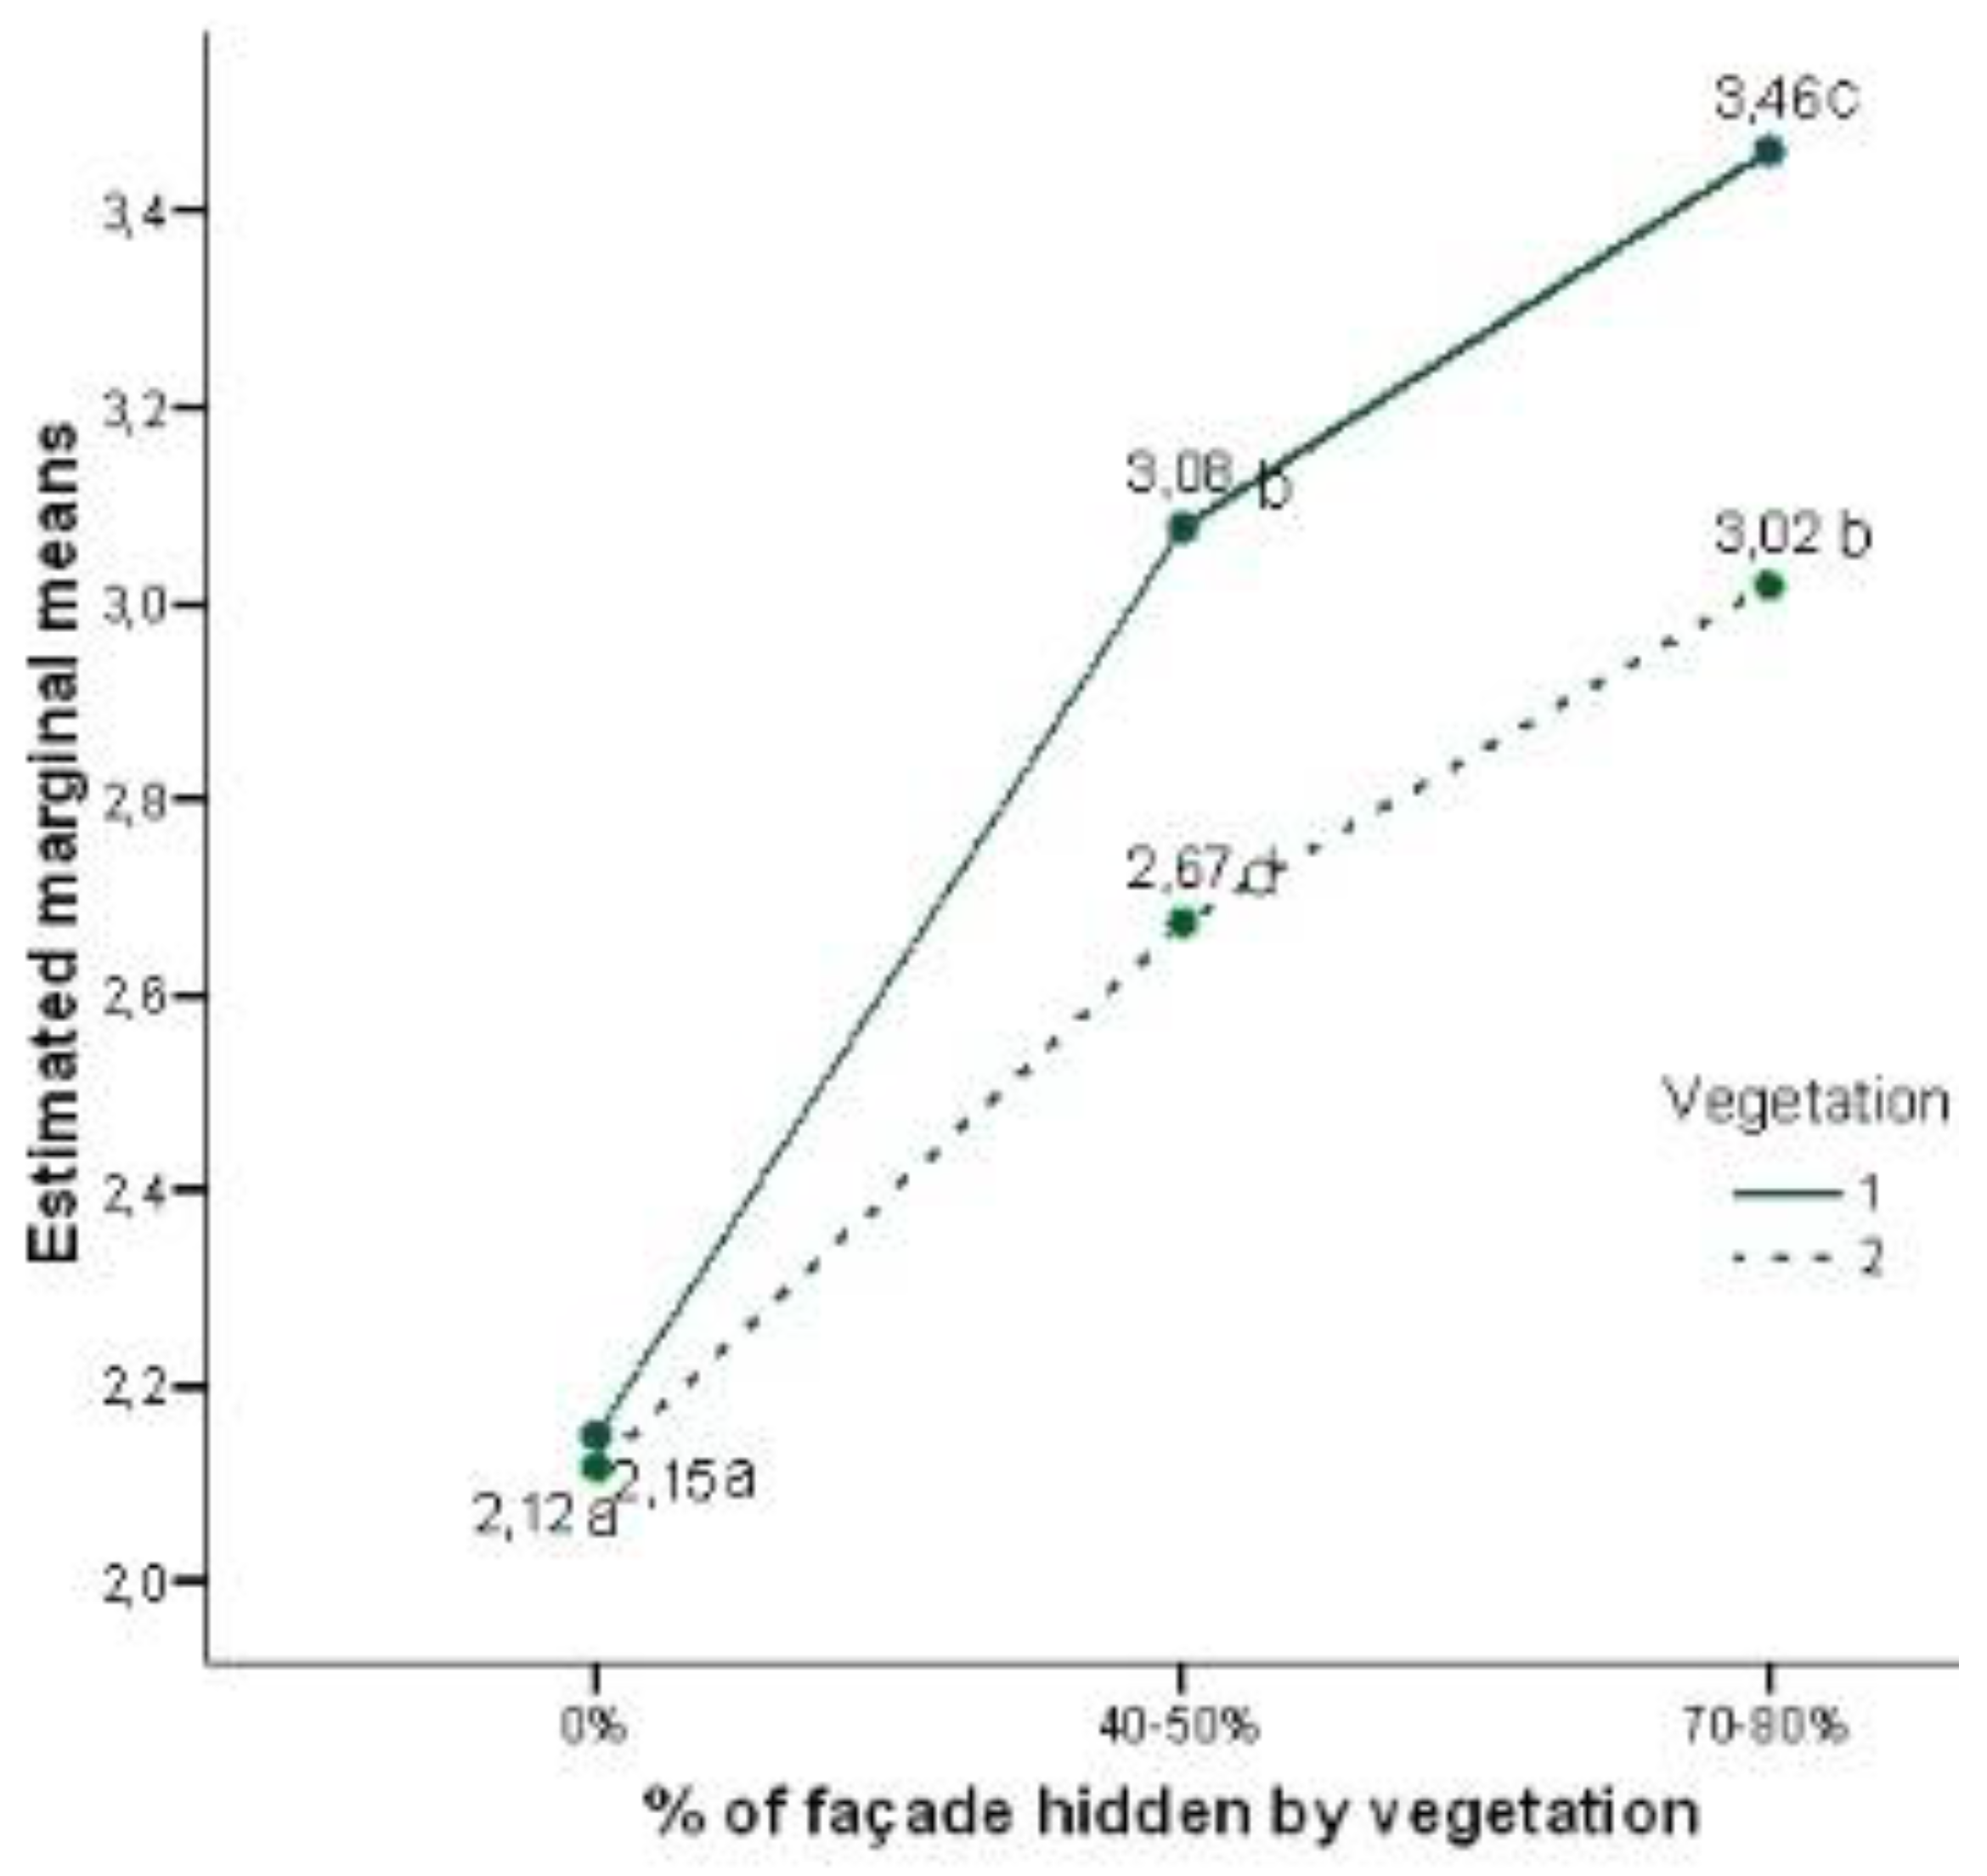
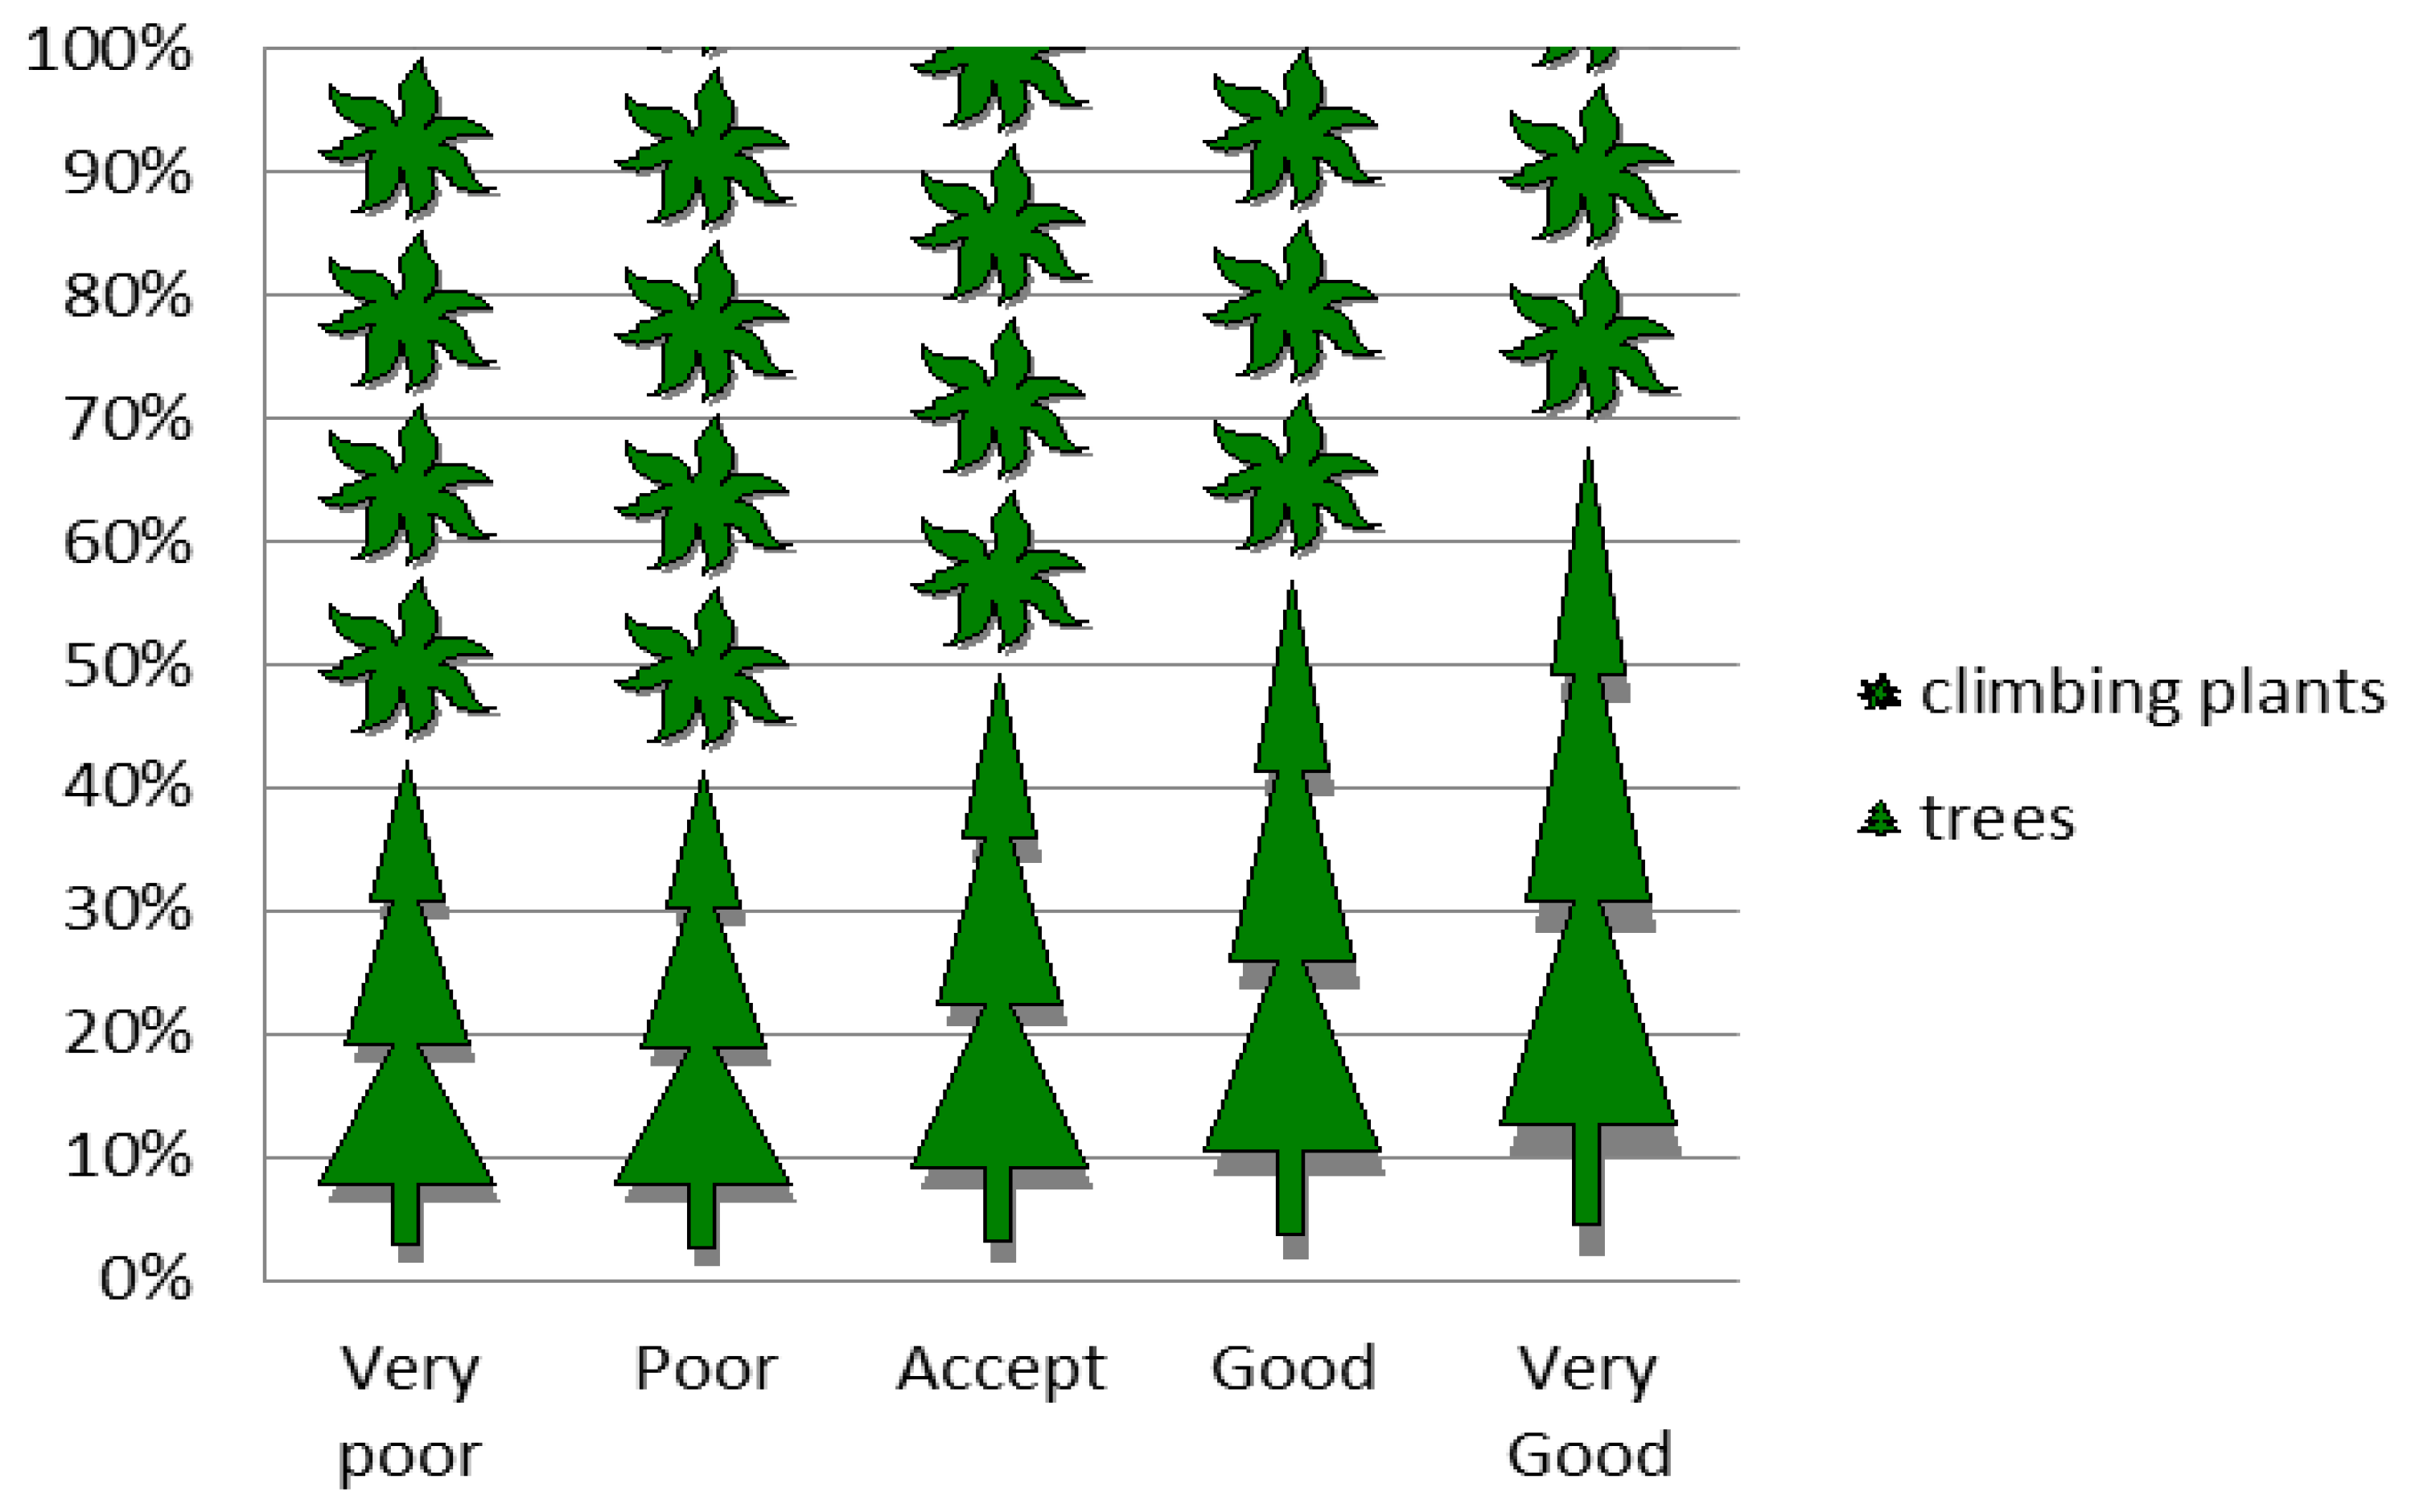
- Using vegetation to filter the view of a building, in general terms and regardless of which species is used, enhances the integration of a project into the surroundings;
- (2)
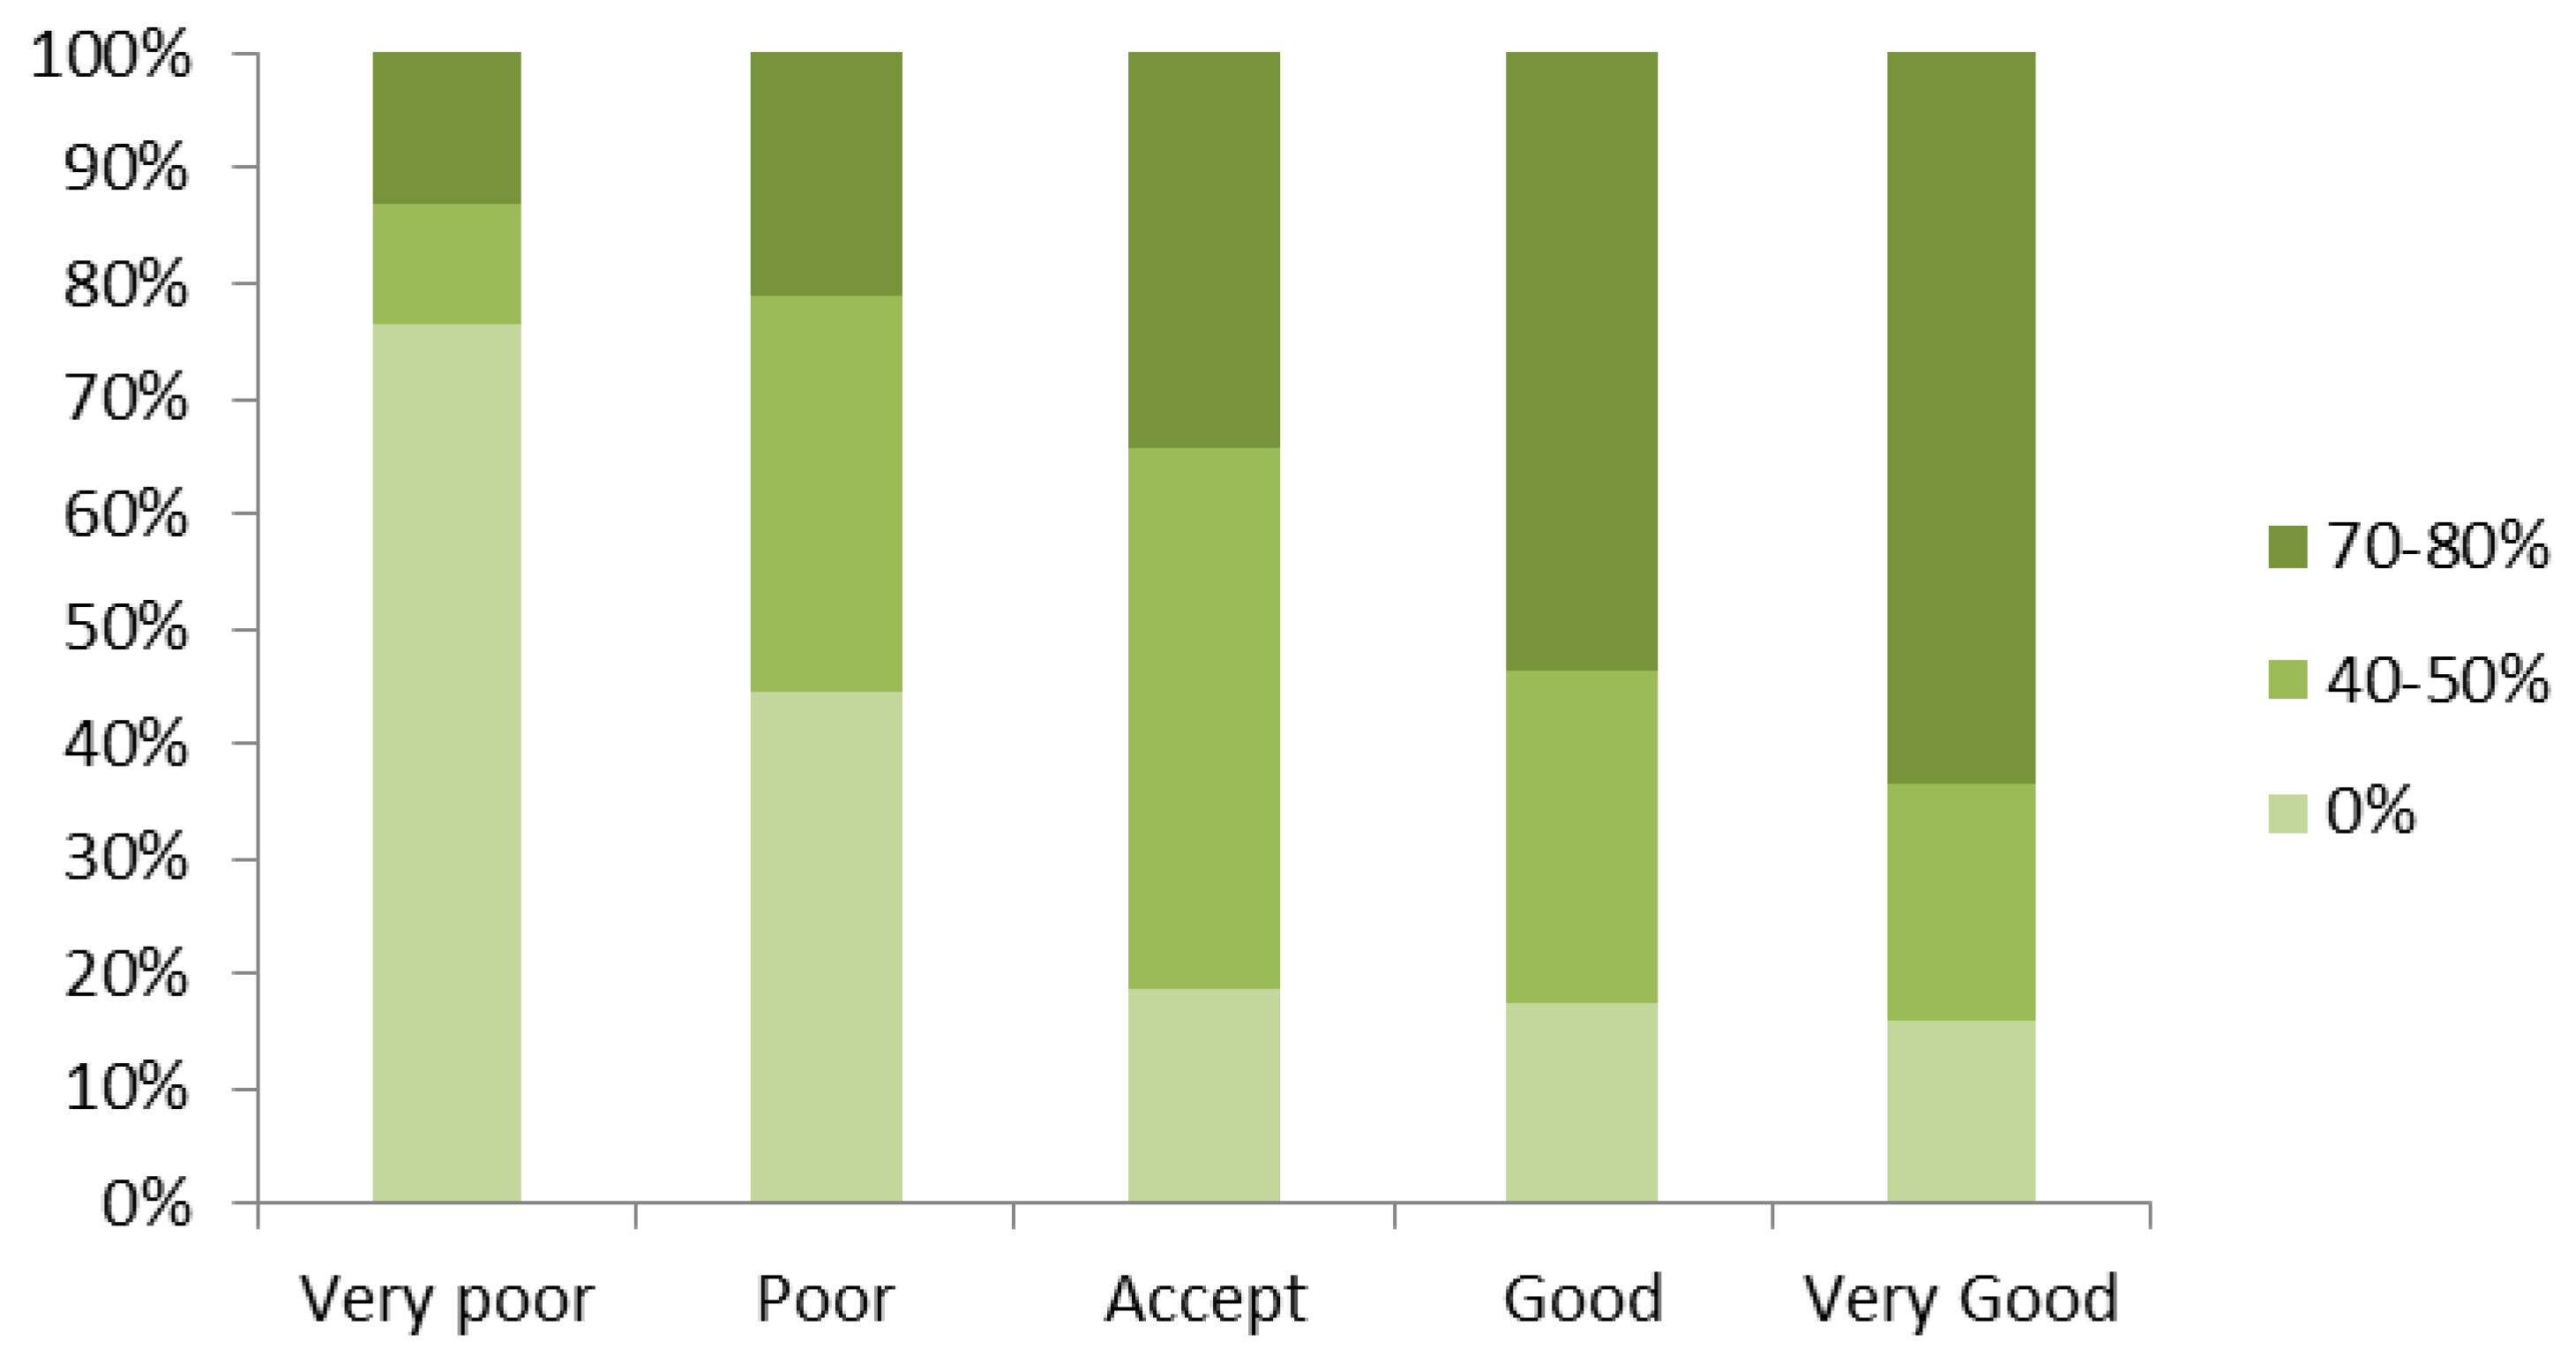
- Using vegetation with an intermediate degree of filtering in the frontal plane of a building (40–50%) increases the possibility of the perception of the façade improving from Poor or Very poor to at least Acceptable;
- (3)
- A higher percentage of filtering with vegetation (ca. 70–80%), stopping short of total concealment, always improves evaluation, increasing the probability of the integration being rated Good or Very good.
6. Future Lines
- Future lines of research could be the incorporation of new native plant species, characteristic of riverine areas, in order to expand the study areas and scenarios considered. It is also possible to advance the method of conducting the surveys, looking for not only the public opinion, but also recording their behavior and attitude during the completion of them;
- Generate an interactive virtual environment that allows respondents to modify the modelled scenarios and different elements, in addition to allowing them to freely navigate inside the modeling space.
Author Contributions
Funding
Acknowledgments
Conflicts of Interest
References
- Van den Berg, A.; Vlek, C. The influence of planned-change context on the evaluation of natural landscapes. Landsc. Urban Plan. 1998, 43, 1–10. [Google Scholar] [CrossRef]
- Schmid, W.A. The emerging role of visual resource assessment and visualisation in landscape planning in Switzerland. Landsc. Urban Plan. 2001, 54, 213–221. [Google Scholar] [CrossRef]
- Tassinari, P.; Torreggiani, D.; Benni, S. Dealing with agriculture, environment and landscape in spatial planning, A discussion about the Italian case study. Land Use Policy 2013, 30, 739–747. [Google Scholar] [CrossRef]
- Deffontaines, J.P.; Thenail, C.; Baudry, J. Agricultural systems and landscapes patterns: How can we build a relationship? Landsc. Urban Plan. 1995, 31, 3–10. [Google Scholar] [CrossRef]
- Kaplan, A.; Taşkin, T.; Önenç, A. Assessing the Visual Quality of Rural and Urban-fringed Landscapes surrounding Livestock Farms. Biosyst. Eng. 2006, 95, 437–448. [Google Scholar] [CrossRef]
- Howley, P.; Donoghue, C.O.; Hynes, S. Exploring public preferences for traditional farming landscapes. Landsc. Urban Plan. 2012, 104, 66–74. [Google Scholar] [CrossRef]
- Ryan, R.L. Local perceptions and values for a midwestern river corridor. Landsc. Urban Plan. 1998, 42, 225–237. [Google Scholar] [CrossRef]
- Hernández, J.; García, L.; Ayuga, F. Integration Methodologies for Visual Impact Assessment of Rural Buildings by Geographic Information Systems. Biosyst. Eng. 2004, 88, 255–263. [Google Scholar] [CrossRef]
- Schroeder, H.W.; Cannon, W.N. The aesthetic contribution of trees to residential streets in Ohio towns. J. Arboric. 1983, 9, 237–243. [Google Scholar]
- Serpa, A.; Muhar, A. Effects of plant size, texture and colour on spatial perception in public green areas—A cross-cultural study. Landsc. Urban Plan. 1996, 36, 19–25. [Google Scholar] [CrossRef]
- Kuo, F.E. The role of arboriculture in a healthy social ecology. J. Arboric. 2003, 29, 148–155. [Google Scholar]
- Todorova, A.; Asakawa, S.; Aikoh, T. Preferences for and attitudes towards street flowers and trees in Sapporo, Japan. Landsc. Urban Plan. 2004, 69, 403–416. [Google Scholar] [CrossRef]
- Acar, C.; Acar, H.; Eroglŭ, E. Evaluation of ornamental plant resources to urban biodiversity and cultural changing: A case study of residential landscapes in Trabzon city (Turkey). Build. Environ. 2007, 42, 218–229. [Google Scholar] [CrossRef]
- Holm, D. Thermal improvement by means of leaf-cover on external walls—A simulation model. Energy Build. 1989, 14, 19–30. [Google Scholar] [CrossRef]
- Krishan, A. Climate Responsive Architecture: A Design Handbook for Energy Efficient Buildings; Tata McGraw-Hill Education: Noida, India, 2001. [Google Scholar]
- Gómez-Muñoz, V.M.; Porta-Gándara, M.A.; Fernández, J.L. Effect of tree shades in urban planning in hot-arid climatic regions. Landsc. Urban Plan. 2010, 94, 149–157. [Google Scholar] [CrossRef]
- Luttik, J. The value of trees, water and open space as reflected by house prices in the Netherlands. Landsc. Urban Plan. 2000, 48, 161–167. [Google Scholar] [CrossRef]
- Smardon, R.C. Appraising the reliability of Visual Impact Assessment methods. In Proceedings of the National Conference on Applied Technique for Analysis and Management of the Visual Resource, Village, NV, USA, 23–25 April 1979. [Google Scholar]
- García, L.; Hernández, J.; Ayuga, F. Analysis of the exterior colour of agroindustrial buildings: A computer aided approach to landscape integration. J. Environ. Manag. 2003, 69, 93–104. [Google Scholar] [CrossRef]
- Hernández, J.; García, L.; Ayuga, F. Assessment of the visual impact made on the landscape by new buildings: A methodology for site selection. Landsc. Urban Plan. 2004, 68, 15–28. [Google Scholar] [CrossRef]
- Smardon, R.C. Perception and Aesthetics of the Urban Environment: Review of the Role of Vegetation. Landsc. Urban Plan. 1988, 15, 85–106. [Google Scholar] [CrossRef]
- Purcell, A.T.; Lamb, R.J. Preference and naturalness: An ecological approach. Landsc. Urban Plan. 1998, 42, 57–66. [Google Scholar] [CrossRef]
- Arriaza, M.; Cañas-Ortega, J.F.; Cañas-Madueño, J.A.; Ruiz-Avilés, P. Assessing the visual quality of rural landscapes. Landsc. Urban Plan. 2004, 69, 115–125. [Google Scholar] [CrossRef]
- Rogge, E.; Nevens, F.; Gulinck, H. Perception of rural landscapes in Flanders: Looking beyond aesthetics. Landsc. Urban Plan. 2007, 82, 159–174. [Google Scholar] [CrossRef] [Green Version]
- Lewis, P. Three-dimensional plant modelling for remote sensing simulation studies using the Botanical Plant Modelling System. Agronomie 1999, 19, 185–210. [Google Scholar] [CrossRef]
- Lynch, J.A.; Gimblett, H.R. Perceptual values in the cultural landscape: A spatial model for assessing and mapping perceived mystery in rural environments. Comput. Environ. Urban 1992, 16, 453–471. [Google Scholar] [CrossRef]
- Gimblett, H.R. Environmental cognition: The prediction of preference in rural Indiana. J. Archit. Plan. Res. 1990, 7, 222–234. [Google Scholar]
- Stamps, A.E., III. Mystery, complexity, legibility and coherence: A meta-analysis. J. Environ. Psychol. 2004, 24, 1–16. [Google Scholar] [CrossRef]
- Ikemy, M. The effects of mystery on preference for residential façades. J. Environ. Psychol. 2005, 25, 167–173. [Google Scholar] [CrossRef]
- Tveit, M.; Ode, A.; Fry, G. Key Concepts in a Framework for Analysing Visual Landscape Character. Landsc. Res. 2006, 31, 229–255. [Google Scholar] [CrossRef]
- García, L.; Montero-Parejo, M.J.; Hernández-Blanco, J.; López-Casares, S. Analysis of lines and forms in buildings to rural landscape integration. Span. J. Agric. Res. 2010, 8, 833–847. [Google Scholar] [CrossRef]
- Hernández Blanco, J.; García Moruno, L.; Morán, J.; Juan, A.; Ayuga, F. Estimating visual perception of rural landscapes using GIS, the influence of vegetation. J. Food Agric. Environ. 2003, 1, 139–141. [Google Scholar]
- Muhar, A. Three-dimensional modelling and visualisation of vegetation for landscape simulation. Landsc. Urban Plan. 2001, 54, 5–17. [Google Scholar] [CrossRef]
- García Mercadal, F. La Casa Popular en España; Gustavo Gili: Paris, France, 1981. [Google Scholar]
- Montero-Parejo, M.J.; García-Moruno, L.; López-Casares, S.; Hernández-Blanco, J. Visual impact assessment of color and scale of building on the rural landscape. Environ. Eng. Manag. J. 2016, 15, 1537–1550. [Google Scholar] [CrossRef]
- Montero-Parejo, M.J.; García-Moruno, L.; Hernández-Blanco, J.; Casares-López, S. Analysis of lines and forms of agroindustrial buildings: A photo-analytical approach to landscape integration. In Agricultural and Biosystems Engineering for a Sustainable World, Proceedings of the International Conference on Agricultural Engineering, Hersonissos, Crete, Greece, 23–25 June 2008; European Society of Agricultural Engineers: Silsoe, UK, 2008. [Google Scholar]
- Stamps, A.E., III. Simulation effects on environmental preferences. J. Environ. Manag. 1993, 38, 115–132. [Google Scholar] [CrossRef]
- Herzog, T.R.; Shier, R.L. Complexity, age, and building preference. Environ. Behav. 2000, 32, 557–575. [Google Scholar] [CrossRef]
- Nasar, J.L.; Stamps, A.E., III. Infill McMansions: Style and the psychophysics of size. J. Environ. Psychol. 2009, 29, 110–123. [Google Scholar] [CrossRef]
- Weber, E.H. De Pulsu, Resorptione, Auditu Et Tactu. Annotationes Anatomicae et Physiologicae; Koehler: Leipzig, Germany, 1834. [Google Scholar]
- Reichl, P.; Egger, S.; Schatz, R.; D’Alconzo, A. The logarithmic nature of QoE and the Role of the Weber-Fechner Law in QoE assessment. In Proceedings of the 2010 IEEE International Conference on Communications, Cape Town, South Africa, 23–27 May 2010. [Google Scholar]
- Stamps, A.E., III. Physical determinants of preferences for residential façades. Environ. Behav. 1999, 31, 723–751. [Google Scholar] [CrossRef]
- Akalin, A.; Yildirim, K.; Wilson, C.; Kilicoglu, O. Architecture and engineering students’ evaluations of house façades: Preference, complexity and impressiveness. J. Environ. Psychol. 2009, 29, 124–132. [Google Scholar] [CrossRef]
- Imamoglu, Ç. Complexity, liking and familiarity, architecture and non-architecture Turkish students’ assessments of traditional and modern house facades. J. Environ. Psychol. 2000, 20, 5–16. [Google Scholar] [CrossRef]
- Yao, Y.; Zhu, X.; Xu, Y.; Yanf, H.; Wu, X.; Li, Y.; Zhanf, Y. Assessing the visual quality of green landscaping in rural residential areas: The case of Changzhou, China. Environ. Monit. Assess. 2012, 184, 951–967. [Google Scholar] [CrossRef]
- Garrido-Velarde, J.; Montero-Parejo, M.J.; Hernández-Blanco, J.; García-Moruno, L. Visual analysis of the height ratio between building and background vegetation. Two rural cases of study: Spain and Sweden. Sustainability 2018, 10, 2593. [Google Scholar] [CrossRef]
- Nasar, J.L. Adult viewers’ preferences in residential scenes: A study of the relationship of the environmental attributes to preference. Environ. Behav. 1983, 15, 589–614. [Google Scholar] [CrossRef]
- Garrido-Velarde, J.; Montero-Parejo, M.J.; Hernández-Blanco, J.; García-Moruno, L. Use of video and 3D scenario visualisation to rate vegetation screens for integrating buildings into the landscape. Sustainability 2017, 9, 1102. [Google Scholar]
- Kendrick, J. Social Statistics, an Introduction to Using SPSS, 2nd ed.; Allyn and Bacon: Boston, MA, USA, 2005. [Google Scholar]
- Stamps, A.E., III. A paradigm for distinguishing significant from non-significant visual impacts: Theory, implementation, case histories. Environ. Impact Assess. Rev. 1997, 17, 249–293. [Google Scholar] [CrossRef]
- Coeterier, J. Lay people’s evaluation of historic sites. Landsc. Urban Plan. 2002, 59, 111–123. [Google Scholar] [CrossRef]
- Kongjian, Y. Cultural variations in landscape preference: Comparisons among Chinese sub-groups and Western design experts. Landsc. Urban Plan. 1995, 32, 107–126. [Google Scholar]
- Kroh, D.P.; Gimblett, R.H. Comparing live experience with pictures in articulating landscape preference. Landsc. Res. 1992, 17, 58–69. [Google Scholar] [CrossRef]
- Palmer, J.F.; Hoffman, R.E. Rating reliability and representation validity in scenic landscape assessments. Landsc. Urban Plan. 2001, 54, 149–161. [Google Scholar] [CrossRef]
- Dunn, M.C. Landscape with photographs: Testing the preference approach to landscape evaluation. J. Environ. Manag. 1976, 4, 15–26. [Google Scholar]
- Shafer, L.; Brush, R.O. How to measure preferences for photographs of natural landscapes. Landsc. Plan. 1977, 4, 237–256. [Google Scholar] [CrossRef]
- Shuttleworth, S. The use of photographs as an environmental presentation medium in landscape studies. J. Environ. Manag. 1980, 11, 61–76. [Google Scholar]
- Stewart, T.R.; Middleton, P.; Downton, M.; Ely, D. Judgments of photographs vs. field observations in studies of perception and judgment of the visual environment. J. Environ. Psychol. 1984, 4, 283–302. [Google Scholar] [CrossRef]
- Hull, R.B.; Stewart, W.P. Validity of photo-based scenic beauty judgments. J. Environ. Psychol. 1992, 12, 101–114. [Google Scholar] [CrossRef]
- Wherrett, J.R. Creating landscape preference models using internet survey techniques. Landsc. Res. 2000, 25, 79–96. [Google Scholar] [CrossRef]
- Pérez, J.G. Ascertaining landscape perceptions and preferences with pair-wise photographs, planning rural tourism in Extremadura, Spain. Landsc. Res. 2002, 27, 297–308. [Google Scholar] [CrossRef]
- Bishop, I.D.; Leahy, P.N.A. Assessing the visual impact of development proposals: The validity of computer simulations. Landscape 1989, 8, 92–100. [Google Scholar] [CrossRef]
- Tress, B.; Tress, G. Scenario visualisation for participatory landscape planning—A study from Denmark. Landsc. Urban Plan. 2003, 64, 161–178. [Google Scholar] [CrossRef]
- García, L.; Hernández, J.; Ayuga, F. Analysis of the materials and exterior texture of agro-industrial buildings: A photo-analytical approach to landscape integration. Landsc. Urban Plan. 2006, 74, 110–124. [Google Scholar] [CrossRef]
- Dockerty, T.; Lovett, A.; Appleton, K.; Bone, A.; Sünnenberg, G. Developing scenarios and visualisations to illustrate potential policy and climatic influences on future agricultural landscapes. Agric. Ecosyst. Environ. 2006, 114, 103–120. [Google Scholar] [CrossRef]
- Ghadirian, P.; Bishop, I.D. Integration of augmented reality and GIS: A new approach to realistic landscape visualization. Landsc. Urban Plan. 2008, 86, 226–232. [Google Scholar] [CrossRef]


| Zoning | ha | % |
|---|---|---|
| Core Zone | 24,385 | 12.24 |
| Buffer Zone | 113,197 | 56.84 |
| Transition Zone | 61,558 | 30.91 |
| Village | Id_case | X | Y | Height of Building (m) | Vegetation |
|---|---|---|---|---|---|
| Cepeda | CEP07 | 29T0751255 | 4484252 | 11.8 | Quercus pyrenaica1 |
| Horcajo de Montemayor | HOR05 | 30T254697 | 4479007 | 8.5 | Quercus pyrenaica1 |
| Lagunilla | LAG05 | 29T248318 | 4468147 | 8.7 | Hedera helix2 |
| Lagunilla | LAG09 | 29T248111 | 4468336 | 7 | Castanea sativa1 |
| Sotoserrano | SOT02 | 29T0751896 | 4480517 | 10 | Hedera helix and Buxus sempervirens2 |
| Valero | VAL02 | 30T0250674 | 4491342 | 8.7 | Hedera helix2 |
| Valero | VA05 | 30T0250802 | 4491561 | 8.9 | Vitis vinifera2 |
| Valdefuentes de Sangusín | VDS01 | 30T259958 | 4483514 | 9.5 | Quercus pyrenaica1 |
| Village | Case | Pixels Building | Pixels Vegetation | % Filtering |
|---|---|---|---|---|
| Valero | VAL02 50 | 214,182 | 111,509 | 52.06 |
| Valero | VAL02 80 | 214,182 | 168,162 | 78.51 |
| Lagunilla | LAG09 50 | 243,826 | 125,496 | 51.47 |
| Lagunilla | LAG09 80 | 243,826 | 191,219 | 78.42 |
| Horcajo | HOR05 50 | 48,683 | 22,162 | 45.52 |
| Horcajo | HOR05 80 | 48,683 | 35,994 | 73.94 |
| Valdefuentes | VDS01 50 | 79,467 | 35,736 | 44.97 |
| Valdefuentes | VDS01 80 | 79,467 | 59,370 | 74.71 |
| Valero | VAL05 50 | 135,648 | 76,424 | 56.34 |
| Valero | VAL05 80 | 135,648 | 101,015 | 74.47 |
| Sotoserrano | SOT02 50 | 105,378 | 48,868 | 46.37 |
| Sotoserrano | SOT02 80 | 105,378 | 76,020 | 72.14 |
| Lagunilla | LAG05 50 | 39,866 | 19,438 | 48.76 |
| Lagunilla | LAG05 80 | 39,866 | 31,930 | 80.09 |
| Cepeda | CEP05 50 | 65,953 | 28,522 | 43.25 |
| Cepeda | CEP05 80 | 65,953 | 54,426 | 82.52 |
| Source | Type III Sum of Squares (SS) | df | Mean Square (MS) | F | Sig.1 | d (Cohen) 2 |
|---|---|---|---|---|---|---|
| PF | 81.237 | 2 | 40.618 | 63.739 | 0.000 | 1.996 |
| Error (PF) | 81.569 | 128 | 0.637 | |||
| VT | 8.257 | 1 | 8.257 | 42.719 | 0.000 | 1.634 |
| Error (VT) | 12.370 | 64 | 0.193 | |||
| PF x VT | 3.275 | 2 | 1.637 | 13.147 | 0.000 | 0.906 |
| Error (PF x VT) | 15.941 | 128 | 0.125 | |||
| PF x RO | 1.029 | 2 | 0.514 | 0.807 | 0.448 | 0.225 |
| VT x RO | 0.408 | 1 | 0.408 | 2.111 | 0.151 | 0.363 |
| PF x VT x RO | 0.170 | 2 | 0.085 | 0.684 | 0.506 | 0.207 |
| Source | Type III Sum of Squares (SS) | df | Mean Square (MS) | F | Sig.1 | d (Cohen) 2 |
|---|---|---|---|---|---|---|
| Respondent_Origin (RO) | 3717 | 1 | 3717 | 4311 | 0.042 | 0.519 |
| Error | 55.180 | 64 | 0.862 |
© 2019 by the authors. Licensee MDPI, Basel, Switzerland. This article is an open access article distributed under the terms and conditions of the Creative Commons Attribution (CC BY) license (http://creativecommons.org/licenses/by/4.0/).
Share and Cite
Garrido Velarde, J.; Montero Parejo, M.J.; Hernández Blanco, J.; García Moruno, L. Using Native Vegetation Screens to Lessen the Visual Impact of Rural Buildings in the Sierras de Béjar and Francia Biosphere Reserve: Case Studies and Public Survey. Sustainability 2019, 11, 2595. https://0-doi-org.brum.beds.ac.uk/10.3390/su11092595
Garrido Velarde J, Montero Parejo MJ, Hernández Blanco J, García Moruno L. Using Native Vegetation Screens to Lessen the Visual Impact of Rural Buildings in the Sierras de Béjar and Francia Biosphere Reserve: Case Studies and Public Survey. Sustainability. 2019; 11(9):2595. https://0-doi-org.brum.beds.ac.uk/10.3390/su11092595
Chicago/Turabian StyleGarrido Velarde, Jacinto, María Jesús Montero Parejo, Julio Hernández Blanco, and Lorenzo García Moruno. 2019. "Using Native Vegetation Screens to Lessen the Visual Impact of Rural Buildings in the Sierras de Béjar and Francia Biosphere Reserve: Case Studies and Public Survey" Sustainability 11, no. 9: 2595. https://0-doi-org.brum.beds.ac.uk/10.3390/su11092595