1. Introduction
In recent decades, the concept of biophilia (a deep affiliation humans have with Nature) has received a great deal of attention from designers and planners, investors and end users [
1,
2,
3,
4]. The term itself has been used by researchers and practitioners in various fields, and different interpretations exist about its meaning [
5,
6]. There are also variances in the application of biophilic design in the built environment [
7].
For the purpose of this paper, we will refer to biophilia to mean the beneficial characteristics of the natural world that improve human health, well-being and productivity, in relation specifically to indoor ornamental plants [
8]. There are numerous reasons that have instigated the above changes in design of the human-made environment. This includes: increased urbanization, environmental concerns that directly impact human health and wellbeing, and new research from fields such as sustainability, environmental psychology, biology and medicine that provide valuable new facts and perspectives on this subject.
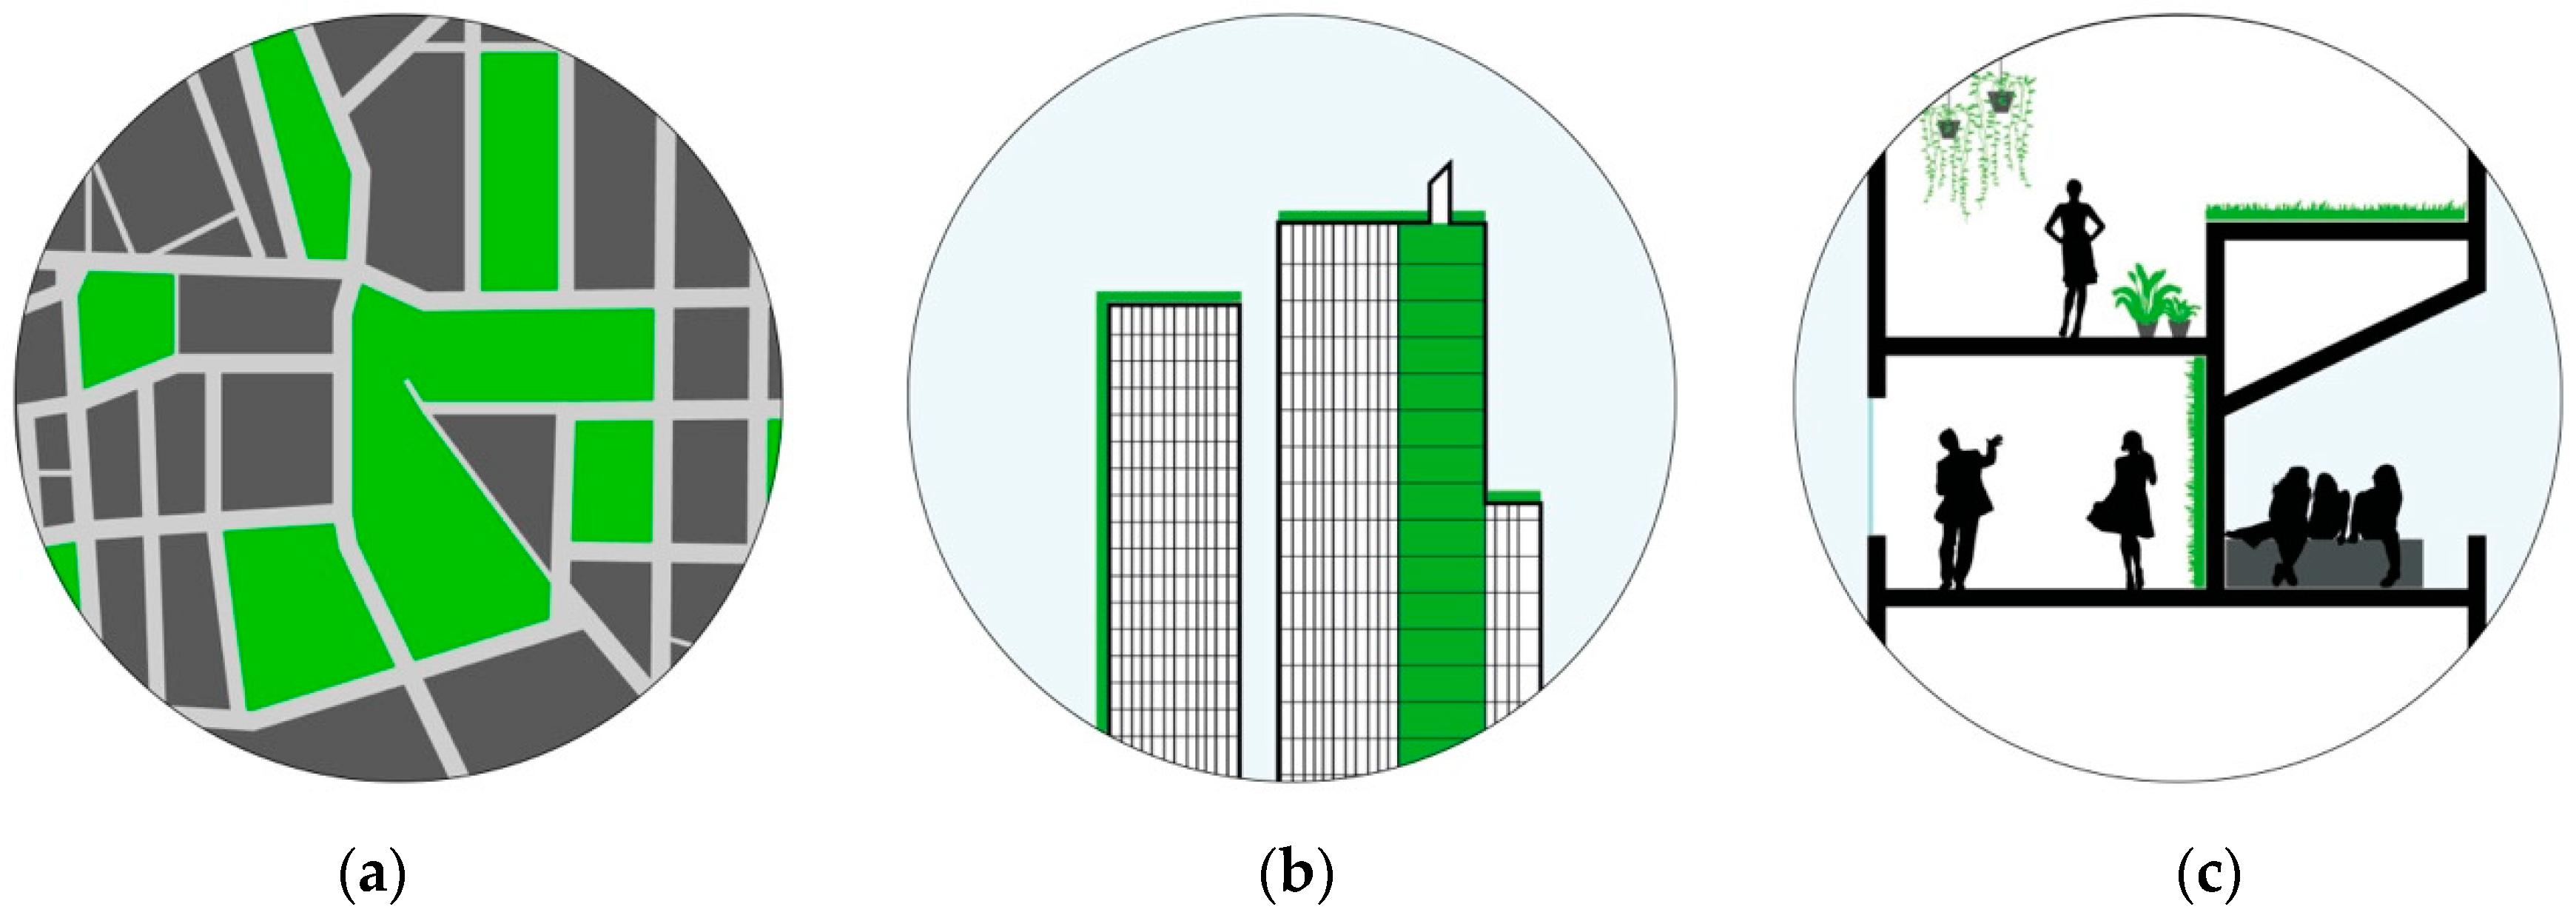
In order to address these requirements, a new strategy was developed in the built environment that involve three distinct levels as explained below. Green areas and plants have been introduced into our cities in the following ways: (a) as urban greening—new parks, green urban squares, community gardens etc. to encourage contact with nature and to improve outdoor air and temperature quality; (b) integrated into buildings as green facades/walls and roofs to attract insects and animals for improved biodiversity, whilst better managing the temperature of buildings inside and out; (c) the indoor application of ornamental plants for the well-being of users (
Figure 1).
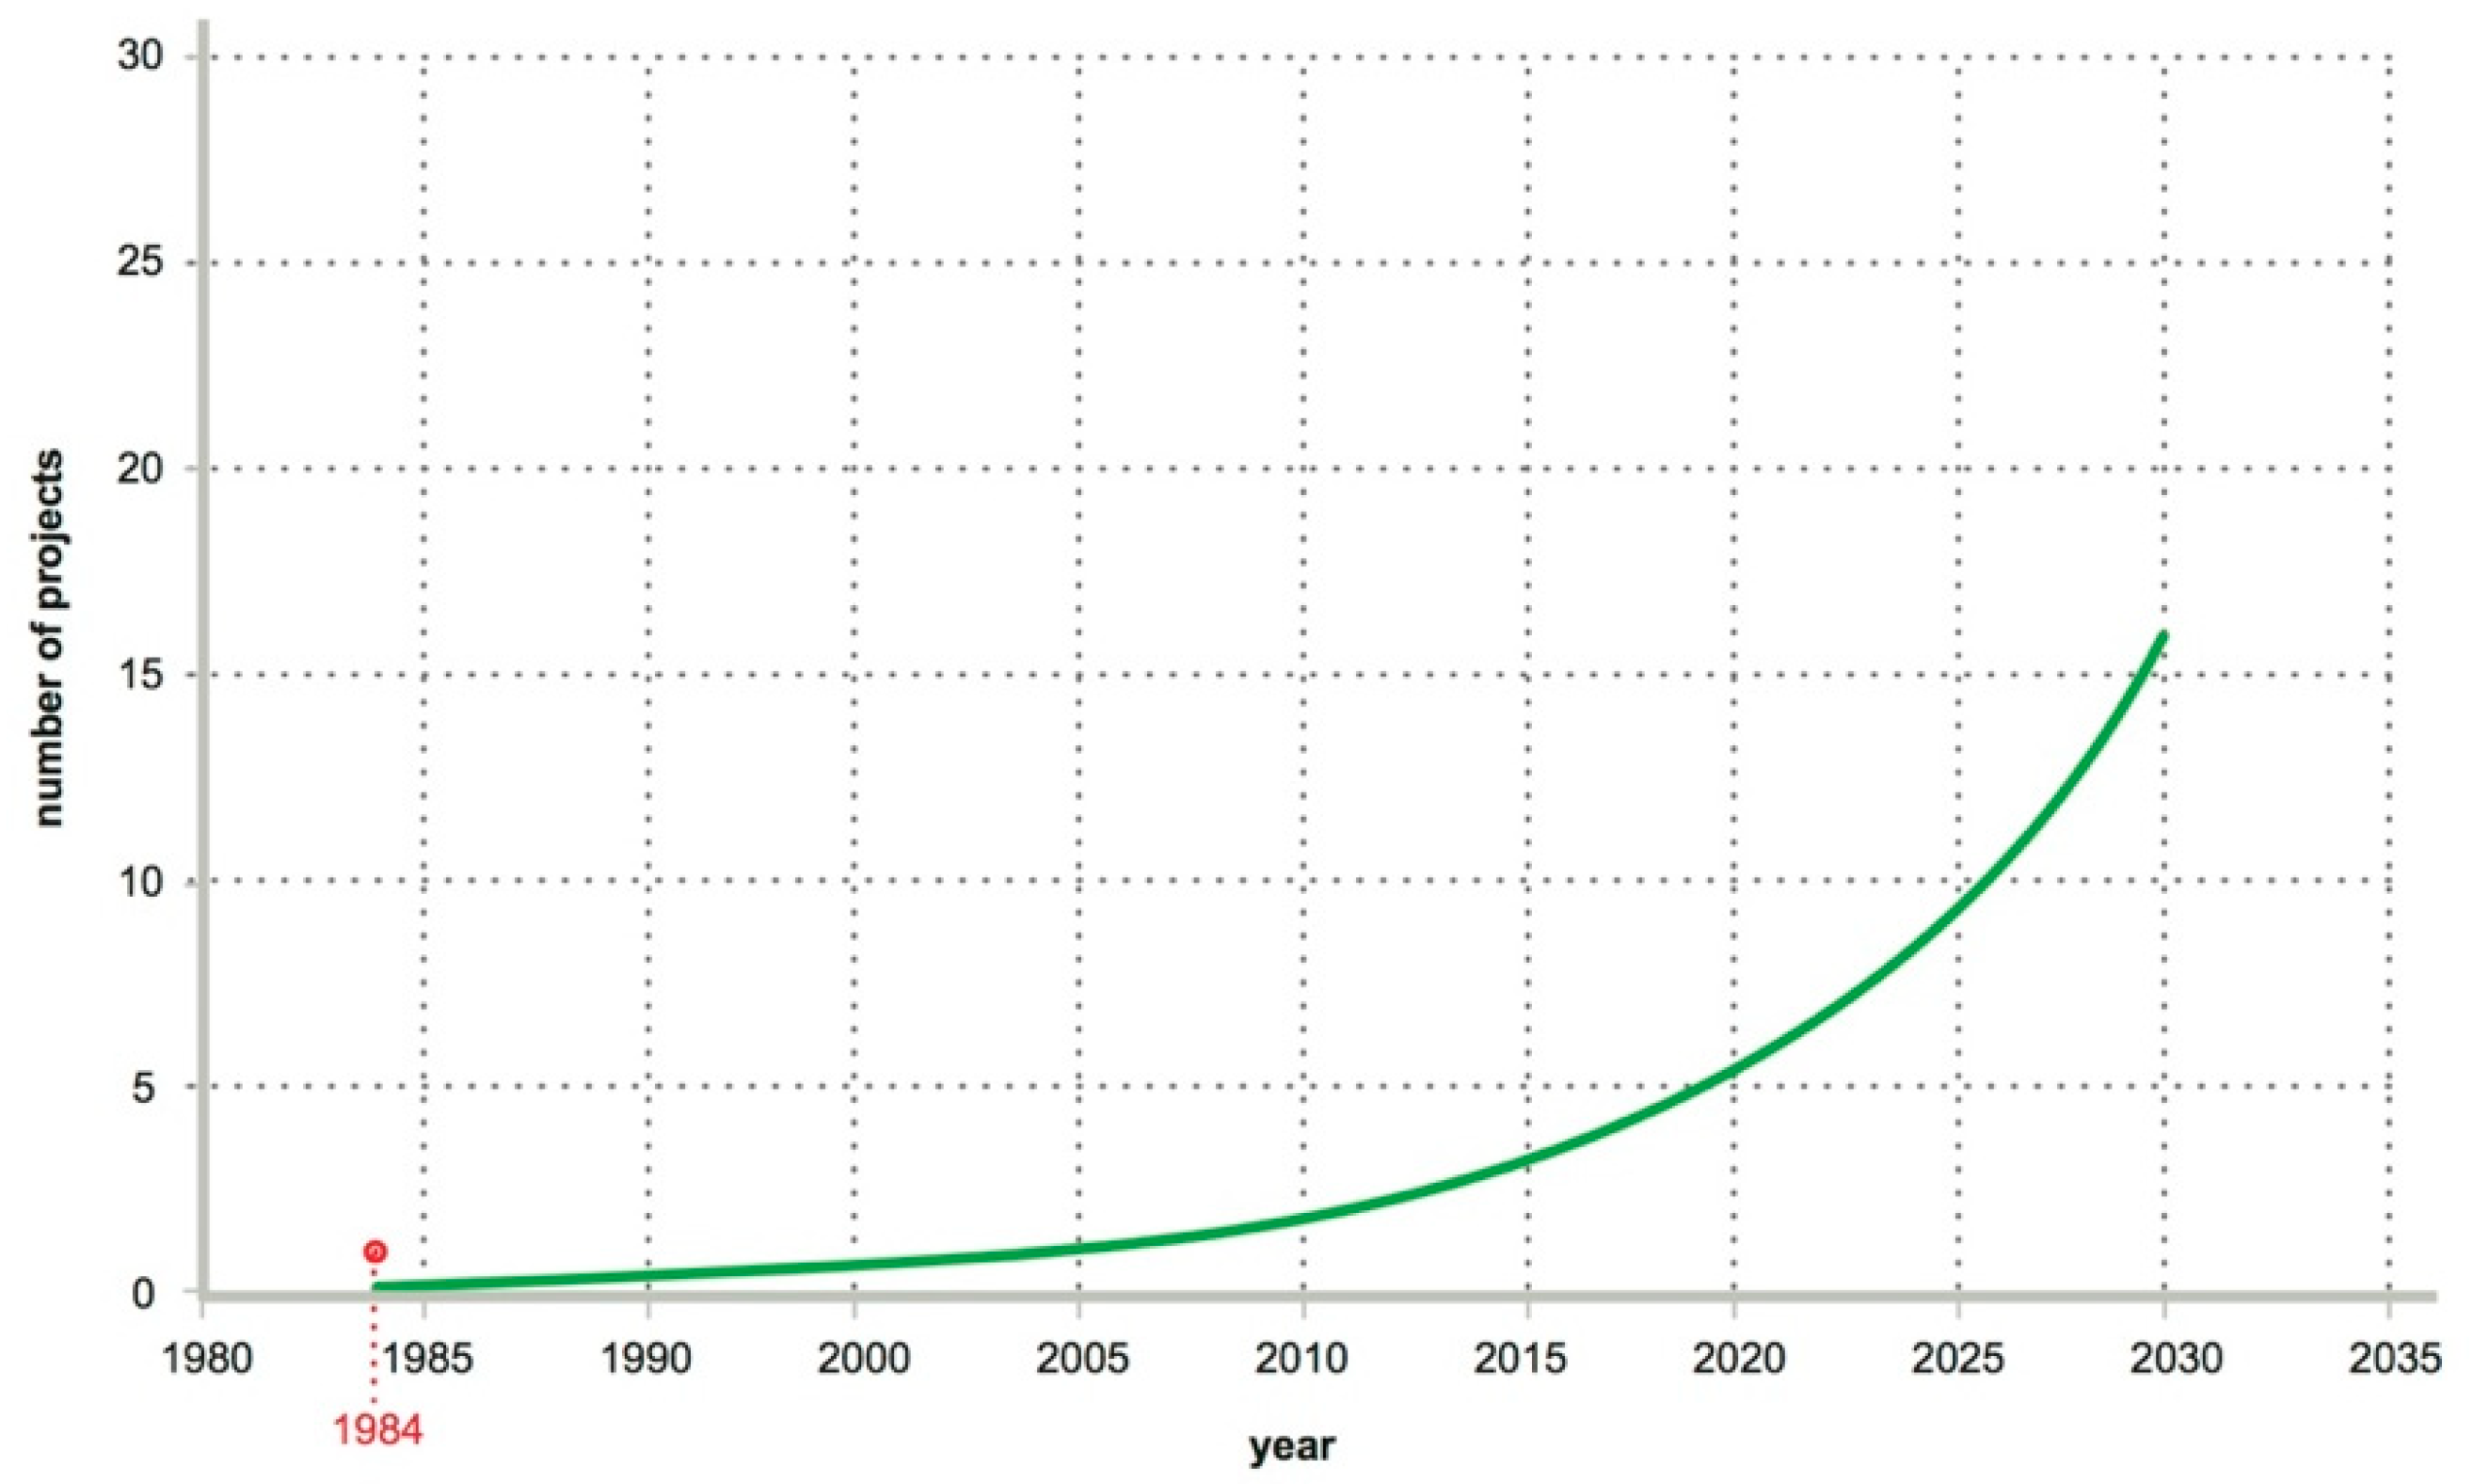
Due to environmental issues [
9,
10,
11], at the turn of the 21st century, a significant global trend developed where biophilic design principles were used in the projects of internationally recognized architectural practices (
Figure 2).
Additionally, the philosophy of green architecture [
12] began to be widely advocated for the integrity of a building’s environment and the health of its occupants. This involves a conscious approach to minimizing a building’s negative environmental impact by applying appropriate sustainable energy sources, buildings materials and processes. As a consequence, various certification programs and standards have been established with measurable criteria for the design and construction of environmentally responsible buildings [
13]. Yet, despite efforts to include biophilic design in building standards and certification systems today, the requirements for the illumination of plants based on natural or artificial lighting has not been specified, nor have evaluation methods been provided.
Buildings with poor air quality often contribute to sick building syndrome (SBS) and occupants can suffer from headache, fatigue, eye and throat irritation, and breathing difficulties [
14]. Thriving, healthy decorative plants can reduce pollutants and appreciably improve indoor air quality [
15].
Lastly, recent research identifies the strong connection between humans and nature. As many people spend the vast majority of their time in enclosed workspaces, views of green plants inside buildings can increase productivity [
16,
17], attention [
18], performance [
19] and reduce stress [
20] therefore, improving their general physical health and mental well-being [
21].
The practice of Horticulture has been applied for many years, enabling the intensive commercial cultivation of plants for food (fruits, vegetables) and plants for ornamental use (cut flowers, pot plants, and greenery, as well as nursery crops such as shrubs, trees, and climbers) [
22]. Yet, a review of existing research and literature shows there is a lack of science-based evidence and knowledge about the complex set up for the visually and biologically effective illumination of ornamental plants in indoor spaces.
Based on the practical experience of the authors and a review of literature, it is clear that existing lighting solutions for horticulture plants cannot be applied to indoor environments as the functions and end purposes are different. As there are no worldwide established standards and recommendations regarding how to correctly illuminate ornamental plants, research in this field seems to be important and necessary.
The main research goal is to establish sustainable design principles when applying new light sources such as LEDs to illuminate ornamental plants. An additional aim is to answer questions about the optimal action spectrum for visually and biologically effective illumination, and the visual effects of monochromatic LEDs applied singly or in combination as mixed LEDs. Lastly, this study might contribute to the development of regulations for the illumination of ornamental plants in biophilic design for high-quality interior spaces.
2. Background Research
An extensive background study was undertaken for nine months involving biophilic design and the illumination of ornamental indoor plants in sustainable, green architecture. This research consisted of a thorough review of published building standards and certification systems, lighting standards, books, scientific research papers and reports, interviews with a plant specialist, as well as the investigation of a number of realized green, sustainable architecture and biophilic design projects around the world.
2.1. Literature Review on the Illumination Requirements for Indoor Plants
Over time, plants evolved on Earth to survive in diverse settings. While they adjusted to their environment, many cannot easily adapt to new and changing human-made conditions. In order to grow well and look healthy, very often plants placed in interior spaces require similar conditions that best match their original, native environments. This involves the air, rainfall, soil, temperature, as well as the quality and quantity of light they would have be exposed to, along with a correct light cycle (exposure to daylight and darkness).
2.1.1. Horticulture Lighting: Food Plants Versus Ornamental Plants—Characteristics and Requirements
To meet the demands and consumer habits of an increasing world population, human food and non-food commercial production are both becoming more reliant on horticulture: the practice of intensively cultivating year-round plants in indoor facilities. Yet, there are important differences between the conditions needed for horticultural food plants and ornamental plants (
Table 1). The end application of plants also defines different requirements for the development speed and the coordinated growth time of their various parts (
Table 2).
For food production, light should support the fast growth of the seedling, encourage improved branching density (more branches with pollinated blossoms equals more fruit), help to increase the size of leaves (more leaves equals increased biomass) and also intensify the flowering/fruit cycle independent of the seasons to maximize production volume. In contrast, ornamental plants seem to require two distinctive phases of growth for the visible shape and structure of the plant which provide strong roots, compact shoot system with appropriate branching density and leaf size.
In order to provide proper illumination for ornamental plants in indoor spaces, it is necessary to have a complete picture of the impact of various wavelengths of light spectrum on photosynthesis, photomorphogenesis, phototropism and photoperiod.
Although it is been known for a long time that both natural and artificial light affects plants [
23], unfortunately, comprehensive research studies are lacking, and only a few have examined the response of ornamental plants to diverse wavelengths of LED light as well as their specific wavelength ratios (
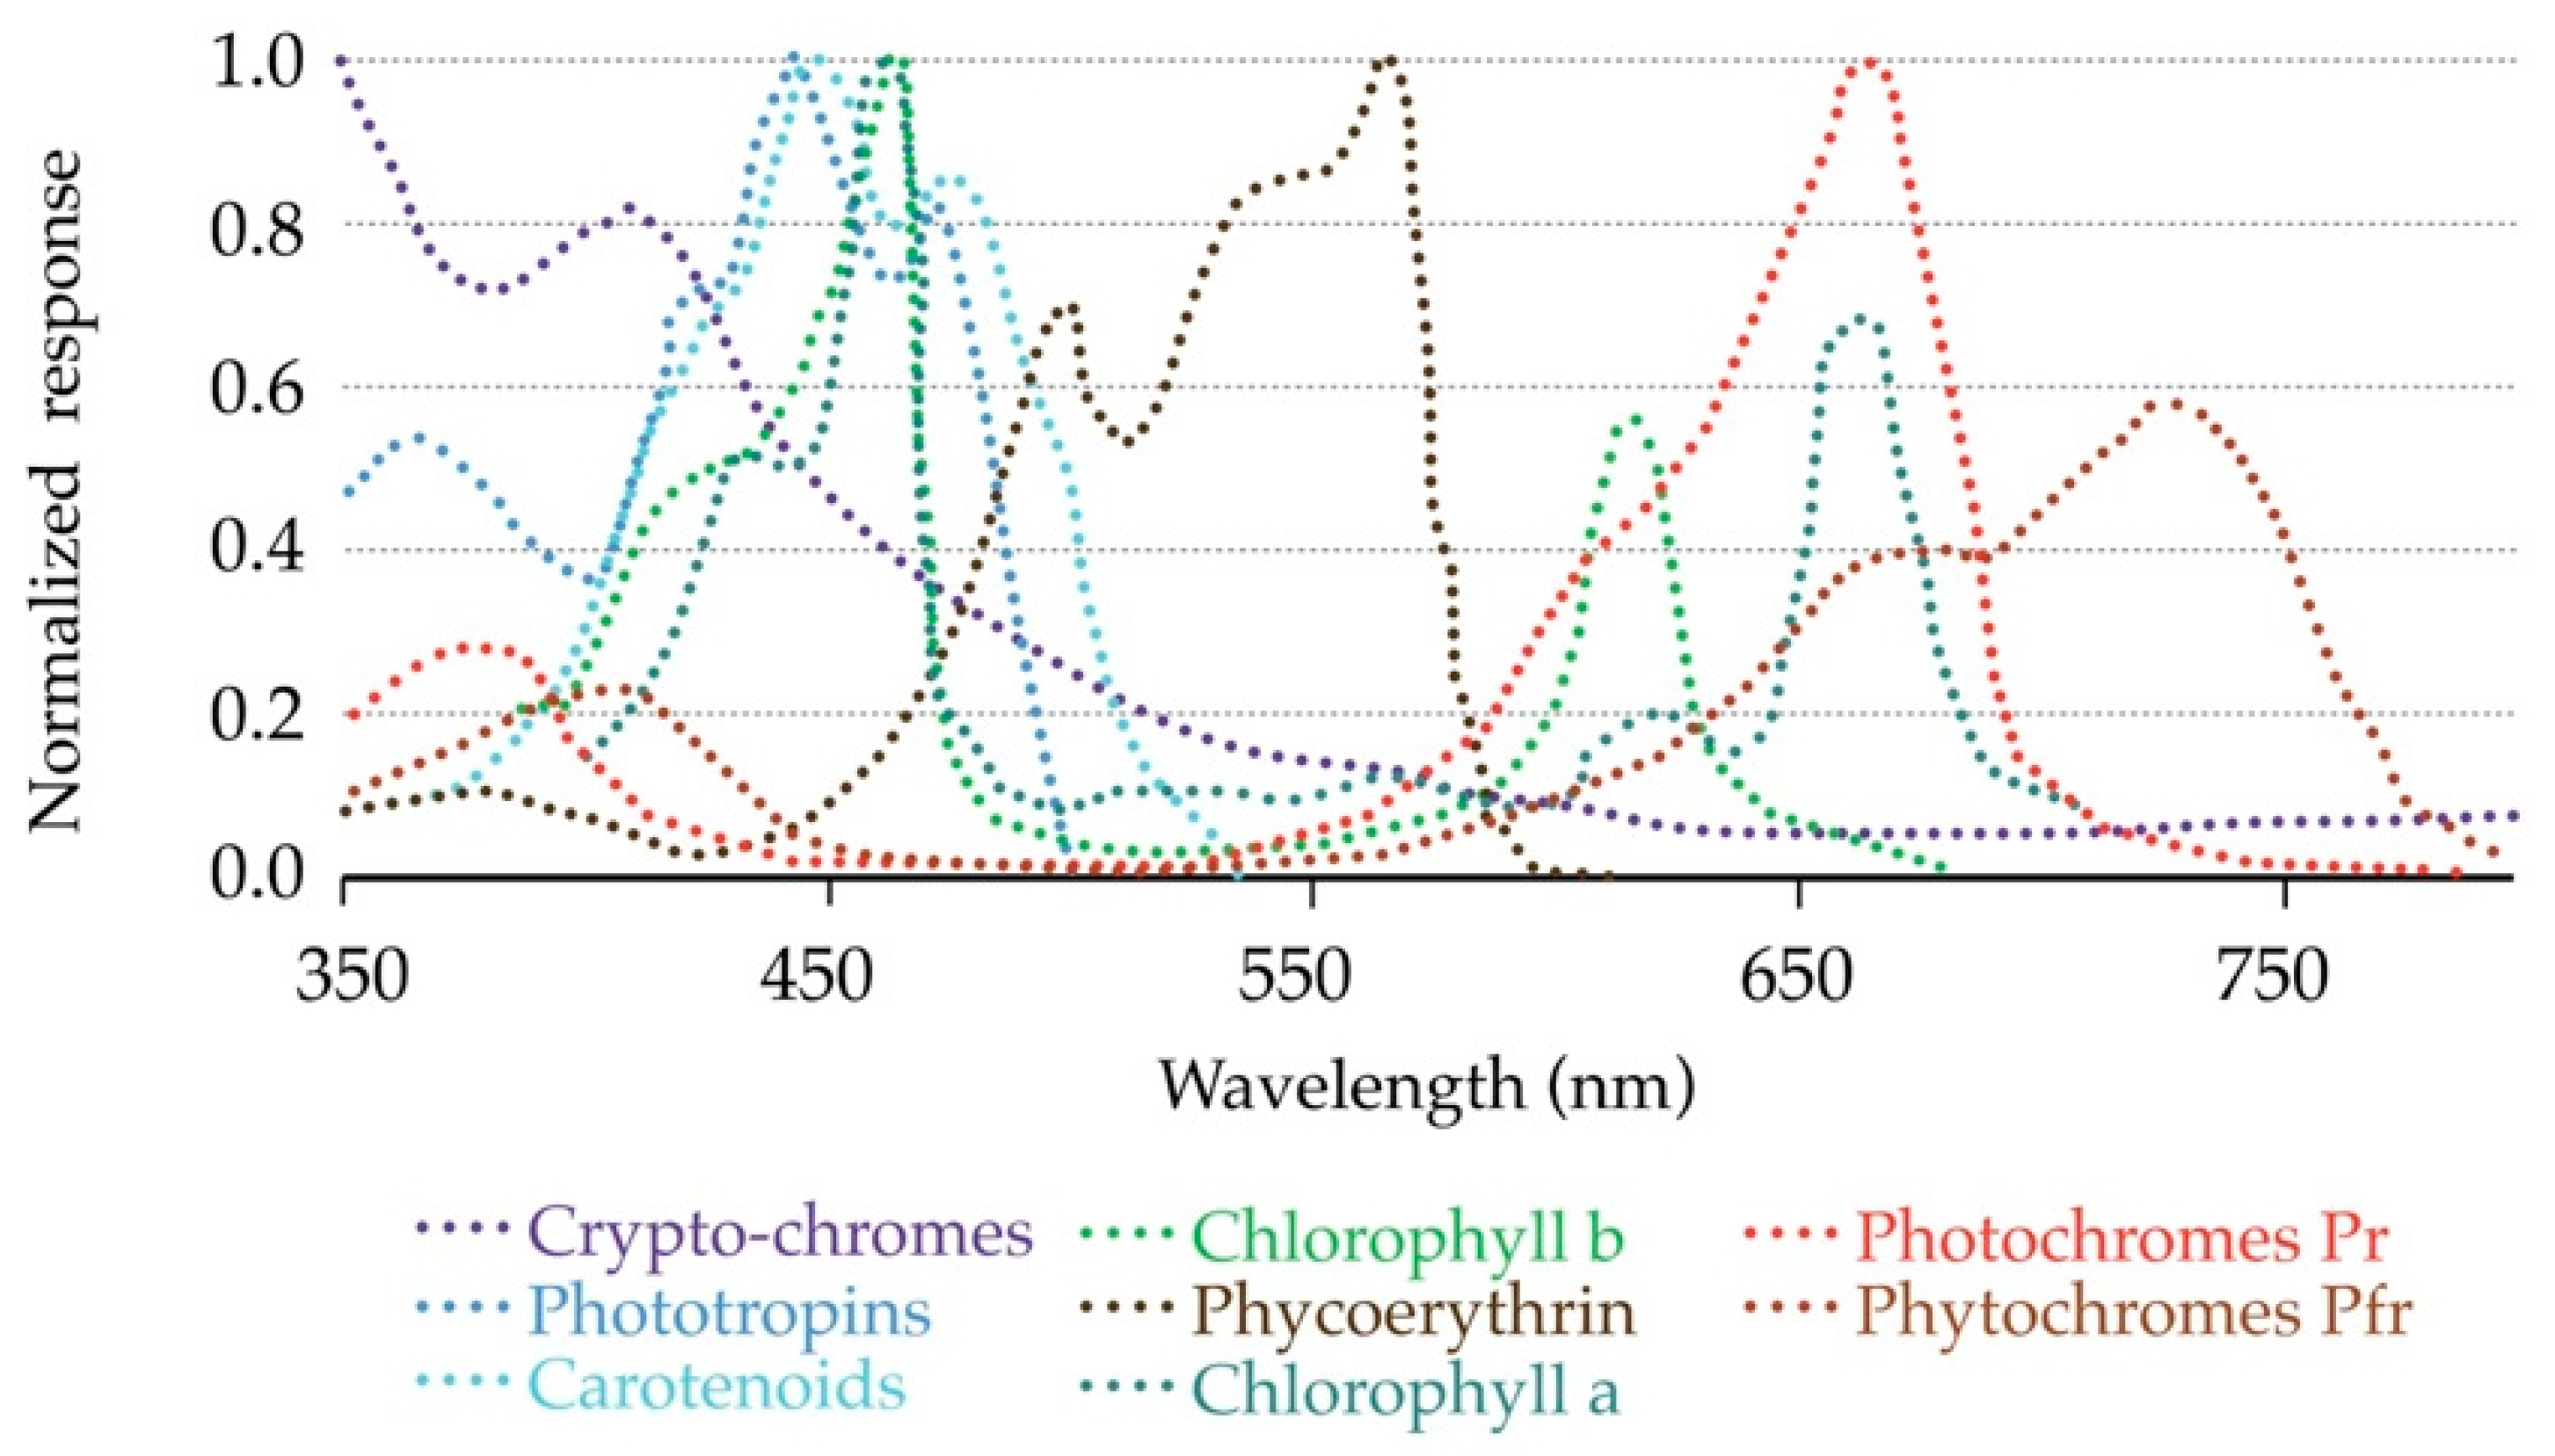
Table 3). Furthermore, this table indicates research is lacking on the impact of UV-A and UV-B, the green part of the spectrum (495–570 nm) and infrared (IR). This is most likely due to the fact that such investigations are a complex undertaking as most plants have numerous groups of photoreceptors (
Figure 3) that respond to a broad range of wavelengths and light intensities [
24].
While plants require the UV light present in daylight, there is a reluctance to introduce this part of the spectrum into interior spaces due to concerns about safety and the negative effects it may have on human skin, such as aging, burns and cancer, and the potential damaging effects of UV wavelengths to the human eye [
25].
In regards to green wavelengths of light, the horticulture industry has deliberately overlooked using green light for food production because it was believed plant illumination should emit mostly blue and red light as it is assumed they provide the most effective photosynthesis reaction [
26]. However, recent research shows that even though the leaves of plants do absorb blue and red wavelengths of light via chlorophyll, green wavelengths of light can penetrate deeper into the plant’s leaves and therefore can perform photosynthesis process in a more efficient manner [
27].
For optimal visual perception of indoor ornamental plants, the color of leaves should best match the way plants appear in outdoor daylit conditions. As horticultural lighting uses a limited part of the visible spectrum, such lighting gives a very unnatural appearance to the leaves of plants and is unsuited. Plants also have photoreceptors called phytochromes that can sense and react to ambient temperatures [
28], as well as to IR light which is necessary for the photoperiod and photomorphogenesis of plants, meaning a broad spectrum of light is necessary.
Additionally, according to existing findings, the effect of light quality appears to be different based on the plant species, its phase of development, and also environmental conditions. Therefore, if ornamental plants are grown purely under artificial lighting, which can impact their visual appearance and biological function, it seems advisable to consider the plant’s evolutionary disposition and to replicate as close as possible, the characteristics of broad spectrum solar radiation via LED lighting technology.
2.1.2. Natural Versus Artificial Illumination in Interior Spaces for Ornamental Plants
Daylight is the most favorable type of illumination for the growth and health of ornamental plants as it provides the necessary energy and spectral quality. Unfortunately, it is challenging to deliver such natural illumination in indoor spaces due to various factors. Exposure to daylight might be insufficient as plants may only receive side illumination from windows. (It rarely comes from above, via skylights, as would occur in nature in the form of direct sunlight at the zenith, or filtered sunlight through a tree canopy). And with an open-plan layout, plants might be located too far away from windows to receive necessary illumination.
Another important factor to consider is that most window glazing specified in workspaces today, filter out infrared and UV wavelengths of light. This helps to reduce the heat/temperature of interior spaces [
30] and minimize exposure to UV light, considered harmful to humans’ vision and skin [
31,
32]. Such filtering also helps to prevent the discoloration and fading of colors in interior finishes and furniture [
33].
To avoid thermal overload from direct sunlight, shading systems are usually installed in sustainable buildings. Whenever the use of ornamental plants indoor are part of the interior/architectural design, shading needs to be balanced with the daylight situation and occupancy of the space to optimize the positive impact of daylight on ornamental plants.
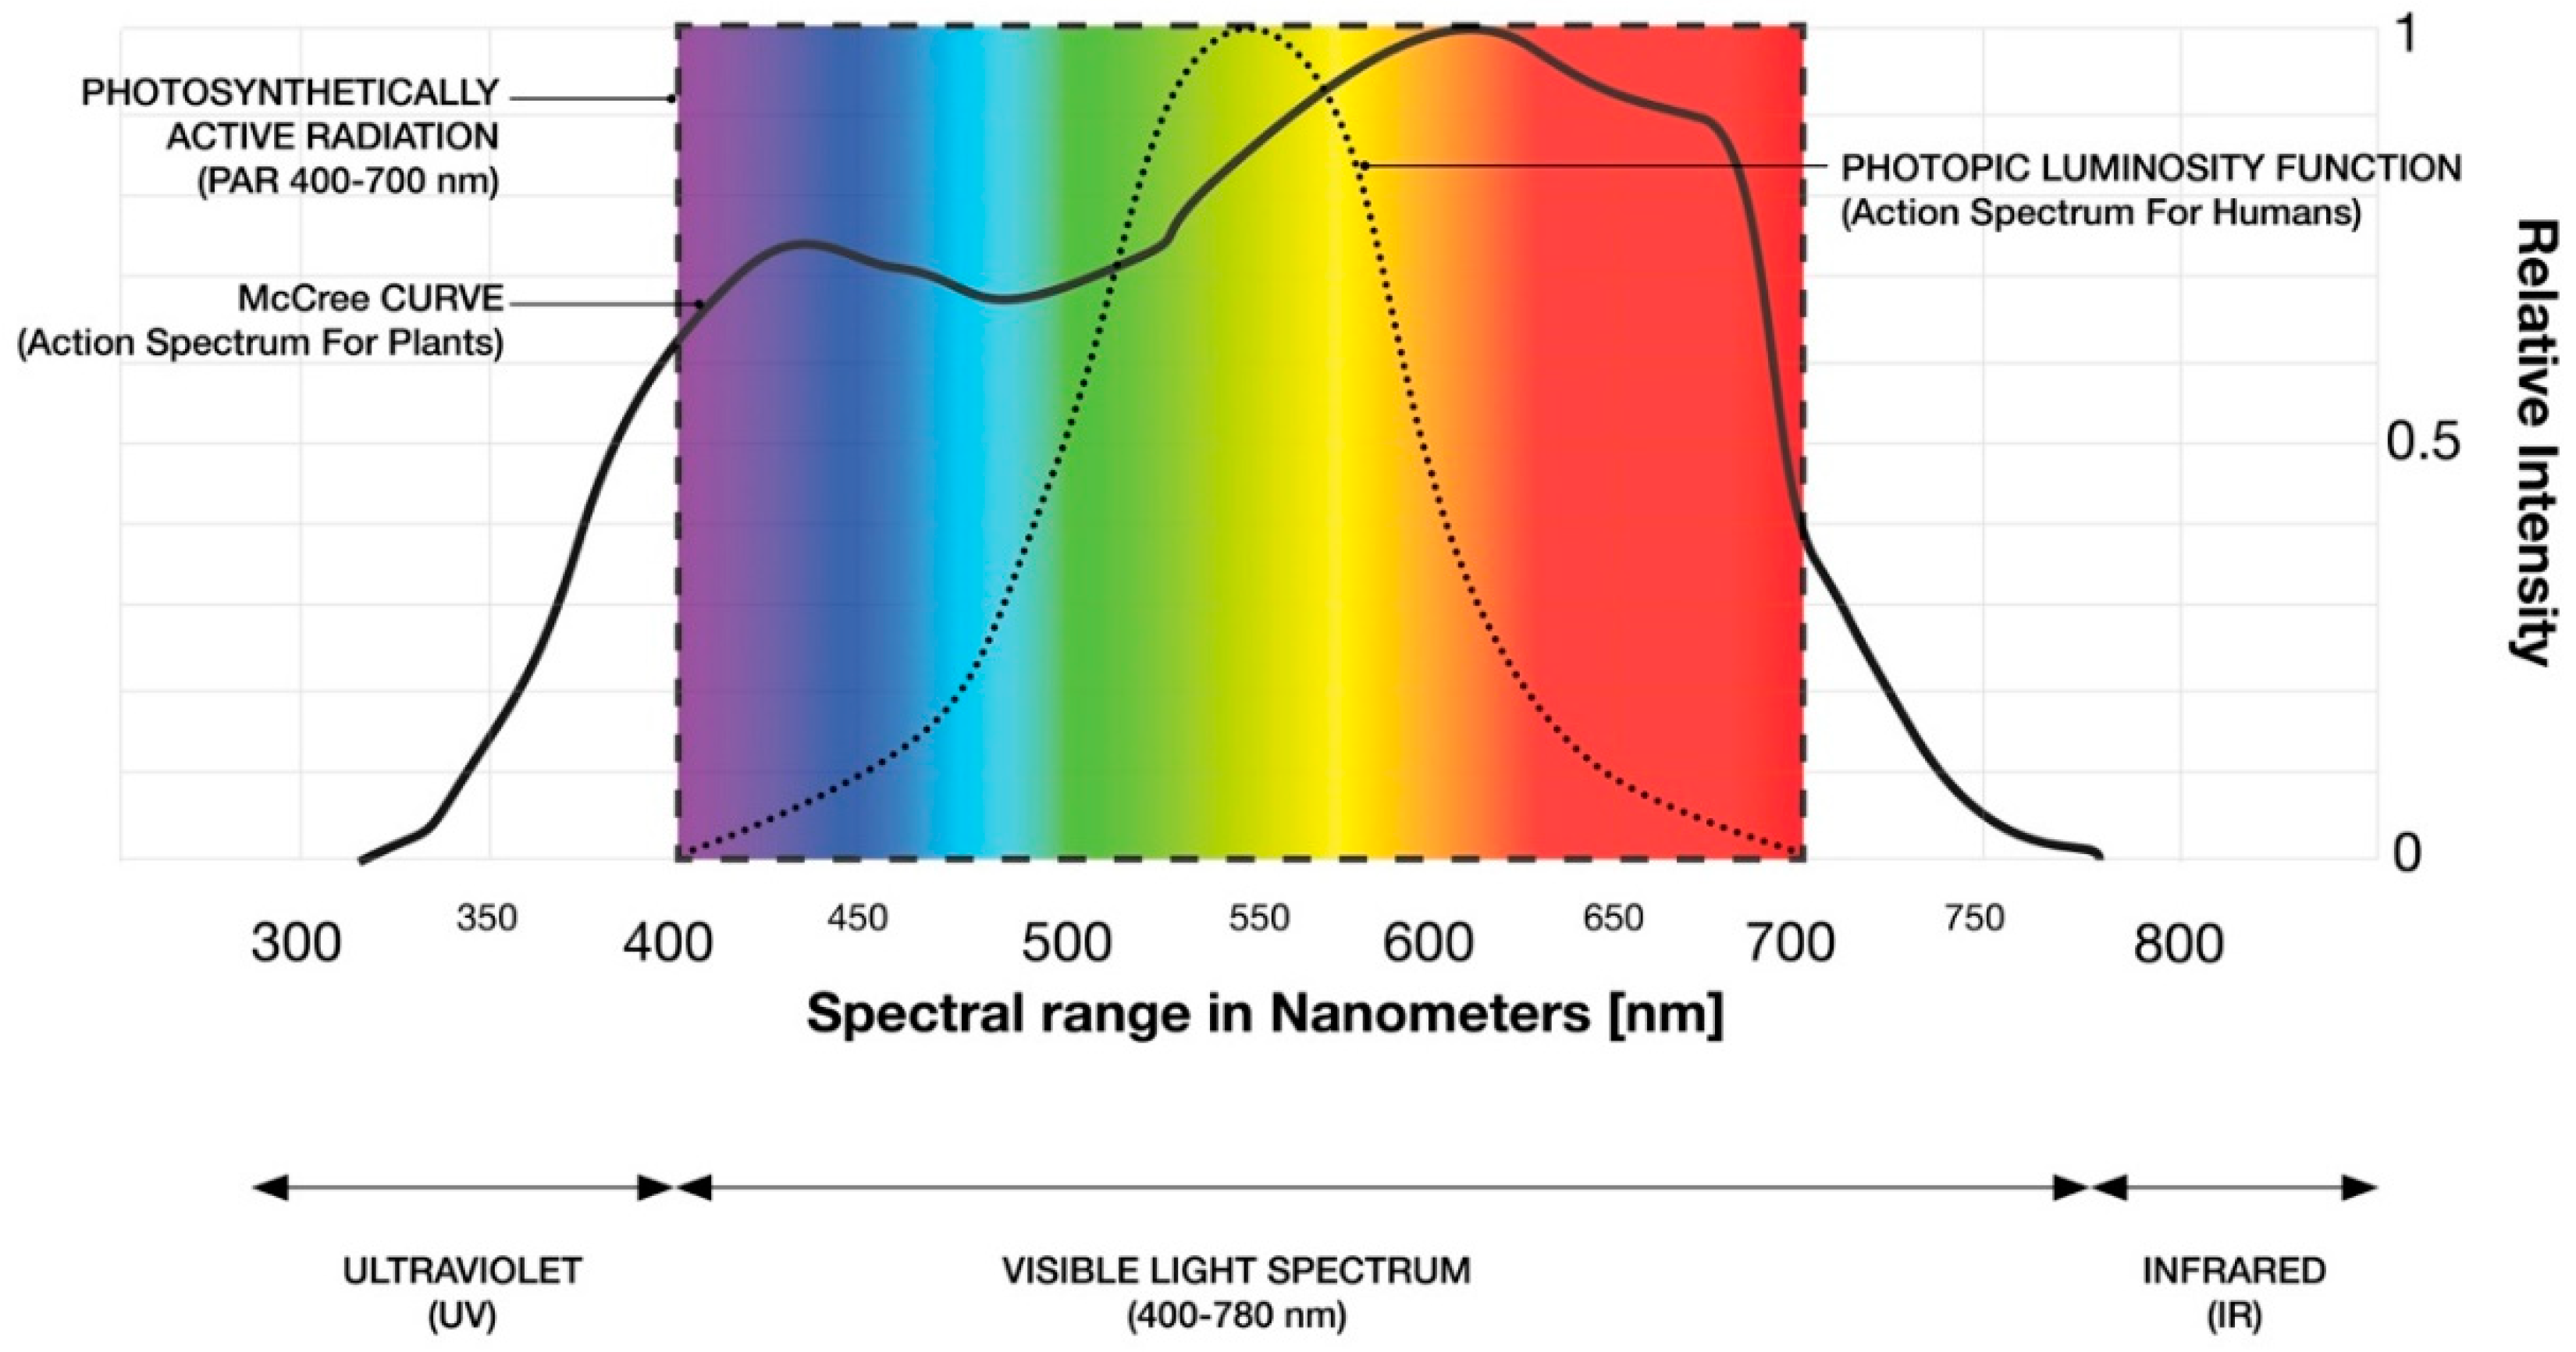
In the 1970s, the average photosynthetic response of plants to light energy was first established, based on the technology of that time. It was called the McCree curve and provided a universal average of the light absorption curves for different plant species [
34]. It is still commonly used nowadays as a reference for the illumination used in horticultural food production. In this context, it is important to understand, that McCree’s work was based on measuring only single-wavelength treatments for single-leaves. After more than 40 years, lighting technology has dramatically changed. Today, it provides new potential and opportunities in adjusting and applying the specific wavelengths and spectral power distributions (SPDs) in a far more precise and customizable way with the help of lighting control systems. (SPD shows in a graph form, the quantity of radiant power across the visible spectrum of wavelengths of light). As recent research reveals plants require the full spectrum of light [
35], future studies will hopefully lead to more precise knowledge about the growing requirements of specific ornamental plant species [
36].
Although the advancement of LED technology means there are many horticultural luminaires available on the market, most of them are for food production. They still use monochromatic or a mix of two wavelengths to create the commonly recognized magenta color which are not applicable for ornamental plants (
Figure 4). Typically, the usage of this type of mixed spectra of blue and red light with a 1:1 ratio, is selected for the growth of leafy green vegetable plants when the visible assessment of plant health is deemed unimportant.
2.2. Literature Review on Interior Illumination Requirements for Humans’ Visual Perception and Comfort in Indoor Spaces
To sufficiently illuminate interior spaces of living and working environments for the visual perception and comfort of humans, it is necessary to understand the way human beings perceive (understand) their physical environment in space and time. (Visual perception is established via continuity between interior and exterior spaces, as well as receiving and interpreting information about the outside world.) This means in the built environment, connection to the outside world is of utmost importance as daylight provides stimuli and cues about the time of the day.
Daylight should be the preferred source of light for spaces used by humans as its characteristics can’t be fully replicated by artificial lighting. It is also crucial to provide the right degree of light by ensuring adequate exposure in terms of specific room depth, window size, and daylight access from the outside. The geographical location, seasons, time of the day, and solar gain are also influencing factors, so a daylight management system can be applied (automated shading and dimming control) without compromising the views to outside. If daylight is insufficient, it should be supplemented with well-designed artificial illumination with continuous, broad spectrum visible light, and biologically effective light that relates to a day/night rhythm should also be implemented.
Light distribution, the direction of light, as well as vertical and horizontal illuminance levels have a noticeable influence on how architectural space is perceived by humans. It is vital to provide illuminance levels for visual acuity in the room on walls, the ceiling and vertical objects which gives primary information of one’s position in the space. Different objects must also receive adequate light (when light falls on an object, the reflected light is detected by the human eye so the object becomes visible). Additionally, enough light has to be projected onto the horizontal planes such as the floor and working surfaces to enable vision and to support visual tasks performed in the space. A combination of direct and indirect lighting will provide appropriate contrast ratios and visual acceptance for the end user. To create an appealing atmosphere in interior spaces, artificial lighting needs to be designed with a good understanding of the following two quantitative measurable characteristics of visible light which describe light quality: (1) high color rendering index (CRI) and (2) the correlated color temperature of light (CCT). (The CRI of a light source indicates how accurately a light source reproduces surface colors in comparison to daylight, measured on scale 1–100. CCT is a description of how warm or cool a light source appears to the human eye, measured in degrees Kelvin (K)).
Lastly, it is essential for visual comfort to manage glare by specifying appropriate luminaires, and to use matt surfaces to reduce reflectivity.
The upcoming implementation of CEN Daylight of Buildings Standard prEN 17037 and its specific requirement to improve the health and wellbeing of occupants, requires access to natural light and an outside view for eye focus relaxation. While there are different forms of artificial light available today, natural daylight is superior and remains the healthiest of all sources of illumination for humans.
Unfortunately, in many cities, buildings are densely placed together and often tall which causes overshadowing. The popularity of open plan offices also means it is impractical and sometimes impossible for occupants to have an exterior view. Therefore, the introduction of well-designed sustainable, green architecture and the application of ornamental plants seems to be a beneficial and useful design solution. In the indoor environment, humans as end users will greatly gain from a view of ornamental living plants.
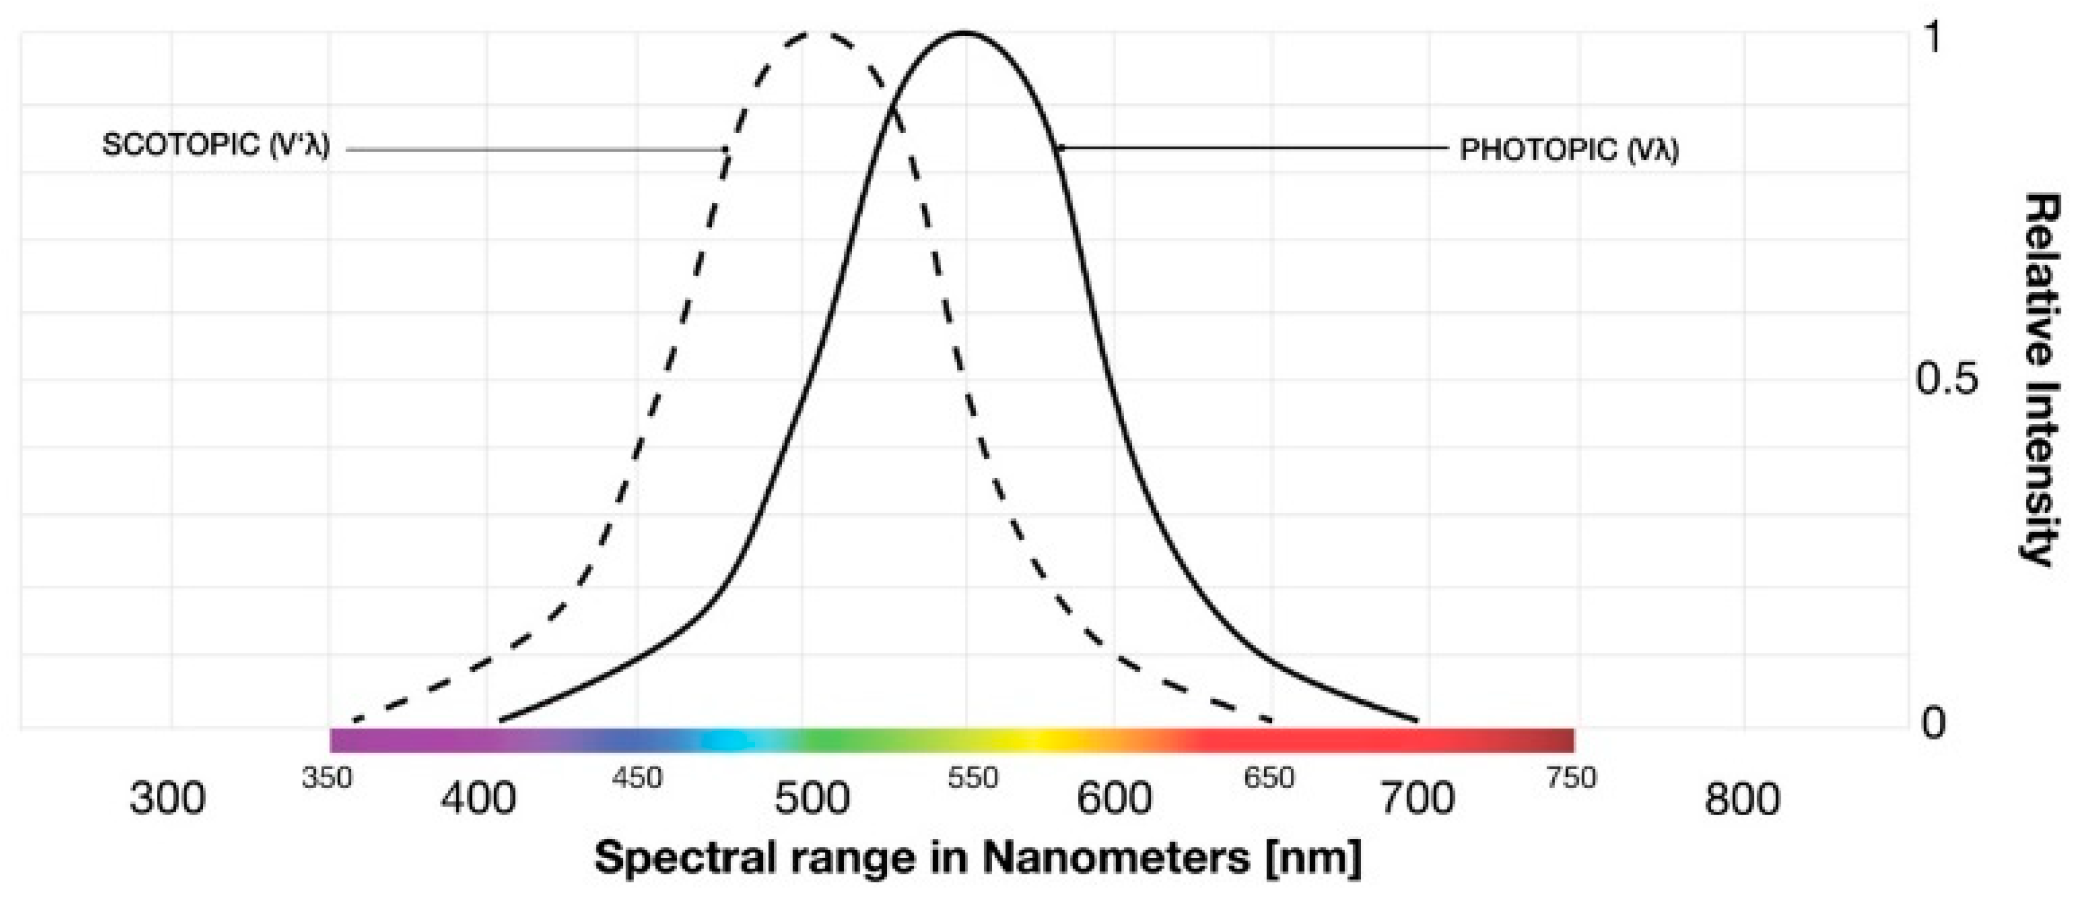
Humans have evolved with two visual systems. Photopic vision V(λ) with cone receptors allows for excellent color discrimination during the day, whereas, scotopic vision V′(λ) with rod receptors allows for night-time seeing, in shades of grey under low-light levels with no color discrimination (
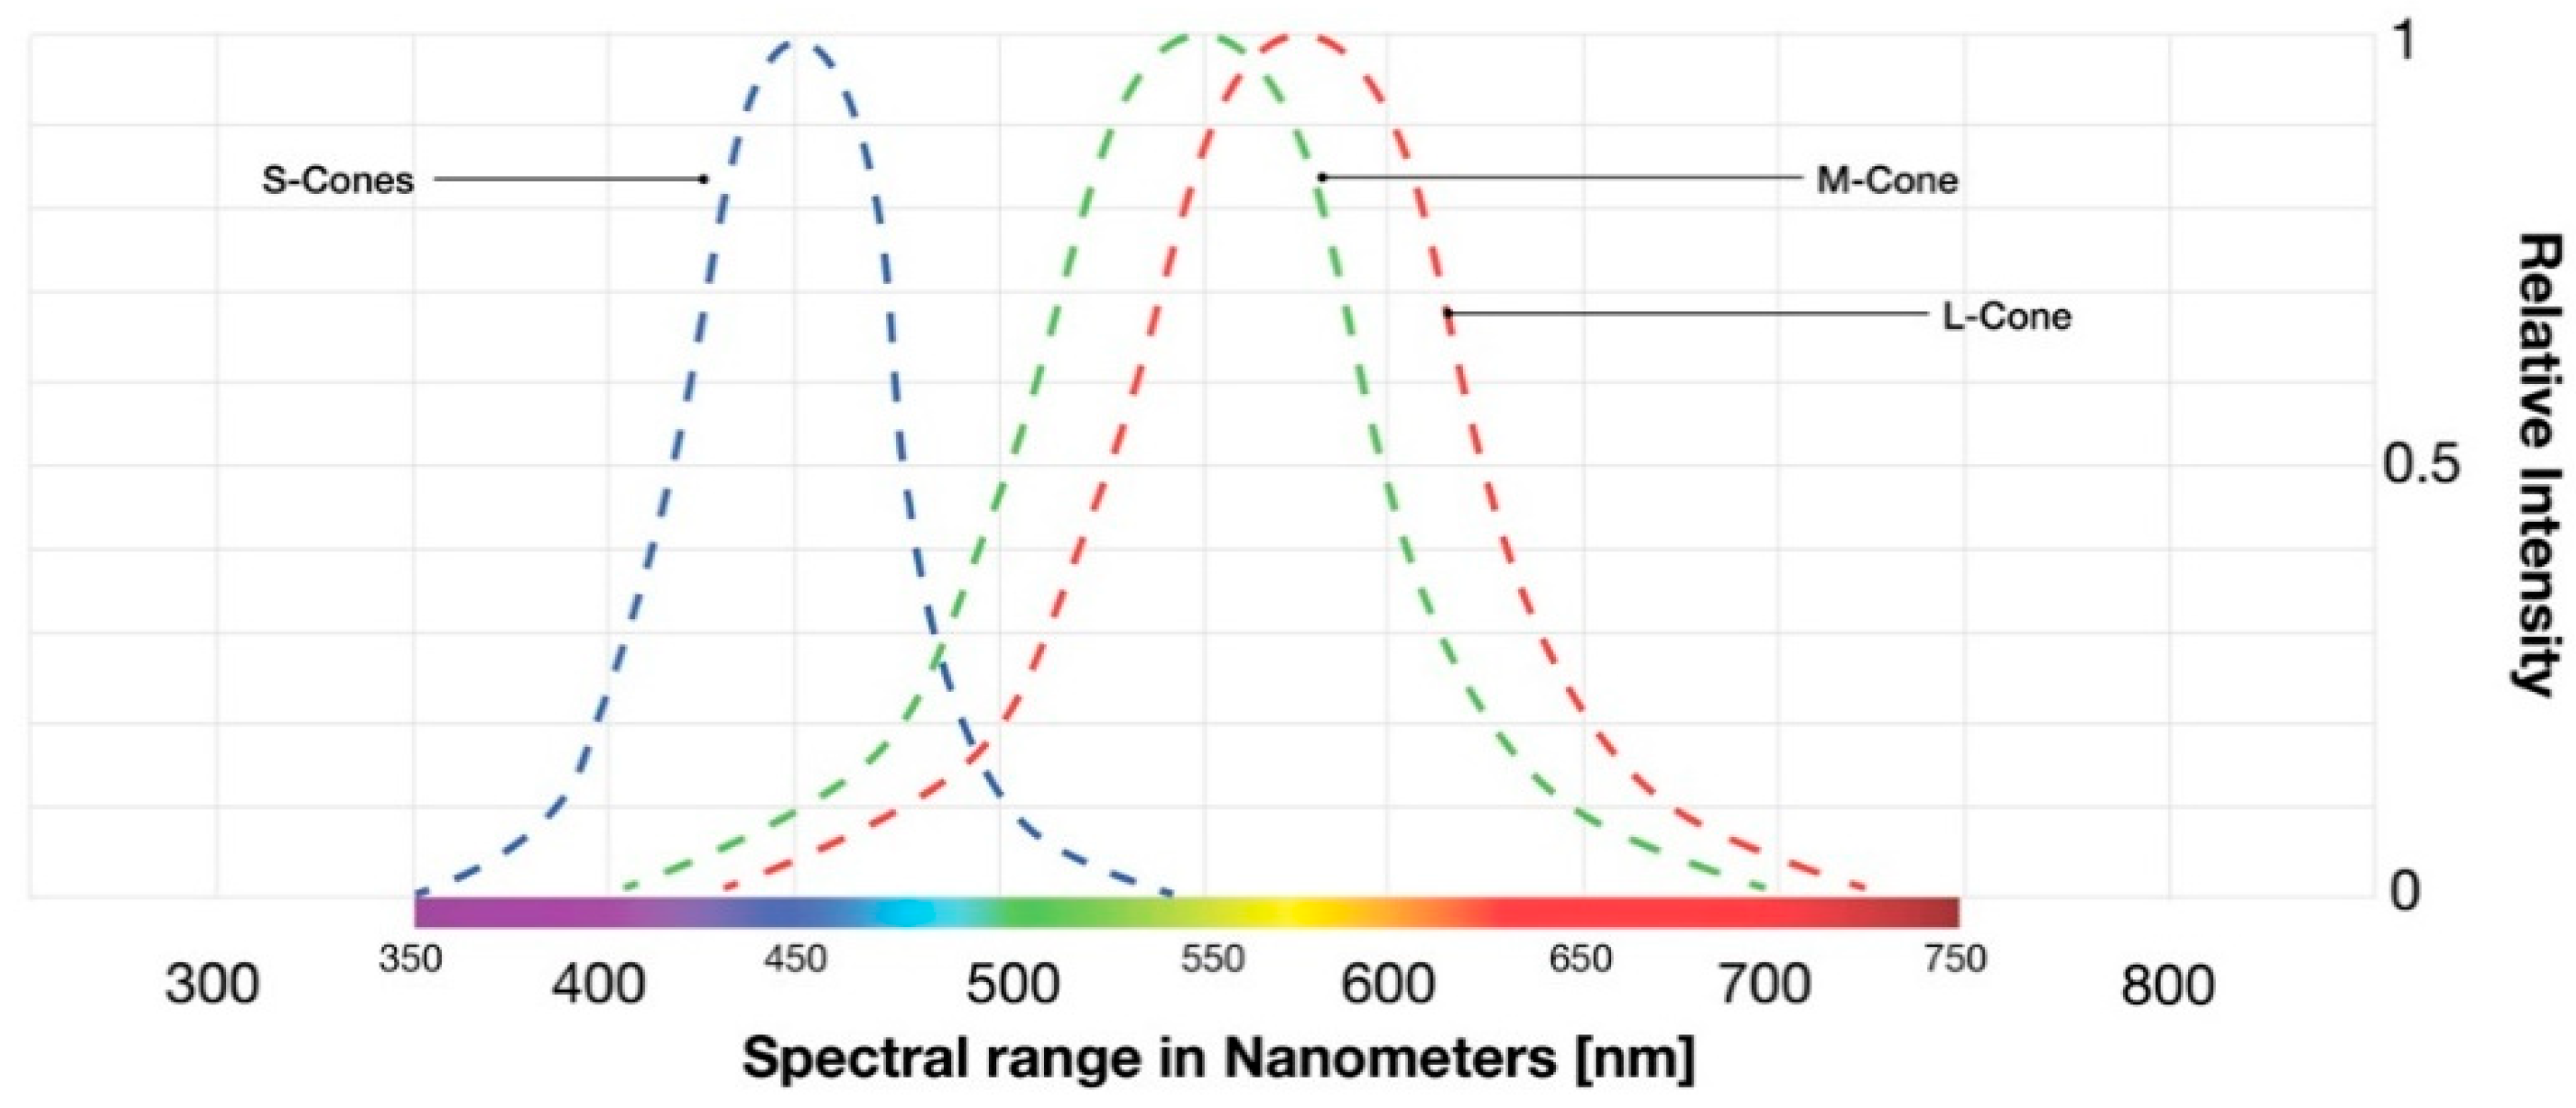
Figure 5). For the purpose of this research, only photopic luminosity function (the action spectrum for humans) is of relevance, as humans are awake and active mostly during the day, when it is light outside. While the human visual system is unable to discriminate individual wavelengths, it is sensitive towards specific parts of the spectrum. The human eye uses three types of cones to sense light in three bands of color (
Figure 6).
Biological pigments in the cones have maximum absorption values at short-wavelength (S-cone), medium-wavelength (M-cone), and long-wavelength light (L-cone), which appear to the human eye as blue, green and red respectively. Therefore, the green foliage found in nature seems to be associated with a peak in photopic luminosity function at 555 nm (green) [
37].
2.3. Light-Related Exposure Variables for Ornamental Plants and Human Illumination—An Overview
There are four light-related physical-exposure variables which impact both ornamental plants and humans. This involves the light spectrum, the intensity of light energy, as well as the timing and duration of light (
Table 4).
2.3.1. Light Spectrum
Both plants and humans capture light information from the environment via photoreceptors which contain particular light sensitive pigments that absorb radiation of a certain wavelength (
Figure 7). The average spectral sensitivity of human visual perception of brightness is defined by a luminosity function V(λ). Whereas, plants respond to a range of optical radiations which they use for photosynthesis, as well as photomorphogenesis, which controls their shape and overall development. The photosynthetically active radiations (PAR) used in horticulture lighting covers the portion of light spectrum (400–700 nm) needed to support photosynthesis of plants, but it is incomplete (the PAR curve shows two peaks in the red and blue part of the spectrum. This gives the incorrect impression that the green part of the spectrum is irrelevant for plant photosynthesis, and that it differs from the range defined by the McCree Curve between 280 nm to 800 nm. The necessary electromagnetic radiation for photomorphogensis is outside the PAR range from ca. 380 nm to ca. 850 nm. Unfortunately, the current sensors available in measuring devices will not identify wavelengths in the UV and far-red and range outside the visible part of the spectrum of light useful for plants, and will measure only PAR. By excluding the necessary wavelengths of light during the growth process, other plant processes will be unbalanced and this will negatively impact their growth and development.
Also, most LEDs favored today are energy efficient, nonthermal light sources, meaning they do not produce beneficial thermal IR wavelengths of light which support the health of humans and plants (nonthermal LEDs are promoted because there is less impact on the electronic components of such luminaires so their lifespan is extended).
As the use of ornamental plants in interior spaces increases, it makes sense to develop appropriate action spectra and measuring devices to help establish the necessary parameters for humans and plants to thrive.
2.3.2. The Intensity of Light Energy
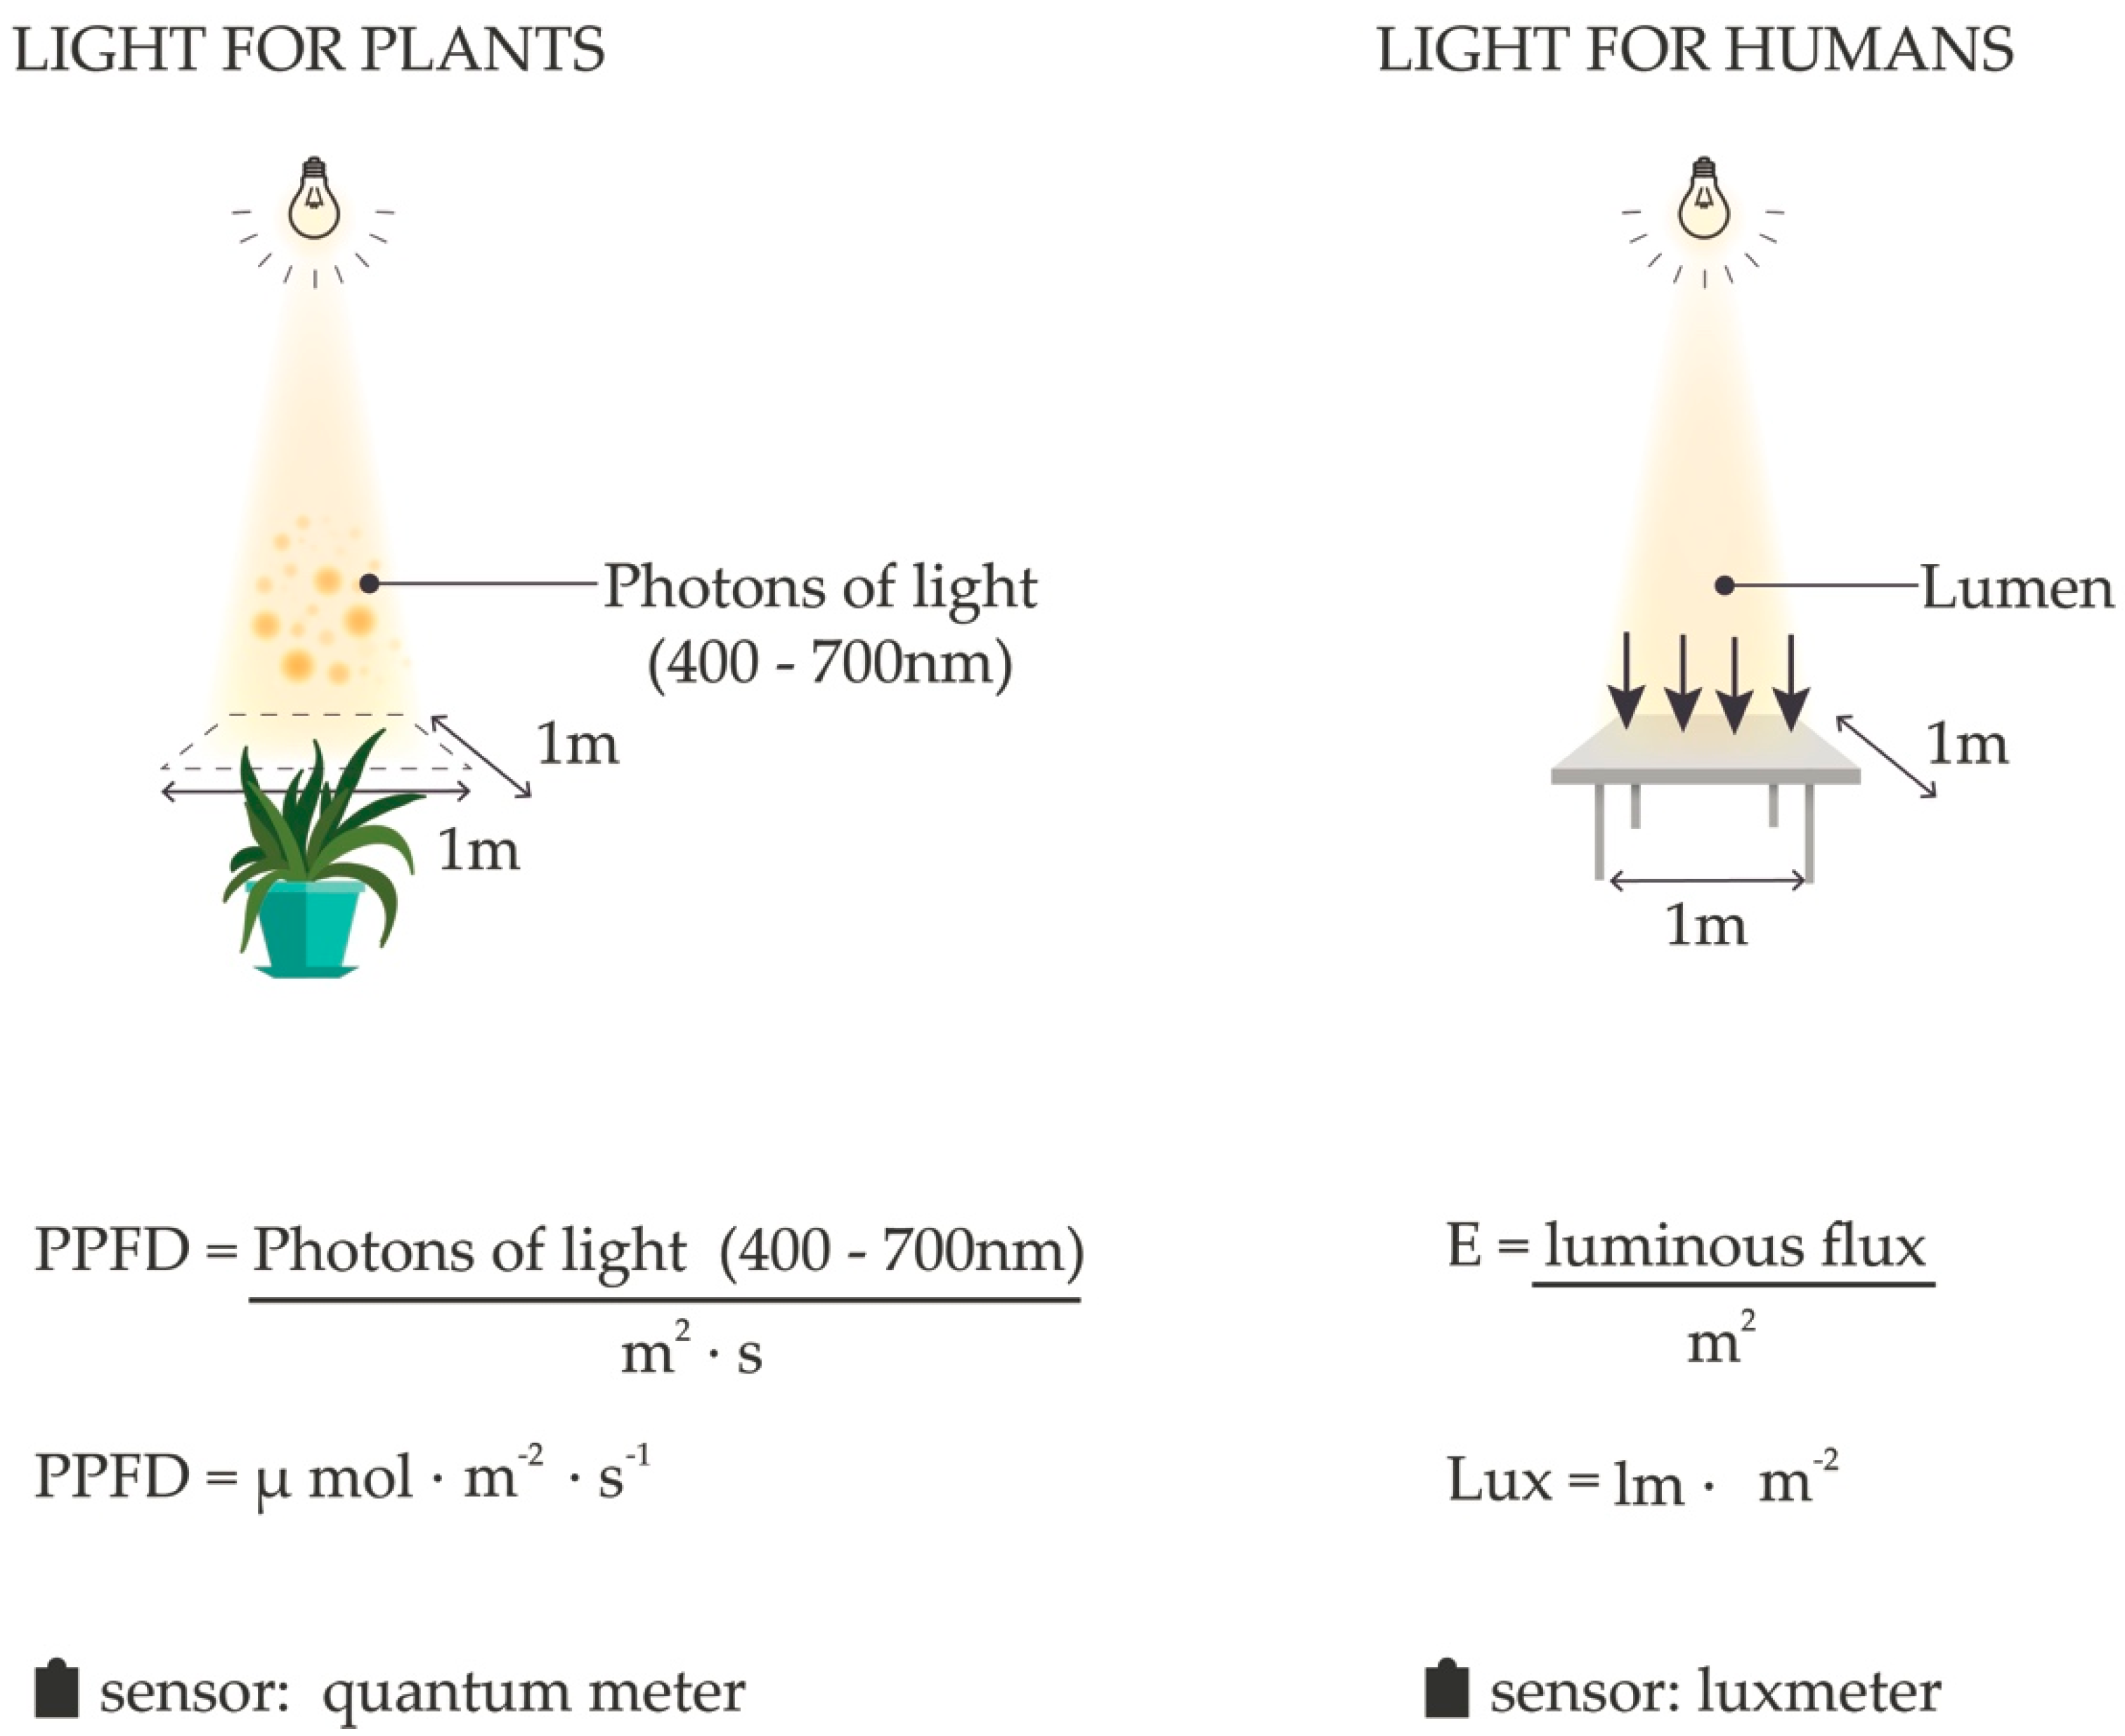
The difference between the light response of plants and humans also involves the intensity of light energy. While it is imperative to find a formula that establishes appropriate levels for humans and plants, this is a complex and challenging task (
Figure 8). It is important to understand that one cannot use units such as lux and lumen to measure the intensity of a plant lighting system, as the values will vary and depend on the spectrum of the luminaire. Light falls to the ground as tiny particles (photons) and depending on the light frequency, the photons contain a different quantity of energy. The process of photosynthesis is dependent on the number of photons, not their energy level. In indoor environments, in order to stimulate photosynthesis and ensure a plant thrives, illumination from a light source, measured by the photosynthetic photon flux density (PPDF) should be applied. It is typically 30–100 times higher than human requirements [
29] and the light source applied also needs to emit the right wavelength of light.
For humans, other factors need consideration, such as sufficient illumination for good visibility, visual performance and comfort. Existing lighting standards for the appropriate illumination of interior spaces require minimum levels of horizontal illuminance (lux) measured on a working plane area. These are all categorized based on the visual function and use of the space. The levels are determined by the perception of brightness of visible white light. To enhance the growing setting of ornamental plants in indoor environments, it is necessary to first assess the light intensity by using suitable metrics and appropriate measuring devices, and then to alternate the light intensity accordingly.
2.3.3. Timing and Duration
The timing and duration of light has enormous consequences on health and well-being. In the past, the entrainment of circadian rhythms (light/dark cycles) of plants and humans were influenced by predictable phases of light exposure set by sunrise and sunset. But that has all changed due to the widespread use of artificial light which has blurred the boundaries of day and night. As a result, the synchronization of these crucial biological processes is often prevented.
The recent discovery of a third photoreceptor type in the human eye called intrinsically photosensitive ganglion cells (ipRGCs) has also dramatically changed our understanding of the impact of light on the human body [
40]. These cells contain a light sensitive pigment called melanopsin that responds specifically to short-wavelengths of blue light at 460 nm, which is the action spectrum that suppresses melatonin production [
41]. This has serious implications because exposure to any illumination with a high blue content of light in the early evening and night can disrupt numerous physiological processes in humans. Sleep and waking cycles, eating patterns, metabolism, reproduction, mental alertness, blood pressure, heart rate, hormone production, temperature, mood, and immunity, are all negatively impacted which can harm health and reduce well-being [
42]. Complicating matters further, it is not only humans who have blue-light photoreceptors. Research has identified new blue-light photoreceptors (ZTL/FKF1/LKP2) in plants as well. These cells not only regulate their circadian clock, they also determine photoperiodic flowering [
43]. Recent research indicates the light-dark cycle should be incorporated in the lighting planning process not only for human health and well-being, but also in order for plants to thrive in interior spaces [
44].
White LED light sources are now increasingly used to illuminate indoor spaces due to their energy efficiency, long lamp life and dimming features, and some luminaires can also be designed to provide specific spectral power distribution (SPDs). Although the technology is advancing, there are still numerous drawbacks that need to be addressed, including the trough in protective red wavelengths of light compared to the spectrum of daylight [
45].
Despite the mentioned challenges, LED lighting technology seems to be the preferred light source for human needs, as well as for the biological functions of plants.
This means when human beings inhabit interior spaces during the day, general LED illumination needs to best replicate the spectrum of visible light outdoors. Then later in the evening, the blue part of the spectrum should be reduced as much as practically possible. As the far-red light, at the extreme end of the visible spectrum (710–850 nm) does not interfere with the visual comfort of humans, it should be applied for plants to support their immune system [
46]. When the space is unoccupied, UV lighting may be implemented for plants for a specific period of time because they require a broad spectrum of light.
3. Research Hypotheses
In order to accomplish research goals and examine the influencing factors of LED light sources for the visually appealing and biologically effective illumination of ornamental indoor plants, this study developed seven hypotheses:
Hypothesis 1 (H1). Architectural white LED lighting with the standard CCT metric applied for indoor spaces cannot provide visually and biologically effective illumination for ornamental indoor plants.
Hypothesis 2 (H2). The colored, artificial illumination used for growing horticulture food plants should not be applied to indoor environments, as it gives an unnatural appearance to indoor ornamental plants and it lacks the healthy properties of full spectrum light needed by humans and plants.
Hypothesis 3 (H3). Due to a deeply engraved evolutionary relationship with natural light, humans will always have a preference for the daylit appearance of plants in interior settings compared to artificial illumination.
Hypothesis 4 (H4). The right action spectrum for biologically effective illumination for ornamental indoor plants can be generated with correctly designed LED light sources.
Hypothesis 5 (H5). When designed correctly, biologically effective LED illumination for ornamental indoor plants can also look natural and visually appealing.
Hypothesis 6 (H6). The general ambient lighting commonly used in interior spaces affects the SPD curve of this study’s proposed illumination for plants and the visual appearance of the plants themselves. (Other available ambient lighting needs to be taken into consideration).
Hypothesis 7 (H7). The color of leaves is very important for the overall appearance of ornamental plants.
4. Materials and Methods
This scientific research involved a mixed method research approach with two-steps: physical lighting test (step 1) followed by visual assessment questionnaire-based survey (step 2) to simultaneously collect, analyze and interpret both quantitative and qualitative data.
4.1. Physical Lighting Test (Step 1)
A physical lighting test with four individual phases was performed to examine the research hypothesis. Various wavelengths of light and the spectral ratios of LED light sources were assessed to establish optimal parameters for visual and biologically effective illumination of ornamental indoor plants. During the test, photographs of plants were taken so participants could visually assess the appearance of plants in the second part of the research.
4.1.1. Technical Equipment
The following professional equipment was used to perform the lighting research (
Table 5).
4.1.2. Ornamental Plants Used
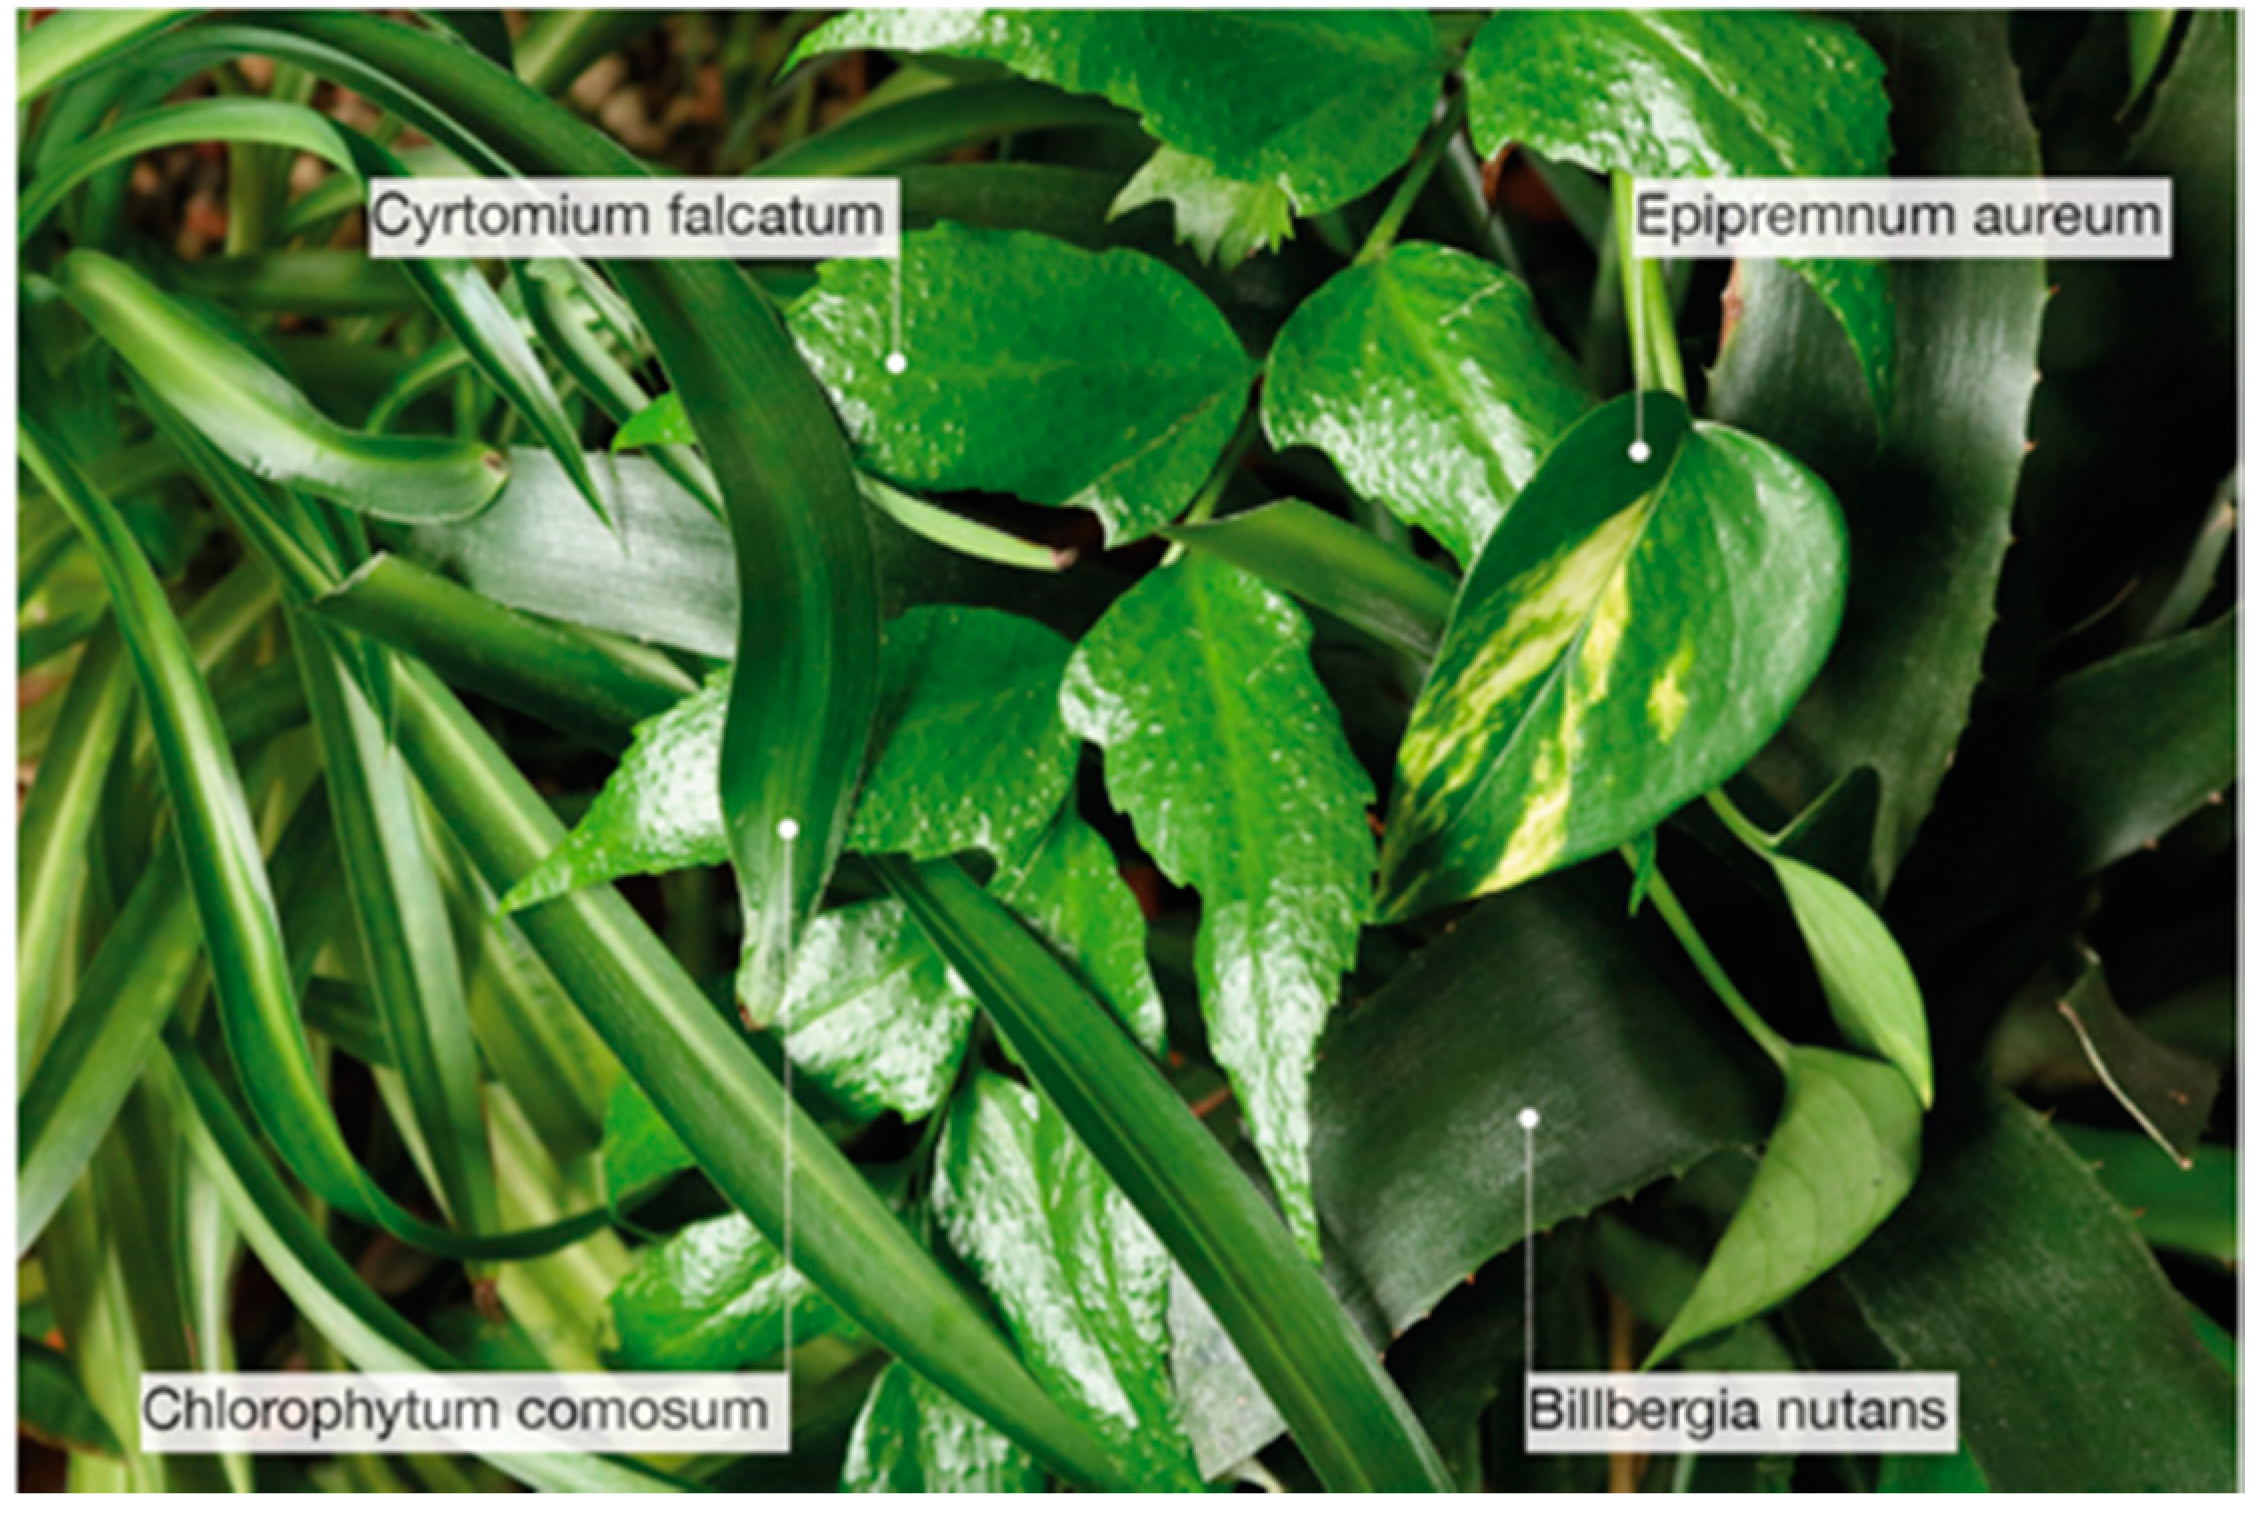
Four types of plants (
Figure 9) were chosen that are often selected for interior spaces due to their suitability for medium light conditions. The photosynthesis light intensity during the day conveyed by the Daily Light Integral (DLI) for these plants has been estimated between 2–6 moles of light (mol) per square meter (m
−2) per day (d
−1) [
47]. (DLI is a quantitative measure of the amount of light obtained in a single day in a specific geographical location.)
These plants are also ideal for the purpose of the study’s visual evaluation due to the easily distinguishable features of the shape, color, and texture of their leaves.
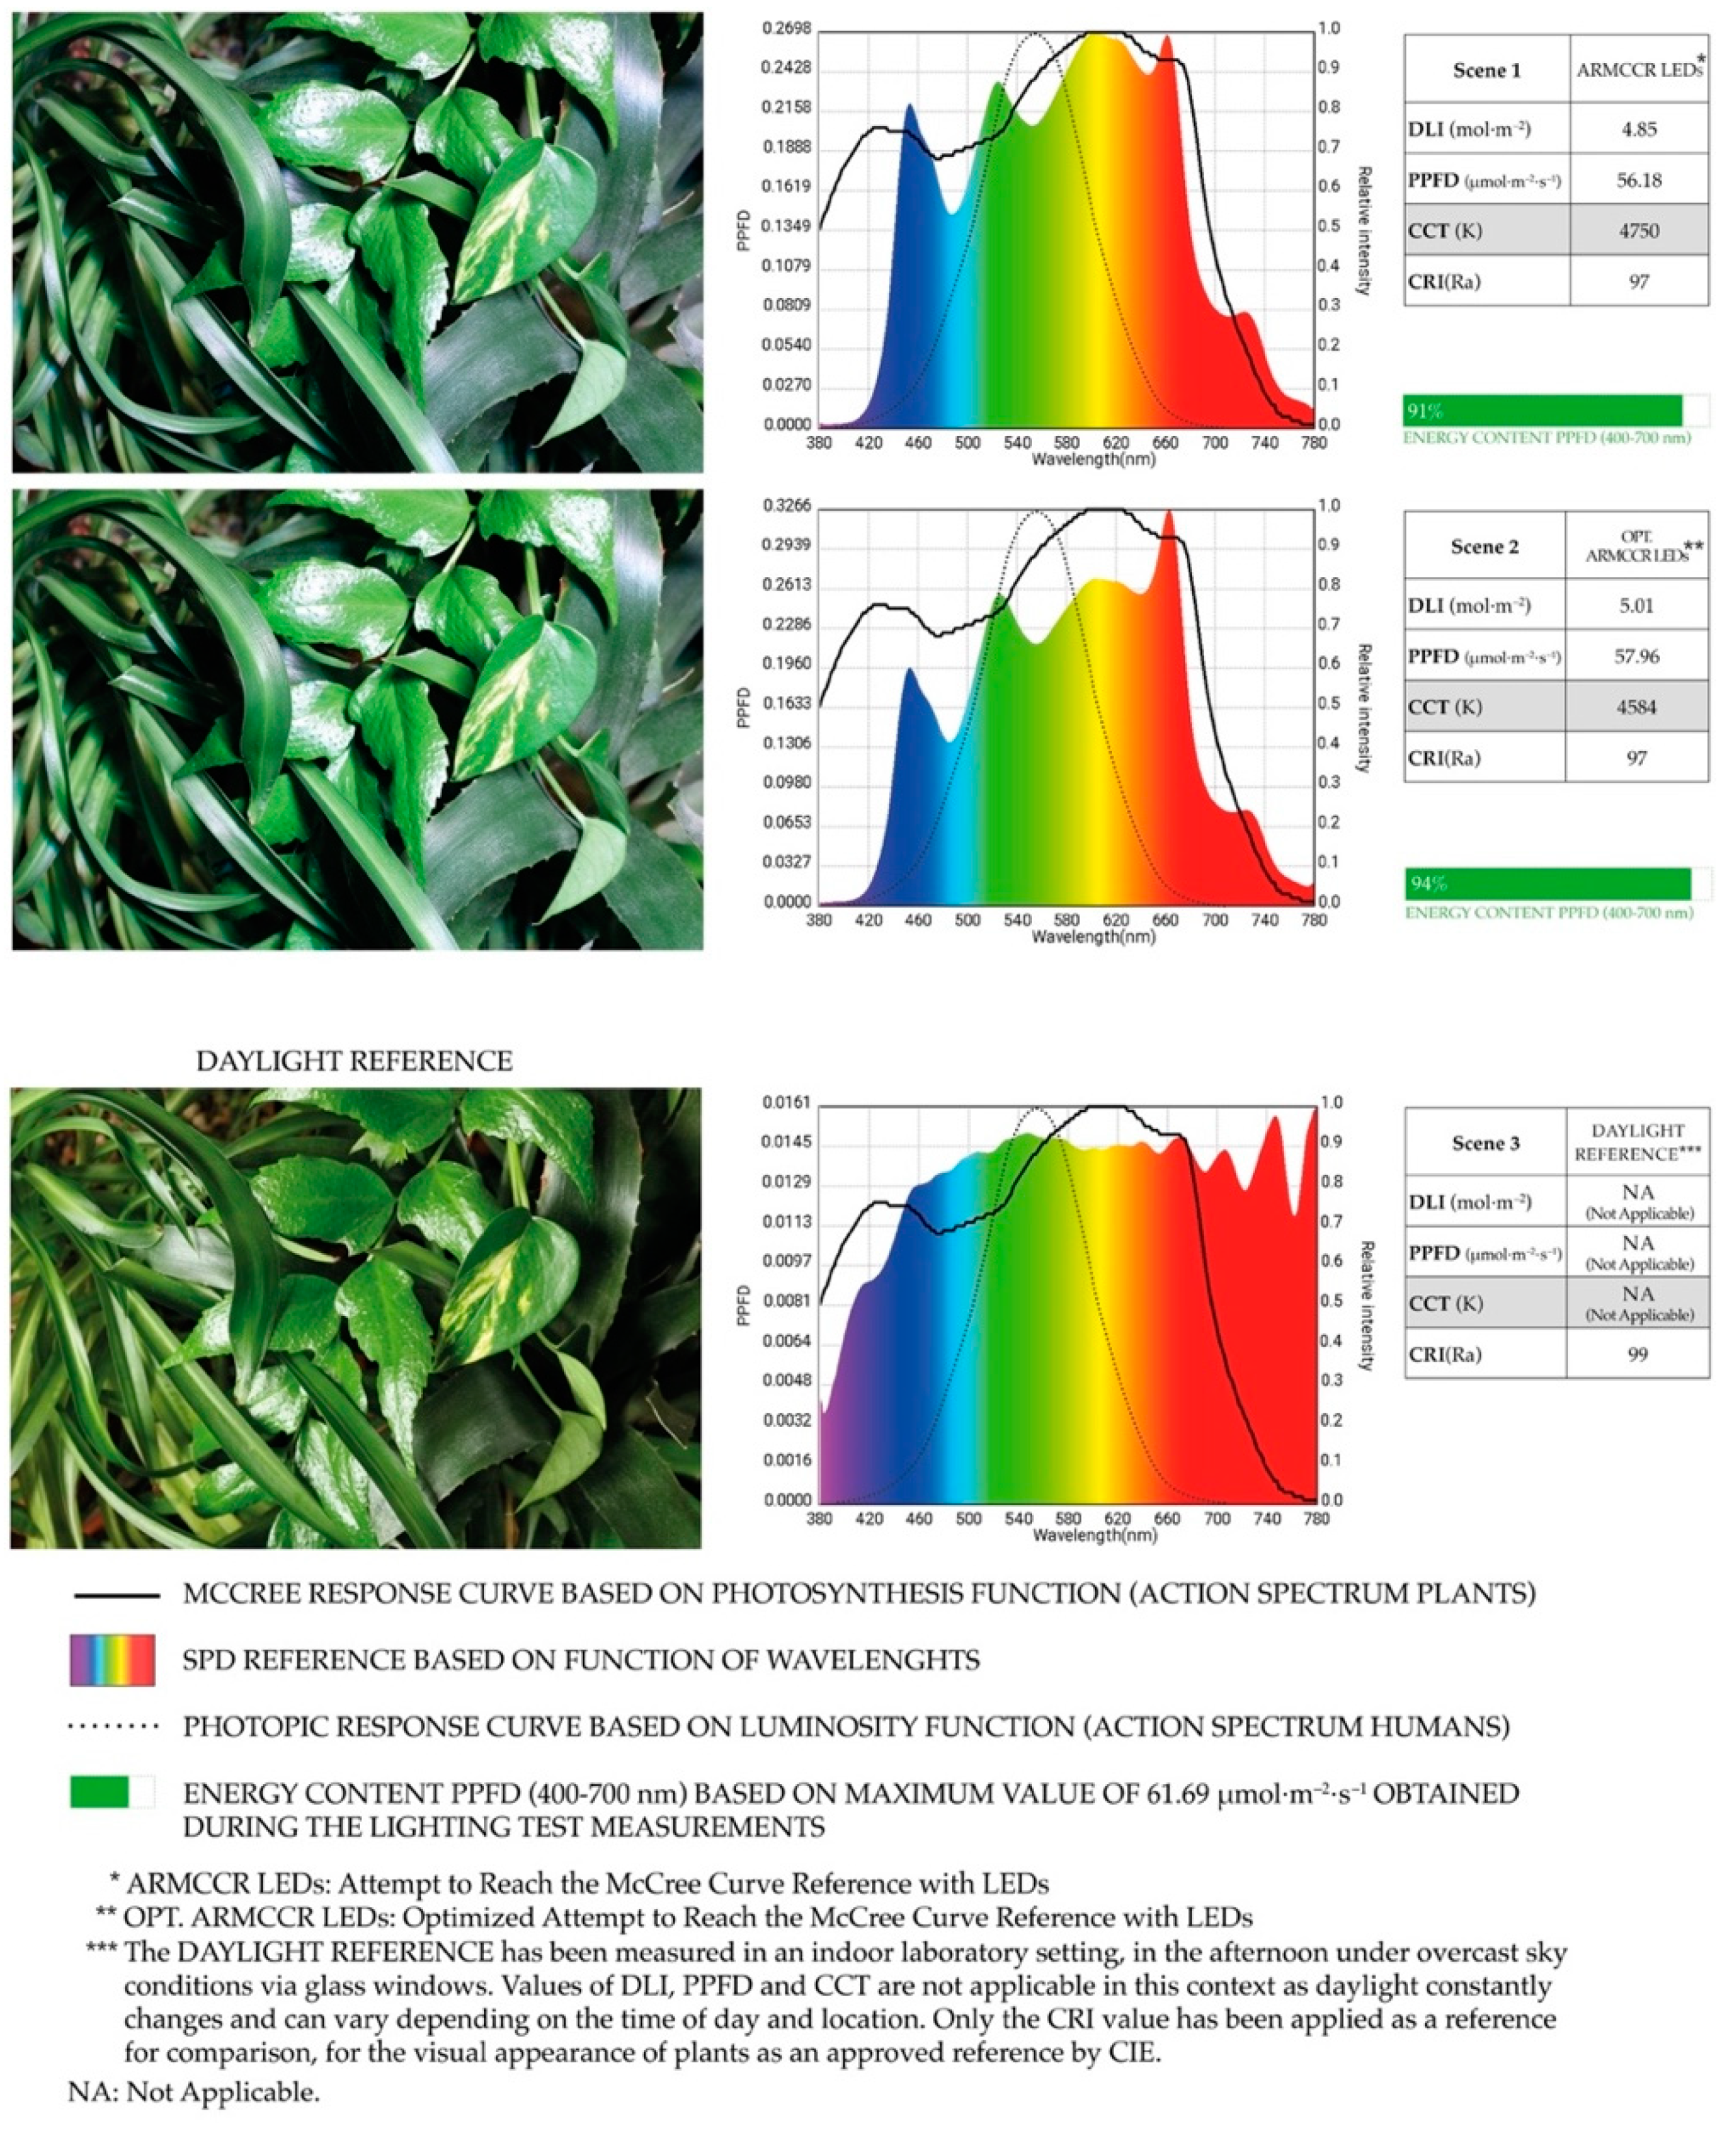
Below image was taken in an indoor laboratory setting, in the afternoon with overcast sky exposure via glass windows. This image has been chosen as a benchmark throughout the research study, as daylight provides the best visual appearance of objects in interior spaces. (Daylight provides an ideal CRI value and full spectrum SPD, as well as the right mix of spectrum for photosynthesis).
4.1.3. Physical Setup
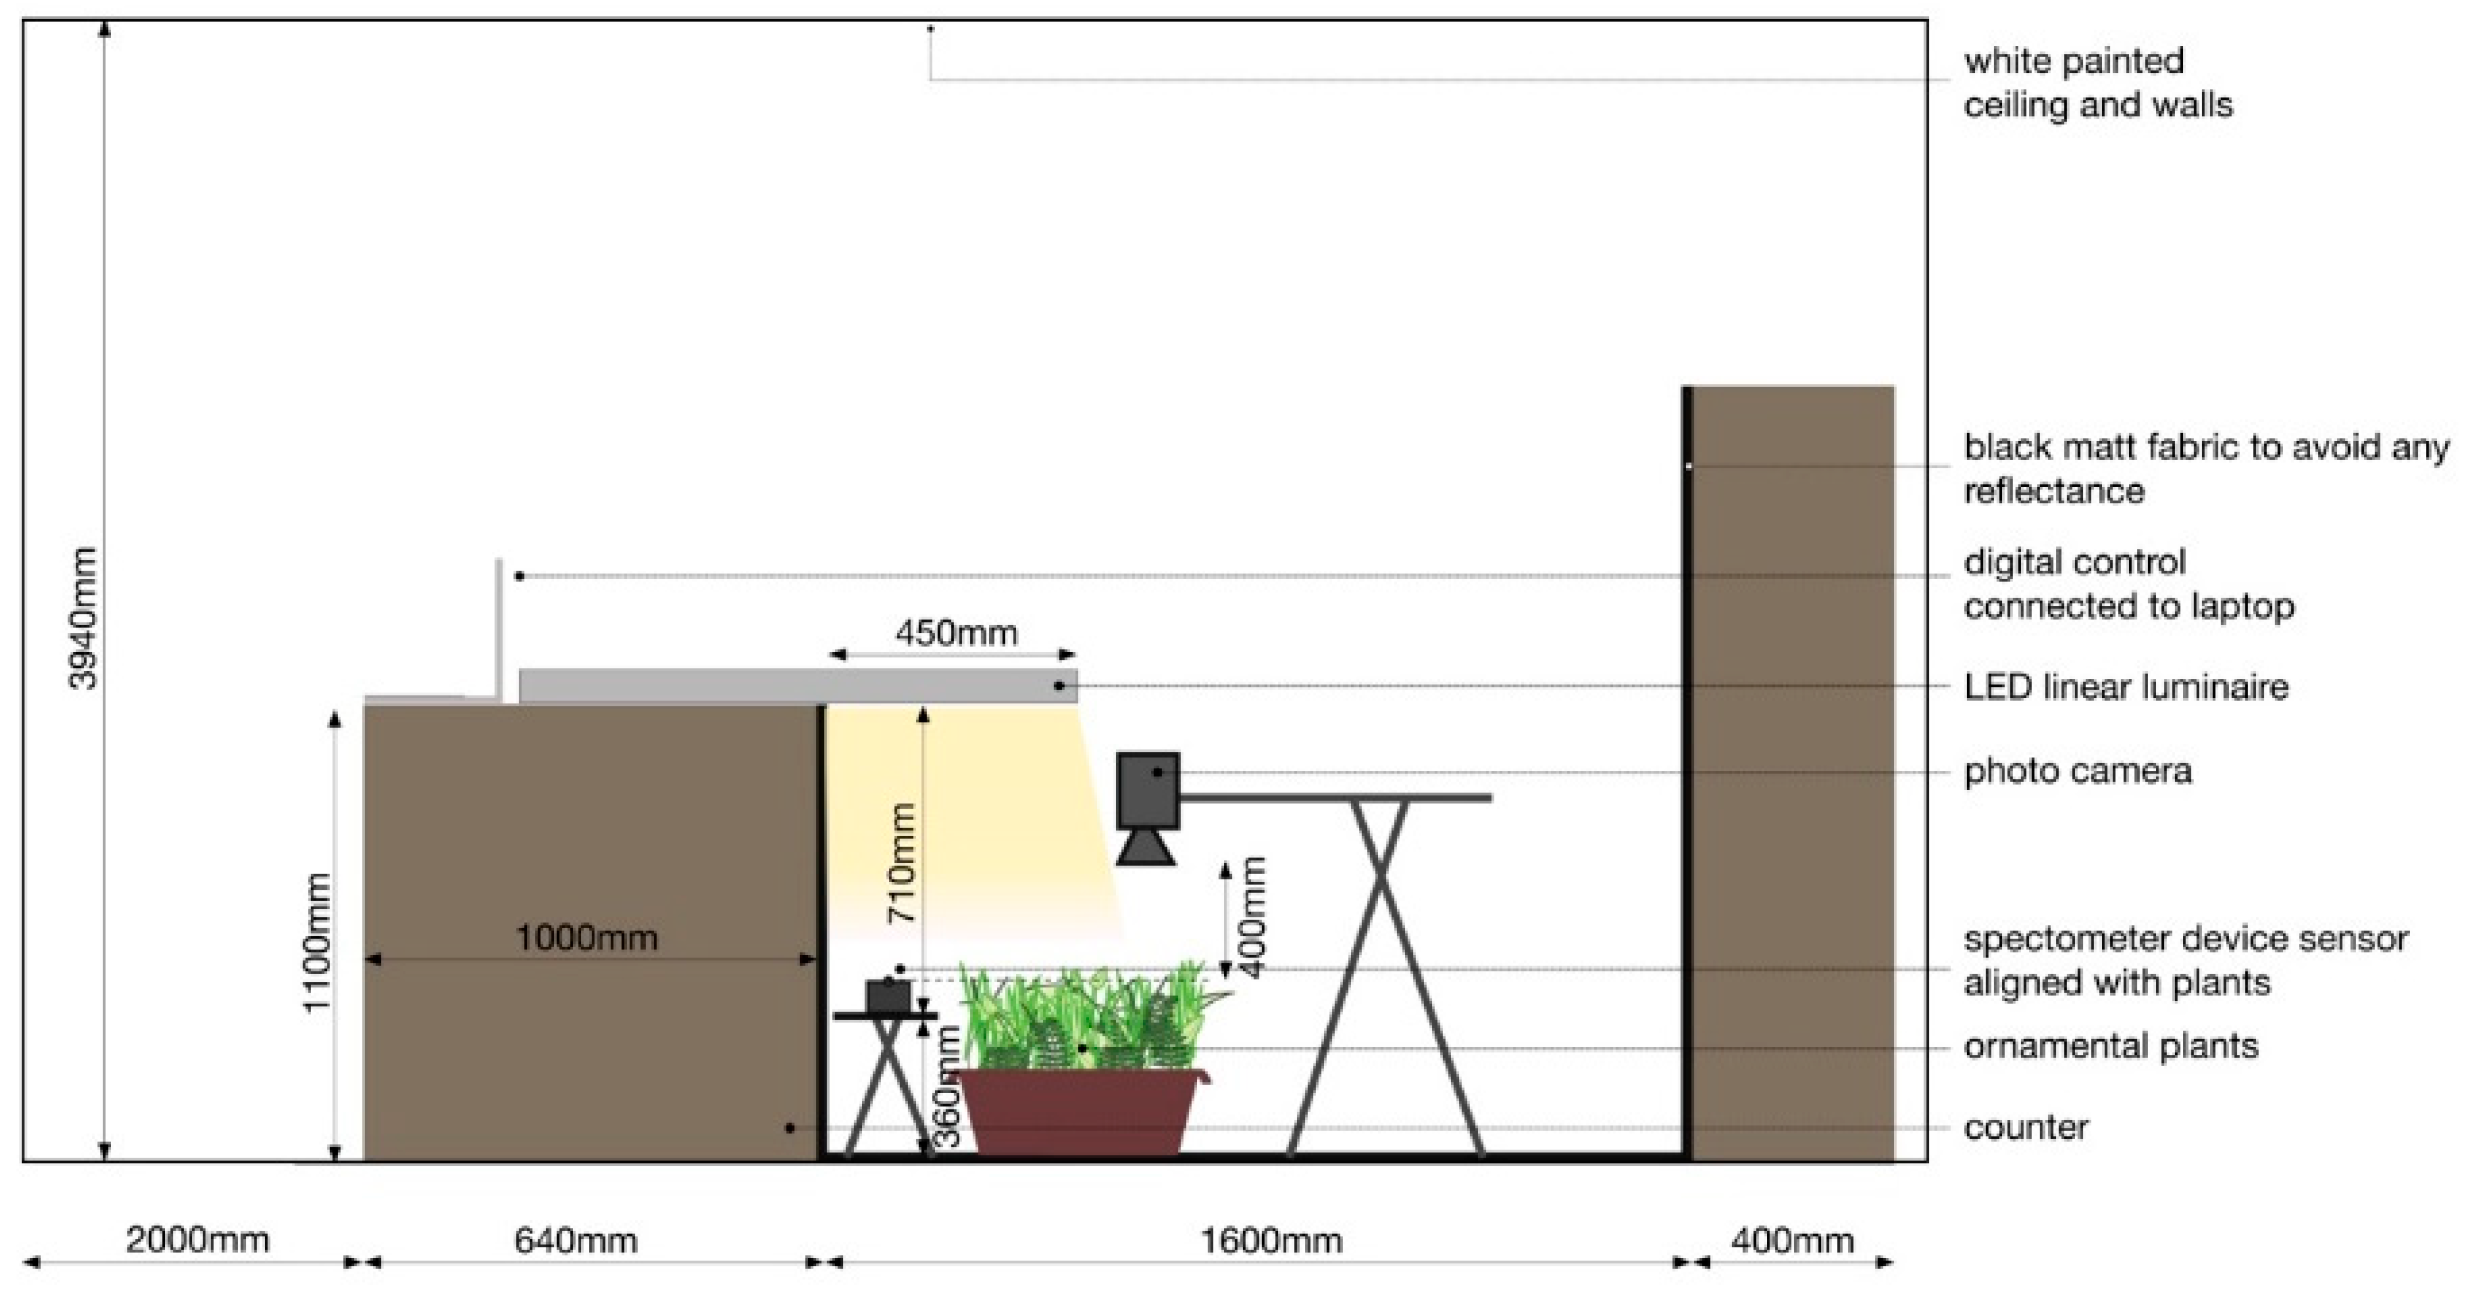
The physical lighting test was performed as an experimental laboratory study. The space was 4.64 m × 1.6 m × 3.94 m in size, located in Zurich/CH on the top floor of an office building. It was important to define a physical dark room set-up that allowed precise lighting measurements. The test was carried out in December of 2018, during the late afternoon and evening hours between 4 p.m.–11 p.m. All windows of the room were closed with electric blinds to block unwanted trespass of natural light from outside and artificial light from the adjacent street. As an additional precaution, to prevent any light that may have bounced from the floor, black opaque fabric was placed on the surfaces surrounding the setup. There was no other light present in the room except that produced by the test LED linear luminaire. The camera was positioned on a tripod, and the pictures were taken using a remote control to stop any camera movement.
The spectrometer device was positioned on top of a black stool to reach the same height of an imaginary plane of large potted plants aligned with the upper leaves of the plants, shot by the camera. The luminaire was suspended from a wooden counter of 1.1 m height, perpendicular to the floor, at a distance from the leaves and sensor of 710 mm (
Figure 10). All lighting scenes were arranged using the digital control in the dark and were static until the end of each phase. The luminaire was set for 100% intensity during all four phases of the lighting test.
4.1.4. Procedure
Individual quantitative measurements were performed for each action spectra in order to compare the values of biological impact based on daily light integrals (DLI), photosynthetic photon flux density (PPFD) and energy content as instantaneous photo-synthetically active radiation (PAR) and also values of peak light wavelength (λP), correlated color temperature (CCT) and color rendering index (CRI) to see how each lighting scene affected the overall visual appearance of the ornamental plants in the room. The spectral McCree curve was used as a reference to help determine the ideal wavelength range as well as the spectral ratios related to the quantum efficiency of photosynthesis for different plant types. In order to evaluate the PPFD, a new method was developed that compared the percentage of PPFD content of each lighting scene of the 4 lighting test phases with the range between 0–100%. A maximum value of PPFD attained of 61.69 µmol·m−2·s−1 (lighting test phase 4; scene 2) was used as a 100% benchmark for all the evaluations.
• Lighting test phase 1
The first test analyzed the architectural white LED lighting with standard CCT of 2700 K, 3000 K, and 4000 K commonly used in general indoor lighting. The aim of this test was to determine the visual preferences of participants from the presented lighting scenes of plants.
• Lighting test phase 2
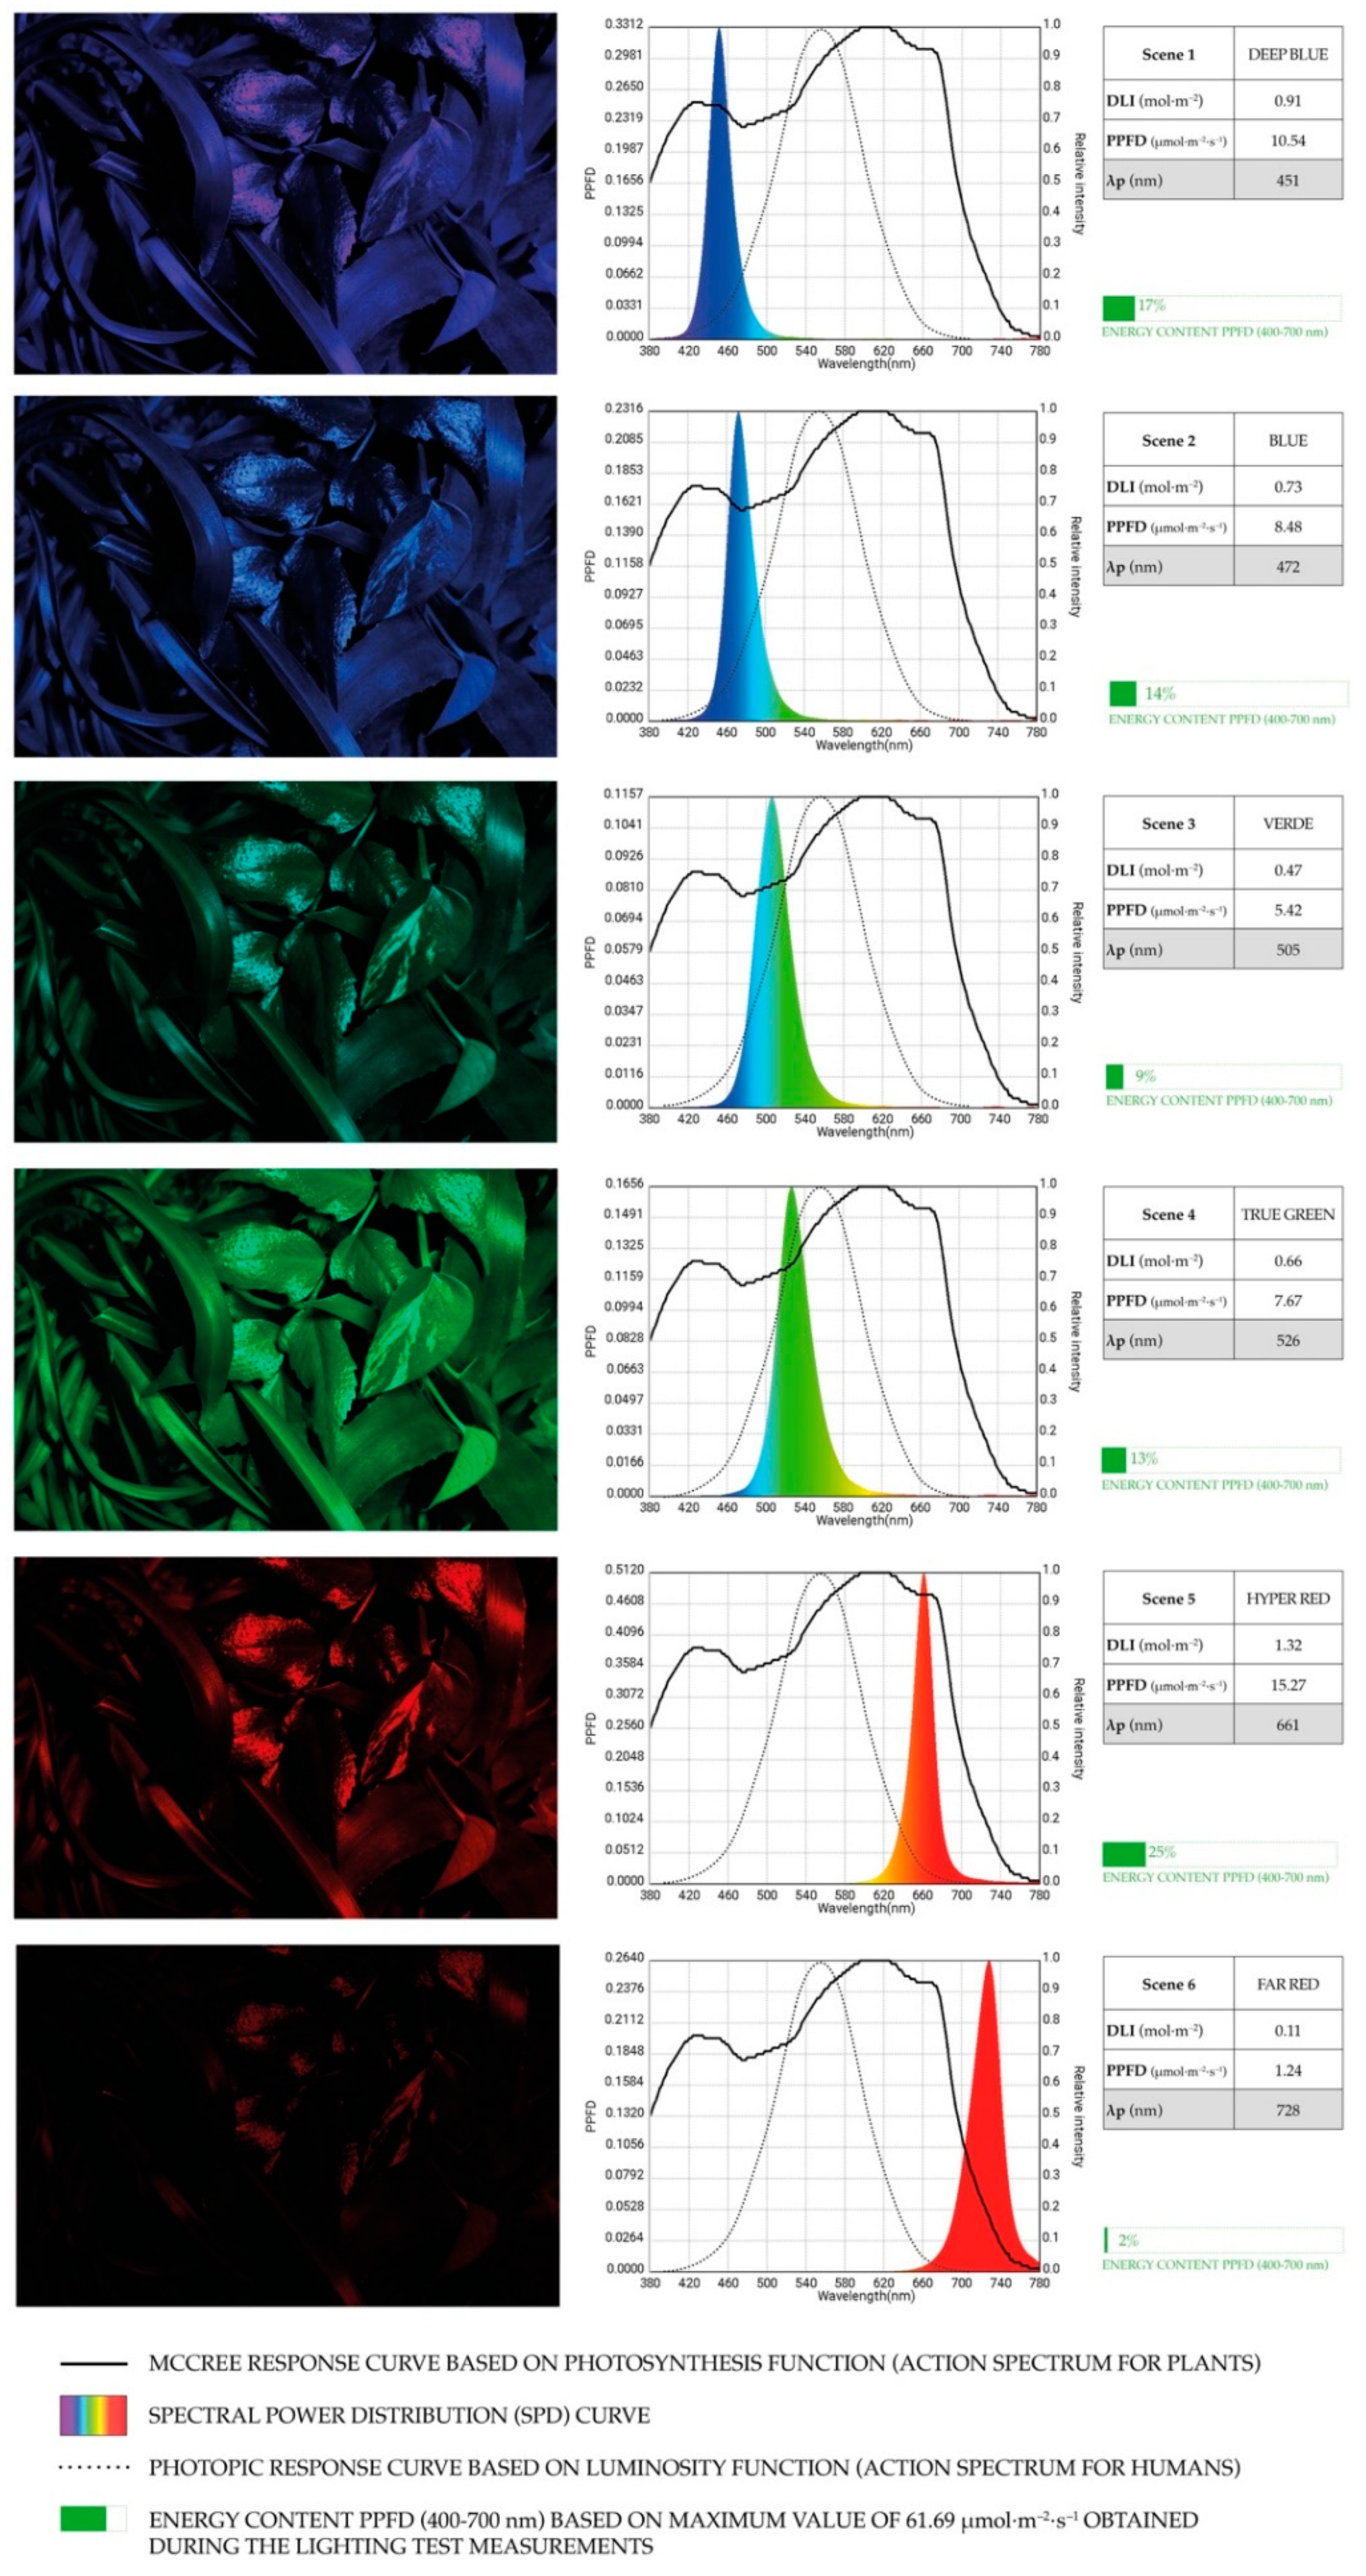
The second test analyzed six individual monochromatic action spectra with peak light wavelength (λP), the measured wavelength with the highest power emitted optically by a light source and their visual appearance described as deep blue (λP = 451 nm); blue (λP = 472 nm); verde (λP = 505 nm); true green (λP = 526 nm); hyper red (λP = 661 nm) and far red (λP = 728 nm). The aim of the individual measurements of the single LED modules which produced colored light, was to compare the coverage of the single SPD in relation to the McCree action spectrum reference, and to see if participants would visually perceive the plants appearance as natural and healthy. The UV content was deliberately left out because lighting standards for rooms in interior spaces intended for human occupation will not permit the use of this part of the spectrum.
• Lighting test phase 3
The third lighting test analyzed two different SPD with their individual spectral composition which were set in a mixed ratio to emulate the reference variable of the McCree curve as optimally as possible. They were named ARMCCR LEDs (scene 1) and OPT. ARMCCR LEDs (scene 2). In each case, the action spectrum and the visual appearance were compared. Daylight was added as a base reference.
• Lighting test phase 4
The fourth test analyzed how ambient general lighting used in interior spaces (CCT of 3000 K, 3500 K) affects the optimized spectral distribution of the McCree curve (OPT. ARMCCR LEDs), the energy content, as well as the visual appearance of the plants themselves.
4.2. Visual Assessment Questionnaire-Based Survey (Step 2)
To examine the research hypothesis connected to the visual preference of lighting scenes, a survey was conducted based on photographs of ornamental plants (taken during the physical lighting test). The choice of photographs as stimuli rather than real plants guaranteed that recurrent evaluations of plants were, and still can be performed in consistent conditions at each session, as plants are living organisms and their visual appearance might change during their development. Additionally, it is an efficient means to collect data on a large scale basis in field sites, as our intention is to repeat this study in the future.
4.2.1. Participants
General demographic sample characteristics of the participants were arranged in a form of a self-exploratory table (
Table 6). Twenty healthy, young professionals in various creative fields were recruited via email from the same office building to take part in the study. None of the participants had impaired colour vision so they could properly distinguish visual variations. Participation was voluntary and unpaid.
4.2.2. Procedure
The visual assessment survey was conducted during daylight hours, on week days in February 2019, in Zurich/CH on the top floor of an open plan office measuring approximately 18.6 m × 15.0 m × 3.94 m in size.
The survey was performed at a working station with a rectangular desk and an office chair. The desk housed a computer monitor for viewing images and an iPad for inputting questionnaire answers. A total of 18 images were projected on a computer screen. To control the impact of external factors that were outside the scope of this study, such as variations in color, the survey included images captured during the lighting test which were presented on the same color calibrated computer monitor [
48,
49]. The survey was performed without any ambient artificial lighting in the space to avoid impacting the appearance of the images on the computer screen.
The researchers explained to each participant that they would take part in a study examining the visual appearance of plants under different lighting conditions. Participants were also told they needed to complete the tasks as accurately as possible and that their first impression/answer could not be reviewed or changed. Researchers were present during the self-administered questionnaire to help with any confusion which might have arisen that would prevent the participant from completing the survey. The process took approximately 10 min in total.
The survey was a structured questionnaire with a mixture of closed-ended and open-ended questions. It was formulated with help of Google Forms: Free Online Surveys for Personal Use and consisted of six sub-parts (the full questionnaire can be found in
Supplementary Materials). The first part of the survey called General Information, assessed the general demographic factors of the participants which included: age, gender, occupation, as well as vision deficiency and color deficiency (
Table 5). The second part of the questionnaire collected the specific participant views on various factors of visual perception. These were measured on a 5-point Likert rating scale for the image sequence with the following details (1 = strongly disagree (SD), 2 = disagree (D), 3 = neutral (N), 4 = agree (A), 5 = strongly agree (SA)) and (1 = not important (NI), 2 = less important (LI), 3 = neutral (N), 4 = quite important (QI), 5 = very important (VI)). After communicating their level of overall liking for each of the eight questions with images, participants were given the choice to spontaneously state separately, the reason behind their decision.
4.2.3. Statistical Analyses and Hypotheses Testing
A one-way analysis of variance (one-way ANOVA) was conducted to assess pronounced differences (measuring F-ratio or equivalently the p-value) between several lighting scenes in terms of overall liking scores on a five-point Likert scale. A typical significance level of 0.05 was considered for all the measurements. When marked variations on how lighting scenes (forming the groups) perceived by participants were concluded, the post hoc t-tests was taken to compare the groups to find the most preferred one with a significance level set to 0.05. A Chi-Square goodness-of-fit (GOF) test was also used to determined how closely a set of data fits hypothesized data distribution. All statistical analyses were carried out with the data analysis of Excel and Chi-Square calculator for goodness of fit.
4.3. Dependent Variables
The dependent variables (
Table 7) were categorized into two groups: (1) suitability of proposed illumination based on measurable visually effective artificial illumination (perceptual quality) and (2) suitability of the proposed illumination based on measurable biologically effective artificial illumination (quantity).
5. Results—Hypothesis Testing
This study examined the quantitative and qualitative characteristic of LED illumination to best meet the requirements for the visual appearance and biological health of indoor ornamental plants. For the visual appearance evaluation, a survey was conducted based on photographs of ornamental plants (taken during the physical lighting test). For the biological requirements evaluation, a physical lighting test was performed to examine the varied wavelengths of light and the spectral ratios of LED light sources (
Table 8). The results are shown in graphical form (
Figure 11,
Figure 12,
Figure 13 and
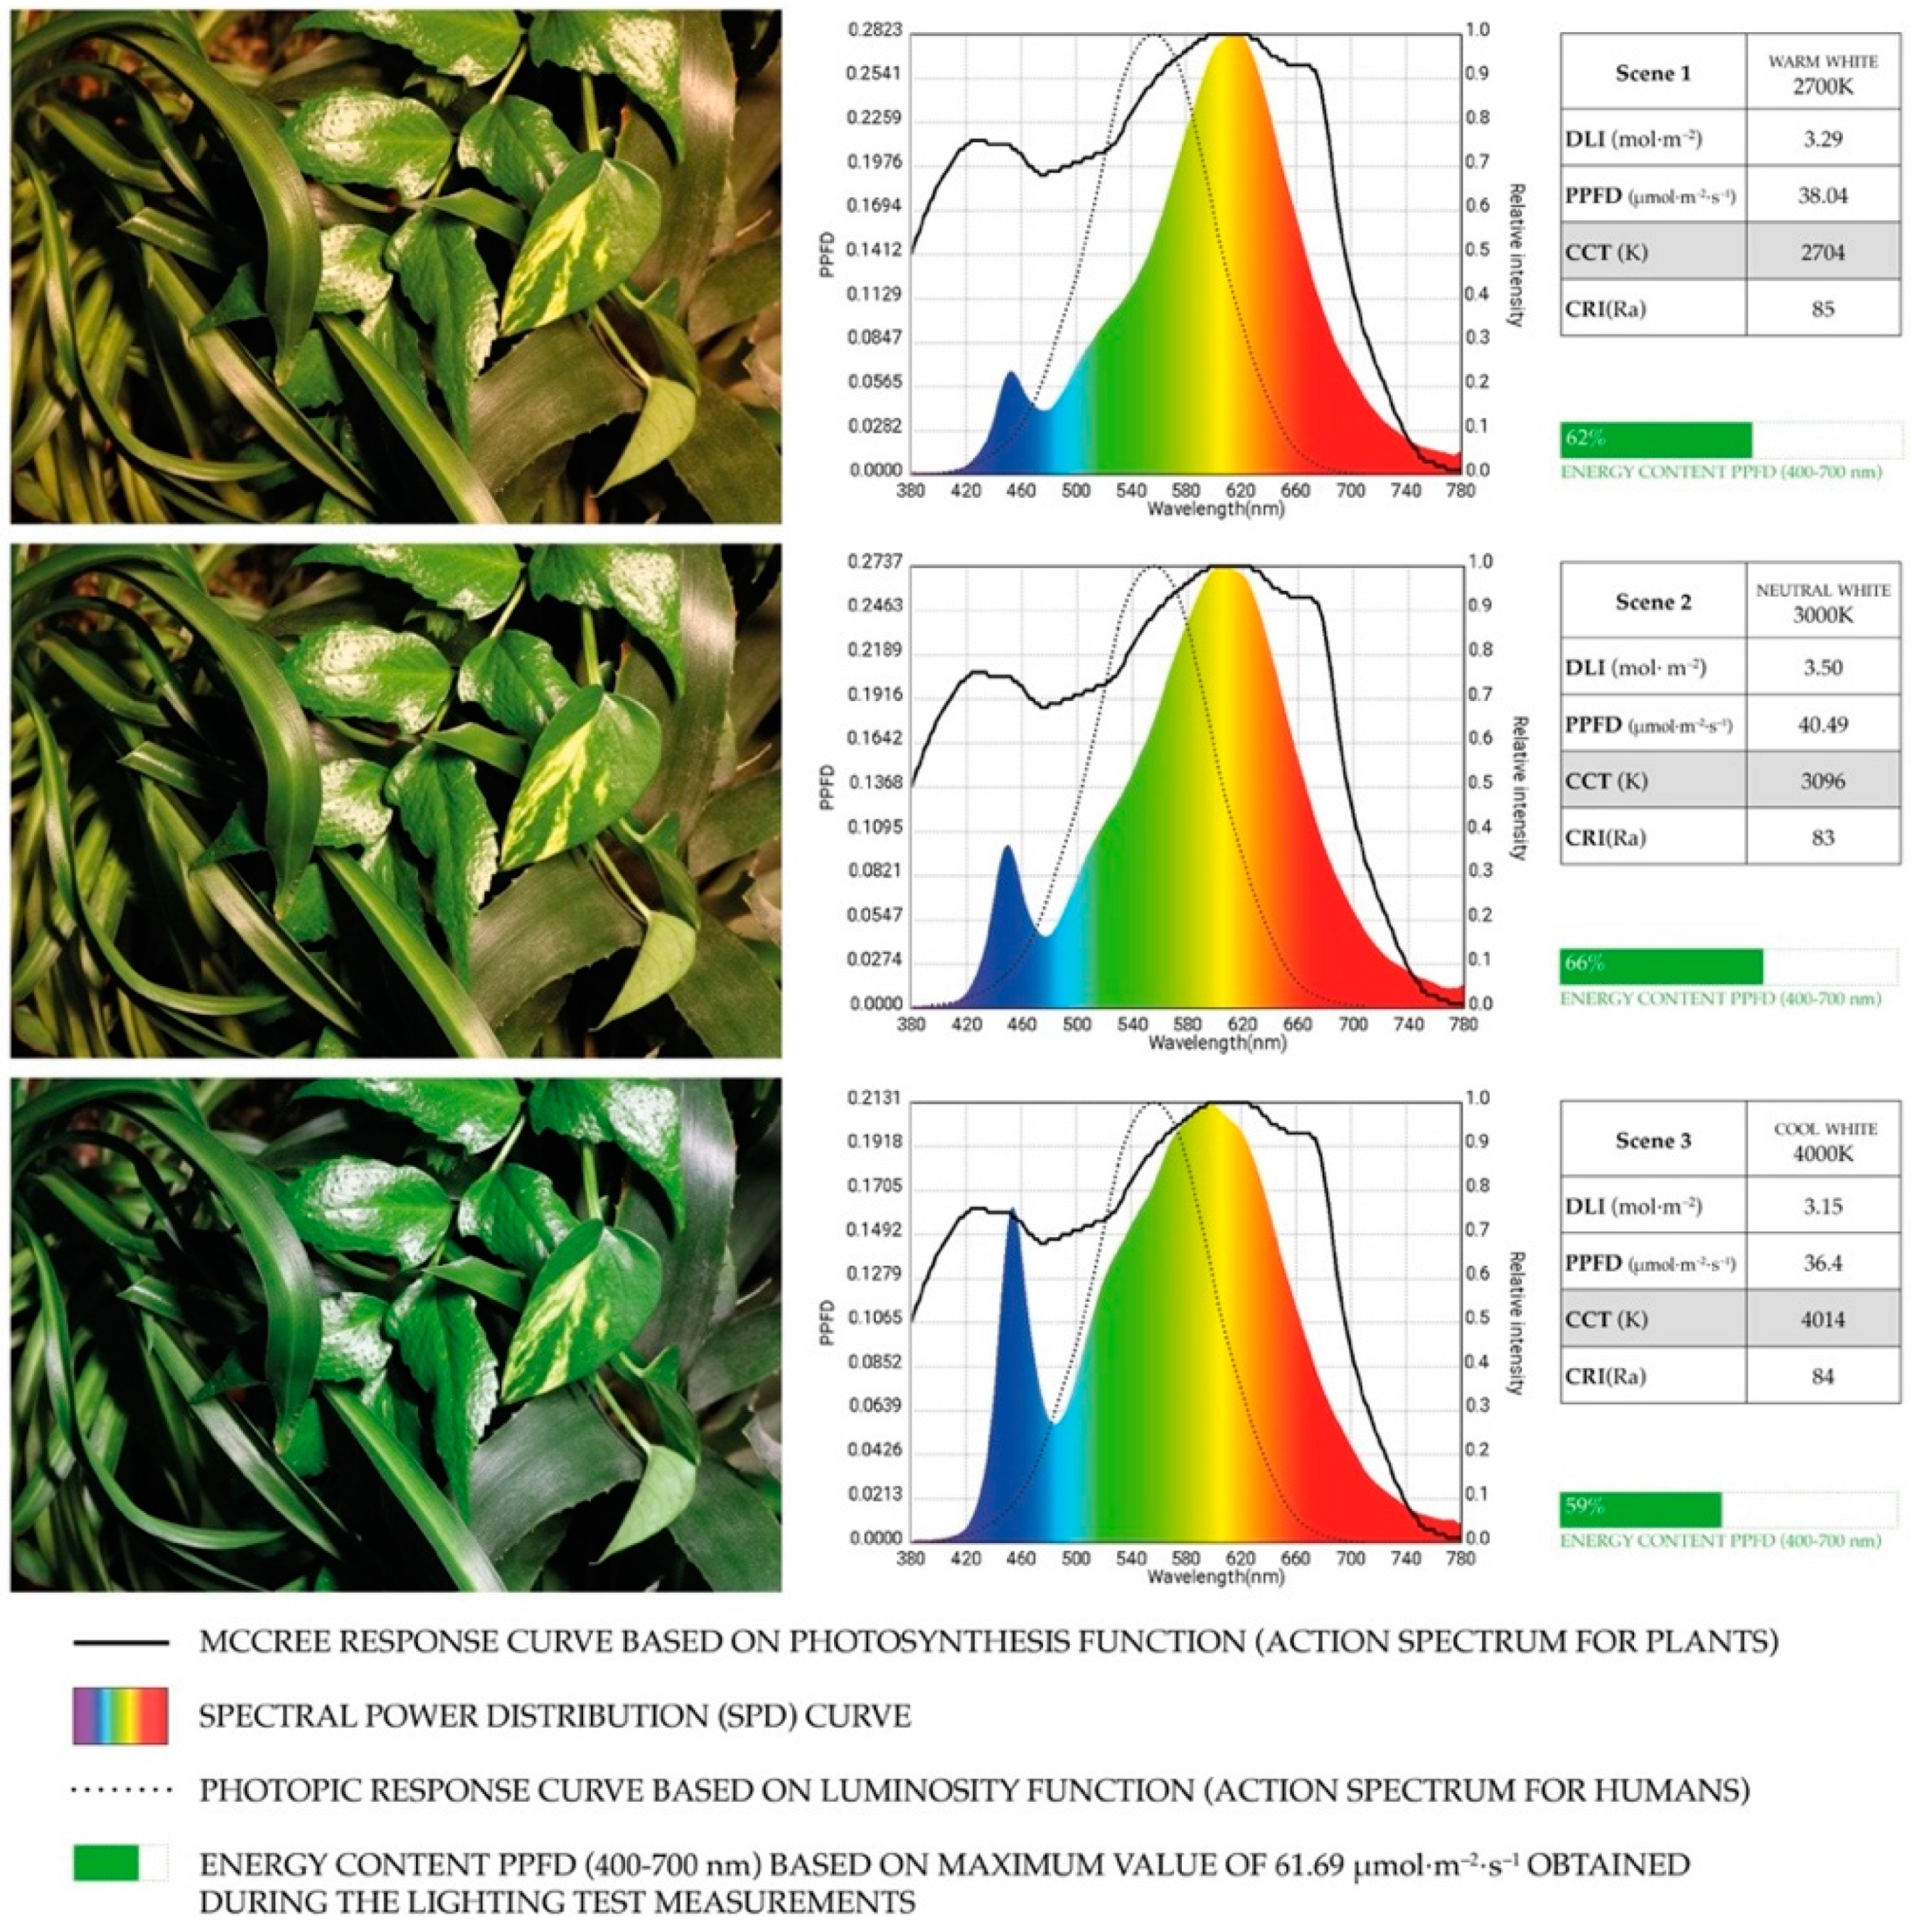
Figure 14). They consist of: (1) a photograph of the lighting scene, (2) the SPD image graph representing the PPFD, downloaded from the spectrometer app, (3) a table showing the measured data, and (4) a horizontal green bar that indicates the energy content of PPFD (400–700 nm) as a percentage (to make the data easier to read).
5.1. Results—Overview
Physical Lighting Test, Phase 1
Physical Lighting Test, Phase 2
Physical Lighting Test, Phase 3
Physical Lighting Test, Phase 4
5.2. Hypothesis 1 (H1)
5.2.1. Measurable Visually Effective Artificial Illumination
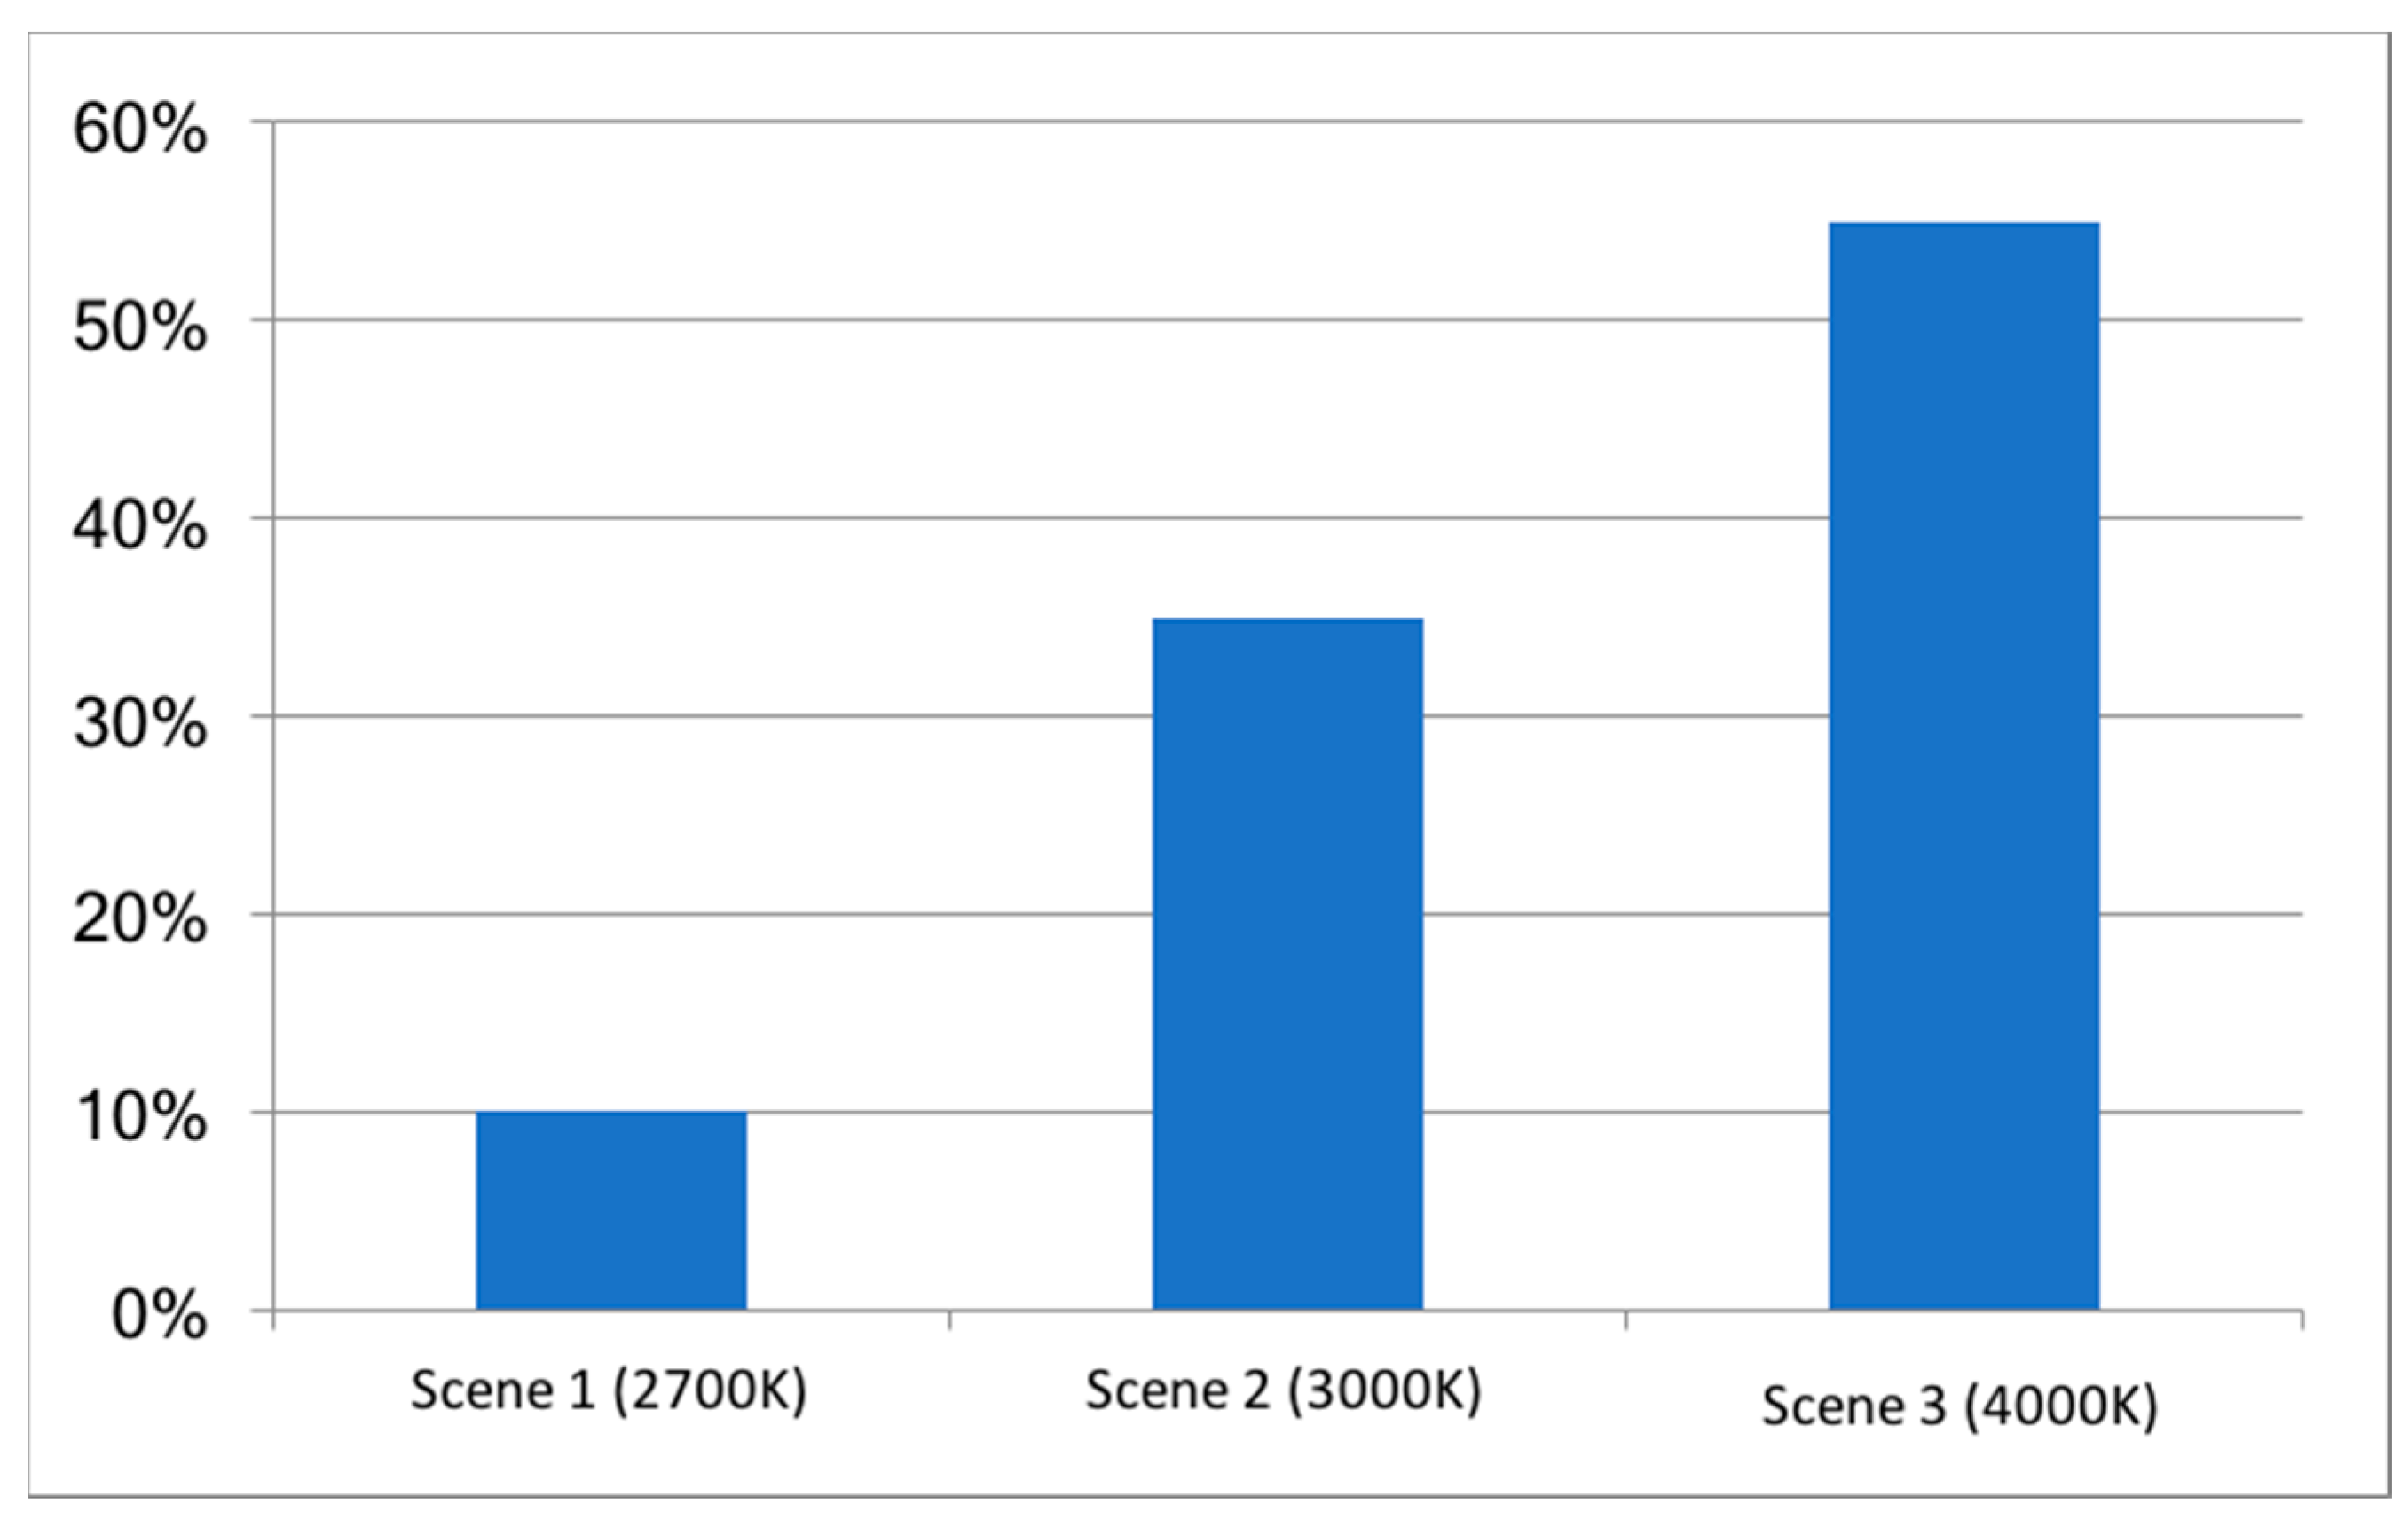
In the survey evaluating the personal visual preference of three lighting scenes (
Figure 11), each with standard white LED lighting that has a different CCT value (see Question 2.1a in
Supplementary Materials), there was noticeable agreement between the participants. Scene 3 with a CCT of 4000 K and the appearance of cool tones was indicated as the most preferred, and scene 1 with a CCT of 2700 K and the appearance of warm tones was the least preferred (
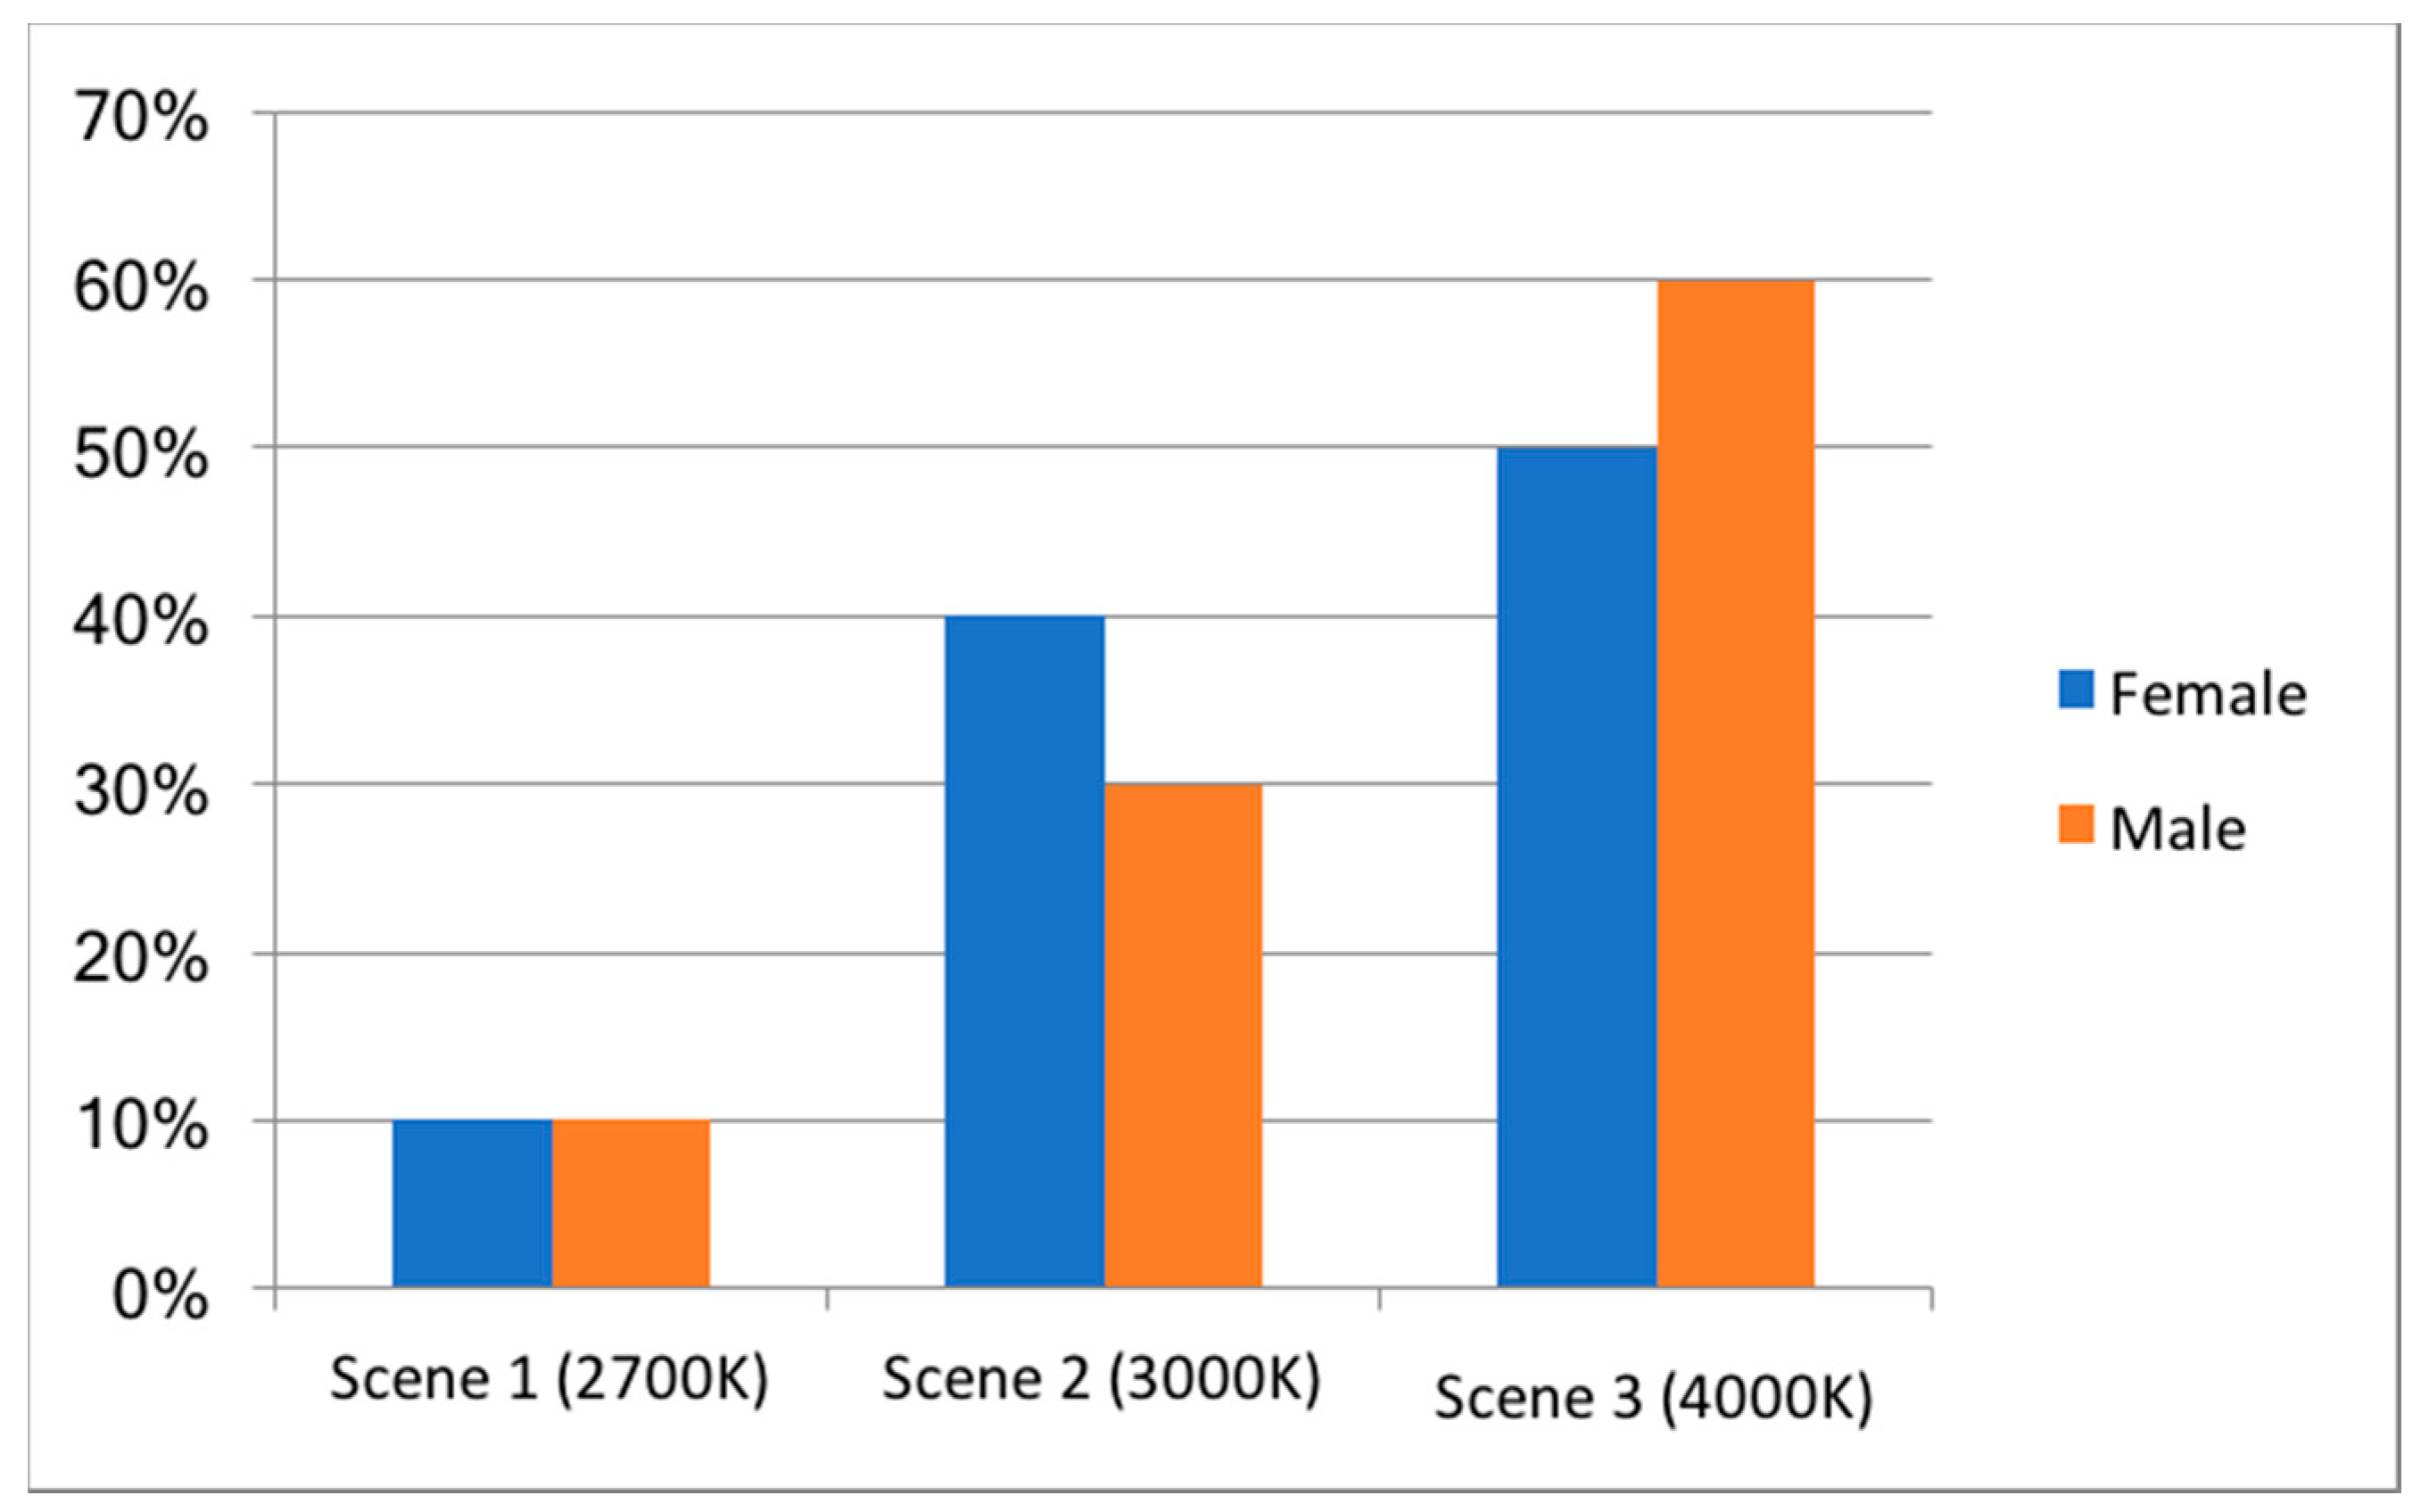
Figure 15). The questionnaire results showed that if the spectral composition of visual action spectrum was missing some of the wavelengths as in scene 1, the lighting scene was perceived as unnatural. As mentioned by some participants, (Question 2.1b) scene 3 was chosen because: “it looks fresh”, “is the most natural looking”, “it looks not as red as the others”. Scene 1 was not chosen because: “it looks too yellowish in appearance”. There was also no differentiation between gender preferences. Both men and women evaluated scenes 1 and 3 in almost the same manner (
Figure 16).
Additionally, participants were asked which of the lighting scenes looked the most natural using the 5-point Likert scale (Questions 2.2a–2.2c). Scores on this measure were subjected to a single factor ANOVA (analysis of variance) to determine whether there were marked differences within the data groups (
Table 9). A significance level of 0.05 (alpha) was considered.
The results suggested the p-value (0.012561) of the ANOVA result between groups was significant. The F-value (4.731225) was greater than the F-critical value (3.158843) so it fitted into the rejection area. This means there was a noticeable variation within the three groups. In order to determine which groups were different from which groups, a post-hoc two-tailed t-test was carried out with a significance level of 0.05 (alpha). The Bonferroni correction for a t-test was applied to avoid errors when many comparisons are involved. The results from post-hoc two-tailed t-tests suggested scene 1 was distinctly different than scenes 2 and 3. However, there were no considerable differences between scenes 2 and 3.
5.2.2. Measurable Biologically Effective Artificial Illumination
The analysis of lighting test phase 1 (
Figure 11) revealed scene 2 had the higher PPFD content (40.49 µmol·m
−2·s
−1) as compared to scenes 1 and 3. It is interesting to note, even at first glance the SPD of scene 3 appeared to achieve a larger area of field content, with more accurate evaluation of the numbers on Y axes. It was revealed in scene 3, that the content was lower than in the other two scenes.
Additionally, the SPD was missing some of the wavelengths in comparison to the McCree response curve reference, specifically in scenes 1 and 2 content was absent in UV-A, and partially in blue (450 nm peak in chlorophyll b and carotenoid photoreceptors) and red (660 nm peak in chlorophyll a and phytochromes Pfr photoreceptors). Whereas, scene 3 was poor in UV-A and red content.
In all three lighting scenes, the architectural white LED lighting tested with the standard CCT commonly used in general indoor lighting, appears to not fully match the McCree response curve reference.
5.3. Hypothesis 2 (H2)
5.3.1. Measurable Visually Effective Artificial Illumination
For the majority of respondents, the lighting scenes (
Figure 12) that used a single color LEDs with a peak in just one small part of the visible spectrum looked unnaturally because of their “artificial appearance” (Question 3.1a). As mentioned by some participants, the scene 3 verde and scene 4 true green with hues of green color were also preferred because for some of the respondents: “plants often look green”, “others scenes looked too artificial” or the green color “seems to be the closest to the natural appearance of plants” (Question 3.1b).
5.3.2. Measurable Biologically Effective Artificial Illumination
The outcomes of lighting test phase 2 (
Figure 12) show a very low energy content of PPFD, for each single monochromatic LED. Scene 1 deep blue and scene 5 hyper red achieved the highest value of PPFD content (10.54 µmol·m
−2·s
−1 and 15.27 µmol·m
−2·s
−1 respectively). These are the LED colors usually used in horticulture for the illumination of plants for food production, mixed together to create the commonly recognized magenta color.
5.4. Hypothesis 3 (H3)
Measurable Visually Effective Artificial Illumination
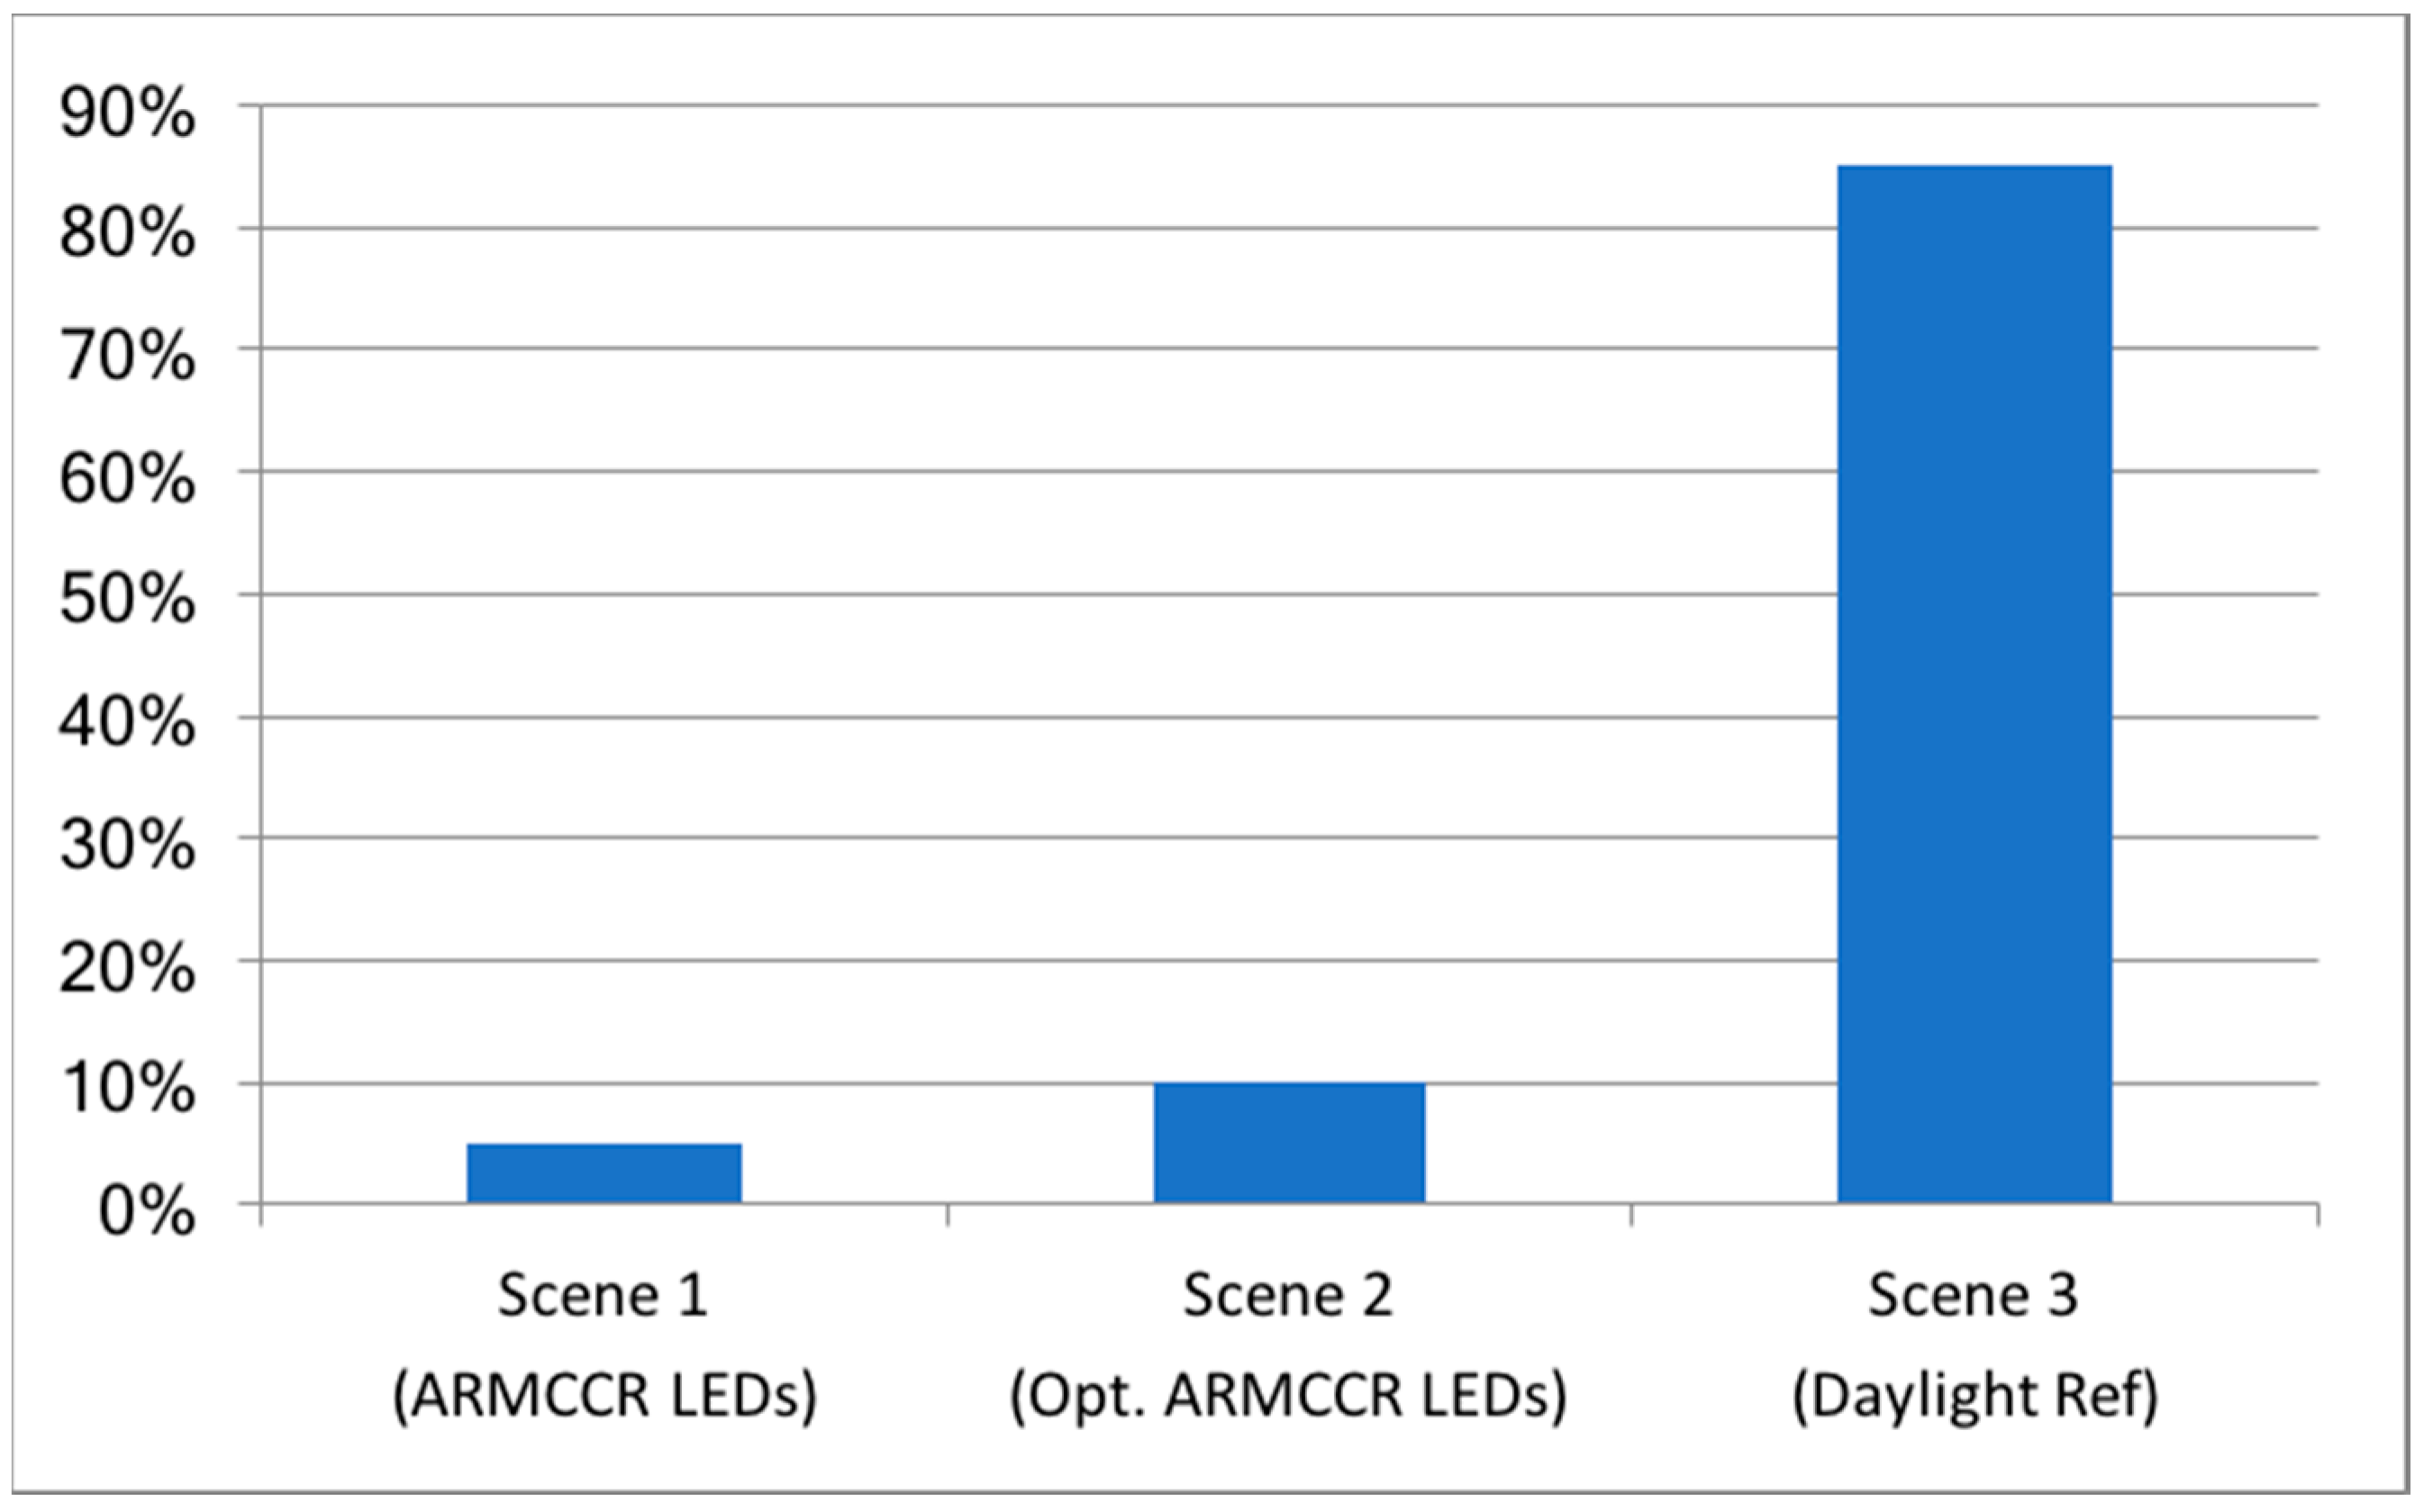
In the survey evaluating two lighting scenes with mixed spectral compositions compared to the daylight reference (
Figure 13) to ascertain personal visual preference (Question 4.1a), there was noticeable agreement between participants. Scene 3—the daylight reference was indicated as the most preferred (
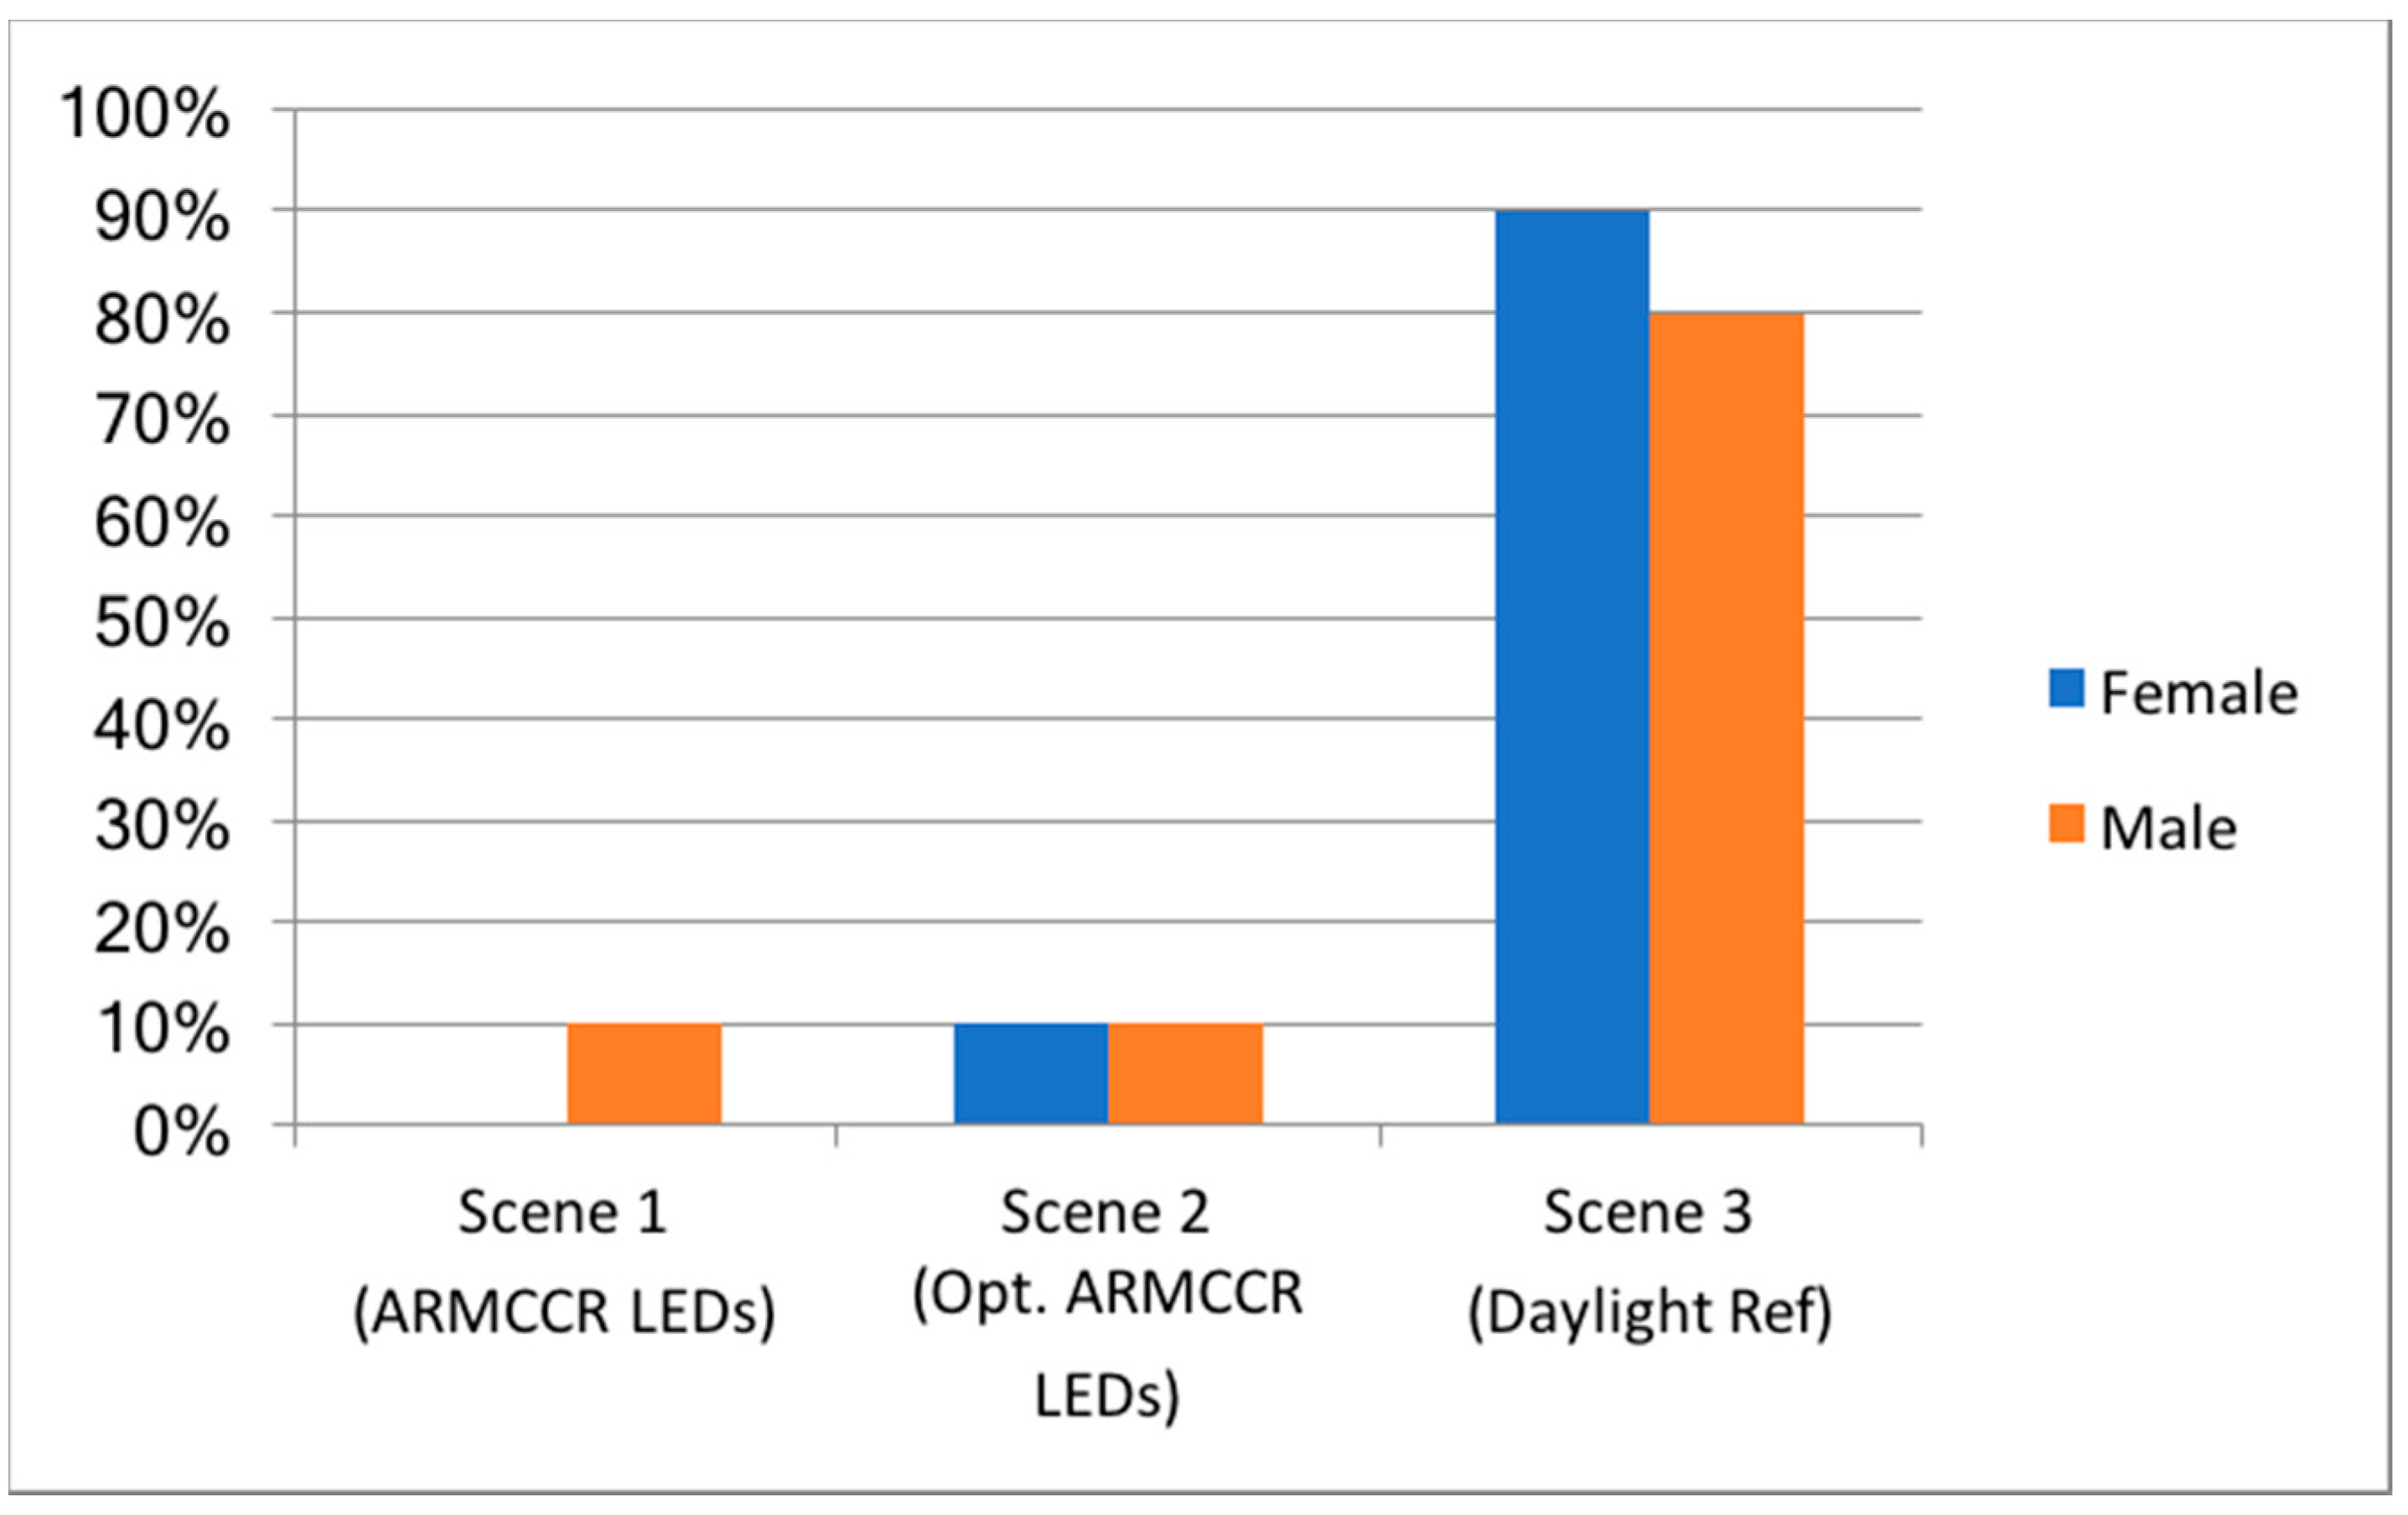
Figure 17). As mentioned by some participants (Question 4.1b) scene 3 was chosen because: “it looks natural and appealing” and “colors are nicer”. There was also no differentiation between gender preferences. Both men and women evaluated scene 3 almost in almost the same manner (
Figure 18).
5.5. Hypothesis 4 (H4)
Measurable Biologically Effective Artificial Illumination
The analysis of lighting test phase 3 (
Figure 13) revealed scenes 1 and 2 had higher PPFD content (56.18 µmol·m
−2·s
−1 and 57.96 µmol·m
−2·s
−1 respectively) compared to lighting test, phase 1. It is important to observe that within the same light output, a different spectral composition that attempts to imitate the McCree response curve as reference, allowed the energy content to increase markedly and therefore become more effective for a plant’s response. By using the SPD of scene 1 as a base, and adding green (true green) and red (hyper red), and lowering the blue (deep blue) content respectively, it was possible to achieve in scene 2, an improved visual appearance of ornamental plants, and to also increase by a small amount, the energy content.
5.6. Hypothesis 5 (H5)
Measurable Visually Effective Artificial Illumination
Overall the best biologically effective LED illumination of ornamental plants (
Figure 13), in the lighting test (phase 3, scene 2 Opt. ARMCCR LEDs) was also chosen by the participants to be visually appealing. This scene was preferred because it seemed: “more natural and cozy, with “good contrast, natural looking lighting and natural looking colors” whereas, in other scenes, “the plants look like they are made of plastic” (Question 4.3b).
Participants were also asked in the questionnaire, which lighting scene looked most similar to the reference image, which was the picture of plants taken in daylight (Question 4.2a–4.3a). The responses were formulated on the 5-point Likert scale. The lighting of the scenes differed in terms of the SPD ranging between scene 1 (ARMCCR LEDs) and scene 2 (Opt. ARMCCR LEDs). A single factor ANOVA (analysis of variance) with a significance level of 0.05 (alpha) was considered, applied to the collected response on this measure in order to determine whether there were marked differences within the data groups (
Table 10). The results suggested that the
p-value (0.00032) was significant. Another way of interpreting the results could be that the F-value (15.66168) was essentially greater than the F-critical (4.098172) value, meaning it fitted into the rejection area. This supported the notion that there was a marked variation within these two groups. To determine which group or which scene represented the image most closely, related to the reference daylight, a post-hoc one-tailed t-test was carried out with a significance level of 0.05 (alpha). The results from the post-hoc one-tailed t-tests suggested scene 2 (Opt. ARMCCR LEDs) looked most similar to the reference image.
5.7. Hypothesis 6 (H6)
Measurable Biologically Effective Artificial Illumination with Ambient Lighting
The analysis of lighting test phase 4 (
Figure 14) reveals that scene 2 had a higher PPFD content (61.69 µmol·m
−2·s
−1) compared to all the performed lighting test phases (1–4). The shift between the SPD of OPT. ATRMCCR LEDs between scenes 1 and 2 with an ambient illumination of 3500 K and 3000 K CCT respectively, was seen in the green part of the spectrum. As an effect, there is an increase in the energy content. Both scenes 1 and 2 following the McCree response curve reference.
5.8. Hypothesis 7 (H7)
Measurable Visually Effective Artificial Illumination
In terms of qualities considered for the visual appearance of ornamental plants, the participants provided their personal preferences in regards to physical plant sensory attributes classes (Question 5.1a). These were: “form”, “shape”, “size”, “texture”, “visible contrast”, “shadows”, “patterns”, “brightness/intensity”, and frequently mentioned “color”.
From the previous analyses and observations, a conclusion was drawn that the color of leaves is important for the plant’s overall visual appearance. Additionally, the majority of participants considered color as “very important” or “important” (Question 5.2a).
Data to more quantitatively support this hypothesis was collected in the survey. A commonly used statistical method was used (Chi-Square “goodness-of-fit” test) to determine whether the sample distribution was consistent with the expected probability distribution (
Table 11).
The actual data observations were split into five categories according to a five-point Likert-scale representing the responses to the question. The counts of data observations in each category were compared with the expected number of scores that would be in identical categories if the data exactly matched the hypothesized distribution.
A Null Hypothesis test was formulated—that the color of the plant’s leaves is not important for its overall visual appearance—to ensure the actual and expected number of counts of data points in each of the categories were the same. This null hypothesis was rejected if either of the following two equivalent conditions were met: (1) the Chi-Square statistic was larger than the critical Chi-Square value and (2) the p-value was smaller than the significance level.
On the basis of these results, both of these equivalent conditions for hypothesis rejection exist and were as follows: (1) Chi-Square statistic = 29.00 was larger than critical Chi-Square value = 9.5 and (2) p-value < 0.00001 was smaller than the significance level = 0.05. The null hypothesis which consequently suggests the counter statement is correct, which is that the color of the plant’s leaves is important for its overall visual appearance was rejected.
Additionally, the majority of respondents supported their choice of color as important for the overall visual appearance of the plants as: “it defines the character of the plant“,” it sets the mood of the space”, but also that “the leaves indicate how healthy the plant is” (Question 5.2b).
6. Discussion
The main research goal of this study was to establish relevant sustainable design principles when applying new light sources such as LEDs to illuminate ornamental plants. With an additional aim to answer questions about the optimal action spectrum for visually and biologically effective illumination, and the visual effects of monochromatic LEDs applied singly or in combination as mixed LEDs.
Based on the results of lighting test phase 1, there is a strong association between a higher value CCT (4000 K) and participant’s preferred visual appearance of plants (scene 3), which out of the three scenes, has the closest resemblance to the spectrum of natural daylight. The increased visual preference by the survey participants for scene 3, was most probably related to the increase in green and blue parts of the spectrum detected by the biological pigments of the cone cells in the human eye, as daylight consist of higher levels of these two wavelengths of light.
Although the spectral distribution curves of standard LED light sources for general illumination in architecture are designed to meet lighting standards, for example: to produce good colour reproduction and provide visual comfort, existing metrics such as CCT, CRI, TM-30-15 and McAdam/standard deviation colour matching (SDCM) all have their limitations. Complicating the picture further, the quality of light may vary depending on the light source/luminaire manufacturer. It is therefore, strongly advised that luminaires be selected using a combination of metrics with a review of the SPD. While most lighting used for indoors plants involves the use of standard general indoor LED lighting with a CCT of 2700 K, 3000 K or 4000 K, illumination for humans does not provide ornamental plants with what they require for biological health. The black McCree curve (
Figure 11,
Figure 12,
Figure 13 and
Figure 14) indicates the necessary action spectrum for photosynthesis is incomplete, and the necessary spectral range for photomorphogenesis is missing and/or is either too low or too high. This is one of the reasons why plants in such settings will languish and eventually die. Ornamental plants need far more light than that required to fulfil the human visual perception of brightness. This is why in each case, the calculated percentage of energy action spectrum for photosynthesis in the form of PPFD (400–700 nm) have been added to the test results, displayed as a green horizontal bar, to prove the levels are too low. The PPFD values reduce rapidly, based on the distance between the sensor of the measuring device (by around 20 cm one would lose around 20 µmol·m
−2·s
−1). This indicates light sources for plants should be close enough to generate enough PPFD and that general workspace lighting will be insufficient at providing the appropriate levels for biologically effective illumination. The above findings support hypothesis 1.
Results of lighting test phase 2, supports hypothesis 2 and highlights why artificial lighting produced by existing luminaires from the horticulture sector cannot be applied to biophilic architecture and design on a one-to-one basis. This is due to a lack in relationship between visual perception and aesthetics. Plants illuminated in such a way will appear unnatural. CRI and visual comfort do not match any of the existing metrics such as CCT, CRI, TM-30-15 and McAdam/standard deviation colour matching (SDCM), as they usually compose of only two to three individual monochromatic spectra and not a continues spectrum. The majority of questionnaire respondents agreed these scenes looked unnatural. Obviously, the perception of color is a subjective process, as the human brain responds to visual stimuli triggered when a particular wavelength of light is detected by cone cells in the eye. Furthermore, while using colored LED lighting, and depending on the plant species, the shape and growth of certain parts of the plant could be non-uniform and require an increased maintenance cycle. Special LED luminaires from the field of horticulture cannot provide the full spectrum of daylight as such luminaires are specifically designed to promote the accelerated growth and development of flowers, leaves and fruits.
For the majority of survey participants, there was a strong association between the daylit reference (lighting test phase 3, scene 3) and the preferred visual appearance of plants (scene 2), supporting hypothesis 3, that when given the opportunity, humans always visually prefer objects/ornamental plants illuminated by natural light/daylight in interior settings compared to artificial illumination. These findings are in line with other research that states people have often expressed visual preferences for natural environments [
50].
The overall results in lighting test phase 3, also show a strong interaction between the visible spectrum and the action spectrum of plant illumination. One spectrum, ARMCCR LEDs, appears to ideally replicate the referenced McCree curve, with the 25% of energy content increased compared to general illumination in architecture (lighting test phase 1). The other spectrum, Opt. ARMCCR LEDs, achieve a better visual appearance, as confirmed from the visual assessment questionnaire-based survey, section 4. In order to achieve an optimal balance between visual comfort and the necessary biological spectrum for ornamental plant growth, precise analysis and coordination of the PPFD and DLI values are crucial. It is therefore vital, not only to observe the curve of the visible spectrum but above all else, to look closely at the energy content (PPFD/DLI) of the active spectrum in relation to it. The above outcomes support hypothesis 4 that the right action spectrum for biologically effective illumination for ornamental plants can be generated with correctly designed LED light sources.
During lighting test phase 3, existing software and control devices (DMX single-channel control) were used to mix monochromatic LEDs in such a way to form a spectral distribution curve that covered both the relevant biological spectra necessary for ornamental plants to grow, to provide visual comfort for human occupants, and also give an appealing appearance to indoor plant based on perception psychology. For the LED chip production, the exact spectrum of action was mixed precisely via the coordination of a LED base and the LED’s phosphor chip, supporting hypothesis 5, that biologically effective LED illumination can also look natural and visually appealing.
Interestingly, as lighting test phase 4 reveals, fine adaptations in the spectral composition of general ambient lighting of 3000 K added to the optimized ARMCCR LEDs, with a shift of the visible spectrum to the effect compared to the referenced McCree Curve values which support Hypothesis 6. In real life projects, one would not only have to consider the correct light spectra for the plants themselves, but also to take into account the other ambient lighting in the interior space which would affect the SPD curve of the dedicated illumination for plants. (This would also affect their visual appearance.) Although this study delivered a valuable design research method that aids controlled experiments and enables researchers to assess the effects of LED illumination on ornamental plants in interior spaces, the proposed method should be individually tested for each specific environment every single time.
Lastly, the majority of participants considered the color of leaves as very important for the overall appearance of ornamental plants, supporting hypothesis 7. It is believed that the evaluation of only one attribute might be insufficient to explain all of the diversity involved in the visual preferences of plants. Therefore, in the future, internal preference mapping could be performed in order to define the primary sensory attributes list, and to evaluate each attribute on the scoring scale.
This study provides preliminary evidence for a relationship between visually and biologically effective illumination for ornamental plants in response to appropriately designed LED light sources.
While no artificial lighting, including modern LED light sources, can mimic the characteristics of daylight, this study has shown, in a small sample, evidence that a good compromise can be achieved in providing visually and biologically effective illumination for ornamental plants, and humans as the end user. The findings reveal and help fill gaps in literature that has not been previously exposed. Anyone who researches, designs and applies optimal illumination for plants in interior spaces should have the necessary knowledge about the relationships between the action spectra and overall visual appearance, as well as the correct use of relevant measuring instruments/tools. Additionally, the type of plant must be properly matched with the correct application in order to bring the best possible overall spectrum. More study and research into this topic is required to better understand the complexity of the subject by manufacturers, architects, planners and investors.
7. Limitations of the Study
Despite the contributions mentioned in
Section 6, the study has its limitations which are identified in five areas:
7.1. Lighting Test Psychical Setup
Ornamental plants are typically used in interior spaces such as residential, commercial (office, retail and hotel) and/or institutional buildings. In order to examine the exact impact of LED illumination on the biology of plants and their visual appearance, this study was undertaken as an experiment in a laboratory setting. This allowed influential and difficult to control elements to be excluded, such as: the layout and design of the space with material characteristics such as color, shape, texture; the quality and quantity of daylight and artificial lighting including glare, factors of thermal comfort such as indoor air temperature and relative humidity, as well as background noise.
7.2. Ornamental Plants
Only four easily available ornamental plants species were studied. The inclusion of more evergreen plants species popular in interior spaces would most likely not greatly impact the study outcome, as all these chosen plants can thrive in light to deep shade conditions due to the low level light requirements for photosynthesis.
Only a limited number of the plant’s appearance characteristics such as color expression were examined. This was due to concern about the inclusion of too many elements such as the plant’s size, structure, form, leaf shape or texture, which would not only increase the complexity of the analysis but also decrease the concentration of the subjects who responded to the 10-min survey. The main purpose of the study was to demonstrate the relative importance of appropriate artificial illumination and the impact it might have on the visual appearance of the plants, not a thorough examination of all possible characteristics of ornamental plants.
7.3. Visual Assessment Questionaire-Based Suvey
This study applied the evaluation of photographs of illuminated living plants displayed on a calibrated computer monitor screen to collect data in a cost effective and efficient way. A study with real-life plants might yield different results. For example, in terms of how participants observe and experience 3D compared to 2D objects.
While the questions were designed to be easily understood and were evaluated by non-lighting designers, some questions might still be unclear to participants and elicit incorrect responses.
Participants from certain age groups were excluded from the survey evaluation due to concern about their vision impacting the outcome of the study. The process of aging in humans approximates by the time people reach 40+ years old, and gradual changes are observed in the eyes with the possible development in later years of conditions such as macular degeneration (loss of central vision), cataract (loss of visual performance due to reduction of lens transparency and changes to color vision), and glaucoma (the loss of peripheral vision). Therefore, it was decided that most of the survey participants should be less than 40 years old.
The number of survey participants was limited to 20 subjects. Future studies should involve more participants to provide even more generalized outcomes.
The participant were young professionals working in Zurich, Switzerland from creative industries such as architecture and design. If in the future, a similar study is conducted, a survey should be performed with a more diverse range of professional and non-professional group, so the results of the survey will be more generalized.
With closed-ended questions in the self-administrated questionnaire, the feedback given by the participants might be influenced by the order of options, due to a tendency to select the answer at the top of the list.
7.4. Research Methodology and Measuring Tools
There is a lack of proper research methodology for ornamental indoor plants to base this research on. This includes establishing and evaluating the optimal wavelength selection and spectral ratios of LED light sources. Currently the McCree curve is used as a guide for plant photosynthesis action spectrum, but it was designed for horticulture food plants and its validation with the use of available software only measures wavelengths of light between 400 to 700 nm, so the other important parts of the spectrum outside of the mentioned visible range could not be evaluated.
Also, the detected/recorded wavelength range of universal measuring devices is limited and excludes non-visual light below 380 nm and above 760 nm.
7.5. Other Variables
Due to a lack of available time and resources, the following variables have not been considered. (It is recommended that future studies consider these additional parameters).
Light distribution, the direction of light, as well as illuminance levels might have an impact on the perception of ornamental plants by humans and on their growth and development.
Different horizontal illuminance levels based on their lighting applications e.g.,: offices versus domestic spaces etc. which will vary considerably.
The location of the plant and also the quantity of plants.
8. Conclusions
In the presented research study, field and laboratory investigations were carried out to determine if it is possible to establish an optimal action spectrum for visually and biologically effective illumination for ornamental indoor plants, whilst also considering the visual needs of humans.
A key point in sustainable green architecture design, is the integration and use of available daylight in buildings, which provides the most appropriate and effective illumination. As confirmed by the survey outcomes, due to the deeply engraved relationship with natural lighting conditions, humans will always have a preference for the daylit apperance of plants in interior settings. When daylight levels are insufficient, artificial illumination should always attempt to replicate, how ornamental plants appear in daylight. Despite some technological challenges, LEDs are the light source of choice for indoor lighting. Combined with appropriate lighting control, LEDs can deliver enough flexibility in regulating the spectral composition of artificial illumination. This offers the possibility of selecting specific wavelength emission peaks and their ratio, including enhancing illumination with far-red wavelengths for plant immunity. Such an approach can appropriately determine the visual appearance and physiological aspects of a plant’s growth. Additionally, by applying intelligent dimming, it is possible to achieve the necessary plant irradiance based on the time of the day, as well as provide a smooth transition of photoperiods (the correct light dark cycle).
Moreover, this study, also highlights the value of correctly designed illumination to achieve economical sustainability and to minimize the replacement of plants.
To achieve the above, it is necessary to translate research into practice and for relevant parties involved in the project process (the architect, lighting designer, landscape architect and plant specialists), to have close collaboration with the client and the end user.
This research makes a novel contribution to literature. It is anticipated it will help guide the development and implementation of improved quality LED-based light sources for the illumination of a wide range of ornamental plants in the indoor environments in the future. A database of the biological effects of LEDs specific wavelengths especially UV, IR and the green part of the spectrum on different plant species should be established in order to support the above goal.
This study reveals that it is also necessary to provide professional expertise and guidance on plant biology and artificial lighting research, and supportive scientific literature too, all of which are currently lacking in the field of sustainable green architecture and biophilic design.
The research also shows error-free, comprehensive data is dependent upon improved methodology, measuring devices and technical references. Consequently, new lighting performance standards need to be developed for indoor ornamental plant species, including the proposed energy content of PPFD in the form of a bar to be integrated into the measuring device software, and delivered as one of the outcomes of measured data, to ease the planning process.
Furthermore, new applied research should validate the outcomes of this study in terms of health and wellbeing by considering the long-term effects of artificial illumination on plants and building occupants.


