Article

Evaluating the Effects of Human Activity over the Last Decades on the Soil Organic Carbon Pool Using Satellite Imagery and GIS Techniques in the Nile Delta Area, Egypt

by
Elsayed Said Mohamed
1,
Mohamed Abu-hashim
2,
Mohamed A. E. AbdelRahman
1,
Brigitta Schütt
3 and
Rosa Lasaponara
4,*
1
National Authority for Remote Sensing and Space Sciences (NARSS), Cairo 1564, Egypt
2
Soil Science Department, Faculty of Agriculture, Zagazig University, Zagazig 44511, Egypt
3
Institute of Geographic Sciences, 12249 Berlin, Germany
4
Italian National Research Council, C.da Santa Loja, Tito Scalo, 85050 Potenza, Italy
*
Author to whom correspondence should be addressed.
Sustainability 2019, 11(9), 2644; https://0-doi-org.brum.beds.ac.uk/10.3390/su11092644
Submission received: 14 February 2019 / Revised: 25 April 2019 / Accepted: 6 May 2019 / Published: 8 May 2019

Abstract

:
The study aims to clarify the relationship between soil organic carbon (SOC) and human activity under arid conditions, in the east area of the Nile Delta, Egypt. SOC is one of the critical factors in food production and plays an important role in the climate change because it affects the physio-chemical soil characteristics, plant growth, and contributes to sustainable development on global levels. For the purpose of our investigations, 120 soil samples (0–30 cm) were collected throughout different land uses and soil types of the study area. Multiple linear regressions (MLR) were used to investigate the spatiotemporal relationship of SOC, soil characteristics, and environmental factors. Remote sensing data acquired from Landsat 5 TM in July 1995 and operational land imager (OLI) in July 2018 were used to model SOC pool. The results revealed significant variations of soil organic carbon pool (SOCP) among different soil textures and land-uses. Soil with high clay content revealed an increase in the percentage of soil organic carbon, and had mean SOCP of 6.08 ± 1.91 Mg C ha−1, followed by clay loams and loamy soils. The higher values of SOCP were observed in the northern regions of the study area. The phenomenon is associated with the expansion of the human activity of initiating fish ponds that reflected higher values of SOC that were related to the organic additions used as nutrients for fish. Nevertheless, the SOC values decreased in southeast of the study area with the decrease of soil moisture contents and the increase in the heavy texture profiles. As a whole, our findings pointed out that the human factor has had a significant impact on the variation of soil organic carbon values in the Eastern Nile Delta from 1995 to 2018. As land use changes from agricultural activity to fish ponds, the SOCP significantly increased. The agriculture land-use revealed higher SOCP with 60.77 Mg C ha−1 in clay soils followed by fish ponds with 53.43 Mg C ha−1. The results also showed a decrease in SOCP values due to an increasing in land surface temperature (LST) thus highlighting that influence of temperature and ambient soil conditions linked to land-use changes have a marked impact on surface SOCP and C sequestration.

1. Introduction

Soil contains the largest stock of organic carbon compared to vegetation and the atmosphere. It is considered a main factor among environment elements that affects C reservoir of carbon stock totaling 2500 Gt (1 Gt ¼ 109 t), of which about 20% are stored in the top soil layers [1]. Soil organic carbon contents and storage are a global issue and are significantly linked to global warming. About 10% of the Earth’s land surface is characterized by the presence of agro-ecosystems, and, consequently, top soil organic carbon storage is directly influenced by human action [2].
Soil organic carbon is associated to soil characteristics, climate, topographic factors, and crop management. The emission of CO2 is not only originated from combustion, but also from soil organic carbon release due to a decreasing in soil organic sequestration equal to 1047.5 Gg CO2 [3]. The development of soils as an organic carbon reservoir is controlled by different soil characteristics, such as, clay content, moisture level, aeration, soil depth, slope degree, and local aspects [4,5,6]. These factors affect the soil biological activities and, in turn, the transformation of organic matter. The soil organic carbon pool (SOCP) varies among different soils: Clay soils in general contain relatively high mean SOCP with 4.08 ± 1.41 kg C m2, while highest SOCP with 7.07 kg C m2 was observed in a clay loam soil associated with soil type and soil water retention [7]. The lowest SOCP of 2.57 kg C m2 was observed in sandy clay loam soil that was associated with bare soil.
In arid and semi-arid regions, low precipitation with strong seasonality is one of the most important controlling factors of the decay and transformation of soil organic matter. In these arid conditions, to increase agricultural production (according to the economic and social situations of the settlers), irrigation and mineral additive practices are commonly used, producing as a consequence a reduction of carbon stocks in the soil layers [8]. Therefore, in arid to semi-arid areas, agriculture has a significant influence on the stock of soil organic carbon at the local level. However, the annual rate of loss of organic matter can vary greatly, depending on the specific cultivation practices and the type of plant/crop cover, whereupon special focus has to be put on soil melioration measures such as irrigation and drainage [9]. To better understand the impacts of land use and climate change on the carbon cycle processes at a local scale [10,11], investigations on the spatiotemporal distributions of SOC pools and their changing dynamics are required.
The estimation of the impact of human activity on the environment is a critical issue as clearly highlighted in the 2030 Agenda on Sustainable Development ratified by the UN General Assembly in September 2015. Indeed, the international community is facing critical challenges in addressing the promotion of prosperity and people’s well-being while protecting the environment. It is expected that the 2030 agenda will drive the global sustainable development until 2030 and beyond, monitoring the process on the basis of 17 Sustainable Development Goals (SDGs), 169 targets translated into 232 indicators that intend to provide a management tool for countries to implement development strategies. The 2030 Agenda for Sustainable Development clearly suggested the use of Geospatial Information and Earth Observations (EO) to monitor progress and achieve the SDG targets. Our effort is a contribution in the definition of the best practices and experiences regarding the production of critical information necessary for the preservation of natural resources and environment. Our approach is based on the joint use of (i) historical and updated data available from satellite technologies at a global scale free of charge, and (ii) data processing to extract useful information from the investigated dataset. In other words, the use of diverse satellite based proxy indicators are herein proposed as tools to detect, compare, and capture the impacts of human activity over time in a quantitative, objective, and reliable manner. Updated maps and related information are important for decision makers to support and design sustainable development plans following the Agenda 2030 recommendations. In particular, the use of satellite technologies today can suitably support the decision makers and the development plan processes providing suitable free of charge tools useful for multi-temporal analysis based on the past and the current conditions capturing changes at diverse temporal and spatial scales from a global down to a local level.
The estimation and modelling of SOC contents using remote sensing technologies and geographical information systems has increasingly gained importance as reliable tools useful to outline the spatial variability of various soil phenomena, including soil organic carbon [12,13,14]. In particular, satellite technologies can provide useful information to estimate SOC, allowing quantitative assessments of SOC contents using proxy indicators, such as spectral indices like the Normalized Difference Vegetation Index (NDVI), Normalized Difference Wetness Index (NDWI), and Enhanced Vegetation Index (EVI). According to several studies [15,16,17,18,19,20,21,22,23,24], the reliability of a quantitative assessment of SOC contents depends on statistical prediction models such step-wise linear regression, principal component regression, and partial least squares regression support vector regression (SVR), artificial neural networks (ANN), and random forest (RF) used to infer the volume-dependent SOC content of the soil body [15,16,17,18,19,20,21,22,23,24,25]. Remote sensing technologies and statistical analysis can enable us to overcome the limitation of methods only based on field surveys and laboratory measurements, which provide information limited to the sites where the measurement was done.
In this study we focused on the use of satellite data, statistical analysis and geographical information systems in order to assess: (i) the spatiotemporal changes of SOC in selected areas (located in the eastern Nile Delta), and (ii) the effects on the spatiotemporal changes of SOC.

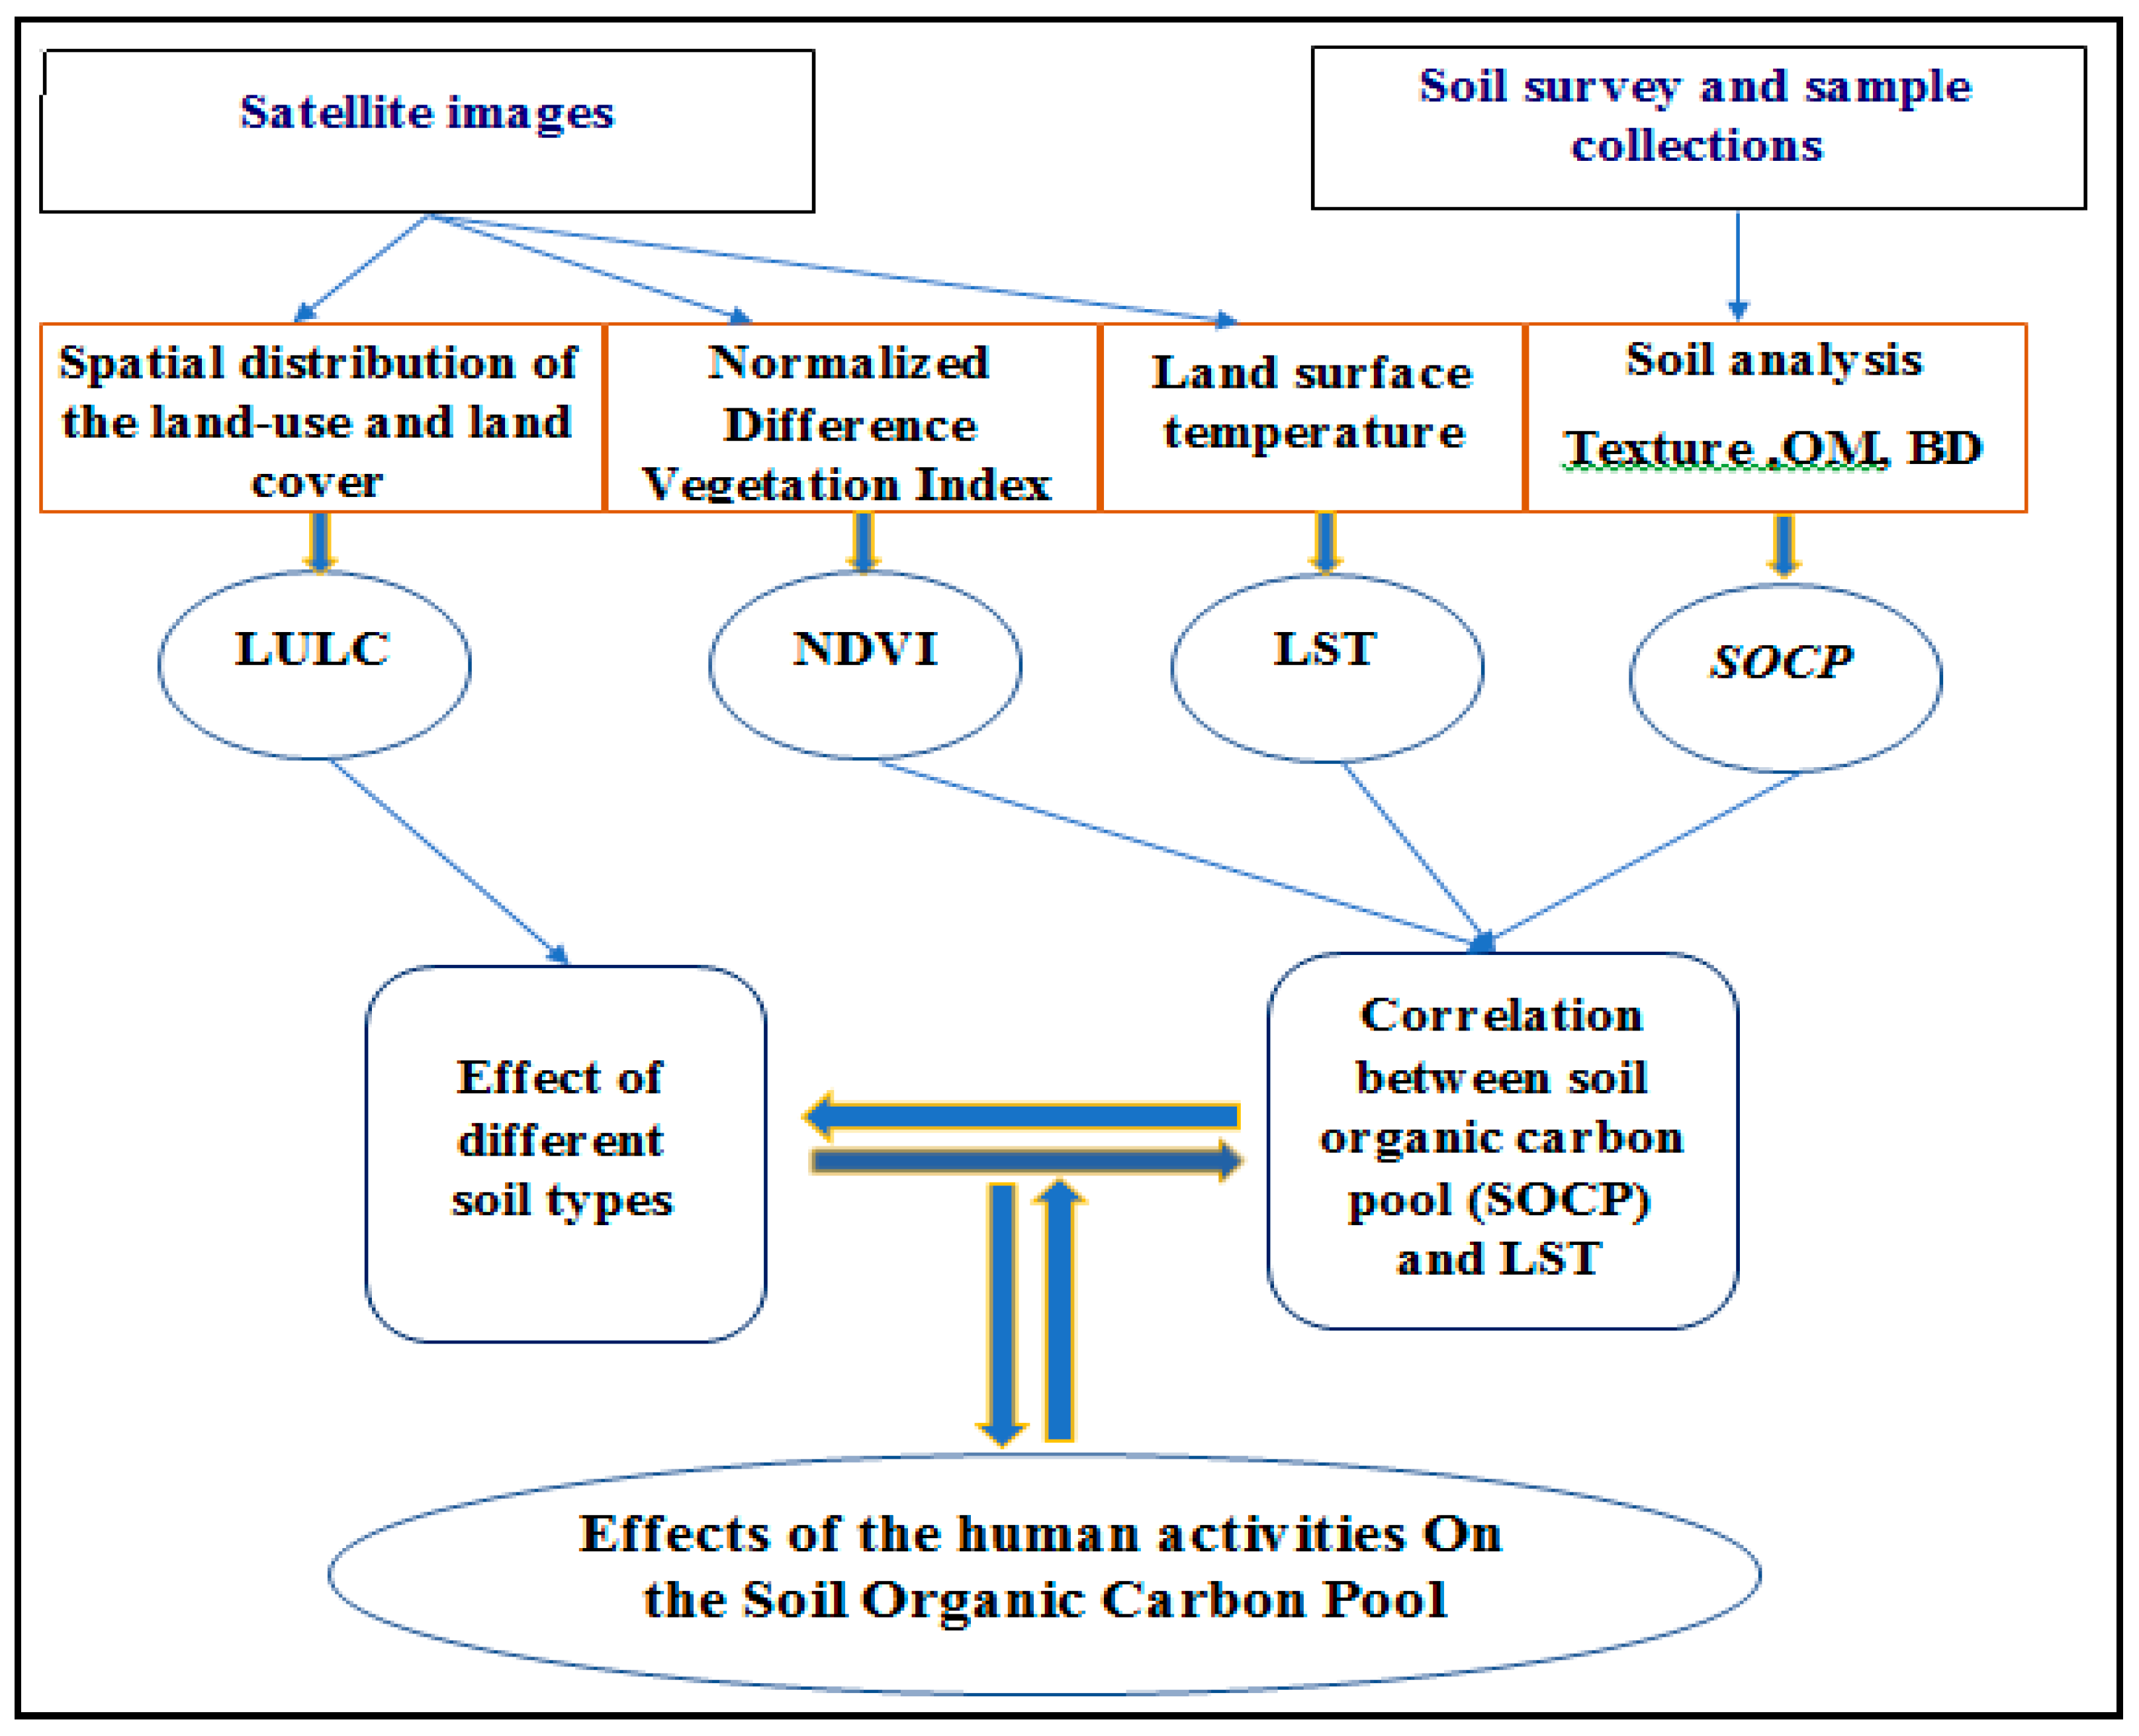
2. Materials and Methods

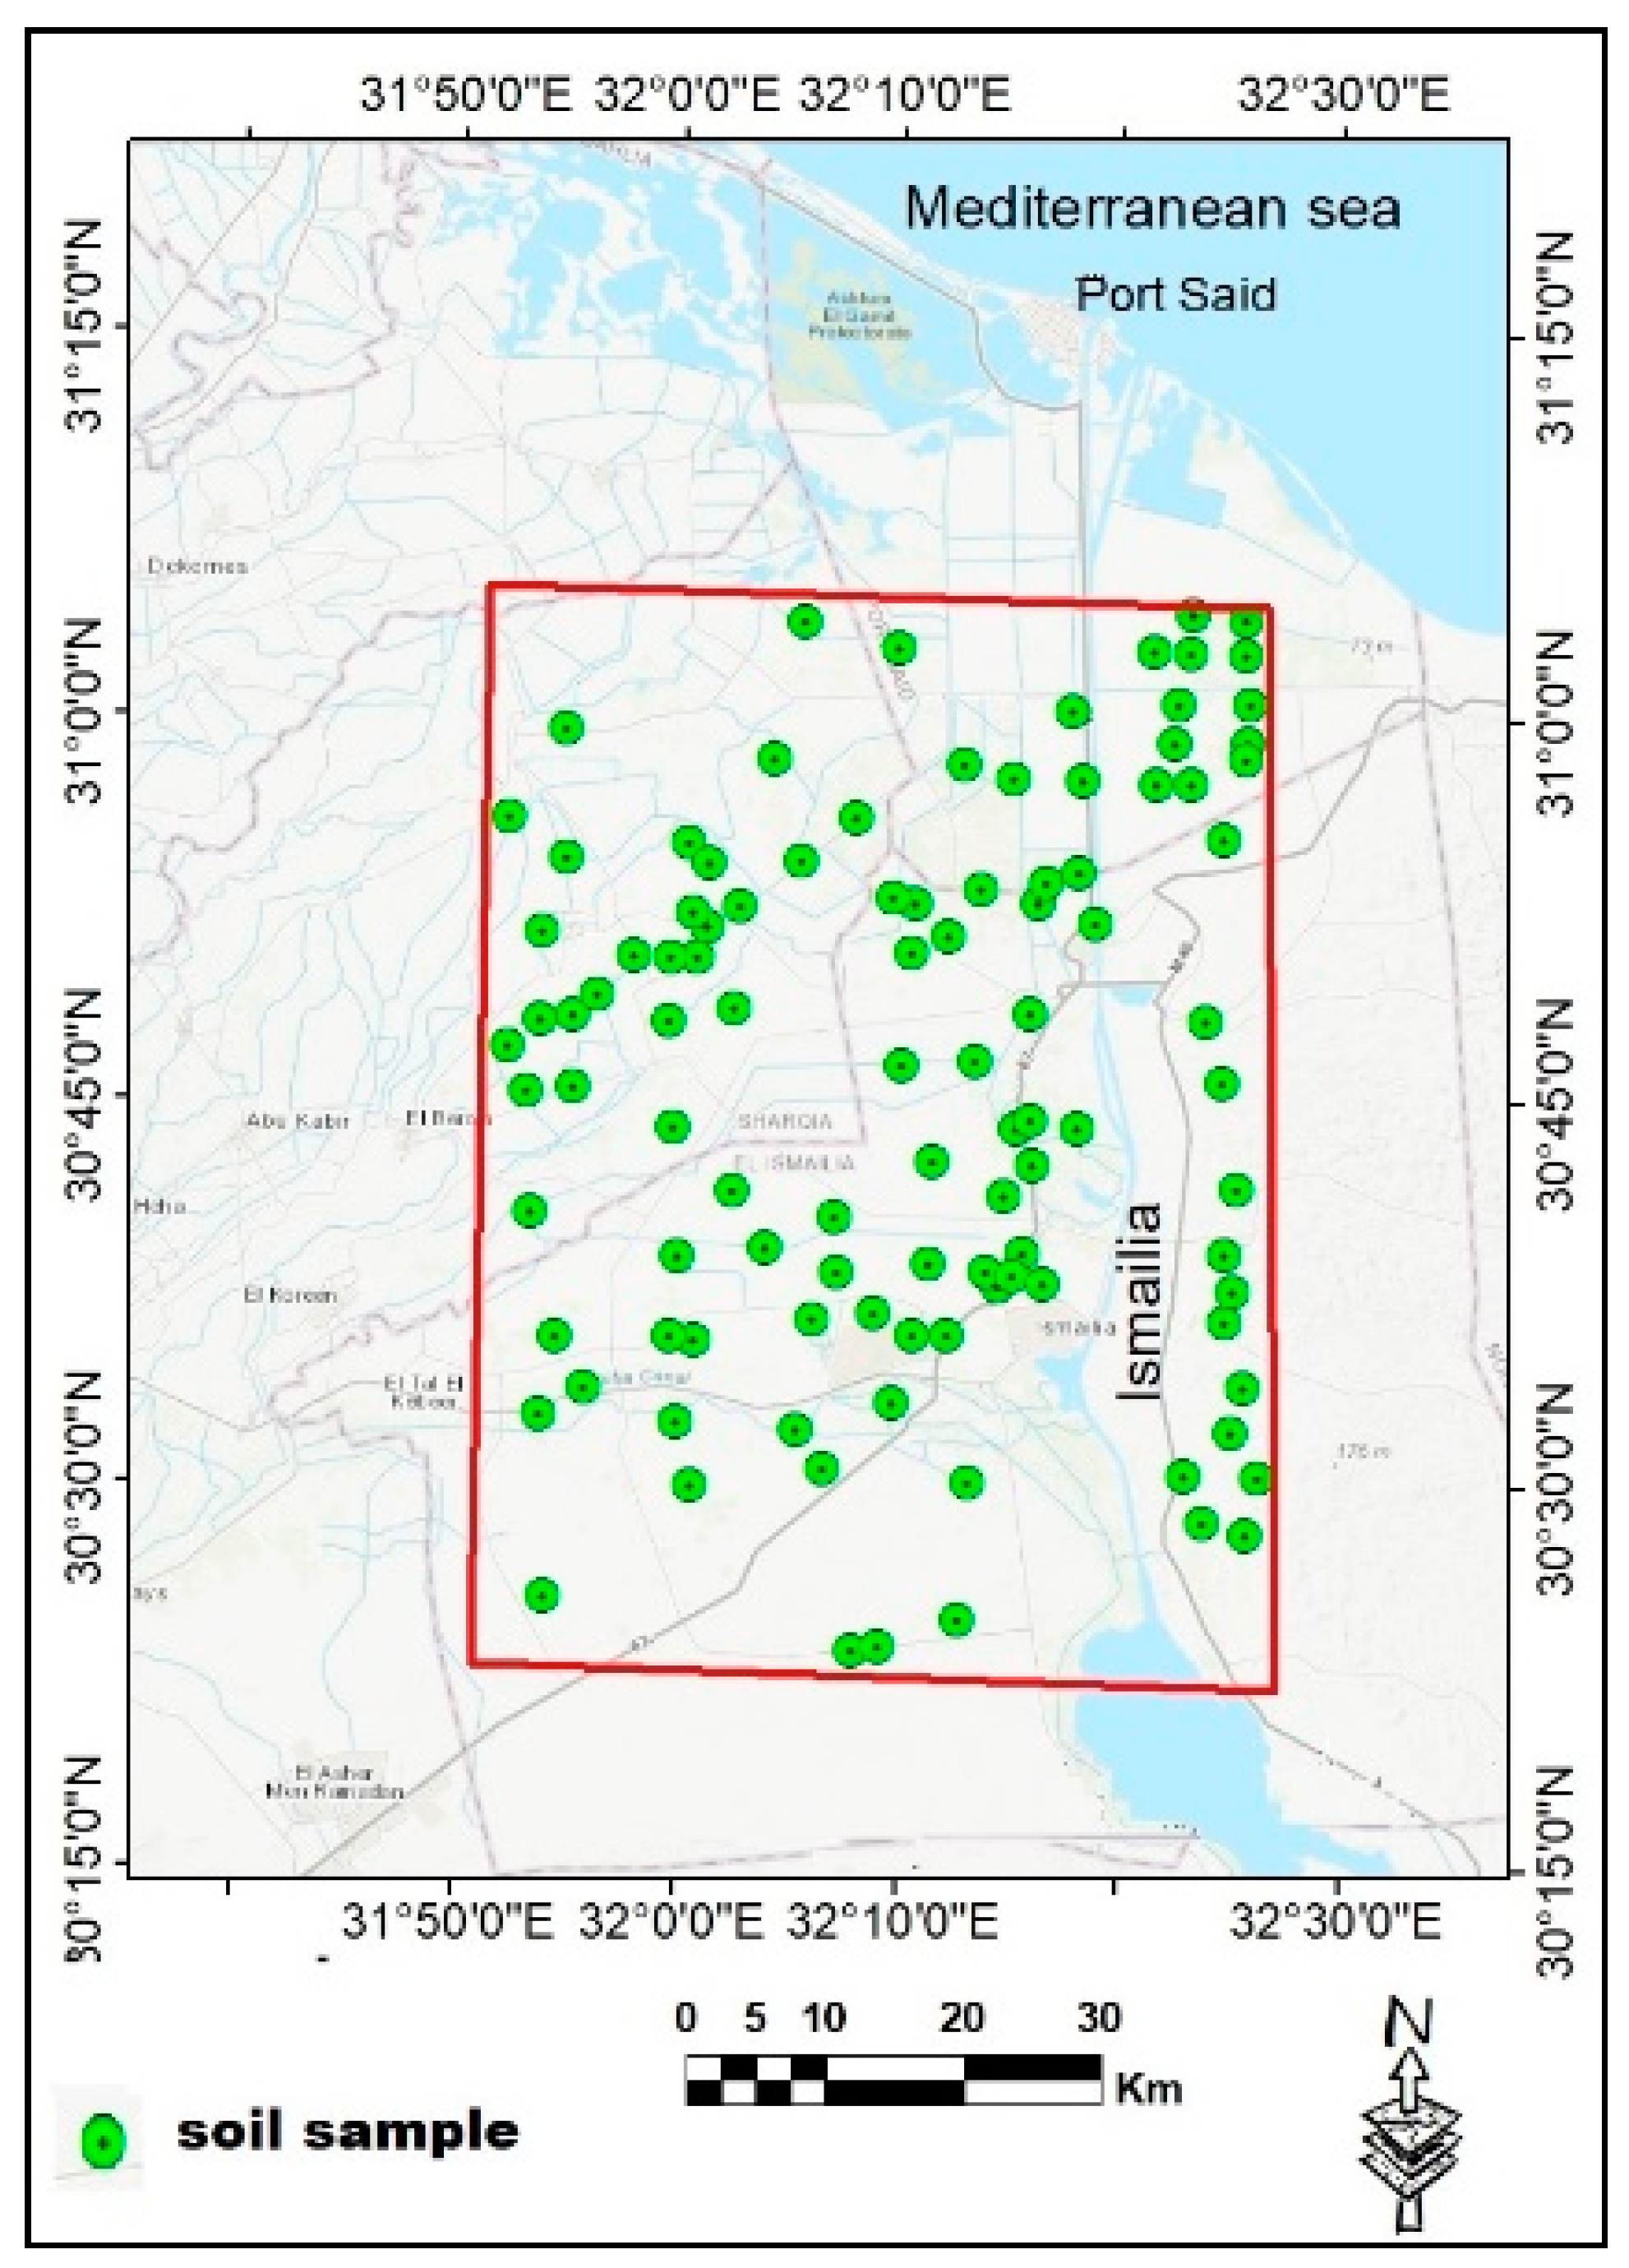
2.1. Experimental Site

The study area is located in the eastern Nile Delta (31°, 55 to 32°, 26 E and 30°, 22 to 31°, 05 N; Figure 1a,b). The elevation of the study area decreases from 45 m in the south to sea level in the north. The area is characterized by Mediterranean climate with strong seasonal changes, and annual rainfall averages of around 35 mm year−1 [26], annual temperature average of around 21.7 °C, and the maximum temperatures in July reach 45 °C.
The study area is quite homogeneous and characterized by two major landscapes: Fluvio-marine flats shaped by fluvial and deltaic processes and river terraces shaped exclusively by alluviation processes [27]. Considering different land use types and soil types, 120 samples from top soils (0–30 cm) were collected from the study area during the summer of 2018 year. In order to assess the changes in the SOC pool since 1995, the soil sampling points correspond to the sampling locations as introduced in the study by [28] (Figure 1). Field survey included the recording of natural landscape characters as well as farming practices registering farm management, different agricultural operations, tillage, organic additions, irrigation methods, etc. During field survey, each sampling point land-use was coded and allocated to soil type; an attribute table was created including map unit ID, current land use, soil type crop types, agricultural practices, tillage conditions, and soil erosion evidences. The analysis of physical and chemical soil characteristics was achieved based on [29]. Landsat 5 TM images acquired in July 1995 and Operational Land Imager (OLI) with spatial resolution of 30 m acquired in July 2018 were used to distinguish the changes of land use and land cover (LULC) between 1995 and 2018. The support vector machine (SVM) has been applied to discriminate the spatial variation of LULC, where utilized on the images acquired in 1995 and 2018 according to [30].
As the vegetation cover is always indicative of soil fertility and simultaneously indicates the availability of SOC and soil nutrients, the NDVI was used. NDVI maps were generated from the Operational Land Imager (OLI). The spatial heterogeneity in soil organic carbon contents reflects the differentiation of soil properties of both physical and chemical characteristics. Therefore, geomorphological characteristics and surface features were described based on remote sensing and topographic 1: 10,000 map.

2.2. Soil Organic Carbon Pool Calculation

The evaluation of SOC has been relied upon the estimation of SOCP using (Mg C ha−1) according to [31]. The current study focusses on the estimation of SOC changes from 1995 to 2018 with implementing different soil characteristics (soil texture, bulk density, pH, and OM) as well as climate data.
Soil organic matter (SOM) percentage was transformed to SOC percentage referring to [32]. Soil organic carbon pool was calculated for each region, depending on the analysis of the surface soil samples at depth 0–30 cm (kg C m−2) using the equation suggested by [33] (see Equation (1));
S O C P = [ L * S O C * B . D * ( 1 F 100 ) ] / 10
where SOCP in 0–30 cm depth (kg m−2), SOC (wt. %), L thickness of the soil layer in cm, B.D soil bulk density, usually at 33 kPa suction (Mg m−3), and F (fine soil fraction) < 2 mm coarse fragment (wt. %).

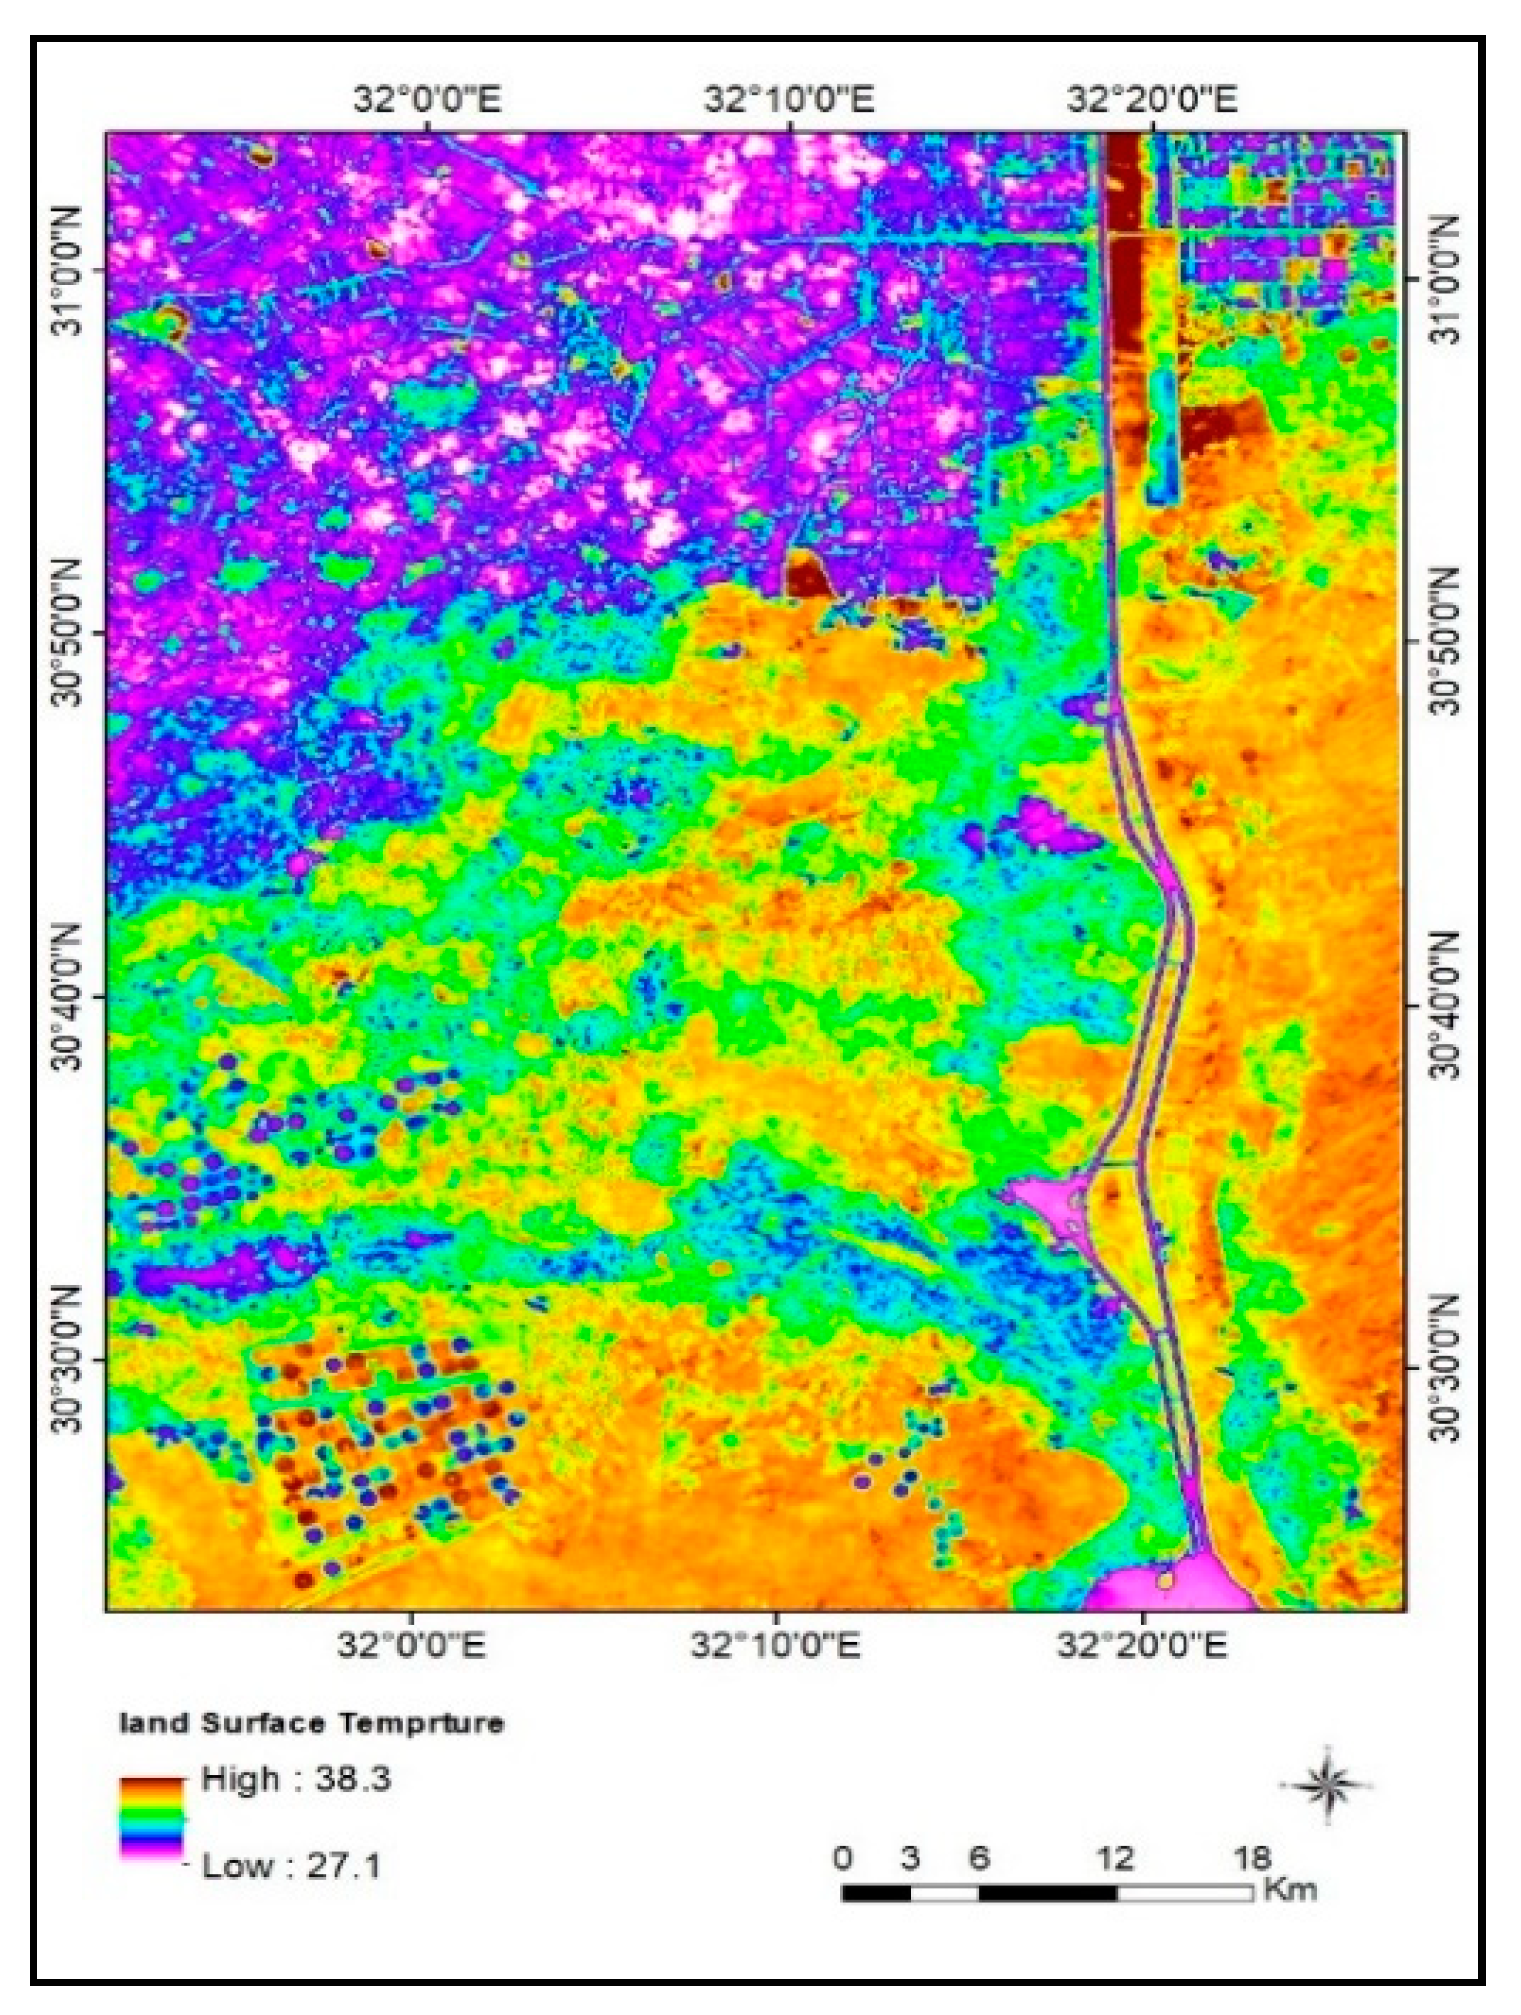
2.3. Land Surface Temperature Estimation

Land surface temperature was estimated based on thermal remote sensing data (Thermal band 10 of OLI) according to [34] as follows (see Equation (2);
T s = γ   ( ε 10   1 ( ψ 1 *   L   10   s e n s o r   +   ψ 2 )   +   ψ 3 )   +   δ T s = γ ( ε 10 ( ψ 1 * L 10   s e n s o r + ψ 2 ) + ψ 3 ) + δ
  • γ T 2 10   s e n s ( b γ * L 10   s e n s
  • δ T 10   s e n s ( T 2   10 / b γ
  • Ts is land surface temperature (LST) in (Kelvin); ε10 is emissivity of Band 10 (unitless). L10sens is Band 10 radiance ( ψ 1 ,   ψ 2 , ψ 3 ) A = π r 2 in (W. m−2. sr−1. μm−1); T10sens is Band 10 at-sensor brightness, temperature in (K). λ 10 Band 10 effective wavelength in μm = 10.9000 μm; bγ = c2/λ = (1324K) for TIRS−1, Band 10; (ψ1, ψ2, ψ3) are three atmospheric functions, w is the atmospheric water vapor content in 4.11 g /cm2.

2.4. Spatial Distribution Mapping and Validation

Thematic maps have been produced applying the Inverse Distance Weighting (IDW). This method depends on the mean values of a phenomenon by the information of the nearby known points where the neighboring points have more weights than distant points and vice versa [35] (see Equation (3));
Z ( x 0 ) = i = 1 n w i Z ( x i ) w i = 1 / d i 2 i = 1 n 1 / d i 2
where Z (x0) is the value of SOC at the un sampled location x0, Z (xi) is the measured values of SOC at the sampled location xi, n is the number of sample points, wi is the weight assigned to each Z (xi), and di is the distance among observed and the estimated point.
The maps’ accuracy was achieved by comparison of the actual values and the predicted values. As Root Mean Square Error (RMSE) was used where one-third of the total soil samples were selected to verify the model accuracy based on the agreement between the observed and predicted [36].
IDW was chosen according to the recommendation of the study conducted by [37] for mapping soil and sediment parameters. This study suggested that IDW is suitable and reliable and easier to implement compared to kriging, which more time consuming and cumbersome. Even if kriging provides a more accurate description of the data spatial structure and produces valuable information about estimation error distributions, IDW is regarded as a good compromise between the reliability and the complexity of implementation and this is a key issue for the generalization of this type of investigation. The interpolation techniques commonly used in agriculture include inverse distance weighting and kriging [38,39]. Several other studies, however, found inverse distance weighing to be more accurate than kriging. Some studies found that squared inverse distance weighing produced better interpolation results than any other method, including kriging [40].
Evaluating the effects of the human activities on the SOCP using Satellite imagery and GIS techniques is presented by the frame work of the followed methodology, as shown in Figure 2.

3. Results and Discussion

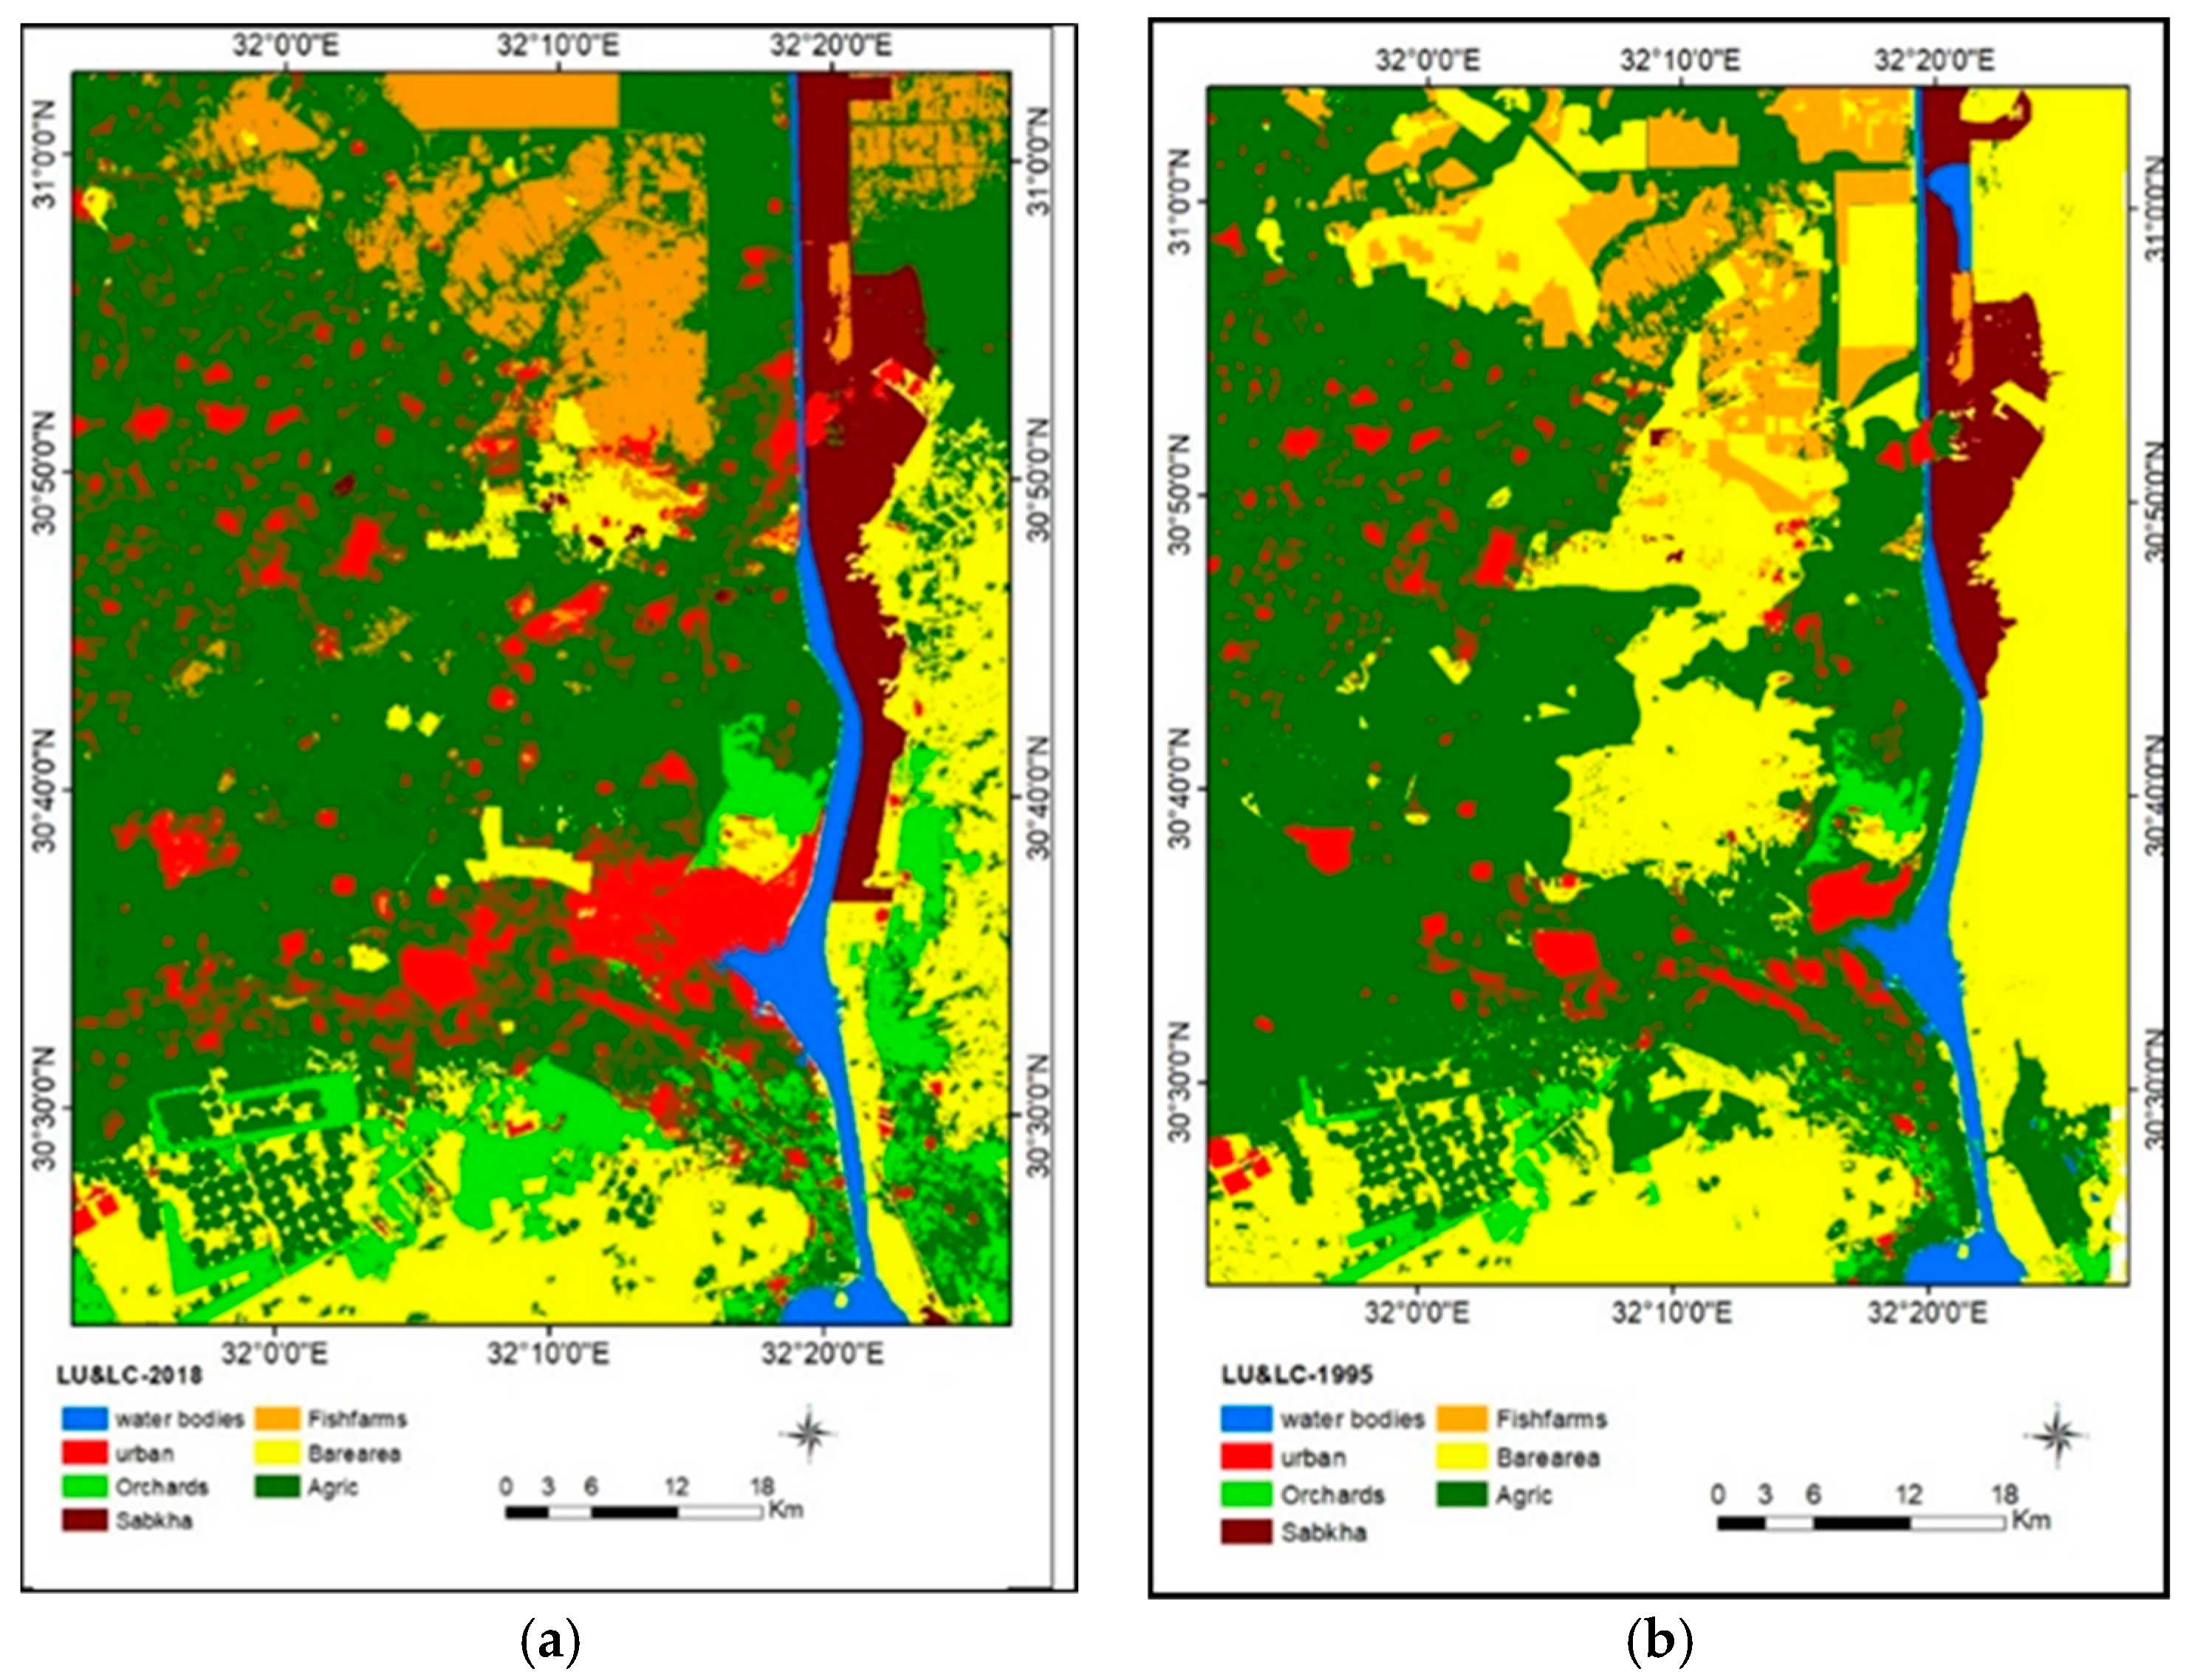
3.1. Land Use Changes and Anthopogenic Activities

Figure 3a,b illustrates the magnitude of the land use and land cover (LULC) changes from 1995 to 2018 along with the extension of the new reclamation areas in the eastern Nile Delta. The cultivated area increased around 219,283 hectares from 1995 to 2018. This increment was linked to the necessity to cope with the increased population growth in the same period [41,42].
The results of the change detection from 1995 to 2018, with overall accuracy 93.7% and Kappa Coefficient 0.87, show that along with an increasing agricultural activities in the study area, there also was observed an increasing in urban areas of around 18,585 hectares during the 23 years between 1995 and 2018 (Table 1). In addition, the results of the change detection pointed out that this urban sprawl significantly affected the green surface areas and, thus, increased the emission of carbon dioxide to the surrounded atmosphere [42]. The results of the change detection from 1995 to 2018 show that with increasing agricultural activities in the study area, the urban areas increased by 18,585 hectares during the 23 years between 1995 and 2018 (Table 1). Nevertheless, significant increase in agricultural expansion into the desert areas (on the east of the Suez Canal) reflects an increase in human activity. Additionally, the vegetation cover increased around 37,407.7 hectares between 1995 and 2008, mostly due to the spread of orchard areas for the cultivation of olive and mango trees [43].

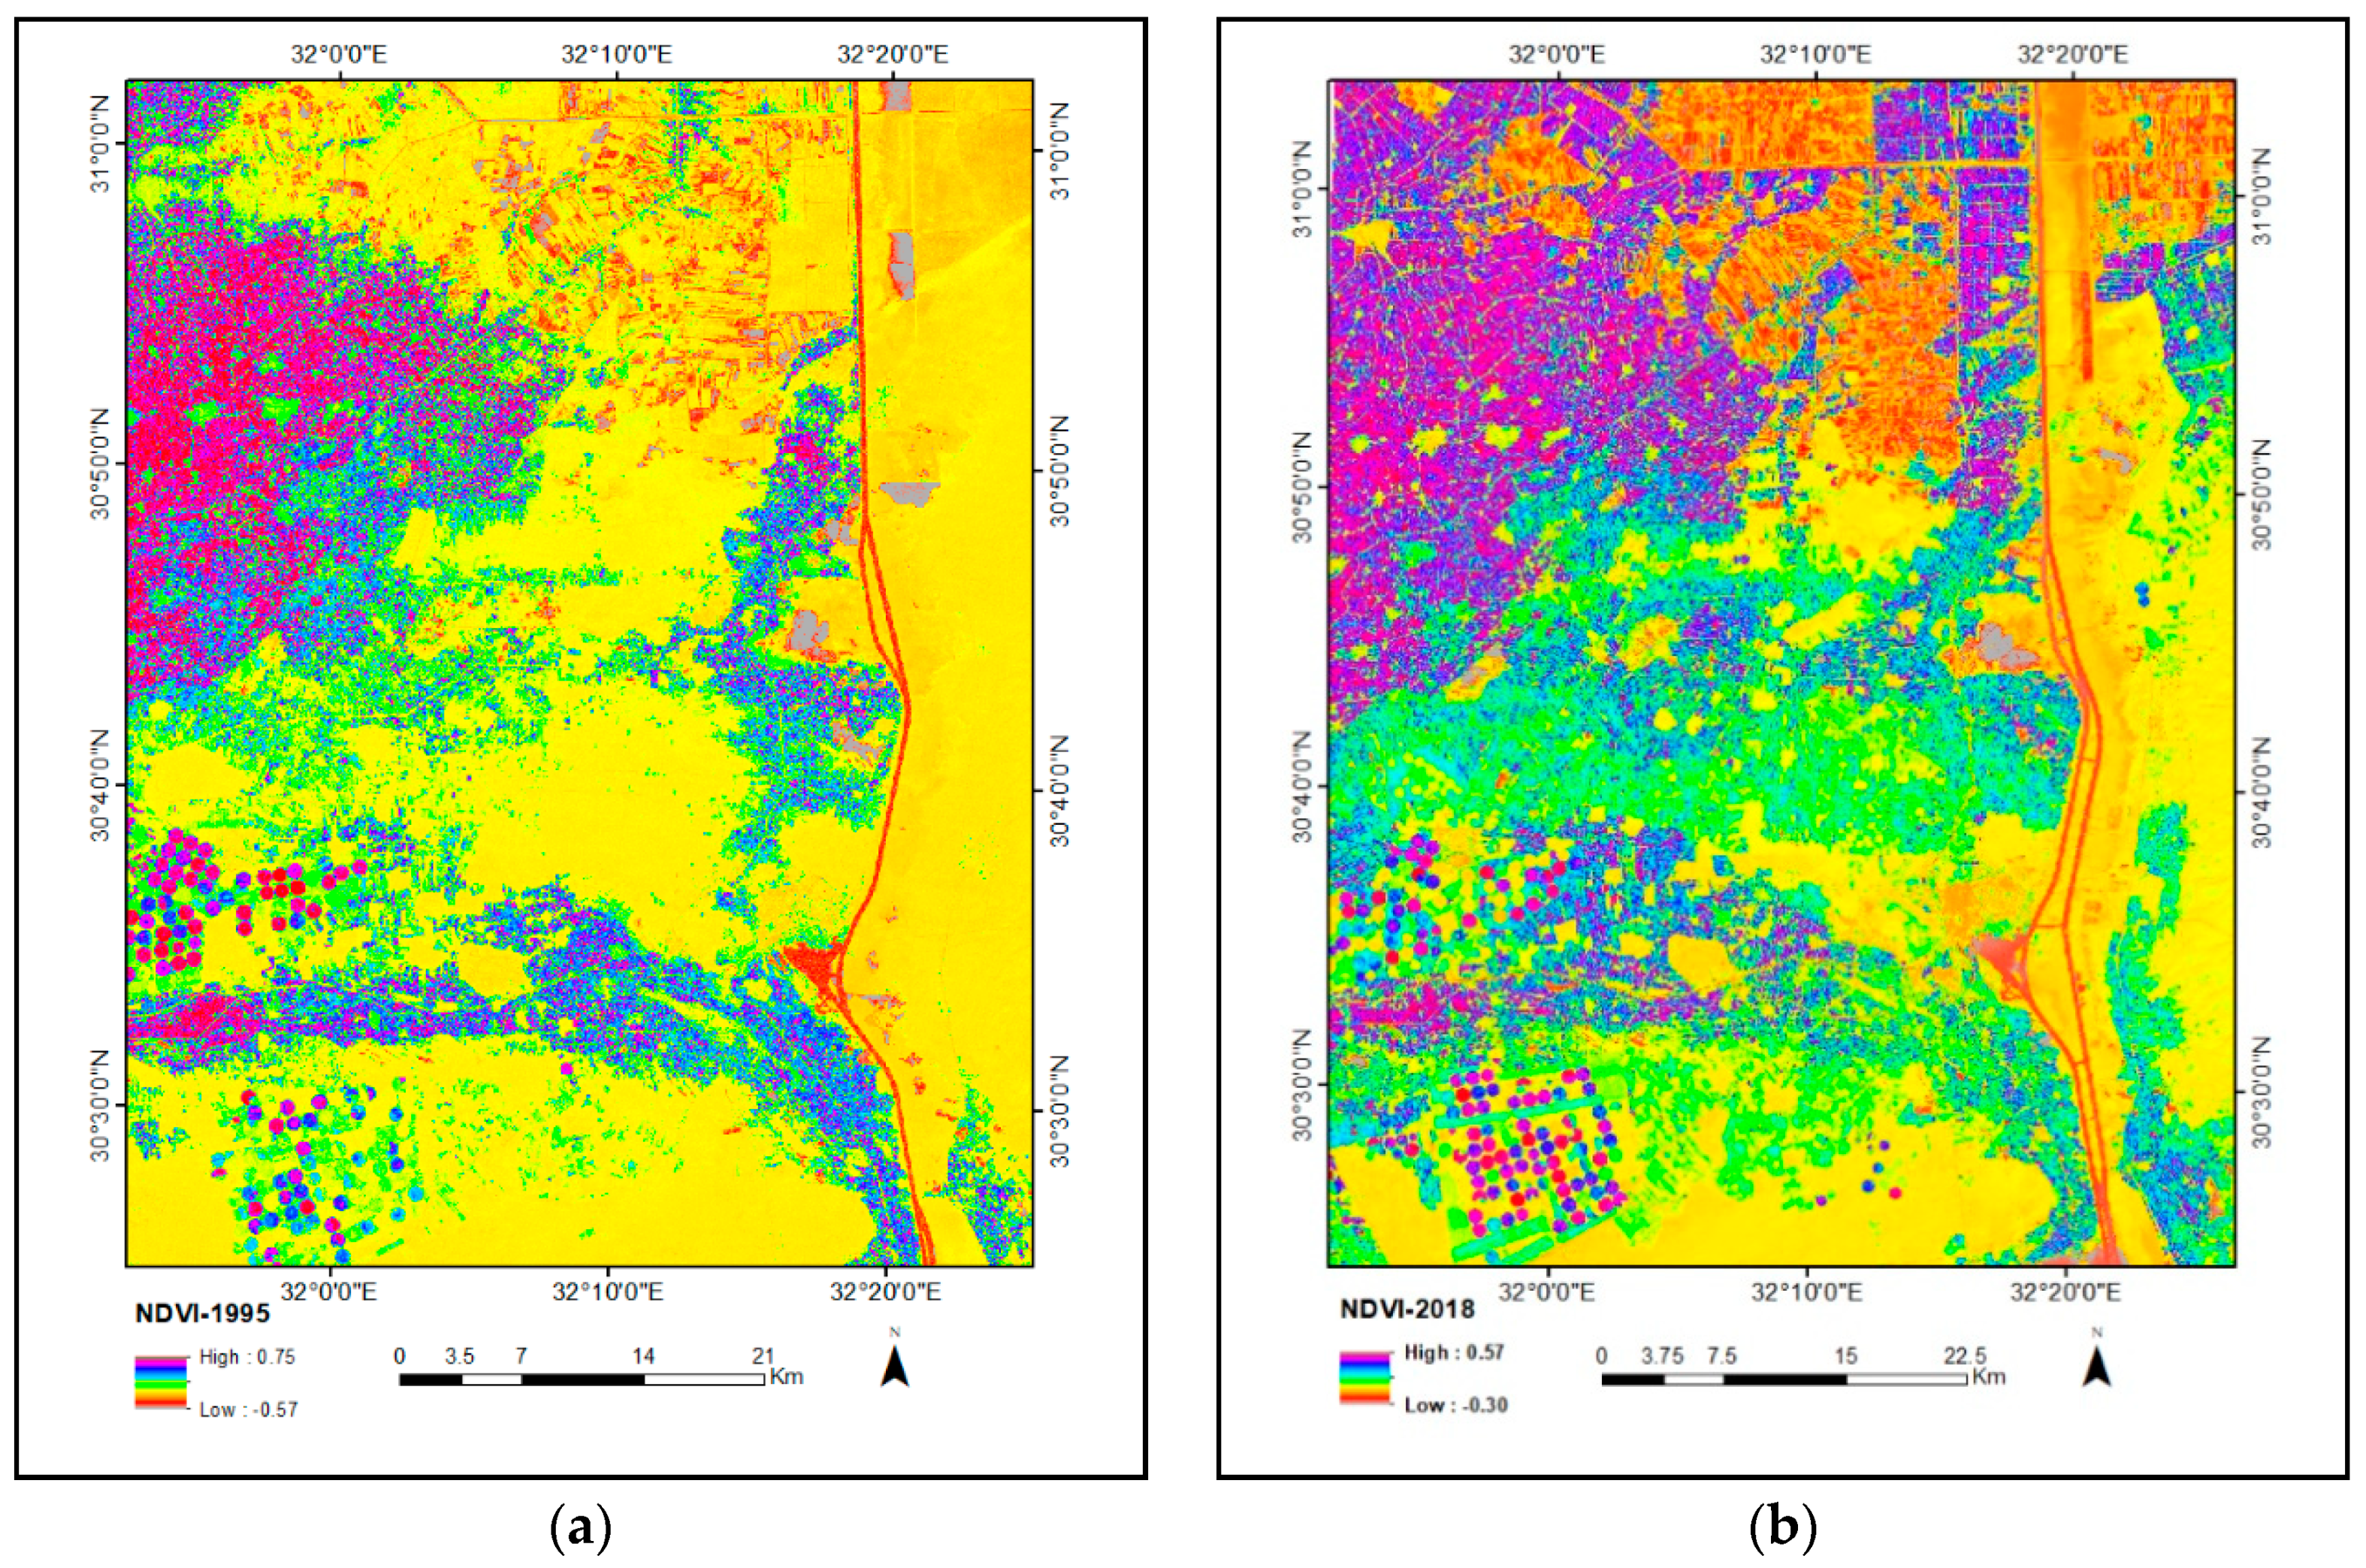
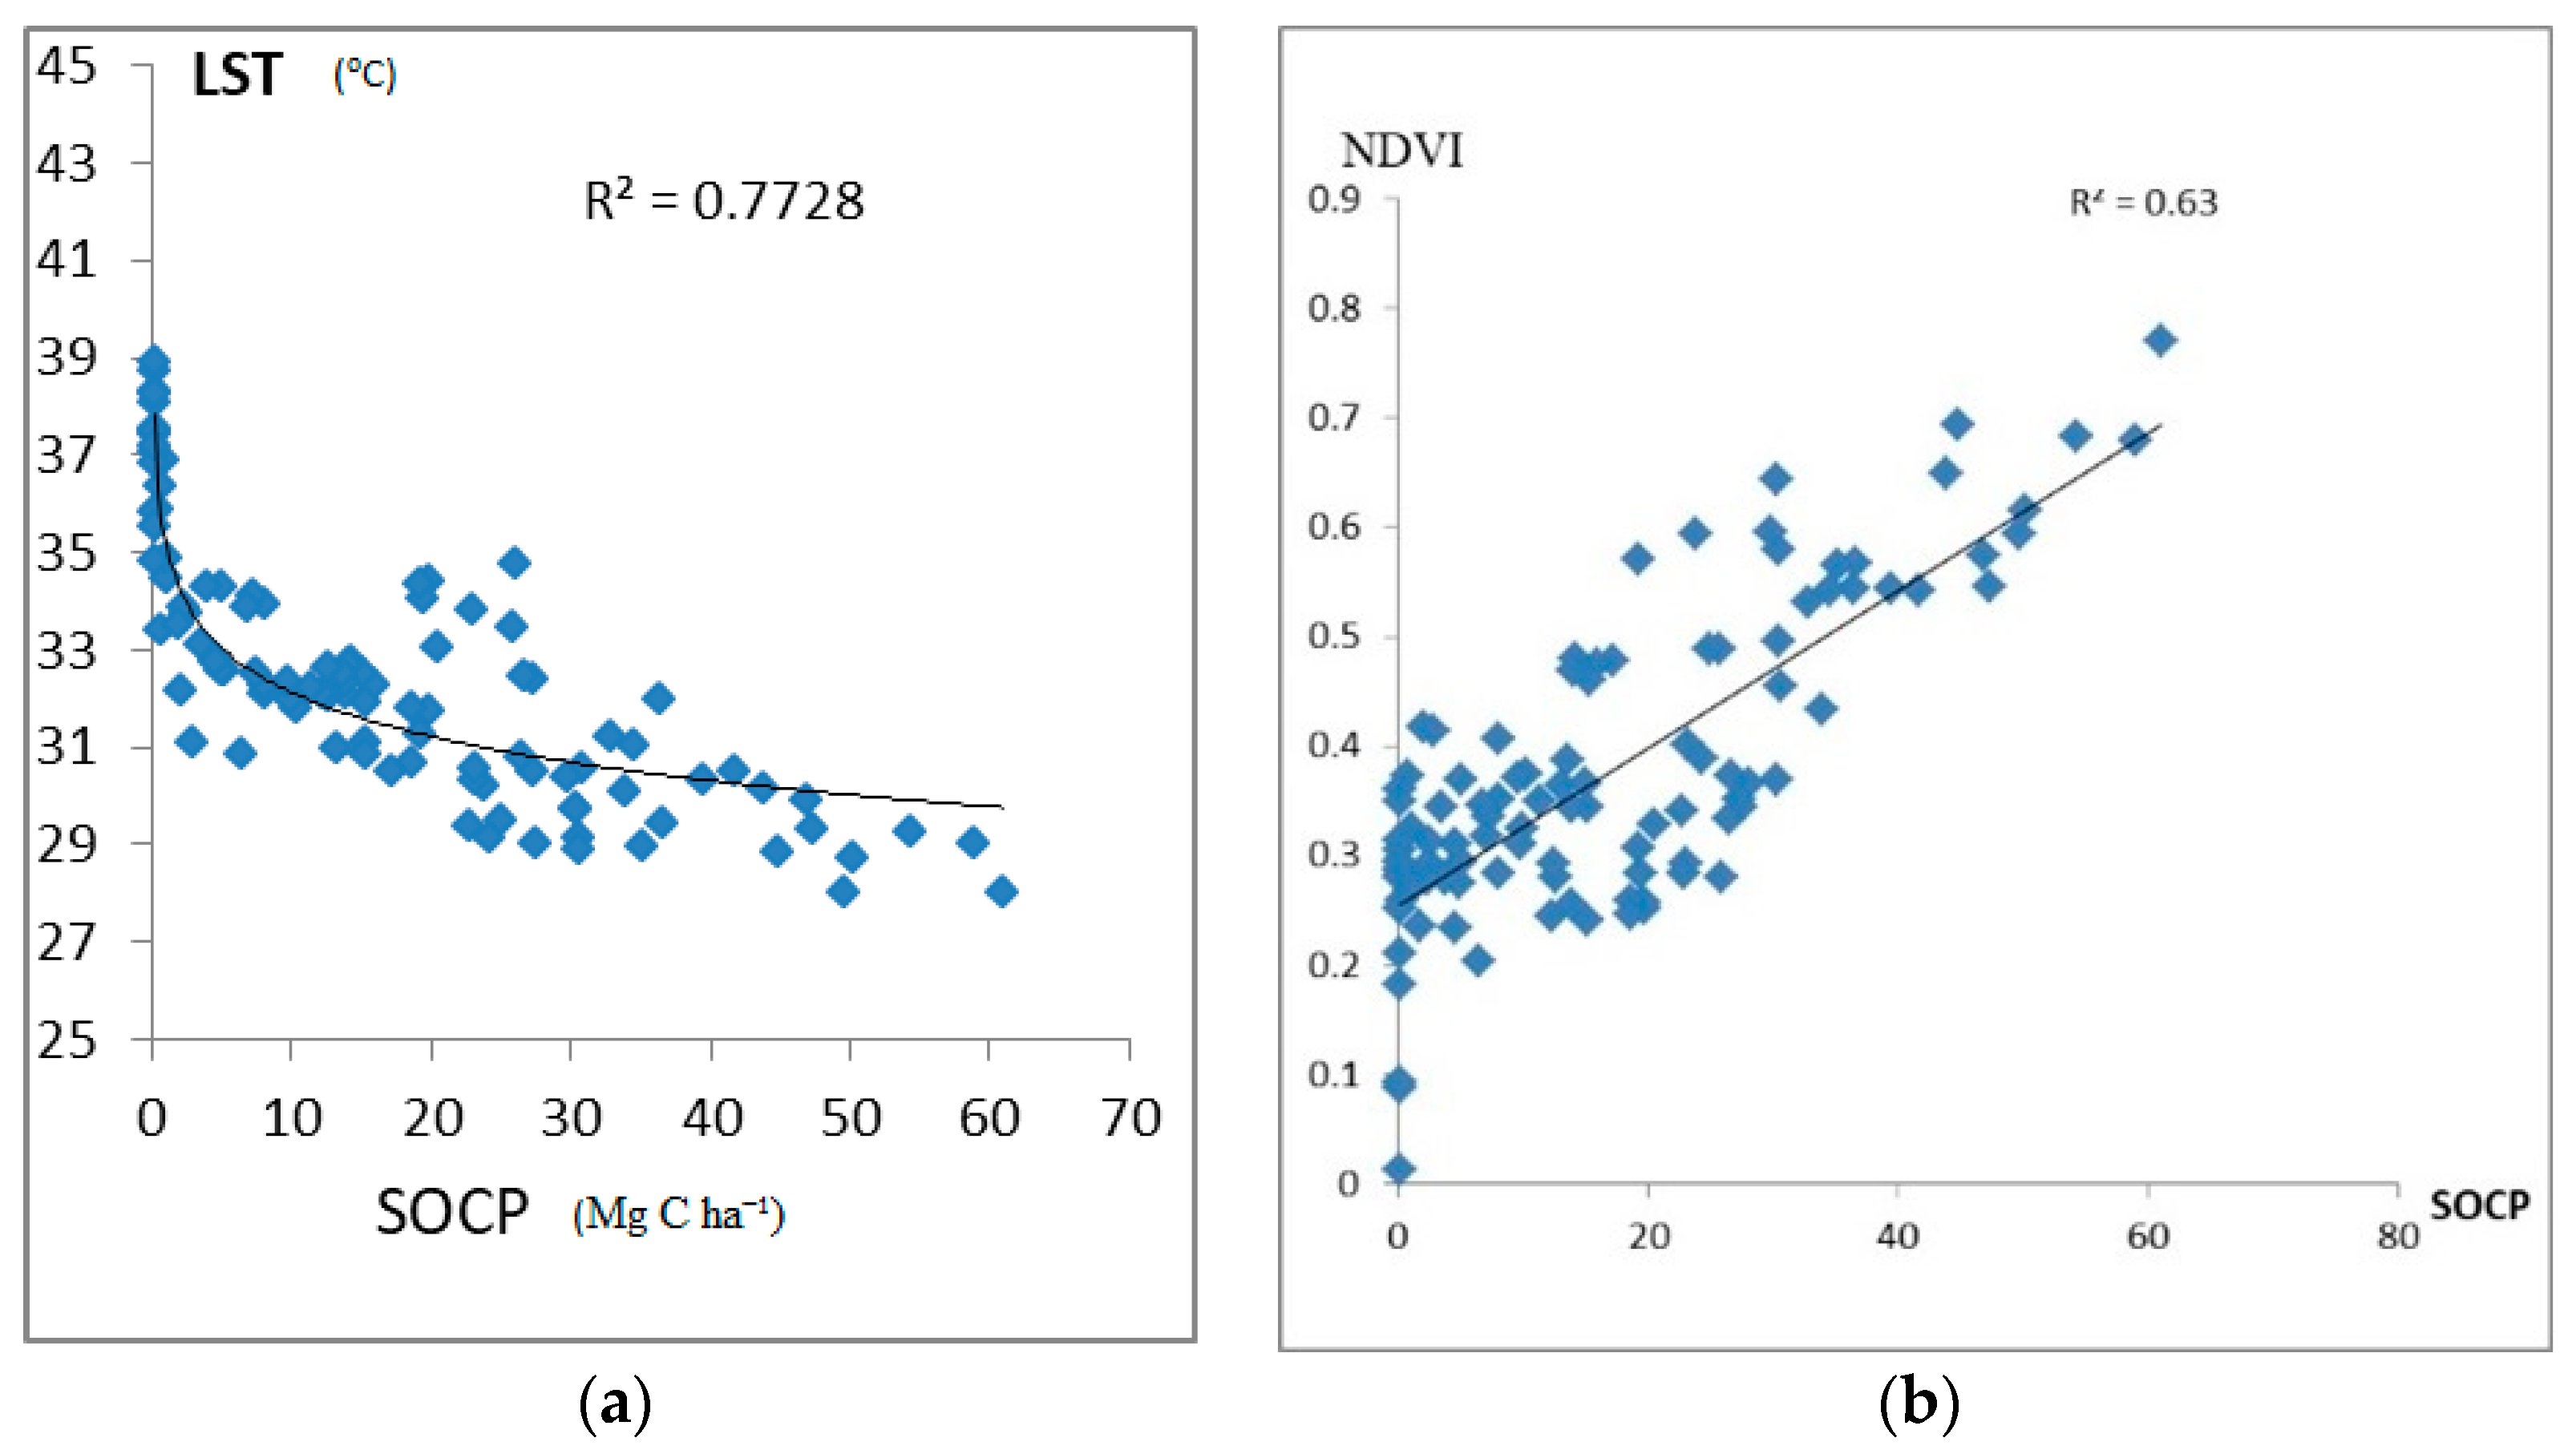
3.2. NDVI Changes and Human Activity

NDVI is considered an efficient index to describe the vegetation density and photosynthetic activity status [44]. The spatial changes of the vegetation cover between 1995 and 2018 are linked to the agricultural development in the southern parts of the investigated area. This portion of farms mainly depends on modern irrigations systems. The results of the NDVI distribution in 1995 and 2018 (Figure 4) illustrate that in 1995 the highest values of NDVI appeared in the western part of the study area ranging between 0.4 and 0.69. Moreover, since 1995, the complete area is characterized by moderate NDVI values of less than 0.5, corresponding to a mixture of bare soils and areas covered by photosynthetic active vegetation [45,46]. Nevertheless, the spatial distribution of NDVI values in 2018 reveal a distinct increase of the NDVI values in several locations of the study area as a result of human activities during the previous 23 years. The results showed an increase in the agricultural activity in the study area, especially in the new reclamation sites located east and west of the Suez Canal [47]. Therefore, the NDVI values have increased in those areas reaching levels higher to be more than 0.5. These variability changes in the NDVI values were attributed to some factors, including human influences on management methods of land resource, type and quality of fertilization (minerals or organic), plant status, growth stage, and biomass and photosynthesis intensity [48]. Contrariwise, the effect of the urban sprawl at the north and west of the study area revealed a decrease of the NDVI values, mainly occurring in scattered areas. Moreover, decreasing NDVI values from 0.5–0.69 in 1995 to 0.4–0.62 in 2018 occurred in areas that were affected by salinization processes. These observations are consistent with the findings of [49], who also pointed out the negative impact of soil degradation due to the deterioration of the land cover on the NDVI values.

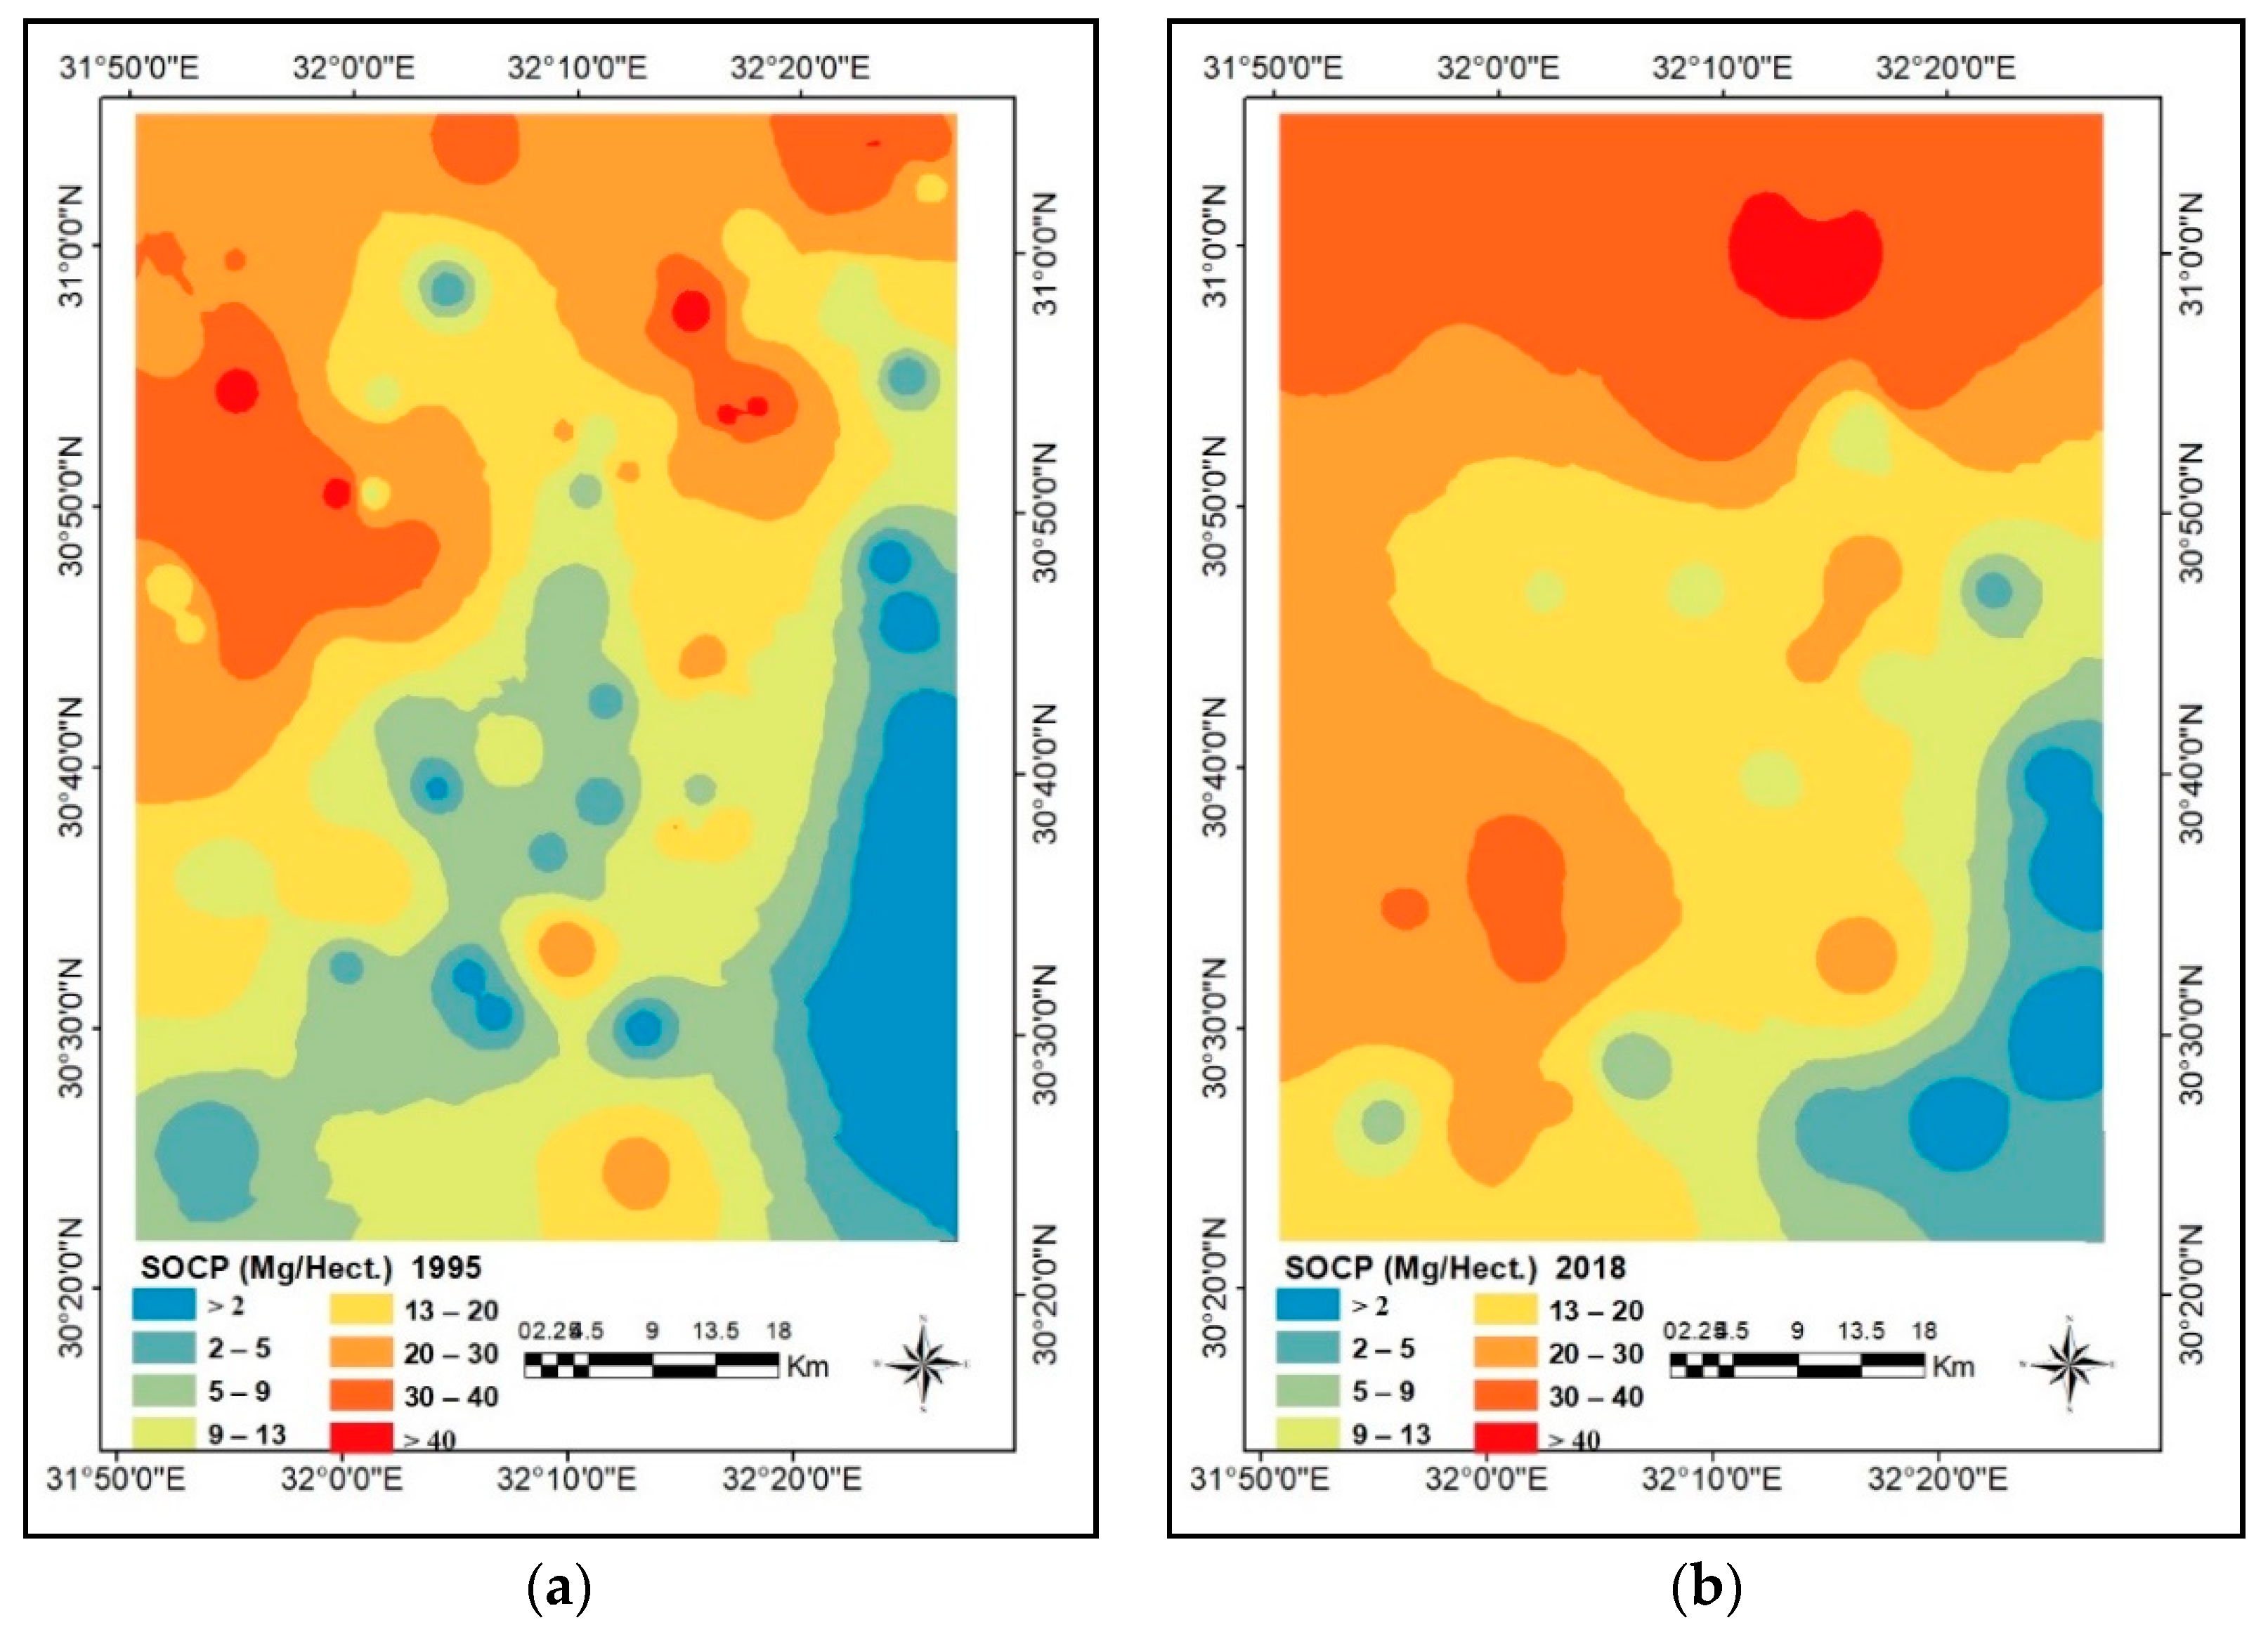
3.3. Soil Organic Carbon and Human Activities

The value of soil organic carbon pool (SOCP) in 1995 varied from 0.12 to 60.77 Mg C ha−1, changing gradually to between 0.10 and 65.64 Mg C ha−1 in the year 2018 (Figure 5). In 1995, the high values were found in the northern west of the study area, ranging from 23.11 to 60.77 Mg C ha−1, while in 2018 overall the soil organic carbon contents increased to 24.99 to 65.64 Mg C ha−1. Highest values were observed in the fish farming areas due to additive of organic materials for fish feeding [50]; the expansion of the fish ponds effected an increase of soil organic matter contents. Meanwhile, the results of soil organic carbon values increased in 2018 from 24.99 to 65.64 Mg C ha−1 in 2018.
The spatial distribution of the SOC pool was significantly affected by human activity, in particular:
(i)
The effect appeared with the urban sprawl on the cultivated lands characterized by high soil quality; this urban encroachment led to a decrease of areas suitable for agricultural land-use. Nevertheless, the increasing of the population density in Nile Delta initiated a pressure on the needs of increasing the agriculture sector yields [51];
(ii)
An increase in SOC pool values in 2018, which can be explained by the enhancement of the agricultural practices and managements especially in the western parts of the study area. In contrast, in 1995 the agricultural practices predominantly occurred in the western parts of Suez Canal and Wadi Altumilatt [52].

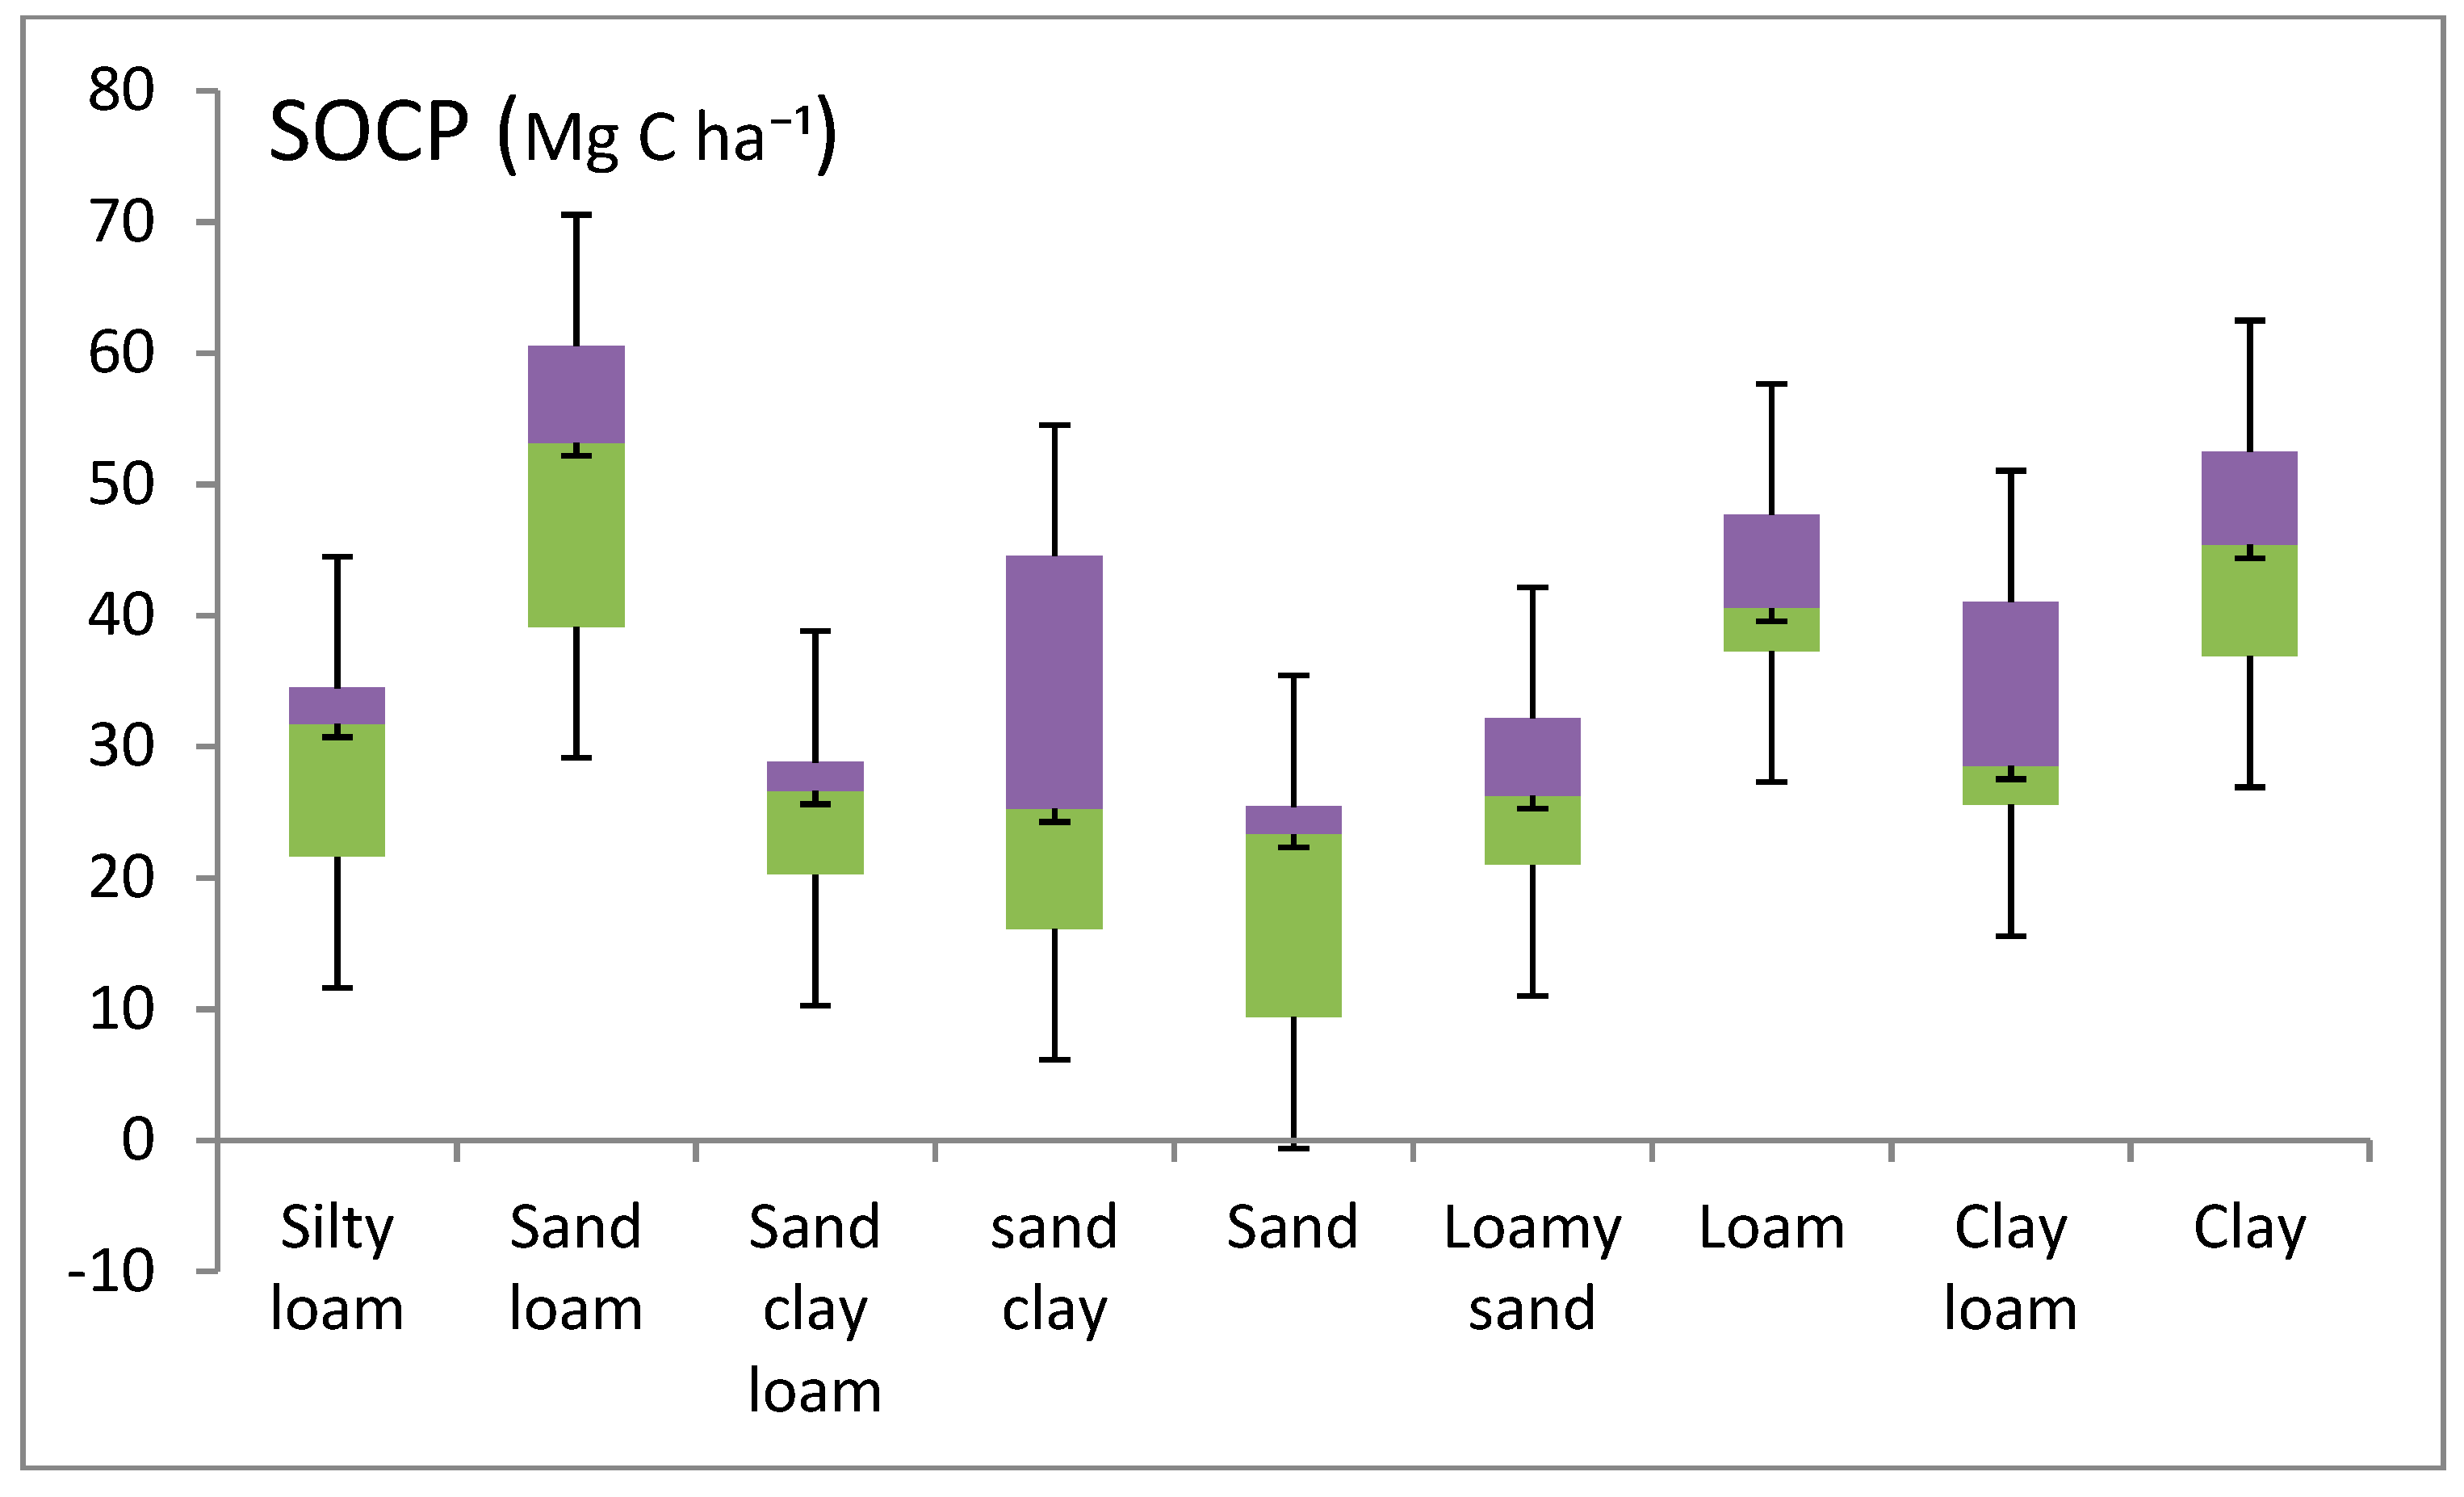
3.4. Effect of Soil Characteristics on SOCP

The dynamic change of SOCP is subjected to several factors besides human actions, including soil properties and exogenous factors such as global climate change. In spite of the homogenous mono cultivation agricultural practices that were applied in the study area region [53], the SOCP values underlie notable variations that can be attributed to the climate effects (Figure 6).
The spatial distribution of the SOCP in 2018 revealed interesting phenomena paralleled with the effect of the land surface temperature (LST). SOCP values decreased in particular locations to less than 30 Mg C ha−1 compared to 1995 where at the same locations’ SOCP totaled more than 30 Mg C ha−1. While variations in SOCP values can be due to several reasons, such as land surface temperature, vegetation cover, human activity, and soil characteristic [54], the spatial correlation with satellite images pointed out that the areas with lower SOCP values in 2018 than 1995 were characterized by increased land surface temperature (LST), exceeding 38 °C in 2018 (Figure 7). An increase of land surface temperature will accelerate decomposition of SOC by fauna and microorganisms, resulting in SOC degradation and release the OC into the atmosphere as CO2 [55]. Comparable results for both SOCP and LST document the heterogeneity distribution in the study area, as the areas with lower LST values still implement the conventional cultivation systems which are often irregular in agricultural practices. In addition, organic carbon values are observed in the bare areas. Figure 7 shows the negative correlation between the spatial distribution of soil organic carbon pool and the land surface temperature in 2018 as R2 was 0.77, as shown in Figure 6. These results are convenient with the finding of [56].
Moreover, the increase in the density of vegetative cover has direct effects on SOC due to the increase of crop residue available for the composition of soil organic carbon. Figure 8 shows a positive correlation between NDVI and SOCP with a reasonable correlation coefficient (R2 0.63). Furthermore, the results point out that a relation between SOCP values and different soil characters: In clay soils the SOCP varied from 1.7 to 53 Mg C ha−1, while in the sandy loam and sand clay loam soils are characterized by minimum values of SOCP around 8 Mg C ha−1, and in clay loam soils minimum SOCP totaled 5.59 Mg C m2 (Figure 8).
Sandy soils have relatively low SOCP values ranging from 0.12 to 25 Mg C ha−1. Nevertheless, in the northern part of the study area which is characterized by clayey soils, the SOCP values reduced between 1995 and 2018 due to the deterioration of the physical properties such as the bulk density (Figure 4). The results show that, in 1995 the values were found to be ranging from a minimum of 1.35 gcm3 to maximum of 1.9 gcm3 (with mean of 1.65 gcm3 in 1995), whereas in 2018 were found to be ranging from a minimum of 1.25 gcm3 to maximum of 1.7 gcm3 with mean of 1.67 gcm3. The observed degradation of soil organic carbon pool mainly refers to the relationship between organic matter contents, soil types, soil porosity and bulk density, which well fit with [57,58].
The decrease of SOCP predominantly refers to an increase of land degradation processes in the east of Nile Delta, and corresponds to the effects of management practices in terms of the use of heavy engines for tillage affecting the soil physical properties such structure and soil porosity in the northern Nile Delta [59,60,61] in the study area reflected by the decomposition of organic material and SOCP (Table 2).

4. Conclusions

The outputs from our investigation clearly highlighted that the use of satellite data can provide useful proxy indicators which (i) enable us to satisfactorily model the SOC pool and (ii) make the approach re-applicable to other study areas and geographic regions also considering that our approach is based on the use of free of charge satellite data (Landsat 5 TM) available systematically for the whole globe from the NASA and USGS website. In particular, our analysis has been based on remote sensing images Landsat 5 TM (acquired in July 1995 and operational land imager (OLI) acquired in July 2018). The results revealed significant variations of soil organic carbon pool (SOCP) among different soil textures and land-uses. Spatiotemporal changes of soil organic carbon pool in the east of the Nile Delta between 1995 and 2018 document the heterogeneity and complexity of processes affecting SOCP values. With our research we document the positive and negative impacts of human activity on SOCP values in agricultural systems of Egyptian drylands. In particular, the change from agriculture to fish farming caused an increase SOCP in the northern parts of the study area as a result of organic additions. Furthermore, the agricultural expansion of new reclaimed areas between 1995 and 2018 caused an increase in vegetation cover due to an increase of cultivation—finally reflected in increasing of soil organic matter contents east of the Suez Canal and some of the southern parts of the study area. In contrast, SOCP values were decreased in some areas in the north and west of the study site as a result of the negative management practices causing increased land degradation processes such as increasing soil bulk density and soil salinity that in turn negatively affects biological activity in the soils.
As a whole, our results pointed out that the use of historical archives as well as the past and current space data today available, even updated weekly, provides an excellent data source suitable to monitor human activity and support systematic low cost monitoring over large areas. In actuality, satellite data provide both (i) historical time-series data set and (ii) timely updated information related to the current and past human activities in terms of land use/land cover and their characteristics as well as parameters (proxy indicators) suitable to assess, characterize, and better understand and manage the impact of the human activities on environment. Updated maps and related information are very important for planners to design sustainable development plans following the Agenda 2030 recommendations. In particular, the use of satellite technologies today can suitable support the decision maker and the development plan processes providing suitable free of charge tools useful for multi-temporal analysis based on the past and the current conditions capturing changes at diverse temporal and spatial scales from global, down to a local level.

Author Contributions

The research article included three main contributions; field survey, satellite imagery interpretation, and writing the text. M.A. and M.A.E.A. provided the field survey. The satellite image data have been analyzed by M.E. and M.A.E.A. The text of article was written by M.A. and B.S. The last version of the article was revised by R.L. and B.S.

Acknowledgments

The manuscript presented an efficient scientific participation between the scientific institutions in three countries (Egypt, German and Italy). The authors would like to thank the University of Basilicata and Italian National Research Council (CNR) at Potenza, Italy, and the institute of Geographic Sciences, FU Berlin, Germany, for supporting the research activities. Special thanks to the National Authority for Remote Sensing and Space Science (NARSS) for funding the satellite data and the field survey.

Conflicts of Interest

The authors would like to hereby certify that no conflict of interest in the data collection, analyses, and the interpretation; in the writing of the manuscript, and in the decision to publish the results. Authors would like also to declare that the funding of the study has been supported by the authors’ institutions.

References

  1. Tan, Z.X.; Lal, R.; Smeck, N.E.; Calhoun, F.G. Relationships between surface soil organic carbon pool and site variables. Geoderma 2004, 121, 187–195. [Google Scholar] [CrossRef]
  2. Smit, B.; Skinner, M.W. Adaptation options in agriculture to climate change: A typology. Mitig. Adapt. Strateg. Glob. Chang. 2002, 7, 85–114. [Google Scholar] [CrossRef]
  3. Abu-hashim, M.; Elsayed, M.; Belal, A.E. Effect of land-use changes and site variables on surface soil organic carbon pool at Mediterranean Region. J. Afr. Earth Sci. 2016, 114, 78–84. [Google Scholar] [CrossRef]
  4. Silva, E.C.D.; Muraoka, T.; Franzini, V.I.; Villanueva, F.C.A.; Buzetti, S.; Moreti, D. Phosphorus utilization by corn as affected by green manure, nitrogen and phosphorus fertilizers. Pesquisa Agropecuaria Brasileira 2012, 47, 1150–1157. [Google Scholar] [CrossRef] [Green Version]
  5. Wang, B.; Waters, C.; Orgill, S.; Cowie, A.; Clark, A.; Li Liu, D.; Simpson, M.; McGowen, I.; Sides, T. Estimating soil organic carbon stocks using different modelling techniques in the semi-arid rangelands of eastern Australia. Ecol. Indic. 2018, 88, 425–438. [Google Scholar] [CrossRef]
  6. Cambardella, C.A.; Elliott, E.T. Particulate soil organic-matter changes across a grassland cultivation sequence. Soil Sci. Soc. Am. J. 1992, 56, 777–783. [Google Scholar] [CrossRef]
  7. Abu-Hashim, M.; Mohamed, E.; Belal, A.E. Identification of potential soil water retention using hydric numerical model at arid regions by land-use changes. Int. Soil Water Conserv. Res. 2015, 3, 305–315. [Google Scholar] [CrossRef] [Green Version]
  8. Mohamed, E.S.; Saleh, A.M.; Belal, A.A. Sustainability indicators for agricultural land use based on GIS spatial modeling in North of Sinai-Egypt. Egypt. J. Remote Sens. Space Sci. 2014, 17, 1–15. [Google Scholar] [CrossRef] [Green Version]
  9. Zhou, T.; Shi, P.; Wang, S. Impacts of climate change and human activities on soil carbon storage in China. Acta Geogr. Sinica 2003, 58, 727–734. [Google Scholar]
  10. Sreenivas, K.; Dadhwal, V.K.; Kumar, S.; Harsha, G.S.; Mitran, T.; Sujatha, G.; Suresh, G.J.R.; Fyzee, M.A.; Ravisankar, T. Digital mapping of soil organic and inorganic carbon status in India. Geoderma 2016, 269, 160–173. [Google Scholar] [CrossRef]
  11. Lu, W.; Lu, D.; Wang, G.; Wu, J.; Huang, J.; Li, G. Examining soil organic carbon distribution and dynamic change in a hickory plantation region with Landsat and ancillary data. CATENA 2018, 165, 576–589. [Google Scholar] [CrossRef]
  12. Ardö, J.; Olsson, L. Assessment of soil organic carbon in semi-arid Sudan using GIS and the CENTURY model. J. Arid Environ. 2003, 54, 633–651. [Google Scholar] [CrossRef]
  13. Mishra, U.; Lal, R.; Liu, D.; Van Meirvenne, M. Predicting the spatial variation of the soil organic carbon pool at a regional scale. Soil Sci. Soc. Am. J. 2010, 74, 906–914. [Google Scholar] [CrossRef]
  14. Mohamed, E.S.; Morgun, E.G.; Kovda, I.V. Assessment of soil degradation in the eastern part of the Nile Delta. Mosc. Univ. Soil Sci. Bull. 2011, 66, 86. [Google Scholar] [CrossRef]
  15. Elfadaly, A.; Attia, W.; Qelichi, M.M.; Murgante, B.; Lasaponara, R. Management of Cultural Heritage Sites Using Remote Sensing Indices and Spatial Analysis Techniques. Surv. Geophys. 2018, 39, 1347–1377. [Google Scholar] [CrossRef]
  16. Elfadaly, A.; Attia, W.; Lasaponara, R. Monitoring the Environmental Risks Around Medinet Habu and Ramesseum Temple at West Luxor, Egypt, Using Remote Sensing and GIS Techniques. J. Archaeol. Method Theory 2018, 25, 587–610. [Google Scholar] [CrossRef]
  17. Elfadaly, A.; Wafa, O.; Abouarab, M.A.; Guida, A.; Spanu, P.G.; Lasaponara, R. Geo-Environmental Estimation of Land Use Changes and Its Effects on Egyptian Temples at Luxor City. ISPRS Int. J. Geo-Inf. 2017, 6, 378. [Google Scholar] [CrossRef]
  18. Elfadaly, A.; Lasaponara, R.; Murgante, B.; Qelichi, M.M. Cultural Heritage Management Using Analysis of Satellite Images and Advanced GIS Techniques at East Luxor, Egypt and Kangavar, Iran (A Comparison Case Study). In International Conference on Computational Science and Its Applications; Springer: Cham, Switzerland, 2017; pp. 152–168. [Google Scholar]
  19. Lasaponara, R.; Murgante, B.; Elfadaly, A.; Qelichi, M.M.; Shahraki, S.Z.; Wafa, O.; Attia, W. Spatial open data for monitoring risks and preserving archaeological areas and landscape: Case studies at Kom el Shoqafa, Egypt and Shush, Iran. Sustainability 2017, 9, 572. [Google Scholar] [CrossRef]
  20. Lasaponara, R.; Elfadaly, A.; Attia, W. Low cost space technologies for operational change detection monitoring around the archaeological area of Esna-Egypt. In International Conference on Computational Science and Its Applications; Springer: Cham, Switzerland, 2016; pp. 611–621. [Google Scholar]
  21. Guo, P.T.; Li, M.F.; Luo, W.; Tang, Q.F.; Liu, Z.W.; Lin, Z.M. Digital mapping of soil organic matter for rubber plantation at regional scale: An application of random forest plus residuals kriging approach. Geoderma 2015, 237, 49–59. [Google Scholar] [CrossRef]
  22. Geisler-Lee, J.; Caldwell, C.; Gallie, D.R. Expression of the ethylene biosynthetic machinery in maize roots is regulated in response to hypoxia. J. Exp. Bot. 2009, 61, 857–871. [Google Scholar] [CrossRef] [Green Version]
  23. Walkley, A. A critical examination of a rapid method for determining organic carbon in soils—Effect of variations in digestion conditions and of inorganic soil constituents. Soil Sci. 1947, 63, 251–264. [Google Scholar] [CrossRef]
  24. Six, J.; Elliott, E.T.; Paustian, K.; Doran, J.W. Aggregation and soil organic matter accumulation in cultivated and native grassland soils. Soil Sci. Soc. Am. J. 1998, 62, 1367–1377. [Google Scholar] [CrossRef]
  25. Sonobe, R.; Yamaya, Y.; Tani, H.; Wang, X.; Kobayashi, N.; Mochizuki, K.I. Assessing the suitability of data from Sentinel-1A and 2A for crop classification. GIScience Remote Sens. 2017, 54, 918–938. [Google Scholar] [CrossRef]
  26. Egyptian Meteorological Authority. Climatic Atlas of Egypt; Ministry of Transport: Cairo Governorate, Egypt, 1996.
  27. Staff, F.A.O. Bibliography on Soil and Related Sciences for Latin America; World Soil Resources Report; FAO: Roma, Italy, 1966; Volume 23, p. 105. [Google Scholar]
  28. Moussa, W.; El-Nahry, F.; Abd El Galil, A. National Survey for Assessment of Vitamin A Status in Egypt; National Nutrition Institute/UNICEF: Cairo, Egypt, 1995. [Google Scholar]
  29. Shukla, M.K.; Lal, R.; Ebinger, M. Determining soil quality indicators by factor analysis. Soil Tillage Res. 2006, 87, 194–204. [Google Scholar] [CrossRef]
  30. Leon, C.T.; Shaw, D.R.; Cox, M.S.; Abshire, M.J.; Ward, B.; Wardlaw, M.C.; Watson, C. Utility of remote sensing in predicting crop and soil characteristics. Precis. Agric. 2003, 4, 359–384. [Google Scholar] [CrossRef]
  31. Lal, R. Soil erosion impact on agronomic productivity and environment quality. Crit. Rev. Plant Sci. 1998, 17, 319–464. [Google Scholar] [CrossRef]
  32. Neff, J.C.; Townsend, A.R.; Gleixner, G.; Lehman, S.J.; Turnbull, J.; Bowman, W.D. Variable effects of nitrogen additions on the stability and turnover of soil carbon. Nature 2002, 419, 915. [Google Scholar] [CrossRef] [PubMed]
  33. Lu, F.; Wang, X.; Han, B.; Ouyang, Z.; Duan, X.; Zheng, H.; Miao, H. Soil carbon sequestrations by nitrogen fertilizer application, straw return and no-tillage in China’s cropland. Glob. Change Biol. 2009, 15, 281–305. [Google Scholar] [CrossRef]
  34. Chamen, T.; Alakukku, L.; Pires, S.; Sommer, C.; Spoor, G.; Tijink, F.; Weisskopf, P. Prevention strategies for field traffic-induced subsoil compaction: A review: Part 2. Equipment and field practices. Soil Tillage Res. 2003, 73, 161–174. [Google Scholar] [CrossRef]
  35. Zhang, Z.; Yu, D.; Shi, X.; Warner, E.; Ren, H.; Sun, W.; Tan, M.; Wang, H. Application of categorical information in the spatial prediction of soil organic carbon in the red soil area of China. Soil Sci. Plant Nutr. 2010, 56, 307–318. [Google Scholar] [CrossRef] [Green Version]
  36. Chai, T.; Draxler, R.R. Root mean square error (RMSE) or mean absolute error (MAE)?–Arguments against avoiding RMSE in the literature. Geosci. Model Dev. 2014, 7, 1247–1250. [Google Scholar] [CrossRef]
  37. El-Zeiny, A. Remote Sensing and GIS for Assessment and Mapping of the Environmental Degradation in the Coastal Region at Damietta—Egypt. Ph.D. Thesis, Faculty of Sciences, Damietta University, Damietta, Egypt, 2015. [Google Scholar]
  38. Franzen, D.; Peck, T. Field soil sampling density for variable rate fertilization. J. Prod. Agric. 1995, 8, 568–574. [Google Scholar] [CrossRef]
  39. Weisz, R. Map generation in high-value Horticultural Integrated Pest Management: Appropriate Interpolation Methods for Site- specific pest management of Colorado potato beetle (Coleoptera: Chrysomelidae). J. Econ. Entomol. 1995, 88, 1650–1657. [Google Scholar] [CrossRef]
  40. Weber, D.; Englund, E. Evaluation and comparison of spatial interpolators. Math. Geol. 1992, 24, 381–391. [Google Scholar] [CrossRef]
  41. Mohamed, E.S.; Schütt, B.; Belal, A. Assessment of environmental hazards in the north western coast-Egypt using RS and GIS. Egypt. J. Remote Sens. Space Sci. 2013, 16, 219–229. [Google Scholar] [CrossRef]
  42. El-Zeiny, A.M.; Effat, H.A. Environmental monitoring of spatiotemporal change in land use/land cover and its impact on land surface temperature in El-Fayoum governorate, Egypt. Remote Sens. Appl. Soc. Environ. 2017, 8, 266–277. [Google Scholar] [CrossRef]
  43. AbdelRahman, M.A.; Shalaby, A.; Mohamed, E.S. Comparison of two soil quality indices using two methods based on geographic information system. Egypt. J. Remote Sens. Space Sci. 2018. [Google Scholar] [CrossRef]
  44. Rouse, J.W.; Haas, R.H.; Scheel, J.A.; Deering, D.W. Monitoring Vegetation Systems in the Great Plains with ERTS. In Proceedings of the 3rd Earth Resource Technology Satellite (ERTS) Symposium, Washington, DC, USA, 10–14 December 1973; Volume 1, pp. 48–62. [Google Scholar]
  45. Mondal, A.; Khare, D.; Kundu, S.; Mondal, S.; Mukherjee, S.; Mukhopadhyay, A. Spatial soil organic carbon (SOC) prediction by regression kriging using remote sensing data. Egypt. J. Remote Sens. Space Sci. 2017, 20, 61–70. [Google Scholar] [CrossRef] [Green Version]
  46. Castaldi, F.; Hueni, A.; Chabrillat, S.; Ward, K.; Buttafuoco, G.; Bomans, B.; Vreys, K.; Brell, M.; van Wesemael, B. Evaluating the capability of the Sentinel 2 data for soil organic carbon prediction in croplands. ISPRS J. Photogramm. Remote Sens. 2019, 147, 267–282. [Google Scholar] [CrossRef]
  47. Bratley, K.; Ghoneim, E. Modeling Urban Encroachment on the Agricultural Land of the Eastern Nile Delta Using Remote Sensing and a GIS-Based Markov Chain Model. Land 2018, 7, 114. [Google Scholar] [CrossRef]
  48. Luo, H.; Dai, S.; Xie, Z.; Fang, J. NDVI-Based analysis on the influence of human activities on vegetation variation on Hainan Island. In IOP Conference Series: Earth and Environmental Science; IOP Publishing: Bristol, UK, 2018; Volume 121, p. 032045. [Google Scholar]
  49. Hammam, A.A.; Mohamed, E.S. Mapping soil salinity in the East Nile Delta using several methodological approaches of salinity assessment. Egypt. J. Remote Sens. Space Sci. 2018. [Google Scholar] [CrossRef]
  50. Oldeman, L.R.; Hakkeling, R.T.; Sombroek, W.G. World Map of the Status of Human-Induced Soil Degradation: An Explanatory Note, 2nd ed.; ISRIC: Wageningen, The Netherlands, 1991. [Google Scholar]
  51. Mohamed, E.S.; Belal, A.; Shalaby, A. Impacts of soil sealing on potential agriculture in Egypt using remote sensing and GIS techniques. Eurasian Soil Sci. 2015, 48, 1159–1169. [Google Scholar] [CrossRef]
  52. El Nahry, A.H. Using Aerial Photo Techniques for Soil Mapping in Some Areas East of the Nile Delta. Master Degree Thesis, Faculty of Agriculture, Cairo University, Cairo, Egypt, 1997. [Google Scholar]
  53. Elnaggar, A.A. Spatial and temporal changes in agricultural lands eastern Nile-delta, Egypt. J. Soil Sci. Agric. Eng. Mansoura Univ. 2013, 4, 187–201. [Google Scholar]
  54. Cao, Q.; Wang, H.; Zhang, Y.; Lal, R.; Wang, R.; Ge, X.; Liu, J. Factors affecting distribution patterns of organic carbon in sediments at regional and national scales in China. Sci. Rep. 2017, 7, 5497. [Google Scholar] [CrossRef] [Green Version]
  55. Janzen, H.H.; Campbell, C.A.; Ellert, B.H.; Bremer, E. To Soil Quality. In Soil Quality for Crop Production and Ecosystem Health; Elsevier Science & Technology: Oxford, UK, 1997; Volume 25, p. 277. [Google Scholar]
  56. Göl, C. Assessing the amount of soil organic matter and soil properties in high mountain forests in Central Anatolia and the effects of climate and altitude. J. For. Sci. 2017, 63, 199–205. [Google Scholar] [Green Version]
  57. Belal, A.E.; Elsayed, M.; Abu-hashim, M. Land Evaluation Based on GIS-Spatial Multi-Criteria Evaluation (SMCE) for Agricultural Development in Dry Wadi, Eastern Desert, Egypt. Int. J. Soil Sci. 2015, 10, 100–116. [Google Scholar] [CrossRef]
  58. Tanveera, A.; Kanth, T.A.; Tali, P.A.; Naikoo, M. Relation of soil bulk density with texture, total organic matter content and porosity in the soils of Kandi Area of Kashmir valley, India. Int. Res. J. Earth Sci. 2016, 4, 1–6. [Google Scholar]
  59. Mohamed, E.S.; Belal, A.; Saleh, A. Assessment of land degradation east of the Nile Delta, Egypt using remote sensing and GIS techniques. Arab. J. Geosci. 2013, 6, 2843–2853. [Google Scholar] [CrossRef]
  60. Hassaan, A.M.; Belal, A.A.; Hassan, M.A.; Farag, F.M.; Mohamed, E.S. Potential of thermal remote sensing techniques in monitoring waterlogged area based on surface soil moisture retrieval. J. Afr. Earth Sci. 2019, 155, 64–74. [Google Scholar] [CrossRef]
  61. Mohamed, E.S.; Ali, A.; El-Shirbeny, M.; Abutaleb, K.; Shaddad, S. Mapping soil moisture and their correlation with crop pattern using remotely sensed data in arid region. Egypt. J. Remote Sens. Space 2019. [Google Scholar] [CrossRef]
Figure 1. Location of the study area and soil samples.
Sustainability 11 02644 g001
Figure 2. Flowchart of the effects parameters on soil organic carbon pool (SOCP) (methodology flowchart).
Sustainability 11 02644 g002
Figure 3. Spatial distribution of the land-use and land cover (LULC) between 1995 and 2018: (a) spatial distribution of the land-use and land cover in 1995; (b) spatial distribution of the LULC in 2018.
Sustainability 11 02644 g003
Figure 4. Normalized Difference Vegetation Index (NDVI) for the study area between 1995 and 2018: (a) NDVI for the study area in 1995; (b) NDVI for the study area in 2018.
Sustainability 11 02644 g004
Figure 5. Spatial distribution of soil organic carbon (SOC) pool for the study area between 1995 and 2018: (a) spatial distribution of SOC pool in 1995; (b) spatial distribution of SOC pool in 2018.
Sustainability 11 02644 g005
Figure 6. Spatial distribution of the land surface temperature of the study area in 2018.
Sustainability 11 02644 g006
Figure 7. Correlation between soil organic carbon pool (SOCP) and land surface temperature (LST). (a) Correlation between SOCP and NDVI. (b).
Sustainability 11 02644 g007
Figure 8. Effect of different soil types (e.g., silty, sand loam, sand clay, sand, etc.) on the soil organic carbon pool (SOCP).
Sustainability 11 02644 g008
Table 1. Land-use change detection from 1995 to 2018 of the study area by hectare.
Class19952018Changes
(ha)(ha)(± ha)
Agriculture221,696240,89019,194
Urban15,92934,51418,585
Sabkha14,57418,9934419
Bare area165,79116,326−149,465
Fish farms25,717103,55477,837
Orchards17,33145,90128,570
Water bodies11,55312,413860
Table 2. Effect of different soil types (e.g., silty, sand loam, sand clay, sand, etc.) on the soil organic carbon pool (SOCP).
Silty LoamSand LoamSand Clay LoamSand ClaySandLoamy SandLoamClay LoamClay
Min18.736.418.713.84.919.436.625.034.6
Mean29.350.925.228.619.426.541.831.744.9
Max35.061.129.050.225.934.049.744.854.3
Std.7.311.44.615.49.75.95.68.98.1

