Is M&A Information Useful for Exploring Promising Industries and Technologies?

1
School of Business, Sejong University, Seoul 05006, Korea
2
Leavey School of Business, Santa Clara University, Santa Clara, CA 95053, USA
3
Department of IT Management, Hanshin University, Osan 18101, Gyeonggi-do, Korea
*
Author to whom correspondence should be addressed.
Sustainability 2020, 12(1), 139; https://0-doi-org.brum.beds.ac.uk/10.3390/su12010139
Submission received: 31 October 2019
/
Revised: 1 December 2019
/
Accepted: 14 December 2019
/
Published: 23 December 2019
(This article belongs to the Special Issue Big Data for Sustainable Anticipatory Computing)
Abstract
:Companies today that seek to diversify their business are looking for opportunities in new markets by considering their core competencies. However, companies are struggling to diversify and grow their current businesses due to a lack of information concerning diversification and a low level of capability for future commercialization. In this study, we suggest a new methodology that identifies promising industry and technology areas by examining mergers and acquisitions (M&As) transaction data. Specifically, by analyzing the extent to which firms have engaged in M&A activities, the prediction of promising industries is derived from the relationships among specific industries, as well as the M&A transactions among technology areas within a focal industry. We first theoretically test whether all M&A transactions are related to promising areas. Second, we analyze the trends of global M&As by a time-series analysis of M&A transactions by sectors over the last 15 years. Lastly, we conduct an association analysis to identify the degree of M&A connections between industry and technology areas, respectively. We hope that our results provide insights for R&D policymakers and investors who need to decide on promising industries to cultivate or invest in, and researchers who want to identify overall M&A trends and promising industries and technology areas.
1. Introduction
Companies seeking to diversify their business look for opportunities in new industries or markets based on their core competencies. In general, most companies pursue growth in categories outside as well as inside their core business area. However, many companies are struggling to diversify and grow their businesses due to a lack of information concerning diversification and a low level of capability for commercialization [1,2,3].
To overcome such difficulties, various forecasting methods for identifying promising industry, business and technology areas have been developed [4]. Some public research and policy organizations such as the RAND Corporation, Korea Institute of S&T Evaluation and Planning (KISTEP), and National Institute of Science and Technology Policy (NISTEP) and research and advisory firms like Gartner, Forrester, OVUM, and IBM periodically publish reports on technology forecasting for private companies and individuals to alleviate R&D risks and to offer reliable and sufficient evidence on promising industries.
Promising industry/technology refers to a rapidly growing industry/technology area in the market in recent years. In other words, the term promising can be used interchangeably with growing or emerging industry/technology.
In terms of forecasting techniques, judgmental [5,6,7,8,9] and bibliometric analysis methods [6,10,11,12,13] have been used extensively by both scholars and practitioners. Specifically, judgmental methods first rely on the opinions of experts or panels with knowledge in a particular field that is relevant to the forecast. In its simplest form, each expert or panel is asked their opinion based on his/her own knowledge and insight, and they are subsequently integrated to generate a forecast. Judgmental methods by experts are particularly useful when there is a lack of empirical evidence in an area with high levels of uncertainty, as well as situations where it may take a long time before the findings from research can be uncovered. However, this “genius forecast”, as it is sometimes called, is largely dependent on the individual’s inputs and is particularly vulnerable to bias, but the potential for bias may be reduced by incorporating the opinions of multiple experts in a forecast, which also has the benefit of improving balance [4]. Another drawback of judgmental methods is inconsistency, which occurs when experts or panels apply different decision criteria to a similar situation.
Second, bibliometrics is defined by Norton [14] as the measurement of texts and information. Although traditional bibliometric methods have been used to trace back academic journal citations, bibliometrics analysis today is used to understand the past and even potentially to forecast the future [15,16]. Bibliometrics, in the context of technology forecasting, can be defined as the research of statistical analysis to produce and disseminate information with respect to the use of recorded literature or patents for forecasting and decision making [5]. Bibliometrics helps to identify the most recent technological trends and discover hidden patterns with information on authors/inventors, affiliations, and recent research in literature and patents [5,17]. Bibliometrics has been popularized and is becoming more significant in technology forecasting with the rapid evolution of information technology and the advancement of database systems [18,19]. Various types of bibliometric tools have been developed to analyze descriptive statistics, affiliations, authors, countries, and collaborations in the literature [5].
However, bibliometric methods have several drawbacks including quality, discipline variation, database variation, and bias and discrepancies [20]. For example, bibliometrics does not measure quality, and so it is important to put the data in context using a combination of metrics and other qualitative information.
In sum, both judgmental methods and bibliometrics have some limitations when applying their results to the real world. The major problem of judgmental methods is that their results cannot be objective. In the case of bibliometric methods based on papers or patents, there is a time lag [21,22] for practical use in the market because it generally takes 1–3 years from finishing documents to finally publish a paper or apply a patent. Above all, since these methodologies do not contain information based on actual business transactions in the market, there might be some gaps with the real business world, resulting in a fundamental limitation to the practical use of analyzed results by stakeholders. Therefore, we need to develop a practical and usable methodology that can explore new business opportunities for growth in the future.
The objective of this paper is to suggest a new methodology that can recommend promising industry and technology areas using mergers and acquisitions (M&A) transaction data. M&A is a general term to describe the consolidation of companies or assets through various types of financial transactions, including mergers, acquisitions, consolidations, tender offers, purchase of assets and management acquisitions. M&A tends to be used interchangeably, but there is a difference. In a merger, two companies agree to join together to form a new entity, whereas in an acquisition, one company subsumes the other [23]. It enables businesses to explore new business opportunities and opportunities for collaboration. Since mergers are so uncommon and takeovers are viewed in a negative light, the two terms have become increasingly blended and are used in conjunction with one another [24].
In particular, the M&A transaction data used in this study contain information that is appropriate to immediately identify specific industry or technology areas that are growing because as they represent current objective transaction information on industry and technology areas that are considered to be promising. Furthermore, it can be very useful in terms of predicting future directions by grasping promising industry and technology areas in each industrial area at specific points compared to the whole period.
The paper is organized as follows. In the following section, we analyze the trends of global M&As in terms of transaction frequency for the recent 15 years (2002–2016). Section 3 analyzes whether most M&A transactions are related to promising areas. We then extract M&A data at the highest level (level 1) of S&P Capital IQ’s industry segment. In Section 4, we conduct time-series analysis of M&A Transactions by sectors over the recent 15 years. To identify promising industry and technology areas, in Section 4, we conduct association analysis to capture the M&A relationships between industrial and technical areas in terms of the number of M&A transactions. For the analysis, we construct an m (buyer) × n (target) matrix to analyze associativity between industry and technology areas. In the last section, implications and further research issues are discussed.
For a detailed analysis of M&A transactions, we use S&P Capital IQ. It provides detailed information and analysis of all M&A transactions at the most granular level. S&P Capital IQ’s industry segments are based on the global industry classification standard (GICS), which includes a four-tiered hierarchical classification framework composed of 11 sectors (Level 1), 24 industry groups (Level 2), 68 industries (Level 3) and 157 sub-industries (Level 4) [25]. The official hierarchy for GICS is level 4, but for S&P, segments are drilled-down into level 6 to level 9, depending on the sector. Generally, one industry is supported by various technology fields. Thus, it is named as the technology for all hierarchies below the sub-industrial level. The classification categories of GICS and S&P Capital IQ change over time to reflect industry structure and technology changes.
We hope this study will generate further research and be helpful to R&D managers, government policymakers, and researchers.
2. Global M&A Trends
M&As have been around for a long time. It is no longer a new concept in the business world. It started making its presence felt as early as the latter part of the 1800s, and increasing competitiveness in the global business landscape has largely been instrumental in its widespread application [26].
The evolution of M&A is broken down into six stages or “waves” [26,27]: First Wave (1893–1904), Second Wave (1919–1929), Third Wave (1955–1970), Fourth Wave (1974–1989), Fifth Wave (1993–2000), Sixth Wave (2003–2008) and Seventh Wave (2011–onwards).
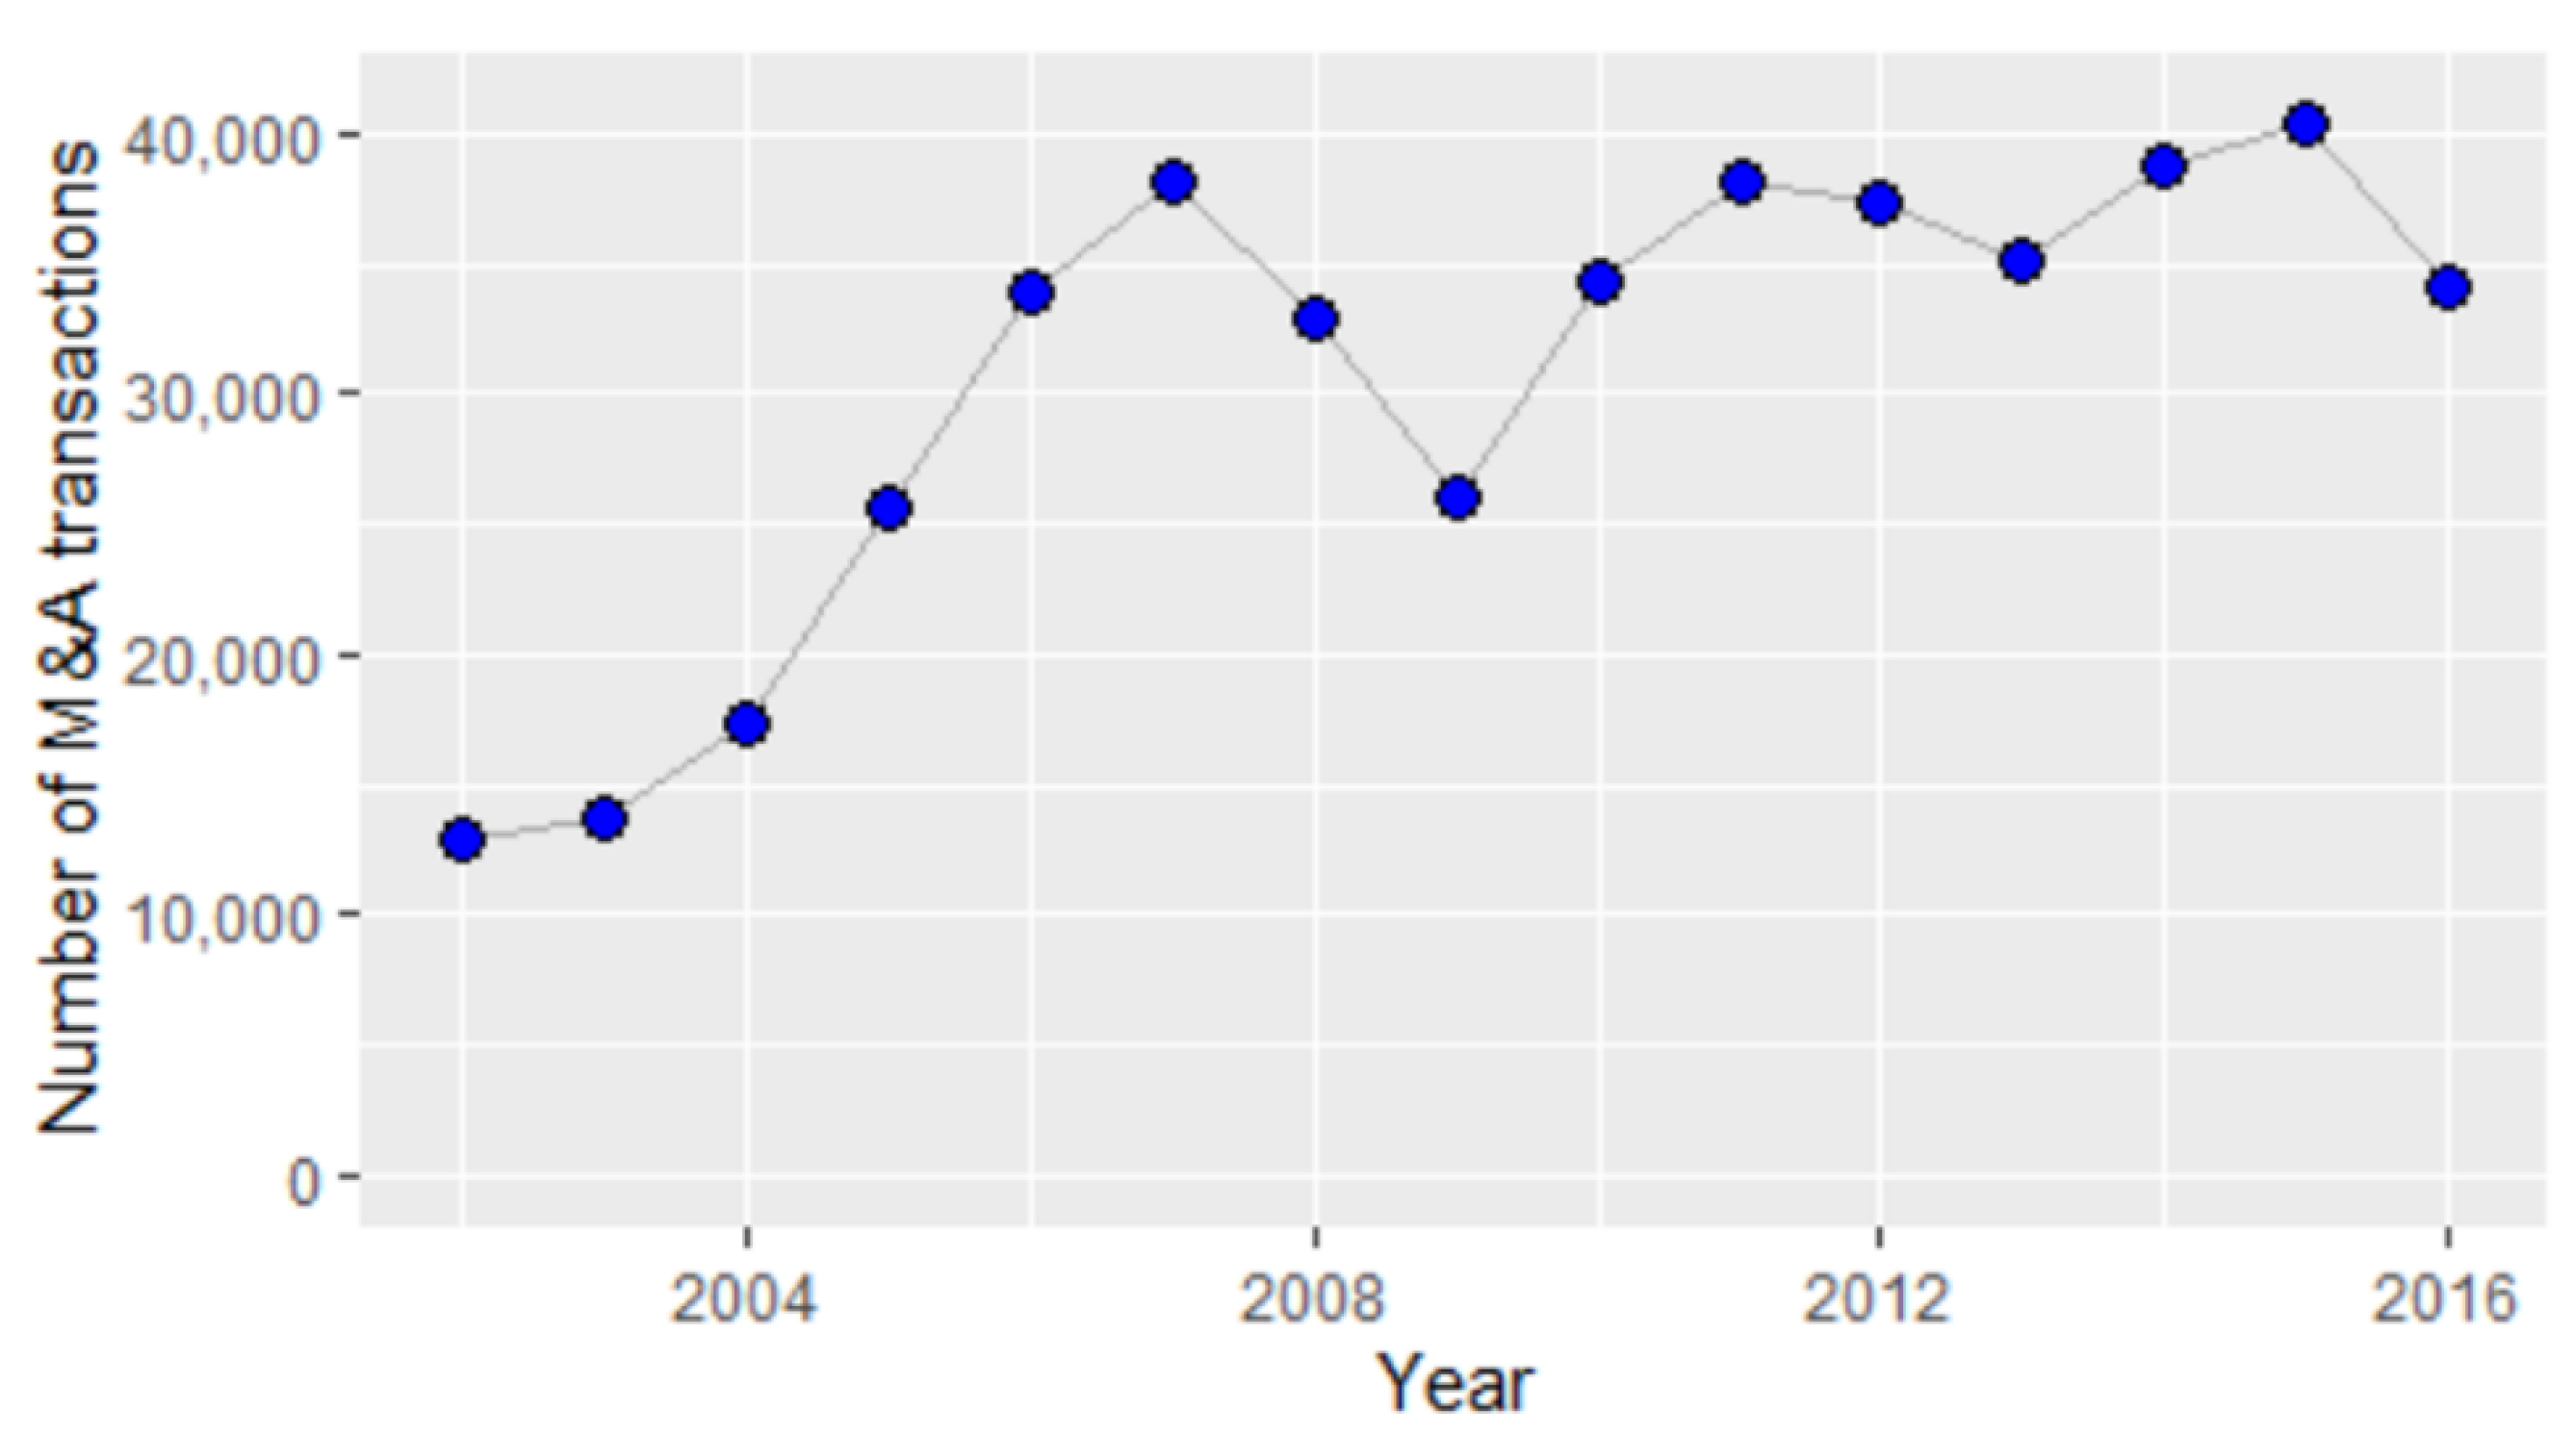
Before identifying promising industrial areas, we investigated the overall trends of M&A transactions over the recent period using the global M&A deals of S&P Capital IQ. Figure 1 shows the number of M&A transactions worldwide from 2002 to 2016. The M&A market has been very active and continually increasing during the period, though there were some ups and downs. In 2015, there were 40,402 global M&A deals. The compound annual growth rate (CAGR) of the number of M&A transactions for the period 2002–2016 was 7.3%.
In addition, Figure 1 shows three waves of global M&A activity over the last 15 years, with peaks in 2007, 2011 and 2015. In each peak year, the average size of M&A deals has grown. The most striking features of today’s wave are the size of the deals and the speed at which these are growing. Strategic deals in particular have grown in size as larger and larger companies agree to merge or be acquired. The number of megadeals over $1 billion has grown exponentially. The increasing size of deals is partly due to the strong trend towards consolidation and higher overall valuation levels, but it also reflects the fact that acquiring companies have much larger war chests thanks to record profits and low interest rates, enabling them to make increasingly audacious bids.
3. Relationship between M&A and Promising Areas
In this section, we theoretically test whether M&A transactions are related to promising areas. M&As are taking place all over the world irrespective of the industry, and therefore it is necessary to understand the basic concepts related to this activity. A merger is said to occur when two or more companies combine to form one company. A merger is defined as a “transaction involving two or more companies in the exchange of securities, and only one company survives.” When the shareholders of more than one company, usually two, decide to pool resources of the companies under a common entity, it is called a “merger”, in contrast to acquisition, which is an act of one company acquiring effective control over the assets (purchase of assets either by lump sum consideration or by item-wise consideration) or management (purchase of stocks/shares or gaining control over the board) of another company without combining their businesses physically [28]. Generally, a company takes effective control over a target company by acquiring the majority of shares of that company.
Companies try M&A deals for various purposes and motives. Not all M&A deals are targeted at promising areas like traditional venture investments. There may be M&A deals for internal changes and strategic objectives. Therefore, it is necessary to classify M&A transactions that have relevance to promising areas based on the theoretical background. Therefore, we try to derive M&A deals based on promising areas by analyzing the relationship between M&As and promising areas.
The motives of general companies for participation in M&As are derived from the related literature. In principle, motives represent expectations and preliminary evaluations formulated by the parties before the completion of a deal [29]. There are various purposes/motives for M&As. According to a review of the literature, the main reasons for M&A are increased market share, improved efficiency, firm growth, optimization, cost savings, risk reduction, entry into new business, securing R&D capability and so on, which is a non-exhaustive and nonexclusive list of such motives.
Bower [30] suggested that acquisitions occur for five reasons, namely (1) to deal with overcapacity through consolidation in mature industries, (2) to roll-up competitors in geographically fragmented industries, (3) to extend into new products or markets, (4) as a substitute for R&D, and (5) to exploit eroding industry boundaries by inventing an industry.
In a survey of 62 firms involved in M&A deals, Colombo and Garrone [31] found that technology-related motives include the scale and scope of economies in R&D, R&D risk spreading, access to technological resources, and the reduction of spillovers and competition in technology markets. Meanwhile, market-related motives include an increase of market share, rationalization, or entry into new businesses and geographic markets. Kui and Shu-cheng [32] also argued in their empirical research that M&As not only play an important role in optimizing the allocation of resources and promoting economic development, but are also an important component of an enterprise’s external growth. Synergy is not only a significant reason for M&A. At the same time, it is an essential measure of success or failure.
Cefis [33] argued that M&As represent a means of acquiring external knowledge, and therefore post-merger behavior favors the consolidation of the knowledge that has been acquired by merging with or by buying another firm. This supports the argument that M&As are generally linked to a firm improving its innovation performance.
Although in older studies on M&As from the 1970s, increasing R&D activities and improving technological performance seem hardly relevant as motives for M&As [34], nowadays, many studies suggest that M&As are an important element in the technology acquisition and innovation strategy of companies, in particular in R&D-intensive industries such as ICT and pharmaceuticals [35]. M&As allow companies to source existing technologies, thereby filling gaps in their technology portfolio quicker than is feasible via in-house development [36,37,38]. Also, they provide a mechanism to learn about the other firm’s technologies, to recombine knowledge and technologies residing in different firms, and thereby to generate innovations [36,39]. In a similar study, Graebner [40] reviewed what is known about technology acquisitions, including buyers’ and sellers’ motivations for engaging in these deals. Buyers pursue technology acquisition to add strategically valuable resources, enhance market power, or to achieve strategic renewal, and the seller’s motivation for M&A is to add strategically valuable resources (at the right time) and relieve personal pressures. Generally, the M&A activity of technology firms is motivated by the acquirer’s desire to enhance its strategic technological capabilities or obtain the resources needed to compete in global markets [41,42].
Mensah and Onumah [43] found that, in theoretical and empirical reviews, the motives for mergers could be grouped into two categories: value enhancing and non-value enhancing. Value enhancing motives include efficiency and synergy, real cost savings, financial or redistributive cost savings, enhancement of market power, and preemptive or defensive disciplinary takeovers, while non-value enhancing motives are hubris, empire building, risk spreading or diversification, stagnation, and internationalization.
Motis [44] summarized a list of different rationales that have been proposed and classified them in two main groups, namely shareholder gains and managerial gains. Shareholder (market value) gains include efficiency gains (economies of scale, economies of scope, economies of vertical integration), synergy gains (diffusion of know-how, R&D), cost savings (rationalization, purchasing power, creating internal capital markets), financial cost savings (taxes, interest rates, diversification), enhancement or strengthening of market power (through unilateral or coordinated effects, to raise entry barriers, to spread portfolios, to obtain multi-market contact), as well as preemptive and defensive disciplinary takeovers (market for corporate control, free cash flow). Managerial gains include empire building, hubris, and risk spreading or diversification.
In contrast, some authors derived the motives for small and medium enterprises (SMEs) to participate in M&A deals. Most of the reasons derived from SMEs were almost the same when compared with general companies; these include rapid R&D capability, innovation, synergies, and survival.
Arvanitis and Stucki [45] analyzed the impact of M&As on the economic performance of SMEs. The authors suggested five groups of motives: growth (increase market share, broaden the product mix, entry into new business), cost (spread fixed costs, rationalization of procurement/production/marketing and sales), resources (obtain access to specific know-how/network), risks (spread the market risk), and innovation (reduce costs of R&D, obtain access to innovation-related know-how/networks, reduce the risk of the R&D portfolio/of being imitated).
Hussinger [38] showed through empirical analysis that firms engage in M&As to strengthen their technological competencies. The results are in line with previous empirical findings in that technological relatedness is an important criterion for the decision to acquire another firm. Distinguishing between the importance of technological relatedness for SMEs and larger firms shows that related technologies are particularly important for the decision to acquire SMEs.
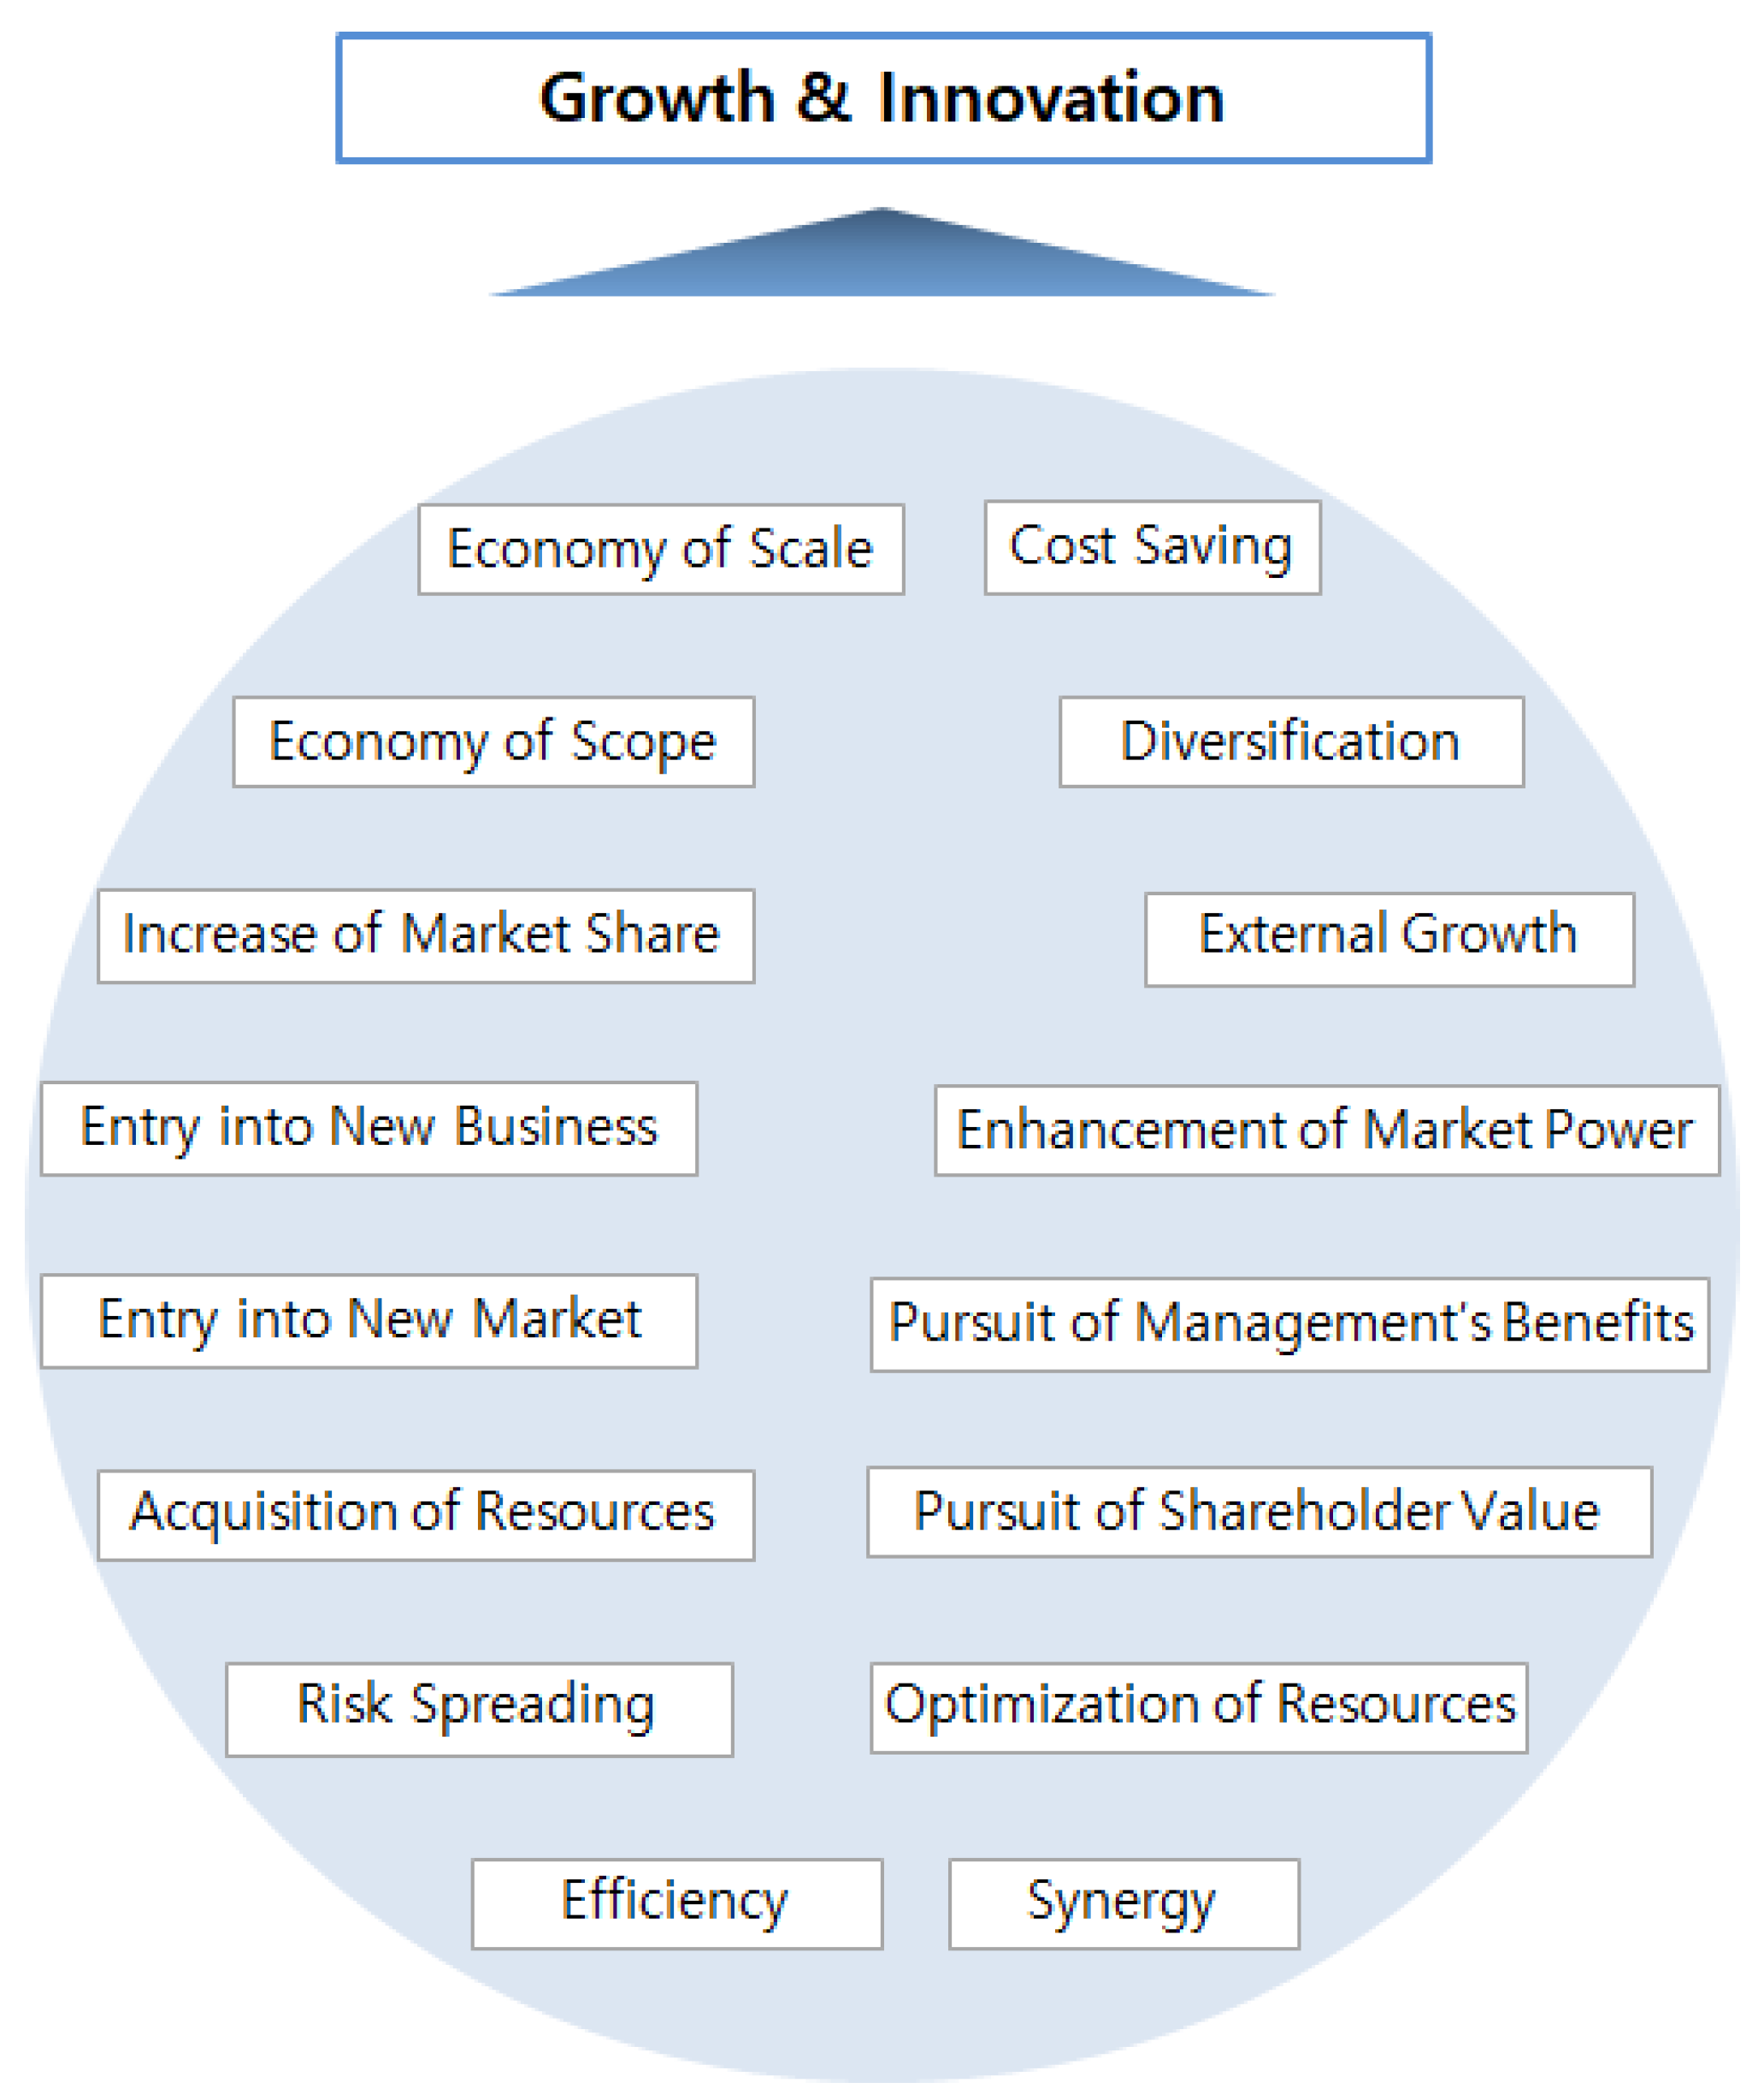
As shown in Figure 2, based on the above literature review, we can see that companies are seeking “growth” and “innovation” by securing technological capability and growth engine with M&As and improving productivity, thereby entering into promising industry and technology areas. Growth is defined as a gradual development in maturity, age, size, weight or height. Innovation, in contrast, is the act or process of innovating, which means introducing something new, e.g., a method, custom, or device [46]. Innovation usually refers to a sudden spark or creativity, and the incipient actions that lead to implementing that spark in a company’s strategy [47]. Therefore, we can conclude that companies try to gain new growth momentum in the future and enter promising industry and technology areas through “growth” and “innovation”.
On the other hand, in the case of “cost saving” and “pursuit of management’s value”, it is necessary to examine whether these are related to promising areas since they can be carried out for internal purposes.
Cost reduction includes the reduction of average or marginal costs of production, fixed costs, financial costs and R&D costs [44,45]. Keywords related to cost reduction can ultimately lead to “growth” and “innovation” as companies can have the same or higher output compared to smaller input by achieving higher efficiency and productivity within the enterprise. Therefore, cost savings for M&A purposes/motives are related to promising areas.
Non-value-maximizing theories argue that mergers are driven by managers trying to maximize their own wealth at the expense of shareholders. Trautwein [48] summarized seven major M&A theories. He classified the first four, namely efficiency theory, monopoly theory, raider theory and valuation theory, as beneficial to the shareholders of the acquiring company, and the fifth one, empire-building theory, as beneficial to the managers of the acquiring company, which means the maximization of managers’ goals. The pursuit of shareholder benefits is driven by the growth of the company, which is all related to promising areas. The pursuit of management’s benefits is maximizing managers’ utility, and they endeavor to maximize the profit or potential value of an enterprise. The managers seek growth potential and innovation to maximize the profit of the enterprise and also seek to enter promising business fields for that purpose. Therefore, the pursuit of shareholders’ and managers’ interests in the M&A purposes/motives are also related to promising areas.
Another classification of M&As has been extensively employed in both the theoretical and empirical literature. This classification does not refer to purposes or motives, but to types, which differ according to the business structure of the merging firms.
M&As are defined as horizontal, vertical, and conglomerate [28,44]. M&A is considered horizontal when two companies are in direct competition and share the same product lines and markets. M&A is considered vertical when one is a customer of the other, i.e., when the company expands backwards by M&A with a company supplying raw materials or expands forward in the direction of the ultimate consumer. Vertical M&As bring together companies in the same industry that are involved in different stages of production, processes, or operations. Finally, M&A is considered conglomerate when firms are in entirely different markets and/or do not have business lines in common.
When the management of acquiring and target companies mutually and willingly agree to a takeover, it is called a friendly M&A, and when the acquisition is “forced” or against the will of the target management, it is called a hostile M&A [28]. Hostile M&As take the form of a tender offer to the target’s shareholders by the acquiring company, even if the target’s management does not approve [49]. Bailout M&As are conducted to bail out sick companies, to allow a company to rehabilitate according to schemes approved by the financial institutions [32].
M&As can also be classified into domestic and cross-border ones [50,51]. Domestic M&A involves two companies within the same country, while cross-border M&As (also referred to as international mergers) are made between two companies from different countries.
The analysis of M&A transaction types shows that horizontal, vertical, and conglomerate M&As, based on combination type, are all attempted for expansion or growth, and that cross-border M&As are also related to promising areas because they are conducted to expand or grow regardless of borders.
If M&As are classified according to transaction intention, friendly M&A and bailout M&A are related to promising areas because both parties’ interests and growth possibilities are recognized by mutual agreement. However, a hostile M&A is not a means for mutual growth, but rather a unilateral relationship, so we need to consider whether the connectivity is related to promising areas.
Theoretically, the motives for a hostile takeover are usually the same as for other acquisitions, except for one additional reason or motive for hostile bidding. It is said that the most effective way of replacing an ineffective board of directors or management of a targeted firm is through hostile M&A [52]. When a company is operated ineffectively, even though it has great growth potential, or the value of the stock price doesn’t adequately illustrate the real value of the company, the company is undervalued. The acquiring company then wants to replace existing management for the company to achieve its full revenue and growth potential, thus increasing its stock value. For this reason, a company with a management that doesn’t seek the best interests for its shareholders can often be the target of future acquisitions.
However, contrary to popular view, most hostile takeovers are not followed by the acquirer stripping the assets of the target firm and leading it to ruin. Instead, target firms refocus on their core businesses and often improve their operating performance [53]. Some hostile M&As proceed to enhance social welfare, for example, the desire to exploit synergies by combining with the target firm. Also, the possibility that a hostile M&A that has a malicious purpose such as taking control of management could succeed is very low because there are anti-takeover mechanisms such as poison pills [54]. Armour and Skeel [25] showed that, in practice, among the total number of M&A transactions announced from 1990 to 2005 for which the target was a publicly traded firm located in the United States and United Kingdom, 0.85% of takeovers during the period in the United Kingdom were hostile and 0.57% of all M&A transactions in the United States were hostile. Therefore, except for a very few cases, most M&As are related to promising areas.
As a result of examining the purpose of M&As and types of M&A transactions, we argue that most M&A transactions are helpful for finding promising areas. Large companies and SMEs seek to enter promising areas through “growth” and “innovation”. Most companies seek out promising industry and technology areas with M&As and constantly strive to explore sustainability and gain new growth engines.
In conclusion, M&A activity is one of the active growth strategies of a company, and an area where M&A transactions actively take place for various motives and purposes can be considered a promising area.
4. M&A Data
Finding information about M&A transactions is possible with the availability of several M&A databases. One of the powerful databases that contain M&A information is S&P Capital IQ [55]. It provides accurate and timely financial information to investment banks, asset management firms, private equity firms, and corporations around the world. S&P Capital IQ provides detailed information and analysis on all M&A transactions at the most granular level.
S&P Capital IQ’s industry segment is based on the GICS, which is an industry taxonomy developed in 1999 by MSCI and Standard & Poor’s (S&P) for use by the global financial community. The GICS structure consists of 11 sectors, 24 industry groups, 68 industries and 157 sub-industries into which S&P has categorized all major public companies [56]. GICS is used as a basis for S&P and MSCI financial market indexes in which each company is assigned to a sub-industry and to a corresponding industry, industry group and sector, according to the definition of its principal business activity. A sector is one of the few general segments in the economy within which a large group of companies can be categorized [57]. An economy can be broken down into about a dozen sectors, which can describe nearly all of the business activity in that economy. An industry, on the other hand, describes a much more specific grouping of companies with highly similar business activities. Essentially, industries are created by further breaking down sectors into more defined groupings [57]. The classification tree in the S&P M&A database has a common lower level for each sector; the common lower level for all industry sectors is level 4, which corresponds to the sub-industry level of GICS. A company is classified in the sub-industry whose definition most closely describes the business activities that generate the majority of the company’s revenues [58].
Our analysis process is as follows. Firstly, we extract M&A data at the highest level (level 1) of S&P Capital IQ’s industry segment and then conduct time-series analysis over the recent 15 years (2002–2016) to do a comparative analysis of changes.
Secondly, we conduct sector-to-sector association analysis at the top level of S&P Capital IQ’s industry segment; the m (buyer’s sector) × n (target’s sector) matrix is constructed for the level (level 1) to analyze the M&A association structure between sectors. The matrix composition is based on the number of M&A transactions between sectors. Promising industrial areas, namely sectors, are derived by an analysis of the whole period (2002 to 2016) and five periods composed of three years, respectively. Thirdly, we conduct sub-industry-to-sub-industry association analysis at the fourth level of S&P Capital IQ’s industry segment. An m (buyer) × n (target) matrix is constructed for common levels for all industries (level 4) for association analysis. Matrix composition is also based on the number of transactions between sub-industries. Promising technology areas, namely sub-industries, are derived by the analysis of the whole period (2002 to 2016) and five periods composed of three years, respectively.
5. Time-Series Analysis of M&A Transactions by Sectors
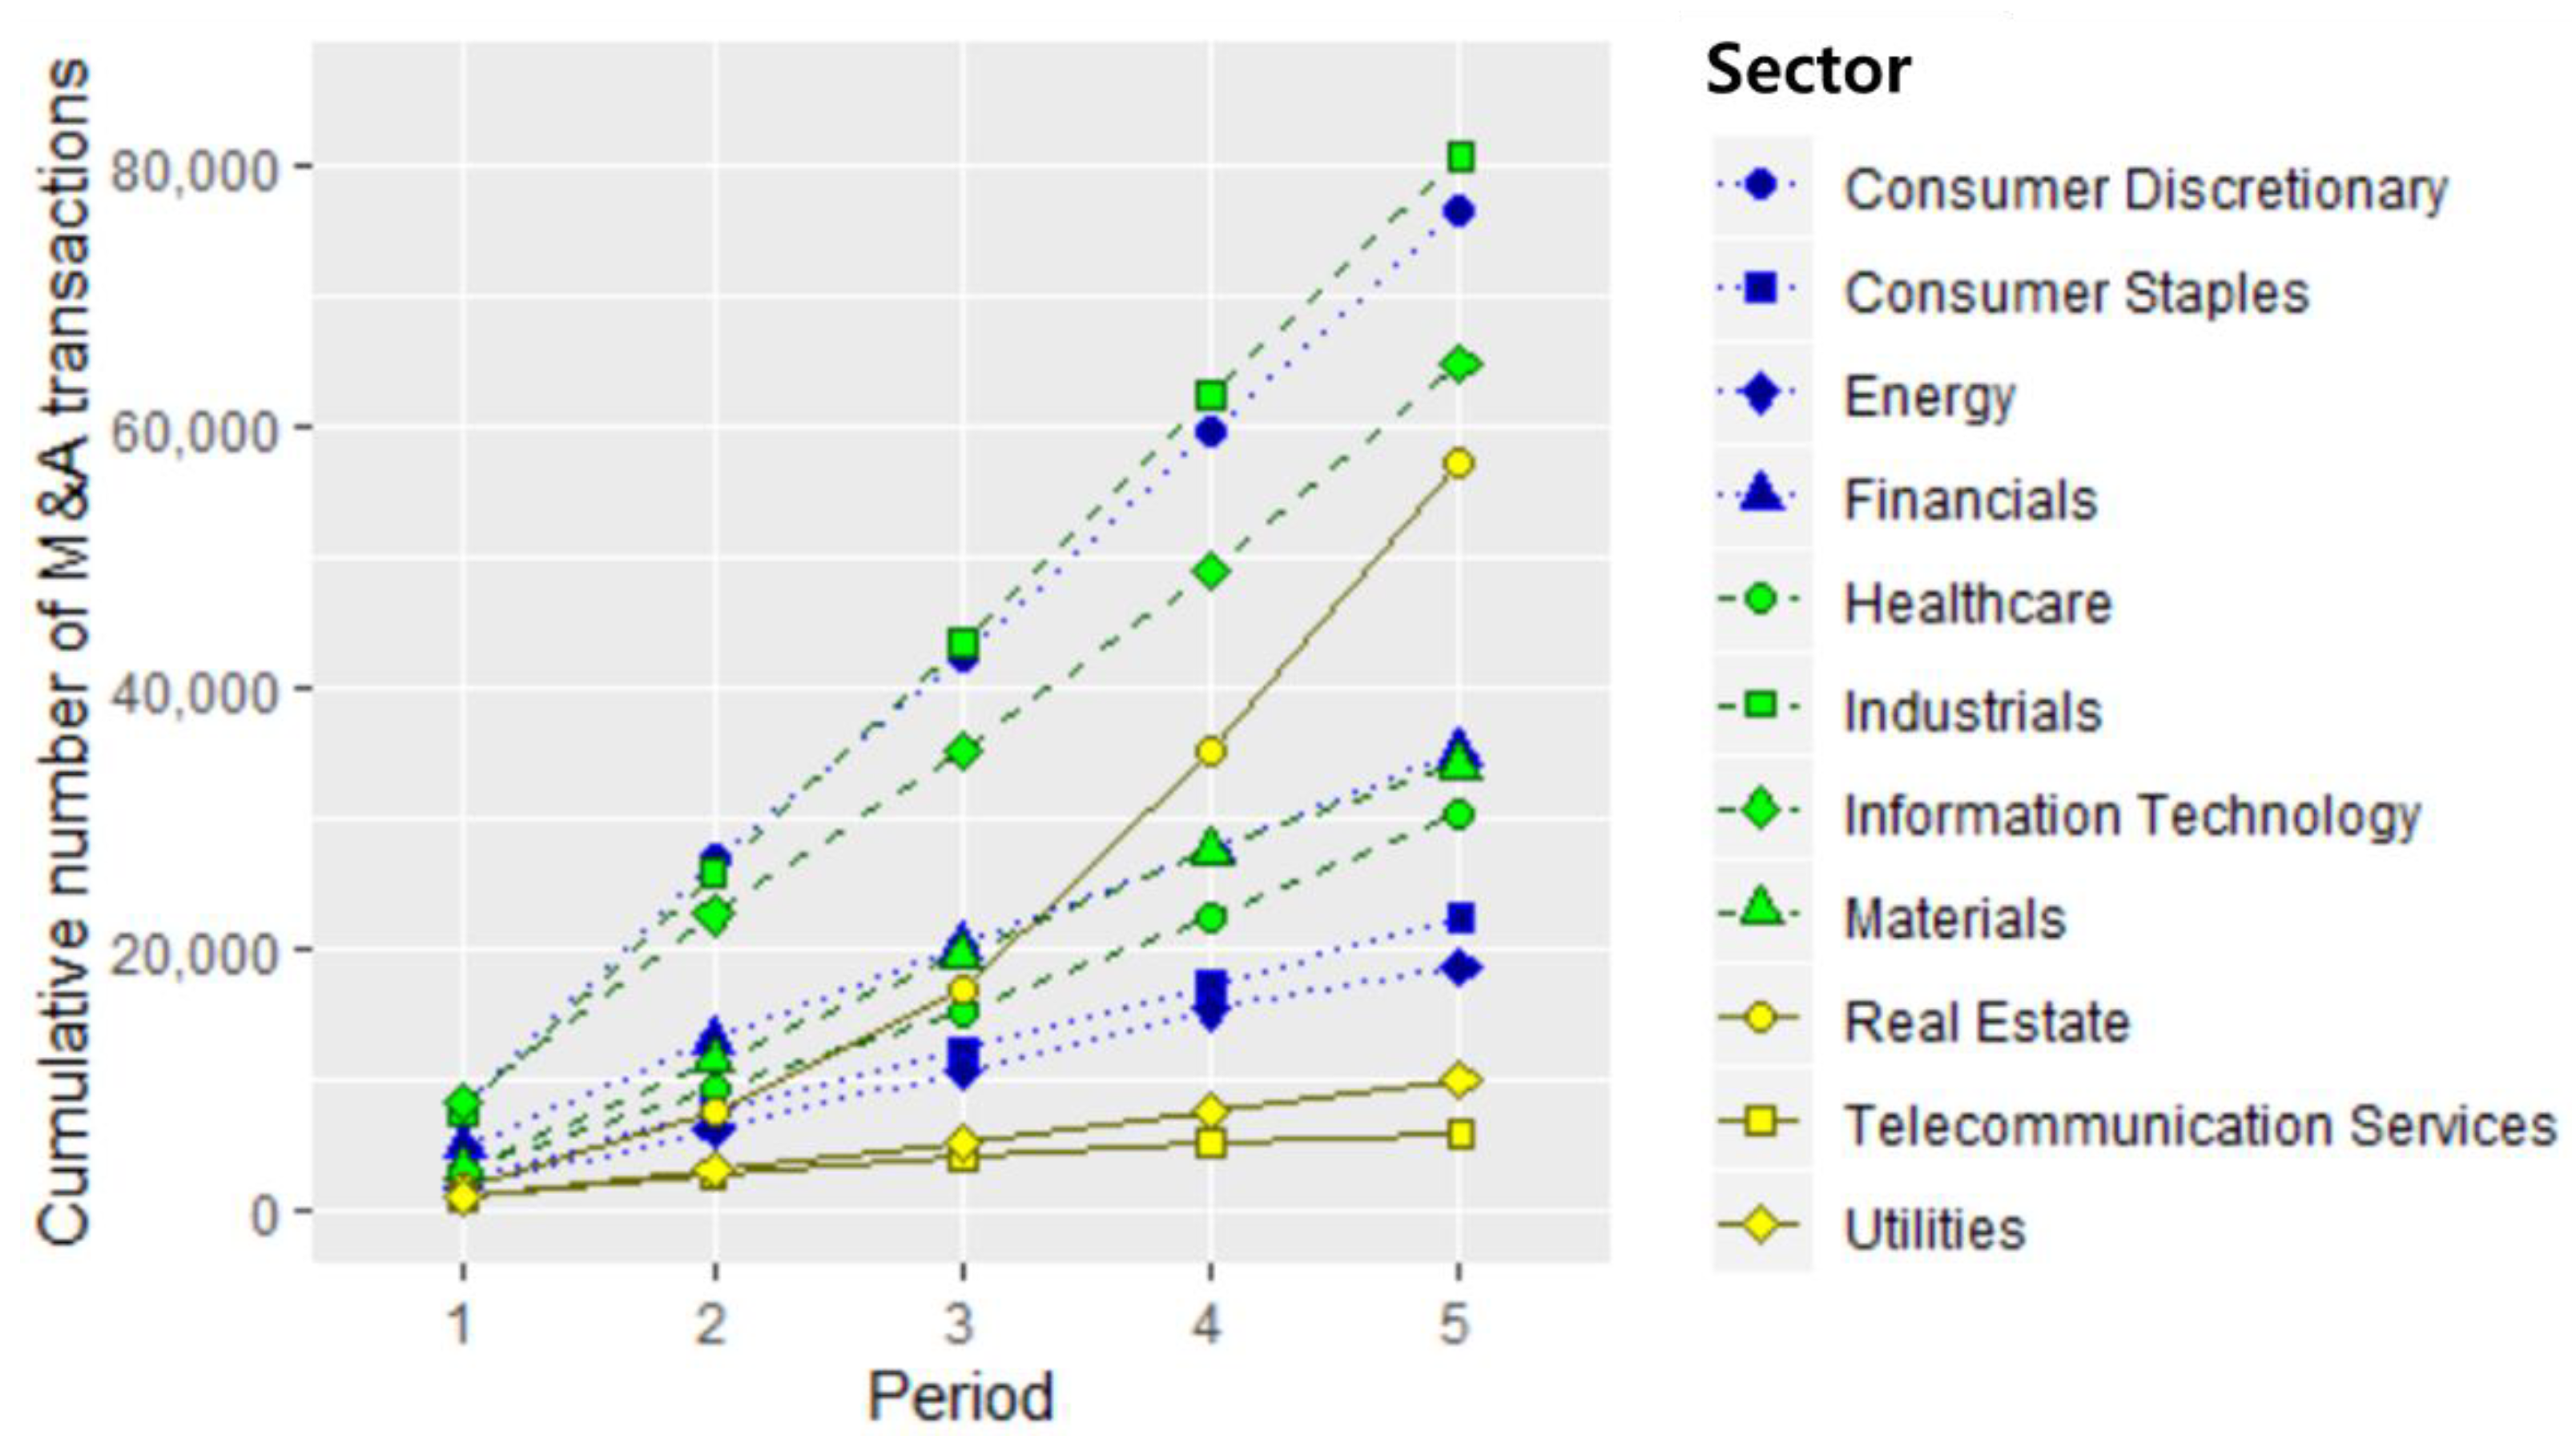
Figure 3 shows the analysis results for cumulative M&A transactions based on the number of M&A deals by 11 sectors over the recent 15 years (2002–2016).
The number of M&A deals has been increasing sharply across most of the sectors, although there are some differences in each sector. In particular, among the sectors, “industrials”, “consumer discretionary”, “information technology”, and “real estate” account for a large part of the M&A transactions and show continuous and rapidly increasing trends. In contrast, sectors such as “utilities” and “telecommunication services” have a relatively low proportion of frequency of M&A transactions, although the number of transactions continues to increase over time.
Table 1 presents a Theil regression analysis of time-series data based on the cumulative number of M&A transactions by sectors. This regression, first proposed by Theil [59], is a method for fitting a line to sample points in a plane (simple linear regression) by choosing the median of the slopes of all lines through pairs of points. Theil’s regression, sometimes referred to as Theil–Sen regression, is a robust non-parametric replacement for the traditional least squares approach to the linear regression model. In straight-line regression, the least squares estimator of the slope is sensitive to outliers and the associated confidence interval is affected by the non-normality of the dependent variable [60]. Theil’s methodology does not require the normality of random error while being able to yield an estimate of the slope of the regression line.
As shown in Table 1, the regression coefficients for all sectors are positive and observed as statistically significant at the 5% level, which means the number of M&A transactions for all sectors increased significantly.
In particular, sectors with large regression coefficients are “consumer discretionary”, “industrials” and “information technology”, which means that their growth velocity is larger than other sectors according to the number of M&A transactions.
In Figure 4, we analyze and compare the relative number of M&A transactions for each of the five periods for each sector. The relative number of M&A transactions is determined by the relative ratio of the M&A frequency of each sector to the total number of M&A transactions of all sectors in each period.
“Consumer discretionary”, “industrials” and “information technology” are sectors where the relative number of M&A transactions is higher than the relative number of M&A transactions.
In contrast, sub-industries such as “consumer staples”, “healthcare” and “utilities” show little difference between the relative number of M&A transactions. In the case of the sector “Real Estate” the relative number of M&A transactions shows a fast growth rate by increasing steeply. On the other hand, it is observed that the relative number of M&A transactions in the sectors “financials”, “consumer discretionary” and “telecommunication services” are decreasing over time. At this point, we present the analysis results of the sectors (level 1) for each period by dividing them into three-year periods. It is possible to identify them more specifically by subdividing the analysis target into lower levels and further dividing the analysis period into two-year, one-year, quarterly, and monthly time units.
6. Association Analysis between Industry and Technology Areas
6.1. Association Analysis of Level 1: Buyer (All Industries) vs. Target (All Industries)
Table 2 shows the results of sector-to-sector association analysis at the top level (level 1) of all sectors. A total of 433,888 deals were made between 11 buyer and 11 target sectors over the entire period (2002–2016, 15 years). This methodology can be regarded as an organizational social informatics [61].
According to the data collected from S&P, the number of closed or effective M&A transactions during the 2002~2016 period was 458,800. In the case where there was an error in the data (e.g., when there is no associated sector for buyer or target), the transaction was excluded.
The largest number of M&A deals was between industrials (buyer) and industrials (target), and 49,399 deals were concluded during the period. Please note that our analysis covers both mergers and acquisitions. The sectors that traded the most over the whole period in terms of buyer’s perspective were financials (84,701 deals), which accounted for 19.5% of the total transactions, followed by industrials (76,658 deals, 17.7%) and consumer discretionary (63,789 deals, 14.7%), respectively. As for the target, industrials (80,459 deals, 18.5%) accounted for the largest volume of transactions, followed by consumer discretionary (76,342 deals, 17.6%) and information technology (64,602 deals, 14.9%).
As shown in Table 2, there were 41,859 transactions between 11 buyer and 11 target sectors during 2002–2004 (period 1). The sector that participated most actively as a buyer was Financials (8538 deals), which accounted for 20.4% of all transactions in period 1. The most actively targeted sector in M&A transactions was information technology (8177 deals; 19.5%), followed by consumer discretionary (7928; 18.9%). The largest number of M&A transactions that occurred during period 1 was between information technology (buyer) and information technology (target), which was 5300 deals.
During 2004–2006 (period 2), there were 93,121 transactions between 11 buyer and 11 target sectors. The sector that participated most actively as a buyer was financials (18,091 deals), which accounted for 19.4% of all transactions in period 2. The most actively targeted sector in M&A transactions was consumer discretionary (18,744 deals; 20.1%), followed by industrials (18,463; 19.8%). The largest number of M&A transactions that occurred during period 2 was between industrials (buyer) and industrials (target), which was 11,022 deals.
During 2007–2009 (period 3), there were 88,870 transactions between 11 buyer and 11 target sectors. The sector that participated most actively as a buyer was industrials (16,874 deals), which accounted for 19.0% of all transactions in period 3. The most actively targeted sector in M&A transactions was industrials (17,592 deals; 19.8%), followed by consumer discretionary (15,619; 17.6%). The largest number of M&A transactions that occurred during period 3 was between industrials (buyer) and industrials (target), which was 10,966 deals.
During 2010–2012 (period 4), there were 104,084 transactions between 11 buyer and 11 target sectors. The sector that participated most actively as a buyer was financials (19,717 deals), which accounted for 19.0% of all transactions in period 4. The most actively targeted sector in M&A transactions was industrials (18,939 deals; 18.2%), followed by real estate (18,264; 17.5%). The largest number of M&A transactions that occurred during period 4 was between industrials (buyer) and industrials (target), which was 11,827 deals.
During 2013–2016 (period 5), there were 105,954 transactions between 11 buyer and 11 target sectors. The sector that participated most actively as a buyer was financials (22,339 deals), which accounted for 21.1% of all transactions in period 5. The most actively targeted sector in M&A transactions was real estate (22,322 deals; 21.1%), followed by industrials (18,098; 17.1%). The largest number of M&A transactions that occurred during period 5 was between the real estate (buyer) and real estate (target) sectors, which was 13,364 deals.
6.2. Association Analysis of Level 4 for Each Period: Buyer (All Industries) vs. Target (All Industries)
Table 3 shows the results of association analysis between sub-industries (level 4). During the entire 15-year period, a total of 433,327 transactions were made between 157 buyers and 157 target sub-industries. The reason why the number of M&As on level 4 is about 500 less than the number of M&As on level 1 is because the lower the level in the S&P standard, the smaller the number of transactions that do not belong to a specific industry or technology area. We used the original M&A data and did not arbitrarily change it for the objectivity and validity of the study.
As shown below in Table 3, the sub-industry with the largest number of M&A transactions was between asset management and custody banks (buyer) and real estate operating companies (target). A total of 13,862 transactions were conducted, which accounted for 3.2% of all M&A transactions between 157 subgroups (buyer) and 157 subgroups (target) over the whole period.
During 2002–2004 (period 1), the subgroups that participated most actively as buyer were asset management and custody banks (4313 deals), which accounted for 10.3% of all transactions in the period. The most actively targeted subgroups in M&A transactions was Application Software (2093 deals; 5.0%), followed by internet software and services (1926; 4.6%). The subgroups that traded the most on the level 4 were application software (buyer) and application software (target), respectively.
During 2005–2007 (period 2), the subgroups that participated most actively as buyer were asset management and custody banks (10,615 deals; 11.4%). The most actively targeted subgroups in M&A transactions were real estate operating companies (4097 deals; 4.4%), followed by application software (3334; 3.6%). The largest number of M&A transactions that occurred during period 1 was between packaged foods and meats (buyer) and packaged foods and meats (target) subgroups, respectively (1688; 1.8%).
During 2008–2010 (period 3), the subgroups that participated most actively as a buyer were Asset Management and Custody Banks (9478 deals), which accounted for 10.7% of all transactions in the period, followed by construction and engineering (2518; 2.8%). The most actively targeted subgroups in M&A transactions were real estate operating companies (7442; 8.4%), followed by internet software and services (3444; 3.9%). The subgroups that traded the most at level 4 were asset management and custody banks (buyer) and real estate operating companies (target), respectively.
During 2011–2013 (period 4), the subgroups that participated most actively as buyer were asset management and custody banks (13,263 deals), which accounted for 12.8% of all transactions in the period. The most actively targeted subgroups in M&A transactions were real estate operating companies (16,531; 15.9%), followed by internet software and services (4566; 4.4%). The largest number of M&A transactions that occurred during period 4 was between the asset management and custody banks (buyer) and real estate operating companies (target) sectors, respectively (4455; 4.3%).
Lastly, during 2014–2016 (period 5), the subgroups that participated most actively as a buyer was asset management and custody banks (15,851; 15.0%), followed by real estate operating companies (5140; 4.9%). The most actively targeted subgroup in M&A transactions were real estate operating companies (20,660; 19.6%), followed by internet software and services (5627; 5.3%). The subgroups that traded the most were asset management and custody banks (buyer) and real estate operating companies (target), respectively (5930; 5.6%).
7. Discussion and Conclusions
Companies that seek to diversify their business are looking for opportunities in new markets by considering core competencies. However, companies are struggling to diversify and grow their businesses due to a lack of information and opportunities for diversification and a low level of capability for actual commercialization. Therefore, we need to develop a practical and usable methodology that can explore new business opportunities for growth in the future. The objective of this paper is to suggest a new methodology that can recommend promising industry and technology areas using M&A transaction data.
The contents of the study are as follows.
Firstly, we analyzed theoretically whether all M&A transactions are related to promising areas. Companies try to gain new growth momentum in the future and enter promising industries and technologies through “growth” and “innovation”. Based on a literature review, we found that companies are seeking “growth” and “innovation” by securing technological capability and growth engines through M&As and improving productivity, thereby entering into promising industry and technology areas. As a result of examining the purpose of M&As and types of M&A transactions, we argue that most M&A transactions are helpful for finding promising areas. In sum, the key argument we propose is that M&A transaction data can be a good steppingstone for finding promising areas, not that all M&A transaction data are promising.
Companies seek out promising industries, markets, and technology with M&As and constantly strive to explore sustainability and gain new growth engines.
Secondly, we extracted M&A data at the highest level (level 1) of S&P Capital IQ’s industry segment and then conducted a time-series analysis of M&A transactions. Specifically, we showed the analysis results for cumulative M&A transactions based on the number of M&A transactions by sectors over the last 15 years (2002–2016). Further, we analyzed and compared the relative number of M&A transactions of each period for each sector.
Thirdly, we conducted association analysis to analyze the M&A relationships between industry and technology areas: sector to sector analysis and subgroup to subgroup analysis. We showed the results of sector-to-sector association analysis at the top level (level 1) for a total of 433,888 deals. We constructed an m (Buyer) × n (Target) matrix to analyze the relationships between sectors. Then, we conducted an association analysis between sectors for the entire period and for each of the three-year periods (2002~2004, 2005~2007, 2008~2010, 2011~2013, and 2014~2016). We found the sectors that participated most actively as buyers and sellers over the whole period and each three-year period. The sectors that traded the most over the whole period in terms of buyer’s perspective were financials, which accounted for 19.5% of the total transactions, followed by industrials (17.7%), and consumer discretionary (14.7%). As for the target, industrials (18.5%) showed the largest volume of transactions, followed by consumer discretionary (17.6%) and information technology (14.9%), respectively. Furthermore, we suggested the results of association analysis between sub-industries (level 4). A total of 433,327 transactions were made between 157 buyers and 157 target sub-industries during the entire 15-year period. The sub-industry with the largest number of M&A transactions was between asset management and custody banks (buyer) and real estate operating companies (target). A total of 13,862 transactions were conducted, which accounted for 3.2% of all M&A transactions between subgroups over the whole period. In addition, we found the subgroups that participated most actively as buyers and sellers over the whole period and each period of three years, respectively.
The possible uses of the research results derived from this study are as follows. First, the analysis results based on M&A transaction information, among various open innovation activities, can be used as data for discovering promising industry and technology areas. Second, by comparing the analysis results of each period, it is possible to grasp overall trends in promising industries and sub-industries. This information will be useful for R&D policymakers and investment bankers who need to decide on promising industries to cultivate or invest in, and researchers who want to find promising industry and technology areas and trends in an industry. The classification tree of S&P has nine levels for each industry. It uses a representative word for an industry as it goes to the upper level, and a word that represents a specific industrial classification or technology area at a further subdivided level. By extending the association analysis presented in this study to a lower level, it is possible to generate more sophisticated analysis results by analyzing the relationships between industries, sub-industries, and even technology areas. Having said that, data availability remains a limitation and this calls for future studies to identify promising areas more efficiently.
Author Contributions
Conceptualization, J.C. and Y.S.C.; Methodology, J.C. and Y.S.C.; Software, Y.S.C. and J.C.; Validation, J.C., Y.S.C. and S.C.; Formal Analysis, J.C. and Y.S.C.; Investigation, J.C., Y.S.C. and S.C.; Resources, J.C., Y.S.C. and S.C.; Data Curation, Y.S.C. and J.C.; Writing-Original Draft Preparation, J.C. and Y.S.C. and S.C.; Writing-Review & Editing, J.C. and Y.S.C. and S.C.; Visualization, J.C. and Y.S.C.; Supervision, J.C. and S.C.; Project Administration, J.C.; Funding Acquisition, J.C. and Y.S.C. All authors have read and agreed to the published version of the manuscript.
Funding
This work was supported by the Ministry of Education of the Republic of Korea and the National Research Foundation of Korea (NRF-2019S1A5A2A03049194).
Conflicts of Interest
The authors declare no conflict of interest. The funders had no role in the design of the study; in the collection, analyses, or interpretation of data; in the writing of the manuscript, or in the decision to publish the results.
References
- Markides, C.C. To Diversify or Not to Diversify. Harv. Bus. Rev. 1997, 75, 93–99. [Google Scholar]
- Wulf, J. Influence and inefficiency in the internal capital market. J. Econ. Behav. Organ. 2009, 72, 305–321. [Google Scholar] [CrossRef]
- Berg, J. Corporate Diversification and Firm Performance: The Effect of the Global Financial Crisis on Diversification in India; University of Groningen: Groningen, The Netherlands, 2016. [Google Scholar]
- Council, N.R. Persistent Forecasting of Disruptive Technologies; The National Academies Press: Washington, DC, USA, 2010. [Google Scholar]
- Cho, Y.; Daim, T.U. Technology Forecasting Methods. In Research and Technology Management in the Electricity Industry: Methods, Tools and Case Studies; Daim, T., Oliver, T., Kim, J., Eds.; Springer: London, UK, 2013; pp. 67–112. [Google Scholar]
- Kavanagh, S.; Williams, D. Making the best use of judgmental forecasting. Gov. Financ. Rev. 2014, 8–16. [Google Scholar]
- Narin, F. Patent Bibliometrics. Scientometrics 1994, 30, 147–155. [Google Scholar] [CrossRef]
- Rodriguez, A.; Tosyali, A.; Kim, B.; Choi, J.; Lee, J.; Coh, B.; Jeong, M.K. Patent clustering and outlier ranking methodologies for attributed patent citation networks for technology opportunity discovery. IEEE Trans. Eng. Manag. 2016, 63, 426–437. [Google Scholar] [CrossRef]
- Shibata, N.; Kajikawa, Y.; Takeda, Y.; Matsushima, K. Comparative study on methods of detecting research. J. Am. Soc. Inf. Sci. Technol. 2009, 60, 571–580. [Google Scholar] [CrossRef]
- Mitchell, V.W. Using delphi to forecast in new technology industries. Mark. Intell. Plan. 1992, 10, 4–9. [Google Scholar] [CrossRef]
- Stewart, T.R. The delphi technique and judgmental forecasting. Clim. Chang. 1987, 11, 97–113. [Google Scholar] [CrossRef]
- Caviggioli, F. Technology fusion: Identification and analysis of the drivers of technology convergence using patent data. Technovation 2016, 55–56, 22–32. [Google Scholar] [CrossRef]
- Yoon, B.; Jeong, Y. Development of patent roadmap based on technology roadmap by analyzing patterns of patent development. Technovation 2015, 39–40, 37–52. [Google Scholar]
- Norton, M.J. Introductory Concepts in Information Science; Information Today, Inc.: Medford, NJ, USA, 2001. [Google Scholar]
- Daim, T.U.; Rueda, G.; Martin, H.; Gerdsri, P. Forecasting emerging technologies: Use of bibliometrics and patent analysis. Technol. Forecast. Soc. Chang. 2006, 73, 981–1012. [Google Scholar] [CrossRef]
- Morris, S.; DeYong, C.; Wu, Z.; Salman, S.; Yemenu, D. A visualization system for exploring document databases for technology forecasting. Comput. Ind. Eng. 2002, 43, 841–862. [Google Scholar] [CrossRef]
- Han, K.; Shin, J. A systematic way of identifying and forecasting technological reverse salients using QFD, bibliometrics, and trend impact analysis: A carbon nanotube biosensor case. Technovation 2014, 34, 559–570. [Google Scholar] [CrossRef]
- Kostoff, R.N. Database tomography: Multidisciplinary research thrusts from co-word analysis. In Proceedings of the Portland International Conference on Management of Engineering and Technology, Portland, OR, USA, 27–31 October 1991; pp. 27–31. [Google Scholar]
- Kostoff, R.N. Database tomography: Origins and duplications. Compet. Intell. Rev. 1994, 5, 48–55. [Google Scholar] [CrossRef]
- Leeds. Available online: Goo.gl/gZ61eW (accessed on 26 January 2018).
- IEEE. Editorial: Bibliometrics. IEEE J. Ocean. Eng. 2014, 39, 405–406. [Google Scholar] [CrossRef] [Green Version]
- Daim, T.; Monalisa, M.; Dash, P.; Brown, N. Time lag assessment between research funding and output in emerging technologies. Foresight 2007, 9, 33–44. [Google Scholar] [CrossRef]
- Liner, E. What’s Behind the All-Time High in M&A? Available online: https://corpgov.law.harvard.edu/2016/03/16/whats-behind-the-all-time-high-in-ma (accessed on 25 October 2018).
- Majaski, C. What Is the Difference Between Mergers and Acquisitions? Available online: https://www.investopedia.com/ask/answers/021815/what-difference-between-merger-and-acquisition.asp (accessed on 13 December 2018).
- Armour, J.; Skeel, D.A. Who writes the rules for hostile takeovers, and why? The peculiar divergence of US and UK takeover regulation. Georget. Law J. 2007, 95, 1727–1794. [Google Scholar]
- Cleverism. A Historical Analysis of M&A Waves. Available online: https://www.cleverism.com/historical-analysis-ma-waves-mergers-acquisition (accessed on 14 December 2018).
- Mantravadi, P.; Reddy, A.V. Post-Merger performance of acquiring firms from different industries in India. Int. Res. J. Financ. Econ. 2008, 22, 192–204. [Google Scholar]
- Gupta, P.K. Mergers and Acquisitions (M&A): The strategic concepts for the nuptials of corporatie sector. Innov. J. Bus. Manag. 2012, 1, 60–68. [Google Scholar]
- Cassiman, B.; Colombo, M.G.; Garrone, P.; Veugelers, R. The impact of M&A on the R&D process: An empirical analysis of the role of technological- and market-relatedness. Res. Policy 2005, 34, 195–220. [Google Scholar]
- Bower, J.L. Not All M&As Are Alike—And That Matters. Harv. Bus. Rev. 2001, 79, 92–101. [Google Scholar] [PubMed]
- Colombo, M.G.; Garrone, P. The sample of M&A: Descriptive statistics. In Mergers & Acquisitions: The Innovation Impact; Cassiman, B.C., Massimo, G., Eds.; Edward Elgar Publishing: Cheltenham, UK, 2006. [Google Scholar]
- Kishore, R.M. Strategic Financial Management: Comprehensive Text Book with Case Studies; Taxmann: New Delhi, India, 2011. [Google Scholar]
- Cefis, E. The impact of M&A on technology sourcing strategies. Econ. Innov. New Technol. 2010, 19, 27–51. [Google Scholar]
- De Jong, H.W. Theory and evidence concerning mergers: An international comparison. In Markets, Corporate Behaviour and the State; Jacquemin, A.P., De Jong, H.W., Eds.; NijhoÚ: The Hague, The Netherlands, 1976; pp. 81–90. [Google Scholar]
- Hagedoorn, J.; Duysters, G. The effect of mergers and acquisitions on the technological performance of companies in a high-tech environment. Technol. Anal. Strateg. Manag. 2002, 14, 67–85. [Google Scholar] [CrossRef]
- Stellner, F. The Impact of Technological Distance on M&A Target Choice and Transaction Value (Sept. 1, 2015). In Technological Distance: Theoretical Foundations, Statistical Analysis and Application to Mergers and Acquisitions; Stellner, F., Ed.; Max Planck Institute for Innovation & Competition Research Paper No. 15-12; BoD: Norderstedt, Germany, 2015; pp. 91–143. [Google Scholar]
- Capron, L.; Mitchell, W. Selection capability: How capability gaps and internal social frictions affect internal and external strategic renewal. Organ. Sci. 2009, 20, 294–312. [Google Scholar] [CrossRef] [Green Version]
- Hussinger, K. On the importance of technological relatedness: SMEs versus large acquisition targets. Technovation 2010, 30, 57–64. [Google Scholar] [CrossRef]
- Valentini, G.D.; Guardo, M.C. M&A and the profile of inventive activity. Strateg. Organ. 2012, 10, 384–405. [Google Scholar]
- Graebner, M.E.; Eisenhardt, K.M.; Roundy, P.T. Success and failure in technology acquisitions: Lessons for buyers and sellers. Acad. Manag. Perspect. 2010, 24, 73–92. [Google Scholar]
- Ranft, M.L. Acquiring new knowledge: The role of retaining human capital in acquisitions of high-tech firms. J. High Technol. Manag. Res. 2000, 11, 295–319. [Google Scholar] [CrossRef]
- Graebner, M.E. Momentum and serendipity: How acquired leaders create value in the integration of technology firms. Strateg. Manag. J. 2004, 25, 751–777. [Google Scholar] [CrossRef]
- Mensah, E.; Onumah, J.M. Mergers and acquisitions in the era of globalization: The ghanaian experience. J. Account. Financ. 2017, 17, 96–114. [Google Scholar]
- Motis, J. Mergers and Acquisitions Motives; Toulouse School of Economics-EHESS (GREMAQ) and University of Crete: Heraklion, Greece, 2007. [Google Scholar]
- Arvanitis, S.; Stucki, T. How Swiss small and medium-sized firms assess the performance impact of mergers and acquisitions. Small Bus. Econ. 2014, 42, 339–360. [Google Scholar] [CrossRef] [Green Version]
- Yourdictionary. Available online: goo.gl/qMUEV7 (accessed on 23 February 2018).
- Newman, D. Innovation Vs. Transformation: The Difference in A Digital World. Available online: goo.gl/U115Qw (accessed on 16 February 2018).
- Trautwein, F. Merger motives and merger prescriptions. Strateg. Manag. J. 1990, 11, 283–295. [Google Scholar] [CrossRef]
- Mallikarjunappa, T.; Nayak, P. Why do mergers and acquisitions quite often fail? AIMS Int. 2007, 1, 53–69. [Google Scholar]
- Liu, Q.; Qiu, L.D. Characteristics of acqduirers and targets in domestic and cross-border mergers and aquisitions. Rev. Dev. Econ. 2013, 17, 474–493. [Google Scholar] [CrossRef]
- Banerjee, T.; Nayak, A. Comparing Domestic and Cross-Border Mergers and Acquisitions in the Pharmaceutical Industry. Atl. Econ. J. 2015, 43, 489–499. [Google Scholar] [CrossRef]
- Zarin, S.; Yang, E. Mergers & Acquisitions: Hostile Takeovers and Defense Strategies against Them. Bachelor’s Thesis, University of Gothenburg, Gothenburg, Sweden, 2011. [Google Scholar]
- Damodaran, A. Investment Valuation: Tools and Techniques for Determining the Value of Any Asset, University Edition; John Wiley & Sons: Hoboken, NJ, USA, 2012. [Google Scholar]
- Prabhu, J.C.; Chandy, R.K.; Ellis, M.E. The impact of acquisitions on Innovation: Poison pill, placebo, or tonic? J. Mark. 2005, 69, 114–130. [Google Scholar] [CrossRef]
- S&P. S&P Capital IQ. 2017. Available online: https://www. capitaliq. com (accessed on 22 December 2017).
- GICS. Global Industry Classification Standard. Available online: goo.gl/qMUEV7 (accessed on 22 December 2017).
- Langager, C. What is the Difference between an Industry and a Sector? Available online: goo.gl/T6RN2d (accessed on 12 April 2019).
- Hicks, D. Structural change and industrial classification. Struct. Chang. Econ. Dyn. 2011, 22, 93–105. [Google Scholar] [CrossRef]
- Theil, H. A Rank-Invariant Method of Linear and Polynomial Regression Analysis, I, II and III; Koninklijke Nederlandse Akademie van Wetenschappen: Amsterdam, The Nederlands, 1950. [Google Scholar]
- Hess, A.; Patterson, P.; Lyer, H. A SAS Macro for Theil Regression. 2002. Available online: bit.ly/2MmOmhD (accessed on 17 May 2019).
- Nakata, K. A cognitive perspective on social informatics. Int. J. Soc. Humanist. Comput. 2008, 1, 28–35. [Google Scholar] [CrossRef]
Figure 1.
The number of M&A transactions worldwide from 2002 to 2016.

Figure 2.
M&A purposes/motives.

Figure 3.
Cumulative number of M&A transactions by sectors.

Figure 4.
Relative number of M&A transactions by each sub-industry.


Table 1.
Theil’s regression analysis of the cumulative number of M&A transactions by sector.
| Sectors | Regression Coefficient | p-Value |
|---|---|---|
| Consumer Discretionary | 17,065 | 0.027 * |
| Consumer Staples | 5018 | 0.027 * |
| Energy | 4429 | 0.027 * |
| Financials | 7339 | 0.027 * |
| Healthcare | 6697 | 0.027 * |
| Industrials | 18,269 | 0.027 * |
| Information Technology | 13,978 | 0.027 * |
| Materials | 7937 | 0.027 * |
| Real Estate | 13,790 | 0.027 * |
| Telecommunication Services | 1154 | 0.027 * |
| Utilities | 2257 | 0.027 * |
* p < 0.1.
Table 2.
Inter-sector (Level 1) association analysis over the entire period (Number of M&A Deals).
| Target Sectors | Consumer Discretionary | Consumer Staples | Energy | Financials | Healthcare | Industrials | Information Technology | Materials | Real Estate | Telecommuni-cation Services | Utilities | Total | |
|---|---|---|---|---|---|---|---|---|---|---|---|---|---|
| Buyer Sectors | |||||||||||||
| Consumer Discretionary | Period 1 | 4553 | 98 | 16 | 106 | 77 | 469 | 541 | 101 | 78 | 50 | 3 | 6092 |
| Period 2 | 10,528 | 266 | 62 | 179 | 116 | 1154 | 1359 | 311 | 244 | 111 | 18 | 14,348 | |
| Period 3 | 9269 | 290 | 59 | 166 | 121 | 1059 | 1181 | 272 | 519 | 74 | 41 | 13,051 | |
| Period 4 | 10,382 | 313 | 58 | 130 | 148 | 1101 | 1513 | 268 | 1175 | 64 | 34 | 15,186 | |
| Period 5 | 10,080 | 325 | 47 | 147 | 165 | 1123 | 1702 | 191 | 1235 | 55 | 42 | 15,112 | |
| 15 years | 44,812 | 1219 | 242 | 728 | 627 | 4906 | 6296 | 1143 | 3251 | 354 | 138 | 63,789 | |
| Consumer Staples | Period 1 | 233 | 1590 | 5 | 24 | 63 | 96 | 35 | 57 | 14 | 0 | 9 | 2126 |
| Period 2 | 566 | 3667 | 32 | 62 | 180 | 265 | 38 | 149 | 65 | 5 | 8 | 5037 | |
| Period 3 | 556 | 3368 | 13 | 53 | 135 | 308 | 46 | 118 | 126 | 0 | 11 | 4734 | |
| Period 4 | 571 | 3617 | 24 | 47 | 144 | 286 | 38 | 121 | 164 | 6 | 17 | 5035 | |
| Period 5 | 402 | 3335 | 21 | 36 | 123 | 172 | 45 | 100 | 118 | 0 | 14 | 4366 | |
| 15 years | 2328 | 15,577 | 95 | 222 | 645 | 1127 | 202 | 545 | 487 | 11 | 59 | 21,298 | |
| Energy | Period 1 | 76 | 7 | 1358 | 56 | 9 | 184 | 66 | 96 | 6 | 9 | 77 | 1944 |
| Period 2 | 153 | 35 | 3302 | 86 | 19 | 543 | 90 | 251 | 8 | 9 | 162 | 4658 | |
| Period 3 | 147 | 19 | 3222 | 66 | 15 | 459 | 75 | 234 | 62 | 5 | 161 | 4465 | |
| Period 4 | 142 | 20 | 3388 | 41 | 11 | 414 | 63 | 235 | 87 | 4 | 163 | 4568 | |
| Period 5 | 84 | 16 | 2189 | 33 | 3 | 258 | 35 | 167 | 66 | 6 | 91 | 2948 | |
| 15 years | 602 | 97 | 13,459 | 282 | 57 | 1858 | 329 | 983 | 229 | 33 | 654 | 18,583 | |
| Financials | Period 1 | 1131 | 286 | 88 | 3875 | 300 | 1167 | 749 | 329 | 441 | 94 | 78 | 8538 |
| Period 2 | 2812 | 616 | 237 | 6736 | 677 | 2737 | 1341 | 856 | 1688 | 145 | 246 | 18,091 | |
| Period 3 | 1797 | 483 | 282 | 6112 | 615 | 2216 | 1086 | 630 | 2435 | 93 | 267 | 16,016 | |
| Period 4 | 2137 | 552 | 294 | 6194 | 761 | 2359 | 1237 | 697 | 5003 | 93 | 390 | 19,717 | |
| Period 5 | 2238 | 678 | 291 | 6219 | 911 | 2473 | 1695 | 795 | 6471 | 119 | 449 | 22,339 | |
| 15 years | 10,115 | 2615 | 1192 | 29,136 | 3264 | 10,952 | 6108 | 3307 | 16,038 | 544 | 1430 | 84,701 | |
| Healthcare | Period 1 | 120 | 63 | 9 | 121 | 2306 | 178 | 237 | 42 | 5 | 5 | 1 | 3087 |
| Period 2 | 220 | 140 | 15 | 110 | 4394 | 253 | 284 | 108 | 25 | 8 | 4 | 5561 | |
| Period 3 | 207 | 157 | 24 | 83 | 4468 | 253 | 211 | 123 | 40 | 3 | 3 | 5572 | |
| Period 4 | 188 | 138 | 19 | 92 | 5188 | 221 | 190 | 83 | 95 | 9 | 4 | 6227 | |
| Period 5 | 184 | 199 | 14 | 91 | 5731 | 235 | 202 | 111 | 115 | 4 | 1 | 6887 | |
| 15 years | 919 | 697 | 81 | 497 | 22,087 | 1140 | 1124 | 467 | 280 | 29 | 13 | 27,334 | |
| Industrials | Period 1 | 836 | 69 | 84 | 221 | 98 | 4210 | 760 | 353 | 79 | 67 | 72 | 6849 |
| Period 2 | 2015 | 229 | 277 | 388 | 241 | 11,022 | 1439 | 1073 | 261 | 66 | 230 | 17,241 | |
| Period 3 | 1751 | 215 | 269 | 323 | 284 | 10,966 | 1309 | 983 | 474 | 54 | 246 | 16,874 | |
| Period 4 | 1718 | 228 | 317 | 333 | 294 | 11,827 | 1339 | 968 | 765 | 43 | 330 | 18,162 | |
| Period 5 | 1555 | 226 | 290 | 344 | 272 | 11,374 | 1623 | 841 | 714 | 45 | 248 | 17,532 | |
| 15 years | 7875 | 967 | 1237 | 1609 | 1189 | 49,399 | 6470 | 4218 | 2293 | 275 | 1126 | 76,658 | |
| Information Technology | Period 1 | 441 | 6 | 19 | 221 | 92 | 580 | 5300 | 46 | 17 | 188 | 6 | 6916 |
| Period 2 | 943 | 21 | 51 | 264 | 161 | 1075 | 8995 | 139 | 43 | 310 | 22 | 12,024 | |
| Period 3 | 834 | 17 | 28 | 230 | 182 | 919 | 7991 | 152 | 52 | 216 | 35 | 10,656 | |
| Period 4 | 928 | 31 | 43 | 227 | 203 | 1101 | 8998 | 153 | 111 | 174 | 60 | 12,029 | |
| Period 5 | 1064 | 37 | 47 | 221 | 247 | 1054 | 9737 | 134 | 88 | 143 | 62 | 12,834 | |
| 15 years | 4210 | 112 | 188 | 1163 | 885 | 4729 | 41,021 | 624 | 311 | 1031 | 185 | 54,459 | |
| Materials | Period 1 | 203 | 64 | 62 | 74 | 53 | 294 | 85 | 2012 | 11 | 3 | 22 | 2883 |
| Period 2 | 423 | 123 | 355 | 95 | 115 | 813 | 126 | 5280 | 39 | 6 | 67 | 7442 | |
| Period 3 | 381 | 116 | 317 | 129 | 97 | 757 | 101 | 5489 | 102 | 3 | 56 | 7548 | |
| Period 4 | 326 | 137 | 260 | 93 | 124 | 769 | 99 | 5292 | 111 | 1 | 72 | 7284 | |
| Period 5 | 200 | 130 | 141 | 72 | 131 | 805 | 116 | 4161 | 121 | 4 | 42 | 5923 | |
| 15 years | 1533 | 570 | 1135 | 463 | 520 | 3438 | 527 | 22,234 | 384 | 7 | 259 | 31,080 | |
| Real Estate | Period 1 | 240 | 26 | 0 | 78 | 29 | 99 | 41 | 9 | 1022 | 7 | 2 | 1553 |
| Period 2 | 854 | 68 | 14 | 125 | 94 | 326 | 97 | 56 | 3406 | 11 | 14 | 5065 | |
| Period 3 | 496 | 63 | 15 | 125 | 127 | 353 | 90 | 40 | 5293 | 3 | 22 | 6627 | |
| Period 4 | 818 | 87 | 17 | 119 | 280 | 588 | 91 | 52 | 10,714 | 9 | 29 | 12,804 | |
| Period 5 | 718 | 74 | 11 | 143 | 331 | 361 | 116 | 31 | 13,364 | 15 | 21 | 15,185 | |
| 15 years | 3126 | 318 | 57 | 590 | 861 | 1727 | 435 | 188 | 33,799 | 45 | 88 | 41,234 | |
| Telecom Services | Period 1 | 73 | 2 | 0 | 15 | 3 | 22 | 344 | 2 | 5 | 532 | 0 | 998 |
| Period 2 | 188 | 3 | 9 | 26 | 8 | 39 | 520 | 6 | 6 | 1059 | 7 | 1871 | |
| Period 3 | 138 | 1 | 8 | 13 | 5 | 49 | 388 | 4 | 9 | 744 | 3 | 1362 | |
| Period 4 | 120 | 6 | 6 | 16 | 6 | 39 | 309 | 6 | 11 | 607 | 3 | 1129 | |
| Period 5 | 119 | 3 | 2 | 11 | 5 | 37 | 339 | 1 | 10 | 516 | 3 | 1046 | |
| 15 years | 638 | 15 | 25 | 81 | 27 | 186 | 1900 | 19 | 41 | 3458 | 16 | 6406 | |
| Utilities | Period 1 | 22 | 1 | 105 | 22 | 3 | 68 | 19 | 13 | 2 | 12 | 606 | 873 |
| Period 2 | 42 | 9 | 148 | 15 | 6 | 236 | 33 | 40 | 13 | 14 | 1227 | 1783 | |
| Period 3 | 43 | 4 | 168 | 37 | 3 | 253 | 45 | 33 | 25 | 7 | 1347 | 1965 | |
| Period 4 | 42 | 9 | 154 | 12 | 4 | 234 | 44 | 15 | 28 | 1 | 1400 | 1943 | |
| Period 5 | 35 | 8 | 116 | 24 | 3 | 206 | 49 | 21 | 20 | 2 | 1298 | 1782 | |
| 15 years | 184 | 31 | 691 | 110 | 19 | 997 | 190 | 122 | 88 | 36 | 5878 | 8346 | |
| Total | Period 1 | 7928 | 2212 | 1746 | 4813 | 3033 | 7367 | 8177 | 3060 | 1680 | 967 | 876 | 41859 |
| Period 2 | 18,744 | 5177 | 4502 | 8086 | 6011 | 18,463 | 14,322 | 8269 | 5798 | 1744 | 2005 | 93,121 | |
| Period 3 | 15,619 | 4733 | 4405 | 7337 | 6052 | 17,592 | 12,523 | 8078 | 9137 | 1202 | 2192 | 88,900 | |
| Period 4 | 17,372 | 5138 | 4580 | 7304 | 7163 | 18,939 | 13,921 | 7890 | 18,264 | 1011 | 2502 | 104,105 | |
| Period 5 | 16,679 | 5031 | 3169 | 7341 | 7922 | 18,098 | 15,659 | 6553 | 22,322 | 909 | 2271 | 105,959 | |
| 15 years | 76,342 | 22,291 | 18,402 | 34,881 | 30,181 | 80,459 | 64,602 | 33,850 | 57,201 | 5833 | 9846 | 433,888 |
Table 3.
Inter-sub industries (Level 4) association analysis for each period.
| Period | Ranking | Buyer | Target |
|---|---|---|---|
| Sub-Industry (Number of Transaction; %) | Sub-Industry (Number of Transaction; %) | ||
| Period 1 (2002–2004) | 1 | Asset Management and Custody Banks (4313; 10.3%) | Application Software (2093; 5.0%) |
| 2 | Application Software (1549; 3.7%) | Internet Software and Services (1926; 4.6%) | |
| 3 | Internet Software and Services (1311; 3.1%) | Real Estate Operating Companies (1171; 2.8%) | |
| 4 | IT Consulting and Other Services (1046; 2.5%) | Packaged Foods and Meats (1075; 2.6%) | |
| 5 | Regional Banks (967; 2.3%) | Industrial Machinery (1003; 2.4%) | |
| Most Transaction | Application Software | Application Software | |
| (731; 1.7%) | |||
| Period 2 (2005–2007) | 1 | Asset Management and Custody Banks (10,615; 11.4%) | Real Estate Operating Companies (4097; 4.4%) |
| 2 | Application Software (2339; 2.5%) | Application Software (3334; 3.6%) | |
| 3 | Packaged Foods and Meats (2324; 2.5%) | Internet Software and Services (3282; 3.5%) | |
| 4 | Internet Software and Services (2253; 2.4%) | Packaged Foods and Meats (2517; 2.7%) | |
| 5 | IT Consulting and Other Services (2243; 2.5%) | Construction and Engineering (2397; 2.6%) | |
| Most Transaction | Packaged Foods and Meats | Packaged Foods and Meats | |
| (1688; 1.8%) | |||
| Period 3 (2008–2010) | 1 | Asset Management and Custody Banks (9478; 10.7%) | Real Estate Operating Companies (7442; 8.4%) |
| 2 | Construction and Engineering (2518; 2.8%) | Internet Software and Services (3444; 3.9%) | |
| 3 | Internet Software and Services (2396; 2.7%) | Construction and Engineering (2690; 3.0%) | |
| 4 | Oil and Gas Exploration and Production (2163; 2.4%) | Application Software (2471; 2.8%) | |
| 5 | Packaged Foods and Meats (2016; 2.3%) | Oil and Gas Exploration and Production (2368; 2.7%) | |
| Most Transaction | Asset Management and Custody Banks | Real Estate Operating Companies | |
| (1930; 2.2%) | |||
| Period 4 (2011–2013) | 1 | Asset Management and Custody Banks (13,263; 12.8%) | Real Estate Operating Companies (16,531; 15.9%) |
| 2 | Real Estate Operating Companies (3722; 3.6%) | Internet Software and Services (4566; 4.4%) | |
| 3 | Real Estate Development (3468; 3.3%) | Application Software (2626; 2.5) | |
| 4 | Internet Software and Service (3209; 3.1%) | Construction and Engineering (2578; 2.5%) | |
| 5 | Construction and Engineering (2683; 2.6%) | Oil and Gas Exploration and Production (2388; 2.3%) | |
| Most Transaction | Asset Management and Custody Banks | Real Estate Operating Companies | |
| (4455; 4.3%) | |||
| Period 5 (2014–2016) | 1 | Asset Management and Custody Banks (15,851; 15.0%) | Real Estate Operating Companies (20,660; 19.6%) |
| 2 | Real Estate Operating Companies (5140; 4.9%) | Internet Software and Services (5627; 5.3%) | |
| 3 | Internet Software and Services (3959; 3.8%) | Application Software (3070; 2.9%) | |
| 4 | Real Estate Development (3844; 3.6%) | Hotels, Resorts and Cruise Lines (2348; 2.2%) | |
| 5 | Application Software (2312; 2.2%) | Construction and Engineering (2347; 2.2%) | |
| Most Transaction | Asset Management and Custody Banks | Real Estate Operating Companies | |
| (5930; 5.6%) | |||
| Whole Period (2002–2016) | 1 | Asset Management and Custody Banks (53,520; 12.4%) | Real Estate Operating Companies (49,901; 11.5%) |
| 2 | Internet Software and Services (13,128; 3.0%) | Internet Software and Services (18,845; 4.3%) | |
| 3 | Real Estate Operating Companies (12,075; 2.8%) | Application Software (13,594; 3.1%) | |
| 4 | Real Estate Development (10,705; 2.5%) | Construction and Engineering (10,787; 2.5%) | |
| 5 | Construction and Engineering (10,310; 2.4%) | Packaged Foods and Meats (10,235; 2.4%) | |
| Most Transaction | Asset Management and Custody Banks | Real Estate Operating Companies | |
| (13,862; 3.2%) | |||
© 2019 by the authors. Licensee MDPI, Basel, Switzerland. This article is an open access article distributed under the terms and conditions of the Creative Commons Attribution (CC BY) license (http://creativecommons.org/licenses/by/4.0/).
Share and Cite
MDPI and ACS Style
Choi, J.; Chung, S.; Chang, Y.S. Is M&A Information Useful for Exploring Promising Industries and Technologies? Sustainability 2020, 12, 139. https://0-doi-org.brum.beds.ac.uk/10.3390/su12010139
AMA Style
Choi J, Chung S, Chang YS. Is M&A Information Useful for Exploring Promising Industries and Technologies? Sustainability. 2020; 12(1):139. https://0-doi-org.brum.beds.ac.uk/10.3390/su12010139
Chicago/Turabian StyleChoi, Jinho, Sunghun Chung, and Yong Sik Chang. 2020. "Is M&A Information Useful for Exploring Promising Industries and Technologies?" Sustainability 12, no. 1: 139. https://0-doi-org.brum.beds.ac.uk/10.3390/su12010139
Note that from the first issue of 2016, this journal uses article numbers instead of page numbers. See further details here.