Cultural Heritage Management Using Remote Sensing Data and GIS Techniques around the Archaeological Area of Ancient Jeddah in Jeddah City, Saudi Arabia

Abstract
:1. Introduction
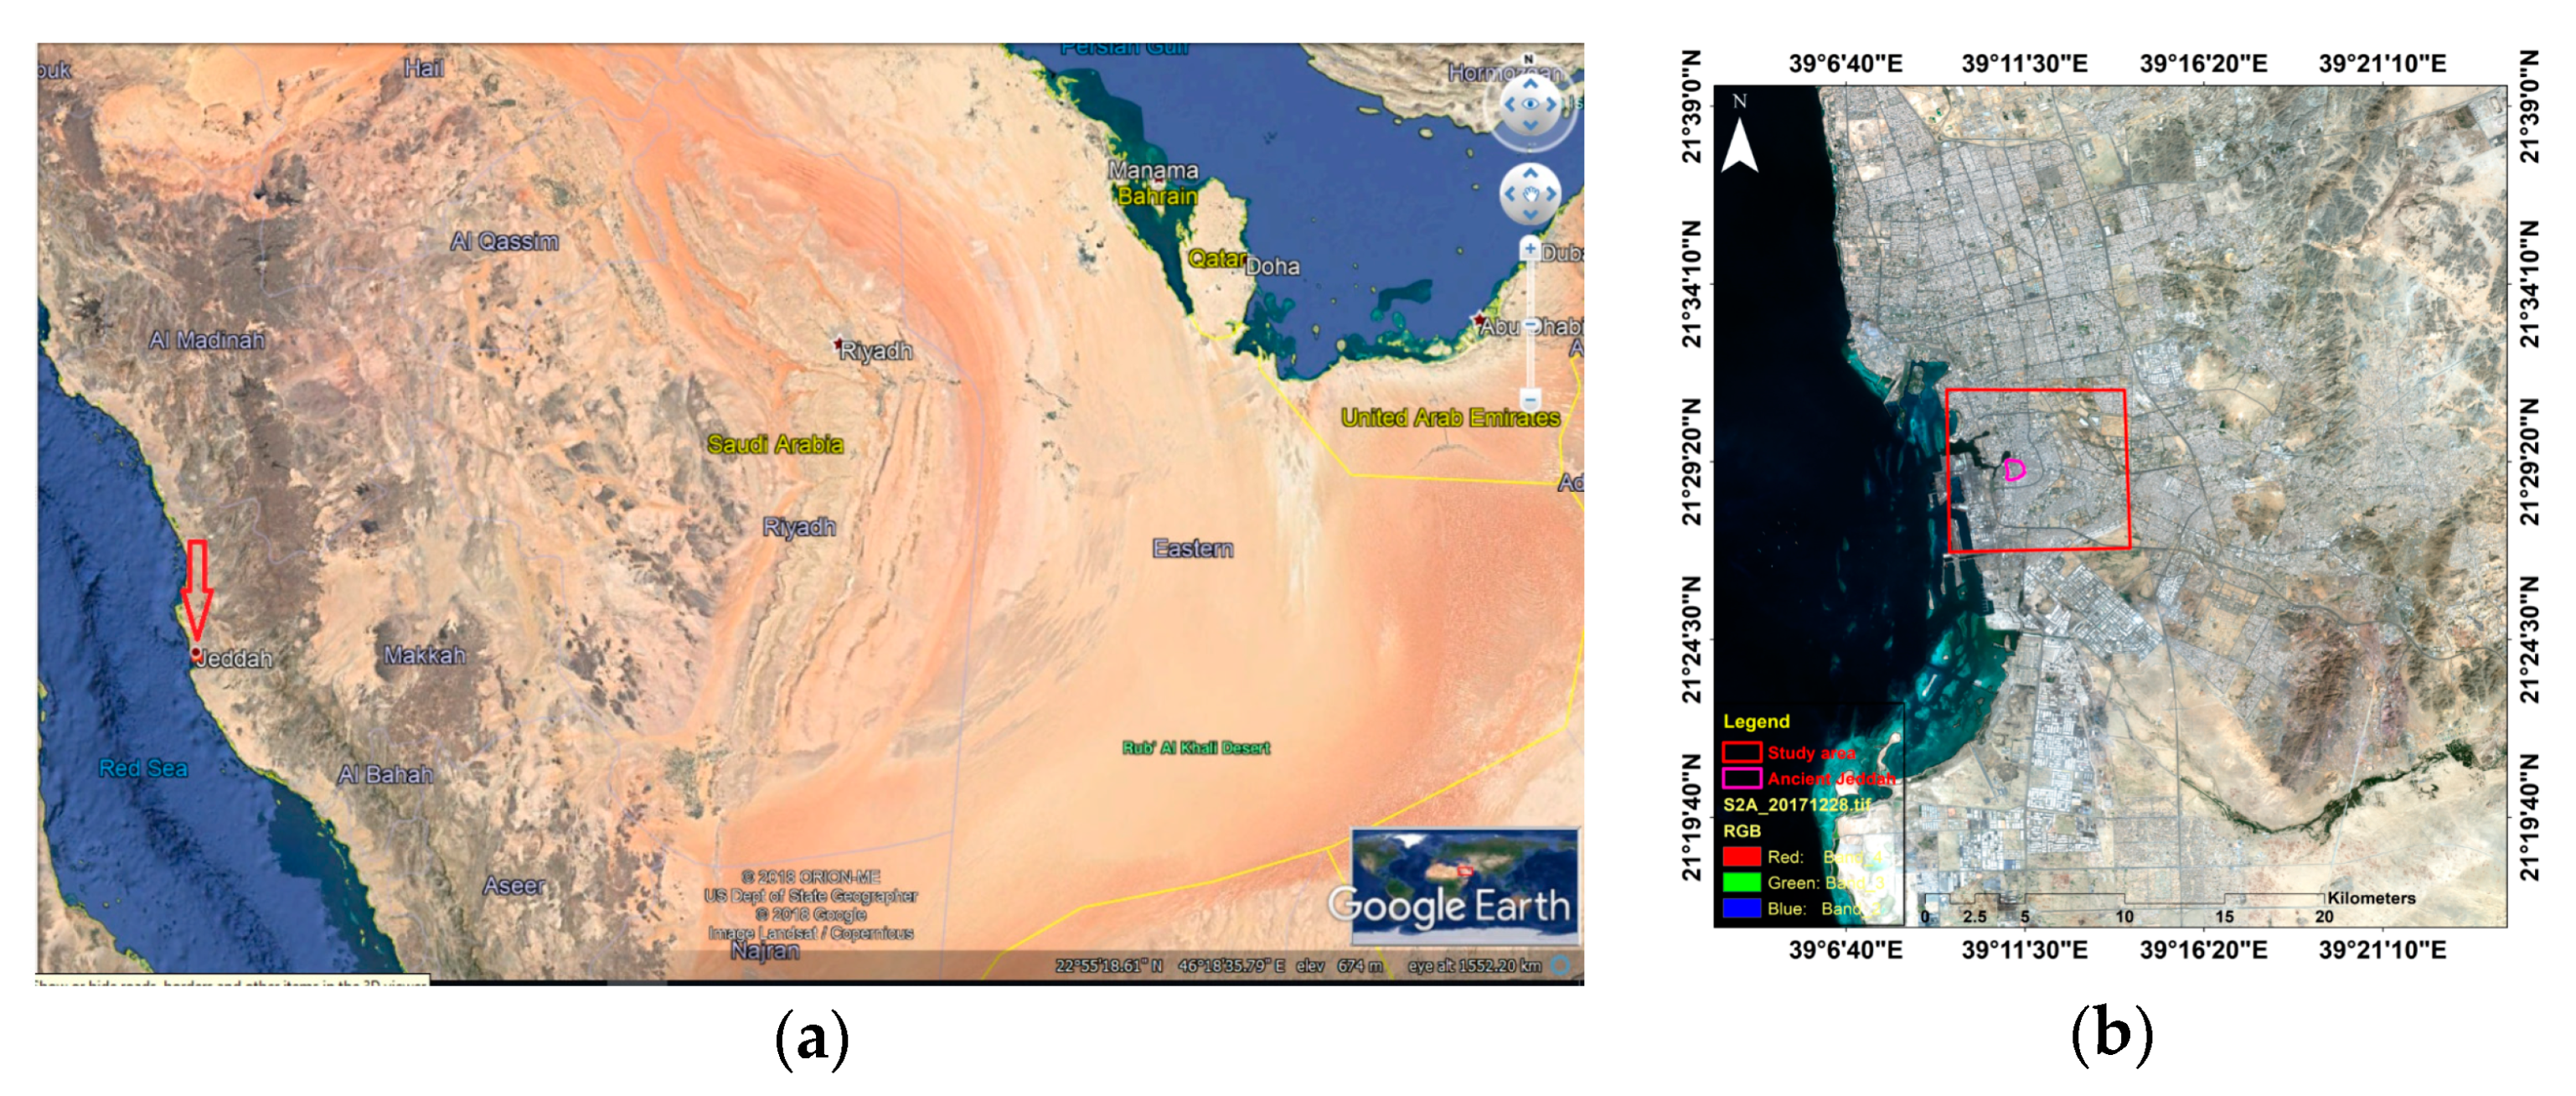
1.1. Study Area
1.2. Archaeological View
1.3. Problem Definition
2. Materials and Methods
2.1. Materials
2.2. Methods
2.2.1. Pre-Processing
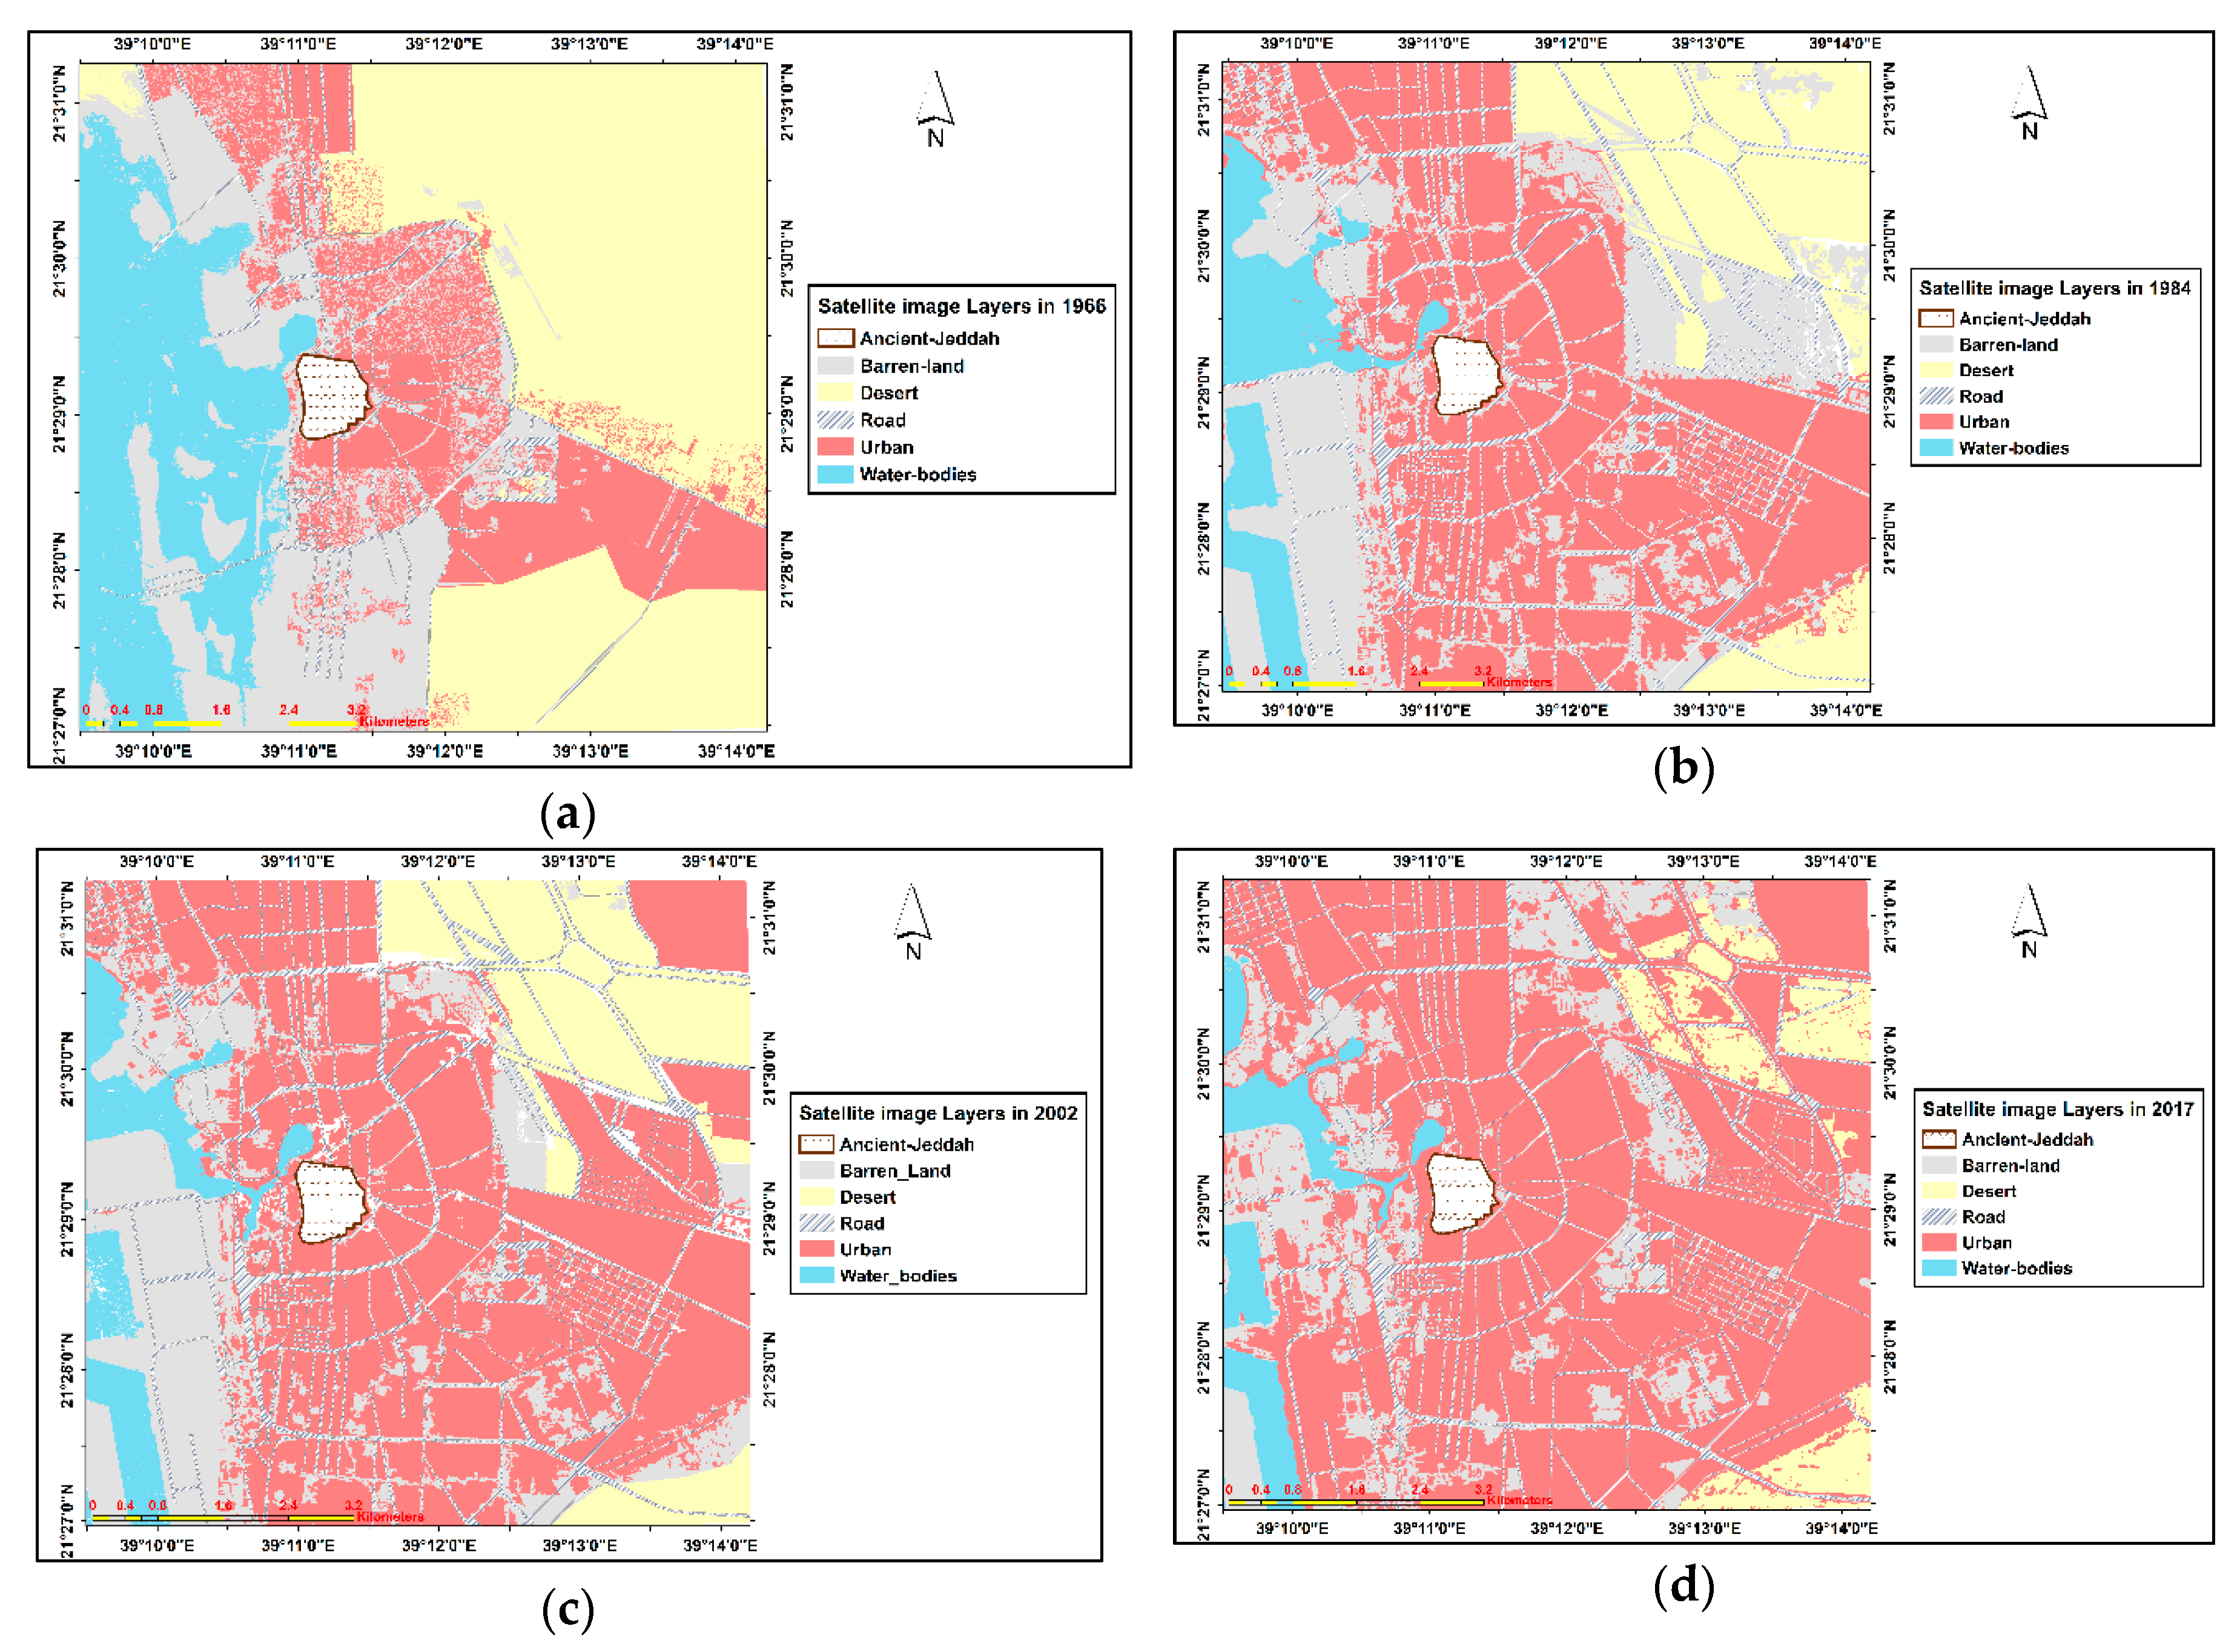
2.2.2. Supervised Classification
2.2.3. Spatial Statistical Analysis (Spatial Distribution Analyzing by Getis-Ord and Hot Spot)
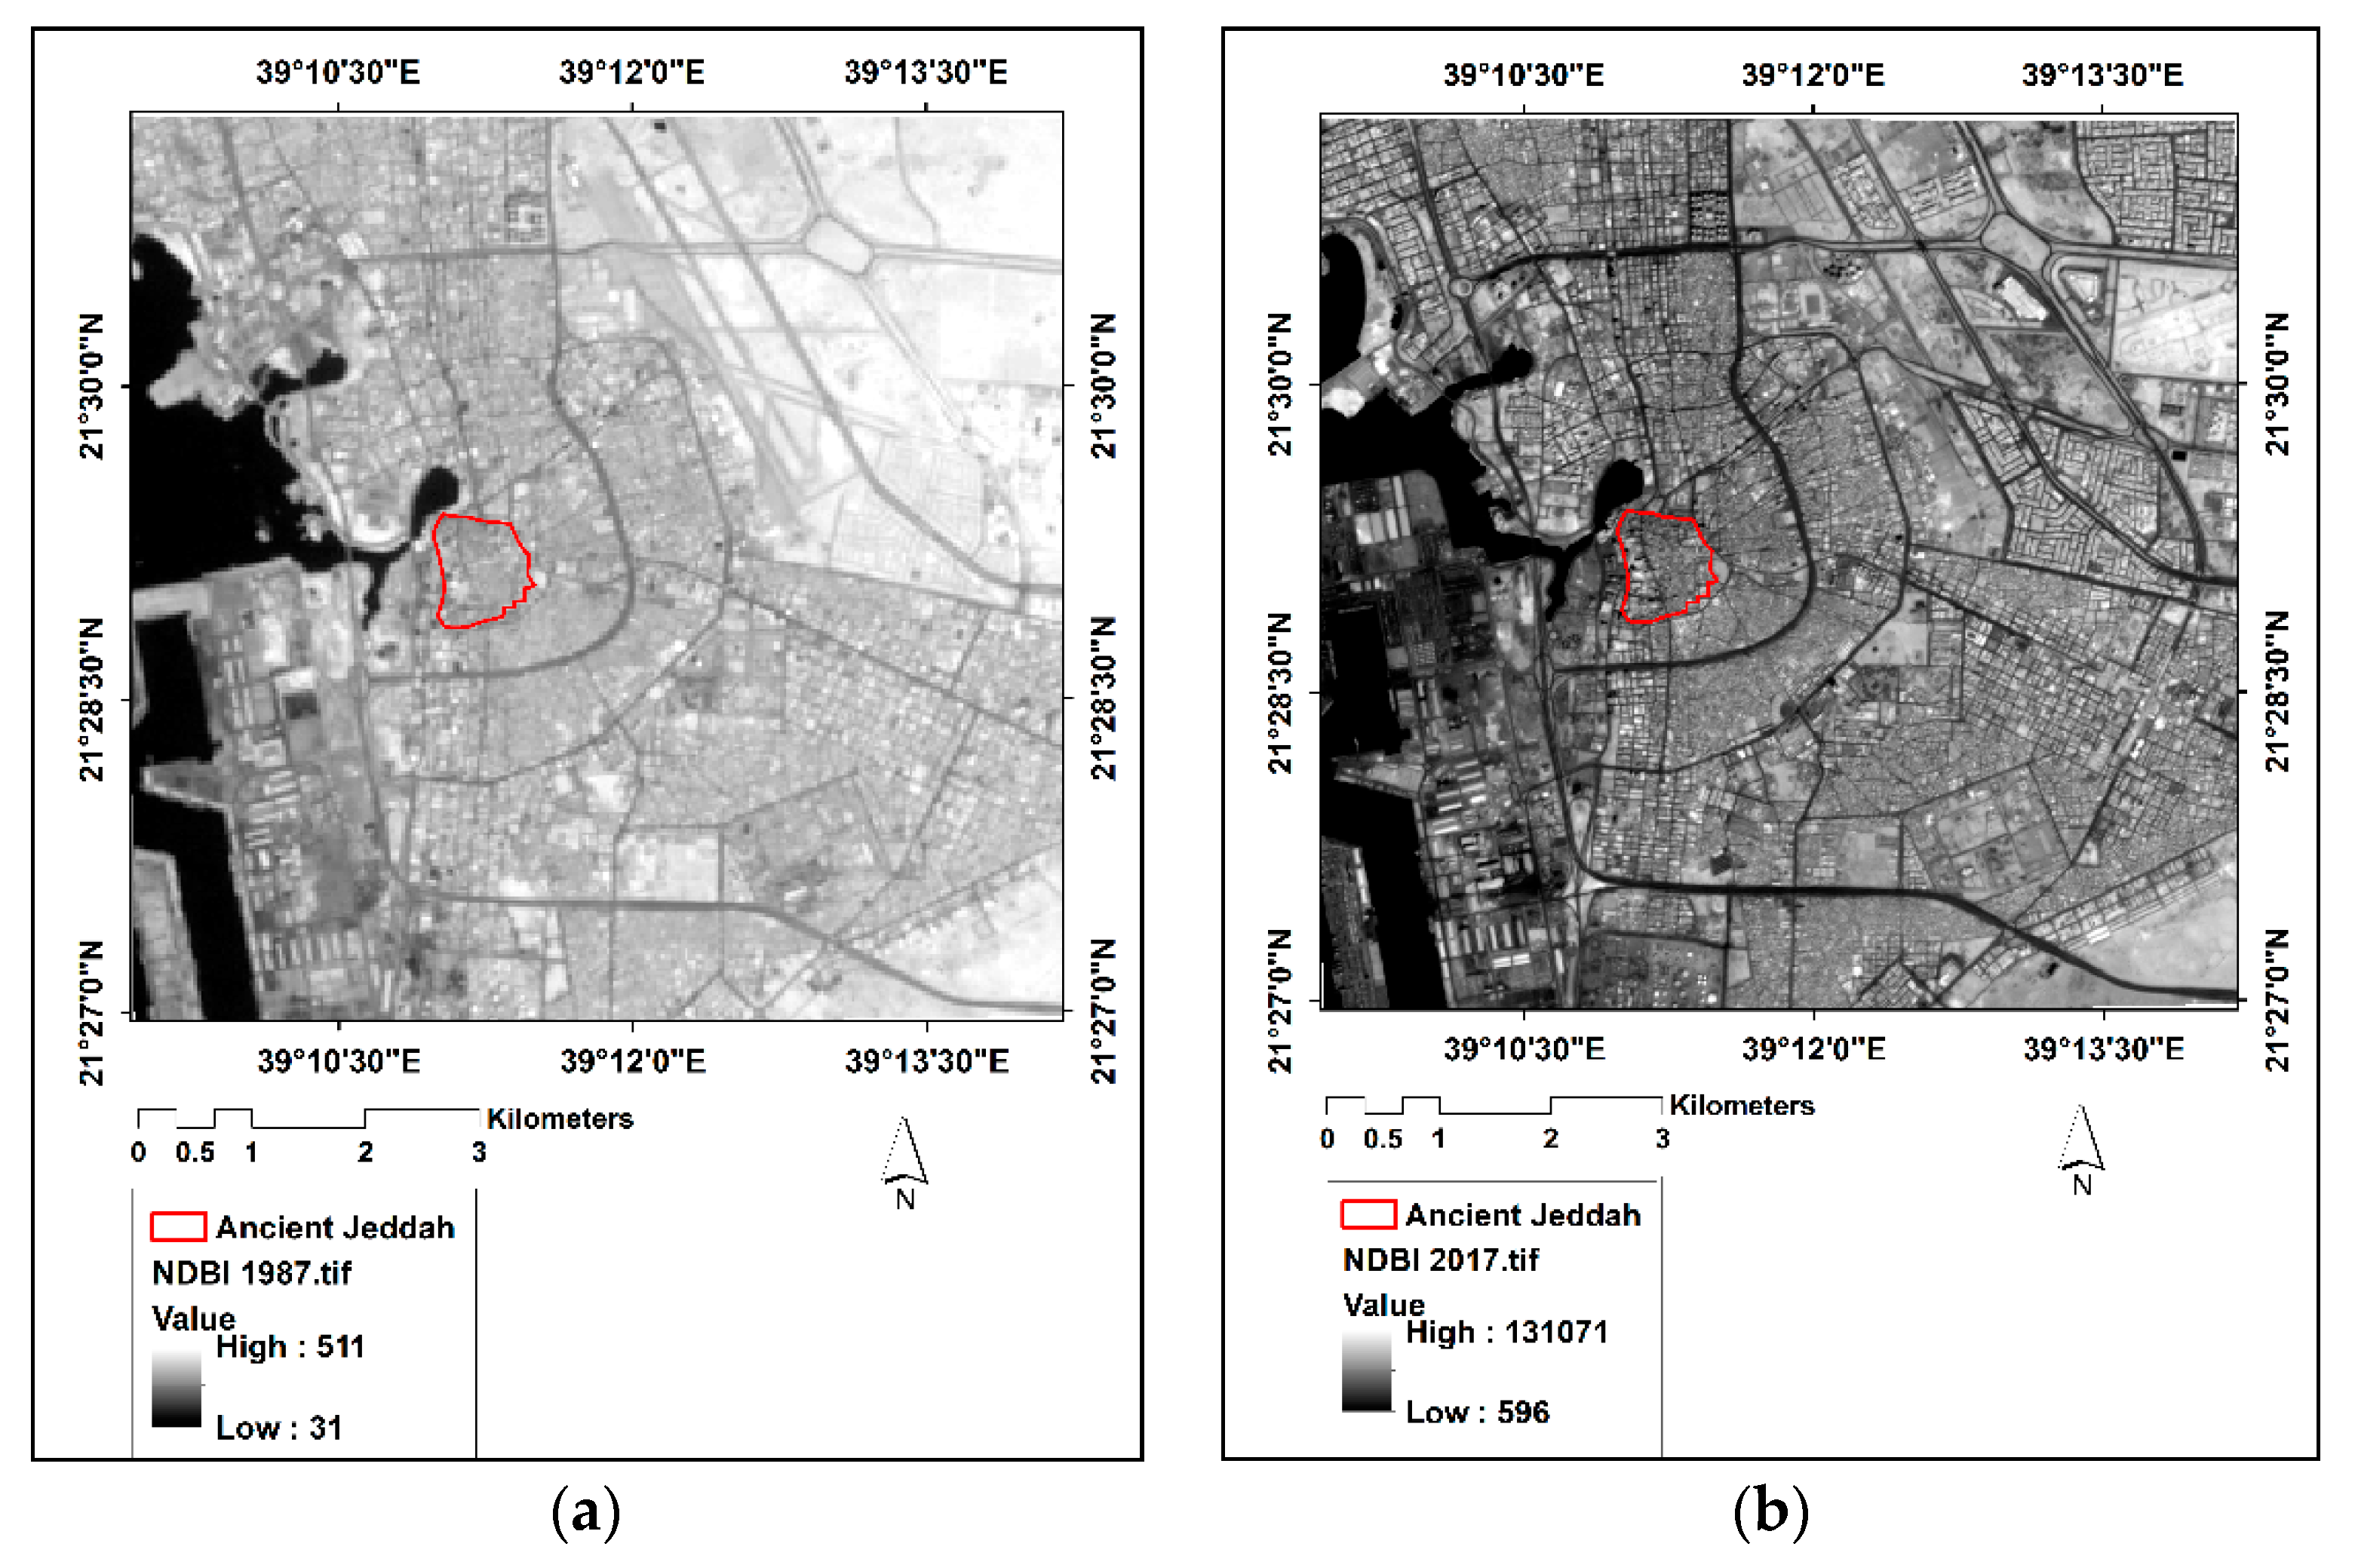
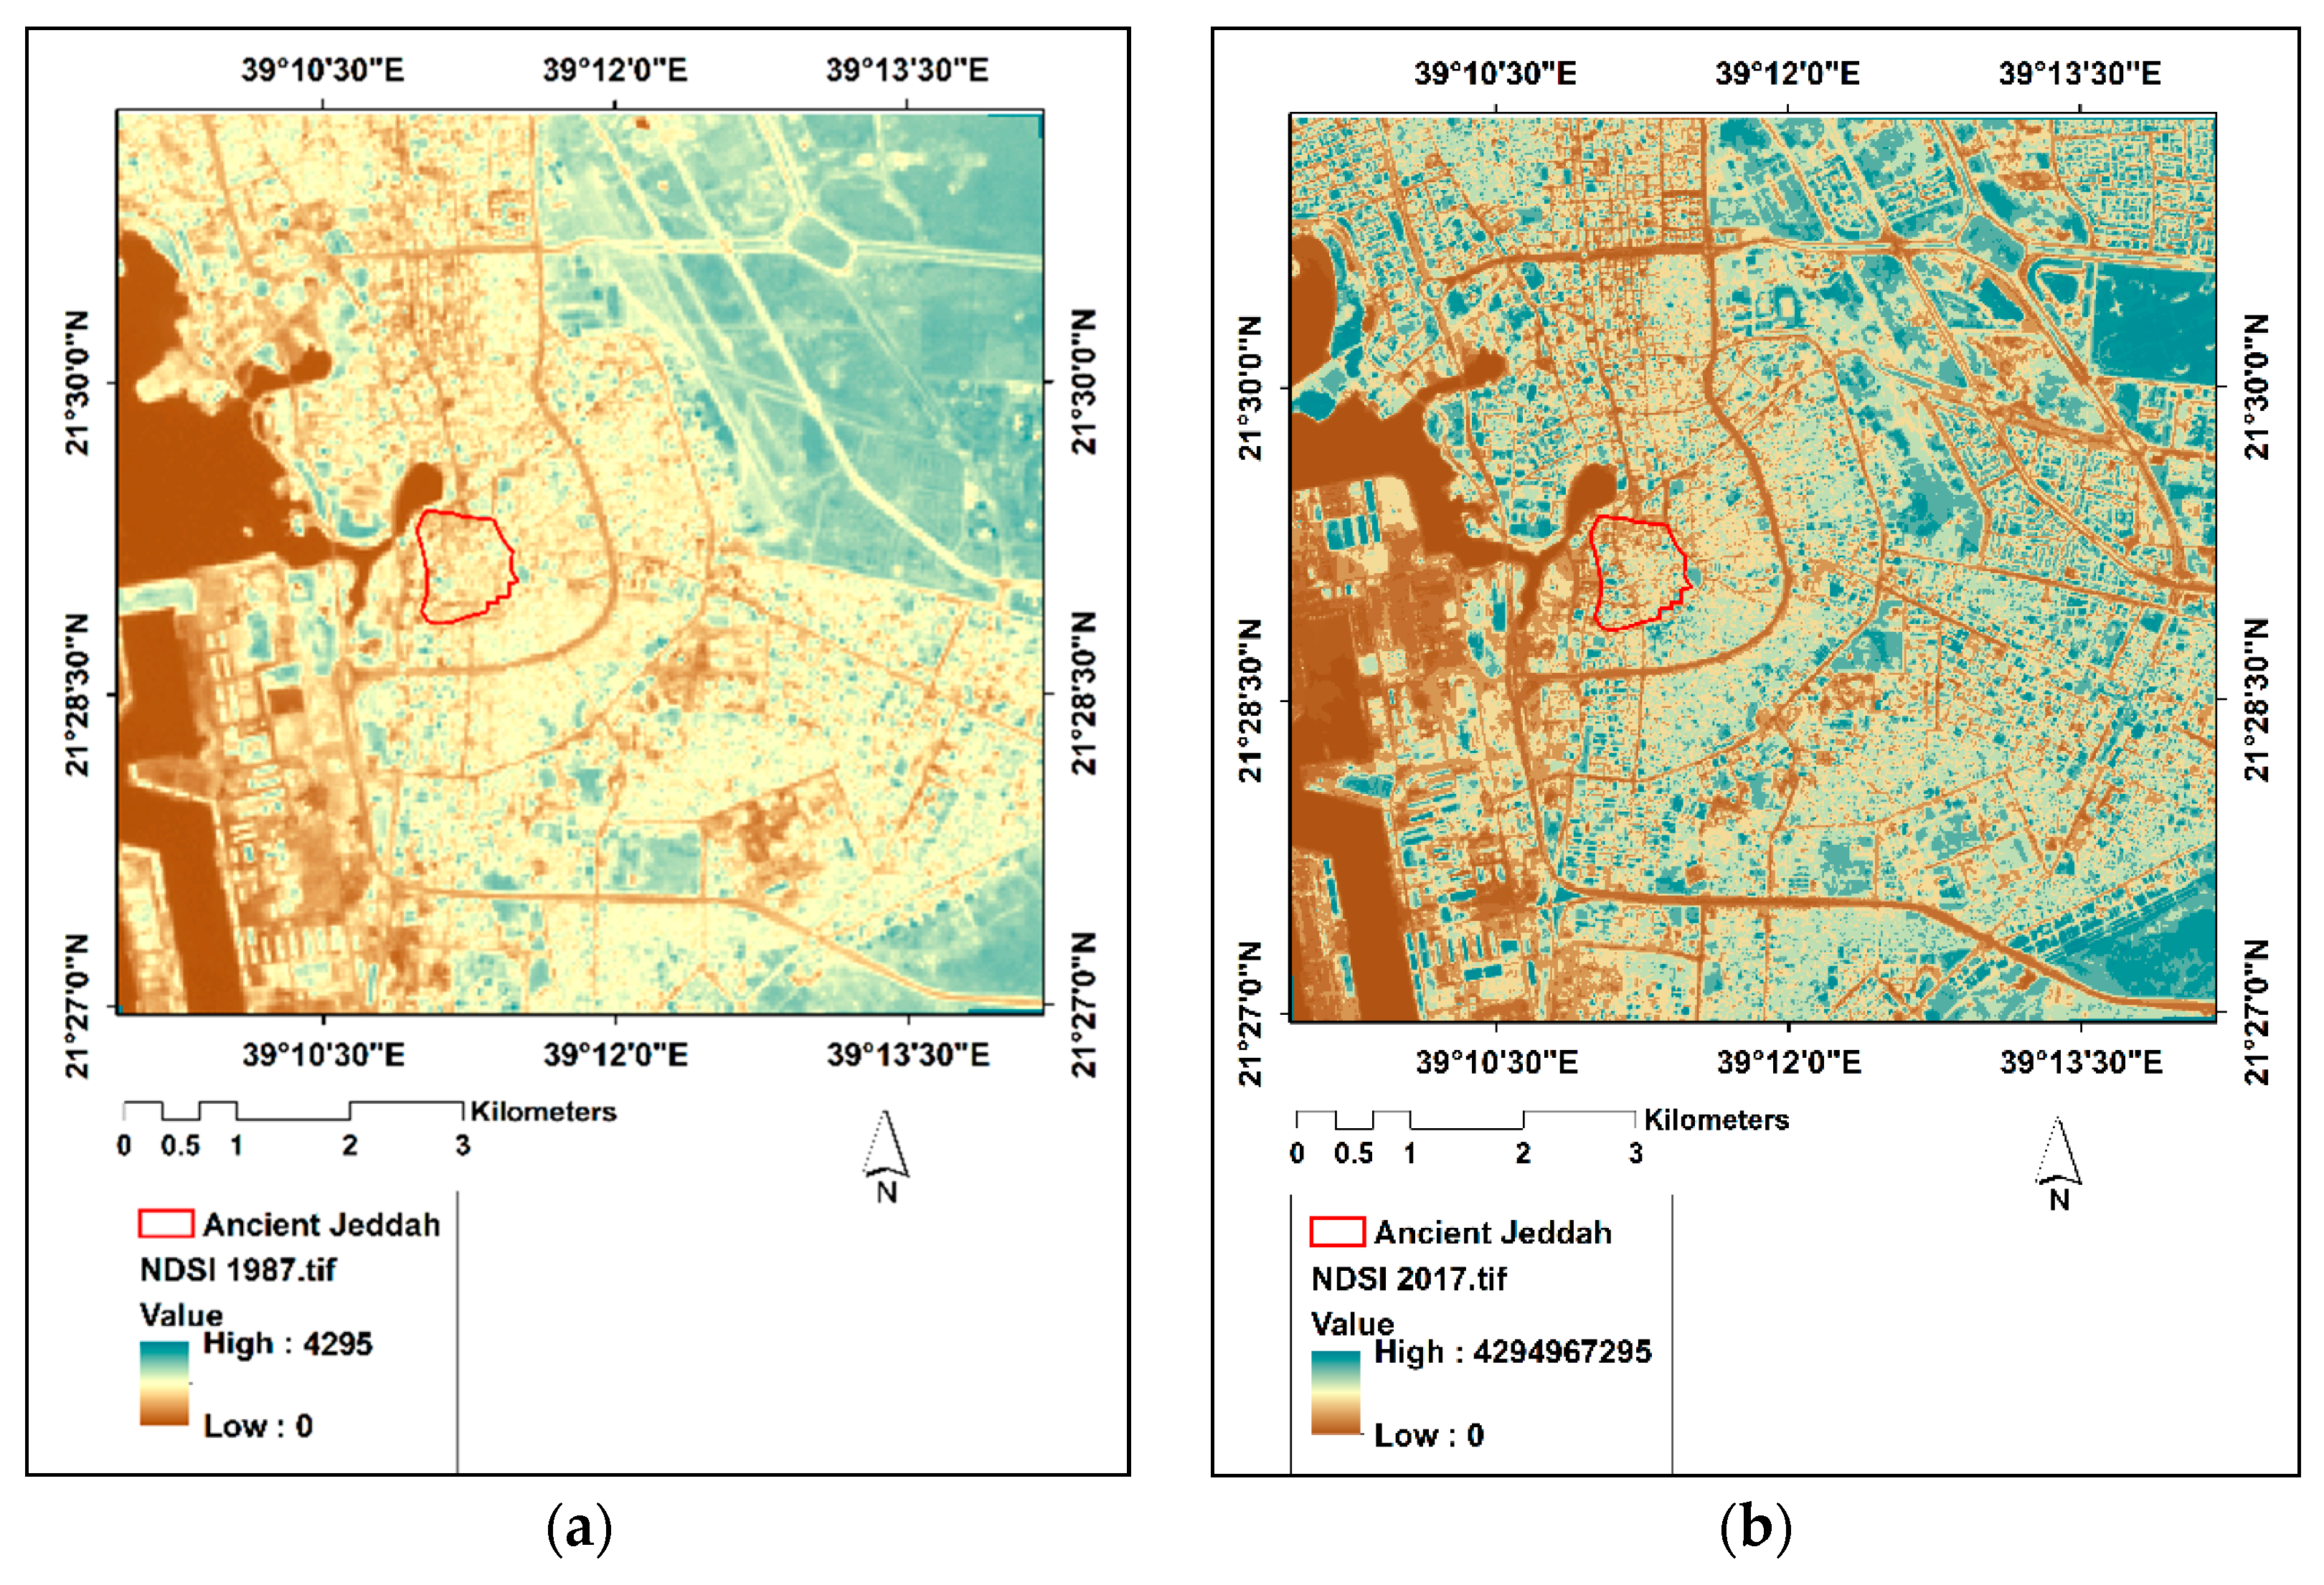
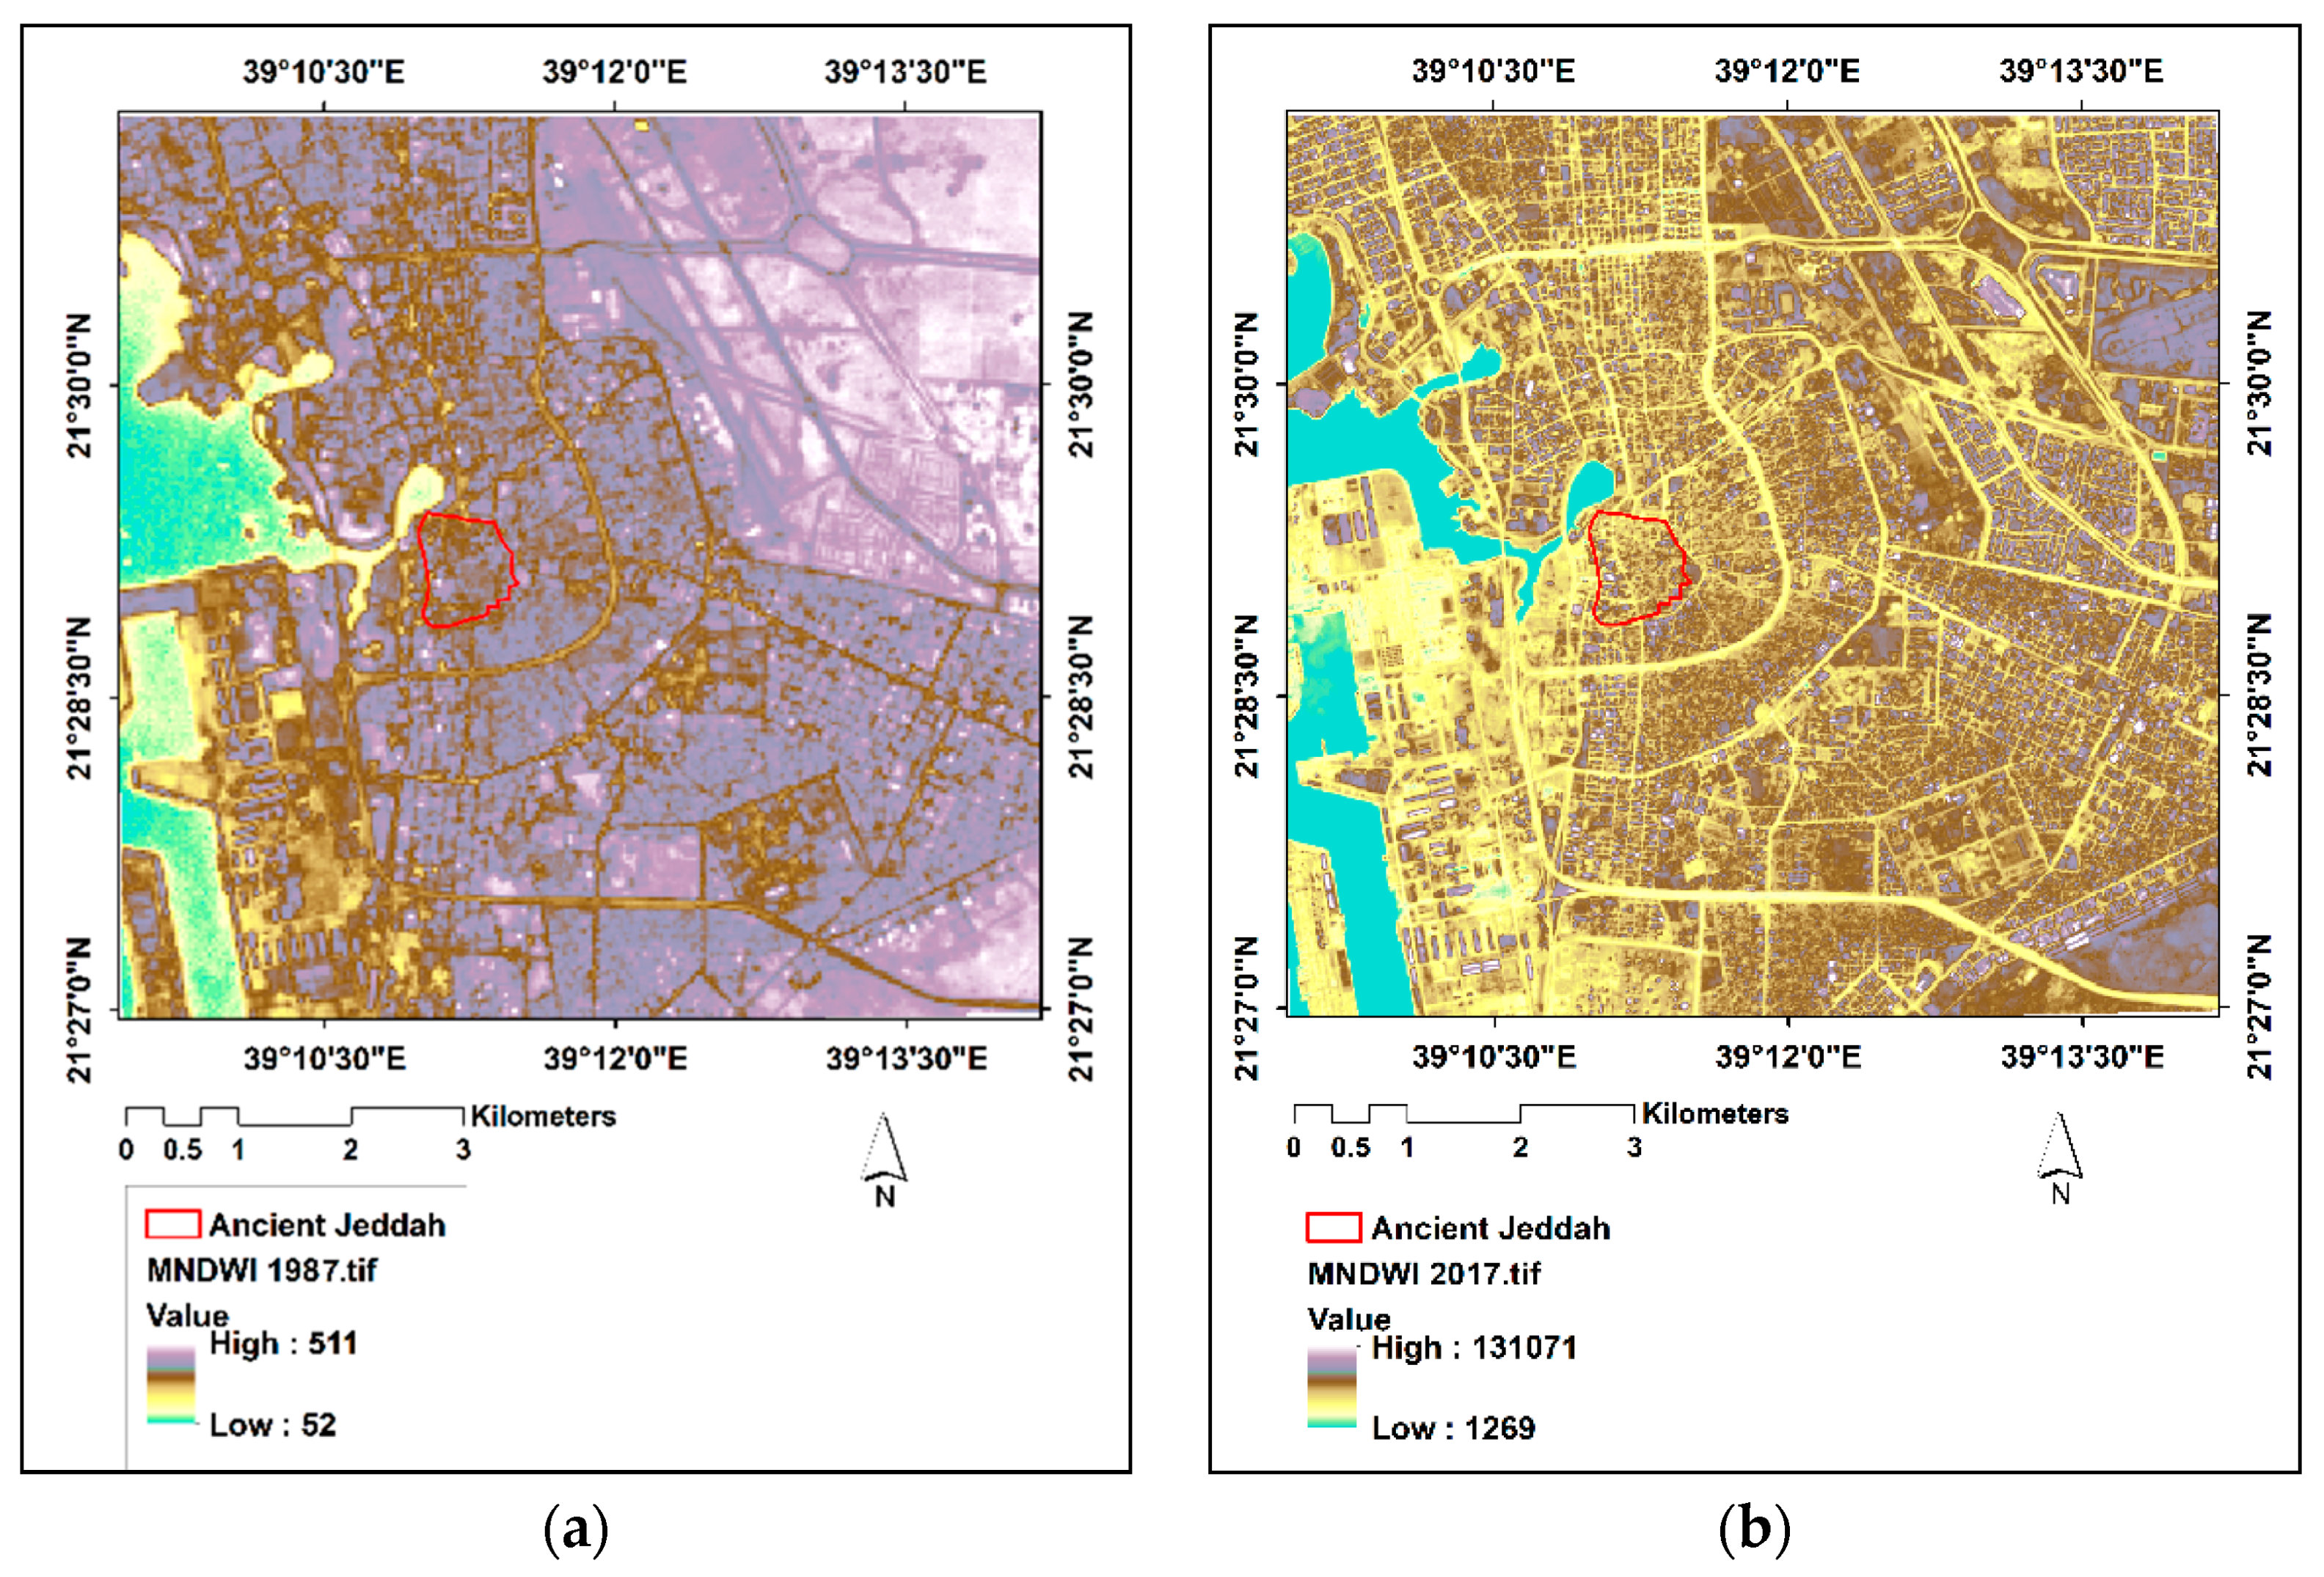
2.2.4. Remote Sensing Indices (Built-Up Indices)
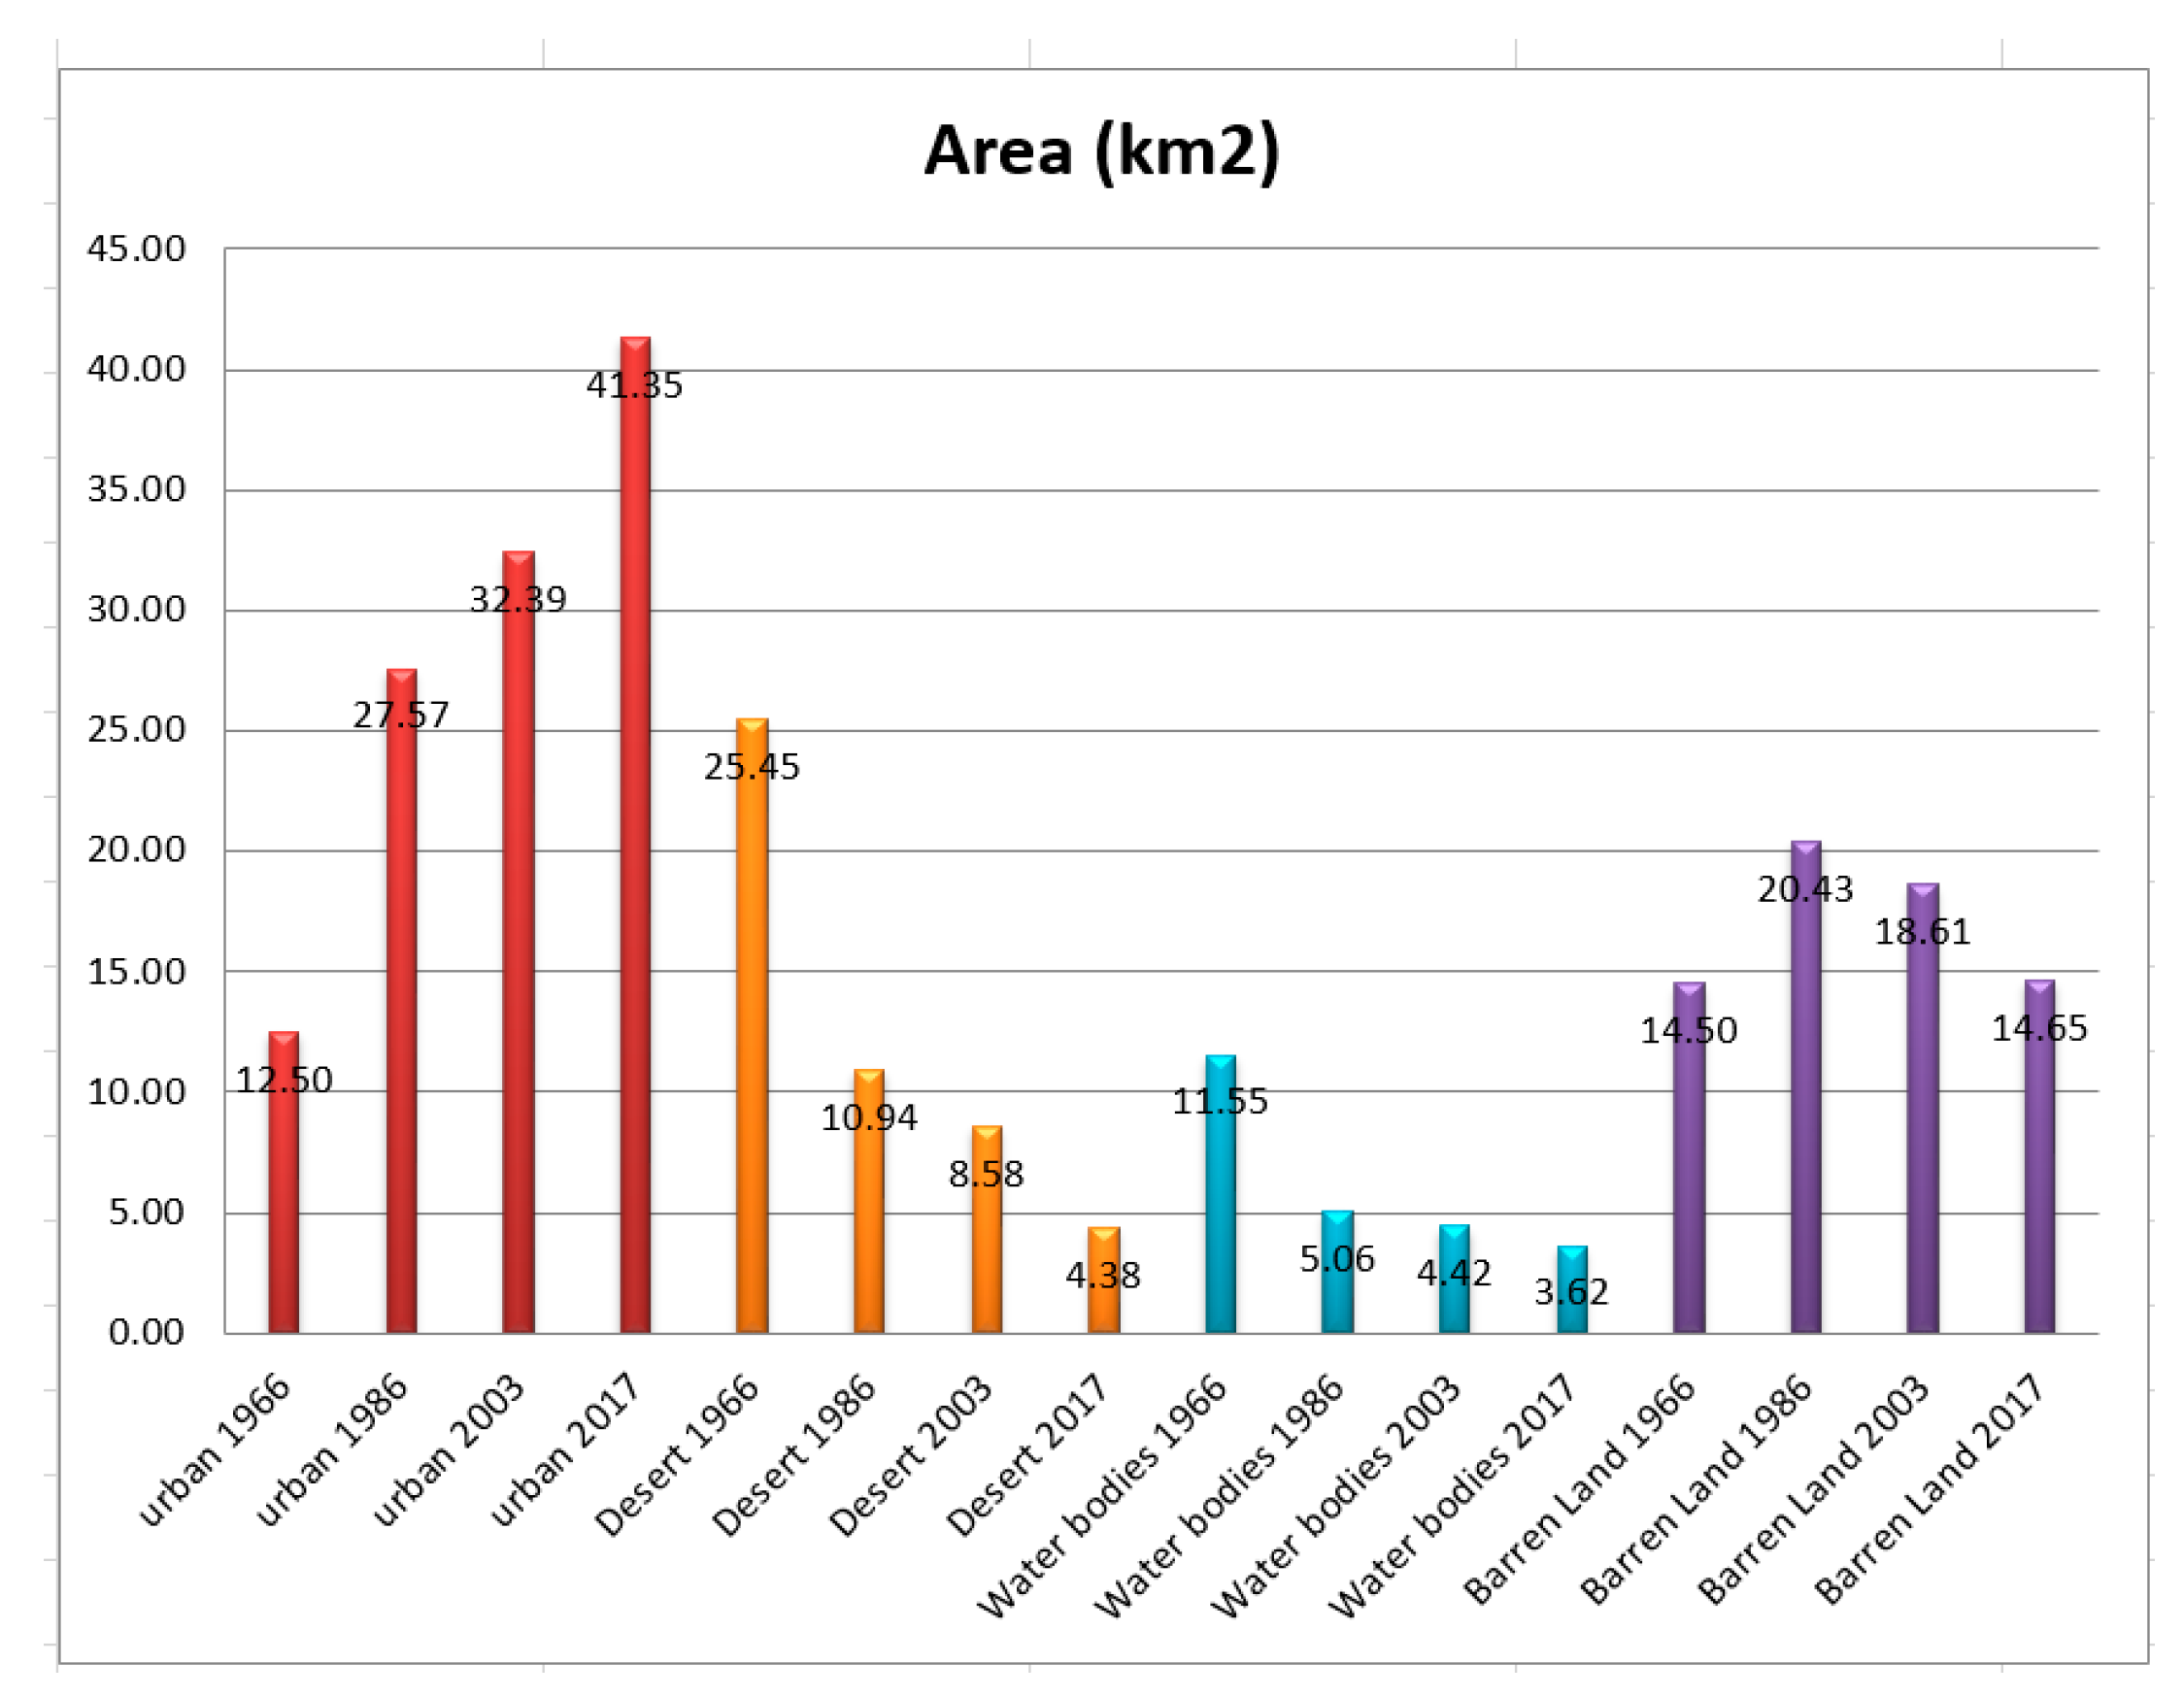
3. Results and Discussion
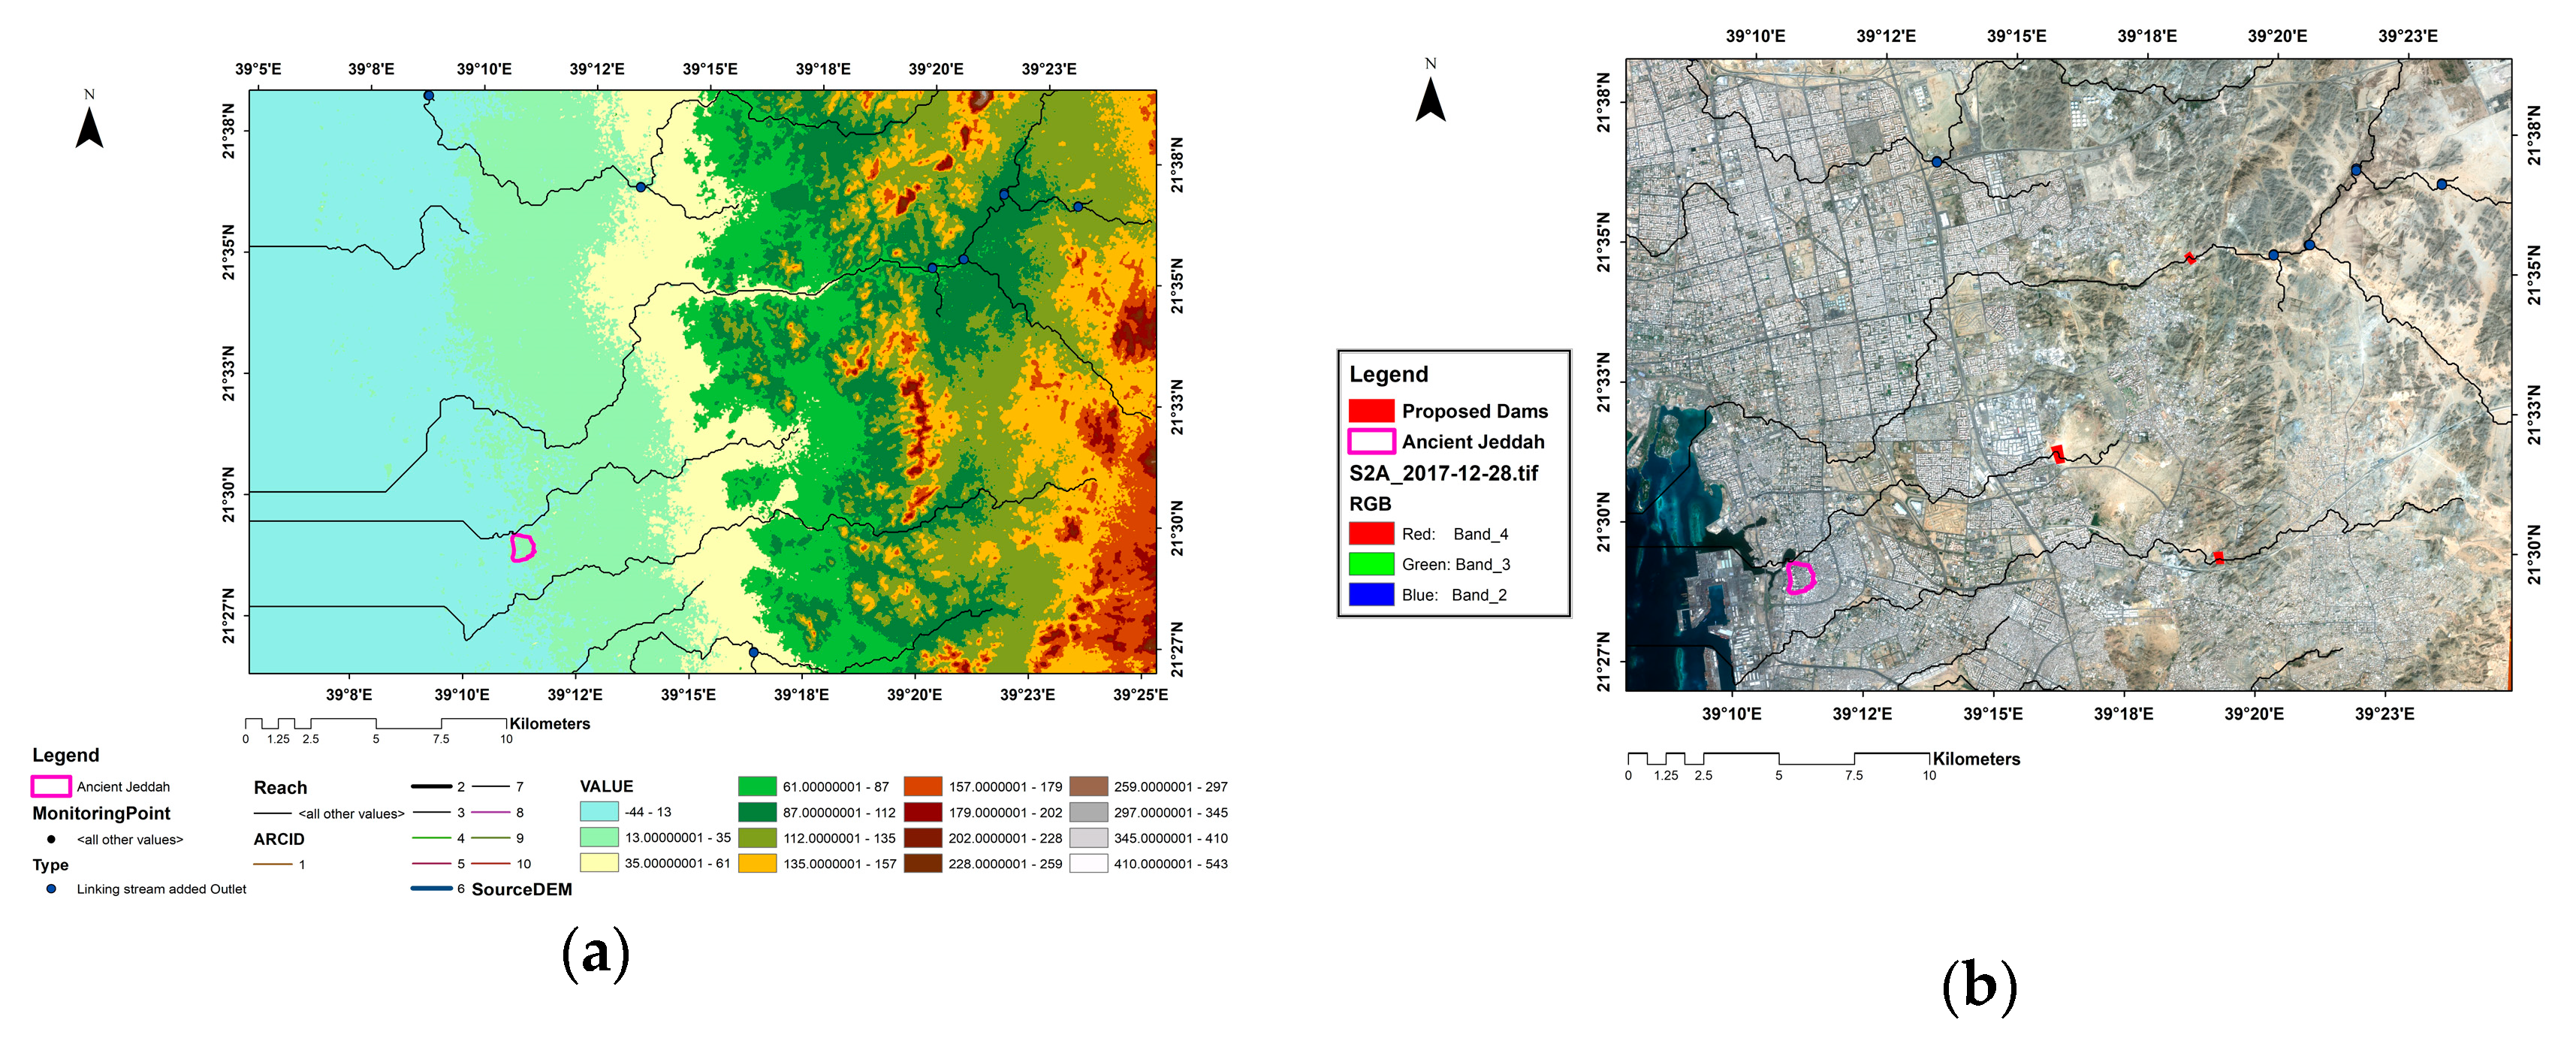
4. Recommendation
5. Conclusions
Author Contributions
Funding
Acknowledgments
Conflicts of Interest
References
- Gullino, P.; Larcher, F. Integrity in UNESCO World Heritage Sites. A comparative study for rural landscapes. J. Cult. Herit. 2013, 14, 389–395. [Google Scholar] [CrossRef]
- Agapiou, A.; Lysandrou, V.; Alexakis, D.D.; Themistocleous, K.; Cuca, B.; Argyriou, A.; Sarris, A.; Hadjimitsis, D.G. Cultural heritage management and monitoring using remote sensing data and GIS: The case study of Paphos area, Cyprus. Comput. Environ. Urban Syst. 2015, 54, 230–239. [Google Scholar] [CrossRef]
- Elfadaly, A.; Attia, W.; Lasaponara, R. Monitoring the Environmental Risks Around Medinet Habu and Ramesseum Temple at West Luxor, Egypt, Using Remote Sensing and GIS Techniques. J. Archaeol. Method Theory 2018, 25, 587–610. [Google Scholar] [CrossRef]
- Elfadaly, A.; Lasaponara, R. On the Use of Satellite Imagery and GIS Tools to Detect and Characterize the Urbanization around Heritage Sites: The Case Studies of the Catacombs of Mustafa Kamel in Alexandria, Egypt and the Aragonese Castle in Baia, Italy. Sustainability 2019, 11, 2110. [Google Scholar] [CrossRef] [Green Version]
- Elfadaly, A.; Wafa, O.; Abouarab, M.A.; Guida, A.; Spanu, P.G.; Lasaponara, R. Geo-Environmental Estimation of Land Use Changes and Its Effects on Egyptian Temples at Luxor City. Isprs Int. J. Geo-Inf. 2017, 6, 378. [Google Scholar] [CrossRef] [Green Version]
- Elfadaly, A.; Lasaponara, R.; Murgante, B.; Qelichi, M.M. Cultural Heritage Management Using Analysis of Satellite Images and Advanced GIS Techniques at East Luxor, Egypt and Kangavar, Iran (A Comparison Case Study). In Proceedings of the International Conference on Computational Science and Its Applications, Trieste, Italy, 2–5 July 2017; Springer: Cham, Switzerland, 2017; pp. 152–168. [Google Scholar]
- Paolini, A.; Vafadari, A.; Cesaro, G.; Quintero, M.S.; Van Balen, K.; Pinilla, O.V. Risk Management at Heritage Sites: A Case Study of the Petra World Heritage Site; UNESCO: Paris, France, 2012; pp. 1–128. [Google Scholar]
- Lasaponara, R.; Murgante, B.; Elfadaly, A.; Qelichi, M.M.; Shahraki, S.Z.; Wafa, O.; Attia, W. Spatial open data for monitoring risks and preserving archaeological areas and landscape: Case studies at Kom el Shoqafa, Egypt and Shush, Iran. Sustainability 2017, 9, 572. [Google Scholar] [CrossRef] [Green Version]
- Lasaponara, R.; Elfadaly, A.; Attia, W. Low cost space technologies for operational change detection monitoring around the archaeological area of Esna-Egypt. In Proceedings of the International Conference on Computational Science and Its Applications, Beijing, China, 4–7 July 2016; Springer: Cham, Switzerland, 2016; pp. 611–621. [Google Scholar]
- Elfadaly, A.; Attia, W.; Qelichi, M.M.; Murgante, B.; Lasaponara, R. Management of Cultural Heritage Sites Using Remote Sensing Indices and Spatial Analysis Techniques. Surv. Geophys. 2018, 39, 1347–1377. [Google Scholar] [CrossRef]
- Quirós-Castillo, J.A. Iberia: Medieval Archaeology. Encycl. Glob. Archaeol. 2014, 3631–3642. [Google Scholar] [CrossRef]
- Tassie, G.; Hassan, F. Sites and Monuments Records (SMRs) and Cultural Heritage Management. In Managing Egypt’s Cultural Heritage, Proceedings of the First Egyptian Cultural Heritage Organisation Conference on Egyptian Cultural Heritage Management; Golden House and ECHO Publications: London, UK, 2009; pp. 191–205. [Google Scholar]
- Cowley, D.C. Remote sensing for archaeological heritage management. In Proceedings of the 11th EAC Heritage Management Symposium, Reykjavík, Iceland, 25–27 March 2010; pp. 1–22. [Google Scholar]
- Lasaponara, R.; Masini, N. Remote sensing in archaeology: An overview. J. Aeronaut. Space Technol. 2013, 6, 7–17. [Google Scholar]
- Campana, S. Archaeological site detection and mapping: Some thoughts on differing scales of detail and archaeological ‘non-visibility’. In Seeing the Un-Seen. Geophysics and Landscape Archaeology; CRC Press: Boca Raton, FL, USA, 2008; pp. 31–52. [Google Scholar]
- Qari, M.H. Geomorphology of Jeddah Governate, with emphasis on drainage systems. Earth Sci. 2009, 20, 23. [Google Scholar] [CrossRef]
- Khodeir, M.; Shamy, M.; Alghamdi, M.; Zhong, M.; Sun, H.; Costa, M.; Chen, L.C.; Maciejczyk, P. Source apportionment and elemental composition of PM2.5 and PM10 in Jeddah City, Saudi Arabia. Atmos. Pollut. Res. 2012, 3, 331–340. [Google Scholar] [CrossRef] [PubMed] [Green Version]
- Nyazi, G.; Sağıroğlu, Ö. The traditional coral buildings of the red sea coast: Case study of historic Jeddah. Gazi Univ. J. Sci. Part B Art Hum. Des. Plan. 2018, 6, 159–165. [Google Scholar]
- Alitany, A. A New Strategy of ICT Integrated Methodologies for 3D Documentation: A Case Study of the Projected Wooden Windows (The Roshans) in the Historical City of Jeddah (Saudi Arabia). Ph.D. Thesis, Universitat Politècnica de Catalunya, Barcelona, Spain, 2014. [Google Scholar]
- Ilias, M.H. Mappila Muslims and the cultural content of trading Arab diaspora on the Malabar Coast. Asian J. Soc. Sci. 2007, 35, 434–456. [Google Scholar] [CrossRef]
- Robinson, D.; Wilson, A. (Eds.) Maritime Archaeology and Ancient Trade in the Mediterranean; Oxford Centre for Maritime Archaeology: Oxford, UK, 2011. [Google Scholar]
- Al-Shahrani, M.A. Inquiry into Leisure and Recreation Patterns and Their Relationship to Open Space and Landscape Design: The Case of Jeddah, Saudi Arabia. 1992. Available online: https://www.era.lib.ed.ac.uk/handle/1842/15753 (accessed on 21 May 2019).
- Baik, A.; Alitany, A.; Boehm, J.; Robson, S. Jeddah Historical Building Information Modelling” JHBIM”—Object Library; International Society for Photogrammetry and Remote Sensing (ISPRS): Riva del Garda, Italy, 2014. [Google Scholar]
- Bagader, M. The Old City of Jeddah: From a walled city to a heritage site. Wit Transact. Built Environ. 2014, 143, 365–374. [Google Scholar]
- UNESCO. Ancient Jeddah City. Available online: https://en.unesco.org/silkroad/content/jeddah (accessed on 21 May 2019).
- UNESCO. Historic Jeddah, the Gate to Makkah. Available online: https://whc.unesco.org/en/list/1361 (accessed on 21 May 2019).
- Kamal, M.A. The morphology of traditional architecture of Jeddah: Climatic design and environmental sustainability. Glob. Built Environ. Rev. 2014, 9, 4–26. [Google Scholar]
- Guzmán, P.C.; Roders, A.P.; Colenbrander, B.J.F. Measuring links between cultural heritage management and sustainable urban development: An overview of global monitoring tools. Cities 2017, 60, 192–201. [Google Scholar] [CrossRef]
- Montagu, C. Civil society and the voluntary sector in Saudi Arabia. Middle East J. 2010, 64, 67–83. [Google Scholar] [CrossRef]
- Alzahrani, A. Mining in al-Baha Region, South-Western Saudi Arabia in Islamic-Era: The Archaeology of Asham. Ph.D. Thesis, University of York, York, UK, 2014. [Google Scholar]
- Darwish, M.A. Architectural effect of Islamiciwan and triple arched facade on the planning of historical houses, (Jeddah, Saudi Arabia as example). Int. J. Res. Soc. Sci. 2016, 6, 361–391. [Google Scholar]
- Bagader, M.A.A. The Evolution of Built Heritage Conservation Policies in Saudi Arabia between 1970 and 2015: The Case of Historic Jeddah. Ph.D. Thesis, The University of Manchester, Manchester, UK, 2016. [Google Scholar]
- Harford, F.D. An old route to India. J. Cent. Asian Soc. 1919, 6, 99–118. [Google Scholar] [CrossRef]
- Morris, A.E.J. History of Urban Form before the Industrial Revolution; Routledge: Abingdon, UK, 2013. [Google Scholar]
- Mushtaha, E.; Helmy, O. Impact of building forms on thermal performance and thermal comfort conditions in religious buildings in hot climates: A case study in Sharjah city. Int. J. Sustain. Energy 2017, 36, 926–944. [Google Scholar] [CrossRef]
- Aygen, Z. International Heritage and Historic Building Conservation: Saving the World’s Past; Routledge: Abingdon, UK, 2013. [Google Scholar]
- Old Building in Historical Village Jeddah, Saudi Arabia. Available online: https://www.123rf.com/photo_98143760_old-building-in-historical-village-jeddah-saudi-arabia.html (accessed on 21 May 2019).
- Rashid, M.; Bindajam, A.A.A. Space, movement and heritage planning of the historic cities in Islamic societies: Learning from the Old City of Jeddah, Saudi Arabia. Urban Des. Int. 2015, 20, 107–129. [Google Scholar] [CrossRef]
- Baik, A. From point cloud to jeddah heritage BIM nasif historical house—Case study. Dig. Appl. Archaeol. Cult. Herit. 2017, 4, 1–18. [Google Scholar] [CrossRef]
- Magram, S.F. A review on the environmental issues in Jeddah, Saudi Arabia with special focus on water pollution. J. Environ. Sci. Technol. 2009, 2, 120–132. [Google Scholar] [CrossRef]
- Kutbi, I.I. A pragmatic pairwise group-decision method for selection of sites for nuclear power plants. Nucl. Eng. Des. 1987, 100, 49–63. [Google Scholar] [CrossRef]
- Al-Sefry, S.A.; Şen, Z. Groundwater rise problem and risk evaluation in major cities of arid lands–Jeddah Case in Kingdom of Saudi Arabia. Water Resour. Manag. 2006, 20, 91–108. [Google Scholar] [CrossRef]
- Al-Refeai, T.; Al-Ghamdy, D. Geological and geotechnical aspects of Saudi Arabia. Geotech. Geol. Eng. 1994, 12, 253–276. [Google Scholar] [CrossRef]
- Historic Site of Al Balad, Jeddah. Ancient Jeddah. Available online: https://www.deviantart.com/raeid/art/Jeddah-97075159?q=boost:popular%20jeddah&qo=15 (accessed on 21 May 2019).
- Songchitruksa, P.; Zeng, X. Getis–Ord spatial statistics to identify hot spots by using incident management data. Transp. Res. Rec. 2010, 2165, 42–51. [Google Scholar] [CrossRef]
- O’Sullivan, D.; Unwin, D.J. Geographic information analysis and spatial data. In Geographic Information Analysis; John Wiley & Sons Ltd.: Hoboken, NJ, USA, 2010; pp. 1–32. [Google Scholar]
- Spatial Statistic. Hotspot. Available online: https://pro.arcgis.com/en/pro-app/tool-reference/spatial-statistics/h-how-hot-spot-analysis-getis-ord-gi-spatial-stati.htm (accessed on 21 May 2019).
- Malerba, D.; Appice, A.; Varlaro, A.; Lanza, A. Spatial clustering of structured objects. In International Conference on Inductive Logic Programming; Springer: Berlin/Heidelberg, Germany, 2005; pp. 227–245. [Google Scholar]
- Landsat Satellite Images. Band Designations. Available online: https://landsat.usgs.gov/what-are-band-designations-landsat-satellites (accessed on 21 May 2019).
- Sentinel2 A, B Satellite Images. Band Designations. Available online: https://www.satimagingcorp.com/satellite-sensors/other-satellite-sensors/sentinel-2a/ (accessed on 21 May 2019).
- He, C.; Shi, P.; Xie, D.; Zhao, Y. Improving the normalized difference built-up index to map urban built-up areas using a semiautomatic segmentation approach. Remote Sens. Lett. 2010, 1, 213–221. [Google Scholar] [CrossRef] [Green Version]
- Deng, Y.; Wu, C.; Li, M.; Chen, R. RNDSI: A ratio normalized difference soil index for remote sensing of urban/suburban environments. Int. J. Appl. Earth Observ. Geo-Inf. 2015, 39, 40–48. [Google Scholar] [CrossRef]
- Deng, C.; Wu, C. BCI: A biophysical composition index for remote sensing of urban environments. Remote Sens. Environ. 2012, 127, 247–259. [Google Scholar] [CrossRef]
- Cultural Heritage Management. Available online: https://whc.unesco.org/en/ managing-cultural-world-heritage (accessed on 21 May 2019).
- Rao, K. A new paradigm for the identification, nomination and inscription of properties on the World Heritage List. Int. J. Herit. Stud. 2010, 16, 161–172. [Google Scholar] [CrossRef]
- Martin, O. World Heritage and Buffer Zones: Patrimoine Mondial Et Zones Tampons: International Expert Meeting on World Heritage and Buffer Zones, Davos, Switzerland 11–14 March, 2008; Unesco-World Heritage Centre: Paris, France, 2009. [Google Scholar]


| Number | Satellite | Sensor | Resolution (M) | Acquisition Date | Source |
|---|---|---|---|---|---|
| 1 | Corona | KH-4A | 1.8 m | 20 March 1966 | USGS |
| 2 | Spot | 1 | 10 m | 24 March 1986 | USGS |
| 3 | Landsat | TM | 30 | 20 December 1987 | USGS |
| 3 | Orbview | 3 | 1.2 m | 22 December 2003 | USGS |
| 4 | Sentinel | 2A | 10 m | 28 December 2017 | USGS |
| Landsat 4 Thematic Mapper (TM) Bands | Wavelength (Micrometers) | Resolution (m) |
|---|---|---|
| Band 2—Green | 0.52–0.60 | 30 |
| Band 3—Red | 0.63–0.69 | 30 |
| Band 4—Near Infrared (NIR) | 0.76–0.90 | 30 |
| Band 5—Shortwave Infrared (SWIR) 1 | 1.55–1.75 | 30 |
| Band 7—Shortwave Infrared (SWIR) 2 | 2.08–2.35 | 120* (30) |
| Sentinel-2 Bands | Central Wavelength (µm) | Bandwidth (nm) | Resolution (m) |
|---|---|---|---|
| Band 3—Green | 559.8 | 36 | 10 |
| Band 4—Red | 664.6 | 31 | 10 |
| Band 8—NIR | 832.8 | 106 | 10 |
| Band 11—SWIR1 | 1613.7 | 91 | 20 |
| Band 12—SWIR2 | 2202.4 | 175 | 20 |
| Class | 1966 (km2) | Change Detection ± km2 | 1986 (km2) | Change Detection ± km2 | 2003 (km2) | Change Detection ± km2 | 2017 (km2) |
|---|---|---|---|---|---|---|---|
| Urban | 12.5 | 15.07 | 27.57 | 4.82 | 32.39 | 8.96 | 41.35 |
| Barren Land | 14.5 | 5.93 | 20.43 | −1.82 | 18.61 | −3.96 | 14.65 |
| Desert | 25.45 | −14.51 | 10.94 | −2.36 | 8.58 | −4.2 | 4.38 |
| Waterbodies | 11.55 | −6.49 | 5.06 | −0.64 | 4.42 | −0.8 | 3.62 |
© 2019 by the authors. Licensee MDPI, Basel, Switzerland. This article is an open access article distributed under the terms and conditions of the Creative Commons Attribution (CC BY) license (http://creativecommons.org/licenses/by/4.0/).
Share and Cite
Elfadaly, A.; Shams eldein, A.; Lasaponara, R. Cultural Heritage Management Using Remote Sensing Data and GIS Techniques around the Archaeological Area of Ancient Jeddah in Jeddah City, Saudi Arabia. Sustainability 2020, 12, 240. https://0-doi-org.brum.beds.ac.uk/10.3390/su12010240
Elfadaly A, Shams eldein A, Lasaponara R. Cultural Heritage Management Using Remote Sensing Data and GIS Techniques around the Archaeological Area of Ancient Jeddah in Jeddah City, Saudi Arabia. Sustainability. 2020; 12(1):240. https://0-doi-org.brum.beds.ac.uk/10.3390/su12010240
Chicago/Turabian StyleElfadaly, Abdelaziz, Ayaat Shams eldein, and Rosa Lasaponara. 2020. "Cultural Heritage Management Using Remote Sensing Data and GIS Techniques around the Archaeological Area of Ancient Jeddah in Jeddah City, Saudi Arabia" Sustainability 12, no. 1: 240. https://0-doi-org.brum.beds.ac.uk/10.3390/su12010240