Evolution of the Individual Attitude in the Risk Decision of Waste Incinerator Construction: Cellular Automaton Model


School of Economics, Shanghai University, Shanghai 200444, China
*
Author to whom correspondence should be addressed.
Sustainability 2020, 12(1), 368; https://0-doi-org.brum.beds.ac.uk/10.3390/su12010368
Submission received: 28 November 2019
/
Revised: 25 December 2019
/
Accepted: 28 December 2019
/
Published: 2 January 2020
(This article belongs to the Collection Trends in Municipal Solid Waste Management)
Abstract
:In current work, the phenomenon of NIMBY (not in my back yard) for a municipal solid waste incinerator was recognized through an investigation for the evolution of individual risk attitude to group risk attitude (ItGRA). The cellular automaton model was employed to evaluate the risk attitude status with different frequencies of social interaction between residents. In the simulation case, the risk attitude of residents in the pseudo-rational state and non-pseudo-rational state was evaluated, which indicates the sheep-flock effect on the exaggeration of public NIMBY attitude. To the incinerator, the individual risk attitude evolved to supportive group risk attitude at a social interaction frequency 100 times higher than that in family or local neighborhoods, when the initial number of residents in opposition and support was equal. This was supported by the result of the model in the evaluation of resident risk attitude around the incinerator in Shanghai. On the contrary, for those in a non-pseudo-rational state, the ultimate group risk attitude depends on the probability that the residents have a supportive or opposing risk attitude as the concept of individuals was difficult to change. Accordingly, the decision strategy of incinerator construction should consider the influence of the sheep-flock effect, which can increase the attitude of residents in support and lead to the evolution of a group risk attitude to support attitude. Therefore, this study provides insight into the evolution of public attitude to NIMBY attitude and a promising evaluation method to quantify and guide the individual and group risk attitudes.
1. Introduction
The phenomenon of “not in my back yard” (NIMBY) was defined as public opposition to the construction of certain public facilities within a certain range of their own residence [1]. It was reported that attitudes held regarding compensation in communities directly impacted final waste disposal infrastructure projects (municipal solid waste landfills and waste incineration) [2,3,4]. For waste incineration, this option is at the bottom of the waste hierarchy and circular economy in urban areas, which raises many concerns across the world. In recent years in China, municipal solid waste (MSW) increased at a fast rate per year with over four million tons in 2016 [5]. The waste incinerator is suggested as an effective way for MSW disposal due to the energy recovery and volume reduction for landfill. In 2009, the rate of MSW for incineration treatment was 20% and increased to over 50% in 2016 [6]. However, in mega-cities such as Shanghai, the waste incineration plants always work over capacity to deal with the large quantity of MSW, and they are implemented nearby residential areas due to the lack of land [7]. Due to the suspicion of releasing toxic pollutants such as heavy metals, dioxins, and toxic pollutants into the atmosphere during the waste combustion process [8,9], residents near the facility take group activities under improper media coverage and disturb the construction of facilities [10,11]. For example, in Beijing, Hunan, and Guangzhou, the government had to stop constructing MSW incineration projects because of public anti-construction activities [12]. Consequently, this NIMBY situation in terms of waste incinerator construction depends on the consideration of the risk attitude of residents nearby in the urban management policy.
The evaluation of risk attitude to NIMBY facilities was researched in the last few decades. It is supposed that the risk attitude to NIMBY facilities is impacted by the resident distance, traffic, age, career, property, health, etc. [13,14]. Recently, the evolution of individual risk attitude to group risk attitude (ItGRA) was reported as the main reason for the NIMBY attitude becoming dramatic [15]. In this situation, most residents usually follow the main viewpoint that waste incinerators are always harmful for their life quality, leading to a strong disagreement and disturbing the incineration plant construction. Consequently, the NIMBY attitude from the public is probably exaggerated [16]. In this hypothesis, some supporters and centrists seem to follow the residents who are against the construction of waste incineration during social interactions, which leads to conflict with respect to the environmental facility. This behavior is described by the theory of sheep, which was always proposed to describe the herd behavior in many aspects such as changing fashion and occupation choice [13]. Accordingly, it is called the “sheep-flock” effect, a kind of “herd effect”, to describe that the individual’s ideas or behaviors in a group’s interaction will change in the same direction as the majority [17,18]. Therefore, to verify this hypothesis, the investigation of the ItGRA evolution process and potential mechanisms is critical.
The cellular automaton is a mathematical model that can effectively analyze the nonlinear transmission of human behavior between individuals and social interaction in a real or simulated society [19,20]. It is used for evaluating the evolution of people’s attitudes toward various events. Chen and Lin [21] designed a cellular automaton model to study the evolution of internet public opinion in a directed world network. The results showed that internet users’ emotions and other characteristics affect individual and group behavior, and the characteristics of neighbor changes also affect individual behavior. Ievgen and Alexander [22] proposed a cellular automaton method using the non-homogeneous cell concept of public opinion modeling, and numerical experiments using the real data of the Ukrainian parliamentary elections confirmed the usefulness of the proposed method. Shi [23] used a cellular automaton to track the transmission of information focused on small-world networks and to observe the evolution of people’s attitudes toward the same issues.
The aim of this study was to simulate the evolution of ItGRA to the MSW incineration facility construction and reveal the mechanism of its evolution for different social interaction frequencies. This work conducted a cellular automaton to distinguish the individual risk attitude from group risk attitude and their evolutions, which provides a new method for social risk assessment. Moreover, it also provided risk management tactics for reducing social risks through intervening in group risk attitude during the process of waste incineration facility construction.
2. Methodology and Data Collection
2.1. Cellular Automaton Model
A cellular automaton (CA) is a system dynamics model that is discrete in time, space, and state [24]. Because of its powerful computing power and spatial modeling capabilities, it can simulate a variety of dynamic systems with very complex temporal and spatial features, such as biological reproduction and evolution. Compared with the traditional mathematical model, the cellular automaton can simulate various complex natural phenomena more clearly and accurately [25]. Its main advantage is the ability to simulate unpredictable results in complex systems.
According to the definition of a one-dimensional cellular automaton, F represents the global rules of the cellular automaton, Z represents the set of integers, S = {0, 1, 2, … k} represents the set of states of each cell, and represents the distribution of state sets S on the integer set Z. Then, the following equation can be used to describe a cellular automaton:
A cellular automaton consists of five basic components: cell, lattice, neighbors, cell evolution rule, and cell state.
The cellular evolution rules establish the relationship between the current state of the cell and the state at the next moment. It is a mathematical state transfer function. Every iteration of the evolution rule is a change of the cellular automaton. Suppose that f is the state transition function, represents the current state of the j-cell at time t, and represents the current state of the neighbors of the j-cell at time t. Then, the evolution rule is as follows:
This function is the evolutionary function of the cellular automaton, and it is also the core part of the whole cellular automaton. It relates to the success of the cellular automaton model simulation. Therefore, when designing the evolutionary function of a cellular automaton, it is necessary to make the function design as reasonable as possible so that it can reflect the essential characteristics of the system objectively and practically.
This paper takes individual risk attitude as the state of cell and takes the functional relationship between individual risk attitude and neighbor’s risk attitude obtained by the logit model as the evolutionary function of the cellular automaton. According to the theory of sheep, the average attitude of the neighbors is assigned to the conversion rules, and the cellular automaton model of group risk attitude is constructed.
2.2. Construction of Cellular Automaton Model
Cellular automaton modeling requires that the system must be a dynamic system. Individual risk attitude toward waste incineration facilities is a dynamic system, and such systems often converge to collective or collective consent.
2.2.1. Segmentation of the System
The surrounding residents of the waste incineration facility can be seen as many small cells, each with its own different state of choice. At the same time, because there are small cells on the boundary, the number of cells with interaction is smaller than the total number of cells. The lattice segmentation of the system determines the number of cells in the cell and cell space. The grid size is determined by the specific situation. Considering the computing power of the computer, this paper adopted a 200 × 200 grid.
2.2.2. Determination of the Cell State
Determining the cell state is based on the characteristics of the object studied. The cell status in this paper was divided into opposition and support according to individual risk attitude towards the waste incineration facility. Opposition was defined as 0, and support was defined as 1; as a result, individual risk attitude to the incineration facility could be defined as a value in the range [0, 1]. According to the constraints of the transition rules, the cell state cannot take to 0 or 1, which means that its range should be (0, 1). Although it cannot take 0 or 1, according to the characteristics of the conversion rules, it can take close to 0 or 1. When the value is in the range (0, 1), there are nine kinds of discrete state.
S indicates the state that can be obtained.
2.2.3. Selection of Neighbors
The neighbors of the cell are directly related to simulation results. The influence of the neighbors in this paper used the classical Moore-type neighbor model, where each resident is affected by the surrounding eight neighbors.
2.2.4. Evolution Rules
Evolutionary rules are the core of a cellular automaton. The state and behavior of the cell are affected by both the attitude and the behavior of neighborhood cells. Due to the sheep-flock effect, various social behaviors of individual residents may be affected by neighbors. Therefore, individual risk attitude (ATT) was set as the explanatory variable, and neighbor’s risk attitude (NEI) was set as an independent variable. The equation with an orderly logit model can be expressed as follows:
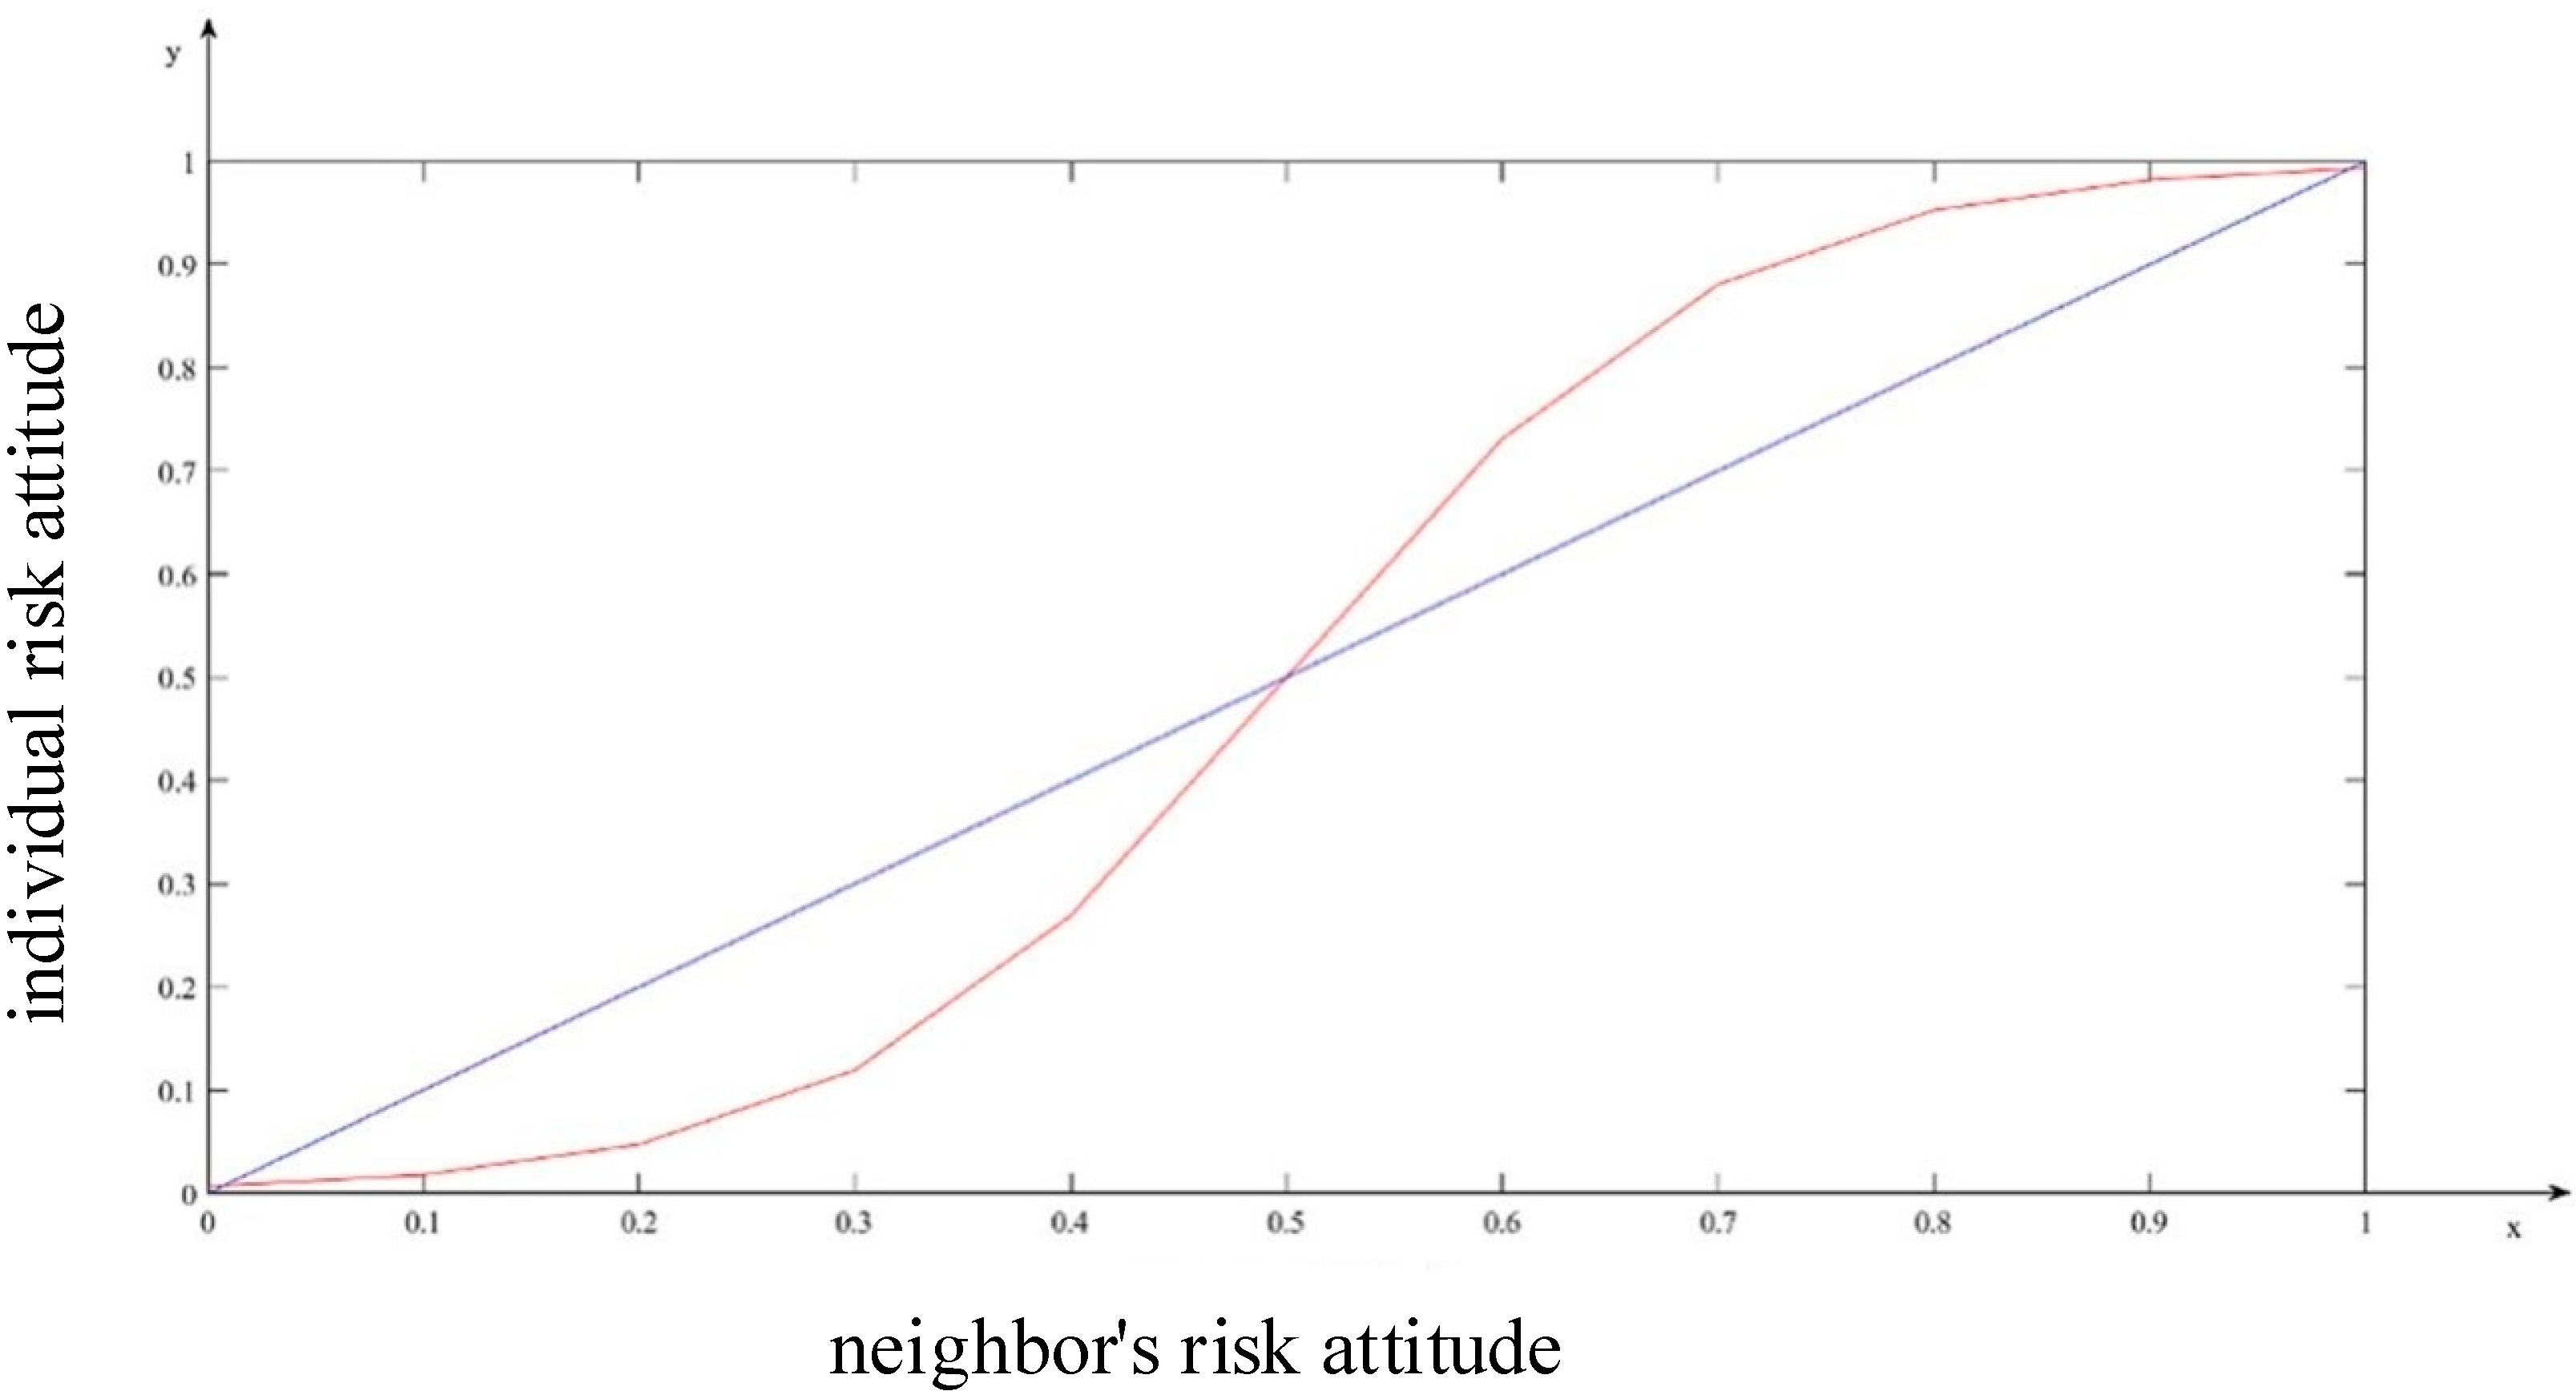
P = 1 indicates the probability that the residents around the incineration facility support the construction of the incinerator, and the probability of its opposition is 1 − P. Furthermore, α and β are the parameters in an ordered logit model; α is the error term and β is the regression parameter. The image of the evolution rule function is shown in Figure 1.
In the curve of the evolution rule image, the line is a y = x image, where x is the neighbor’s risk attitude to the incineration facility, and y is the individual risk attitude. There is a special point on the image of the evolution rule function, referred to as the inflection point, at which the evolution rule function intersects with the line Y = X. The coordinates of this point can be known from calculations of , Y = 0.5. When the individual residents are in this state, it is considered as a “pseudo-rational state”. The decision-making method of the residents in this state is to take the mean of the neighbor’s risk attitude without their own irrational factors. Meanwhile, the residents with this state are also in a state of instability, in which their own attitude is extremely vulnerable to others and easily deviates from the state.
When deviating from this point, the individual risk attitude takes different directions. If X is located in the lower part of the inflection point in Figure 1, in which the neighbor’s attitude is less than 0.5, the individual resident usually exhibits a more supportive state than the neighbor through the sheep-flock effect. However, when X is located in the upper part of inflection point in Figure 1, more than 0.5, the individual resident usually shows more extreme opposition than their neighbors. The individual residents with these two states are referred to as the non-pseudo-rational states. As the first derivative and the second derivative of the evolution function in Equation (4) are not affected by the α factor, the curvature of the function is independent of α. Only β measures the curvature of the function of the evolutionary rule. This indicates that β measures the degree of frenzy of the residents themselves. At the same time, the value of β in the logit model also measures the amount of change in the natural logarithm of the explanatory variable for each unit and the ratio.
2.3. Questionnaire Processing Data for Model Application Verification
In this paper, the residents within 6 km of the Jiangqiao waste incineration facility (JWIF) were surveyed (121.37° east (E), 31.27° north (N)). The potential evolution of individual risk attitudes was assessed based on the questionnaire data (see Table A1, Table A2, Table A3 and Table A4, Appendix A). Using Matlab to simulate the results of the cellular automaton required simplifying the individual risk attitude. Opposite and complete opposite attitudes are summarized as opposite, while attitudes with some support and full support are summarized as support. For an indifferent attitude, the determination of final attitude can be obtained by calculating the highest probability of prediction according to the orderly logit model in the article. Although the individual risk attitudes of residents varied due to their different background, all data were used in the cellular automaton evaluation. Therefore, individual risk attitude can be transformed into a dichotomous variable. The pretreatment of questionnaire data is conducive to the modeling and analysis of a cellular automaton.
3. Results and Discussion
3.1. Simulation of Hypothetical Parameters by Cellular Automaton
As discussed in evolution rules, the initial state of the individual resident can be classified into a pseudo-rational state and non-pseudo-rational state. The risk attitude evolution of individual residents with different initial states has different evolutionary consequences.
3.1.1. Pseudo-Rational State
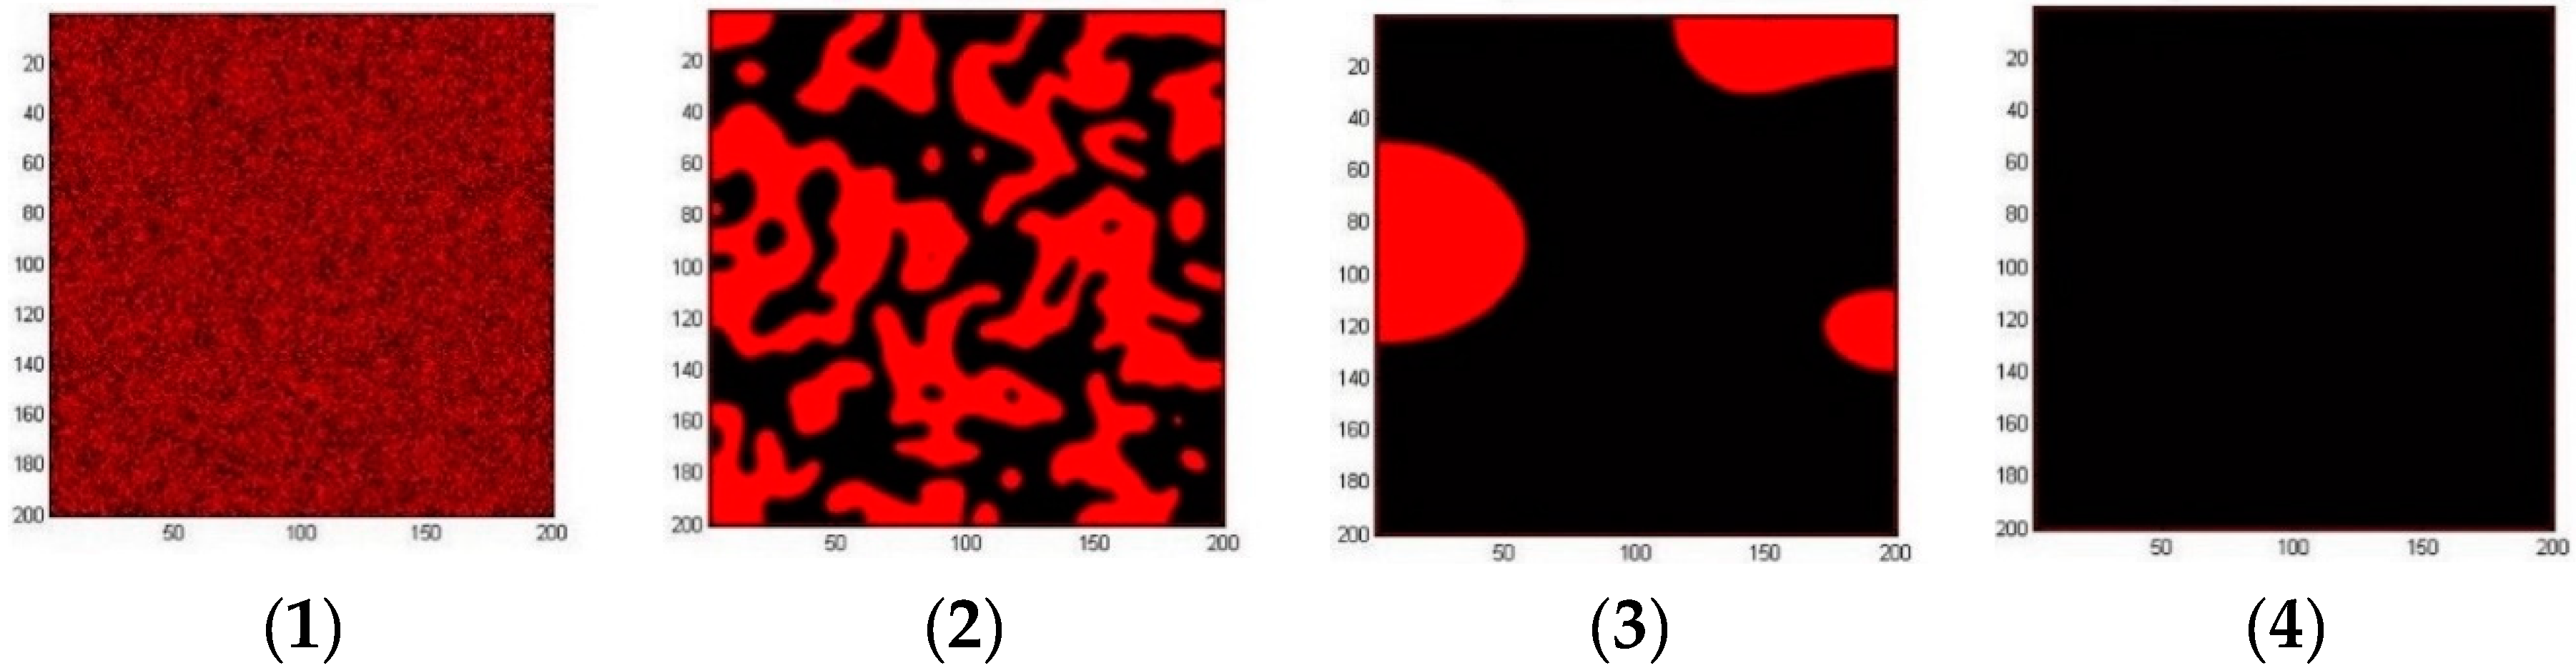
When the residents are in the pseudo-rational state, the X- and Y-coordinate values are calculated based on the above analysis. X = 0.5 indicates that the risk attitude of the neighbor is 0.5, whereas Y = 0.5 indicates that the risk attitude of the individual resident is 0.5. The black dots or black area in Figure 2 denote that the individual risk attitude is opposition, while the red area represents support. By the random distribution of Matlab, the initial risk attitudes with two colors (red and black) were gathered together in a random manner as shown in Figure 2(1). There are three scenarios for the dynamic evolution of individual risk attitude toward group risk attitude.
Scenario one: assuming that residents are in the pseudo-rational state, the neighbor’s average risk attitude is opposed, which means that the risk attitudes of Moore’s neighbors around the individual residents are mainly counteractive.
After 30 cycles of evolution, the distribution of group attitudes becomes significant, which means that residents’ attitudes toward the event changed after being propagated 30 times [26], as shown in Figure 2(2). In our case, the number of cycles in the cellular automaton evaluation indicates the frequency of a resident’s social interaction, in which information and attitudes are exchanged [27]. Rapid aggregation effects can be found during the initial evolution. The rapid agglomeration effect means that, at the beginning of evolution, individual resident risk attitudes quickly converge with the exchange of neighbor’s risk attitudes in a small frequency of social interaction. This is proposed to happen in situations with a family or neighborhood next door. During the initial rapid agglomeration, black and red dots form a large number of black and red plaques. Individual residents’ attitudes rapidly diverge into either extreme opposition or extreme agreement, forming groups of support or opposition attitudes. Therefore, evenly distributed plaques indicate that the residents of the area with different attitudes have a similar level of influence.
After 1000 cycles of evolution, as shown in Figure 2(3), large plaque areas are formed by the connectivity of small plaques. This indicates that, in a large frequency of social interaction such as the local community or online community, the individual resident risk attitude is sharply converted to a group risk attitude. This is in a good agreement with the hypothesis that aware and aroused people were significantly influenced by messages in community activities [28]. In this evolutionary process, concave effects and enveloping effects are active. The concave effect denotes that the residents with the minority attitude change their original attitude due to the pressure of the majority. For example, if the number of neighbors with support attitudes is more than the number of counteractive attitudes, the residents turn from the opposition attitude to the support attitude. If the situation is the opposite, residents turn from a supportive attitude into an opposition attitude. During the evolution of the model, black plaques continue to accumulate based on the action of the concave effect, and they engulf the red plaques, eventually forming the result shown in Figure 2(3) where red plaques are surrounded by large black plaques.
The enveloping effect means that, if an individual resident is surrounded by those who hold another attitude, the individual resident changes their original attitude. As shown in Figure 2(3), red plaques are surrounded by black plaques. Under the effect of the enveloping effect, these red plaques are completely swallowed by black plaques.
After 3000 cycles of evolution, the entire area of Figure 2(4) turns black. The result reflects that a wide frequency of social interaction higher than 1000 cycles leads to a completed ItGRA evolution, which impacts the public risk attitude to the construction of incinerator. This indicates clearly that, when residents with a support attitude are surrounded by residents who hold opposition attitudes, the result of the group’s risk attitude evolution trends eventually to be opposition.
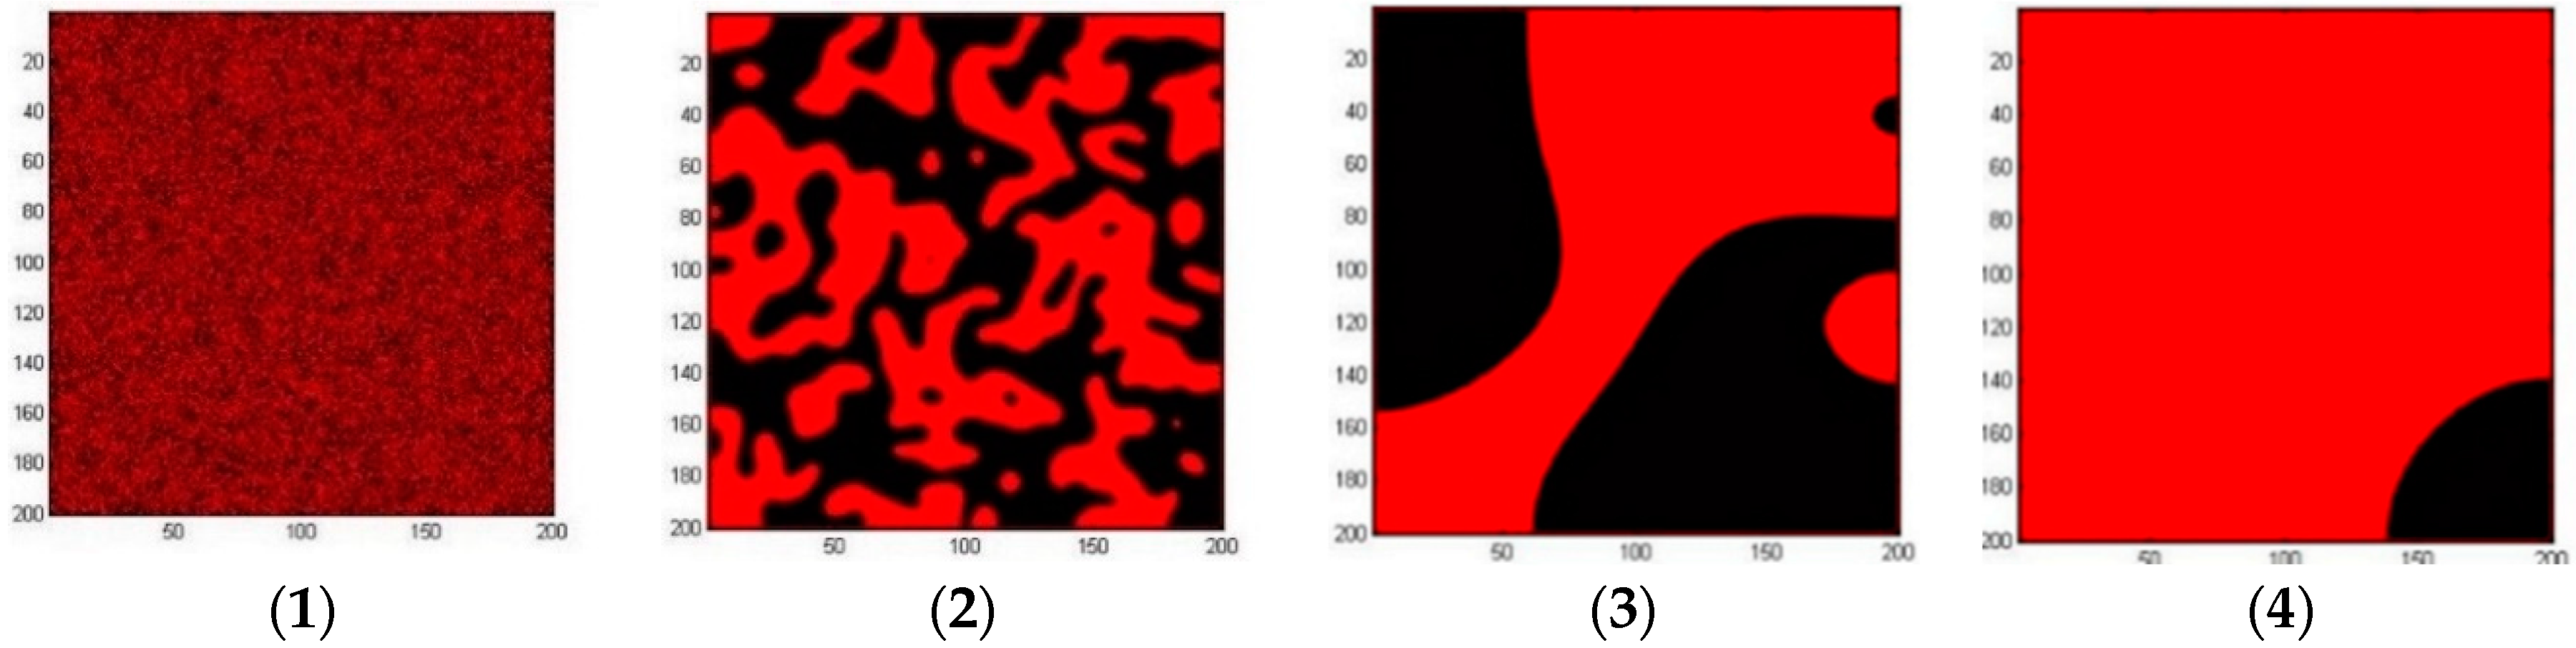
Scenario two: assuming that residents are in the pseudo-rational state, the number of Moore’s neighbors with opposite attitudes is equal to those with supportive attitudes around the individual residents. The evolution result is shown in Figure 3. In the initial evolution, after 30 cycles, the aggregation of spots to plaques is formed by the rapid agglomeration effect (see Figure 3(1)). After 1000 cycles of evolution (see Figure 3(2)), because the neighbors holding the two attitudes have the same influence, the residents who hold the two different attitudes continuously gather to finally form a group of equal power due to the concave effect and the enveloping effect. As shown in Figure 3(3), the accumulation of black and red patches shows the situation of confrontation. The ultimate result of this evolution means that, if the individual’s neighbors have the same number of opposition attitudes and supportive attitudes, then the finally evolved group attitude is divided into two groups with the same power.
Scenario three: assuming that residents are in the pseudo-rational state, the neighbor’s average risk attitude is support. Similar to the case in scenario one and in scenario two, after 30 cycles, red and black plaques are formed under the aggregation of the respective spots as shown in Figure 4(2). By the concave effect, two large plaques with black or red color are connectivity formed, as shown in Figure 4(3). Finally, the large red plaque continuously engulfs the black area to form a surrounding state. It is expected that the entire area will ultimately turn into red.
3.1.2. Non-Pseudo-Rational State
When residents are in the non-pseudo-rational state, it means that X is located in two positions on the function of the evolution rule (Figure 1). One position is where X is located in the lower part of the inflection point in Figure 1, in which the neighbor’s risk attitude is less than 0.5, and the other is where X is located in the upper part of the inflection point in Figure 1, more than 0.5.
If X is located in the lower part of the inflection point in Figure 1, according to the function of the evolution rule, the individual residents have a high probability of holding a supportive risk attitude. Therefore, at the beginning of evolution, the rapid agglomeration effect is very strong, which reflects the evolution of residents’ risk attitudes quickly approaching the red area, resulting in a final evolutionary result of red, as shown in Figure 5(1). However, when X is located in the upper part of inflection point, the probability that individual residents hold a supportive risk attitude is low, indicating that residents tend to hold opposition risk attitudes. Then, in the initial state of evolution, the evolution of residents’ risk attitudes quickly approaches the black areas under the effect of rapid agglomeration, and eventually leads to the black evolutionary result, as shown in Figure 5(2).
3.2. Simulation of the Questionnaire Processing Data by Cellular Automaton
In order to verify the rationality of the simulation results based on the cellular automaton hypothesis parameters, according to the analysis of the questionnaire processing data verified by the model application, the simplified attitude of the residents was used as the explained variable, and the neighbor’s risk attitude was used as the explanatory variable. Firstly, regression analysis was performed on the data using the logit model.
Based on Table 1, the logit equation can be expressed as shown in Equation (5).
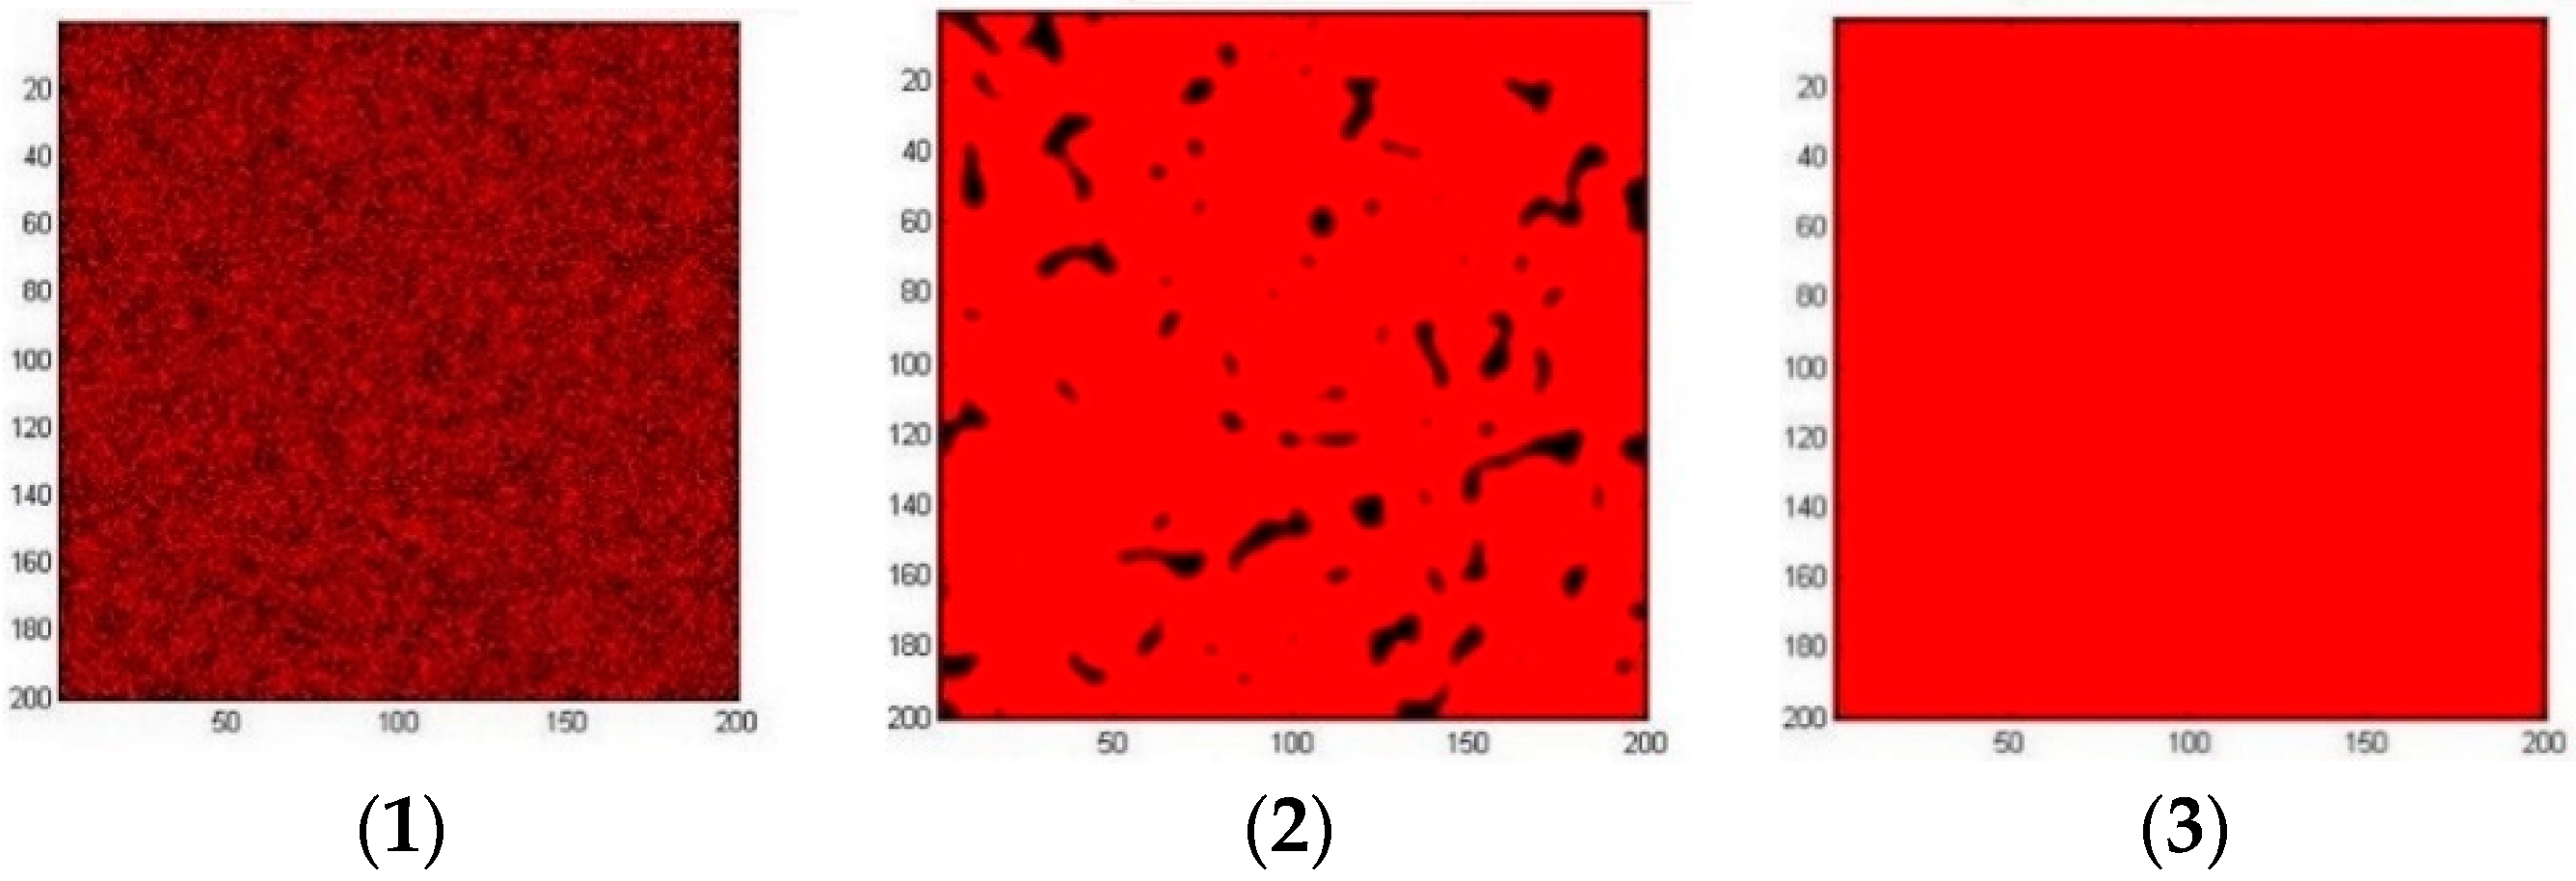
The curve deduced using Equation (5) is shown in Figure 6, where the curve is also a logit function. Using the function y = x, the intersection point of the curve is at (0.4595, 0.4595). Significantly, the resident at this point is in the pseudo-rational state, similar to that in Figure 1.
Through the random distribution of Matlab, the different risk attitudes of the surveyed residents in the survey questionnaire were in the initial state shown in Figure 7(1). After 30 cycles, as shown in Figure 7(2), red points became flaky red plaques due to the rapid agglomeration effect, and only a few small black plaques were inlaid within the red area. This suggests that residents in support are significantly more numerous than those in opposition. After 40 cycles, as shown in Figure 7(3), the entire area turned red due to the concave effect, indicating that the region evolved a supportive attitude. According to the simulation results of the practical survey for local residents, the residents tend to hold a supportive risk attitude after a low frequency of social interaction. This shows a positive case for the risk attitude evolution, which reflects that, in the pseudo-rational state, the evolution of ItGRA between residents to the support attitude occurs when the number of individual attitudes in support is close to that in opposition (Table A4, Appendix A).
3.3. Implication of Results by Cellular Automaton Simulation
According to the simulation results, both from hypothetical parameters and from practical questionnaire processing data by the cellular automaton, the initial evolution of the individual risk attitude toward waste incineration facilities depends on the initial state (pseudo-rational state or non-pseudo-rational state). When residents are in the pseudo-rational state, the evolution of the resident risk attitude is affected by the neighbor’s risk attitude via a frequency of social interaction. Compared to that at 30 cycles, the evolution of ItGRA at 1000 cycles demonstrates that the process of ItGRA happens when the network of social interaction between residents is established regardless of various ages, distances, incomes, etc. [29]. The result of the cellular automaton model reflects the sheep-flock effect on ItGRA, which occurs in a social interaction frequency 100 times higher than that in family or local neighborhoods. Under the effect of the neighbor’s risk attitude, the final group risk attitude is controlled by the rapid agglomeration effect, concave effect, and envelopment effect. This is in a good agreement with the findings from the resident attitude toward wind turbines, where it was concluded that perceived inequalities (between neighbors, within communities, and within the province) were the main source of opposition related to wind turbines and that future development may be more amenable if partnered with increased compensation or community ownership [30]. On the contrary, when the residents are in a non-pseudo-rational state, the ultimate group risk attitude depends on the probability that the residents have a supportive or opposing risk attitude as the concept of individuals is difficult to change. As a result, the higher probability decides the final result of group attitude from residents in a pseudo-rational state, whether supportive or opposed, under the influence of a high frequency of social interaction.
Therefore, it is particularly important for the government to actively intervene in the planning and establishment of waste incineration facilities. It is proposed that effective community engagement strategies require project managers to adopt trust-building strategies early in projects and an intimate understanding of community concerns and social structures [31]. This indicates that a preliminary survey on the local residents’ risk attitude needs to be conducted in the early stage of the construction of incinerators. Based on the survey results, residents with different attitudes can be divided into three groups so as to adopt different intervention tactics. The first case is for the residents in a pseudo-rational state. Relevant personnel should communicate with each other in a timely manner, and the preferential policies brought about by the construction of incinerators and the correct NIMBY knowledge must also be effectively popularized. At the same time, the government can also use the enveloping effect and concave effect to guide these residents to understand and support the construction of NIMBY facilities.
In the second case, for residents in the non-pseudo-rational state who soundly support the construction, governments should actively communicate with these residents to stabilize their attitudes so as to prevent residents from changing their attitudes. In addition, economic incentives can be implemented to encourage these residents to persuade those residents who have opposite attitudes. In this way, it is possible to rationally use these residents with positive attitudes to surround the residents holding opposite or indifferent attitudes, and to control the residents’ attitude toward opposition.
In the third case, for residents who are not in the non-pseudo-rational state and who oppose the construction, these residents are the key groups for intervention. First of all, it is necessary to investigate the reasons why they have opposite attitudes and to conduct effective methods for different situations. If residents are blindly opposed to construction because of the influence of NIMBY, the correct knowledge and various policy benefits need to be continuously propagated and disseminated. Then, it is very important that supportive residents need to be encouraged to persuade the opposed residents via the action of the enveloping effect and concave effect.
The results in the three cases provide the prediction of the public risk attitude for the incinerator facility, which can guide the decision of facility construction by local governor. Moreover, it is prospective that further investigation would be conducted in terms of the evolution dynamics of risk attitude, which is impacted by the local environment, land benefit, resident health, etc. These factors are proposed to lead to a different evolution of risk attitude.
3.4. Decision Strategy for the Changing of Public Risk Attribute
Our result reveals that the evolution of public attitude to the incinerator risk was dependent on the residents who were in the non-pseudo-rational state or the pseudo-rational state. For a further understanding of the incinerator risk, the identification of the rational state of residents is the most important way to support the government in waste incinerator construction. After that, correct NIMBY knowledge should be induced via insight into the pollution control of the incinerator and the improvement of facilities [13]. This promotes the impact of neighbors on the residents in the non-pseudo-rational state. Sun, Ouyang, and Meng proposed that positive attitudes are impacted by factors such as property price, gender, and living area [32]. This suggests that the concept of supporting the incineration should be guided in the residents who are in the pseudo-rational state via strategies such as the supplement of energy, work, or free public entertainment from the facility [33].
In addition, in order to reduce the social risks brought about by waste incineration facilities, governments need to actively understand the residents’ risk attitudes and push residents to soundly support the construction of incinerators through intervention with supportive attitudes, preferential policies, and propaganda of correct NIMBY knowledge, which is the premise of waste incinerator establishment and support for MSW disposal efficiency. Furthermore, the propagation of the potential risk or harmfulness of incineration facilities has to be addressed [34].
According to the plan and outlook of the Chinese government, the waste incinerator capacity is expected to reach 400 thousand tons per day by 2020 [35], and it will reach 500 thousand tons per day by 2025. This means that over 50% of municipal solid waste will be treated in incinerators, which are located predominately in eastern and southern China. The situation indicates that the establishment of incinerators is a suitable solution for waste treatment, which is dominant in urban China. This suggests that a more open and democratic publicly involved approach should be considered in the decision-making for incinerator construction, which includes compensation and risk communication to promote the local community attitude toward waste incinerators [36].
4. Conclusions
This study used the cellular automaton model to track the evolution process of individual risk attitude toward group risk attitude. The simulation results show that, in the pseudo-rational state of residents, the evolution of individual risk attitude toward waste incineration facilities is highly affected by the neighbor’s risk attitude with the frequency of social interaction, through which the sheep-flock effect affects or decides the final group risk attitude. In a social interaction frequency of 100 times or higher than that in family or local neighborhoods, the NIMBY attitude from the public is exaggerated. This is consistent with the case of the incinerator in Shanghai, which shows the evolution of ItGRA between residents to the support attitude as the number of individual attitudes in support was close to that in opposition with a higher frequency of social interaction. Meanwhile, in the non-pseudo-rational state, the ultimate group risk attitude depends on the probability of the residents holding a supportive or opposed risk attitude. No evolution of individual attitude occurs. The results suggest that, to change public risk attribute when residents tend to hold an opposition risk attitude, the decision strategy of incinerator construction should consider the influence of the sheep-flock effect, which will increase the residents in support and lead to the evolution of group risk attitude to support attitude. Therefore, this study provides insight into the evolution of public attitude to NIMBY attitude, as well as a promising evaluation method to quantify and guide individual and group risk attitudes.
Author Contributions
Conceptualization, J.Z. (Jizhi Zhou) and Y.N.; methodology, J.Z. (Jinbu Zhao); software, K.L.; formal analysis, J.Z. (Jinbu Zhao); investigation, J.Z. (Jinbu Zhao); writing—original draft preparation, J.Z. (Jinbu Zhao); writing—review and editing, K.L. All authors have read and agreed to the published version of the manuscript.
Funding
This research received no external funding.
Acknowledgments
The authors appreciate the Jiading Environmental Protection Bureau and Jiangqiao waste incineration facility for providing detailed and accurate data for this work.
Conflicts of Interest
The authors declare no conflict of interest
Appendix A

Table A1.
Sample elements of the questionnaire.
| Individual Characteristics | Option | Number of Samples (N) | % |
|---|---|---|---|
| Gender | Man | 137 | 46.1 |
| Woman | 160 | 53.9 | |
| Age | 25 and below | 40 | 13.5 |
| 26–35 | 61 | 20.5 | |
| 36–45 | 78 | 26.3 | |
| 46–55 | 68 | 22.9 | |
| 56 and above | 50 | 16.8 | |
| The level of education | High school, secondary school, and below | 120 | 40.4 |
| College and undergraduate | 90 | 30.3 | |
| Master graduate | 64 | 21.5 | |
| Doctorate and above | 23 | 7.7 | |
| Career | State-owned enterprises and institutions | 103 | 34.7 |
| Self-employed persons | 52 | 17.5 | |
| Free occupation or temporary work | 54 | 18.2 | |
| Private enterprises and foreign staff | 43 | 14.5 | |
| Others | 45 | 15.2 | |
| Income level (million) | 0.05 and below | 23 | 7.7 |
| 0.05–0.1 | 69 | 23.2 | |
| 0.1–0.2 | 103 | 34.7 | |
| 0.2–0.3 | 78 | 26.3 | |
| 0.3 and above | 24 | 8.1 | |
| Number of families | 1–2 | 75 | 25.3 |
| 3 | 138 | 46.5 | |
| 4–5 | 68 | 22.9 | |
| 6 and above | 16 | 5.4 | |
| Distance | 0.5 km and below | 52 | 17.5 |
| 0.5 km–1 km | 73 | 24.6 | |
| 1 km–2 km | 70 | 23.6 | |
| 2 km–3 km | 68 | 22.9 | |
| 3 km and above | 34 | 11.4 |
Table A2.
Correlation coefficient of each element and resident risk attitude. Sig—significance; MSW—municipal solid waste.
Table A2.
Correlation coefficient of each element and resident risk attitude. Sig—significance; MSW—municipal solid waste.
| Spearman Test | Tau-y Test | |
|---|---|---|
| Gender | η = 0.017 | |
| Age | ρ = −0.035, Sig = 0.544 | |
| The level of education | ρ = 0.107, Sig = 0.065 | |
| Career | η = 0.031 | |
| Number of families | ρ = 0.112, Sig = 0.054 | |
| Income | ρ = 0.298, Sig = 0.000 | |
| Distance | ρ = 0.254, Sig = 0.000 | |
| Attention to MSW | ρ = 0.301, Sig = 0.000 | |
| Understanding of waste | ρ = 0.263, Sig = 0.000 | |
| incineration plant | ||
| Credibility of waste | ρ = 0.483, Sig = 0.000 | |
| incineration plant | ||
| Health | ρ = 0.596, Sig = 0.000 | |
| Satisfaction with the | ρ = 0.355, Sig = 0.000 | |
| preferential policies | ||
| Improvement of | ρ = 0.615, Sig = 0.000 | |
| environment | ||
| Neighbor’s attitude | ρ = 0.799, Sig = 0.000 |
Table A3.
Cross-mapping and correlation coefficient of each unrelated element and resident risk attitude.
Table A3.
Cross-mapping and correlation coefficient of each unrelated element and resident risk attitude.
| Attitude | Total | ||||||
|---|---|---|---|---|---|---|---|
| Complete Opposition | Opposition | Indifference | Support | Strongly Support | |||
| Gender | Man | 17 | 44 | 13 | 38 | 25 | 137 |
| Woman Tau-y test | 25 η = 0.017 | 44 | 44 | 37 | 10 | 160 | |
| Age | 25 and below | 8 | 5 | 8 | 14 | 6 | 41 |
| 26–35 | 12 | 17 | 10 | 7 | 14 | 60 | |
| 36–45 | 10 | 33 | 12 | 20 | 3 | 68 | |
| 46–55 | 12 | 21 | 12 | 20 | 3 | 68 | |
| 56 and above | 0 | 12 | 15 | 17 | 6 | 50 | |
| Spearman test p = −0.035, Sig = 0.544 | |||||||
| The level of education | High school, secondary school, and below | 24 | 32 | 30 | 22 | 12 | 120 |
| College and undergraduate | 15 | 22 | 12 | 30 | 11 | 90 | |
| Master graduate | 0 | 22 | 15 | 17 | 10 | 64 | |
| Doctorate and above | 3 | 12 | 0 | 6 | 2 | 23 | |
| Spearman test p = 0.107, Sig = 0.065 | |||||||
| Career | State-owned | 15 | 35 | 15 | 23 | 15 | 103 |
| enterprises and | |||||||
| institutions | |||||||
| Self-employed | 6 | 23 | 10 | 13 | 0 | 52 | |
| persons | |||||||
| Free occupation or | 12 | 11 | 11 | 20 | 0 | 54 | |
| temporary work | |||||||
| Private enterprises and | 3 | 10 | 12 | 9 | 9 | 43 | |
| foreign staff | |||||||
| Others | 6 | 9 | 9 | 10 | 11 | 45 | |
| Tau-y test | η = 0.031 | ||||||
| Number of families | 1–2 | 6 | 25 | 15 | 20 | 9 | 75 |
| 3 | 30 | 45 | 24 | 27 | 12 | 138 | |
| 4–5 | 6 | 15 | 18 | 20 | 9 | 68 | |
| 6 and above | 0 | 3 | 0 | 8 | 5 | 16 | |
| Spearman test p = 0.112, Sig = 0.054 | |||||||
| Total | 42 | 88 | 57 | 75 | 35 | 297 | |
Table A4.
Cross-mapping and correlation coefficient of each related element and resident risk attitude.
Table A4.
Cross-mapping and correlation coefficient of each related element and resident risk attitude.
| Attitude | Total | ||||||
|---|---|---|---|---|---|---|---|
| Complete Opposition | Opposition | Indifference | Support | Strongly Support | |||
| Income level (million/per year) | 0.05 and below | 9 | 0 | 4 | 6 | 4 | 23 |
| 0.05–0.1 | 19 | 26 | 2 | 16 | 6 | 69 | |
| 0.1–0.2 | 14 | 38 | 25 | 18 | 8 | 103 | |
| 0.2–0.3 | 0 | 24 | 18 | 27 | 9 | 78 | |
| 0.3 and above | 0 | 0 | 8 | 8 | 8 | 24 | |
| Spearman test ρ = 0.298, Sig = 0.000 | |||||||
| Distance | 0.5 km and below | 15 | 16 | 3 | 15 | 6 | 55 |
| 0.5 km–1 km | 15 | 30 | 9 | 15 | 3 | 72 | |
| 1 km–2 km | 3 | 21 | 15 | 26 | 3 | 68 | |
| 2 km–3 km | 6 | 21 | 18 | 11 | 12 | 68 | |
| 3 km and above | 3 | 0 | 12 | 8 | 11 | 34 | |
| Spearman test ρ = 0.25, Sig = 0.000 | |||||||
| Attention to MSW | Completely ignored | 12 | 9 | 9 | 9 | 3 | 42 |
| Not noticed | 21 | 43 | 12 | 23 | 6 | 105 | |
| Occasional attention | 6 | 21 | 24 | 23 | 9 | 83 | |
| Pay attention to | 0 | 12 | 21 | 9 | 8 | 41 | |
| Very much attention | 3 | 3 | 0 | 11 | 9 | 26 | |
| Spearman test ρ = 0.301, Sig = 0.000 | |||||||
| Understanding of waste incineration plant | Completely ignorant | 6 | 12 | 15 | 12 | 3 | 48 |
| Do not understand | 15 | 34 | 12 | 12 | 0 | 73 | |
| Understand it | 0 | 24 | 21 | 8 | 3 | 56 | |
| Understanding | 9 | 15 | 9 | 26 | 8 | 67 | |
| Very understanding | 12 | 3 | 0 | 17 | 21 | 53 | |
| Spearman test ρ = 0.263, Sig = 0.000 | |||||||
| Credibility of waste incineration plant | Completely distrustful | 19 | 7 | 7 | 4 | 0 | 37 |
| Untrustworthy | 10 | 38 | 16 | 14 | 4 | 82 | |
| Not clear | 4 | 34 | 24 | 17 | 3 | 82 | |
| Credible | 7 | 6 | 10 | 31 | 12 | 66 | |
| Very credible | 2 | 3 | 0 | 9 | 16 | 30 | |
| Spearman test ρ = 0.483, Sig = 0.000 | |||||||
| Health | Very influential | 24 | 17 | 3 | 5 | 2 | 51 |
| More influential | 12 | 41 | 12 | 17 | 3 | 85 | |
| Influential | 6 | 18 | 27 | 12 | 0 | 63 | |
| Not influential | 0 | 12 | 15 | 29 | 15 | 71 | |
| No effect | 0 | 0 | 0 | 12 | 15 | 27 | |
| Spearman test ρ = 0.596, Sig = 0.000 | |||||||
| Satisfaction with the preferential policies | Very dissatisfied | 21 | 9 | 12 | 3 | 5 | 50 |
| Not satisfied | 9 | 52 | 21 | 26 | 3 | 111 | |
| It does not matter | 6 | 15 | 24 | 23 | 12 | 80 | |
| Satisfaction | 6 | 6 | 0 | 14 | 9 | 35 | |
| Very satisfied | 0 | 6 | 0 | 9 | 6 | 21 | |
| Spearman test ρ = 0.355, Sig = 0.000 | |||||||
| Improvement of | Very insignificant | 21 | 9 | 0 | 3 | 0 | 33 |
| environment | Not obvious | 9 | 27 | 8 | 4 | 0 | 48 |
| No feelings | 4 | 12 | 28 | 5 | 2 | 51 | |
| Obvious | 8 | 38 | 18 | 42 | 9 | 115 | |
| Very obvious | 0 | 2 | 3 | 21 | 24 | 50 | |
| Spearman test ρ = 0.615, Sig = 0.000 | |||||||
| Neighbor’s attitude | Correlation coefficient | 0.799 | |||||
| Sig | 0.000 | ||||||
| N | 297 | ||||||
| Total | 42 | 88 | 57 | 75 | 35 | 297 | |
Appendix A.1. Statistical Analysis Section
The ordered logit model is a useful tool to find the controlling indicators among possible influencing factors. When establishing a linear regression model with logit (p) as the explained variable and X as the explanatory variable, the model is as follows:
In this model, explanatory variables are categorical or non-contiguous; thus, the distribution of errors does not obey a normal distribution but a binomial distribution. Therefore, the coefficients β should be estimated using the maximum likelihood method, and the tests of the regression model and coefficient should use the Wald test and likelihood ratio test.
Appendix A.2. Survey and Data Collection
Considering both the area where the maximum smoke concentration covers and the spatial distribution of residential areas around the plants, the residents within 6000 m of the waste incineration facility were surveyed. The north of Jiangqiao waste incineration facility (JWIF) is an industrial park, while the south is residential, among which one area was less than 500 m away from JWIF, and four were 500–1000 m away. The survey object was residents in the abovementioned five residential areas, and the sample survey was conducted in September 2017.
According to the population characteristics, five residential areas were selected with a population of 10,000 more than 20 years old. Using the rules of simple random sampling, a total of 320 questionnaires were distributed, and 297 valid questionnaires were used in this paper.
References
- Zhu, D.M. Effects and Drawbacks of Environmental Impact Assessment in Avoiding NIMBY. Ekoloji 2018, 27, 149–154. [Google Scholar]
- Sun, L.L.; Yung, E.H.K.; Chan, E.H.W.; Zhu, D.J. Issues of NIMBY conflict management from the perspective of stakeholders: A case study in Shanghai. Habitat. Int. 2016, 53, 133–141. [Google Scholar] [CrossRef]
- Sun, L.L.; Zhu, D.J.; Chan, E.H.W. Public participation impact on environment NIMBY conflict and environmental conflict management: Comparative analysis in Shanghai and Hong Kong. Land Use Policy 2016, 58, 208–217. [Google Scholar] [CrossRef]
- Ferreira, S.; Gallagher, L. Protest responses and community attitudes toward accepting compensation to host waste disposal infrastructure. Land Use Policy 2010, 27, 638–652. [Google Scholar] [CrossRef]
- Liu, Z.Y.; Yue, Y.; Lu, M.; Zhang, J.; Sun, F.C.; Huang, X.; Zhou, J.Z.; Qian, G.R. Comprehension of heavy metal stability in municipal solid waste incineration fly ash with its compositional variety: A quick prediction case of leaching potential. Waste Manag. 2019, 84, 329–339. [Google Scholar] [CrossRef] [PubMed]
- Lu, J.W.; Zhang, S.K.; Hai, J.; Lei, M. Status and perspectives of municipal solid waste incineration in China: A comparison with developed regions. Waste Manag. 2017, 69, 170–186. [Google Scholar] [CrossRef] [PubMed]
- Yue, Y.; Liu, Z.Y.; Liu, Z.Z.; Zhang, J.; Lu, M.; Zhou, J.Z.; Qian, G.R. Rapid evaluation of leaching potential of heavy metals from municipal solid waste incineration fly ash. J. Environ. Manag. 2019, 238, 144–152. [Google Scholar] [CrossRef] [PubMed]
- Li, J.F.; Zhang, Y.; Sun, T.T.; Hao, H.W.; Wu, H.; Wang, L.L.; Chen, Y.X.; Xing, L.M.; Niu, Z.G. The health risk levels of different age groups of residents living in the vicinity of municipal solid waste incinerator posed by PCDD/Fs in atmosphere and soil. Sci. Total Environ. 2018, 631–632, 81–91. [Google Scholar] [CrossRef]
- Nedellec, V.; Rabl, A. Costs of Health Damage from Atmospheric Emissions of Toxic Metals: Part 1-Methods and Results. Risk Anal. 2016, 36, 2081–2095. [Google Scholar] [CrossRef]
- Wright, R.A.; Boudet, H.S. To Act or Not to Act: Context, Capability, and Community Response to Environmental Risk. Am. J. Sociol. 2012, 118, 728–777. [Google Scholar] [CrossRef] [Green Version]
- Wong, N.W.M. The road to environmental participatory governance in Taiwan: collaboration and challenges in incineration and municipal waste management. J. Environ. Plann. Man 2017, 60, 1726–1740. [Google Scholar] [CrossRef]
- Johnson, T. The Health Factor in Anti-Waste Incinerator Campaigns in Beijing and Guangzhou. China Quart. 2013, 214, 356–375. [Google Scholar] [CrossRef]
- Yang, Q.; Zhu, Y.X.; Liu, X.X.; Fu, L.M.; Guo, Q.Q. Bayesian-Based NIMBY Crisis Transformation Path Discovery for Municipal Solid Waste Incineration in China. Sustainability 2019, 11, 2364. [Google Scholar] [CrossRef] [Green Version]
- Cavazza, N.; Rubichi, S. Ways of thinking about the incinerator: A typology of citizens’ mindsets. Soc. Sci. J. 2014, 51, 422–430. [Google Scholar] [CrossRef]
- Zhang, X.; Xu, J.G.; Ju, Y. Public participation in NIMBY risk mitigation: A discourse zoning approach in the Chinese context. Land Use Policy 2018, 77, 559–575. [Google Scholar] [CrossRef]
- Kolla, G.; Strike, C.; Watson, T.M.; Jairam, J.; Fischer, B.; Bayoumi, A.M. Risk creating and risk reducing: Community perceptions of supervised consumption facilities for illicit drug use. Health Risk Soc. 2017, 19, 91–111. [Google Scholar] [CrossRef]
- Geritz, S.A.H.; Gyllenberg, M. Group defence and the predator’s functional response. J. Math Biol. 2013, 66, 705–717. [Google Scholar] [CrossRef]
- Bulai, I.M.; Venturino, E. Shape effects on herd behavior in ecological interacting population models. Math. Comput. Simulat. 2017, 141, 40–55. [Google Scholar] [CrossRef]
- Alimadad, A.; Dabbaghian, V.; Singhk, S.K.; Tsang, H.H. Modeling HIV Spread Through Sexual Contact Using a Cellular Automaton. IEEE C Evol. Computat. 2011, 11, 2345–2350. [Google Scholar]
- Dabbaghian, V.; Mago, V.K.; Wu, T.K.; Fritz, C.; Alimadad, A. Social interactions of eating behaviour among high school students: a cellular automata approach. BMC Med. Res. Methodol. 2012, 12, 155. [Google Scholar] [CrossRef] [PubMed] [Green Version]
- Chen, T.; Lin, J. A Novel Model for the Evolution of Online Public Opinion Based on Fuzzy Cellular Automata Rules in Directed World Networks. Appl. Math. Inform. Sci. 2013, 7, 2335–2343. [Google Scholar] [CrossRef] [Green Version]
- Ievgen, T.; Alexander, M. Simulation of Public Opinion with Ideas of Cellular Automata. Lect. Notes Comput. Sci. 2014, 8751, 518–525. [Google Scholar]
- Shi, X.M.; Shi, L.; Zhang, J.F. Opinion evolution based on cellular automata rules in small world networks. Chin. Phys. B 2010, 19, 038701. [Google Scholar]
- Cao, C.; Dragicevic, S.; Li, S.N. Short-Term Forecasting of Land Use Change Using Recurrent Neural Network Models. Sustainability 2019, 11, 5376. [Google Scholar] [CrossRef] [Green Version]
- Yang, J.; Shi, F.; Sun, Y.Z.; Zhu, J. A Cellular Automata Model Constrained by Spatiotemporal Heterogeneity of the Urban Development Strategy for Simulating Land-use Change: A Case Study in Nanjing City, China. Sustainability 2019, 11, 4012. [Google Scholar] [CrossRef] [Green Version]
- Nagaraju, K.; Sudeep, K.S.; Kurhekar, M.P. A cellular automaton model to find the risk of developing autism through gut-mediated effects. Comput. Biol. Med. 2019, 110, 207–217. [Google Scholar] [CrossRef]
- Zhu, J.; Yu, Y.N.; Zhou, S.L.; Wang, X.; Lv, L.G. Simulating Sustainable Urban Development by Incorporating Social-ecological Risks into a Constrained CA Model. Chin. Geogr. Sci. 2018, 28, 600–611. [Google Scholar] [CrossRef] [Green Version]
- Chung, W.; Choi, J.; Woo, C.W.; Lee, S.; Saindon, C.E. Community relations dealing with a not in my back yard (NIMBY) context An experimental application of situational theory of publics and social exchange theory. Int. J. Confl. Manag. 2016, 27, 424–452. [Google Scholar] [CrossRef]
- Melchionda, D.; Pastacaldi, E.; Perri, C.; Banerjee, M.; Venturino, E. Social behavior-induced multistability in minimal competitive ecosystems. J. Theor. Biol. 2018, 439, 24–38. [Google Scholar] [CrossRef] [Green Version]
- Christidis, T.; Lewis, G.; Bigelow, P. Understanding support and opposition to wind turbine development in Ontario, Canada and assessing possible steps for future development. Renew. Energy 2017, 112, 93–103. [Google Scholar] [CrossRef]
- Teo, M.M.; Loosemore, M. Understanding community protest from a project management perspective: A relationship-based approach. Int. J. Proj. Manag. 2017, 35, 1444–1458. [Google Scholar] [CrossRef]
- Sun, C.W.; Ouyang, X.L.; Meng, X.C. Public acceptance towards waste-to-energy power plants: a new quantified assessment based on ?willingness to pay? J. Environ. Plann. Man. 2019, 62, 2459–2477. [Google Scholar] [CrossRef]
- Scheer, D.; Konrad, W.; Wassermann, S. The good, the bad, and the ambivalent: A qualitative study of public perceptions towards energy technologies and portfolios in Germany. Energy Policy 2017, 100, 89–100. [Google Scholar] [CrossRef]
- Lanza, G.G. Perceived Risk Effect and Nimby Syndrome. Analysis of the “No-Tap” Conflict in Puglia. Doc. Geogr. 2018, 1, 69–88. [Google Scholar]
- Commission, N.D. National Construction Plan for Urban Solid Waste Harmless Treatment Facilities during 13th Five-Year (2016–2020); National Development and Reform Commission (NDRC): Beijing, China, 2016.
- Liu, Y.; Ge, Y.J.; Xia, B.; Cui, C.Y.; Jiang, X.Y.; Skitmore, M. Enhancing public acceptance towards waste-to-energy incineration projects: Lessons learned from a case study in China. Sustain. Cities Soc. 2019, 48, 101582. [Google Scholar] [CrossRef]
Figure 1.
Function of the evolution rule.

Figure 2.
Cell simulation images from scenario one with initial state (1) and states after 30 (2), 1000 (3) and 3000 (4) cycles of evolution.
Figure 2.
Cell simulation images from scenario one with initial state (1) and states after 30 (2), 1000 (3) and 3000 (4) cycles of evolution.

Figure 3.
Cell simulation images from scenario two with initial state (1) and states after 30 (2), 1000 (3) cycles of evolution.
Figure 3.
Cell simulation images from scenario two with initial state (1) and states after 30 (2), 1000 (3) cycles of evolution.

Figure 4.
Cell simulation from scenario three with initial state (1) and states after 30 (2), 1000 (3) and 3000 (4) cycles of evolution.
Figure 4.
Cell simulation from scenario three with initial state (1) and states after 30 (2), 1000 (3) and 3000 (4) cycles of evolution.

Figure 5.
Cell simulation from non-pseudo-rational state with initial state (1) and final state after evolution (2).
Figure 5.
Cell simulation from non-pseudo-rational state with initial state (1) and final state after evolution (2).

Figure 6.
Conversion rule function.

Figure 7.
Cell simulation from questionnaire processing data with initial state (1) and states after 30 (2), 40 (3) cycles of evolution.
Figure 7.
Cell simulation from questionnaire processing data with initial state (1) and states after 30 (2), 40 (3) cycles of evolution.

Table 1.
Regression results for the logit model.
| Coefficient | Test Results | |||
|---|---|---|---|---|
| Estimate | Standard Error | Wald | Significance | |
| Neighbor’s risk attitude (NEI) | 10.628 | 2.046 | 26.982 | 0.000 |
| Constant | −4.884 | 0.977 | 25.005 | 0.000 |
© 2020 by the authors. Licensee MDPI, Basel, Switzerland. This article is an open access article distributed under the terms and conditions of the Creative Commons Attribution (CC BY) license (http://creativecommons.org/licenses/by/4.0/).
Share and Cite
MDPI and ACS Style
Zhao, J.; Nie, Y.; Liu, K.; Zhou, J. Evolution of the Individual Attitude in the Risk Decision of Waste Incinerator Construction: Cellular Automaton Model. Sustainability 2020, 12, 368. https://0-doi-org.brum.beds.ac.uk/10.3390/su12010368
AMA Style
Zhao J, Nie Y, Liu K, Zhou J. Evolution of the Individual Attitude in the Risk Decision of Waste Incinerator Construction: Cellular Automaton Model. Sustainability. 2020; 12(1):368. https://0-doi-org.brum.beds.ac.uk/10.3390/su12010368
Chicago/Turabian StyleZhao, Jinbu, Yongyou Nie, Kui Liu, and Jizhi Zhou. 2020. "Evolution of the Individual Attitude in the Risk Decision of Waste Incinerator Construction: Cellular Automaton Model" Sustainability 12, no. 1: 368. https://0-doi-org.brum.beds.ac.uk/10.3390/su12010368
Note that from the first issue of 2016, this journal uses article numbers instead of page numbers. See further details here.